
Reversing Worrisome Trends How to Attract and Retain Investment in a
No. 735
August 22, 2013
Reversing Worrisome Trends
How to Attract and Retain Investment in a
Competitive Global Economy
by Daniel Ikenson
Executive Summary
No country has been a stronger magnet
for foreign direct investment than the United
States. Valued at $3.5 trillion, the U.S. stock of
inward foreign direct investment accounted for
17 percent of the world total in 2011, more than
triple the share of the next largest destination.
Foreign direct investment is ultimately a judgment by the world’s value creators about a country’s institutions, policies, human capital, and
prospects. As the world’s largest economy, the
United States has been able to attract the investment needed to produce the innovative ideas, revolutionary technologies, and new products and
industries that have continued to undergird its
position atop the global economic value chain.
But the past is not necessarily prologue. Indeed, while the U.S. claim to 17 percent of the
world’s stock of foreign direct investment is impressive, the share stood at 39 percent as recently as 1999. It has been 12 years since the annual
value of U.S. inward FDI set a record high of
$314 billion, and since then, annual flows have
failed to establish an upward trend. The most
recent figures show a decline of 35 percent, from
$227 billion in 2011 to $147 billion in 2012.
To a large extent, these trends reflect the
emergence of new, viable destinations for investment resulting from inevitable demographic, economic, and political changes. However,
some of the decline is attributable to a deteriorating U.S. investment climate, as reflected on a
variety of renowned business surveys and investment indices measuring policy and perceptions
of policy.
The current U.S. business environment conspires to deter inward investment and to encourage companies to offshore operations that
could otherwise be performed competitively in
the United States. A proper accounting of these
policies, followed by implementation of reforms
to remedy shortcomings, will be necessary if the
United States is going to compete effectively
for the investment required to fuel economic
growth and higher living standards.
Daniel Ikenson is director of Cato’s Herbert A. Stiefel Center for Trade Policy Studies. Ikenson is author of
many related studies, including “Made on Earth: How Global Economic Integration Renders Trade Policy
Obsolete.”
While the
United States can
claim the largest
stock of foreign
direct investment
by a factor of
three, its share
of global foreign
direct investment
stock declined
from 39 percent
in 1999 to
17 percent in
2011.
Introduction
policies, human capital, and prospects. As
an economy featuring a highly productive
work force, world-class research universities, a stable political climate, strong legal
institutions, accessible capital markets, and
countless other advantages (including size),
the United States has been able to attract
the investment needed to produce the innovative ideas, revolutionary technologies, and
new products and industries that have continued to undergird the U.S. position atop
the global economic value chain.
But the past is not necessarily prologue.
Indeed, while the United States can claim
the largest stock of foreign direct investment
by a factor of three, the U.S. share of global
FDI stock declined from 39 percent in 1999
to 17 percent in 2011.4 It has been 12 years
since the annual value of U.S. inward FDI
set a record high of $314 billion. Since 2000,
annual flows have failed to establish an upward trend. The most recent investment figures indicate that U.S. FDI inflows declined
from $227 billion in 2011 to $147 billion in
2012, a drop of over 35 percent.5
To a large extent, these trends reflect inevitable demographic changes. Strong economic growth in developing countries has
followed periods of political stability and
economic liberalization, creating new opportunities and inspiring confidence that
these formerly higher-risk bets are viable—
indeed desirable—places to invest in productive activities.
However, some of the decline in U.S. share
is attributable, not to increasing absolute advantages of investing in other countries, but
to decreasing absolute advantages of investing in the United States. A deteriorating U.S.
investment climate is making other countries relatively more attractive. Just as U.S.
businesses have been reluctant to invest and
hire since the Great Recession, foreign companies also have been reticent about investing in the United States, and for many of the
same reasons: uncertainty and an increasingly inhospitable environment for business.
Another contributing factor is U.S. outflows of FDI. Just as the United States is
Investment is the lifeblood of economic
growth. The value of tomorrow’s output is
a function of today’s investments in factories, research centers, machines, technology,
software, and training. Whether investment
comes from domestic or foreign sources, its
purpose is to create value and wealth, a process that begets higher living standards. In
all but the rarest of circumstances, such as
where a transaction poses obvious threats
to national security, investment should be
welcomed from sources both domestic and
foreign.
Investment comes in many different
forms. Equity investment entails purchases
of shares in specific companies, industries,
or funds. Purchases of debt issued by governments or corporations also constitute
investment. The focus of this paper is direct
investment, which includes purchases and
control of real assets, such as buildings, factories, equipment, and software.1
No country has been a stronger magnet
for foreign direct investment (FDI) than the
United States. Valued at $3.5 trillion, the
U.S. stock of inward FDI accounted for 17
percent of the world total in 2011, which was
more than triple the share of the next largest
destination.2 For the period 2006–2011, U.S.
inflows of FDI have averaged $221.3 billion
per year—well more than double the next single-country destination.3 That inward investment has punched above its weight, contributing disproportionately to increases in U.S.
output, value-added, compensation, exports,
and research and development spending.
It should not be surprising that global
demand for U.S. factories, research and development facilities, office buildings, and
industrial machinery has been strong. Foreign companies seeking greater sales in the
world’s largest market often require some
physical presence in that market. But size is
not all that matters.
Foreign direct investment (or its absence)
is ultimately a judgment by the world’s value creators about a country’s institutions,
2
the destination for more FDI than any
other country, U.S. investors hold more
FDI abroad than the investors of any other
country. Valued at $4.5 trillion in 2011, most
U.S.-owned FDI stock is located in Europe,
Canada, Japan, and other wealthy countries,
but a growing share is going to developing
countries.6
Unlike ever before, the world’s producers
have a wealth of options when it comes to
where and how they organize product development, production, assembly, distribution,
and other functions on the continuum from
product conception to consumption. As
businesses look to the most productive combinations of labor and capital, to the most
efficient production processes, and to the
best ways of getting products and services to
market, perceptions about the business environment can be determinative. In a global
economy, “offshoring” is an inevitable consequence of competition.7 And policy improvement should be the broad, beneficial result.
The capacity of the United States to continue to be a magnet for both foreign and
domestic investment is largely a function of
its advantages, many of which are shaped
by public policy. Considerations of taxes,
regulations, trade openness, access to skilled
workers, infrastructure, energy policy, and
dozens of other policy matters factor into
decisions about whether, where, and how
much to invest. It should be of major concern that inward FDI has been erratic and
relatively downward trending in recent years,
but why that is the case should not be a mystery. U.S. scores on a variety of renowned
business surveys and investment indices
measuring policy and perceptions of policy
suggest that the U.S. business environment
is becoming increasingly less hospitable.
Although some policymakers recognize
the need for reform, others seem to be impervious to the investment-repelling effects
of some of the laws and regulations they create. Some see the shale gas and oil booms as
more than sufficient for overcoming policy
shortcomings and attracting the necessary
investment. The most naive consider “Amer-
ican” companies to be tethered to the U.S.
economy and obligated to invest and hire in
the United States, regardless of the quality
of the business and policy environments.
They fail to appreciate that increasingly
transnational U.S.-based businesses are not
obligated to invest, produce, or hire in the
United States.
It is the responsibility of policymakers,
however, to create an environment that is
more attractive to prospective investors. Current laws, regulations, and other conditions
affecting the U.S. business environment are
conspiring to deter inward investment and
to encourage companies to offshore operations that could otherwise be performed
competitively in the United States.
A proper accounting of these policies, followed by implementation of reforms to remedy shortcomings, will be necessary if the
United States is going to compete effectively
for the investment required to fuel economic growth and higher living standards.
Foreign Investment in
Perspective
Americans are transacting with foreigners more intensively than ever before. Over
the past 20 years, the value of U.S. trade as a
share of gross domestic product more than
doubled from 16 percent to 33 percent.8 In
2012, the total value of imports and exports
of goods and services reached an all-time
high of $5 trillion.9 If those trade statistics
give a hint of the fact of increasing global integration, the international investment figures tell a compelling story about it.
The combined value of U.S.-owned assets
abroad and foreign-owned assets in the United States had already surpassed the $5 trillion
mark 20 years ago. In 2012 that cross-border
engagement exceeded $46 trillion, a figure
triple the size of the U.S. economy and more
than nine times the value of U.S. trade.10
About 70 percent of that transnational
investment—$32.5 trillion—is privately held
in securities, government-issued debt, other
3
Although some
policymakers
recognize the
need for reform,
others seem to
be impervious to
the investmentrepelling effects
of some of
the laws and
regulations they
create.
Increasingly,
a company’s
success abroad
will be a
determinant of
its success at
home, and
vice versa.
financial instruments, and real assets such
as land, factories, office buildings, other facilities, and equipment. The market value
of these cross-border investments in real assets amounted to about $9.1 trillion in 2012,
with Americans owning $5.2 trillion worth
of direct assets abroad and foreigners owning $3.9 trillion worth of direct assets in the
United States.11
It is primarily through these cross-border
direct investments that Americans transact—as workers, consumers, producers, and
collaborators in the production of goods
and services—with people around the world.
With 95 percent of the world’s population
living outside U.S. borders, where economic
growth has been and is expected to remain
stronger for many years, it is imperative that
Americans develop, deepen, and broaden
their channels of commercial engagement
with the rest of the world. Increasingly, the
success of U.S. companies will depend on
their ability to sell in foreign markets, incorporate foreign intermediate goods and raw
materials into their own output, and collaborate effectively with foreign firms and
workers in production and supply-chain operations. Increasingly, a company’s success
abroad will be a determinant of its success
at home, and vice versa.
An all-too-common portrayal of globalization presents the external 95 percent as
a threat more than an opportunity. The 95
percent are competitors, but not customers or production partners. They will take
our jobs and dominate U.S. markets, but
not purchase our output or help U.S. companies succeed abroad. In this view, there is
great peril, but little opportunity. The facts
surrounding foreign direct investment tell a
very different story.
legal system and a relatively transparent
business environment. More than $4 out of
every $5 of that stock (84.2%) is owned by
Europeans, Canadians, and Japanese, with
the U.S. manufacturing sector accounting
for a full third of its value, making it the primary destination for inward FDI.13
Foreign direct investment enters the
United States through different channels,
but the most common channels are through
acquisitions of U.S. companies or divisions
by foreign companies, mergers between foreign and U.S. companies, foreigners creating
new businesses in the United States (“greenfield” investment), and expansion of existing
foreign-owned companies through capital
expenditures and acquisitions.
With some important exceptions, inward
investment generally has been welcomed in
the United States since the founding of the
republic. For example, foreign ownership
in some industries, such as shipping, aviation, communications, energy, mining, and
banking is restricted, and a statutory process exists to examine and ultimately block
prospective foreign acquisitions that are
deemed a threat to national security.14
Although the investment climate is relatively open, not everyone sees inward FDI as
beneficial. Among the common concerns
registered about inward investment are that
it can lead to layoffs and closures; it reduces
competition in the U.S. market; it replaces
domestic-based supply chains with foreign
supply chains, leading to further layoffs and
closures; it reduces exports and increases
imports; it has only a fleeting commitment
to the United States; it results in higher value-added activities being stripped from the
United States; it causes loss of proprietary
technology; it shrinks the U.S. tax base; and
it can undermine national security through
loss of control over crucial industries.
Skepticism about FDI is nothing new. In
his Report on Manufactures in 1791, Alexander
Hamilton wrote:
Inward FDI
With a stock valued at $3.9 trillion, the
United States is the top single-country destination for the world’s FDI outflows.12 There
are plenty of reasons for that being the case,
including the facts that the United States is
the world’s largest market and has a sound
It is not impossible that there may be
persons disposed to look with a jeal-
4
ous eye on the introduction of foreign
capital, as if it were an instrument to
deprive our own citizens of the profits
or our own industry; but, perhaps,
there never could be a more unreasonable jealousy. Instead of being viewed
as a rival, it ought to be considered as
a most valuable auxiliary, conducing
to put in motion a greater quantity of
productive labor, and a greater portion of useful enterprise, than could
exist without it.15
the relative contribution of affiliates to GDP
is even more profound: overall U.S. manufacturing sector value-added increased by 21
percent over the decade, while it rose by 53
percent for manufacturing-sector affiliates.
As average private-sector compensation
per worker increased by 33 percent over the
decade, it increased by 40 percent at U.S. affiliates to $77,409—a 24 percent premium
over the private-sector average. Per worker
compensation in the overall U.S. manufacturing sector averaged $76,484 in 2010, as
compared to an average of $85,211 at manufacturing affiliates. The smaller and shrinking differential—11 percent in 2010, down
from 15 percent in 2001—speaks to the positive impact of affiliates on U.S. workers’ incomes.18
Affiliates have demonstrated a strong
commitment to the U.S. economy, increasing their stock of U.S. property, plant, and
equipment by 46 percent over the decade—
double the overall private-sector increase.
U.S.-based companies also benefit from exposure to the best practices employed by affiliates, many of which are world-class companies that know how to operate efficiently.
While sales per worker in the U.S. private
sector amounted to $431,758 in 2010, it averaged $632,777 among affiliates—a 47 percent premium. Just as they generate more
revenue per worker, affiliates get more revenue from their physical assets. In 2010, affiliates’ fixed asset turnover ratio (a measure of
return on assets) was 53 percent higher than
it was for the U.S. private sector on average.
U.S. affiliates have raised average economic performance by boosting output,
sales revenue, exports, employment, and
compensation. They have also demonstrated
a strong commitment to the United States
with increasing levels of capital investment,
reinvested profits, research and development
spending, and cultivation of relationships
with U.S. suppliers. And they have introduced industry best practices, as evidenced
by the achievement of higher levels of valueadded per worker, sales per worker, and returns on assets.
The data support Hamilton’s perspective.
According to recent congressional testimony from Dartmouth economist Matthew
Slaughter:
U.S. subsidiaries of global companies—despite accounting for far less
than 1% of U.S. businesses—perform
large shares of America’s productivityenhancing activities that lead to higher average compensation for American
workers.16
Slaughter notes that, in 2010, these subsidiaries produced $649.3 billion in output,
which was 5.8 percent of all private-sector
output; purchased $149 billion in new
property, plant, and equipment, which was
14.4 percent of all non-residential, privatesector capital investment; exported $229.3
billion of goods, which was 18 percent of
the U.S. total; performed $41.3 billion of
research and development, accounting for
14.3 percent of the total performed by all
U.S. companies; and purchased 80 percent
of their intermediate goods—nearly $2 trillion worth—from U.S. suppliers.17
Digging deeper into the data, the increasing contribution of these subsidiaries, affiliates, or “insourcing” companies to U.S.
economic performance is unmistakable.
Between 2001 and 2010, U.S. private sector
value-added (output measured in terms of
GDP) increased by 39 percent; for affiliates,
the increase was 56 percent, which lifted the
overall average. In the manufacturing sector,
5
Between 2001
and 2010, U.S.
private sector
value-added,
measured in
terms of GDP,
increased by
39 percent, and
for affiliates, the
increase was
56 percent.
Any trade deficit
is matched by
an investment
surplus, as
the dollars
that purchase
foreign goods
and services and
foreign assets are
matched nearly
identically by
dollars coming
back to the
United States.
These data suggest that the alleged ill effects of inward FDI are more bark than bite,
and they make a compelling case for the extension of maximum investment liberalization to currently restricted industries, such
as shipping, commercial aviation, and mining. While being mindful of the national security implications of foreign acquisitions
is always prudent, the potential for an overencompassing definition of national security
to give cover to protectionist or otherwise political motives is also an ever-present danger.
Until the past few years, Chinese direct
investment in the United States has been
immaterial.19 Some proposed high-profile
Chinese acquisitions of U.S. companies have
come under close scrutiny from the Committee on Foreign Investment in the United
States (CFIUS), resulting in aborted transactions and post-acquisition divestment.
As the volume and value of Chinese investments in the U.S. economy increases in the
coming years, it is highly likely that acquisitions without any pertinent national security ramifications will be portrayed as threats
and thwarted by politicians acting through
an opaque CFIUS process. The recently proposed acquisition of Smithfield Foods for
$4.7 billion by Shuanghui International, and
the close scrutiny the deal is receiving from
CFIUS at the urging of numerous politicians with constituents in the same industry,
should raise concerns among those who recognize the importance of foreign investment
to U.S. economic growth and job creation.
Expansive definitions of national security
can undermine U.S. economic security.
which reduces domestic output, valueadded, employment, and all of the secondary and tertiary commercial activities that
would have taken place. But their argument
relies on the assumption that the dollars
sent to foreigners to purchase imports do
not make their way back into the U.S. economy—an assumption that is incorrect.
The dollars that go abroad to purchase
foreign goods and services (imports) and foreign assets (outward investment) are matched
nearly identically by dollars coming back to
the United States to purchase U.S. goods and
services (exports) and U.S. assets (inward investment). Any trade deficit (net outflow of
dollars) is matched by an investment surplus
(net inflow of dollars).20
This process helps explain the absence of
any inverse relationship between trade deficits and jobs and between trade deficits and
domestic output, and severely weakens the
claims of trade and investment skeptics.
As Figure 1 demonstrates, if anything,
there is a positive relationship between the
trade deficit and GDP. In years when the
deficit is rising, GDP is increasing; when the
deficit is falling, GDP tends to level off and
stagnate.
The trade deficit equals the excess of imports over exports. Homing in on the relationship between imports and GDP and between imports and jobs, a very clear, strong,
positive relationship is evident for nearly the
entirety of the period. Only in the three most
recent years has a growing economy (anemic
as it has been) been contemporaneous with
a declining trade deficit. It is worth noting,
however, that the annual growth in imports
in each of those years far exceeded the rate of
economic growth.21
As Figures 2 and 3 reveal, in years when
imports increase over the previous year, U.S.
output (as measured by GDP) and employment tend to increase from the previous
year. In years when imports show a decline,
output and employment also tend to decline. The high incidence of observations in
the upper-right and lower-left quadrants in
both graphs suggests positive relationships
Inward FDI and the Trade Deficit
Many of those who express reservations
about inward investment are the same people who issue warnings about the deleterious
effects of the U.S. trade deficit. They assert
that the deficit is a drain on U.S. economic
activity and employment. By purchasing
more goods and services from foreigners
than foreigners purchase from Americans,
the argument goes, U.S. factories, farmers,
and service providers are deprived of sales,
6
Figure 1
Real GDP and the Real Trade Deficit, 1969–2012
Deficit
GDP
Linear (Deficit)
800
16,000
700
14,000
600
10,000
400
300
8,000
200
6,000
Real GDP, $US Billions
Real Trade Deficit, $US Billions
12,000
500
100
4,000
-100
1969
1971
1973
1975
1977
1979
1981
1983
1985
1987
1989
1991
1993
1995
1997
1999
2001
2003
2005
2007
2009
2011
0
2,000
0
-200
Source: Bureau of Economic Analysis.
between imports and output and between
imports and jobs. In fact, as shown in Figure
2, in only one of the 44 years observed did
imports and output move in different directions. In Figure 3, the relationship between
imports and jobs is also demonstrated to be
positive. In 39 of the 44 years observed, the
measurements moved in the same direction.
If the trade deficit reduces economic activity and destroys jobs, why is there a positive relationship between these variables?22
One important reason is that investment
inflow provides the capital that supports
economic activity and job creation.
Moreover, contrary to the admonitions
of deficit hawks, the trade deficit is not a
running tab that we or our children will have
to pay back to foreigners. Inward investment
used to finance the trade deficit comes primarily in the form of foreign purchases of
U.S. equities and direct investment. These
are investments that produce real wealth
and other benefits for American businesses,
workers, and consumers. The portion of the
trade deficit that the American public will
have to pay back is that which finances the
U.S. government’s debt, which accounts for
about one-third of the value of all foreign
investment and is not a failing of trade or
investment policy, but a consequence of excessive government spending.23
Outward FDI
Considering how the U.S. economy reaps
all of these benefits from inward investment,
it is tempting to conclude that outward investment is economically deleterious. After
all, if activity-spurring, value-creating investment flows from U.S. investors to locations
abroad, there will be less production, less
7
Investment
inflow provides
the capital
that supports
economic activity
and job creation.
Figure 2
Annual Changes in Real Imports and Real GDP, 1969–2012
8.0%
Annual Percent Change in Real GDP
6.0%
4.0%
2.0%
-25.0%
0.0%
-5.0%
-15.0%
5.0%
15.0%
25.0%
-2.0%
-4.0%
-6.0%
-8.0%
Annual Percent Change in Real Imports
Source: Bureau of Economic Analysis.
Outward
investment
and domestic
economic activity
are usually
complementary,
as investment
abroad tends to
spur domestic
activity.
value creation, fewer jobs, a smaller tax base,
and less research and development spending
in the United States.
But that is not necessarily the case. Outward investment and domestic economic activity are usually complementary; investment
abroad tends to spur domestic activity because local and foreign operations are often
sequential functions in the same supply chain
or because there is more demand placed on
domestic administrative, accounting, human
resources, and other management functions
to support expanding activities abroad.
The cliché about foreign outsourcing
describes factories shutting down in the
industrial Midwest only to be resurrected
bolt-by-bolt, rafter-by-rafter in developing
countries to produce the same products for
export back to the United States. Yet in reality, most outward investment has been
to serve purposes that cannot be fulfilled
practicably or cost-effectively in the United
States. Reaching potential foreign customers without having any physical presence
in their countries, for example, would be a
difficult task. Marketing to foreign customers, getting better acquainted with foreign
product preferences, having retail locations
to serve demand abroad, performing postsale and other customer-service activities,
tapping into local expertise, or diversifying
market-specific risks are among several reasons to invest abroad that are highly unlikely
to be successfully replicated from within the
United States. Outward investment of this
nature and for these purposes might be considered “non-discretionary” offshoring; they
are the steps that must be taken in order for
U.S. companies to compete more effectively
in the global economy.
U.S. companies invest abroad for a variety of important reasons, but serving U.S.
8
demand from those foreign locations is not
prominent among them. Referring to the
recent growth of U.S. investments in China,
Brazil, India, and Eastern Europe, Bureau of
Economic Analysis economists Kevin Barefoot and Raymond Mataloni noted: “Judging by the destination of sales by affiliates
in those countries, the goal of the U.S. multinational corporations’ expanded production was to primarily sell to local customers rather than to reduce their labor costs
for goods and services destined for sale in
the U.S., Western Europe and other highincome countries.” According to the data,
over 90 percent of the value of output from
foreign affiliates of U.S.-based companies is
sold in foreign markets.24
For the unconvinced, it is worth noting
these findings of Harvard Business School
professors Michael E. Porter and Jan W. Rivkin:
[L]arge-scale relocations make up a
tiny fraction of all American job losses.
From 2008 to 2010, mass layoffs (50
or more jobs) involving relocations
outside the U.S. resulted in the loss
of only 27,145 U.S. jobs, government
statistics show. In contrast, mass layoffs not involving foreign relocations
resulted in nearly 5 million jobs lost.25
Outward investment benefits the U.S. economy through numerous direct and indirect
channels. The pattern for outward FDI is
similar to that for inward FDI in the sense
that the overwhelming majority is located
in rich countries. Nearly three-quarters of
the $5.2 trillion stock of U.S.-owned direct
investment abroad is concentrated in Europe, Canada, Japan, Australia, and Singapore.26 Contrary to persistent rumors, only
Figure 3
Annual Changes in Real Imports and Non-Agricultural Employment, 1969–2012
Annual Percent Change in Non-Agricultural Employment
8.0%
6.0%
4.0%
2.0%
-5.0%
0.0%
-1.0%
-3.0%
1.0%
-2.0%
-4.0%
-6.0%
-8.0%
Annual Percent Change in Real Imports
Source: Bureau of Economic Analysis.
9
3.0%
5.0%
Over 90 percent
of the value of
output from
foreign affiliates
of U.S.-based
companies is
sold in foreign
markets.
U.S. companies
must be engaged
in foreign
markets, because
95 percent of
the world’s
population is
overseas.
1.3 percent of the value of U.S. outward FDI
was in China at the end of 2011.27
Even after factoring out U.S. investment
in foreign financial institutions, banks, and
holding companies (which account for nearly two-thirds of the total outward stock), the
bulk of outward U.S. FDI remains concentrated in developed countries, with Europe,
Canada, Japan, Australia, and Singapore accounting for 70 percent of all outward U.S.
manufacturing FDI and China’s share rising
to a still modest 4.5 percent.28 U.S. investors
are also important participants in foreign
professional services and information industries, as well as their hospitality and wholesaling sectors—industries that would all
seem to require intensive physical presence.
With 95 percent of the world’s population overseas, where the rate of economic
growth over the past decade well exceeded
the U.S. rate, U.S. companies must be engaged in foreign markets. Nine of the 10
largest U.S. multinational companies had
greater revenues in foreign markets than in
the United States.29
In 2010, the total value of U.S. exports
to the world was $1.8 trillion, but majorityowned foreign affiliates of U.S. companies
had sold $5.2 trillion of goods and services
in foreign markets. In other words, for every dollar of U.S. exports, foreign affiliates
of U.S. companies made $3 in sales to foreign customers. That ratio is even more pronounced for multinational corporations.
Matthew J. Slaughter found that in 2010,
U.S.-based multinational companies exported $573.3 billion in goods to foreign markets, while their foreign affiliates sold $3.7
trillion worth of goods in those markets,
for a greater than 6-to-1 premium.30 This
would seem to confirm the importance of
direct investment abroad to the success of
U.S. multinational companies. And success
abroad begets success at home.
Slaughter adds:
ment abroad often boosting hiring,
investment, and R&D in their U.S
operations. And they create jobs in
America in other companies, not just
in themselves. In particular, they create jobs in small and medium-sized
American enterprises that become
part of their global supply networks.31
U.S. multinational corporations’ investment in affiliates abroad is crucial to the
success of their U.S. operations, and impediments to outflows would likely adversely
impact their U.S. employment, compensation, and investment. According to Slaughter, U.S. parent companies account for large
shares of U.S. economic activity: they produce 23 percent of all private-sector valueadded; they hold 42 percent of all privatesector capital investment; they account for
45 percent of U.S. exports; and they conduct
69 percent of all research and development
expenditures undertaken by the private sector.32
U.S. parent operations are very much
complementary to the operations of their
foreign affiliates. In a recent Peterson Institute for International Economics (PIIE) paper recommending corporate tax reforms to
spur more investment at home and abroad,
Gary Hufbauer and Martin Vieiro argue that
“MNCs which engage in FDI are in the best
position to create jobs and promote prosperity at home.”33 They reinforce the point
that outward FDI is not a substitute for, but
a complement to, investment and economic
activity at home:
Better jobs, higher investment, larger
exports, and more research and development (R&D) at home go hand
in hand with greater outward FDI.
Unfortunately, and contrary to these
research findings, much of the recent
debate over corporate tax policy reflects
a zero-sum view of MNC activity.34
Expansion abroad by U.S. companies
tends to complement their U.S operations, with more hiring and invest-
The performance of foreign affiliates and
their U.S. parents points to complemen-
10
tarity. Across a range of relevant metrics
(depicted in Figures 4–9), the performance
of foreign affiliates and their U.S. parents
seems to be positively correlated, improving or declining contemporaneously. Annual changes in affiliates’ and parents’
capital expenditures, output (value-added),
total compensation, and compensation per
worker moved in the same direction in 8 of
the 11 years measured. Such was the case for
research and development spending in 6 of
the 9 years measured. For employment, the
complementarity was not as evident, with
changes moving in the same direction in 6
of 11 years. However, in 3 of the 5 years when
employment moved in opposite directions
(affiliate employment increased and parent
employment decreased), there was no perceptible increase in employment at affiliates
to suggest substitutability. Also notable is
the fact that in all 11 years, compensation
per worker at U.S. parents increased over the
previous year.
For those still skeptical, Matthew Slaughter offers these additional reassurances:
The worldwide operations of U.S.headquartered multinational companies are highly concentrated in
America in their U.S. parents, not
abroad in their foreign affiliates: In
2010, U.S. parents accounted for 67.3
percent of their companies’ worldwide
employment, 72.5 percent of capital investment, and 84.3 percent of
R&D.35
The decline of both direct and indirect
impediments to trade and investment—aided by other important trends—has opened
new channels for connecting U.S. consumers to foreign producers and U.S. producers
Figure 4
Annual Percent Changes at Foreign Affiliates and U.S. Parents Capital Expenditures
(2000–2010)
20.0%
Annual Percent Change at U.S. Parents
15.0%
10.0%
5.0%
-20.0%
-15.0%
-10.0%
0.0%
-5.0%
0.0%
5.0%
10.0%
-5.0%
-10.0%
-15.0%
-20.0%
Annual Percent Change at Foreign Affiliates
Source: Bureau of Economic Analysis.
11
15.0%
20.0%
The performance
of foreign
affiliates and
their U.S.
parents seems
to be positively
correlated
across a range of
relevant metrics,
improving
or declining
contemporaneously.
Figure 5
Annual Percent Changes at Foreign Affiliates and U.S. Parents Value Added
(2000–2010)
20.0%
Annual Percent Change at U.S. Parents
15.0%
10.0%
5.0%
-20.0%
-15.0%
-10.0%
-5.0%
0.0%
0.0%
5.0%
10.0%
15.0%
20.0%
-5.0%
-10.0%
-15.0%
-20.0%
Annual Percent Change at Foreign Affiliates
Source: Bureau of Economic Analysis.
American
companies
investing abroad
are accused
of pursuing
low wages
and lax labor,
environmental,
and productsafety standards
so they can cut
production costs
and pad the
bottom line.
to foreign consumers, has improved opportunities for cross-border collaboration in
production and design, has increased the
likelihood that worthy ideas get funded and
appropriately marketed, and, ultimately, has
expanded the global pie.
is gaining access to proprietary U.S.-owned
technology, or knocking off U.S. competitors, or disrupting domestic supply chains,
something sinister or economically threatening is intimated about the transaction.
Meanwhile, U.S. companies that invest
abroad are accused of engaging in a race to
the bottom, fueled by an endless pursuit of
lower wages and increasingly lax labor, environmental, and product-safety standards so
as to shave a few cents off the cost of production and pad the bottom line. Throughout the election campaigns last year, President Obama and Governor Romney traded
accusations over who was most guilty of
perpetuating this sin. Referring to Mr. Romney, an Obama campaign news release said
“As a corporate buyout specialist, he made
massive profits by shuttering plants, firing
workers and investing in companies that
pioneered shipping of good American jobs
The “Race to the Bottom”
Canard
Like all businesses, multinational corporations are committed to maximizing profits for their shareholders. Globalization’s
loudest critics detect malevolence in their
motives. Foreign companies seeking to purchase U.S. businesses or make new investments in production facilities in the United
States are often portrayed as pursuing an
opaque agenda that offends their conceptions of the “national interest.” Whether it
12
overseas.”36 In response, and referring to allegations that “stimulus” money was benefitting foreign companies, Romney said: “If
there’s an outsourcer-in-chief, it’s the president of the United States, not the guy who’s
running to replace him.”37 Unfortunately,
with the candidates droning on about the
ravages of “shipping jobs overseas,” the predictable debate about offshoring that transpired generated more heat than light, and
was a lost opportunity to educate Americans
about the real determinants and benefits of
foreign direct investment.
Contrary to the misconceptions so often
reinforced in the media, offshoring is rarely
the product of U.S. businesses chasing low
wages or lax standards abroad. Businesses
are concerned about the entire cost of production, from product conception to consumption. Foreign wages and standards are
but a few of the numerous considerations
that factor into the ultimate investment and
production decision.
Locales with low wages and lax standards
tend to be expensive places to produce all
but the most rudimentary goods because,
typically, those environments are associated with low labor productivity and other
economic, political, and structural impediments to smooth operation of cost-effective
supply chains. Most of those crucial considerations favor investment in rich countries
over poor.
Indeed, if low wages and lax standards
were the real draw, then U.S. investment outflows would not be so heavily concentrated
in rich countries with higher wages and more
stringent labor, environmental, and product
safety standards than our own.38 Likewise,
the United States would not be the world’s
largest single country destination for direct
investment. In 2011, the value of the stock
Figure 6
Annual Percent Changes at Foreign Affiliates and U.S. Parents R&D Expenditures
(2002–2010)
20.0%
Annual Percent Change at U.S. Parents
15.0%
10.0%
5.0%
-25.0%
-15.0%
0.0%
-5.0%
5.0%
-5.0%
-10.0%
-15.0%
-20.0%
Annual Percent Change at Foreign Affiliates
Source: Bureau of Economic Analysis.
13
15.0%
25.0%
If low wages and
lax standards
were the real
draw, U.S.
investment
outflows would
not be so heavily
concentrated in
countries with
higher wages and
more stringent
standards than
our own.
Figure 7
Annual Percent Changes at Foreign Affiliates and U.S. Parents Compensation
(2000–2010)
20.0%
AnnualPercentChange at U.S. Parents
15.0%
10.0%
5.0%
-20.0%
-15.0%
-10.0%
-5.0%
0.0%
0.0%
5.0%
10.0%
15.0%
20.0%
-5.0%
-10.0%
-15.0%
-20.0%
Annual Percent Change at Foreign Affiliates
Source: Bureau of Economic Analysis.
Foreign
investments,
jobs, and related
activities in
America, which
employ more
than five million
U.S. workers,
are the products
of foreign
companies
engaging in
offshoring.
of foreign direct investment in the U.S. manufacturing sector alone amounted to $838
billion, while the value of the stock of U.S.
direct investment in foreign manufacturing
sectors amounted to $589 billion.39 Those
figures amount to a $250 billion manufacturing “insourcing” surplus.
In the midst of last summer’s outsourcing brouhaha, the candidates were remiss
in failing to note that Europe’s Airbus had
announced plans for a $600 million facility in Mobile, Alabama, just down the road
from the $5 billion, 1,800-worker steel production facility belonging to German-based
ThyssenKrupp, which was built there for its
proximity to the dozens of mostly foreignnameplate auto producers, who employ tens
of thousands of U.S. workers and generate
economic activity supporting thousands
more, all while providing U.S. consumers
with greater value from their automobiles
than they would be getting absent those
foreign investments. Those investments,
jobs, and related activities are the products
of foreign companies engaging in offshoring. Why do they come to American shores
to produce instead of producing elsewhere?
Because from an aggregate cost perspective,
locating here makes the most sense. They
are not here because of low wages or lax enforcement of labor and environmental standards, but because all of the factors affecting
costs that each company uniquely considers
weigh—in the aggregate—in favor of locating
their respective activities here.
That such a large proportion of the
world’s investment is located in rich countries should be strongly persuasive evidence—
even to globalization’s biggest skeptics—that
other factors are of greater significance to
14
the investment decision than wages and environmental standards.
ket; the size of nearby markets; the overall
economic environment in the host country
or region; the political climate; the risk of
asset expropriation; the regulatory environment; taxes; and the dependability of the
rule of law, to name some.
Although the United States has fared
well with respect to these investment determinants over the years, it is now faltering in
many respects, while facing greater competition from once-slumbering economies that
have liberalized their markets, stabilized
their political systems, upgraded their labor
skills, and strengthened their business and
legal institutions.
The Organization for Economic Co-operation and Development (OECD) publishes
annually an index of foreign direct investment restrictiveness for OECD member
countries and other countries. The index is a
compilation of scores assigned to four types
What Really Drives the
Investment Decision?
Investment is a judgment about the virtues of a jurisdiction’s business and political climates. Policies that breed stability and
predictability are good. The importance of
these determinants of investment varies by
company, by situation, and by prospective
function to be performed. But, by and large,
they include considerations such as the
quality and skills of the work force; access
to ports, rail, and other transportation infrastructure; customs-clearance procedures;
import duties; proximity of the prospective
production location to the next or previous
link in the supply chain or to the final mar-
Figure 8
Annual Percent Changes at Foreign Affiliates and U.S. Parents Employment
(2000–2010)
10.0%
Annual Percent Change at U.S. Parents
8.0%
6.0%
4.0%
2.0%
-10.0%
-5.0%
0.0%
0.0%
-2.0%
5.0%
-4.0%
-6.0%
-8.0%
-10.0%
Annual Percent Change at Foreign Affiliates
Source: Bureau of Economic Analysis.
15
10.0%
Investment is a
judgment about
the virtues of a
jurisdiction’s
business and
political climates.
Figure 9
Annual Percent Changes at Foreign Affiliates and U.S. Parents Compensation per
Worker (2000–2010)
10.0%
Annual Percent Change at U.S. Parents
8.0%
6.0%
4.0%
2.0%
-10.0%
-5.0%
0.0%
0.0%
-2.0%
5.0%
10.0%
-4.0%
-6.0%
-8.0%
-10.0%
Annual Percent Change at Foreign Affiliates
Source: Bureau of Economic Analysis.
From 1997 to
2012, U.S. foreign
direct investment
restrictiveness
has remained
unchanged,
but policy
consistency
means relative
decline when the
rest of the world
is reforming.
of investment restrictions, including limits
on foreign equity; screening or prior approval requirements of foreign investors; restrictions on the activities of foreign personnel
who are key to the investment operations;
and other restrictions on operations, including those with respect to domestic content,
the establishment of branches, and restrictions on profit or capital repatriation.40
The index is designed to reflect FDI restrictiveness, as intended by the explicit
rules governing foreign direct investment in
each economy. The scores are not adjusted
in any way to account for intensity (or lack
thereof) of enforcement, nor do they reflect
other laws, regulations, rules, practices, or
customs that may influence or deter foreign
investment.
Scores are assigned for each of the four
categories based on the policies in effect on a
scale of 0 to 1, where 0 means completely un-
restricted and 1 means completely restricted. Major sectors within each economy are
assigned scores for each of the four categories, as the rules tend to be more restrictive
in some sectors than in others. Ultimately,
those sector-specific scores are compiled
into an economywide index.41
Looking at the index from 1997 to 2012,
the U.S. score of 0.089 has remained the
same every year.42 Official U.S. laws and regulations with respect to these four categories of investment policy have not changed
over the span of these years, which explains
the consistent index score. High scores for
overt ownership restrictions in U.S. fisheries, utilities, maritime and air transportation, and radio and television industries are
muted by the absence of ownership restrictions in most other industries. But policy
consistency means relative decline when the
rest of the world is reforming.
16
In 1997, the average score for all OECD
countries was 0.138, which was 55 percent
more restrictive than the United States. In
2012, the OECD average was .081, which
was 9 percent less restrictive than the United
States. As the United States stood still, OECD
countries, on average, became 41 percent less
restrictive of foreign direct investment.
Between 1997 and 2012, all of the BRICS
countries (Brazil, Russia, India, China, and
South Africa) experienced significant investment reform. Brazil improved from .113 to
.086, which was a 24 percent reduction in restrictiveness. Russia improved by 47 percent,
from .338 to .178. Improving from .484 to
.273, India became 44 percent less restrictive. China’s score improved from .633 to
.407, which is 36 percent less restrictive. And
South Africa improved from .102 to .054, a
47 percent improvement.
In 1997, the U.S. score was better than 16
of 34 OECD economies; in 2012, the U.S.
score was better than only 9 of the 34 OECD
economies. In 1997, the United States was
less restrictive than all nine developing countries measured, but in 2012 it was better than
only five of those nine developing countries.
Overall, in 1997 the United States ranked
18th out of 43 countries measured, but it fell
to 29th out of those original 43 in 2012.
The relative decline of U.S. investment
openness, as measured by the explicit rules,
should be a major concern to U.S. policymakers, as the number of viable destinations for direct investment has been increasing. But the investment environment—the
attractiveness of an economy to investment—is not exclusively, or even primarily,
a function of the rules explicitly governing
investment. Openness is a necessary but
insufficient condition. Whether the investment comes depends on numerous other
competitive factors.
The annual Economic Freedom of the World
Report includes an index that “measures the
degree to which the policies and institutions
of countries are supportive of economic
freedom.”43 The index score reflects performance on 42 different variables that feed
into five broad measurement components
of economic freedom: the size of government, the legal system and property rights,
sound money, the freedom to trade internationally, and regulation. To varying degrees,
each component contributes to the domestic investment environment.
Overall, the United States ranked 18th
out of 144 countries in the most recent ratings, which the authors note is the latest
score in “a substantial decline in economic
freedom during the past decade . . . The
chain-linked ranking of the United States
has fallen precipitously from second in 2000
to eighth in 2005 and 19th in 2010 (unadjusted ranking of 18th).”44
The “Freedom to Trade Internationally”
component, which is based largely on data
published by the World Bank, the International Monetary Fund, the World Trade
Organization, and the World Economic Forum, provides a measure of some of the laws
and regulations that directly affect foreign
investment, such as restrictions on foreign
ownership of assets and controls on the
flow of capital. As the OECD index score
confirmed, U.S. performance with respect
to those conditions has been declining relative to other countries. Although the United
States ranked 18th overall, it ranked 57th
on the “Freedom to Trade Internationally”
component.
But it is not just restrictions placed on
foreign investment that are taken into account by prospective investors. Foremost are
answers to questions about whether foreign
investors want to be in a particular country
in the first place. The four other broad components measured by the Economic Freedom
of the World Report are probably more illuminating in that regard.
Relative to its overall score, the United
States performs poorly on many of the index
components, which all contain subcomponents that reflect on the investment climate.
On “Legal System and Property Rights,”
which includes consideration of the integrity of the legal system, protection of property rights, and regulatory restrictions on
17
The relative
decline of
U.S. investment
openness should
be a major
concern to U.S.
policymakers,
as the number
of viable
destinations for
direct investment
has been
increasing.
the sale of real property, the United States
ranked 28th.
The authors note a whopping 2 point
decline in the U.S. score on this index component since 2000, and offer the following
possible explanation:
The United
States performs
poorly on many
of the Economic
Freedom of the
World index
components,
including
“regulation”
and “size of
government.”
conditions that may help to attract or repel investment is the Global Competitiveness
Index, which is the basis for the analysis in
the World Economic Forum’s annual Global Competitiveness Report. The purpose of
the report is to study and benchmark the
many factors underpinning national competitiveness, which is defined by the World
Economic Forum as “the set of institutions,
policies, and factors that determine the level of productivity of a country . . . [which]
also determines the rates of return obtained
by investments in an economy.”47 In other
words, the factors considered are those that
would directly influence investment location decisions.
The United States is ranked 5th on the
overall global competitiveness index for
2011–2012, which is a weighted value reflecting scores assigned for 12 broad criteria
presumed to affect “competitiveness,” including: institutions, infrastructure, macroeconomic environment, health and primary
education, higher education and training,
goods market efficiency, labor market efficiency, financial market development, technological readiness, market size, business
sophistication, and innovation.
The scores assigned to each of these 12
criteria are derived by weight-averaging the
scores from individual survey questions. For
example, there are 21 questions related to
the first criteria, “institutions,” including
conditions such as property rights, public
trust of politicians, judicial independence,
transparency of government policymaking,
and more. There are nine questions that
feed into the infrastructure score, six that
feed into the macroeconomic environment
score, 16 that comprise the goods market efficiency score, and so on.
The relatively high weighted average U.S.
rank of 5th reflects a few obvious U.S. advantages, including “market size” (ranked 1st),
“university-industry collaboration in R&D”
(which feeds into the innovation criterion;
ranked 3rd), “strength of investor protection” (institutions; ranked 5th), “availability
of airline seats” (infrastructure; ranked 1st),
While it is difficult to pinpoint the
precise reason for this decline, the
increased use of eminent domain to
transfer property to powerful political interests, the ramifications of the
wars on terrorism and drugs, and the
violation of the property rights of
bondholders in the bailout of automobile companies have all weakened
the United States’ tradition of the
rule of law and, we believe, contributed to the sharp decline of the Area
2 rating.45
On “Regulation,” which includes credit market, labor market, and business regulations,
the United States ranked 31st. For “Size of
Government,” which includes consideration
of income and payroll taxes, the United
States ranked 73rd. Taxes, regulations, security of property, and the integrity of the
legal system are all important determinants
of investment flows, so policymakers should
not be cavalier about these declines.
As the authors note:
The approximate one-point decline
in the summary rating between 2000
and 2010 on the 10-point scale of the
index may not sound like much, but
scholarly work on this topic indicates
that a one-point decline is associated with a reduction in the longterm growth of GDP of between 1.0
and 1.5 percentage points annually. This implies that, unless policies
undermining economic freedom are
reversed, the future annual growth of
the US economy will be half its historic average of 3%.46
Even more revealing of the qualities and
18
“inflation” (macroeconomic environment;
ranked 1st), “extent of marketing” (business
sophistication; ranked 3rd), and a few others.
On taxes and regulations, the U.S. ranks
poorly. On the “Burden of Government
Regulation,” the United States ranked 58th
out of 142 countries with a score of 3.4 on a
scale from 0-to-7, slightly above the global
average of 3.3. On the “Extent and Effect of
Taxation,” the United States ranked 63rd;
on “Total Tax Rate, % Profits,” the United
States came in 96th.
The United States ranked 24th on quality of total infrastructure, better than on
taxes and regulations. The same goes for
“technological readiness” and “innovation.”
“Higher education” generates bad scores for
the United States, but clearly not for lack of
spending.
Combine those impediments to investment and hiring with the growing perception that crony capitalism is on the rise
(U.S. rank: 50th), that customs procedures
present obstacles to global supply chains
(58th), that U.S. public debt weighs heavily
on the economy (132 of 142), and that government spending is on a treacherous path
(139th), and it becomes more apparent why
an increasingly mobile business community
often seeks the refuge and relatively warm
embrace of foreign shores.
In a recent paper with colleague Jan
Rivkin, renowned and prolific expert on
business strategy and competitiveness Michael E. Porter wrote:
decisions that support healthy job
growth and rising wages.48
Although high-end activities such as advanced manufacturing and research and development have been U.S. strengths over the
years, Porter and Rivkin worry that the United States has been struggling to attract and
retain those activities. They attribute the
loss of location decisions to bad public policies: “The U.S. government is failing to tackle weaknesses in the business environment
that are making the country a less attractive place to invest and are nullifying some
of America’s most important strengths.”49
Their focus on policy failings is consistent
with their view that “a location decision is,
in many respects, a referendum on a nation’s
competitiveness.”50
The authors surveyed nearly 10,000 Harvard Business School alumni about their
experiences with location decisions. Citing
a complex tax code, an ineffective political
system, a weak public education system,
poor macroeconomic policies, convoluted
regulations, deteriorating infrastructure,
and a lack of skilled labor, survey respondents expressed great concern that business
conditions in the United States were eroding relative to other countries.
Of the respondents, 1,767 had been directly involved with a location decision in
the previous year, and 57 percent said the
decision was about moving activities out
of the United States (which happened in 86
percent of those cases); 34 percent said the
decision concerned whether to locate new
activities in the United States or elsewhere
(half of the time the U.S. was chosen); and
only 9 percent said the decision was about
whether to move activities into the United
States from abroad (which happened threequarters of the time).
The results of these several surveys help
explain the declining U.S share of global investment: the United States is losing ground
to other countries partly because of perceptions that its business and investment climate have become less hospitable.
The question ‘Where should we
locate?’ is more prominent in the
minds of executives than it has ever
been. Over the past three decades,
business activities have become
increasingly mobile, and more and
more countries have become viable
contenders for them. As a result, the
number and significance of location
decisions have exploded. Considerable
evidence . . . suggests that the U.S. is
not winning enough of the location
19
The U.S.
government is
failing to tackle
weaknesses in
the business
environment that
are making the
country a less
attractive place
to invest.
The solution will
require a full
accounting of the
range of policies
and practices
in place that
are subverting
investment and
working at crosspurposes.
The Proper Role of
Investment Policy
individual investors can circumvent local
courts and sue foreign governments in third
party, extra-legal tribunals for their being
deprived of “fair and equitable treatment,”
which could range from policies that have
some small tertiary effect on the investor up
to expropriation of property.
This policy approach may look reasonably enlightened from a rule of law perspective, but one perverse effect of requiring
foreign governments to agree to conditions
intended to homogenize the investment
climates around U.S. standards is that it
mitigates what are, in some cases, huge U.S.
advantages in the race to attract investment.
When companies weigh their location decisions, considerations about the commitment of the host government to transparency and the rule of law and the risk of asset
expropriation are important variables in the
equation. Policies designed to equalize attributes that are otherwise usually heavily in
America’s favor, for the purpose of providing extra guarantees and protections to U.S.
companies that invest abroad, are nothing
less than subsidizing outward investment.
Investment is risky. Foreign investment is
even more so. But surely U.S. multinational
companies contemplating foreign investments are savvy and sophisticated enough
to measure and manage risk. By mitigating
their risks for them, U.S. policymakers are
effectively subsidizing and thus lowering the
cost of offshoring, which means we should
expect to see more of it.
Instead, U.S. policymakers should work
to create the conditions that put the United
States in a stronger position to win more
of the location decisions of both foreignheadquartered and U.S.-based companies.
Policies that increase the benefits and lower
the costs of conducting economic activities
in the United States would simultaneously
encourage inward investment and discourage “discretionary” outward investment.51
This will require an understanding of the
determinants of investment location decisions and how public policy affects those determinants. (Reconsideration of the Model
In June 2011, the Council of Economic
Advisers published a paper titled “U.S. Inward Foreign Direct Investment,” which was
essentially a statement about the openness
of the United States to FDI and the benefits
of FDI to the U.S. economy. While it made
valid and important points, there were
no references to the declining U.S. share
of global inward FDI, no mentions of the
growing perceptions that the U.S. policy environment was becoming less hospitable to
investment, and, thus, no discussion about
U.S. policies that might be causing these
worsening perceptions.
Since then there have been expressions of
greater understanding from the administration and Congress that the United States is
in a global competition to attract and retain
investment. Administrative initiatives have
been undertaken. Legislation has been introduced. Recognition of the problem is a good
start, but the solution will require a full accounting of the range of policies and practices in place that are not only subverting
investment, but working at cross-purposes.
The American public is entitled to a degree of policy coherence. For example, if
attracting and retaining investment in the
United States is vital to economic growth,
why does the U.S. government promote bilateral investment treaties and investment
provisions in trade negotiations that have
the primary effect of subsidizing offshoring? Official U.S. investment policy objectives—as reflected in the language of the
State Department’s negotiating template
known as the Model Bilateral Investment
Treaty (BIT)—are to make other economies
as open to investment as the United States,
to establish rules for treating foreign investment and investors no less favorably than
domestic investment and investors, and
to ensure that the rights of U.S. investors
abroad are sufficiently secured. U.S. negotiators even insist on an investor-state dispute
mechanism under which companies and
20
BIT would be a good start.) It will also require a commitment to fixing the problems
that detract from the overall appeal of the
United States as an investment destination.
Some policymakers make it to this point
of the analysis only to come to the wrong
conclusion: that inducing investment in the
United States by raising the absolute cost of
investing abroad is equivalent to inducing
investment here by reducing the absolute
cost of investing in the United States. That
is false. Both approaches may reduce the relative cost of investing in the United States,
but only the latter approach reduces the absolute cost of producing anywhere.
President Obama has made mention on
many occasions of his desire to “end tax giveaways to companies that ship our jobs overseas.” The brouhaha over Apple’s and other
companies’ tax minimization schemes—perfectly rational and legal strategies to contend
with the byzantine U.S corporate tax—has
prompted some policymakers to consider
ways to make it more expensive for companies to operate abroad and to keep their
profits there. Policies that would penalize
companies for offshoring, such as assessing
them higher tax rates, stripping them of their
eligibility for tax credits or tax deductions, or
subsidizing domestic competitors who vow
to keep operations stateside, also reduce the
relative cost of conducting activities in the
United States. But they do so by raising the
absolute cost of investing abroad. Policies
designed to discourage offshoring by raising
its absolute cost reduce economic welfare
because U.S.-based multinational companies, who account for a significant share of
domestic economic activity, will become less
competitive and less capable of providing the
jobs, compensation, capital investment, and
research and development required by the
U.S. economy.
If policymakers want to retain and attract
more investment, compulsion is the wrong
approach. The recently introduced Global Investment in American Jobs Act of 2013 takes
a more reasonable tack.52 Despite its populist-sounding title, the legislation would:
direct the Secretary of Commerce, in
coordination with the heads of other relevant Federal departments and
agencies, to conduct an interagency review of and report on ways to
increase the competitiveness of the
United States in attracting foreign
direct investment.53
The “Findings” section of the bipartisan Senate bill acknowledges the importance of foreign direct investment to the U.S. economy
and national security, acknowledges that the
United States is facing growing competition
for investment from the rest of the world,
acknowledges that the U.S. share has been
declining, advises legislators to consider the
likely impact of their bills on America’s capacity to attract investment, references some
of the Obama administration’s efforts to
promote the United States as an investment
destination, and sets the table for a comprehensive assessment of the policies that both
repel and attract foreign investment.
Senator Bob Corker (R-TN), one of the
bill’s cosponsors, remarked: “If we want the
U.S. to be the very best place in the world
to do business, we need to take a close look
at what we’re doing right, what we’re doing
wrong and how we can eliminate barriers
that diminish investment in the U.S.”54
What is so refreshing about the bill is
that its premise is not that the practices of
foreign governments or the greed of U.S.
corporations that allegedly “ship jobs overseas” are to blame, but that U.S. policy and
its accumulated residue have contributed to
a business climate that might be deterring
foreign investment in the United States, and
that changes to those policies could serve to
attract new investment. This kind of thinking is long overdue.
Comprehensive tax reform should be on
the table, given that the United States has a
tax code with the highest corporate tax rate
among OECD countries and an extraterritorial system that subjects corporate earnings
abroad to punishingly high rates of taxation
upon repatriation. PIIE’s Hufbauer and Vie-
21
If we want the
United States to
be the best place
to do business,
we need to look
at what we’re
doing right,
what we’re doing
wrong and how
we can eliminate
barriers to
investment in the
United States.
iro argue convincingly in a recent paper that
“[r]educing the U.S. corporate tax rate is certainly the most efficient way to encourage
domestic investment and associated gains
in production and jobs.”55
In January 2011, President Obama issued
Executive Order 13563 under the heading
“Improving Regulation and Regulatory Review.” Section 1 states:
If the fact that U.S.-based producers,
whose intermediate goods and capital equipment purchases accounted for over 60 percent of imports in 2012, are competitively
disadvantaged by higher production costs
than their foreign competitors on account of
the customs duties they must pay for those
inputs, permanently eliminating all duties
on production inputs should be an option
on the table.
If U.S. producers’ access to crucial raw
materials is frustrated by the hundreds of
antidumping and countervailing duty measures imposed at the behest of one or two
domestic suppliers, reforming the trade
remedy laws to include a public-interest provision and to permit full and formal consideration of the downstream consequences of
such restrictions would be wise.57
If a dearth of skilled workers is cited as an
investment deterrent, the spotlight should
be shone on U.S. education and immigration policy failures with the goal of finding
the right solutions.
If liability costs on account of wayward
class-action suits and other legal system
abuses are keeping investors at bay, major
tort reform should be seriously considered.
Investment deterrents can be found in
the millions of pages of the U.S. Code and
the Federal Register. In almost every instance,
these deterrents were not designed to impede
foreign investment. It is just that foreign investment is a verdict about the efficacy of a
country’s institutions, policies, and potential.
In the conclusion to his recent book
about the adverse accumulated impacts of
public policy on U.S. manufacturing, author
Andrew Smith provides a summary that aptly applies to the investment situation:
Our regulatory system must protect
public health, welfare, safety, and our
environment while promoting economic growth, innovation, competitiveness and job creation. It must be
based on the best available science. It
must allow for public participation
and an open exchange of ideas. It must
promote predictability and reduce
uncertainly. It must identify and use
the best, most innovative, and least
burdensome tools for achieving regulatory ends. It must take into account
benefits and costs, both quantitative
and qualitative. It must ensure that
regulations are accessible, consistent,
written in plain language, and easy
to understand. It must measure, and
seek to improve, the actual results of
regulatory requirements.56
Investment
deterrents can
be found in the
millions of pages
of the U.S. Code
and the Federal
Register.
If the burgeoning, increasingly unchecked
regulatory state is identified as an important impediment to investing in the United
States, President Obama should reissue his
Executive Order, but with a much greater
sense of urgency and seriousness, including
external reviews with goals and firm deadlines included.
If a badly incoherent U.S. energy policy—
one that leaves investors guessing about
whether and to what extent the administration will restrict gas and oil exports next year
and the year after, and about whether solar
energy will be subsidized or taxed in 2014—
is found to be deterring capital-intensive,
job-creating investments, the public should
be made aware of the decisionmaking process that has produced the impasse.
[N]o one person or group set out
with the intention of crippling the
manufacturing sector by making a
series of hostile policy choices. Each
new policy, each new program, each
new rule had at heart a good intention to make our system better. For
an entire generation we stood at the
22
top of the world and saw over the
horizon a seemingly endless bounty of
progress. Under the gilded light, the
small costs of a little stricter rule here,
a little excess compensation there, a
few more restrictions elsewhere simply
looked like pebbles on the smooth
pavement running endlessly ahead.
A nation as phenomenally wealthy as
the United States could afford to have
a highly litigious society with jackpot judgments, could afford the most
expensive health care system in the
world funded by its employers, could
afford to give labor unions destructive power over the workplace, could
afford to let government run wild
with excessive regulation, could afford
a complex and dysfunctional tax system, and could afford a featherbedded
disability system for its workers. It has
turned out, however, that these are
luxuries we can no longer afford. Only
the wealthiest nations can get away
with programs like these, for a time,
and as the rest of the world catches up
to the West, and to the United States
in particular, our ability to devote so
much of our national wealth to these
inefficiencies is no longer sustainable.
We are simply not rich enough to do
this any longer.58
tions are right, but they are under no obligations except to maximize profits for their
shareholders.
U.S. policymakers, however, do have an
obligation to maintain smart policies. They
may find it convenient to chide U.S. companies for sending jobs overseas or to say they
are being un-American, but the fact is that
policy and its accumulated residue weigh
heavily on decisions about where to locate
production and other-supply chain functions.
In a global economy, where investors have
options, governments are in a competition—
whether they know it or not and whether
they like it or not—to attract the financial,
physical, and human capital necessary to
nourish high value-added, innovation-driven, 21st-century economies. Punitive policies will only chase away the companies with
the capital needed to fuel growth.
In a global economy, offshoring is a
natural consequence of business competition. And policy competition is the natural
response to offshoring. This global competition in policy is a positive development,
and a properly functioning feedback loop
should serve as a check against bad policies.
U.S. policymakers are deluding themselves if they think the United States need
not compete to earn its share with good
policies. The decisions we make now with
respect to immigration, education, energy,
trade, entitlements, taxes, and the role of
government in managing the economy will
determine the health, competitiveness, and
relative significance of the U.S. economy in
the decades ahead. Offshoring is a check
against bad policy. Its increase tells us that
reform is in order.
Conclusion
Empowered by greater mobility and more
viable investment location alternatives,
companies have greater flexibility than ever
before when it comes to deciding where to
conduct functions including research and
development, design, manufacture, sales,
customer service, and other activities.
Some policymakers believe that it is the
obligation of U.S. multinational firms to ensure that they are doing their part to maximize U.S. employment—that these companies have a responsibility to hire and retain
U.S. workers. They will do that if the condi-
Notes
1. The U.S. Bureau of Economic Analysis tracks
cross-border investment of all kinds, as well as
the operations of U.S.-headquartered multinational companies, their foreign affiliates, and the
U.S. affiliates of foreign-headquartered multinational companies. Foreign affiliates are at least 10
percent owned by a U.S. parent (10% of the vot-
23
Governments are
in competition
to attract the
financial,
physical, and
human capital
necessary to
nourish high
value-added,
innovationdriven
economies.
ing shares are owned or controlled by the parent)
and U.S. affiliates are at least 10 percent owned
by a foreign parent. The BEA distinguishes and
separately tracks the operations of affiliates that
are 10–50 percent owned and those that are more
than 50 percent owned by a U.S. or foreign parent. Data cited in this paper concerning affiliate
performance are for these “majority-owned” entities. See www.bea.gov.
13. The BEA provides investment stock by industry and by country on a historical cost basis
only. Historical cost data are available for 2011,
but not 2012. Whereas the market value of the
stock of inward U.S. FDI was $3.9 trillion in
2012, it was $3.5 trillion in 2011. The historical
cost was $2.5 trillion in 2011, and the manufacturing sector stock, accounting for one-third of
the total, was $838 billion.
2. United Nations Conference on Trade and
Development, “World Investment Report 2012:
Towards a New Generation of Investment Policies” (2012), Annex Table I.2, p. 173. In 2012, according to the U.S. Bureau of Economic Analysis,
the stock of U.S. foreign direct investment was
valued a $3.9 trillion, but there is no corresponding figure for the value of the world stock in 2012.
14. See Michael V. Seitzinger, “Foreign Investment in the United States: Major Federal Statutory Regulations,” Congressional Research Service, January 26, 2009.
15. Secretary of the Treasury Alexander Hamilton, cited in Michael V. Seitzinger, “Foreign
Investment in the United States: Major Federal
Statutory Regulations,” Congressional Research
Service, January 26, 2009.
3. Ibid., Annex Table I.1, p. 169. The next largest destinations over this period were the UK
($103.3b), China ($99.7b), and Belgium ($96.4b).
16. Testimony of Matthew J. Slaughter before
the United States House of Representatives,
Committee on Energy and Commerce, Subcommittee on Commerce, Manufacturing, and Trade,
“Discussion of ‘The Global Investment in American Jobs Act of 2013’,” April 18, 2013.
4. United Nations Conference on Trade and Development, http://unctadstat.unctad.org/Table
Viewer/tableView.aspx.
5. United Nations Conference on Trade and
Development, “Global FDI Recovery Derails,”
Global Investment Trends Monitor 11 (January 23,
2013): 6.
17. Ibid.
18. Bureau of Economic Analysis, “International
Data, Direct Investment & Multinational Companies (MNCs),” http://www.bea.gov/iTable/in
dex_MNC.cfm.
6. Bureau of Economic Analysis, International
Investment Position, 1976–2012, http://www.bea.
gov/international/index.htm#iip. The market value of the stock of outward U.S. FDI in 2012 was
$5.2 trillion.
19. Valued at less than $1 billion in 2009, Chinese direct investment in the United States has
begun to increase. There has been a spate of acquisitions and proposed acquisitions of U.S. companies by Chinese suitors since 2010. According
to the BEA data, the stock of Chinese FDI in the
United States as of the end 2011 was $9.5 billion. However, a more recent accounting by the
Rhodium group (www.rhg.com) puts that figure
at about $25 billion, which includes deals in the
pipeline that might not yet have been consummated. In any event, China’s share of the $2.55
trillion of U.S. FDI stock is no more than 1 percent of the total.
7. The terms outward direct investment, outward foreign direct investment, outward FDI, and
offshoring are used interchangeably throughout
the paper. The term outsourcing, often mistakenly used to refer to what is really offshoring, will
be avoided to the fullest extent possible.
8. Council of Economic Advisors, “Economic
Report of the President, 2013,” Table B-1.
9. U.S. Department of Commerce, Bureau of
the Census, “Foreign Trade,” http://www.census.
gov/foreign-trade/data/index.html.
20. Technically, the outflow of dollars to buy
imports and foreign assets, plus remittances and
profits paid to foreigners, equals the inflow of
dollars to buy U.S. exports and U.S assets, plus
remittances and profits paid to Americans by
foreigners. Rearranging terms, the identity that
holds is: Current Account = -Capital Account.
10. U.S. Department of Commerce, Bureau of
Economic Analysis, “International Investment
Position of the United States,” Table 1, http://
www.bea.gov/international/index.htm#iip.
11. BEA, “International Investment Position.”
21. Council of Economic Advisers, Economic Report of the President (2013), Table B-2, Real Gross
Domestic Product (1964–2012). Between 2009
12. Ibid. This figure is the market value of the
U.S. stock in 2012.
24
and 2010, real import growth was 12.5% and real
GDP growth was 2.4%; between 2010 and 2011,
real import growth was 4.8% and real GDP growth
was 1.8%; between 2011 and 2012, real import
growth was 2.4% and real GDP growth was 2.2%.
34. Ibid.
35. Slaughter, “American Companies and Global Supply Networks,” p. 5.
36. Jon Greenberg, “Obama Says Tax Code Rewards Firms for Shifting Jobs Overseas,” Politifact.
com, http://www.politifact.com/truth-o-meter/st
atements/2012/oct/08/barack-obama/obamasays-tax-code-rewards-firms-shifting-jobs-ov/.
22. Note that import value is being used instead of the trade deficit (import minus exports)
because the occasional large annual swings in
value of the deficit makes for large year-over-year
percentage changes, which are difficult to plot
alongside annual changes in GDP or employment.
37. “Obama Stimulus Program Sent Jobs
Abroad, GOP Says,” Wall Street Journal, July 10,
2012, http://online.wsj.com/article/SB1000142
4052702303292204577519181071135146.html.
23. BEA, U.S. International Investment Position.
24. Kevin B. Barefoot and Raymond J. Mataloni
Jr., “Operations of U.S. Multinational Companies
in the United States and Abroad: Preliminary Results From the 2009 Benchmark Survey,” Survey of
Current Business (November 2011): 35, http://www.
bea.gov/scb/pdf/2011/11%20November/1111_
mnc.pdf.
38. Eighty percent of U.S. outward foreign direct investment is in Europe, Canada, Bermuda,
Australia, Singapore, and Japan.
25. Michael E. Porter and Jan W. Rivkin, “Choosing the United States,” Harvard Business Review 90,
no. 3 (March 2012): 80–91.
40. OECD, “FDI Restrictiveness Index,” http://
www.oecd.org/investment/fdiindex.htm.
39. BEA, “Balance of Payments and Direct Investment Position Data” (May 17, 2013), http://
www.bea.gov/international/di1fdibal.htm.
41. Ibid.
26. BEA, “Balance of Payments and Direct Investment Position Data,” (May 17, 2013). The
country- and industry-specific allocations for
investment are based on 2011 historical value figures, as the market value figures by country and
industry are not tracked by the BEA and the most
recent allocated values are for 2011, http://www.
bea.gov/international/di1fdibal.htm.
42. Ibid.
43. James Gwartney, Robert Lawson, and Joshua
Hall, et al., Economic Freedom of the World 2012 Annual Report, Fraser Institute (2012): v.
44. Ibid., p. vi.
45. Gwartney et al., Economic Freedom of the World,
2012 Annual Report, p. 17.
27. Ibid.
28. Ibid.
46. Ibid.
29. Mergent Online (database), Mergent, Inc.,
American University Library, http://www.merg
entonline.com, data obtained on March 19, 2013.
These are the top 10 companies by revenue, excluding banking and financial industry firms.
47. Klaus Schwab, “The Global Competitiveness
Report 2011–2012,” World Economic Forum
(2011).
30. Matthew J. Slaughter, “American Companies and Global Supply Networks: Driving U.S.
Economic Growth and Jobs by connecting with
the World” (December 2012): 28.
49. Ibid.
48. Porter and Rivkin, “Choosing the United
States.”
50. Ibid.
31. Ibid., p. 3.
51. The term “discretionary” refers to investment that goes abroad, but doesn’t really have
to. It is investment in activities that could be
performed in the United States if perceptions of
the U.S. policy environment were more favorable.
The term is used to distinguish investment in
these activities from investment in activities that
require a foreign presence.
32. Ibid., p. 10.
33. Gary Hufbauer and Martin Vieiro, “Corporate Taxation a US MNCs: Ensuring a Competitive Economy,” Peterson Institute for International Economics Policy Brief Number PB13-9
(April 2013).
25
52. The Global Investment in American Jobs
Act of 2013, S. 1023 and H.R. 2052.
56. Exec. Order No. 13,563, 76 Fed. Reg. 3821
(Jan. 18, 2011), “Improving Regulation and Regulatory Review.”
53. Ibid.
57. For a detailed discussion of this problem,
see Daniel Ikenson, “Economic Self-Flagellation:
How U.S. Economic Policy Subverts the National
Export Initiative,” Cato Institute Trade Policy
Analysis no. 46, May 31, 2011.
54. Office of Senator Bob Corker, “Corker,
Klobuchar Introduce Bill to Help Encourage
More Global Investment in the U.S., Improve
American Competitiveness,” press release, May
23, 2013.
58. Andrew O. Smith, Sand in the Gears: How
Public Policy Has Crippled American Manufacturing
(Washington: Potomac Books, 2013).
55. Hufbauer and Veiro, p. 11.
26
RELATED PUBLICATIONS FROM THE CATO INSTITUTE
Made on Earth: How Global Economic Integration Renders Trade Policy Obsolete
by Daniel Ikenson, Cato Institute Trade Policy Analysis no. 42 (December 2, 2009)
A Protectionism Fling: Why Tariff Hikes and Other Trade Barriers Will Be ShortLived by Daniel Ikenson, Cato Institute Free Trade Bulletin no. 37 (March 12, 2009)
“Shipping Jobs Overseas” or Reaching New Customers? Why Congress Should
Not Tax Reinvested . . . by Daniel Griswold, Cato Institute Free Trade Bulletin no. 36
(January 13, 2009)
Liberalization or Litigation? Time to Rethink the International Investment
Regime by Simon Lester, Cato Institute Policy Analysis no. 720 (July 8, 2013)
The Challenges of Negotiating a Transatlantic Trade and Investment Partnership
by Simon Lester, Cato Institute Free Trade Bulletin no. 51 (February 26, 2013)
License to Drill: The Case for Modernizing America’s Crude Oil and Natural Gas
Export Licensing Systems by Scott Lincicome, Cato Institute Free Trade Bulletin no.
50 (February 21, 2013)
Liberalizing Cross-Border Trade in Higher Education: The Coming Revolution of
Online Universities by Simon Lester, Cato Institute Policy Analysis no. 720 (February
5, 2013)
Countervailing Calamity: How to Stop the Global Subsidies Race by Scott
Lincicome, Cato Institute Policy Analysis no. 710 (October 9, 2012)
Still a Protectionist Trade Remedy: The Case for Repealing Section 337 by K.
William Watson, Cato Institute Policy Analysis no. 708 (September 19, 2012)
Free Trade and Tobacco: Thank You for Not Smoking (Foreign) Cigarettes by
Simon Lester, Cato Institute Free Trade Bulletin no. 49 (August 15, 2012)
Expanding Ex-Im’s Mandate Is A Big Mistake by Sallie James, Cato Institute Free
Trade Bulletin no. 48 (March 14, 2012)
Trade Policy Priority One: Averting a U.S.-China “Trade War” by Daniel J. Ikenson,
Cato Institute Free Trade Bulletin no. 47 (March 5, 2012)
Trading with the Bear: Why Russia’s Entry into the WTO Is in America’s Interest
by Daniel Griswold and Douglas Petersen, Cato Institute Free Trade Bulletin no. 46
(December 6, 2011)
Time to X Out the Ex-Im Bank by Sallie James, Cato Institute Trade Policy Analysis
no. 47 (July 6, 2011)
As Promised, Free Trade Agreements Deliver More Trade: Manufacturing Exports
Receive an Extra Boost by Daniel Griswold, Cato Institute Free Trade Bulletin no. 45
(June 7, 2011)
Economic Self-Flagellation: How U.S. Antidumping Policy Subverts the National
Export Initiative by Daniel J. Ikenson, Cato Institute Trade Policy Analysis no. 46 (May
31, 2011)
RECENT STUDIES IN THE
CATO INSTITUTE POLICY ANALYSIS SERIES
734.
Arms and Influence in Syria: The Pitfalls of Greater U.S. Involvement by
Erica D. Borghard (August 7, 2013)
733.
The Rising Cost of Social Security Disability Insurance by Tad DeHaven
(August 6, 2013)
732.
Building a Wall around the Welfare State, Instead of the Country by Alex
Nowrasteh (July 25, 2013)
731.
High Frequency Trading: Do Regulators Need to Control this Tool of
Informationally Efficient Markets? by Holly A. Bell (July 22, 2013)
730. Liberalization or Litigation? Time to Rethink the International Investment
Regime by Simon Lester (July 8, 2013)
729. T
he Rise and Fall of the Gold Standard in the United States by George Selgin
(June 20, 2013)
728. Recent Arguments against the Gold Standard by Lawrence H. White (June 20,
2013)
727.
“Paint Is Cheaper Than Rails”: Why Congress Should Abolish New Starts
by Randal O’Toole (June 19, 2013)
726.
Improving Incentives for Federal Land Managers: The Case for Recreation
Fees by Randal O’Toole (June 18, 2013)
725. Asia’s Story of Growing Economic Freedom by Razeen Sally (June 5, 2013)
724.
Move to Defend: The Case against the Constitutional Amendments Seeking
to Overturn Citizens United by John Samples (April 23, 2013)


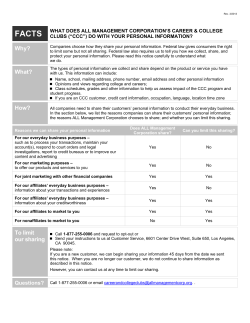


© Copyright 2026