
Achieving Clinical and Operational Excellence: How to Establish Healthcare
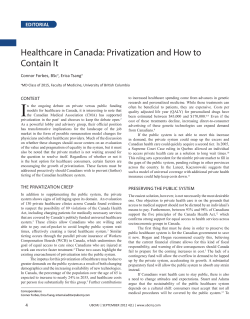
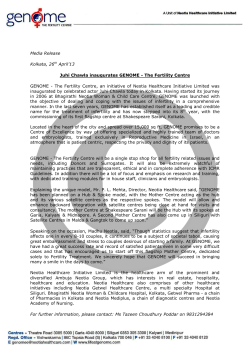
An Oracle White Paper
June 2011
Achieving Clinical and Operational
Excellence: How to Establish Healthcare
Service Line Costs
1
Introduction
Not knowing the clear direction that the healthcare reform initiatives will take over the next several
years, healthcare organizations remain under intense pressure to reduce costs and repair inefficiencies.
Most organizations understand that to successfully execute, they have to manage cost and key
performance measurements across business lines. Yet, few are able to attain this. Healthcare provider
organizations find themselves in the middle of market pressures from payers, the government and
competing for market share and doctors. The only way to sustain an organization in this financially
stimulating environment is to closely manage profitability, which cannot occur without understanding
true costs and profit sources. Healthcare organizations that fail to recognize and meet this imperative
will find it increasingly difficult to compete and may eventually have to close their doors.
This white paper will address how innovative healthcare organizations are adapting to different service
line costing methodologies and to implement a sustainable and supportive model for healthcare
costing. Balancing detail and accuracy is critical in deciding on a more efficient model for developing
service line costs than traditional costing methodologies. Healthcare organizations need the support of
timely and insightful patient-level analysis and the ability to access the right level of detail needed to
drive improved performance across their organization.
Oracle Enterprise Performance Management solutions bring the leading planning, budgeting,
costing and forecasting cycle and a suite of Healthcare specific analytics applications called Healthcare
Performance Platform dedicated to helping providers become world class care delivery organizations.
Oracle, partnered with Anthem Healthcare Intelligence brings the only solution that integrates
the planning, budgeting, forecasting, costing and BI under a single analytical platform. This integration
simplifies the scenario analysis and what-if planning Provider organizations require today in order to
understand the impact of changes in case mix, costs of delivering services, or the real cost of
reimbursement tariffs.
2
“Service Line dashboards provide a great means to share enterprise performance with the entire
executive management team. The dashboards are proven as a catalyst for change for healthcare
organizations.”
Roy Mathews, CEO, Anthem Healthcare Intelligence
Value of Service Line Costs
Some industry leading financial consulting firms have indicated that even though healthcare
organizations have streamlined their processes in recent years, many hospitals and provider groups
have yet to rigorously deploy methodologies like Six Sigma and Lean. Nor have they adopted tools like
process analysis and activity-based costing. With the demand for financial results increasing, it is time
for cost and performance measurement to move to the very top of management’s agenda.
To obtain a clearer picture of costs, you must be able to answer key questions:
•
•
•
•
•
What drives profitability—by case, service line, etc.?
Which activities and processes produce value and enhance quality?
How do contractual payer prices compare to costs?
How much capacity is being used?
Are equipment investments justified?
To stay competitive in today’s environment, healthcare organizations need to streamline inefficient
processes and understand the types and amount of resources they need to deliver care across the
enterprise. This can only be achieved through cost transparency.
Amazingly, most healthcare entities still use primitive standard costing tools that date back to an
assembly line model – tools long abandoned by the manufacturing industry that created them. The
result is rudimentary cost allocation that fails to match resources and related costs to their services.
This makes it impossible to arrive at informed decisions that will improve financial results.
The movement to a value driven healthcare model and the advances in medicine will enable healthcare
organizations to provide more effective and specialized care than ever before. But the cost of the
technology, human capital, medical devices, and drugs required for providing this care, and the
capability t for reporting on service line cost is critical. At the same time, reimbursement contracts are
more complex, harder to administer, and unable to keep pace with rising costs. Bridging this widening
gap between care delivery and administrative costs requires healthcare providers to truly understand
the cost of the care on a per-patient basis, so they can negotiate realistic payment terms and stop-loss
measures with their contracted payer groups. To effectively set a strategic and profitable course for the
future, internal planning and analysis groups must have insight into the volume and cost of care across
functional departments—such as radiology, lab services, and nursing—and across clinical service
lines—such as oncology, cardiac services, and neuroscience.
3
Different Cost Allocation Approaches in Healthcare
There are four main cost allocation approaches for healthcare providers. All four attempt to allocate
costs that are accumulated in the General Ledger system to services performed, often to the service
transaction level, but other times to a more summarized level. Allocation to the lowest level of details
provides the greatest amount of flexibility in reporting. Some of the cost allocation approaches overlap
each other, but they can be categorized into the following: RCC (Ratio of Cost to Charge), RVU
(Relative Value Units), Hybrid (80/20), and Micro Costing/Activity Based Costing (ABC).
RCC method is the most commonly used. This is because it is easy to implement, maintain, and
understand. Under RCC, charge amount or service line level is the measure by which costs are
disseminated. Typically, when cost models are initiated, all revenue-producing departments can be
quickly set up with RCC.
Hospitals using RCC methods should eventually strive to implement the RVU method. The RVU
method can be set up to simulate Standard Costing approach. The RVU and RCC methods are similar
in that both methods employ weights to determine proper allocation. What sets RVUs apart is that
measures other than charge amount can be utilized to determine resource consumption. The RVU
process is more complex than the RCC method, and requires more maintenance. However, it
produces more reliable and predictable cost estimates.
Due to the tedious process of performing RVU cost studies for every charge item, it is common
practice to apply the hybrid or 80/20 rule. This means RVUs are only developed for the charge items
that comprise 80% of the total patient revenue for a given department. The remaining 20% of the
charges use the RCC method.
Variations of RVUs or Standard Costing can also be used to satisfy the more sophisticated data inputs
of the Micro Costing/ABC approach. The theory of ABC costing is that a more accurate service line
cost is derived when cost drivers are established based on a cause/effect relationship between the
commencement of a cost and its true origin. In order to properly implement ABC costing, separate
measures must be established for each cost driver so that charge items that do not gain benefit from a
resource are not allocated any costs for that resource. Microcosting uses more complex and specific
objective measures such as time studies and actual prices. These approaches are the most challenging
and costly to implement and maintain, but in the long run, will result in more precise results.
Microcosting and ABC approaches are rarely found among U.S. based healthcare provider
organizations compared to other industries.
4
Advantages & Disadvantages of RVU Based Costing
The most common costing method used today in the healthcare industry overall is RCC. This is
primarily due to comfort level, based on experience, many financial managers have with reimbursement
and the use of the RCC method in Medicare cost reports. Additionally, the RCC method is relatively
easy to implement for a non-cost accountant. A simple calculated weight of cost to charge by
department in Excel or an Access database will suffice. This cost rate can then be easily applied to the
procedures and patients from Patient Accounting data that could also be stored in Excel or Access.
Although RCC has these advantages, it also has significant disadvantages. For one, the RCC method
assumes that reimbursement directly correlates to resource consumption. One major Charge Master
mark-up could render the RCC method obsolete. Additionally, the RCC method does not force cost
accountants and department managers to analyze their own data to identify cost drivers and measure
true resource consumption.
Conversely, the RVU method provides a more accurate measure of resource consumption. This is
because service line costs will be determined by clinical acuity levels, not reimbursement rates. A
benefit of the RVU method is that it can be as simple or complex as it needs to be. Sophisticated RVU
development can be performed to determine RVU values such as nurse minutes for a service, number
and type of films needed for radiology tests, and actual cost based on the NDC value of a
pharmaceutical supply.
The major hindrance of RVU costing is that it entails RVU development. This requires time, expertise,
and corroboration across departments. Full RVU costing could be considered a bottom-up approach
to costing, requiring organizational-wide adoption. Another disadvantage is that RVU values must be
maintained and updated at least once a year, whereas the RCC method is self-sustaining. Additionally,
RVU development typically requires a more robust system than offered by Excel or Access, therefore,
additional technological outlays may be required to accommodate for an RVU costing system. From an
ROI perspective, the benefits of RVU approach will outweigh its additional costs needed for most
healthcare providers. The process of developing RVU’s, however, involves significant commitment for
organizations of any size.
Allocation of Overhead Costs
Regardless of which of the above methods is used for allocating costs to the service transaction level,
the overhead costs need to be first allocated to the revenue producing areas. Overhead (primarily
administrative costs), is the fastest growing portion of a hospital’s total costs. This is partially due to
the growing complexity of the healthcare industry. More specialized professionals are required to
manage such functions as Quality, Accounting and Finance, Reimbursement, Decision
Support/Business Intelligence, HIM, Information Systems, and Medical Coding. Furthermore, with
the continuing dependence on electronic processes and records for care delivery, investments must be
made to keep up with technology.
There are two types of overhead costs in the healthcare setting, 1) Direct Overhead and 2) Indirect
Overhead. Direct overhead costs can be linked to a particular department, but not a procedure or
service. An example would be the salary of a Lab Director. This salary can be traced to the Lab
department, but not to specific Lab tests. As such, this salary could be spread over all procedures
based on RCC or RVU method. Indirect overhead costs are costs incurred by departments that are
shared across the system. An example would be all expenses in the Housekeeping department. The
resources consumed in Housekeeping (Director Salary, Man Hours, Materials) cannot be associated
5
with specific procedures or departments. Both revenue-producing departments and other indirect
departments utilize Housekeeping. Even Housekeeping uses Housekeeping services. A portion could
be considered direct to patient care, but generally Housekeeping expenses are considered entirely
indirect. It is common practice to allocate Housekeeping costs to departments based on square feet.
Not only do square feet have a reasonable correlation with resources consumed in Housekeeping, but
square feet by department is data readily available to cost analysts via previously completed Medicare
Cost reports. It is generally acceptable to update this allocation once a year to accommodate for
development of existing departments and the creation of new departments.
Overhead allocation involves determining which cost buckets will be allocated and what basis will be
used. ABC costing can produce sophisticated methodologies to achieve more precise allocations. An
emphasis in ABC produces a correlation between a service activity and overhead costs. ABC, however,
requires additional set up and maintenance. Common overhead allocation involves setting up an
allocation basis such as square feet or FTE count. These are relatively easy to gather in an organization
and automated feeds may also be available.
Indirect overhead cost allocation is not an overly complicated process, yet it consists of several steps
and, when done manually, the margin of error is great. First, expenses by indirect departments,
overhead (cost driver) statistics, and patient accounting data at the procedure level must be stored in a
reliable database. These costs must first be allocated to other indirect departments when applicable
and then to direct departments. The approaches to allocate overhead costs include single step,
sequential step down, and reciprocal methods. Single step approach is the simplest in which all indirect
costs are allocated to direct departments. Medicare cost reporting follows the sequential step down
approach and provides a pre-established framework for allocating overheads. As a result variations of
step down approach are commonly used in healthcare. Reciprocal method is the most advanced and
can be complex to implement and trace costs back to their sources.
Service Line Definitions
The term “Service Line” or more commonly known industry term “Product Line” is less precise in
healthcare than manufacturing or retail. For an automobile manufacturer, a product lines could be cars,
SUV’s and trucks. In healthcare, service lines are generally defined after the fact because many patients
come to the hospital with needs and expectations for multiple services. While hospitals are organized
along traditional departments such as Radiology, Surgery, Pharmacy, Lab, Nursing etc, most inpatients
will use services from several areas. Grouping departments as services is one way of defining service
lines, but that does not accurately reflect the patient’s typical use of the hospital. For example, the same
6
patient may use services from all of the above departments in one stay. The hospital will be paid based
on the patient’s total stay rather than for individual services purchased from each department. Most
payments cannot be broken down into the department level of details.
So, what is the most useful way of defining hospital service lines? It should be based on patient
encounter attributes. In a hospital data warehouse, where patient encounters are tracked, there are a
number of attributes of the patient available. Using these attributes, a rule based service line grouper
can group services into various categories. The first break down should be inpatient versus outpatient
services. There are many ways to break down inpatients into more detail service lines. Examples
include Major Disease Categories (MDC’s) and Diagnoses Related Groups (DRG’s) provided by the
CMS administration. ICD procedure codes and diagnosis codes can also be used for this definition.
Since there are hundreds or even thousands of these codes available, this process can become
complicated. As a practical matter, one may start with MDC’s and then further refine them based on
DRG’s and ICD codes. Outpatients can be defined in terms of HCPCS or ICD codes. An automated
service line grouper will make these tasks much easier. Solutions like Healthcare Performance
Platform come with a Service Line Grouper as below. The grouper not only allows grouping of
patients into service lines, but updating the group assignments each time the data is updated from the
source as part of the daily data warehouse update.
The above approach was based on disease or procedure driven service line definitions. There are
business reasons to look at service lines from a payer or physician standpoint. A flexible grouper will
enable defining alternative service line definitions based on multiple criteria. Once the service lines are
defined and costing is completed, many different service line performance reports can be easily created
as below:
By Inpatient Service:
7
By Physician:
Dashboard Graphs:
Detail Data Requirements
Service line reporting requires vast amounts of data and appropriate querying tools. With a strong data
warehouse foundation and good analytical reporting applications, the job becomes manageable and
maintainable. The data warehouse should contain all relevant information about each patient
encounter. The warehouse data model is ideally structured under a relational star/snowflake schema
for optimum performance and ease of use. OLAP can be used when the business requirements are well
defined. Building multiple OLAP applications based on specific business purposes is a good approach
with the relational warehouse providing all the data feeds.
Costing requires data from General Ledger and Patient Accounting sources. Patient Accounting data
may already be brought into a data warehouse which can then be interfaced to the costing application.
Once costing is done, that data is brought back to the warehouse for service line reporting. The
required data elements include encounter demographics, charge details, payment details, diagnoses,
procedure, and CPT details, physician information, insurance information and such. General Ledger
details need to include account and department level details and statistical information such as square
feet, number of employees etc. If you have a full suite of BI applications the applications colored in
blue should contain all the data elements required:
8
Ongoing Maintenance
Once the initial cost model setup for a facility is complete, it must be maintained in order to remain
relevant. A good cost model application will provide easy to use forms that will make the update
process quick and straightforward. It will generate summary comparison reports at each cost model
step to assist in the trouble-shooting and reconciliation of data.
Every time a new General Ledger account accumulates dollars in the source accounting system, it must
be added and classified in the cost model. A well-designed cost model should add any new accounts
through an automated process. However, someone familiar with the Chart of Accounts and the Cost
Model must classify each new account into buckets and RVU designations. Potential classifications are
Inpatient Revenue, Outpatient Revenue, Other Revenue, Deductions, Salaries and Wages, Medical
Supplies, etc.
Any reassignment of accounts and departments must be made. This is often performed to better
establish a matching of revenues and expense by combining or rearranging departments. It can also be
used to properly share resources such as a Director of Radiology across Diagnostic Radiology, Nuclear
Medicine, Ultrasound, etc.
9
The above are a handful of examples. Other required maintenance includes department list and its
attributes, RVU’s, mark-up factors, allocation bases, and GL to Patient Accounting department
mappings. Web based, user friendly forms will allow online gathering of maintenance information
much easier and the overall process much quicker.
A cost model cannot be properly maintained without the support of accounting, operations, and a
Decision Support department. A well laid out Decision Support System and Cost Model Application
will significantly increase the ability to analyze costs and margins for services. However, since
operations constantly change and grow, human intervention and expertise will always be an essential
part of a well-implemented cost model.
Best Practices
No doubt, costing is a complex activity in a healthcare provider organization of any size. Due to the
inherent complexity of the system and the associated business processes many organizations fail to
efficiently deploy cost allocation in a reasonable timeframe. Even after successful deployment, upkeep
of the system becomes a maintenance nightmare. Here are some of the best practices we have found
that will enable quicker deployment and easier maintenance to generate better cost information across
the patient service areas:
Hybrid Approach in Building RVU’s:
Hospitals use thousands of charge codes to charge their patients. Building RVU’s for all charge codes
is very time consuming. We have found that an 80/20 in developing RVU’s will achieve substantially
all benefits of an RVU based costing. The idea is RVU’s will be built for 20% of the charge codes that
make up 80% of the volumes. The rest of the charge codes will be allocated based on RCC’s. The
percentages could vary but the concept is valid when dealing with departments that have lots of charge
codes.
10
Automated RVU Updates and Other Data Interfaces
Whenever possible, update RVU’s using an automated feed. Whether it is standard CPT based weights,
wholesale prices, or a supplies systems interface, an automated interface will make the maintenance
much more efficient. Other interfaces such as the one with the GL or data warehouses can also be
automated.
Better Validation Reports
Cost accountants spend a lot of time validating information. There are certain traceability reports that
will make their job much easier. These reports are designed to pick up the mismatches easily and help
to resolve issues quickly. There can be validation reports established for each step/process of the
allocation.
Distribute Maintenance Responsibility to Department Managers
With web based forms and appropriate training, department managers can share the responsibility for
RVU maintenance to improve the precision of the cost allocation system. This will free up the cost
accountants to spend more of their time on analysis.
Matching Charge Master to Item Master
Most healthcare provider organizations do not have a Charge Description Master (CDM) that matches
with their item master. This creates enormous complexities in updating RVU’s. Any effort, even small,
towards standardizing the CDM around item master will go a long way towards improving the cost
model.
Share Service Line Reports with the Leaders
Dashboards provide a good means to share service line performance with the entire executive
management team. That should prompt further discussion and visibility for the service line and costing
efforts. Many critical decisions such as adding or dropping a service line, recruiting physicians,
refocusing marketing activities etc. can be based on such information. Support and sponsorship for the
costing process is usually better established when information is available to all leaders of the
organization. Service Line Dashboards are proven as a catalyst for change for healthcare organizations.
“Oracle offers a complete Enterprise Performance Management Solution providing reliable costing information when and where it is
needed to support the ever changing healthcare market in achieving operational excellence"
William Bercik, Director of Healthcare – North America, Oracle Corporation
11
Conclusion
Creating cost simplicity is very difficult, but healthcare organizations that move from a basic to a
sophisticated approach to cost analysis will benefit greatly. They will be more prepared for the
phase of healthcare reform, making better decisions that will lead to superior financial results.
They will be less likely to experience negative financial surprises than other organizations.
Additionally, the benefits of the Oracle and Anthem partnership with a proven healthcare
customer base experiencing improved performance results from integration, common and
powerful reporting across all modules, modern and open-standards based architecture and finally
the hardware and software engineered together to create all of the requirements that healthcare
organizations need to achieve clinical and operational excellence.
12
About Anthem
Anthem Healthcare Intelligence provides business intelligence applications created exclusively for
healthcare provider industry. Experts in data warehousing and management reporting, Anthem enables
healthcare executives to know critical information and insights to improve their organization’s
performance. Anthem products are created by personnel who have decades of healthcare operations
and analytics background. Anthem is headquartered near Nashville, Tennessee.
501 Corporate Center Drive, Suite 520
Franklin, TN 37067 (615)
628-3250
http://www.anthemhi.com
13
14
White Paper
Achieving Clinical and Operational Excellence:
How to Establish Healthcare Service Line Costs
June 2011
Author:
Copyright © 2010, Oracle and/or its affiliates. All rights reserved.
William Bercik, Director of Healthcare, Oracle
This document is provided for information purposes only and the contents hereof are subject to change without notice. This document
Contributing Authors:
is not warranted to be error-free, nor subject to any other warranties or conditions, whether expressed orally or implied in law,
Roy Matthews, CEO, Anthem Healthcare
including implied warranties and conditions of merchantability or fitness for a particular purpose. We specifically disclaim any liability
Intelligence
with respect to this document and no contractual obligations are formed either directly or indirectly by this document. This document
Christie Scanlon, Director of Business
Intelligence, Anthem Healthcare
may not be reproduced or transmitted in any form or by any means, electronic or mechanical, for any purpose, without our prior
written permission.
Intelligence
Oracle Corporation
Oracle and Java are registered trademarks of Oracle and/or its affiliates. Other names may be trademarks of their respective
World Headquarters
owners.
500 Oracle Parkway
Redwood Shores, CA 94065
AMD, Opteron, the AMD logo, and the AMD Opteron logo are trademarks or registered trademarks of Advanced Micro Devices. Intel
U.S.A.
and Intel Xeon are trademarks or registered trademarks of Intel Corporation. All SPARC trademarks are used under license and are
Worldwide Inquiries:
Ltd. 0110
trademarks or registered trademarks of SPARC International, Inc. UNIX is a registered trademark licensed through X/Open Company,
Phone: +1.650.506.7000
Fax: +1.650.506.7200


© Copyright 2026