
ACTA UNIVERSITATIS AGRICULTURAE ET SILVICULTURAE MENDELIANAE BRUNENSIS Volume LXI 331 Number 7, 2013
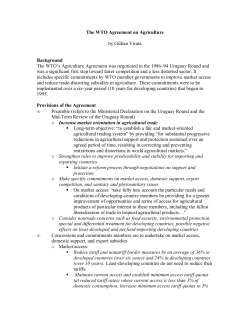
ACTA UNIVERSITATIS AGRICULTURAE ET SILVICULTURAE MENDELIANAE BRUNENSIS
Volume LXI
331
Number 7, 2013
http://dx.doi.org/10.11118/actaun201361072951
THE ISSUES HOW TO EXPRESS THE
CONCENTRATION PROCESSES IN
EUROPEAN AGRICULTURE
Ivo Zdráhal, Věra Bečvářová
Received: August 30, 2013
Abstract
ZDRÁHAL IVO, BEČVÁŘOVÁ VĚRA: The issues how to express the concentration processes in European
agriculture. Acta Universitatis Agriculturae et Silviculturae Mendelianae Brunensis, 2013, LXI, No. 7,
pp. 2951–2964
The paper deals with one of the current problems of the agrarian economics and policy, and this
approaches to the definition, measurement and interpretation of farm size, as one of the key indicators
of evaluation the processes shaping the entrepreneurial structure in the current agribusiness. The
results of research into causation factors and processes shaping the business structure of modern
agriculture are presented there. It evaluates approaches to express the magnitude of company and its
explanatory power in the context of the selected evaluation criteria of the processes and phenomena.
It deals with the potential risks of a narrow criterion-oriented agricultural policy in terms of strategy
and fulfillment of role allocation and distribution in order to support of enterprises in today’s business
environment. The basic trends in the farm size structure in the member countries of the European
Union are evaluated including their impact of the significance of individual size segments and their
share of the output sector. In this context it evaluates and compares the results of the analysis of
developments in business structures in the old and new EU Member States.
agricultural holding, agricultural policy, concentration process, farm size indicators, farm size
structure
In October 2011, the European Commission
presented a package of legislative proposals
outlining the Common Agricultural Policy (CAP)
framework aer 2013. Already this first version
along with subsequent general discussion on the
follow-up amendments triggered a series of oen
conflicting and contradictory views concerning not
only the priorities, pathways and criteria related
to the proposed strategies, but the very vision of
the European model of agriculture for the 21st
century. It has become clear that, even in this
relatively “protected” environment, the processes of
globalization are uncompromisingly pursuing their
way, with all their positives and negatives.
Moreover, in view of the diverse geographic
productionand
particularly
performancecharacteristics of agriculture in the current EU 27
resp. 28 member states, the overall development
does not seem to confirm that the proclaimed
common agricultural market constituted a unified
environment for all participants and led to
a convergence in the structure and in effect of the
results. It is clear that a sound knowledge of the
dynamics of the agribusiness general environment
and its interaction with the environment and
conditions defined at a given stage by the applicable
framework of the Common agricultural policy plays
an increasingly important role (and not only in the
aforementioned common market). In this economic
and political interaction, specific conceptual and
“implementing” materials related to the agenda
on specific policies of individual countries have
been draed, usually including involvement of the
Member States in the accepted idea of development
through direct commitment and budgetary
measures.
2951
2952
Ivo Zdráhal, Věra Bečvářová
It goes without saying that reactions to the general
framework and defined and adopted rules of the
common policy shall be, at this level, different
and that at this stage the clarity, elaboration and
complexity of the agricultural strategy itself and of
perception of the role of agriculture in society play
indeed a significant role. In addition to a number
of indisputable and objective particularities of
agriculture, it is indeed the perception and expert
evaluation of causal changes in the whole chain –
i.e. in agribusiness – that transform the centuries
old conservative production structure of the
sector and the corresponding business structure,
in dynamically shaping system with both positive
and negative symptoms in the general processes
of regionalization and particularly of rural
development.
The problem mentioned above concerns almost
14 million agricultural enterprises in the 27 Member
States faced with declining share of the European
agriculture in the world markets and growing
disparity of size and performance of agriculture
between the old and new EU member states. This
diversity is reflected in the evolution of views on the
content and strategy of reform measures aer 2013,
including finding adequate criteria and incentive
mechanisms in the system of the CAP financing
itself.
One of the issues that is becoming a “grateful”
topic of conversation at both domestic and European
level is the size of the agricultural enterprise itself.
The question of defining the optimal size of an
agricultural enterprise in the current business
environment, as well as efforts of defining the
optimal size of an enterprise in agricultural primary
production in terms of levels and forms of support
to target groups under agricultural policy, is in the
EU member states currently considered a quite
relevant topic.
MATERIALS AND METHODS
The challenges associated with the need
for systematic solution for increasing the
competitiveness of European agriculture on global
stage are gaining prominence within the CAP for
the 21st century strategy and choice of priorities
and it is clear that this is a dynamic problem. It
actually affects the approach to and development
of the company size criteria in the implementation
of agricultural policy instruments and their impact
over time.
The aim of the paper is to deepen the knowledge on
the impact of changes in the business environment
of European agriculture in a broader socioeconomic context of shaping agribusiness markets
on the formation of the size structure of agricultural
holdings. On this basis, verify whether and to
what extent they reflect concentration processes
in general and what specificity are typical for the
business development of agricultural structures
in the old and new member states of the European
Union. For the actual analysis and comparison
of characteristics of the size structure of farms be
used two basic approaches namely (1) development
of size structure in terms of farmed land and (2)
development of size structure in terms of economic
size of the holding. At the same time verify the
explanatory power of these indicators and to draw
attention to limitations and conditionality of their
use for systematic evaluation and conclusions in
the context of agrarian policy measures.The current
state and compare the average size of agricultural
enterprises in member states, the Czech Republic
has indeed the highest average size and its size
structure is cited as very atypical. This frequently
mentioned figure is based on the following
comparison (Fig. 1).
In each particular case, it is the question of
legitimacy and objectivity of the company size
criterion in the allocation and distribution processes
related to specific implementation of agricultural
1: The average size of an agricultural holding in the European Union in ha
Source: DG AGRI, Eurostat
The issues how to express the concentration processes in European agriculture
policy in a given European region at particular
development stage.
In this process, the objective assessment of relationship
between farm size and its success is clearly important and
relevant.
This review shows clearly that in terms of the
average size of an agricultural enterprise, there are
truly significant differences, not only among the old
member states, but also among the new ones.
The analysis and comparison of the size structure
of farms, due to the availability and comparability
of data, mainly based on statistical database
EUROSTAT. Even this, however, does not offer an
“ideal” data set, which reduces the breadth and depth
of possible analyzes. Of the 27 Member States are
available in time series data from 1990 to 2010 only
three of them. Especially in the new Member States,
it significantly reduces the possibility of assessment
of the dynamics of size structure of farms. Data for
in addition the year 2010, from structural surveivs,
presents nowday the informationa about numbers
and areas of agriculture holding. So they are used in
the comparisons, for analyzing of long term trens,
the data until 2007 are used.
The second problem was the definition of segment
size in this database.
This category offers free land to 2 ha, 2–5 ha, 5–10
ha, 10–20 ha, 20–30 ha, 30–50 ha, 50–100 ha and 100
ha or more. Especially definition of the maximum
category just over 100 hectares, again significantly
reduces the possibility of capture the position and
the tendency for large farms. This limitation did
not allow further specify precisely the structure
of the current crucial players in the common
agricultural market and their role in individual
member countries. Yet research offers a number of
findings that, compared to commonly used averages
for individual Member States, significantly more
accurately characterize the structural development
of enterprises in this sector within the European
region.
RESULTS AND DISCUSSION
Several theoretical and methodological notes
to begin
The basis for describing the structure of the
industry is number and size distribution of units
(farms). In practice, the most widely used indicator
relating to the characteristics of size is the average
size of the enterprise.
A useful concept to express the size and even
the definition of specific population of agricultural
holdings is its assessment on the basis of its production
capacity or production capacity as controlled by
1
2953
the farmer (Ntsebeza and Hall, 2007). However,
this “refined” definition captures a number of
institutional and technical characteristics and is still
too general in nature to be used e.g. in international
comparison (von Braun, 2005) and therefore
it is more common further operationalize this
concept with regard to the statistically available
and adequately monitored (and thus valid enough)
indicators. It is used in so many ways of expressing
the size of the agricultural holding, and we can
divided them, in principle (whether measured in
physical or monetary units), into indicators of the
size of the input or output type (Ahern, Korb and Jet
Yee, 2009).
The most commonly used concept is the farmed
land acreage. The advantage of this indicator is that
the size of the farmed land does not change too oen
and it is relatively easy to quantify, it gives us clear
information on all the farms and in the literature
it is also largely used for political, economic and
statistical analysis. On the contrary, significant
differences in quality of soil for agricultural
purposes and sometimes ambiguous relationship
to productivity reduce the relevancy of this size
expressing indicator. Different demands on soil in
different production systems also play their role.
The concept of expressing the size of the enterprise area based
on farmed land acreage thus gives some information on the
structural changes; its information capability then grows
especially if this trend is observed in the group of similar
farms.
The size of farmed land, along with the amount
of work involved may not yet provide sufficient
benchmark and other information may provide
indicators related to share in total agricultural
production. This can be partly inferred from the
number of livestock, their products or physical
quantity of crop commodities.
Another benchmark of the size of the farm expressed as
market produce i.e. evaluation in relation to market share
implies a market valuation of output. In this case, the
data can not be considered sufficiently objective
(representative) as not all primary producers
produce their entire agricultural production for the
market. Many of them produce only for their own
consumption or market only part of the production.
Unlike statistical records of the size structure
of farms in the U.S., in the EU there is no available
information on the revenue for agricultural
production (mainly in small farms) and the indicator
of economic size of farms is used instead.
Farm size in terms of the European Union
is measured by the ESU1, European size unit. The
advantage of using ESU lies in possibility of
comparison
between
differently
oriented
European Size Unit (ESU 1 = 1200 EUR) is derived as the potential gross value added of the agricultural holding
calculated as the sum of SGM (standard gross margins) of each agricultural activity carried out in the farm. SGM is
calculated as the difference between average production and average cost of each agricultural activity per hectare
(head) of each type of crop (livestock) production at the regional level.
2954
Ivo Zdráhal, Věra Bečvářová
agricultural holdings and thus assessment of farm’s
ability to remain in the market. The main limitation
of this criterion is the use of standardized values
because in given region, the SGM per hectare of
a crop has the same value for all farms that produce
it. No specificities of the holding’s production
affecting the final output are taken into account.
Size expressed by indicator of labor input based
on the assumption that in small enterprise the total
labor input can be lower than in large farms (DG 6,
2011).
The simplest form of indicator is the number of workers.
Seasonal nature of agricultural activities which
are oen carried out as not full time lead to a more
accurate expression of work inputs by recalculating
them to one-year employment of a worker (in the
EUROSTAT database – AWU). Even the information
capability of this indicator is limited by agroecological and socio-economic factors that define
the required amount of work, and requirements
of necessary amount of labor of some specialized
types of farming are negatively correlated with the
physical size of the farm (horticulture production,
extensive cattle breeding).
Ahern, Korb and Jet Yee (Ahern, Korb and Jet Yee,
2009) state that further possible indicators of the
farm size is the valuation of land and buildings on
the farm or the size of the resulting rent. To better
reflect the nature of the functioning and dynamics
of individual size groups of farms it is necessary to
use other characteristics, whether related to farm
management within the family, the use of hired
labor, the contribution from non-agricultural
activities to farm income, technological level, access
to inputs, attitudes to risk, age structure of the
workforce, conservative vs. innovative behavior,
level of education and degree of specialization.
The above indicators of the enterprise size are
usually chosen and combined in relation to specific
issues the author addresses, however, always topical
question is to what extent any of these ways of
expressing the size are relevant for the assessment
of the role, performance and prospects of each size
group.
Once the method (or methods) of expressing the
enterprise size for a certain population of farms in
a particular country (region) is chosen, another and
significant problem associated with this definition
arises, i.e. what is still a small farm and what can
be considered a large farm. This is associated with
the choice of criteria (absolute or relative) for this
expression (Hubbard, 2009; DG AGRI, 2011).
If absolute criteria are selected, then it is necessary to
establish specific threshold (hectares area, number of
employees, volume of production or SGM) based
on which the farms are then divided into large and
small. This criterion is well understood, clearly
applicable, however, it is necessary to take into
account the heterogeneity of farms which oen
differ in size structure not only between countries
but also within countries. The choice of the level
of given criteria and the possibility of response
to environmental changes is difficult as even the
selected threshold may not be appropriate in all
situations (in terms of space and time) that may
occur.
The problem deepens when trying to apply a single criterion
in both economic comparison and, in particular, the choice of
policy measures in distinctly structurally inhomogeneous
environment such as the current agrarian sector in the
world and even in the EU. It is the determination of
the threshold that is the subject of discussions
related to the preferences of different views on the
business structure and strategic plans of support
to agriculture in various regions of the agricultural
policies.
Particularly sensitive is this problem in the EU
where the size of enterprises is one of the criteria
for the application of critical instruments of the
Common agricultural policy. Search for objectivity is
very complicated and in the changing environment
insufficiently substantiated. Hubbard (Hubbard,
2009) for example defines a small European farm as
less than 10 hectares, the economic size of less than
8 ESU and less than 2 AWU.
Another option is to choose a threshold with
regard to the relative distribution of the variable at
the regional level. Due to the strong differentiation, this
ratio has greater information capability as it relates to
the distribution of size of the agricultural holdings
as such and thus, more accurately, characterizes
the business structure of the territory (region). An
effective solution for this purpose is the descriptive
statistics using one of the characteristics of kurtosis,
namely representation using Lorenz curve.
The problem in trying to capture the size of
agricultural holdings and their size distribution
is the very statistical definition of what it is an
agricultural holding.
Characteristics and evolution of size structure
of agricultural holdings in the EU
To characterize the size structure of agricultural
holdings in this part of the work there are used two
basic approaches allowing to analyze the structure
and its evolution over time in international
comparison, namely:
• Development of size structure in terms of farmed
land
• Development of size structure in terms of
economic size of the holding.
First approach gives us an overview of the number
and size of enterprises as individual business
entities and in this context, allows us to monitor
development trends but without the possibility of
capturing economic context, structure and effect of
economic activities as well as basic interactions with
the environment.
Second approach is, to the contrary, inherently
based on the economic characteristics of producers
and allows take better account of the company’s
ability to remain in the market, including the
possibility of comparison between various
The issues how to express the concentration processes in European agriculture
a)
2955
b)
2a: Changes in number of agricultural holdings in the EU-15 between 1966 and 2000
2b: Changes in the area of agricultural land farmed by holdings in the EU-15 between 1966 and 2010
Source: EUROSTAT and DG AGRI, compiled by the author
manufacture-oriented agricultural holdings. By
using standardized values in the construction of
this type of indicator the ability to identify specific
business prosperity is, however, weakened.
Development of the size structure in terms of
farmed land
Agricultural sectors in the original Member States
are going over long-term restructuring, which is
reflected in the development of the size structure of
agricultural holdings.
Acreage of agricultural land has changed in the
reference period of almost forty years minimally, or
has been slightly decreasing (Fig. 2).
The number of agricultural holdings is, however,
gradually diminishing, which can be considered
the result of ongoing restructuring of the sector
in a broader context, but, above all, the result of
the application of technological innovations and
the results of scientific and technical progress in
agricultural enterprises in general.
If we want to further characterize the overall
development of the business structure of individual
Member States and seek the connection with the
influence of the state intervention instruments,
in this case of the Common Agricultural Policy,
including reforms in its strategy and instruments, an
interesting answer is given.
From comparison of the average annual changes
in the number of holdings in individual countries
it is clear that, in the overall development, the truly
innovative processes and general development
of technologies are more significant than state
intervention.
Although we may to some extent deduce that in
the CAP “golden age” (until 1992) the declines were
generally lower, aer the reforms of the early 1990’s,
the decline in the number of enterprises has been
broadly accelerating.
However, as documented by specific data from
individual countries, this “theoretical” conclusion
cannot be reliably interpret in all Member States.
Here too the significant heterogeneity in the
default business structure, historical development
and the formation of general bonds within the
agricultural sector and consequently in agribusiness
is confirmed, and so is, obviously, the influence
of diverse agro-ecological conditions and the very
structure of agricultural production.
With different pace and partially with a different
mechanism this has logically been reflected in longterm decline in the number of agricultural holdings.
As the acreage of agricultural land was maintained,
it led to the increasing average size of agricultural
holdings with different characteristics in each
country.
In 2010 the average size of the agricultural
holding in the EU-15 was 22.6 ha. Countries with
the highest average size among the original Member
States are the United Kingdom with 84.0 hectares
and Denmark with 62.9 hectares. The smallest
average size of agricultural holdings can be found
in countries around the Mediterranean sea, such as
Greece (4.8 ha). In the reference period, there was an
2956
Ivo Zdráhal, Věra Bečvářová
increase in the average size of agricultural holdings
in all EU-15 This tendency is quite significant in
Germany, Denmark, France and other countries.
The average size of agricultural holding in the
EU-15 increased between 1995 and 2010 by 5.17 ha
(+ 30 %). Comparison of development in individual
countries shows the highest absolute increase in the
average size of agricultural holdings in Germany
(+ 27.7 ha), Denmark (+ 25.8 ha) and France (+ 18.8
ha) = significant EU agricultural producers and
also countries with higher average farm size in
comparison to other EU-15 Member States.
The above analysis of the average size of
enterprises in different countries points to the
basic size trends. These land acreage ratings,
however, can not be certainly considered typical
since, as indicated by the following partial analysis
of individual countries, there are significant
differences in the structures of sizes of agricultural
holdings both between and within the countries.
The countries of Southern Europe typically
feature dominance of small agricultural holdings
up to 5 ha, in Greece the share of these enterprises
is 75.5% of all farms, in Italy 73.2%, in Portugal 72.2%
and in Spain 51,5%. Furthermore, the share of farms
over 50 ha in Greece (0.1%), Italy (0.8%) and Portugal
(2.0%) makes only a fraction of the total number
of the agricultural holdings. In the other EU-15
Member States, agricultural holdings of larger size
categories (over 50 ha here) are already represented
more substantially. This size segment at the major
agricultural producers, Denmark (34.2%), France
(37.4%), the UK (24.7%) and Germany (24.7%) as well
as Sweden (23.0%) makes about one-quarter of the
agricultural holdings.
Even more conclusive view of the significance of
individual size segments of agricultural holdings
in the agricultural sectors of the original Member
States brings comparison of business structure of
manufacturers in terms of farmed land of a Member
State (Fig. 3). It is evident that agricultural holdings
over 100 ha are predominant in terms of agricultural
land in England, Denmark, Spain, Portugal, France,
Germany and Sweden. The Netherlands, which
can certainly be considered an example of one of
the most successful agricultural producers even in
the global markets, in terms of the size structure of
manufacturers rather falls among states where the
majority of land farm smaller farms (on the right
side of the Fig. 3). It is a question to what extent
(isolated) information on the form of the size
structure of enterprises in the country may be used
for evaluating the success and competitiveness of
the agricultural sector.
The decline in the number of farms in the EU15 is typical especially for the smallest category of
agricultural holdings despite the fact that the strong
support for the sector could have created conditions
for survival of the less competitive producers in the
sector. On the contrary, the number of enterprises of
the larger size categories is growing and the area of
agricultural land, which they cultivate, is increasing
(Fig. 4).
Overview in Tab. I is focused on assessment of
concentration tendencies in the individual EU15 For this purpose the share of agricultural land
farmed by farm size categories from 50 to 100 ha and
over 100 ha of the total agricultural land is defined.
It is thus possible to assess the current trends in
the concentration of farming enterprises. In the
reference period 1993–2007 (due to incompleteness
of data, for Austria, Finland, Sweden and France
a shorter period was chosen, see note the Tab. I), in
all countries, the share of enterprises of size greater
than 100 ha in total agricultural land was increasing,
except Austria, where the share remains the same.
For the vast majority of countries, there is also
an increase in share of agricultural holdings in the
category from 50 to 100 hectares. This tendency is
especially strong in Denmark where the share of
companies over 100 ha grew by 34.9 percentage
points and enterprises in this size category in 2007
cultivated already 61.1% of agricultural land.
3: The business structure of the EU-15 in terms of farmed land of the member state (2007)
Source: EUROSTAT, DG AGRI compiled by the author
Note: Size category in ha
2957
The issues how to express the concentration processes in European agriculture
4: Development of the business structure of the EU-15 in terms of number of
agricultural holdings and farmed land of the Member State in individual size categories
(1993–2007)
Source: EUROSTAT, DG AGRI, compiled by the author, note: Size category
in ha, France is not included; data for Austria, Finland, Sweden of 1995
I: Proportion of large agricultural holdings in agricultural land in the EU-15 (in hectares)
country
share of agricultural holdings from
change
change
share of agricultural holdings over
50 to 100 hectares in agricultural (percentage
(percentage
100 hectares in agricultural land (%)
land (%)
points)
points)
1993
2007
07-93
1993
2007
07-93
Belgium
22.2
33.9
+11.7
9.2
21.1
+11.9
Denmark
30.1
19.1
–11.0
26.2
61.1
+34.9
Germany
19.5
22.1
+2.6
38.0
52.3
+14.3
Ireland
24.0
29.4
+5.4
13.6
16.5
+2.9
France
30.4
28.0
–2.4
48.8
54.8
+6
Italy
12.4
14.4
+2
21.7
24.9
+3.2
Netherlands
19.0
31.9
+12.9
7.2
15.7
+8.5
UK
17.8
15.5
–2.3
65.2
70.0
+4.8
+1.8
Greece
4.8
9.4
+4.6
2.9
4.7
Spain
13.9
14.1
+0.2
50.7
56.1
+5.4
Portugal
7.3
8.8
+1.5
45.5
55.9
+10.4
Austria
9.8
16.7
+6.9
24.0
24.0
0
Finland
17.8
32.6
+14.8
5.1
20.1
+15
Sweden
29.3
22.9
–6.4
31.3
49.3
+18
Source: EUROSTAT, DG AGRI
Note: In the case of Austria, Finland and Sweden, data for 1995 and 2007 are used, for France: 2003 and 2007
Growth in the share of agricultural land in this
category is probably mainly due to the growth of
enterprises above 100 ha because the share of lower
size categories from 50 to 100 ha in this period
decreased by 11.7 percentage points.
Similar trend can be seen also in Sweden, and
to some extent, in France or the UK. In Belgium,
Germany, the Netherlands and Finland, the share of
both observed size categories grows, at a lower rate
they grow in Ireland, Italy and Greece. In Austria,
enterprises with more than 100 ha farm the same
portion of roughly a quarter of the agricultural
land, but here too raises the concentration – only
represented by size category from 50 to 100 hectares.
Another view of the size segment of agricultural
holdings with an area of over 100 hectares, describes
the progress of their average size, and thus at least
partially allows assessing the nature and evolution
of this group of enterprises, as data on very large
farms are not available.
The highest average size of farms over 100 ha is
achieved by enterprises in the UK, Germany and
Austria (around 250 ha). It is possible to explain it by
the historical development of the agrarian systems
of these countries, a large concentration of farms in
the 19th century UK was associated with the liberal
approach to the agrarian sector at that time exposed
to strong pressure from overseas exporters of
agricultural commodities. In Germany there could
be influenced by the Prussian path of development
(similar to the development of agriculture in the
Czech Republic) which was typical by the capitalist
2958
Ivo Zdráhal, Věra Bečvářová
way of doing business in agriculture with a strong
position of the large farms, and also by the size
structure of enterprises of former East Germany.
Somewhat surprisingly a high average size of 100
hectares achieve also the agricultural holdings in the
states of southern Europe – Portugal (350 ha), Spain
(300 ha) and Italy (250 ha), which are otherwise
typical of a large number of small agricultural
producers. Although there will be internal
variability in this size segment, other studied states,
the average size of firms reaches roughly 150 to 200
hectares.
Upon closer assessment of the context of growth
of agricultural holdings in the category of over
100 ha in total agricultural land we could see the
following trends and facts:
• in the case of Denmark, Sweden and Finland aer
2000 there is rapid increase in agricultural land
in this category, compared to increase in number
of enterprises. The share grows also thanks to
significant increase in existing businesses over
100 ha
• the Netherlands went through the same evolution,
since 2003, however, size of agricultural land in this
category has been stagnating. With the continuing
growth in the number of holdings over 100 ha the
average farm size of 100 ha is thus declining,
• in Belgium there is a dynamic proportional growth
in number of holdings and land. The increase in
the share of this category in agricultural land is
especially so influenced by the increasing number
of holdings in the category,
• in the case of Germany, the number of agricultural
holdings in the category over 100 ha grows faster
than land farmed by these holdings. In absolute
terms thus the area, and consequently the share of
total agricultural land, is increasing, however the
mean size of a holding in this category is declining,
• in Austria the area of agricultural land in this
category is slightly decreasing, but the number of
enterprises is growing and their average size and is
also decreasing.
• in Portugal, the number and area of land in the
same category remains unchanged. The increase in
share of this size category in the total agricultural
land is therefore caused by the dynamics of
development in other size groups.
Performed analysis thus pointed out the
differences between the concentration of holdings
farming in the old EU Member States and confirmed
the ongoing concentration trend in the size
structure of enterprises in general, however these
can manifest in different countries in different ways.
Development of size structure in terms of economic
size of the holding
For evaluation of the size structure of agricultural
holdings it is useful to apply the criterion of
economic size as well, which allows taking into
account also the link of the enterprise to market and
so, to some extent, it is related to the ability of the
agricultural holding to stand the test of the market.
Unlike the direct link to company size and farmed
land, this view shows the ability of the enterprise to
use the given factors of production effectively. The
following review clearly points to “cardinal” key
core countries of the common agricultural market,
led by the Netherlands, Denmark and Belgium and,
of course – crucial in terms of size and performance
– France and Germany. Fig. 5 compares the average
economic size and its changes in agricultural
holdings in the EU-15.
In 2007, average economic farm size in the EU15 was 23.8 ESU (European Size Units). Among the
surveyed countries, there are, however, significant
differences. In the Netherlands, which has to
some extent different conditions of agricultural
production and specific production structure,
achieves this indicator 111.2 ESU. On the contrary,
in the countries of southern Europe, whose agrarian
structures still feature numerous smaller businesses
5: Development of average economic size of agricultural holding in the EU-15
(1993 and 2007)
Source: EUROSTAT and DG AGRI, compiled by the author
Note: There are no data for France in 1993, data for Austria, Finland and
Sweden from 1995
The issues how to express the concentration processes in European agriculture
2959
6: The size structures of agricultural holdings in the EU-15 according to their economic size (2007)
Source: EUROSTAT, DG AGRI, compiled by the author
(paradoxically they are also typical for the
Netherlands, however the production parameters
of such enterprises are vastly different), the average
economic size of agricultural holdings is about 10
ESU (Portugal – 6.6 ESU). Spain is an exception here.
The main European producers are characterized by
high average economic size compared to the EU15 average, including most other Member States.
Intensive livestock production in the Netherlands
and Denmark is apparent here.
Common feature in the chanhe of average
economic size of agricultural holdings in terms
of changes in both absolute and relative terms in
1993–2007 was a growth of average economic size
of agricultural holding in all EU-15 member states
except the UK. A high increase in this indicator is
recorded in Spain. In this case, it may be the result of
an improving competitive position in the European
and world markets in livestock production.
Indicators of economic size of the agricultural
holding can be somewhat loosely interpreted also
as the significance of individual size segments in
terms of their contribution to the final output sector
(Fig. 6).
The similarity in size and structure even when
(and especially when) this criterion is used in the
Netherlands and Greece reaffirms the problem
of capturing the relationship between the size
structure of the country and the success and
competitiveness of its agriculture.
Development of the size structure of agricultural
holdings in the EU 12
Enlargement of the European Union to include
new countries took place in two waves, the first in
2004 included Estonia, Latvia, Lithuania, Hungary,
Poland, Slovenia, Slovakia, Cyprus, Malta and
the Czech Republic. In 2007 the Union has been
further enlarged to include Bulgaria and Romania.
Especially the accession of Central and Eastern
European countries meant for further strategy
of the Common Agricultural Policy considerable
challenge. As shown in Figs. 7a) and 7b) enlargement
of twelve states meant not only an increase in acreage
of the agricultural land, but first and foremost
a significant increase in the number of agricultural
producers, the number more than doubled.
The issue of accession of the countries of Central
and Eastern Europe was further complicated by the
diversity of their internal transformation processes
associated with, among others, the formation
of a new business structure in agriculture. The
transition from a centrally planned to a market
economy principles initiated in the late 1980’s
represented a complex and multidimensional
process. Creating conditions for the development
of functional markets with factors of production as
well as products and services was associated with
a number of other measures, directly or indirectly
related to the formation of essentially new structure
of agricultural holdings in different countries.
The aim of the ongoing reforms was the overall
transformation of the agricultural sector from
a centrally planned systems, applying principles of
collective production, to the market system, where
the manner, scope and other production parameters
are decided by manufacturers in response to market
signals. This meant strengthening the independence
and responsibility of the manufacturer in its
decision-making concerning the structure and
mode of production and its evaluation (individual
agriculture). The transition from collectivized
economy towards individual businesses and its legal
and economic support generally led to a reduction
in the size of existing farms, corresponding to
typical types of organizational structures and
size of agricultural holdings in market economies
(Lerman, 2000). In this context, an important role
was also played by a simplified interpretation of
the principles and context of changes in relatively
highly subsidized agricultural structures in the
older EU member states.
Even with regard to the fact that the agricultural
sectors of the studied countries of Central and
2960
Ivo Zdráhal, Věra Bečvářová
a)
b)
7a: Changes in the number of agricultural holdings in the EU after the accession of new countries
7b: Comparison of farmed agricultural land in the EU-12 and EU-15
Source: EUROSTAT, DG AGRI, compiled by the author
Eastern Europe had their own specificities, that
they entered the transition at different levels of
performance, and their structure and organization
of manufacturers have carried many of the
problems mentioned above, the question remains
to what extent the argument and following
directing of goals of transformation of the sector
towards disorganization and fragmentation of
the efficient producers were appropriate. It was
in this period when the lack of knowledge of the
principles and conditions of the functioning of
typical organizational structures related to the
effective functioning of the sector as well as with
the formation of typical size groups of agricultural
producers in Europe proved to be a handicap. It was
not only the current knowledge of their form, but
also the knowledge of how these structures function
in the context of the specificities of the regions,
in their ability to capture trends of changes in the
business environment and commodity verticals,
in, at that time still strongly supported, European
agriculture.
That decade of changes brought about
a significant individualization of production base
in all countries (mainly due to the restitution
of property rights to land, privatization of state
property and the reorganization of cooperatives
to private companies), especially in Slovenia,
Poland and Latvia. In other countries, the share of
these subjects was between 50% and 60% of state
agricultural land in 1997, with the exception of
the Czech Republic with 40% and Slovakia with
10%. In 1998, some of the former cooperatives and
state enterprises still remained part of the agrarian
structures, although farming a smaller share of
state agricultural land and with a lower average
size of farmed land. In addition to that a number
of profit-oriented private companies of corporate
nature were newly created or arose due to internal
reorganization. The average size of individual
entities increased. In this newly created segment,
there were two different groups of producers. On
the one hand, very small units of subsistence and
part-time nature, cultivating their own land from
the pre-reform period or obtained during the
reform, and, on the other hand, greater, full-time
market-oriented entities. The latter were primarily
responsible for the increase in the average size of
land farmed by individual manufacturers. It follows
that the characteristic structure of the business base
of the new member states, which is associated with
the period of accession of these countries to the EU,
is not able to capture a significant qualitative and
quantitative changes in this area, which (again in
differentiated manner) were carried out in various
countries in Central and Eastern Europe during late
1980’s and early 1990’s in the context of economic
reforms. It was Czechoslovakia and subsequently
the Czech Republic where a significant change in
the size and business structure in agriculture took
place. This fact is confirmed by the following data on
the size of agricultural holdings in the period aer
the accession of these countries to the EU.
In the current period, the business structure of
the new member states (EU-12) can be characterized
The issues how to express the concentration processes in European agriculture
2961
8: Number of enterprises by the size of agricultural land in hectares in the EU-12 (2007)
Source: EUROSTAT and DG AGRI, compiled by the author
Note: Size category in ha
9: The business structure of the EU-12 in terms of farmed land in a member state (2007)
Source: EUROSTAT and DG AGRI, compiled by the author
Note: Size category in ha
by the following proportions of representation of
the the size groups (Fig. 8).
A high share of smaller small enterprises in
the total number of enterprises that have arisen
as a result of the above mentioned processes is
clearly apparent. This chart also includes two
other countries Cyprus and Malta that joined the
EU in 2004. Their size structure of enterprises is,
as expected, similar to the southern countries of
Europe with a high share of smaller producers.
In terms of the share of each size group in the
agricultural land it is the structure – see Fig. 9.
Enterprises of 100 ha farm the vast majority of
agricultural land in Slovakia, the Czech Republic,
Bulgaria, Estonia and Hungary.
Average size of the size segment of agricultural
holdings with an area of over 100 hectares is
commonly higher than in EU 15 countries, 800 ha in
the Czech republic and Slovakia, 600 ha in Romania
and Bulgaria and around 350–400 ha in other
countries.
Their significant proportion, however, can be
identified in Poland and Romania, i.e. in countries
where the business structure of manufacturers is
generally referred to as the model with small family
producers. Interesting development in changes of
the size of agricultural holdings takes place in Latvia
and Lithuania where, following the fragmentation
of the manufacturers aer transformation – the
share of 10% of the largest agricultural holdings in
1997 was in Latvia 20% of agricultural land and in
Lithuania 30% of agricultural land (Lehrman, 2000)
– leads to re-concentration and the share of this
group in 2007 was around 60%.
The above mentioned structural characteristics
are reflected in the following shares of basic size
categories in agricultural output in the new member
states as follows – see Fig. 10.
2962
Ivo Zdráhal, Věra Bečvářová
10: Share of each size group of agricultural holdings in the EU-12 at the output of the industry
(economic size criterion) in 2007
Source: EUROSTAT, DG AGRI compiled by the author
Note: Size category in ha
Although the restructuring process in the newly
acceded countries are still ongoing, it is already clear
that even here large farms managed to maintain its
market position and represent size segment, which
is fundamental in terms of the final output.
More detailed analyzes of trends in the numbers
of agricultural holdings in the EU 15 and the new
accession countries with more detailed picture
of the importance of individual size segments of
farms and their dynamics and also giving the results
of these analyzes into the context of the overall
changes in the business environment of European
agriculture can be found in the publication of
authors (Zdráhal and Bečvářová, 2012).
CONCLUSIONS
The analysis and comparison of changes in the
size structure of agricultural holdings (in terms of
farmland or economic size indicators) in the old
and new Member States, confirm the general trend,
though it is not the unification of business structure.
The concentration process is typical of the development of
the business structure in agriculture in all EU member states,
leading to their harmonization.
The analyzes confirm that the concentration
of business structure of agriculture in the EU is
generally taking place as the agrarian sectors in
the old Member States go through the long-term
restructuring. The numbers of agricultural holdings,
in particular in the category of the smallest holdings,
are declining, but the number of businesses in
the higher size categories is increasing. The area
of agricultural land farmed by these enterprises
is also growing, as well as the importance of these
categories in terms of the final output. The lack of
availability and information capability of data in
the structure and existing evidence by EUROSTAT
is hampering more detailed evaluation of the
development in this seg-ment of large companies.
The above processes however have undeniably
different pace in different size segments of
agricultural holdings based on historical differences
in their structures and level of their initial state
in individual states and on the conditions of the
current environment, as the site-specific factors
influence the choice of size of the agricultural
holding and overall development of the size
structure of producers in the region.
It is therefore likely that the heterogeneity in size
and size structures of agricultural holdings in the
EU member states and even within those countries
will persist over time. The oen used arguments of
evaluation based on the average size of enterprise
are thus too simplistic. The question is whether
it is possible to determine the typical size of the
agricultural holding or typical size structure of
agricultural holdings in the EU, in particular when
taking into account the problem of the objective
existence of strong links between farm size and its
success.
Understanding the causal relationships of
shaping the size structures of agricultural
holdings and factors of their development as well
as understanding the aspects of their effective
functioning in the final outcome of the sector
and its contribution to economic development is
undoubtedly one of the preconditions of objective
assessment of current development. In this context,
wide range of issues related to the size and/or size
structure of enterprises effectively functioning in
modern agriculture arises.
Although it is clear that the basic concept of the
system of support for the European agriculture
based on two pillars of the CAP remains essentially
preserved, the possibilities of fulfilling, in the
given framework, the MS own vision for further
The issues how to express the concentration processes in European agriculture
development of agriculture using the knowledge
of specific conditions and envi-ronment are
enhanced. Decentralization, in this context,
undoubtedly increases the MS authority but also
their responsibility for the choice of appropriate
strategies as well as specific concept of promoting
active contribution of agriculture and agrarian
sector to the development of a specific area under
significantly tougher global competition. In this
situation, the risk of negative impact of asymmetric
information as well as bias in decision-making with
a preference for short-term and oen particular
interests increases, with much broader social effect
and consequences
Taking into account the knowledge and
generalization of development in organization
and efficiency of business relationships in today’s
business environment it should be beneficial also
2963
for objectification of criteria derived from the size of the
company and its performance.
Recognition of tendencies in the size structure of the current
production agriculture should therefore be indeed beneficial in
a situation when the overall strategy of the CAP undergoes
certain shi, when the level and targeting of tools
applied on the principle of redistribution changes to
some extent and when, on account of reduced funds
in the budgets, it is increasingly difficult to justify
certain decisions.
From this perspective it should contribute to
the identification and generalization of the crucial
causation of growth in heterogeneity and dynamics
of changes in business structure and thus to
evaluation of the effects of state interference. In
all these aspects it is associated with possibility,
availability and information capability of the data
on size of the agricultural holding and of business
structure in agriculture.
SUMMARY
The paper discusses the changes in the farm structure in the context of changes in the business
environment and the causal link and speeches concentration the processes in today’s agriculture.
It presents the findings and conclusions of the research and evaluates the results of analyzes in this
field. In the specified context it deals with issues of size, boundaries and its definition. Assesses the
economic and methodological methodological approaches to express the size, characterizes the
possibilities and limits of these approaches, the explanatory power and potential applicability in the
specific context of the agrarian economy and politics. In this context, analyzes and evaluates the basic
trends in the size structure of agricultural holdings in the EU countries. Based on the comparison of
the development of business structures in old and new EU member states then concludes that. The
concentration process is typical of the development of the business structure in agriculture in all EU
member states, leading to their harmonization.
The analyzes confirm that the concentration of business structure of agriculture in the EU is
generally taking place as the agrarian sectors in the old EU member states go through the long-term
restructuring. The numbers of agricultural holdings, in particular in the category of the smallest
holdings, are declining, but the number of businesses in the higher size categories is increasing. The
area of agricultural land farmed by these enterprises is also growing, as well as the importance of these
categories in terms of the final output. The above processes however have undeniably different pace in
different size segments of agricultural holdings based on historical differences in their structures and
level of their initial state in individual states and on the conditions of the current environment, as the
site-specific factors influence the choice of size of the agricultural holding and overall development
of the size structure of producers in the region.
It is therefore likely that the heterogeneity in size and size structures of agricultural holdings in the
EU member states and even within those countries will persist over time. The oen used arguments of
evaluation based on the average size of enterprise are thus too simplistic. Similarly effort to determine
the typical size of the agricultural holding or typical size structure of agricultural holdings in the EU,
in particular when taking into account the problem of the objective existence of strong links between
farm size and its success appears in the current conditions of agribusiness, is not a key precondition
or prerequisite for success and competitiveness of today’s agriculture.
Acknowledgement
The paper was developed within the Research Project of MENDELU in Brno, MSM 6215648904, as
a part of the solution to thematic direction No. 4 “The development tendency of agribusiness, forming
of segmented markets within commodity chains and food networks in the process of integration,
globalization and changes of agrarian policy”.
2964
Ivo Zdráhal, Věra Bečvářová
REFERENCES
AHEARN, M. C., KORB, P., YEE, J., 2009: Producer
Dynamics in Agriculture: Empirical Evidence, Producer
Dynamics: New Evidence from Micro Data,
Timothy Dunne, J. Bradford Jensen, and Mark
J. Roberts (eds.), Chicago: University of Chicago
Press and National Bureau of Economic Research,
chapter 10. 624 pp. ISBN10: 0-226-17256-2.
HUBBARD, C., 2009: Small Farms in the EU: How
Small is Small?, 111 EAAE-IAAE Seminar ‘Small
Farms: decline or persistence’University of Kent.
Canterbury, UK:. Available online: http://www.
kent.ac.uk/economics/documents/research/
ceas/2009/Contributed%20papers/093.pdf.
LERMAN, Z., 2000: Status of Land Reform and Farm
Restructuring in Central and Eastern Europe:
A Regional Overview. In: CSAKI, Csaba and Zvi
LERMAN. Structural change in the farming sectors in
Central and Eastern Europe: lessons for the EU accession:
second World Bank/FAO Workshop, June 27–29,
1999. Washington: The World Bank, 2000, 248 pp.
ISBN 0-8213-4733-0.
NTSEBEZA, L., HALL, R., 2007: The land question
in South Africa: The challenges of transformation and
redistribution, HSRC Press, 256 pp. ISBN 0-79692163-6.
VON BRAUN, J. 2005: Small-Scale Farmers in
liberalized trade environment in Huvio, T., Kola, J.
and Lundstrom, T. (eds.) Small-scale Farmenrs
in Liberalised Trade Environment, Proceedings
of the Seminar, Haikko, Finland, University
of Helsinki, Publication no. 38, Agricultural
Policy. Available online http://www.helsinki.fi/
taloustiede/Abs/Pub38.pdf.
ZDRÁHAL, I., BEČVÁŘOVÁ, V., 2012: Velikostní
struktura podniků v zemědělství – faktory, tendence,
souvislosti. 1. vyd. Brno: Mendelova univerzita
v Brně, 166 pp. ISBN 978-80-7375-690-1.
DGAGRI, 2010: Zemědělské statistiky a indikátory
[online]. 2010. [Cit. 2011-08-07]. http://ec.europa.
eu/agriculture/agrista/2010/table_en/index.htm.
DGAGRI, 2009: Zemědělské statistiky a indikátory
[online]. 2009. [Cit. 2011-08-07]. http://ec.europa.
eu/agriculture/agrista/2009/table_en/index.htm.
DGAGRI, 2008: Zemědělské statistiky a indikátory
[online]. 2008. [Cit. 2011-08-07]. http://ec.europa.
eu/agriculture/agrista/2008/table_en/index.htm.
DGAGRI, 2007: Zemědělské statistiky a indikátory
[online]. 2007. [Cit. 2011-08-07]. http://ec.europa.
eu/agriculture/agrista/2007/table_en/index.htm.
DGAGRI, 2006: Zemědělské statistiky a indikátory
[online]. 2006. [Cit. 2011-08-07]. http://ec.europa.
eu/agriculture/agrista/2006/table_en/index.htm.
DGAGRI, 2005: Zemědělské statistiky a indikátory
[online]. 2005. [Cit. 2011-08-07]. http://ec.europa.
eu/agriculture/agrista/2005/table_en/index.htm.
DGAGRI, 2004: Zemědělské statistiky a indikátory
[online]. 2004. [Cit. 2011-08-07]. http://ec.europa.
eu/agriculture/agrista/2004/table_en/index.htm.
DGAGRI, 2003: Zemědělské statistiky a indikátory
[online]. 2003. [Cit. 2011-08-07]. http://ec.europa.
eu/agriculture/agrista/2003/table_en/index.htm.
DGAGRI, 2002: Zemědělské statistiky a indikátory
[online]. 2002. [Cit. 2011-08-07]. http://ec.europa.
eu/agriculture/agrista/2002/table_en/index.htm.
DGAGRI, 2001: Zemědělské statistiky a indikátory
[online]. 2001. [Cit. 2011-08-07]. http://ec.europa.
eu/agriculture/agrista/2001/table_en/index.htm.
DGAGRI, 2000: Zemědělské statistiky a indikátory
[online]. 2000. [Cit. 2011-08-07]. http://ec.europa.
eu/agriculture/agrista/2000/table_en/index.htm.
DGAGRI, 2011: EU economics briefs: What is a small farm.
[online]. 2011. [Cit. 2011-11-10]. http://ec.europa.
eu/agriculture/agrista/economic-briefs/02_
en.pdf.
DG AGRI, 2011: Large farms in Europe, European
Commision 2011, dostupné z internetu: http://
epp.eurostat.ec.europa.eu/cache/ITY_OFFPUB/
KS-SF-11-018/EN/KS-SF-11-018-EN.PDF.
EUROSTAT, 2012: Počty a velikostní znaky zemědělských
podniků [online]. [Cit. 2011-07-06]. Dostupné na:
http://epp.eurostat.ec.europa.eu/portal/page/
portal/agriculture/data/database.
Address
Ing. Ivo Zdráhal, Ph.D., prof. Ing. Věra Bečvářová, CSc., Department of Regional and Business Economics,
Mendel University in Brno, Zemědělská 1, 613 00 Brno, Czech Republic, e-mail: [email protected]


© Copyright 2026