
Implementing a Remote Debugging Agent Using the GNU Debugger William Gatliff Introduction
Implementing a Remote Debugging
Agent Using the GNU Debugger
William Gatliff
Introduction
Despite its low cost and popularity as a workstation debugger, the GNU debugger, gdb, is an extremely
powerful and flexible tool for embedded systems development. This is partly because an increasing
number of embedded systems are based on the same powerful, 32-bit processors found in some desktop
workstations. However, it is also because the diverse, high-end workstation market demands flexible,
powerful tools, and such tools can also be used to make great embedded systems.
The following paragraphs describe how the GNU debugger works, and how you can implement a remote
debugging agent that allows gdb to debug application code running on your embedded system. The text
introduces the basics of gdb’s communications protocol, then provides example implementations for the
commands gdb needs to step code, read and write registers, and handle breakpoints.
What is Gdb?
The GNU Debugger, gdb is the GNU software debugger. It is an extremely versatile and powerful
application that can be used to debug sophisticated programs written in C, C++ and several other
programming languages. Gdb is most often used for debugging programs running on the same machine
as the debugger itself.
Gdb provides a "remote target" capability that, when properly accommodated in a device, allows source
level debugging across a serial port or network connection to any microprocessor GNU supports (more
than 30 to date), even if the target microprocessor is different than the one running the debugger.
The key to integrating this capability into an embedded system lies in knowing gdb’s Remote Serial
Protocol (RSP), and understanding how to implement a debugging agent: a small program running on the
target hardware that helps gdb carry out requests to monitor and control the application being debugged.
Gdb in Action
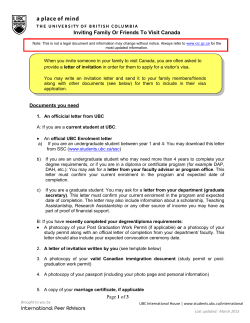
Figure 1 is a partial screen capture of a typical debugging session. It lists the commands used to initiate
communications with the debugging target, download a program, and debug it. Commands to step code,
set breakpoints and display data are also shown.
Figure 1. A typical debugging session (paraphrased).
localhost$ sh-hitachi-hms-gdb a.out
GNU gdb 5.0
1
Implementing a Remote Debugging Agent Using the GNU Debugger
Copyright 2000 Free Software Foundation, Inc.
(gdb) target remote /dev/ttyS0
(gdb) load
Loading section .text, size 0x1280 vma 0x1000
Loading section .data, size 0x760 vma 0x2280
Loading section .stack, size 0x10 vma 0x30000
Start address 0x1000
Transfer rate: 53120 bits in <1 sec.
(gdb) b main
Breakpoint 1 at 0x8048476: file test.c, line 5.
(gdb) continue
Breakpoint 1, main () at test.c:5
5
for( i = 0; i < 10; i++ ) {
(gdb) display j
1: j = 1074136126
(gdb) step
6
j = i * 2 + 1;
1: j = 1074136126
(gdb) step
5
for( i = 0; i < 10; i++ ) {
1: j = 1
(gdb) quit
An Overview of Remote Debugging
If you are familiar with the concept of a rom monitor, or you have ever used a typical, commercially
prepared microprocessor evaluation kit, then you have already experienced the concept being discussed
here. The important idea is that, in such a setup, there is always a small amount of code resident in the
debugging target, usually in a ROM or flash chip. This code, which is the monitor itself, boots the target
hardware and then waits until the debugger tells it what to do next.
In GNU lingo, the small bit of code that lives on the debugging target is called a debugging agent (or,
sometimes, a debugging stub), and its job is to implement debugger commands to read and write
memory, query and set register values, and run the program being debugged. The debugging agent also
tells the debugger about unexpected events like breakpoint hits, and application errors like an attempt to
divide by zero.
In general, what happens during a debugging session is this: the debugger sends the debugging target a
series of memory writing commands that transfer the application to be debugged from the development
host to the debugging target (this step is not necessary if the application has already been installed in the
target system by some other means). After that, the debugger tells the target to jump to the memory
location that is the start of the program.
The running application encounters a breakpoint, and the debugging agent notifies the debugger that the
application has been paused and is now waiting for further instructions. The debugger may peek and
poke memory to discover and assert the values of registers and data, but eventually it tells the target to
resume the application. At some point, either the application ends or the debugger tells it to go away.
On a typical day, shortly thereafter this cycle repeats itself.
2
Implementing a Remote Debugging Agent Using the GNU Debugger
How do we do that?
The implementation of a debugging agent requires a lot of information about the target processor’s
debugging capabilities, and the communications protocol used by the debugger. Most processors feature
opcodes and hardware for providing breakpoints and catching exceptions generated by the program; the
communications protocol for the debugger, in the case of gdb, is well documented and freely available.
The following sections describe gdb’s debugging agent communications protocol, and provide examples
on how to use the features of the Hitachi SH-2 microprocessor family to implement a debugging agent.
The GDB Remote Serial Protocol
The GDB Remote Serial Protocol (RSP) is the lingua franca between gdb and a debugging target. It
defines messages for reading and writing data, controlling the application being debugged, and reporting
application status.
The RSP uses plain ASCII characters for most messages. Messages begin with a dollar sign ($), and end
with a gridlet (#) and an ASCII encoded, 8-bit checksum. Put another way, each message looks like this:
$ <data> # CKSUM_MSN CKSUM_LSN
where <data> is a string of ASCII hex [0-9,a-f,A-F] characters, and CKSUM_MSN and CKSUM_LSN are
ASCII hex bytes representing the most and least significant nibbles of the packet’s eight-bit checksum.
When a message is sent, the receiver acknowledges with either:
+ if the received checksum was correct, and the receiver is ready for the next packet;
or,
- if the received checksum was incorrect, and the message needs to be retransmitted.
A debugging stub responds to messages from gdb with either data, an OK, or an error code. When gdb
receives an error code, it reports the number to the user via the gdb console, and then halts whatever
activity is currently in progress.
The following sections summarize and provide examples of the essential RSP commands. If the
command is issued by gdb, then the examples show that command packet on the first line; the second
line is the target’s response. If the packet is documented as a target response, then the first line of the
example is a command (perhaps one of many) that gdb may issue to elicit that response.
Read Registers (g)
This command is issued by gdb to request the values of all target registers. The target replies with a
single message containing ordered register values packed end-to-end. The ordering of the values is
hardcoded in the debugger, and is target specific. The ordering is documented in the target specific
configuration files in the gdb/config/ directory of gdb’s source code.
[gdb]
$g#67
3
Implementing a Remote Debugging Agent Using the GNU Debugger
[target]
+ $0123456789abcdef0123456789abcdef...#xx
Write Registers (G)
This command is issued by gdb to assert the values of all target registers. The target replies with OK. The
ordering of the values is identical to the ordering used in the Section called Read Registers (g).
[gdb]
[target]
$0123456789abcdef0123456789abcdef...#xx
+ $OK#9a
Note that this command does not necessarily cause immdediate modification of target register contents.
Consider the case where the target’s stack pointer value is modified by this command: such action would
likely crash the debugging agent and/or the application being debugged. Instead, the typical
implementation stores values received by this command in a data structure called a register file; these
values are placed into physical registers as the debugging agent transfers system control back to the
application.
Write Register n (P)
Sent by gdb to set the value of a particular register, esp. the program counter. The register is enumerated
per the Section called Read Registers (g). The target replies with OK.
As with the other commands that modify register values, this command does not cause modification of
physical register values until the debugging agent transfers control back to the application. See
the Section called Write Registers (G) for a brief discussion on why.
[gdb]
[target]
$P10=0040149c#b3
+ $OK#9a
Read Memory (m)
This command is sent by gdb to request the contents of target memory. The target responds with the data,
sorted in order of increasing byte address. The target is responsible for handling any alignment or other
access restriction issues.
Arguments are the memory address, and the number of bytes. The example reads two bytes from address
0x4015bc.
[gdb]
[target]
$m4015bc,2#5a
+ $2f86#06
4
Implementing a Remote Debugging Agent Using the GNU Debugger
Write Memory (M)
Sent by gdb to set the values of a region of target memory. The target must deal with any alignment or
access restriction issues, esp. writing single bytes to control registers that have fixed multibyte widths.
Such accesses would not normally be encountered during a program download, but may occur if a
startup script or user at the debugging console tries to configure target peripheral control registers.
Arguments are the memory address, length of the data in bytes, and the data. Data is sorted in increasing
byte order. Target responds with OK.
The example sets the byte at address 0x4015cc to 0xc3, and the byte at address 0x4015cd to 0x20.
[gdb]
[target]
$M4015cc,2:c320#6d
+ $OK#9a
Query Section Offsets (qOffsets)
Sent by gdb to determine what relocation, if any, the target applies to applications and data during the
download process. Unused in typical embedded systems, recognition of this command improves gdb
startup performance by avoiding a timeout delay waiting for a response.
There are no arguments to this command. Target responds with the offsets it applies to the application’s
.text, .data and .bss sections, all of which are typically zero.
[gdb]
[target]
$qOffsets#4b
+ $Text=0;Data=0;Bss=0#04
Set Thread (H)
Sent by gdb to constrain future commands to the thread specified in the arguments. Particularly important
for thread-aware debugging in applications that utilize an RTOS. The thread number is user-specified,
and usually maps directly to a thread or task identifier in the application’s operating system.
In non-multithreaded applications, or applications that can stop all threads when a breakpoint is
encountered, it is safe to leave this command either unimplemented, or implemented as a do-nothing.
The lone argument to this command is the thread number; if the thread number specified is -1, then gdb
is requesting that any thread-specific capabilities in the debugging agent be disabled, i.e. "apply the
following to all threads". The target replies with OK.
[gdb]
[target]
$Hc-1#09
+ $OK#9a
5
Implementing a Remote Debugging Agent Using the GNU Debugger
Step (s)
Sent by gdb to request that the debugging agent step one machine instruction. This command has one
optional argument: the address of the instruction to step. There is no return message from the target,
except for the message acknowledgement.
[gdb]
[target]
$s#73
+
After sending this command, gdb waits for the target to indicate that it has stopped at a breakpoint,
encountered an exception condition, or terminated the program; this response will come in the form of
one of the target responses described in the following sections. If the user presses a CTRL-C at the gdb
console, gdb sends a ^C (\003, ASCII ETX) to the target, in an attempt to interrupt the running
application. The target may choose to ignore the request.
Continue (c)
Sent by gdb to instruct the target to continue program execution. An optional argument specifies the
address to resume at; if this argument is omitted, the target resumes at the current Program Counter.
As with the Section called Step (s), after sending this command gdb waits for the target to indicate that it
has stopped at a breakpoint, encountered an exception condition, or terminated the program. If the user
presses a CTRL-C at the gdb console, gdb sends a ^C to the target. The target may choose to ignore the
request.
[gdb]
[target]
$c#63
+
Report Target Status (?)
Sent by gdb to request target status, esp. during initial serial link setup. Target responds with a signal
identifier as per the Section called Target Status Response (S) , or an expedited message that contains the
signal identifier plus register values, as per the Section called Expedited Target Status Response (T).
[gdb]
[target]
$?#3f
+ $S05#b8
6
Implementing a Remote Debugging Agent Using the GNU Debugger
Terminate Application (k)
Sent by gdb to instruct the target to terminate the application, esp. when gdb itself exists or disconnects
from the target. The target may implement this command as a forced reset, a do-nothing, or something in
between. The target responds with an OK.
[gdb]
[target]
$k#6b
+ $OK#9a
Target Status Response (S)
Sent by the target in response to a Report Target Status command, at the occurrence of a breakpoint, in
response to an exception condition, or upon application termination. Gdb does not send a reply to this
message, other than acknowledgement.
The message’s single argument is the signal number, encoded in a two-byte hex format. Signal numbers
are specified in gdb/target.h, the enumeration enum target_signal.
[gdb]
[target]
$?#3f
+ $S05#b8
Expedited Target Status Response (T)
Sent by the target in response to a Report Target Status command, at the occurrence of a breakpoint, in
response to an exception condition, or upon application termination. Semantically equivalent to the
Target Status Response message documented in the Section called Target Status Response (S).
The Expedited Target Status Response message is intended to minimize target communications, by
eliminating the need for gdb to issue another target request to fetch register values. As such,
implementation of this message is optional but recommended, as it improves gdb performance over
low-bandwidth and/or high-latency links.
Arguments to this message are a signal number encoded as a two-byte hex number, followed by one or
more combinations of a register number, a colon, register data, and a semicolon. Registers are numbered
per the Section called Read Registers (g).
[gdb]
[target]
$?#3f
+ $T0510:1238;F:FFE0..#xx
7
Implementing a Remote Debugging Agent Using the GNU Debugger
Console Output (O)
Sent by the target to request output at the gdb console. There is currently no corresponding strategy for
gdb to request target console output, or for either gdb or a target to simulate console input.
The argument to this message is a string of data encoded as two-byte hex. Gdb will not display the
message until a newline, 0x0a, is received.
The following example sends a "Hello, world!\n" message to the gdb console. Gdb does not respond to
this message, other than message acknowledgement.
[target]
[gdb]
$O48656c6c6f2c20776f726c64210a#55
+
Implementing Breakpoints
To set breakpoints, gdb typically uses memory reading and writing commands to nondestructively
replace the instruction at the breakpoint location with a TRAP or similar opcode. When the breakpoint is
encountered, the debugging agent communicates the event to gdb via one of the target status response
messages, and then waits for additional instructions. Gdb usually responds by replacing the breakpoint
opcode with the original instruction, and requesting register values so that it can display source code and
data to the user.
Figure 2 is a TRAP exception handler for the Hitachi SH-2 microprocessor family. When the processor
encounters the TRAP instruction placed as a breakpoint by gdb, this function sends the processor context
to a function called gdb_exception(), which sends the target status message to gdb.
Figure 2. A TRAPA handler for the Hitachi SH-2.
/* An example TRAPA #32 handler for the Hitachi SH2.
Stores current register values on the stack, then calls
gdb_exception.
*/
__asm__("
.global _gdb_exception_32
_gdb_exception_32:
/* push the stack pointer and r14 */
mov.l r15, @-r15
mov.l r14, @-r15
/* the sh2 stacks the pc and sr automatically when performing a
trap exception, so we have to adjust the stack pointer value we
give to gdb to account for this extra data. In other words, gdb
wants to see the stack pointer value as it was BEFORE the trap
was taken, and not what its value is right now. So, subtract
eight (pc and sr are four bytes each) from the sp value we just
8
Implementing a Remote Debugging Agent Using the GNU Debugger
pushed onto the stack */
mov.l @(4,r15), r14
add #8, r14
mov.l r14, @(4,r15)
/* push other register values onto the stack */
mov.l r13, @-r15
mov.l r12, @-r15
mov.l r11, @-r15
mov.l r10, @-r15
mov.l r9, @-r15
mov.l r8, @-r15
mov.l r7, @-r15
mov.l r6, @-r15
mov.l r5, @-r15
mov.l r4, @-r15
mov.l r3, @-r15
mov.l r2, @-r15
mov.l r1, @-r15
mov.l r0, @-r15
sts.l macl, @-r15
sts.l mach, @-r15
stc vbr, r7
stc gbr, r6
sts pr, r5
/* call gdb_exception, pass it exception=32 */
mov.l _gdb_exception_target, r1
jmp @r1
mov #32, r4
.align 2
_gdb_exception_target: .long _gdb_exception
");
Implementing Instruction Stepping
The step command can be a challenge to implement, especially when the target processor doesn’t
provide a "trace bit"1 or similar functionality that facilitates instruction stepping in hardware. In such
cases, the only alternative is for the stub to disassemble the instruction to be executed, and write a TRAP
at the instruction’s destination address.
Several suggestions on how to do this are supplied with gdb. For the Hitachi SH-2, the function
doSStep() in gdb/sh-stub.c is illustrative, as are the similarly-named functions in the files
gdb/i386-stub.c, and gdb/m68k-stub.c.
9
Implementing a Remote Debugging Agent Using the GNU Debugger
Hardware-assisted instruction stepping
Some versions of the SH-2 have a peripheral called the User Break Controller (UBC), which is designed
specifically for single stepping and breakpointing. The code in Figure 3 is an example of how to use the
UBC to implement gdb’s step command. This code configures the UBC to generate an exception after
the application’s next instruction is fetched, which is a good illustration of why the information in
gdb_register_file is so important: without it, we would have no idea where the application’s next
instruction was located.
Note that some versions of the SH’s UBC peripheral are defective: they cannot step across instructions
that are in delay slots, and/or instructions in certain branch conditions. The example code tries to address
this by configuring the UBC to generate an exception on any access of the next instruction’s location,
which does not work in branching and delay slot situations with broken UBCs.
Once gdb_step() has configured the UBC, it returns control to the application being debugged using
the gdb_return_from_exception function.
Figure 3. Code stepping with the SH-2’s UBC peripheral.
/*
Steps one instruction, starting from the address
(supplied as a hex buffer) supplied in hargs.
Uses the UBC.
*/
void gdb_step ( char *hargs )
{
long addr = 0;
/* parse address, if any */
while( *hargs != ’#’ )
addr = ( addr << 4 ) + hex_to_long( *hargs++ );
/* if we’re stepping from an address,
then adjust pc (note: untested!) */
if( addr )
gdb_register_file.pc = addr;
/* we need the exception to occur after the next instruction
(because of the way the UBC works, this is ok even if the
next instruction is a branch; this doesn’t work if the
next instruction is a TRAP, though) */
addr = gdb_register_file.pc + 2;
/* configure the UBC */
*SH2_704X_UBC_UBARH = (short)( addr >> 16 );
*SH2_704X_UBC_UBARL = (short)( addr );
/* tell UBC not to mask any address bits
(because we’re looking for an exact address
match, all address bits are valid here) */
*SH2_704X_UBC_UBAMRH = 0;
*SH2_704X_UBC_UBAMRL = 0;
10
Implementing a Remote Debugging Agent Using the GNU Debugger
/* break on instruction and data fetches
(necessary because target address may be a branch,
per 7.5.2 of User’s Manual) */
*SH2_704X_UBC_UBBR = 0x74;
/* we’re all done now */
gdb_return_from_exception();
return;
}
Software-only instruction stepping
If a microprocessor lacks instruction stepping hardware, or the hardware has been allocated for other
uses, then the only alternative is to implement instruction stepping in software. The technique is
laborious but straightforward.
Code to implement instruction stepping in software for the Hitachi SH-2 is shown in Figure 4. The code
determines the address of the instruction that will follow the stepped opcode, and replaces it with a
TRAPA #32 opcode: in effect, simulating a breakpoint. The modified instruction is restored in the TRAPA
handler.
Figure 4. Stepping in software, for the Hitachi SH-2.
/* some
#define
#define
#define
#define
#define
#define
#define
#define
#define
#define
#define
#define
#define
#define
#define
#define
#define
#define
#define
macros for gdb_get_stepi_dest() */
OPCODE_BT(op)
(((op) & 0xff00) == 0x8900)
OPCODE_BF(op)
(((op) & 0xff00) == 0x8b00)
OPCODE_BTF_DISP(op)
(((op) & 0x80) ? (((op) | 0xffffff80) << 1) : \
(((op) & 0x7f ) << 1))
OPCODE_BFS(op)
(((op) & 0xff00) == 0x8f00)
OPCODE_BTS(op)
(((op) & 0xff00) == 0x8d00)
OPCODE_BRA(op)
(((op) & 0xf000) == 0xa000)
OPCODE_BRA_DISP(op)
(((op) & 0x800) ? (((op) | 0xfffff800) << 1) : \
(((op) & 0x7ff) << 1))
OPCODE_BRAF(op)
(((op) & 0xf0ff) == 0x0023)
OPCODE_BRAF_REG(op)
(((op) & 0x0f00) >> 8)
OPCODE_BSR(op)
(((op) & 0xf000) == 0xb000)
OPCODE_BSR_DISP(op)
(((op) & 0x800) ? (((op) | 0xfffff800) << 1) : \
(((op) & 0x7ff) << 1))
OPCODE_BSRF(op)
(((op) & 0xf0ff) == 0x0003)
OPCODE_BSRF_REG(op)
(((op) >> 8) & 0xf)
OPCODE_JMP(op)
(((op) & 0xf0ff) == 0x402b)
OPCODE_JMP_REG(op)
(((op) >> 8) & 0xf)
OPCODE_JSR(op)
(((op) & 0xf0ff) == 0x400b)
OPCODE_JSR_REG(op)
(((op) >> 8) & 0xf)
OPCODE_RTS(op)
((op) == 0xb)
SR_T_BIT_MASK
0x1
#define STEP_OPCODE
0xc320
11
Implementing a Remote Debugging Agent Using the GNU Debugger
long gdb_get_stepi_dest (void)
{
short op = *(short*)gdb_register_file.pc;
long addr = gdb_register_file.pc + 2;
/* BT, BT/S, BF and BF/S */
if(((OPCODE_BT(op) || OPCODE_BTS(op))
&& (gdb_register_file.sr & SR_T_BIT_MASK))
|| ((OPCODE_BF(op) || OPCODE_BFS(op))
&& !(gdb_register_file.sr & SR_T_BIT_MASK))) {
/* we’re taking the branch */
/* per 6.12 of the SH1/SH2 programming manual,
PC+disp is address of the second instruction
after the branch instruction, so we have to add 4 */
addr = gdb_register_file.pc + 4 + OPCODE_BTF_DISP(op);
}
/* BRA */
else if(OPCODE_BRA(op))
addr = gdb_register_file.pc + 4 + OPCODE_BRA_DISP(op);
/* BRAF */
else if(OPCODE_BRAF(op))
addr = gdb_register_file.pc + 4
+ gdb_register_file.r[OPCODE_BRAF_REG(op)];
/* BSR */
else if(OPCODE_BSR(op))
addr = gdb_register_file.pc + 4 + OPCODE_BSR_DISP(op);
/* BSRF */
else if(OPCODE_BSRF(op))
addr = gdb_register_file.pc + 4
+ gdb_register_file.r[OPCODE_BSRF_REG(op)];
/* JMP */
else if(OPCODE_JMP(op))
addr = gdb_register_file.r[OPCODE_JMP_REG(op)];
/* JSR */
else if(OPCODE_JSR(op))
addr = gdb_register_file.r[OPCODE_JSR_REG(op)];
/* RTS */
else if(OPCODE_RTS(op))
addr = gdb_register_file.pr;
return addr;
}
12
Implementing a Remote Debugging Agent Using the GNU Debugger
void gdb_step (char *hargs)
{
long addr = 0;
/* parse address, if any */
while(*hargs != ’#’)
addr = (addr << 4) + hex_to_long(*hargs++);
/* if we’re stepping from an address, adjust pc */
if(addr) gdb_register_file.pc = addr;
/* determine where the target instruction will send us to */
addr = gdb_get_stepi_dest();
/* replace it */
gdb_stepped_opcode = *(short*)addr;
*(short*)addr = STEP_OPCODE;
/* we’re all done now */
gdb_return_from_exception();
return;
}
Returning from an instruction step or other exception
The code in Figure 5 illustrates how a debugging agent should return from a breakpoint or other
exception. In summary, the code dumps the contents of the saved register data (gathered into
gdb_register_file at the start of the exception) back into the registers, restores the stack, and then
returns control to the application.
Figure 5. Returning control to the interrupted application.
__asm__("
.global _gdb_return_from_exception
_gdb_return_from_exception:
/* find gdb_register_file */
mov.l register_file, r0
/* restore a few registers from it */
lds.l @r0+, pr
ldc.l @r0+, gbr
ldc.l @r0+, vbr
lds.l @r0+, mach
lds.l @r0+, macl
/* skip r0 and r1 for now,
13
Implementing a Remote Debugging Agent Using the GNU Debugger
since we’re still using them */
add #8, r0
/* restore a few more registers */
mov.l @r0+, r2
mov.l @r0+, r3
mov.l @r0+, r4
mov.l @r0+, r5
mov.l @r0+, r5
mov.l @r0+, r7
mov.l @r0+, r8
mov.l @r0+, r9
mov.l @r0+, r10
mov.l @r0+, r11
mov.l @r0+, r12
mov.l @r0+, r13
mov.l @r0+, r14
mov.l @r0+, r15
/* put sr back onto stack */
mov.l @(4,r0), r1
mov.l r1, @-r15
/* put pc back onto stack */
mov.l @r0, r1
mov.l r1, @-r15
/* restore r1, r0 */
add #-64, r0
mov.l @(4,r0), r1
mov.l @r0, r0
/* we’re done-- return */
rte
nop
.align 2
register_file:
.long _gdb_register_file
");
Debugging a debugging agent
Gdb provides some functionality that can be used to debug debugging agents. To display and log all the
messages exchanged between gdb and the agent, use the debug remote and remotelogfile commands:
(gdb) set debug remote 1
(gdb) set remotelogfile <filename>
14
Implementing a Remote Debugging Agent Using the GNU Debugger
Gdb’s maintenance packet command sends arbitrary messages to the agent. Its arguments are
everything between the a packet’s $ and # characters. To send the report target status packet, for
example, do this:
(gdb) maintenance packet ?
Target Expression Evaluation
With a properly implemented debugging agent, gdb can evaluate arbitrary C expressions entered at the
console--- including ones containing function calls or data references on the debugging target. This
functionality is useful for setting the values of control registers and memory, manipulating data
structures, and invoking "helper functions" that provide greater insight into the state of the target than
functions that normally exist in the application.
To read memory locations, use the print command, and C syntax (the x command is also useful at times):
(gdb) print *(char*)0x123456
The syntax to write a value to memory is identical, except that it uses the set command:
(gdb) set *(char*)0x123456=0x9a
To invoke a function on the debugging target, use the print command, and reference the function as you
would in a C expression:
(gdb) print foo()
If the function call has arguments, you can include them as well:
(gdb) print bar(x,10,foo())
Gdb implements target function calls by manipulating the target’s program counter, register file, and
stack. The called function does not need a special signature to be callable from gdb.
On Startup Scripts
The most effective debugging agents are the ones that try to do as little as possible. For example, a
debugging agent that only performs the minimum startup configuration necessary to get the target
hardware talking a serial port is more likely to be stable and portable than one that runs a long series of
diagnostic checks, zeroes out memory, sets up a few DMA transfers, and tracks the time of day 2.
For everything else, the set command will generally suffice. To perform a sequence of sets to
automatically establish a target connection and initialize target hardware, place the commands into a text
file called .gdbinit; gdb automatically runs the commands in this file at startup.
15
Implementing a Remote Debugging Agent Using the GNU Debugger
Gdb’s command syntax includes support for conditional looping and other higher-level programming
constructs, which facilitates automated testing. See the section Canned Sequences of Commands in gdb’s
online help for more information.
Disassembling Code
Gdb can disassemble the contents of target memory, and for convenience will supplement magic
numbers in the disassembled opcodes whenever possible.
(gdb) disassemble main
Dump of assembler code for function main:
0x8130 <main>: mov
r12, sp
0x8134 <main+4>:
stmdb
sp!, {r11, r12, lr, pc}
0x8138 <main+8>:
sub
r11, r12, #4
; 0x4
0x813c <main+12>:
sub
sp, sp, #8
; 0x8
0x8140 <main+16>:
bl
0x8268 <__gccmain>
0x8144 <main+20>:
ldr
r3, [pc, #44]
; 0x8190 <main+96>
Building and Installing Gdb
Gdb is distributed as source code from the Free Software Foundation’s website. After downloading the
source code, use the procedure in Figure 6 to configure, compile and install it.
Figure 6. Building and Installing Gdb
#
#
#
#
#
tar xzf gdb-5.1.tar.gz
mkdir build-gdb
cd build-gdb
../gdb-5.1/configure --target=<target-name>
make all install
Replace target-name with the name of the target you are trying to debug. The documented selection of
supported targets is always out of date (targets are added regularly), but the following lists some of the
more commonly-requested ones.
•
powerpc-eabi
•
m68k-coff
•
sh-elf
•
arm-linux
•
powerpc-linux
16
Implementing a Remote Debugging Agent Using the GNU Debugger
Source Code for a GDB Debugging Stub
Despite the target-specific nature of remote software debugging, it is possible to create a highly portable
debugging stub that can be reused with minimal modification on several different embedded
microprocessors. The author has begun work on a portable debugging stub library. This code has been
compiled and tested for the Hitachi SH-2 microprocessor, and ports are underway for several other parts.
If you are interested in contributing in the development of this library, or just need help writing your own
stub, see the resources listed at the end of this article.
Ideas on adapting gdb to solve specific problems
Gdb uses a modular implementation architecture, which makes it straightforward to change aspects of its
behavior that don’t suit your needs. For example, if your product has only one communications port that
is already dedicated to a non-gdb communications protocol, then it is possible to modify gdb so that
debugger messages fit inside of packets your product already understands. Likewise, if your product
lacks a serial port but has some other kind of communications interface, like a CAN port, then you could
enhance gdb’s remote communications strategy to work with an off-the-shelf serial-to-CAN or
parallel-to-CAN bridge.
One can also modify gdb’s behavior to make it more compatible with other software in your embedded
application. For example, if you were already using TRAPA #32 for something non-gdb-related, then
you could either change the opcode gdb uses for a breakpoint, or you could have gdb produce a new
message-- one that signaled your target to turn on instruction tracing or enable on-chip
breakpoint-generating hardware, for example.
The file gdb/remote.c contains gdb’s implementation of the Remote Serial Protocol, and is a good
starting point for studying how gdb’s modular implementation permits you to quickly adapt it to meet the
needs of a specific debugging target. Other files like gdb/remote-hms.c and gdb/remote-e7000.c
use this modular framework to provide support for debuggers and emulators supplied by Hitachi,
Motorola and other vendors.
For the most up-to-date information on how gdb works, how to enhance gdb, and how to get your
improvements into future gdb releases, see the gdb internals document on the gdb website.
Conclusion
This document describes how to implement a basic debugging agent for the GNU debugger. A properly
implemented debugging agent allows you to set breakpoints, step code, and debug applications across a
serial port or similar connection.
Having the source code for a debugging agent and the debugger allows you to implement powerful and
flexible solutions to challenging embedded development problems. I hope this article encourages you to
prove this for yourself, in your own embedded systems.
17
Implementing a Remote Debugging Agent Using the GNU Debugger
Copyright
This article is Copyright (c) 2002 by Bill Gatliff. All rights reserved. Reproduction for personal use is
encouraged as long as the document is reproduced in its entirety, including this copyright notice and
author contact information. For other uses, contact the author.
About the Author
Bill Gatliff is a freelance embedded developer and training consultant with almost ten years of
experience of using GNU and other tools for building embedded systems. His product background
includes automotive, industrial, aerospace and medical instrumentation applications.
Bill specializes GNU-based embedded development, and in using and adapting GNU tools to meet the
needs of difficult development problems. He welcomes the opportunity to participate in projects of all
types.
Bill is a Contributing Editor for Embedded Systems Programming Magazine
(http://www.embedded.com/), a member of the Advisory Panel for the Embedded Systems Conference
(http://www.esconline.com/), maintainer of the Crossgcc FAQ, creator of the gdbstubs
(http://sourceforge.net/projects/gdbstubs) project, and a noted author and speaker.
Bill welcomes feedback and suggestions. Contact information is on his website, at
http://www.billgatliff.com.
Notes
1. For example, Motorola 683xx processors have the ability to trap on instruction execution and/or
changes in program flow; this feature is controlled by the "trace enable" bits, T1 and T0, in the
processor’s status register.
2. It is not unreasonable for a debugging agent to manage a hardware watchdog timer, however, if such
hardware cannot be disabled during debugging.
18


© Copyright 2026