
- 69 - characteristics to a sustainable city.
- 69 Chapter 5: Alternatives for the future
5.1 Green City
As discussed in section 1.3, the literature attributes the following general
characteristics to a sustainable city.
•
•
•
•
•
Reduces the ecological footprint per capita of its inhabitants by providing
adequate transportation, adequate construction techniques and
materials, concentration of housing, and food production.
Develops a closed system for its outputs trying to convert these into
resources (recycling, use of biogas, composting).
Inserts itself in its bioregion, harmonizing its construction, growth, and
production to the surrounding ecosystem. In other words, as much as
possible, it adapts to the natural conditions rather than adapting the
natural conditions to it
Imports carrying capacity from places that have an ecological surplus or
an environmentally sustainable production
Emphasizes social interaction and political participation for local
problem solving.
It is neither realistic nor reasonable for a city relatively small like Castillos
to try to tackle all the points presented above. However, Castillos is already
doing well in many aspects and could easily get “greener” in others.
Walk, bicycle, or motorbike constitute the most commonly used means of
transportation inside Castillos. There are cars in the city but they are not an
environmental concern and there are no traffic problems in the city. It does not
make sense for a city like Castillos to spend resources in transportation
planning. Perhaps the main area of concern with respect to transportation is
related to transportation between Castillos and Aguas Dulces, and to a lesser
extent between Castillos and Balizas. Only during the summer months there is
appropriate transportation in these routes, during the winter months the
frequency is very low with Aguas Dulces and non-existent with Balizas.
However, investing in transportation planning should be completely focused in
the social aspect for it would be a waste of resources at this point in time to
relate it to environmental concerns.
In terms of construction techniques, materials, concentration of housing,
population growth/infrastructure ratio there is room for improvement in the
city. Castillos growth between the two last censuses was not significantly large.
It had had a previous trend of decreasing population but it had a small
increase in population between 1986 and 1996. Castillos urban growth has not
been well regulated and this has lead to problems like the ones described in the
previous chapter. New constructions should be done in an orderly fashion and
- 70 location should be regulated, especially in terms of distance from the creeks
and exclusion from flooding areas. When possible, those households living in
houses located in the flooding areas should have priority to move into new
dwellings constructed by the central government. At the same time a strict
enforcement of the rules should be carried out by the local government. New
economic dwellings constructed by the central government should consider not
being connected to the sewer given that it is already functioning over capacity.
Section 5.2 below will discuss possibilities suggested by UNEP. Moreover, the
central government could use Castillos as a place to experiment in the use of
local materials, and new “green” techniques. This is easier said than done with
the central government, but the Castillos area of influence has people with
good constructing skills available for this kind of alternative approaches. The
few remaining palafitos in Aguas Dulces are a living proof of this. In terms of
city growth, picture 13 shows the variation in Castillos extension between 1967
and 1998. Not a significant change, but the local government based on
technical reasons should determine and regulate the areas for future
development making special consideration of creeks and wastewater treatment.
Picture 13 illustrates
the locations into
which Castillos has
been growing during
the past 25 years.
The growth is not
extremely significant,
but regulation is
needed.
In terms of food production, there are several small agricultural
producers in the area and they supply part of Castillos’ food. Even in the winter
there is a relatively good supply from local greenhouses. Production is not
organic for there is no market for it in the city. However, a local project recently
received international funding to establish urban agriculture activities
connected to some other social aspects of the project. This project is just
getting started at the time (September 2003) but it will create a positive impact
- 71 in Castillos’ population and is an invaluable opportunity to increase local food
production, increase environmental education and create a tendency towards
the reduction of agrochemicals in surrounding lands. The Urban Region
Biosphere Reserve should coordinate with these local initiatives in order to
exchange positive feedback and build on the synergies of established
alternatives.
Continuing with the general characteristics of the green cities, the
importation of carrying capacity from area that produce sustainably is not a
reasonable expectation for a city like Castillos. Perhaps it could be an utopia to
include in the management of Urban Biosphere Reserves with megacities that
could have the size required for this type of analysis and objective.
Social participation is an important part of Castillos civic life and solidarity
has been significant during times of crisis. A barter club was created at the
peak of the national financial crisis and in less than 300 months it grew to
more than 300 members (almost 5% of the population) who exchanged food,
services, crafts and other goods. The local television sponsored a solidarity day
in which people could donate food and/or clothes for people in need and the
response again was out of the ordinary.
The process of decentralisation should be pursued. Obtaining a higher level
of decentralization from the municipal government can help increase the levels
of participation. However, transparency and accountability as well as an
increase in the opportunities for participation in planning processes should go
hand in hand with decentralisation for it to succeed. If financial control is given
to the Junta Locales, local citizens should be one of the guarantees for an
appropriate use of funds, but they can only participate if they are given the
spaces to do so. Having said this, Castillos starts with a level of civic life
superior to that observed in other parts of Rocha.
The development of closed system instead of linear ones in order to convert
waste into resource, and the insertion into the city’s bioregion will be analysed
in the next sections.
5.2 Wastewater management
In section 4.2.3 it was stated that the problem with the creeks was
twofold, flooding affected several houses and water quality was affected. The
dual nature of the problem provides an opportunity in relation to this project.
Including Castillos in a protected area will necessarily involve a creeks
restoration process. Restoration projects need to be clearly tied to solutions to
the problems of flooding. Olazabal et al propose a combination of instruments.
In connection to the project, engineering parts of the creeks in which
construction has gone far beyond the point of no return might be necessary to
combine with relocation into better and legal housing in others. Whatever the
- 72 measures taken, it has to be clear to Castillos’ citizens that solving the flooding
project is just as part of the project as creek restoration activities. Local
citizens need to associate an improvement in the creeks environment with a
better quality of life in their households. At the same time, solving the garbage
problem in the city and the creeks will provide a better living environment that
will be appreciated by local citizens and will solve problems to landowners
downstream, and this could promote the involvement of actors needed to
complete other issues of the project located outside the city.
According to municipal regulations, new houses and governmentconstructed dwellings have to be connected to the city’s sewage system. In the
case of Castillos this is a partial solution due to the situation of the treatment
plant. Studies need to be done in order to find a solution for the wastewater
plant. The author is in the first stages of a project proposal that will be done in
collaboration with local authorities and private citizens involved in the central
government agency in charge of water and wastewater. The proposal will focus
on improving the existent facilities in combination with alternative methods for
those houses not connected to the sewage. Goodland and Rockerfeller (1996)
suggest that instead of providing sewer to the places without it, funds should
be used to “install on-site remediation technologies” already available and
superior to septic systems. They highlight the following advantages of such
alternatives:
1. development of communities is not bound to the grid or sewer lines;
2. pollution problems can be dealt with piecemeal –where they really
exist, and where they are worst first;
3. capital as well as maintenance costs are substantially lower for onsite systems than for central sewering and treatment;
4. most importantly, the problem of water pollution becomes solvable
instead of merely transferable.
These alternatives are applicable for the case of Castillos and any proposal
related to wastewater treatment should have a dual focus: improving the
existent treatment plant, and providing off sewer alternatives for housing not
yet connected to the sewer. A final alternative is the use of wastewater trucks
that will collect wastewater from septic tanks and dispose it in the wastewater
treatment plant. This option is not recommended, but could be used as a
temporary alternative if the treatment plant ends up having enough capability
for the entire population.
Finally, the lack of industries in Castillos, and the existence of small
agriculture producers in the area provides opportunities to consider a closed
system instead of linear one in regards to water use. With proper treatment
excreta could be recycled and safely used in agricultural or urban agriculture
activities.
- 73 5.3 Solid Waste
As appendix F clearly illustrates, the local dump situation needs urgent
repair. It is a major source of contamination of the creeks, the city, and its
surroundings. It is also one of the main causes of concern among castillenses
as graph 9 illustrates.
Graph 9 shows
that the local
follows creeks
contamination
closely as the
main
environmental
problem according
to Castillos
Citizens.
Coherent with the result shown in graph 9 is the willingness of
castillenses to recycle and to take garbage out fewer times per week – with the
chi-square test showing a strong relation between these two variables. Local
press and private business will surely support an informative campaign related
to new garbage collection strategies.
Recycling necessarily has to become part of Castillos waste management.
Plastics are probably the worst contaminants in the area, but due to the size of
the problem they could also provide some opportunities if efforts are
coordinated with communities located in the area. One of the problems with
the recycling of plastic is associated with the cost of transporting it to
Montevideo where the facilities for grinding it and the major port exist. In the
past some trucks have been sent to Montevideo with plastic, however this has
been unsystematic due to the difficulty finding cheap transportation (trucks
usually go full and return empty through that route) and a storehouse to keep
plastics. Involving surrounding communities in a recycling project could
provide alternatives that make transportation feasible or could justify getting a
grinder for Castillos, a preferred alternative for it would show some local
immediate benefits from recycling. The grinder could be located in the old
‘cocopalm’ warehouse, a plant that was established many decades ago with the
- 74 intention of obtaining oil from the fruit of the butia palm. The warehouse
(shown in picture 14) has the appropriate size to host a grinder like the ones
used in Montevideo. This added to the increase number of plastic from
surrounding communities that could go as far as Chuy (Castillos is located
between Chuy and Montevideo and Chuy has big problems with its own dump)
could provide the necessary economies of scale to make such a project
economically feasible.
Picture 14. The old
warehouse, which is not
being used, could provide
storage space or a
location for the grinder.
It is conveniently located
only a few minutes ago
from Castillos and there
are no major populations
that could be affected by
the noise.
Combining recycling of plastics with composting would turn the linear
system of Castillos solid waste to as much of a circular one possible given the
circumstances of the city. The opening of activities of the group related to
urban agriculture provides a unique opportunity to once again show Castillos
citizens direct benefits from the transformation of the city into a ‘green’ one.
Composting could start as an activity promoted by the group in charge of the
new project and gradually the city could provide the facilities and machinery to
include new households into the project. Castillos does not produce sufficient
garbage to do composting after collection, but a well planned strategy that is
related with ongoing projects and activities in and around the urban centre can
convince enough households to do classification at home.
As stated above, an important percentage of the population is willing to
take the garbage out fewer times per week. This way the reduction in use of the
garbage trucks can be transferred to activities related to plastic recycling and
composting.
- 75 5.4 Palmares
Given the strong connection Castillos city and its citizens have with the
palmares, alternatives for the conservation needs special attention in this
section. It is clear that establishing a traditional protected area of an adequate
size would necessarily involve expropriation of the land, for which the state has
no funds. Therefore, it can be assumed that a single protected area established
and funded by the national government will not be enough to protect the
palmar ecosystem. Any project designed to protect the palmar will need the
support from the local community and should have among its objectives the
analysis of alternatives presented by the local community and the proposal of
new strategies to the stakeholders. Among these new strategies, the use of
mobile and temporary protected areas should be studied. The ownership of the
land is what makes the use of mobile and temporary protected areas plausible
for the preservation of the landscape of palm trees. After 12 to 15 years without
cattle, palm trees are at a stage in which they are less vulnerable to the
reintroduction of cattle. A long-term use of mobile protected areas could protect
a bigger area at a smaller cost to the state. The state can rent the land from
different landowners for 12 to 15 years, after which the land goes back to the
landowner who can reintroduce cattle, then the funds used for renting the land
can be used in another, preferably adjunct, area. Under a long-term plan, the
preservation of the landscape is possible using less monetary resources. This
management system will then help maintain an invaluable landscape that
would be almost impossible for the government to protect with traditional
conservation practices.
Cattle ranchers, artisans, tourist operators, local governments, small
landowners are all affected, whether directly or indirectly, by the presence of
the palmar. As such they should play an integral role in the creation of
alternatives for their preservation and in the search for sustainable uses of the
palmar. The project should provide a mechanism for round-table discussions
involving local people in order to address the peculiarities of conserving the
area as well as to shape various proposals as to the usage of the palmar
ecosystem. Perhaps the most important challenge will be in addressing the
concerns of all stakeholders involved, including those reluctant to partake in
the conservation process. Sustainable alternatives and information sessions
with regards to the project should be held prior to the convocation for roundtables in order to overcome any potential misunderstandings and prejudices.
In order to go beyond the discussion and planning stages, any final proposals
will require a compromise by all parties and a commitment to a short-term
plan of action. Moreover, stakeholder involvement combined with field visits,
GIS and other methods will help identify features that will improve the
efficiency (e.g., size, location, distance and connectivity) of a system of
protected areas.
- 76 It is vital to identify which features of the landscape favour palms
recruitment and growth. For example, roadsides usually harbour saplings and
adult palms of different ages. This suggests that these areas may play an
important role for the recovery of the whole system, and hence should be
considered in the design of the action plan. Vegetation growing on the verge of
the highways and routes also suggests a possible association of the palm trees
with native forest (Carrere, 2001)1. A study conducted in July 2002, covering
three routes that cut through the palmar with a total length of 120 km, shows
not only that palm trees are growing in the space between the fence and the
highways, but also that this is the only place where succession is taking place2
and, coincidentally, where palm trees are associated with native forest species.
One particular area approximately 700 m long and less than 15 m wide shows
individuals more than 200 years old mixed with individuals approximately 80
years old and several native species and young palm trees. Many other places
along the highway show recruitment, and many palms are already more than
20 years old, but ages usually jump from less than 20 to more than 200 years
old with few palms of intermediate age. However, this particular stretch of
highway, where individuals of almost all ages can be found together and
associated with other species, suggests that today’s Palmares might have
developed from forest with native species and butia palms but, due to
anthropogenic actions, the landscape was modified to that which we now see. It
also suggests, considering the mixed age of palms in this particular area, that
regeneration and association with other native species might take more than
20 years to become manifest. Whatever the case, and keeping in mind the
special characteristics of these parcels of land, these areas at the side of some
highways possibly provide evidence of what will happen a few years after cattle
are excluded. Not without reason did Leopold state, half a century ago, that “In
the narrow thread of sod between the shaved banks and the Toppling fences
grow the relics of what once was Illinois: The prairie” (Leopold, 1949, p. 117).
Temporary or mobile protected areas could provide protection for young
palm trees to grow. Research conducted by the Botanical Garden of Montevideo
in two exclusion zones (with no cattle) shows that there is a potential for 11
100 sprouts per hectare per year. Given such a large number, protection of
individuals by fences would be infeasible. However, the report also concludes
that a certain level of management intervention is likely to be needed to assure
successful survival of a good percentage of these sprouts. In visits to two
different areas, one with total exclusion of cattle and another one with lower
cattle density, the author observed the regeneration of sprouts, which were
competing with grass but growing healthily nonetheless. Small enclosures were
unintentionally created when the new highway was built and small pieces
(approximately 1 hectare), were left between the old and new highways; in
these, palm trees have been successfully growing for more than two decades.
This suggests that a temporary protected area could be established on a piece
of land for a period of 12–15 years, after which the palm can survive the
- 77 reintroduction of cattle. After that period, land could be returned to grazing
and another piece of land, preferably adjacent, could be used to initiate a new
cycle of 12–15 years. This mobile component allows, in the long run, the
protection of a larger area with a limited budget and without using land
expropriation. It has the disadvantage of not preserving or restoring the
ecosystem, but several species could benefit from a strategy of short-term
exclusion, especially if the cycle is continued in adjacent areas. Further,
highways and their associated vegetated strips could be used as ecological
corridors connecting different areas.
Moreover, some commercial uses of the palm tree fruit could be allowed
without placing the area under total exclusion. By moving the protected area
from one place to another a larger area can be preserved for the same
resources that would be required to protect a small one for a prolonged period
of time. Gudynas and Evia (1999) estimate that maintaining a grazing rent
could cost the state US$25 per hectare per year, and expropriating could cost
US$550 per hectare. With those numbers in mind, protecting 10% (7000
hectares) of the palma butia landscape could cost approximately US$175 000
per year. Expropriation of the same amount of land would cost US$3 850 000.
By using temporary and mobile protected areas over a period of 36–45 years,
30% of the land (21 000 hectares) could be integrated into a landscape
protection programme at a cost of US$6 300 000–7 875 000. Buying the same
amount of land would cost US$1 550 000. Buying 30% of the land for 12–15
years and then selling it would be the best option in economic terms. However,
it is unlikely that the national or local government would get involved in such a
kind of policy for two main reasons: the political will for such a level of
investment does not yet exist, so funding would be very difficult to secure; and
an option to invest less in the short term, especially if combined with
easements, would be attractive to the government, even if it meant paying more
in the long run. This economic equation does not consider the impact of the
palm tree landscape on tourism or on palm based local products, but it is clear
that temporary and mobile protected areas, by providing more land coverage,
also benefit these aspects. The proposed system has two main problems. First,
if the state chooses to rent instead of expropriating, there is no guarantee that,
in future years, and with changes in government, it will continue to do so.
Second, many species will benefit from the habitat being restored, even if it is
mobile, but many others need a stable habitat. That is why this system is
proposed for landscape restoration and as a complement to, not a substitute
for, traditional protected-area strategies.
To date, one of the main obstacles has been finding enough landowners
willing to collaborate with the conservation efforts. In the few cases where
portions of private land were set aside for conservation or research purposes,
success was reliant on the co-operation of altruistic landowners, who received
no incentive or compensation from the state. Successive local governments
have made efforts to promote conservation in the area, but received little
- 78 support from the central government, in whose hands lies the possibility for
offering tax concessions. The local government could play an important and
complementary role by authorizing those landowners who co-operate with the
conservation effort to relocate their cattle onto public land, although the
opportunities for doing so are geographically limited. Having enough funds for
renting the land and/or obtaining appropriate tax incentives from central
government will still be the most important obstacle in the implementation of a
system of mobile and temporary protected areas for the conservation of the
palmar landscape. Even so, the temporal characteristic of these approaches
makes them useful in places where land is in private hands and the state does
not have sufficient resources for conservation. Moreover, the mobility of these
areas is compatible with the temporary factor, allowing more land to be covered
with the same resources over a long period of time. The use of these tools
should not be detrimental to the establishment of a reserve where habitat
restoration could be implemented. Temporary and mobile reserves should be
established to protect the landscape and at the same time complement the
objectives of a traditional reserve3, which should be the preservation of the
habitat.
This conception was also suggested by Hugo San Martin during my field
research but could not be empirically confirmed despite archival research
(Araujo, 1892; Reyes, 1859; Fiebrig, 1933), but early 20th-century descriptions
mention the absence of other species in the palm tree area.
2 There are very few other places where sprouts grow under the protection of a
native species that due to its abundant thorns keeps cattle away
3 The first mention of the need for the establishment of a Palmar protected area
that the author could find was in La Accion in June the 4th 1931, and it is
proposed as a National Monument.
1
- 79 Chapter 6: Integration of urban, production and conservation planning in
Castillos Urban Region Biosphere Reserve.
Agriculture and cattle ranching activities are closely linked to
environmental preservation and Castillos’ background. The landscapes in
which Castillos is embedded are cultural landscapes that have been managed
for centuries and with few exceptions they did not affect the essential
structure of the existent ecosystems. This could change if new crops become
economically feasible and they start displacing from the landscape extensive
cattle ranching and other environmentally preferred activities. In fact this is
starting to happen near Castillos’ area of influence where native forest is being
bulldozed out of the sierras and eucalyptus monocultures are replacing it.
In order to avoid this kind of damaging exploitations, alternatives need to
be provided, and appropriate regional planning has to be formulated for the
region. Creating an Urban Region Biosphere Reserve in Castillos’ area of
influence could provide sustenance to such a regulation of activities in the
most ecosystem diverse region in Uruguay. However, protected areas in the
region need to be carefully planned with local population. Objectives need to be
clearly established but flexibility should be a key characteristic of the
management strategy. Despite being the region with more research being
conducted, many actors believe more information is necessary before
embarking into a protected area zoning and strategy. Certainties are hard to
reach when dealing with nature, especially when nature has already been
altered by humans in more ways that could be possibly understood. Therefore,
the region represents an ideal case to practice adaptive management.
Conservation objectives should be very clearly stated, something that has not
been done yet, but experimentation needs to be taken from experimental scale
to management scale, and conservation management should become more
opportunistic –at the beginning location of protected areas might need to be
decided by access to the land, cooperative landowners and other factors not
directly tied to conservation biology. This way conservation efforts in Uruguay
for once will go beyond paper and people will be able to se tangible results,
something that according to the rangers of two local protected areas surprises
and engages visitors. Information on where to locate protected areas for
different objectives is already provided by PROBIDES, information on the areas
of preference of Castillenses is included here, now the efforts have to focus on
the management at an appropriate scale of enough protected areas –how
restrictive they are in the use of natural resources needs to be decided in
consultation with the stakeholders.
Castillos could then become not only a centre for nature based tourism
but also the venue for research and conservation oriented operations. This has
had excellent results with an NGO working in Castillos’ area of influence. Casa
Ambiental is a respected and well know environmental NGO working in
Castillos and its rural surroundings. By having their offices in the city they
- 80 were able to establish direct contacts with its citizens, many of which have
engaged in some of the NGO’s ongoing projects. Any conservation effort in the
region would benefit widely from having their workplace in Castillos, this gives
the project a feeling of belonging to the area, and a vast majority of Castillenses
believe Rochenses and local experts should be in charge of managing protected
areas in the region -60% believe Rochenses should be in charge and 34%
believe local experts should be in charge. The location in Castillos would also
help decentralise power from Montevideo and Rocha City, and provide a sense
of a more regionally based proposal.
Having the city as the centre of the proposal will transform the city into a
social core area for the Urban Region Biosphere Reserve. Biodiversity core
areas are designed to protect certain areas, at the same time it is expected that
this areas will then have a positive impact that will spread and benefit its less
protected natural surroundings. A ‘social core area’ around Castillos city will
have a similar effect, it will help transform Castillos into a greener city as we
stated above, but it would also spread its benefits to areas outside the social
core area. Castillos has an important social reservoir to be conserved, and
whatever is done inside the city in terms of improving environmental education
will not remain in the city but will spread all around the area of influence. By
placing special emphasis on both biodiversity core areas and social core areas
the human-nature dualism present in certain conservation strategies will
vanish and the Urban Region Biosphere Reserve can be the stage for a real
integration of humans and nature.
Despite all the benefits of Urban Region Biosphere Reserves outlined
here, there could be associated complications and the precautions outlined by
the Advisory Committee for Biosphere Reserves in 1998 (UNESCO 1998) are
shared by some of the interviewees, specially those whose view of protected
areas is strictly conservationist. One of the specific arguments expressed by the
Committee is shared by an interviewee who warns about the confusion that
would emerge regarding the objectives of protected areas if cities are included.
This is true if one believes protected area to be there for the sole purpose of
preserving nature. However, if protected areas are seen under a different
framework, like the Seville Strategy for example, this “confusion” might not be
so and integrating selected cities into selected protected areas for the creation
of Urban Region Biosphere Reserves might in fact inform about the objectives
of protected areas. This new perception of protected areas in the Castillos’ area
of influence, and particularly in Uruguay, will help overcome the boundary
mentality that has been hard to overcome, and is perhaps the main reason for
the 2003 World Parks Congress’ topic: “Benefits Beyond Boundaries”.
Another complication associated with the integration of cities and
protected areas that a few interviewees mentioned is related to the
management of the protected area. Four important points from the interviews
are highlighted here.
- 81 -
•
•
•
•
Castillos can become “green” without being included in a protected area.
It is harder to manage conflicts generated by conservation strategies
when the managers have to deal with a few landowners than when they
have to deal with the many actors present in the city.
The administrators of the protected area might be influenced by urban
concerns and leave conservation issues in second place.
The managers of protected areas will not have enough political power to
influence decision making related to urban areas.
Some of the opposing voices affirm that the city can become green
without any need for it to be in the protected area. While this might be true,
greening the city in association with a conservation effort will reflect positively
in conservation and will have an important environmental education
component in local and regional citizens, and this in turn will affect citizens’
behaviour in relation to local protected areas. So if you are going to green the
city, why not help protected area managers while doing so? Moreover, the city
can become green without being inside the protected area, but given the
influence that Castillos has in its surrounding, can the protected area achieve
its objectives without a positive interrelation with the city? With the current
support from central government and the lack of resources existent for
protected area management, I believe protected areas in Castillos’ area of
influence will be much better of by building local partnerships than by
depending on the national government to protect its limits.
Management of the protected area might be easier without the
involvement of urban affairs. However, in Castillos’ area of influence land is
almost entirely held in private hands. With a central government in financial
crisis and not compromised with conservation this means that there are no
actual areas to be managed! And in the only two miniature reserves existent
management has certainly not been easy. Of course one cannot discard one
option if it has not been implemented yet, but under the current state of affairs
in Uruguay protected area management might become more successful if it
brings aboard both the pros and cons of urban areas. As stated above, linking
conservation in the region with the greening and improvement of quality of life
in Castillos might collect support from local landowners. Needless to say that
these landowners won’t donate their land for conservation, but if they perceive
a different approach to conservation the momentum for a more collaborative
search for alternatives could arise. As stated below for the case of the palmar,
conversations, discussions and brainstorming opportunities need to be created
in order to get citizens and landowners engaged in the topic. This is clearly a
monumental task, but only by working, networking, lobbying and getting truly
involved in the regional social fabric a manager will be successful in
overturning what has been the reality of conservation in the Castillos’ area of
influence. Finally, even if consensus is achieved among local stakeholders, the
- 82 administrative levels of the central government will present another difficult
challenge. Again, the case of the palmar serves as an example. Conservation
easements were suggested by the local government as an alternative for palmar
conservation, but taxes are collected by the central government. The
bureaucracy of the administrative branches that could have provided an
opportunity to this approach in private lands ended killing the initiative, even
when there is legislation regulating this approach.
The final point related to the concerns showed by the interviewees relates to
the political power that protected area managers will have to influence urban
decisions. The structure of the management board of an Urban Region
Biosphere Reserve is something that will need to be considered by local
stakeholders. When designing the structure of the board every aspect related to
the Urban Region Biosphere Reserve should be considered. This concern seems
to oppose the preoccupation showed by other interviewees regarding urban
concerns leaving aside biological ones. If the objectives of the Castillos Urban
Region Biosphere Reserve are clearly stated and the management board is
adequately designed for the objectives, the political power to influence
decisions in the urban area should be as important as the political power to
influence decisions in the rest of the region. Castillos is a relatively small city,
which makes its management easier to handle. However, the approach taken
by UNESCO seems to focus the attention in big and mega urbanizations.
As we explained in section 1.4 (chapter 1), mega-cities are usually the
stars, or the villains, in the urban sustainability discussion. However, megacities hold a small percentage of the world’s population, and it is in fact small
and medium sized cities that account for the majority of the urban population.
Moreover, as Drakakis-Smith (1995) points out small and medium size cities
present some of the most patent environmental problems in developing
countries. In order to a the same time make cities sustainable and change the
way they relate to their surrounding environment it is crucial to engage citizens
in the planning and implementation of new projects. Medium and small size
cities are important for regional development and conservation strategies and
at the same time constitute a manageable size for participatory approaches to
planning. The suggestion is not that mega urbanizations should be excluded
for any city despite the administrative problems related to its management can
provide participation opportunities at different scales. However, more emphasis
should be placed on small and medium size cities in the planning and
implementation of urban Biosphere Reserves. These cities provide a human
scale in which citizens can still understand their political environment, their
relation with surrounding areas and participate actively in urban and regional
affairs (Bookchin 1995). While other urban biosphere reserve options could be
applicable to mega-cities, the Urban Region Biosphere Reserve is ideal for small
or medium sized cities in which the relation between city and countryside is
not one of dominance and opposition but an open one.
- 83 -
A proposal for the creation of a Castillos Urban Region Biosphere Reserve
would have strong support in Castillos city and Rocha. National, regional and
local government officials see the proposal of including a city in a protected
area as either positive or feasible. The major opposition will come from part of
the conservation community that believes the inclusion of the city will have a
negative impact in the management of the protected area involved. However,
even some of those opposed on those grounds, believe that the proposal would
have a positive educational impact.
The environmental status of Castillos city presented above constitutes at
the same time a problem and an opportunity in relation with this project. The
situation is serious in its relatively small scale, but solutions are quite
straightforward. The opportunity lies in the possibility of producing relatively
rapid change to the situation an influencing attitudes and perspectives existent
towards conservation of biodiversity in the area. One crucial factor for the
successful outcome of the project lies in the ability of its managers to create an
immediate and powerful impact in the city and the region. This is necessary to
overcome the apathy existent in parts of the society due to the characteristics
of past conservation initiatives.
The region has distinctive characteristics that make it an ideal location
for the establishment of an Urban Biosphere Reserve Proposal and the author
will promote incentive, collaborate and work towards the establishment of
Castillos Urban Region Biosphere Reserve if UNESCO decides to continue its
trend towards the integration of human and nature in the MAB programme.
- 84 -
Bibliography
Aberley, Dough (ed.) 1993. Boundaries of Home: Mapping for local
empowerment. New Society Publishers. Gabriola Island.
Adams, Jonathan and McShane, Thomas 1996. The Myth of Wild Africa.
Conservation without illusion. University of California Press.
Alberti, A and Susskind, L 1996. Managing Urban Sustainability: Introduction.
In Environmental Impact Assessment Review16 (4-5): 213-222.
Alberti, M. 1996. Measuring Urban Sustainability. In Environmental Impact
Assessment Review 16: 381-424
Alcorn, Janis 1993. Indigenous Peoples and Conservation. In Conservation
Biology Vol. 7 N. 2.
Alcorn, Janis 1994. Noble Savage or Noble State?: Northern Myths and
Southern Realities in Biodiversity Conservation. In Etnoecologica Vol. 2 N. 3.
Alexandre, A and De Michelis, N 1996. Environment and Energy: Lessons from
the North. In Environmental Impact Assessment Review 16 (4-5): 249-258.
Alsford, S 1999. Introduction to the history of medieval boroughs. In
http://www.trytel.com/~tristan/towns/townint8.html
Anderson, William; Kanaroglou, Pavlos and Miller, Eric 1996. Urban Form,
Energy and the Environment: A Review of Issues, Evidence and Policy. In
Urban Studies 33 (1): 7-35
APN s/f. www.medioambiente.gov.ar/sian/apn
Araujo, O 1892. Geografía Nacional Física, Política y Coreográfica. Imprenta
Artística y Librería, De Dornaleche y Reyes, Montevideo.
Atkinson, A 1992. The urban Bioregion as ‘sustainable development’ paradigm.
In Third World Planning Review 14 (4): 327-354
Bachert, S 1991. Acceptance of national parks and participation of local people
in decision making. In Landscape and Urban Planning. 20: 239-244.
Balkansky, Andrew 1998. Origin and Collapse of Complex Societies in Oaxaca
(Mexico): Evaluating the Era from 1965 to the present. In Journal of World
Prehistory 12 (4): 451-493.
Basiago, A 1996. The search for the sustainable city in 20th century urban
planning. In The environmentalist 16: 135-155.
Basiago, A 1999. Economic, social, and environmental sustainability in
development theory and urban planning practice. In The Environmentalist 19:
145-161
Bassiago, A 1995. Methods of defining ‘sustainability’. In Sustainable
Development 3: 109-119
Batten, David 1998. Transport and Urban Growth in Pre-industrial Europe:
Implications for Archaeology. In Human Ecology 26 (3): 489-516.
Baudry, J and Merriam, H 1988. Connectivity and connectedness: functional
versus structural patterns in landscapes. In Connectivity in Landscape Ecology.
Proceedings of the 2nd International Seminar of the ‘International Association for
Landscape Ecology’. Munster 1987. Ferdinadn Schoningh, Paderborn.
- 85 Beatley, T. 2000. Green Urbanism: Learning from European Cities. Island Press.
Bell, Simon and Morse, Stephen 2001. Breaking through the Glass Ceiling:
who really cares about sustainability indicators? In Local Environment 6 (3):
291-309.
Berkes, Fikret and Folke, Carl (eds.) 2000. Linking Social and Ecological
Systems. Cambridge University Press
Berthold-Bond, Daniel 2000. The Ethics of Place: Reflections of Bioregionalism.
In Environmental Ethics 22: 5-24.
Biehl, Janet 1997. The Murray Bookchin Reader. Cassell, London.
Bissonette, John 1997. Scale Sensitive ecological properties: historical context,
current meaning. In Bissonette, John (ed.) Wildlife and Landscape Ecology:
Effects of Pattern and Scale. Springer-Verlag New York: 3-31.
Bookchin, Murray 1992. Urbanization without cities. The rise and decline of
citizenship. Black Rose Books.
Bookchin, Murray 1995. From Urbanization to Cities. Toward a New Politics of
Citizenship. Cassell, London
Bosshard, Andreas 2000. A methodology and terminology of sustainability
assessment and its perspectives for rural planning. In Agriculture, Ecosystems
and Environment 77: 29-41.
Bottema, S; Entjes-Nieborg, G and Van Zeist, W (eds.) 1990. Man’s Role in the
Shaping of the Eastern Mediterranean Landscape. A.A. Balkema. Rotterdam.
Brandon, Katrina 1997. Policy and practical considerations in land-use
strategies for biodiversity conservation. In Kramer, R; van Schaik, C and
Johnson, J (eds.), Last stand: Protected areas and the defense of tropical
biodiversity: 90-114. Oxford University Press, New York.
Brandon, Katrina and Wells, M 1992. Planning for people and parks: Design
dilemmas. World Development, 20 (4): 557-570.
Breheny, M 1992. Towards sustainable urban development. In Mannion, A and
Bowlby, S (eds.) Environmental issues in the 1990s. John Wiley and Sons,
Sussex, England.
Brown, Lester 1981. Building a Sustainable Society W.W. Norton & Company,
New York.
Brumfield, Elizabeth 1983. Aztec State Making: Ecology, Structure, and the
Origin of the State. In American Anthropologist 85: 261-284.
Brunckhorst, David and Rollings, Nick 1999. Linking Ecological and Social
Functions of Landscapes I. Influencing Resources Governance. In Natural
Areas Journal 19 (1): 57-64.
Burkart, R; Ruiz, D; Marañal, C y Aduea, F 1991. El Sistema Nacional de áreas
Naturales Protegidas de la Republica Argentina. Diagnostico de su Desarrollo
Institucional y Patrimonio Natural. APN, Buenos Aires.
Burke, Peter 1975. Some Reflections on the Pre-industrial City. In Urban
History Yearbook: 13-21.
Burke, Vincent 2000. Landscape Ecology and Species Conservation. In
Landscape Ecology 15: 1-3.
- 86 Buxo I Capdevila, Ramon 1996. Evidence for vines and ancient cultivation from
an urban area, Lattes (Herault), southern France. In Antiquity 70: 393-407.
Caldevilla, Gabriel 1997. Areas Silvestres Protegidas En Uruguay. In Vida
Silvestre, Primer Congreso Nacional sobre Areas Silvestres Protegidas.
Publicacion Especial N 1
Caldevilla, Gabriel and Quintillan, Ana 1996. Areas Naturales Protegidas:
Hacia un Sistema Nacional. In Uruguay Forestal 11: 24-26
Callicott, J. B., and Neslon, M. (eds.) 1998. The Great New Wilderness Debate.
University of Georgia Press
Callicott, J. Baird 1999. Beyond the land ethic: more essays in environmental
philosophy. State University of New York Press, Albany.
Calnek, Edward 1972. Settlement Pattern and Chinampa Agriculture at
Tenochtitlan. In American Antiquity 37 (1): 104-115.
Capello, R., and Camagni, R. 2000. Beyond Optimal City Size: An Evaluation of
Alternative Urban Growth Patterns. In Urban Studies 37: 1479-1496
Carlson, John 1993. Rise and Fall of the City of the Gods. In Archaeology
November/December: 58-69.
Carrere 2001. Monte Indigena: mucho mas que un conjunto de arboles.
Editorial Nordan-Comunidad, Montevideo.
Cespedes, Carlos and Gonzales, Alvaro 1997. El valor de las ASP como
herramientas de conservacion. In Vida Silvestre, Primer Congreso Nacional
sobre Areas Silvestres Protegidas. Publicacion Especial N 1
Chebataroff, J 1971. Condiciones Ecológicas que Influyen en la Distribución de
las Palmeras en Uruguay. Facultad de Humanidades y Ciencias, Departamento
de Geografía, Montevideo.
Chebataroff, J 1974. Palmeras del Uruguay. Montevideo.
CIPFE 1992. Actaas del 1er Congreso Latino Americano de Ecologia Social. 1017 de Diciembre de 1989, Montevideo, Uruguay. CIPFE, Montevideo.
CIPFE and CLAES 1996. Congreso Nacional sobre Areas Silvestres Protegidas.
In Contribuciones en Biologia. 16: 1-16, Montevideo, agosto de 1996.
CIPFE; MFAL and FESUR 1993. Segundo Seminario Taller, Politicas de
Conservacion de Areas Naturales. Montevideo, 15 de Octubre de 1993
Cohen, M 1996. HABITAT II: A critical assessment. In Environmental Impact
Assessment Review 16 (4-5): 429-434.
Colchester, Marcus 1995. Salvando la Naturaleza: Pueblos Indigenas, Areas
Protegidas y Conservacion de la biodiversidad. UNRISD DP 55S
Corcoran, Elizabeth and Wallich, Paul 1991. The Rise and Fall of Cities. In
Scientific American 265 (1-3): 103.
Costanza, Robert and Patten, Bernard 1995. Defining and predicting
sustainability. In Ecological Economics 15: 193-196.
Costanza, Robert; Low, Bobbi; Ostrom, Elinor and Wilson, James (eds.) 2001.
Institutions, ecosystems and sustainability. Lewis Publishers, Boca Raton,
Florida, US.
- 87 Cousillas, Marcelo 1997. Topicos Legales Referentes a ASP. In Vida Silvestre,
Primer Congreso Nacional sobre Areas Silvestres Protegidas. Publicacion
Especial N 1.
Cousins, A and Nagpaul, H 1979. Urban Life. The sociology of cities and urban
society. John Wiley & Sons.
Crenshaw, Edward; Christenson, Matthew and Oakey, Doyle 2000.
Demographic Transition in Ecological Focus. In American Sociological Review
65, June: 371-391.
Cronon, William 1993. Uses of Environmental history. In Environmental history
review Fall 1993: 1-22.
Darier, Eric (ed.) 1999. Discourses of the Environment. Blackwell Publishers
Inc. Malden, USA.
Darlow, Alison 1996. Cultural Policy and Urban Sustainability: making a
missing link? In Planning Practice and Research 11 (3): 291-301.
Deb, Amitaba 1998. Sustainable cities in developing countries. In Building
Research & Information 26 (1): 29-38.
Delfino, L; Denis, V; Nicoli, N y Scarlato, G 2002. Los palmares del este: una
comunidad vegetal amenazada Jardín Botánico, Montevideo.
Denevan, William 1992. The Pristine Myth: Landscape of the Americas in 1492.
In Annals of the Association of American Geographers. 82 (3), 1992: 369-385.
di Castri, Francesco 1997. Editorial: Landscape ecology in a changing
globalized environment. In Landscape Ecology 12 (1): 3-5
Dilks, D 1996. Measuring urban sustainability: Canadian indicators workshop.
Workshop proceedings (june 19-21, 1995).
Donald, Alexander 1990. Bioregionalism: Science or Sensibility. In
Environmental Ethics 12: 161-173.
Douglas, I., and Box, J. 2000. The Changing Relationship Between Cities and
Biosphere Reserves. Report prepared for the Urban Forum
Drakakis-Smith 1995. Third World Cities: Sustainable Urban Development, 1.
In Urban Studies 32: 659-677.
Drakakis-Smith 1996. Third World Cities: Sustainable Urban Development, IIPopulation, Labour and Poverty. In Urban Studies 33: 673-701.
Eames, Edwin and Goode, Judith 1977. Anthropology of the City. Prentice-Hall,
inc, New Jersey, USA.
EIA 1997. Household Characteristics by Urban/Rural Location.
www.eia.doe.gov/emev/consumption.
European Commission 1996. European Sustainable Cities: Report of the Expert
Group on the Urban Environment. European Commission, Brussels,
Luxembourg.
European Foundation for the Improvement of Living and Working Conditions
1995. Intermediate cities in search of sustainability. The research and the Attica
workshop. Lavrion, 4-6 October 1995. Loughlinston House, Shankill, Dublin.
Evia, Gerardo and Gudynas, Eduardo 1999. Un ejercicio de analisis de costos y
oportunidades economicas de un sistema de areas protegidas en Uruguay.
Documentos de Trabajo 47. CLAES, Montevideo.
- 88 Evia, Gerardo and Gudynas, Eduardo 2000. Ecologia del Paisaje en Uruguay:
Aportes para la conservacion de la Diversidad Biologica. Junta de Andalucia,
MVOTMA and AECI. EGONDI, Artes Graficas, Sevilla, Spain
Fall, Patricia; Lines, Lee and Falconer, Steven 1998. Seeds of Civilization:
Bronze Age Rural Economy and Ecology in the Southern Levant. In Annals of
the Association of American Geographers 88(1): 107-125.
Farina, Almo 1993. Editorial Comment: From global to regional landscape
ecology. In Landscape Ecology 8 (3): 153-154.
Fiallo, Elba and Jacobson, Susan 1995. Local Communities and Protected
Areas: Attitudes of Rural Residents Towards Conservation and Machalilla
National Park, Ecuador. In Environmental Conservation Vol. 22 N. 3 Autumn.
Fiebrig, C 1933. Apuntes de una excursión a Castillos, Departamento de
Rocha, Uruguay, en Ostenia, Colección de Trabajos Botánicos 11 de Febrero:
187-192.
Folch, R. 1996. Biodiversity in Urban and Peri-urban Zones. In Castri and
Younes (eds.) Biodiversity, Science and Development: towards a new
partnership. CAB International
Folke, Carl; Jansson, Asa; Larsson, Jonas and Costanza, Robert 1997.
Ecosystem Appropriation by Cities. In Ambio 26 (3), pp. 167-172
Folke, Carl; Pritchard, Lowell; Berkes, Fikret; Colding, Johan and Svedin, Uno
1998. The Problem of Fit between Ecosystems and Institutions. International
Human Dimensions Programme on Global Environmental Change, Bonn,
Germany.
Foreman, Dave 1998. Wilderness Areas for Real. In The Great New Wilderness
Debate. Berkes and Folke (eds.): 408-413. University of Georgia Press.
Forman, Richard 1995. Some general principles of landscape and regional
ecology. In Landscape Ecology 10 (3):133-142.
Frenkel, Stephen 1994. Old Theories in New Places? Environmental
Determinism and Bioregionalism. In Professional Geographer 46 (3): 289-295.
Friedmann, J 2000. The Good City: In Defense of Utopian Thinking. In
International Journal of Urban and Regional Research. 24.
Fustel de Coulange, Numa Demis 1980 (1863). The Ancient City; a study on the
religion, laws, and institutions of Greece and Rome. John Hopkins University
Press, Baltimore, USA.
Ghimire, Krishna 1994. Parks and People: Livelihood Issues in National Parks
Management in Thailand and Madagascar. In Development and Change Vol.25:
195-229
Gibson, R and Tomalty, R 1995. An ecosystem approach to planning for urbancentered regions. In Colloqui 10: 1-10
Girardet, Herbert 1999. Toward Urban Sustainability. In Posey, Darrell 1999
(ed.) Cultural and Spiritual Values of Biodiversity. Intermediate Technology
Publications, London.
Gist, N and Fleis Fava, S 1964. Urban Society. Thomas Y. Crowell Company.
- 89 Gleeson, B., and Low, N. 2000. Cities as consumers of the world’s environment.
In Low., Gleeson., Elander., and Rolf (eds.) Consuming cities. The urban
environment in the global economy after the Rio Declaration. Routledge
Gomez-Pompa, Arturo 1998. La Conservacion de la Biodiversidad en Mexico:
Mitos y Realidades. In Boletin de la Sociedad Botanica de Mexico.
Gomez-Pompa, Arturo and Kaus, Andrea 1992. Taming the Wilderness Myth in
BioScience Vol. 42 N. 4 April
Gomez-Pompa, Arturo and Kaus, Andrea 1999. From prehispanic to future
conservation strategies: Lessons from Mexico. In Proc. Natl. Acad. Science USA
96: 5982-5986.
Goodland, Robert and Rockefeller, Abby 1996. What is Environmental
Sustainability in Sanitation?
http://action.enviroweb.org/sludge/sustainability.html
Goose, Nigel 1982. English pre-industrial urban economies. In Urban Histroy
Yearbook: 24-30.
Graber, David 1995. Resolute Biocentrism: The Dilemma of Wilderness in
National Parks. In Soule, Michael and Lease, Gary (eds.), Reinventing Nature?
Responses to Postmodern Deconstruction. Island Press.
Grantham, George 1997. Espaces Privilegies. Productivite agraire et zones
d’approvisionnement des villes dans l’Europe preindustrielle. In Annales HHS
3: 695-725.
Grillo, R 2000. Plural cities in comparative perspective. In Ethnic and Racial
Studies 23 (6): 957-981.
Gross Espiell, Hector 1997. La proteccion del medio ambiente en el derecho
constitucional. In Reforma Constitucional 1997, Serie Congresos y Conferencias
N 16, Revista Uruguaya de Derecho Constitucional y Politico, Universidad
Catolica, Montevideo
Gudynas, Eduardo 1994. Nuestra Verdadera Riqueza: Una nueva vision de la
conservacion de las areas naturales del Uruguay. CIPFE, MFAL, Editorial
Nordan-Comunidad, Montevideo
Gudynas, Eduardo 1996. Politicas Ambientales en Uruguay: Una mirada desde
el ambientalismo. In Barreiro, J; Gatto, H; Gudynas, E; Honty, G; Leff, E;
Castellano, E and Santandreu, A Democracia y Ecologia. La politica de la
gestion ambiental. Vinten Editor, Montevideo: 36-65
Gudynas, Eduardo 1998. Por que la izquierda no lidera la discusion ambiental?
In Cuadernos de Marcha 138: 34-38. Montevideo
Gudynas, Eduardo 1999. Concepciones de la Naturaleza y Desarrollo en
America Latina. In Persona y Sociedad 13 (1): 101-125.
Gudynas, Eduardo 1999. Municipios y Desarrollo Sustentable. In Temas Clave
N.11. CLAES, Montevideo
Gudynas, Eduardo and Evia, Gerardo 1998. Un ejercicio de analisis sobre el
numero, tamano y representatividad de las areas protegidas en Uruguay.
Documentos de Trabajo 42. CLAES, Montevideo.
- 90 Gudynas, Eduardo and Santandreu, Alain 1999. Balance de la Gestion
Legislativa en Temas Ambientales. Documentos de Trabajo 48. CLAES,
Montevideo.
Habitat 1996. An Urbanizing World: Global Report on Human Settlements, 1996.
Oxford University Press.
HABITAT 2001. Cities in a Globalizing World. Global Report on Human
Settlements. Earthscan, London.
Haines, Valerie 1986. Energy and urban form. A Human Ecological Critique. In
Urban Affairs Quarterly 21 (3): 337-353.
Hardoy, Jorge 1973. Pre-Columbian Cities. Walker Publishing Company, Inc,
US.
Hardoy, Jorge; Mitlin, Diana and Satterthwaite, David (eds.) 2001.
Environmental Problems in an Urbanizing World. Earthscan Publications Ltd,
London
Hardoy, Jorge; Mitlin, Diana and Satterthwaite, David (eds.) 2001.
Environmental Problems in an Urbanizing World. Earthscan Publications Ltd,
London.
Harris, Nigel 1990. Urbanization, Economic Development and Policy in
Developing Countries. In Habitat International 14 (4): 3-42.
Harvey, David 1996. Justice, Nature and the Geography of Difference. Blackwell
Publishers, Oxford, UK.
Harwell, M., Long, J., Bartuska, A., Gentile, J., Harwell, C., Myers, V., Ogden,
J. 1996. Ecosystem Management to Achieve Ecological Sustainability: The Case
of South Florida. In Environmental Management 20: 497-521
Hassan, M; Zakaria, Z and Rahman, R 1998. Managing costs of urban
pollution in Malaysia: The case of solid wastes. In Nederlandse Geografische
Studies 240: 127-147.
Haughton, Graham 1999. Information and participation within environmental
management. In Environment and Urbanization 11 (2).
Haughton, Graham 1999. Searching for the Sustainable City: Competing
Philosophical Rationales and Processes of ‘Ideological Capture’ in Adelaide,
South Australia. In Urban Studies 36 (11)> 1891-1906.
Hawley, A 1971. Urban Society. The Ronald Press Company, New York.
Hearn et al. 2000. Global GIS Database: Central & South American CD-ROM
Hernandez, Orlando; Rawlins, Barbara and Schwartz, Reva 1999. Voluntary
recycling in Quito: factors associated with participation in a pilot programme.
In Environment & Urbanization 11 (2): 145-159.
Heywood, V 1996. The Importance of Urban Environments in Maintaining
Biodiversity. In Castri and Younes (eds.) Biodiversity, Science and Development:
towards a new partnership. CAB International
Higgs, E 1997. What is good ecological restoration? In Conservation Biology Vol.
11 N. 2: 338 - 348
Holmberg, John; Lundqvist, Ulrika; Robert, Karl and Wackernagel, Mathis
1999. International Journal of sustainable Development and World Ecology 6,
pp. 17-33.
- 91 Hough, M 1994. Design with City Nature: An overview of some issues. In Platt,
R; Rowntree, R and Muick, P (eds.) The Ecoogical City: preserving and restoring
urban biodiversity: 41-47.
Hourihan, Kevin 2000. Urban planning in the twentieth century. In Urban
History 27 (3): 384-396.
Hughes, Donald 1998. The Pre-Industrial City as Ecosystem. In Capitalism,
Nature, Socialism 9 (1): 105-110.
ICLEI 2000. Urban Land Management and Global Sustainability.
http://iclei.org/csdcases/csdstudy/csd.htm
ICLEI 2000. Urban Land Management and Global Sustainability.
http://iclei.org/csdcases/csdstudy/csd.htm
Ingonuchi, T., Newman, E., and Paoletto, G. 1999. Cities and the Environment,
towards eco-partnerships. In Ingonuchi, T., Newman, E., and Paoletto, G. (eds.)
Cities and the Environment: new approaches for eco-socities
Instituto de Comunicacion y Desarrollo (ICD) 1993. Medio Ambiente en
Uruguay. Estrategias y Recursos. ICD y Sociedad de Conservacion del Medio
Ambiente. Montevideo.
IUCN 1994. Guidelines for Protected Are Management Categories. IUCN, Gland,
Switzerland and Cambridge, UK.
IUCN 1997. Protected Areas in our modern world: proceedings of a workshop
held as part of the IUCN World Conservation Congress. Montreal, Canada
October 18 & 21, 1996.
IUCN 2000. Ecosystem Management: Lessons from Around the World. A Guide
for Development and Conservation Practitioners. IUCN, Gland, Switzerland
IUCN 2002. What is the World Parks Congress?
http://wcpa.iucn.org/wpc/staging/intro.html
IUCN, European Commission (EC) 1999. Parks for Biodiversity: Policy Guidance
based on experience in ACP countrie s. IUCN, Gland, Switzerland.
IUCN, UNEP AND WWF 1980. Word conservation strategy: Executive summary.
IUCN, Gland, Switzerland.
IUCN, UNEP and WWF 1991. Caring for the Earth, A strategy for Sustainable
Living. Gland Switzerland
IUCN, UNEP AND WWF 1993. Caring for the Earth. A strategy for survival. Reed
International Books, Ltd, London, Great Britain.
IUCN, WRI AND UNEP in consultation with FAO and UNESCO 1992. Global
Biodiversity Strategy: Guidelines for action to save, study and use earth’s biotic
wealth sustainably and equitably. IUCN, WRI and UNEP
IUCN, WRI, CI, WWF-US and WB 1990.Conserving the world’s biological
diversity. Gland, Switzerland and Washington, D.C
IUCN; European Commission (EC) 1999. Parks for Biodiversity: Policy Guidance
based on experience in ACP countrie s. IUCN, Gland, Switzerland
Jacobsen, Judith and Firor, John (eds) 1992. Human impact on the
environment: Ancient roots, current challenges. Westview Press, Inc. Boulder,
USA.
- 92 Jansson, AnnMari and Jansson, Bengt-Owe 1994. Ecosystem properties as a
basis for sustainability. In Jansson, AnnMari (ed.) Investing in natural capital:
Chapter 5. Island Press, Washington DC.
Jindal, R; Harada, H and Shikura, S 1997. Solid Waste Management in some
Asian Countries. In Environmental Systems Reviews 42-43: 1-126.
Joardar, Souro 1998. Carrying Capacities and Standards as Bases Towards
Urban Infrastructure Planning in India: A Case of Urban Water Supply and
Sanitation. In Habitat International 22 (3): 327-337.
Johnston, R; Gregory, D and Smith, D 1994 (eds.). The Dictionary of Human
Geography. Third Edition. Blackwell Publishers Ltd, Oxford, UK.
Jones, D 1991. How urbanization affects energy-use in developing countries. In
Energy Policy September.
Kaika, M and Swyngedouw, E 2000. Fetishizing the modern city: the
phantasmagoria of urban technological networks. In International Journal of
Urban and Regional Research 24 (1): 120-138
Kemf, Elizabeth (ed.) 1993. Indigenous Peoples and Protected Areas. The Law of
Mother Earth. Earthscan Publications Ltd, Londong.
Kendle, Tony and Forbes, Sthephen 1997. Urban Nature Conservation.
Landscape Management in the Urban Countryside. E& FN Spon, London, UK.
Kloor, Keith 2000. Returning America's Forests to their 'Natural' Roots. In
Science Vol. 287 N. 28 January: 573 - 574
Klopatek, Jeffrey and Gardner, Robert (eds.) 1999. Landscape Ecological
Analysis: Issues and Applications. Springer New York, Inc.
Lampard, E 1963. Urbanization and Social Change: on Broadening the Scope
and Relevance of Urban History. In Handlin, O and Burchard, J (eds.) The
Historian and the City: 225-247. The M.I.T Press and Harvard University Press,
US.
Lassila, Kathrin 1999. The new suburbanities. In Amicus Journal 21 (2): 16-21.
Leeds, Anthony 1975. La Sociedad urbana engloba a la rural: especializaciones,
nucleamientos, campo y redes: metateoria, teoria y metodo. In Hardoy, J and
Schaedel, R (eds.) Las ciudades de America Latina y sus areas de influencia a
traves de la historia. Ediciones SIAP, Buenos Aires, Argentina.
Leeds, Anthony 1979. Forms of Urban Integration: “Social Urbanization” in
Comparative Perspective. In Urban Anthropology 8 (3-4): 227-247.
Leeds, Anthony 1985. Cities Perceived. Urban Society in European and American
Thought, 1820-1940. Columbia University Press, Great Britain.
LeGates, Richard and Stout, Frederic (eds.) 1996. The City Reader. Routledge,
London, UK.
Leopold, Aldo 1949. A sand county almanac. Oxford University Press.
Lewis, Damien 1990. Conflict of Interests. In Geographical Magazine,
December.
Lightfoot, Dale and Miller, James 1996. Sijilmassa: The Rise and Fall of a
Walled Oasis in Medieval Morocco. In Annals of the Association of American
Geographers 86 (1): 78-101.
- 93 Ling, O. 1999. Civil society and the urban environment. In Ingonuchi, T.,
Newman, E., and Paoletto, G. (eds.) Cities and the Environment: new
approaches for eco-socities
Lloyd, Peter 1973. The Yoruba: An Urban People? In Southhall, Aidan (ed)
Urban Anthropology: Cross-Cultural Studies of Urbanization. Oxford University
Press, New York.
Lombardi, Patrizia 1998. A Model for Understanding Sustainability in Planning.
http://www.surveying.salford.ac.uk/resources/docs/model.htm
Lombardo, A 1964. Flora arbórea y arborescente del Uruguay. Intendencia
Municipal de Montevideo.
Lucas, Perry 1992. Protected Landscapes: A guide for policy-makers and
planners. Chapman & Hall, London, New York.
Maclaren, V 1996. Developing Indicators Of Urban Sustainability: A Focus On
The Canadian Experience. ICURR Press, Toronto, Canada
Maclaren, V 1996. Developing Indicators Of Urban Sustainability: A Focus On
The Canadian Experience. ICURR Press, Toronto, Canada.
Magarinos de Mello, Mateo 1997. La proteccion del medio ambiente. In Reforma
Constitucional 1997, Serie Congresos y Conferencias N 16, Revista Uruguaya de
Derecho Constitucional y Politico, Universidad Catolica, Montevideo
Makhzoumi, Jala 2000. Landscape ecology as a foundation for landscape
architecture: application in Malta. In Landscape and Urban Planning 50: 167177.
Mantero, Osvaldo and Cabral, Daniela 1995. Derecho Ambiental. Fundacion de
Cultura Universitaria, Montevideo.
Martino, Diego 2000. Reintroducing homo sapiens sapiens into protected areas
and nature. M.A. Thesis, Carleton University, Ottawa.
Martino, Diego 2001. Buffer Zones Around Protected Areas: A Brief Literature
Review. In Electronic Green Journal. Issue 15 December 2001.
Martino, Diego 2001. Medium and small size cities as crucial actors in the quest
for urban sustainability: integrating urban, rural and conservation planning.
Unpublished.
Martino, Diego 2002. Comprehensive examination. Unpublished.
Martino, Diego 2004. Areas Protegidas en la Bioregion Pampa. Chapter in book
to published in: Title to be determined. Eduardo Gudynas (Ed). Coscorroba
Ediciones, Montevideo, Uruguay.
Martinotti, G 1997. The SustainableCity. A Synthesis Report. European
Foundation for the Improvement of Living and Working Conditions. Dublin,
Ireland
Martinotti, G 1997. The SustainableCity. A Synthesis Report. European
Foundation for the Improvement of Living and Working Conditions. Dublin,
Ireland.
Massicotte, Daniel 1999. Dynamique de croissance et de changement a
Montreal de 1792 a 1819: le passage de la ville preindustrielle a la ville
industrielle. In Urban History Review XXVIII (1): 14-30.
- 94 Mazzotti; Morgenstern 1997. A scientific framework for managing urban
natural areas.In Lanscape and Urban Planning. 38: 171-181.
Mc Donnell, J and Pickett, S 1988. Connectivity and the theory of landscape
ecology. In Connectivity in Landscape Ecology. Proceedings of the 2nd
International Seminar of the ‘International Association for Landscape Ecology’.
Munster 1987. Ferdinadn Schoningh, Paderborn.
McClanahan, T 2000. Recovery of a coral reef keystone predator Balistapus
undulatus in East African marine parks en Biological Conservation 94 (2): 191198.
McGinnis, Vincent (ed.) 1999. Bioregionalism. Routledge, London.
McNeely, Jeffrey 1990. The Future of National Parks. In Environment, Jan 01
1990 v 32 N. 1: 16
McTaggart, Donald 1993. Bioregionalism and Regional Geography: Place,
People, and Networks. In The Canadian Geographer 37 (4): 307-319.
Mega, V 1997. European Cities in Search of Sustainability. A Panorama of Urban
Innovations in the European Union. European Foundation for the Improvement
of Living and Working Conditions. Dublin, Ireland.
Mehta, P 1996. Local Agenda 21: Practical Experiences Emerging from the
South. In Environmental Impact Assessment Review 16 (4-5): 309-320.
Merchant, Carolyn 1980. The Death of Nature. Harper, San Francisco.
Miguez, Juan Carlos and Grinwald, Rosana 1997. Turismo y Naturaleza en
Uruguay. In Vida Silvestre, Primer Congreso Nacional sobre Areas Silvestres
Protegidas. Publicacion Especial N 1.
Miles, I., Sullivan, W., and Kuo, F. 1998. Ecological restoration volunteers: the
benefits of participation. In Urban Ecosystems 2: 27-41.
Miles, S., and Paddison, R. 1998. Urban Consumption: An Histographical Note.
In Urban Studies 35: 815-823
Mills, Stephanie 1991. Standing in the places we live. In E Magazine
September-October: 40-56.
Mittler, D 1999. Environmental Space and Barriers to Local Sustainability:
evidence from Edinburgh, Scotland. In Local Environment 4 (3): 353-365.
Morello, J; Buzai, G; Baxendale, C; Rodriguez, A; Matteucci, S; Godagnone, R
and Casas, R 2000. Urbanization and the consumption of fertile land and other
ecological changes: The case of Buenos Aires. In Environment and Urbanization
12 (2): 119-131
Moss, Michael 2000. Interdisciplinarity, landscape ecology and the
Transformation of Agricultural Landscapes. In Landscape Ecology 15: 303-311
Moss, Michael and Milne, Robert 1998. Biophysical processes and bioregional
planning: The Niagara Escarpment of southern Ontario, Canada. In Landscape
and Urban Planning 40: 251-268.
Mumford, Lewis 1940. The Culture of Cities. Secker & Warburg, London.
Mumford, Lewis 1961. The City in History. Harcourt, Brace & World, Inc, New
York.
Murphy, Pat 2000. Urban Governance for More Sustainable Cities. In European
Environment 10: 239-246.
- 95 National Science Foundation 2000. Towards a Comprehensive Geographical
Perspective on Urban Sustainability
Naveh, Z 1994. From Biodiversity to Ecodivesity: A Landscape-Ecology
Approach to Conservation and Restoration. In Restoration Ecology 2 (3): 180189.
Naveh, Zev 2000. What is holistic landscape ecology? A conceptual
introduction. In Landscape and Urban Planning 50 (1-3): 7-26.
Naveh, Zev and Lieberman, Arthur 1994. Landscape Ecology: theory and
application. Springer-Velag. New York
Nebel, Juan Pablo 1997. Bosque Nativo. Gestion de Conservacion. In Uruguay
Forestal 7 (15): 4-7.
Neumann, Roderick 1998. Impossing Wilderness. UC Press.
Neumann, Roderick. 1997. Primitive Ideas: Protected Area Buffer Zones and
the Politics of Land in Africa. In Development and Change Vol. 28:559-582
Nijkamp, P and Pepping, G 1998. A Meta-analytical evaluation of sustainable
city initiatives. In Urban Studies 35 (9): 1481-1500
Oelschlaeger, Max (ed.) 1995. Postmodern Environmental Ethics. State
University of New York.
Olazabal, Alvaro; Falcon, Cesar; Barrios, Antonio; Barboza, Carlos and De
Cuadro, Fabian n/d. Canadas de la Ciudad de Castillos: Bases para una
discussion. Rocha, Uruguay.
Opdam, P 1988.Populations in Fragmented Landscape. In Connectivity in
Landscape Ecology. Proceedings of the 2nd International Seminar of the
‘International Association for Landscape Ecology’. Munster 1987. Ferdinadn
Schoningh, Paderborn.
Parsons, James 1985. On Bioregionalism and Watershed Consciousness. In
Professional Geographer 37 (1): 1-6.
Peil, M and Sada, P 1984. African Urban Society. John Wiley & Sons, England.
Perdomo, Jesus 1998. San Vicente de Castillos, origenes y fundacion. Biblioteca
Pedro Amonte, Junta Local de Castillos, Uruguay.
Phillis, Yannis and Andriantiatsaholiniaina, Luc 2001. Sustainability: and illdefined concept and its assessment using fuzzy logic. In Ecological Economics
37: 435-456.
Poiani, Karen; Richter, Brian; Anderson, Mark and Richter, Holly 2000.
Biodiversity conservation at multiple scales: functional sites, landscapes, and
networks. In Bioscience 50 (2): 133-146.
Posey, Darrell 1999. Cultural and Spiritual Values of Biodiversity. Intermediate
Technology Publications, London.
Price, B 1978. Cause, Effect, and the Anthropological Study of Urbanism. In
Schaedel, R; Hardoy, J and Scott, Kinzer, N (eds.) Urbanization in the Americas
from its Beginnings to the Present: 51-62. Mouton Publishers, The Hague.
PROBIDES 1996. Aves de la Laguna de Rocha. In Serie: Documentos de Trabajo
N.11. Rocha, Uruguay.
PROBIDES 1999. Plan Director. PROBIDES, Rocha, Uruguay.
- 96 PROBIDES 2000. Isla del Padre (Rio Cebollati): Propuesta de manejo y
recomendaciones para el desarrollo turistico de su entorno. In Serie:
Documentos de Trabajo N.23, Rocha, Uruguay.
Pugh, Cedric 2000. Sustainable cities in developing countries. Earthscan
Publications Ltd, London, UK.
Puig y Nattino, J 1915. La Palma Butia, Contribución al estudio de las plantas
indígenas alimenticias. Talleres Gráficos A. Barreiro y Ramos, Montevideo.
Quigley, Peter 1995. Rethinking Resistance: Environmentalism , Literature and
Poststructural Theory. In Oelschlaeger Postmodern Environmental Ethics. State
University of New York Press.
Quijano, A 1968. The urbanization of Latin American Society. In Hardoy, J (ed.)
1975 Urbanization in Latin America: Approaches and Issues: 109-153. Anchor
Books, New York.
Rapoport, Amos 1990. History and precedent in environmental design. Plenum
Press, NYC.
Redford, Kent and Stearman, Allyn 1993a. Forest-dwelling Native Amazonians
and the Conservation of Biodiversity: Interests in Common or in Collision? In
Conservation Biology Vol. 7 N. 2.
Redford, Kent and Stearman, Allyn 1993b. On Common Ground? Response to
Alcorn. In Conservation Biology Vol. 7 N. 2.
Redman, Charles 1999. Human Impact on Ancient Environments. The
University of Arizona Press. Tucson, USA.
Reduron, J 1996. The Role of Biodiversity in Urban Areas and the Role of Cities
in Biodiversity Conservation. In Castri and Younes (eds.) Biodiversity, Science
and Development: towards a new partnership. CAB International
Rees, William 1994. Pressing Global Limits: Trade as the Appropriation of
Carrying Capacity. In Schrecker, Ted and Dalgleish, Jean (eds.), Growth, Trade
and Enivronmental Values. Westminster Institute for Ethics and Human
Values, London, Ontario
Rees, William 1995. Reducing the Ecological Footprint of Consumption.
Presented to 'The Workshop on Policy Measures for Changing Consumption
Patterns.
Rees, William 1996. Revisiting Carrying Capacity: Area-Based Indicators of
Sustainability. In Population and Environment: A Journal of Interdisciplinary
Studies 17 (3).
Rees, William and Wackernagel, M 1994. Ecological footprints and
appropriated carrying capacity: Measuring the natural capital requirements of
the human economy. In Jansson, A; Hammer, M; Folke, C and Constanza, R
(Eds.). Investing in natural capital: The ecological economics approach to
sustainability, pp. 362-390. Washington, Island Press
Rees, William and Wackernagel, M 1996. Urban Ecological Footprints: Why
Cities Cannot be Sustainable And Why They are the Key to Sustainability. In
Environmental Impact Assessment Review 16 (4-5): 223-248
- 97 Reyes, J. M 1859. Descripción Geográfica del Territorio de la República
Oriental del Uruguay. Establecimiento Tipográfico y Litográfico de Luciano
Mege, Montevideo.
Richardson, N 1996. What is a “Sustainable City”? In Plan Canada September:
34-38.
Rollings, Nick and Brunckhorst, David 1999. Linking Ecological and Social
Funtions of Landscapes: II. Scale and Modeling of Spatial Influence. In Natural
Areas Journal 18: 65-72.
Romieu, I; Weitzenfeld, H and Finkelman, J 1991. Urban air pollution in Latin
America and the Caribbean. In Journal – Air & Waste Management Association
41(9): 1166-1171.
Rosen, Christine and Tarr, Joel 1994. The Importance of an Urban Perspective
in Environmental History. In Journal of Urban History 20 (3): 299-310.
Ross, H; Poungsomlee, A; Punpuing, S and Archavanitkul, K 2000. Integrative
analysis of city systems: Bangkok “Man and the Biosphere” programme study.
In Environment and Urbanization 12 (2): 151-161.
Sale, Kirkpatrick 1985. Dweller in the land: the bioregional vision. Sierra Club
Books. San Francisco.
Sanderson, Jim and Harris, Larry (eds.) 2000. Landscape Ecology: A Top-Down
Approach. Lewis Publishers.
Sant'ana Diegues, Antonio 1996. O Mito Moderno da Naturaleza Intocada.
Editora Hucitec, Sao Paulo.
Santos, M 1999. The Environmental Crisis. Greenwood Press, Westport,
Connecticut, US.
Savage and Kong 1993. Urban constraints, political imperatives: environmental
design in Singapore. In Landscape and Urban Planning 25: 37-52.
Savard; Clergeau; Mennechez 2000. Biodiversity concepts and urban
ecosystems. In Landscapes and Urban Planning 48: 131-142.
Schoonbrodt, R 1996. The Sustainable City. A European Tetralogy. Part II.
European Foundation for the Improvement of Living and Working Conditions.
Dublin, Ireland.
Schreiber, K 1988. Connectivity in Landscape Ecology. In Connectivity in
Landscape Ecology. Proceedings of the 2nd International Seminar of the
‘International Association for Landscape Ecology’. Munster 1987. Ferdinadn
Schoningh, Paderborn.
Shepherd, A and Ortolano, L 1996. Strategic Environmental Assessment for
Sustainable Urban Development. In Environmental Impact Assessment Review
16 (4-5): 363-380
Smith, R and Malty, E N/D. Using the Ecosystem Approach to implement the
CBD. http://www1.rhbnc.ac.uk/rhier/cem/Global_report.doc
Smole, William 1989. Yanoama Horticulture in the Parima Highlands of
Venezuela and Brasil. In Advances in Economic Botany 7: 115-128.
Soemarwoto, Otto 1979. Exploitative city-rural- relationship: a human
ecological problem in economic development in Indonesia. In Oikos 33: 190195.
- 98 Soriano, Alberto with Leon, R; Sala, O; Lavado, R; Deregibus, V; Cauhepe, M;
Scaglia, O; Velazques, C and Lemcoff, J 1992. Rio de la Plata Grasslands. In
Ecosystems of the World Vol 8A: 367-407. Elsevier North-Holand
Sorokin, P and Zimmerman, C 1929. Excerpts from the Principles of Rural and
Urban Sociology. In Cousins, A and Nagpaul, H 1970 Urban Man and Society. A
reader in Urban Sociology. Alfred A Knopf, New York.
Soule, Michael and Lease, Gary (eds.) 1995. Reinventing Nature? Responses to
Postmodern Deconstruction. Island Press.
Soule, Michael and Sanjayan, M 1998. Conservation targets: Do they help? In
Science Vol. 279 March 27.
Soule, Michael and Terborgh, J (eds.) 1999. Continental Conservation. Island
Press.
Spencer, D and Goodall, B 1992. Counterurbanization and Environmental
Quality. In Mannion, A and Bowlby, S (eds.) Environmental issues in the 1990x.
John Wiley and sons, Sussex, England.
Storey, Rebecca 1985. An Estimate of Mortality in a Pre-Columbian Urban
Population. In American Anthropologist 87:519-535.
Stren, Richard; White, Rodney; Whitney, Joseph 1992 (eds.). Sustainable Cities.
Urbanization and the Environment in International Perspective. Westview Press,
Boulder, USA.
Taylor, Pat 2002. Fragmentation and cultural landscapes: tightening the
relationship between human beings and the environment. In Landscape and
Urban Planning 58 (2-4): 93-99.
Thrupp, Sylvia 1961. The Creativity of Cities. In Comparative Studies in Society
and History 14 (1): 53-64.
Tilly, Charles 1974. An Urban World. Little, Brown and Company, Boston, USA.
Tisdell, Clement 1995. Issues in Biodiversity Conservation Including the Role of
Local Communities. In Environmental Conservation, Vol. 22 N. 3 Autumn 1995.
Trainer, T 1995. The Conserver Society. Alternatives for Sustainability. Zed
Books, London.
Tucci, Carlos and Clarke, Robin 1998. Environmental Issues in the la Plata
Basin. In Water Resources Development 14 (2): 157-173.
Tweed, Christopher and Jones, Phil 2000. The role of models in arguments
about urban sustainability. In Environmental Impact Assessment Review 20:
277-287.
UNCHS 2001. Cities in a Globalizing World. Global report on human settlements
2001. Earthscan Publications Ltd, London and Sterling.
UNEP 1995. Global Biodiversity Assessment. Cambridge University Press
UNEP, UNDP, WB and WRI 2000. World Resources 2000-2001: People and
Ecosytems, The Fraying Web of Life. Elsevier Science, London
UNEP y WCMC. World Database on Protected Areas. http://quin.uncpwcmc.org/wdbpa
UNESCO 1995. The Seville Strategy for biosphere reserves.
http://www.unesco.org/mab/docs/document.htm
- 99 UNESCO 1998. Application of the Biosphere Reserve Concept to Urban Areas
and Their Hinterlands. Advisory Committee for Biosphere Reserves, Fifth
Meeting 7-10 July, UNESCO HQ.
UNESCO 2000a. The Role of MAB with Regard to Urban and Peri-Urban Issues.
http://unesco.org/mab/mabicc/2000/eng/urban.htm
UNESCO 2000b. MAB ad hoc Working Group to Explore the Application of the
Biosphere Reserve Concept to Urban Areas and their Hinterlands.
http://unesco.org/mab/urban/bradvdoc.pdf.
UNESCO 2003. Urban Biosphere Reserves in the context of the Statutory
Framework and the Seville Strategy for the World Network of Biosphere
Reserves.
Unknown author. Palmeras en Uruguay, en Selección de Temas Agropecuarios.
Urban, Dean; O’Neill, Robert and Shygart, Herman 1987. Landscape Ecology.
In Bioscience 37 (2): 119-127.
Van den Bergh, Jeroen and Verbruggen, Harmen 1999. Spatial sustainability,
trade and indicators: an evaluation of the 'ecological footprint'. In Ecological
Economics 29, pp. 61-72.
van Selm, A 1988. Ecological infrastructure: a conceptual framework for
designing habitat networks. In Connectivity in Landscape Ecology. Proceedings
of the 2nd International Seminar of the ‘International Association for Landscape
Ecology’. Munster 1987. Ferdinadn Schoningh, Paderborn.
Vance, James 1971. Land assignment in the pre-capitalist, capitalist, and
postcapitalist city. In Economic Geography 47 (2): 101-120.
Vandergeest, Peter 1996. Property rights in protected areas: obstacles to
community involvement as a solution in Thailand. In Environmental
Conservation 23 (3): 259-268.
Vida, G. 1996. General Considerations on the Biodiversity of Urban and Periurban Environments. In Castri and Younes (eds.) Biodiversity, Science and
Development: towards a new partnership. CAB International
Wacker, C; Viaro, A and Wolf, M 1999. Partnerships of urban environmental
management: the roles of urban authorities, researchers and civil society. In
Environment and Urbanization 11 (2).
Wackernagel, Mathis and Yount, David 1998. The Ecological Footprint: An
Indicator of Progress Toward Regional Sustainability. In Environmental
Monitoring and Assessment 51, pp. 511-529.
Wackernagel, Mathis; Lewan, Lillemor and Borgstrom Carina 1999. Evaluating
the Use of Natural Capital with the Ecological Footprint. In Ambio 28. (7), pp.
604-612.
Wadland, John and Gibson, Anna 1997. Bioregionalism: Interdisciplinarity in
Theory and Practice. In Arachne 4 (2): 43-65.
Waelkens, Marc 1995. Rise and Fall of Sagalassos. In Archaeology May-June:
28-34.
Waelkens, Marc; Paulissen, Etienne; Vermoere, Marleen; Degryse, Patrick;
Celis, David; Kristof, Schroyen; De Cupere, Bea; Librecht, Ireen; Nackaerts,
Kris; Vanhaverbeke, Hannelore; Viaene, Willy; Muchez, Philippe; Ottenburgs,
- 100 Raoul; Deckers, Seppe; Van Neer, Wim; Smets, Erik; Govers, Gerard;
Verstraeten, Gert; Steegen, Anna; Cauwenberhs, Kris 1999. Man and
environment in the territory of Sagalassos, a classical city in SW Turkey. In
Quaternary Science Reviews 18: 697-709.
Weatherley, A 1991. Self-sustainable societies and a sustainable global nexus
of societies. In Burkhardt, H and Vanderburg, W (eds.) Preparing for a
sustainable society. Proceedings of the 1991 symposium on technology and
society: 25-32. IEEE, Toronto, Canada.
Weiskel, Timothy 1991. Urbanization: A doomed experiment? In Ecodecision
December: 16-21.
Wells, M and Brandon, K 1992. People and Parks: Linking protected area
management with local communities. World Bank, WWF, US Agency for
International Development. Washington DC.
White, R and Whitney, J 1992. Cities and the Environment: An Overview. In
Stren, R; White, R and Whitney, J (eds.) Sustainable cities: urbanization and the
environment in international perspective: 8-52.
Whited; Galatowitsch; Tester; Schik; Lehtinen; Husveth 2000. The importance
of regional factors in predicting effective conservation. Planning strategies for
wetland bird communities in agricultural and urban landscapes. In Landscape
and Urban Planning 49.
Whithers, Mark and Meentemeyer, Vernon 1999. Concepts of Scale in
Landscape Ecology. In Klopatek, Jeffrey and Gardner, Robert (eds.) Landscape
Ecological analysis: issues and applications. Springer-Verlag New York, Inc:
205-252.
Wiens, John 1999. The Science and Practice of Landscape Ecology. In
Klopatek, Jeffrey and Gardner, Robert (eds.) Landscape Ecological analysis:
issues and applications. Springer-Verlag New York, Inc: 371-383
Wild, Robert and Mutebi, Jackson 1997. Bwindi Impenetrable Forest, Uganda:
Conservation through collaborative management. In Nature and Resources V.33
N.3-4
Wirth, L 1938. Urbanism as a way of life. In Hatt, P and Reiss, A 1957 Cities
and Society. The revised reader in Urban Sociology. The Free Press, New York.
Wood, P 2000. Biodiversity and Democracy: Rethinking Society and Nature. UBC
Press, Vancouver.
Young, Robert 1997. The ecological Origins of Cities. In Colloqui: 3-8
- 101 Appendices
The appendices included below are intended to inform the reader on
other circumstances related to the project, but mainly they are included to
provide information that could prove valuable at the time of implementing any
of the author’s suggestions.
List of Appendices
Appendix A: Survey
Appendix B: Survey results
Appendix C: Results of Landscape Perception Study
Appendix D: Methodology for Landscape Perception Study
Appendix E: Maps of Priority Conservation Areas
Appendix F: Dump pictures and extra information
Appendix G: Uruguay and the Environment
- 102 Appendix A
Survey
A copy of the survey is included in this section. It is provided in its original
language (Spanish) and appendix B provides a translated version for each question.
The survey was conducted during the month of August 2003 in the City of
Castillos with help from the Grupo de Jovenes de Casa Ambiental, the youth group
of a local NGO.
Due to lack of time and resources it was impossible to conduct a totally
random sampling. However, instructions were given to the interviewers to try to
ensure a sample as random as possible given the circumstances:
•
•
•
•
•
•
The sample consisted on 350 respondents, which constitutes approximately
5% of the population of Castillos according to the last Census.
The city was divided into different quadrants and each quadrant was
assigned a number of surveys proportional to the density in the quadrant.
Interviewers were asked not to concentrate surveys in one block, but to
spread them as evenly as possible in the assigned area.
Surveys were conducted every day of the week, at different times of the day,
and included houses and businesses when business owner was present –
many businesses have the houses located at the back.
A stratified sample was taken from an education center to ensure
representation of ages 15 to 21.
No stratified sample was taken to ensure representation of people whose
infancy was spent in the coastal area. This oversight restricted the use of
chi-square tests in one important variable.
Interviewers were divided into 4 different groups and received instructions
regarding, sampling, how to reduce bias, and other basic interviewing
techniques. Each interviewer was paid a fixed amount for the number of
surveys conducted, no matter whether they were completed or not.
The survey consists on 40 questions that can be divided into 4 different
groups.
• A group of Nominal questions.
• A group of interval questions with rating from 1 to 10.
• The ranking of photographs.
• The mapping of areas that should be protected in the local surroundings.
- 103 Encuestador:_________________________ Zona:_____
Manzana No_______ Numero de encuesta:_____
Edad:______ Sexo:______
Número de integrantes de su hogar______
Entrada mensual aproximada para el grupo familiar______
Ocupación:________________________
Educación: A) Primaria B) Secundaria C) Terciaria
1)
Dónde paso su infancia?
A. Medio Rural
B. Urbano
C. Costa
D. Montevideo o Capital Departamental
2)
En los últimos años vivió/vive en el medio rural?
A. No
B. 1 año
C. Entre 1 año y 7 años
D. Mas de 7 años
3)
Las áreas protegidas son áreas destinadas a la protección de la naturaleza. En estas
áreas por lo general no se permiten las producciones humanas (Ej. Ganadería) y cuando se
permiten es con restricciones. Algunos ejemplos locales son El Potrerillo, El Monte de
Ombues o Don Bosco. Visito algún área protegida en Uruguay en los dos últimos años?
A. Una vez. Cual?__________
B. Dos o más áreas diferentes. Mencione una___________
C. Ninguna
4)
Tener áreas protegidas en Rocha es
A. Muy malo
B. Malo
- 104 C. Bueno
D. Muy Bueno
5)
Las áreas protegidas en las que el ser humano no puede ingresar bajo ningún concepto
son el mejor método para proteger la naturaleza. Esta usted:
A. Totalmente en desacuerdo
B. Parcialmente de acuerdo
C. Totalmente de acuerdo
D. No opina
6)
Las áreas protegidas favorecen el desarrollo local en la zona de Castillos. Esta usted:
A. Totalmente en desacuerdo
B. Parcialmente de acuerdo
C. Totalmente de acuerdo
D. No opina
7)
Quien se procupa mas por la naturaleza en Rocha
A. Los técnicos
B. Los Rochenses
C. Los extranjeros
D. Los partidos políticos
8)
En los dos últimos años, visito las lagunas Negra y/o Castillos
A. Una vez
B. Dos a cuatro veces
C. Mas de cuatro veces
D. Nunca
9)
En una escala de 1 a 10 (1 poco importante, 10 extremadamente importante), cuan
importante es para usted el proteger estas lagunas de los usos humanos?
1 2 3 4 5 6 7 8 9 10
---------------------------------------10)
En una escala de 1 a 10, cuan importante es proteger de los usos humanos los bañados
que rodean las lagunas y la zona de Castillos?
- 105 -
1 2 3 4 5 6 7 8 9 10
----------------------------------------11)
En una escala de 1 a 10, cuan importante es para usted el proteger de los usos humanos la
fauna y flora que rodean estas lagunas y la zona de Castillos?
1 2 3 4 5 6 7 8 9 10
12)
En una escala de 1 a 10, cuan importante es para usted el proteger de los usos humanos
los palmares situados en la zona de estas lagunas y de la zona de Castillos?
1 2 3 4 5 6 7 8 9 10
-----------------------------------------13)
En una escala de 1 a 10, cuan importante es para usted el proteger de los usos humanos
las praderas que rodean estas lagunas y la zona de Castillos?
1 2 3 4 5 6 7 8 9 10
-------------------------------------------14)
En una escala de 1 a 10 (1 no están en peligro 10 están muy en peligro), cuan en peligro
están estas lagunas?
1 2 3 4 5 6 7 8 9 10
------------------------------------------15)
En una escala de 1 a 10, cuan en peligro están los bañados que de la zona de las lagunas y
de la zona de Castillos?
1 2 3 4 5 6 7 8 9 10
------------------------------------------16)
En una escala de 1 a 10, cuan en peligro están la fauna y flora que rodean estas lagunas y
la zona de Castillos?
1 2 3 4 5 6 7 8 9 10
------------------------------------------17)
En una escala de 1 a 10, cuan en peligro están los palmares situados en la zona de estas
lagunas y la zona de Castillos?
1 2 3 4 5 6 7 8 9 10
------------------------------------------18)
En una escala de 1 a 10, cuan en peligro están las praderas que rodean estas lagunas y la
zona de Castillos?
1 2 3 4 5 6 7 8 9 10
-------------------------------------------
- 106 19)
Hay otros lugares u aspectos más importantes a proteger en los alrededores de Castillos?
Nombre hasta 3 por orden de importancia.
_______________________ / __________________________ / ________________________
20)
Que porcentaje de Rocha debería ser área protegida sin ningún uso humano?
A. 0%
B. hasta un 10%
C. entre un 10 y un 20%
D. entre un 20 y un 50%
21)
Debe prohibirse cazar en un área protegida
A. Totalmente en desacuerdo
B. Parcialmente de acuerdo
C. Totalmente de acuerdo
D. No opina
22)
Debe prohibirse pescar en un área protegida
A. Totalmente en desacuerdo
B. Parcialmente de acuerdo
C. Totalmente de acuerdo
D. No opina
EN ESTAS 4 PREGUNTAS DIGAME LO PRIMERO QUE LE VENGA A
LA MENTE
23)
Cuál es el lugar más natural de Rocha? _________________________________
24)
Cuál es el lugar más útil de Rocha? ____________________________________
25)
Cuál es el lugar más feo de Rocha? _____________________________________
26)
Cuál es el lugar más hermoso de Rocha? _________________________________
27)
La actividad agropecuaria en Rocha es perjudicial para el medio ambiente. Esta usted
A. Totalmente en desacuerdo
B. Parcialmente de acuerdo
C. Totalmente de acuerdo
D. No opina
- 107 28)
Castillos merece el titulo de “Capital del Medio Ambiente”
A. Totalmente en desacuerdo
B. Si, pero debe mejorar
C. Totalmente de acuerdo
D. No opina
29)
Debería prohibirse la caza alrededor de Castillos y de las lagunas Negra y Castillos
A. Totalmente en desacuerdo
B. Parcialmente de acuerdo
C. Totalmente de acuerdo
D. No opina
30)
Cual es el principal problema ambiental de la ciudad de Castillos
A. Los plásticos
B. La contaminación de las cañadas
C. El basurero local
D. Otro _________________________________________________
31)
Las ciudades de Rocha son perjudiciales para el medio ambiente. Esta usted
A. Totalmente en desacuerdo
B. Parcialmente de acuerdo
C. Totalmente de acuerdo
D. No opina
32)
El humano y sus actividades como la agropecuaria deben ser parte de las áreas protegidas
A. Siempre
B. Algunas veces
C. Solo en casos excepcionales y con muchas restricciones
D. Nunca
33)
Poner mas áreas protegidas en la zona de Castillos es bueno para la creación de empleos
A. Totalmente en desacuerdo
B. Parcialmente de acuerdo
- 108 C. Totalmente de acuerdo
D. No opina
34)
Estaría dispuesto/a a separar los envases plásticos en su casa a fin de colaborar con que
Castillos sea verdaderamente Capital del Medio Ambiente.
A. No
B. Quizás
C. Sí
D. No opina
35)
Visito alguna vez el basurero de la ciudad de Castillos?
A. No
B. Si hace menos de un año
C. Si hace mas de un año
36)
Aceptaría sacar la basura 2 o 3 veces por semana en lugar de todos los días si eso mejora
la calidad ambiental de Castillos?
A. No
B. Quizás
C. Si
D. No opina
37)
Observa estos paisajes y ordénalos de mas a menos. Cual le parece mas...
UTIL
FRAGIL
NATURAL
A
____ ____ ____ ____ ____ //// ____ ____ ____ ____ ____ //// ____ ____ ____ ____ ____
UTIL
FRÁGIL
NATURAL
B
____ ____ ____ ____ ____ //// ____ ____ ____ ____ ____ //// ____ ____ ____ ____ ____
38) Cree usted que la distribución de los tachos de basura en Castillos es
- 109 A. Muy buena
B. Hacen falta mas
C. Muy mala
D. Los tachos deben eliminarse
39) La protección de la naturaleza en Rocha debe estar a cargo de
A. Los Políticos
B. Los Técnicos Extranjeros
C. Los Ciudadanos de Rocha
D. Los Técnicos Nacionales
40)
Por favor dibuje en este mapa cuales son las áreas en las que considera mas
importante proteger la naturaleza
- 110 Appendix B
Results of the Survey
The results of the survey are included in this appendix. Question 19 of the
survey is not included because the results were too heterogeneous to provide
any meaningful information and it would take too much space. Question 37 A
and B is part of the Landscape Perception Analysis and is included in appendix
C. Finally, question 40 is the map of areas of preference for conservation
provided in the text and a few more maps are provided in appendix D.
- 111 -
Question 1. Where did you spend your infancy?
Statistics
Infancy location
N
Valid
Missing
Mode
350
0
2
Infancy location
Valid
Coast
Montevideo or Rocha City
Rural area
Urban area
Total
Frequency
18
19
93
220
350
Infancy location
70
63
60
50
40
30
27
Percent
20
10
0
5
5
Coast
Rural area
Montevideo or Rocha
Infancy location
Urban area
Percent
5.1
5.4
26.6
62.9
100.0
Valid Percent
5.1
5.4
26.6
62.9
100.0
Cumulative
Percent
5.1
10.6
37.1
100.0
- 112 -
Question 2. In the last years did you leave in the Rural Area?
Statistics
Recent Years in Rural area
N
Valid
319
Missing
31
Mode
1
Recent Years in Rural area
Valid
Missing
Total
1 year
1 - 7 years
7 years or more
No
Total
System
Frequency
9
14
27
269
319
31
350
Percent
2.6
4.0
7.7
76.9
91.1
8.9
100.0
Recent Years in Rural area
100
84
80
60
40
Percent
20
8
0
1 year
1 - 7 years
Recent Years in Rural area
7 years or more
No
Valid Percent
2.8
4.4
8.5
84.3
100.0
Cumulative
Percent
2.8
7.2
15.7
100.0
- 113 -
Question 3. Protected Areas are areas dedicated to the protection of
nature. In these areas human production are generaly not allowed or
allowed with restrictions. Some local examples are El Potrerillo, El
Monte de Ombues o Don Bosco. Have you visited a protected area in
Uruguay in the last 2 years?
Statistics
Number of visits to PA
N
Valid
Missing
Mode
338
12
2
Number of visits to PA
Valid
Missing
Total
Once
Never
Twice or more
Total
System
Frequency
109
109
120
338
12
350
Percent
31.1
31.1
34.3
96.6
3.4
100.0
Number of visits to PA
40
36
30
32
32
Once
Never
20
Percent
10
0
Number of visits to PA
Twice or more
Valid Percent
32.2
32.2
35.5
100.0
Cumulative
Percent
32.2
64.5
100.0
- 114 -
Question 4. Having protected areas in Rocha is:
Statistics
Having PAs in Rocha is
N
Valid
Missing
Mode
349
1
4
Having PAs in Rocha is
Valid
Missing
Total
Frequency
3
11
140
195
349
1
350
Very bad
Bad
Good
Very good
Total
System
Percent
.9
3.1
40.0
55.7
99.7
.3
100.0
Having PAs in Rocha is
60
56
50
40
40
30
Percent
20
10
3
0
Very bad
Bad
Having PAs in Rocha is
Good
Very good
Valid Percent
.9
3.2
40.1
55.9
100.0
Cumulative
Percent
.9
4.0
44.1
100.0
- 115 -
Question 5. Protected areas in which humans cannot enter under any
circumstances are the best method to protect nature. Are you:
Statistics
PA only for Nature protection
N
Valid
349
Missing
1
Mode
3
PA only for Nature protection
Valid
Missing
Total
Totally disagree
Partially disagree
Totally agree
No opinion
Total
9
Frequency
40
75
188
46
349
1
350
Percent
11.4
21.4
53.7
13.1
99.7
.3
100.0
PA only for Nature protection
60
54
50
40
30
Percent
20
10
21
13
11
0
Totally disagree
Totally agree
Partially disagree
PA only for Nature protection
No opinion
Valid Percent
11.5
21.5
53.9
13.2
100.0
Cumulative
Percent
11.5
33.0
86.8
100.0
- 116 -
Question 6. Protected Areas favour local development in the Castillos
area. Do you:
Statistics
PA enhance Local Dev
N
Valid
Missing
Mode
348
2
3
PA enhance Local Dev
Valid
Missing
Total
Totally agree
Partially agree
No opinion
Totally disagree
Total
System
Frequency
216
65
51
16
348
2
350
Percent
61.7
18.6
14.6
4.6
99.4
.6
100.0
PA enhance Local Dev
70
60
62
50
40
30
20
Percent
19
15
10
5
0
Totally agree
Partially agree
PA enhance Local Dev
No opinion
Totally disagree
Valid Percent
62.1
18.7
14.7
4.6
100.0
Cumulative
Percent
62.1
80.7
95.4
100.0
- 117 -
Question 7. Who cares about nature in Rocha?
Statistics
Who cares about N
N
Valid
Missing
Mode
331
19
2
Who cares about N
Valid
Missing
Total
Political Parties
Foreigners
Experts
Rochenses
Total
System
Frequency
10
50
83
188
331
19
350
Percent
2.9
14.3
23.7
53.7
94.6
5.4
100.0
Who cares about N
60
57
50
40
30
25
Percent
20
15
10
0
3
Political Parties
Who cares about N
Foreigners
Experts
Rochenses
Valid Percent
3.0
15.1
25.1
56.8
100.0
Cumulative
Percent
3.0
18.1
43.2
100.0
- 118 -
Question 8. How many times did you visit lagunas Negra and/or
Castillos in the last two years?
Statistics
How many visits to lagoons?
N
Valid
347
Missing
3
Mode
1
How many visits to lagoons?
Valid
Missing
Total
Once
Two - Four times
More than four times
Never
Total
System
Frequency
105
87
81
74
347
3
350
How many visits to lagoons?
40
30
30
25
23
20
21
Percent
10
0
Once
More than four times
Two - Four times
How many visits to lagoons?
Never
Percent
30.0
24.9
23.1
21.1
99.1
.9
100.0
Valid Percent
30.3
25.1
23.3
21.3
100.0
Cumulative
Percent
30.3
55.3
78.7
100.0
- 119 -
Graph Questions 9 to 13 (Mean)
9.4
9.3
9.2
9.0
9.0
8.8
8.8
8.7
8.6
8.4
8.3
Mean
8.2
8.0
Protecting lagoons
Protecting fauna
Protecting wetlands
Protecting grassland
Protecting palms
Graph Questions 14 to 18 (Mean)
8.0
7.8
7.5
7.0
6.8
6.6
6.5
6.4
Mean
6.0
5.9
5.5
How in danger lagoon
Hos in danger fauna
How in danger wetlan
How in danger grassl
How in danger palms
- 120 -
Question 20. What percentage of Rocha should be PA with no human
use?
Statistics
Percentage of Rocha as PA
N
Valid
337
Missing
13
Mode
4
Percentage of Rocha as PA
Valid
Missing
Total
Frequency
21
68
120
128
337
13
350
0%
Up to 10%
10% to 20%
20% to 50%
Total
System
Percent
6.0
19.4
34.3
36.6
96.3
3.7
100.0
Percentage of Rocha as PA
40
38
36
30
20
20
Percent
10
6
0
0%
Up to 10%
Percentage of Rocha as PA
10% to 20%
20% to 50%
Valid Percent
6.2
20.2
35.6
38.0
100.0
Cumulative
Percent
6.2
26.4
62.0
100.0
- 121 -
Question 21. Hunting should be banned in a Protected Area
Statistics
Hunting should be banned in a PA
N
Valid
347
Missing
3
Mode
3
Hunting should be banned in a PA
Valid
Missing
Total
Totally disagree
Partially agree
Totally agree
No opinion
Total
System
Frequency
24
22
279
22
347
3
350
Percent
6.9
6.3
79.7
6.3
99.1
.9
100.0
Hunting should be banned in a PA
100
80
80
60
40
Percent
20
0
7
6
Totally disagree Partially agree
6
Totally agree
Hunting should be banned in a PA
No opinion
Valid Percent
6.9
6.3
80.4
6.3
100.0
Cumulative
Percent
6.9
13.3
93.7
100.0
- 122 -
Question 22. Fishing should be banned in a Protected Area
Statistics
Fishing should be banned in a PA
N
Valid
347
Missing
3
Mode
3
Fishing should be banned in a PA
Valid
Missing
Total
Totally disagree
Partially agree
Totally agree
No opinion
Total
System
Frequency
64
42
222
19
347
3
350
Percent
18.3
12.0
63.4
5.4
99.1
.9
100.0
Fishing should be banned in a PA
70
64
60
50
40
30
20
Percent
18
10
12
5
0
Totally disagree Partially agree
Totally agree
Fishing should be banned in a PA
No opinion
Valid Percent
18.4
12.1
64.0
5.5
100.0
Cumulative
Percent
18.4
30.5
94.5
100.0
- 123 -
Questions 23 to 26. Most natural, useful, ugly, beautiful place in
Rocha
Statistics
N
Valid
Missing
Most natural
place
350
0
most useful
place
350
0
most ugly
place
350
0
most beautiful
place
350
0
Frequency Table
Most natural place
Valid
Palmares
Don Bosco
Monte Ombues
z
Polonio
Playa
Castillos
Laguna negra
Fortaleza
Lagunas
Agua Dulce
Laguna Castillos
Campo
Punta Diablo
Monte Nativo
Potrerillo
Valizas
Sierra Lechiguana
Barra Valizas
Guardia del Monte
Cerro de los rocha
La Coronilla
Santa teresa
Cueva del tigre
Banado del Indio
Sierras
Cerro Oratorio
Banados
Dunas
Sierra San Miguel
Los moros
Chuy
La Esmeralda
Velazques
Alrededores
Cascadas
Todo
Serrania
Las Dunas
Laguna de Rocha
Mar
Isla del Padre
Isla Negra
La Paloma
Puerto Botes
Cerro la Virgen
Total
Frequency
41
34
33
31
29
23
15
13
12
11
10
9
8
7
7
6
6
6
5
3
3
3
3
3
2
2
2
2
2
2
1
1
1
1
1
1
1
1
1
1
1
1
1
1
1
1
1
350
Percent
11.7
9.7
9.4
8.9
8.3
6.6
4.3
3.7
3.4
3.1
2.9
2.6
2.3
2.0
2.0
1.7
1.7
1.7
1.4
.9
.9
.9
.9
.9
.6
.6
.6
.6
.6
.6
.3
.3
.3
.3
.3
.3
.3
.3
.3
.3
.3
.3
.3
.3
.3
.3
.3
100.0
Valid Percent
11.7
9.7
9.4
8.9
8.3
6.6
4.3
3.7
3.4
3.1
2.9
2.6
2.3
2.0
2.0
1.7
1.7
1.7
1.4
.9
.9
.9
.9
.9
.6
.6
.6
.6
.6
.6
.3
.3
.3
.3
.3
.3
.3
.3
.3
.3
.3
.3
.3
.3
.3
.3
.3
100.0
Cumulative
Percent
11.7
21.4
30.9
39.7
48.0
54.6
58.9
62.6
66.0
69.1
72.0
74.6
76.9
78.9
80.9
82.6
84.3
86.0
87.4
88.3
89.1
90.0
90.9
91.7
92.3
92.9
93.4
94.0
94.6
95.1
95.4
95.7
96.0
96.3
96.6
96.9
97.1
97.4
97.7
98.0
98.3
98.6
98.9
99.1
99.4
99.7
100.0
- 124 most useful place
Valid
Playa
z
Campo
Cabo Polonio
Castillos
Palmares
Lagunas
La Paloma
Agua Dulce
Balnearios
Rocha
Santa Teresa
Ciudades
Fortaleza
Chuy
Todo
Don Bosco
Bosque Ombues
La Coronilla
Monte Ombues
Barra Valizas
Estancias
Pradera
Centros estudiantiles
Hospital
Arenas negras
Estancias turisticas
Rural Areas
Puerto La Paloma
Punta Diablo
Zoo
Montes
Guardia del monte
Valizas
Arroyo Balizas
Fauna y Flora
Costa Cebollati
Laguna Castillos
Mar
Cerro Pensadores
Laguna negra
Laguna de rocha
Banados
Su Casa
Zona Rural
Agricultura
Chacras
represa
La pedrera
Montes Eucaliptus
Oceano
Museos
Campana
Potrerillo
La esmeralda
Cantera India Muerta
Total
Frequency
97
49
45
17
13
10
9
8
7
7
6
5
4
4
4
3
3
3
3
3
2
2
2
2
2
2
2
2
2
2
2
2
2
1
1
1
1
1
1
1
1
1
1
1
1
1
1
1
1
1
1
1
1
1
1
1
1
350
Percent
27.7
14.0
12.9
4.9
3.7
2.9
2.6
2.3
2.0
2.0
1.7
1.4
1.1
1.1
1.1
.9
.9
.9
.9
.9
.6
.6
.6
.6
.6
.6
.6
.6
.6
.6
.6
.6
.6
.3
.3
.3
.3
.3
.3
.3
.3
.3
.3
.3
.3
.3
.3
.3
.3
.3
.3
.3
.3
.3
.3
.3
.3
100.0
Valid Percent
27.7
14.0
12.9
4.9
3.7
2.9
2.6
2.3
2.0
2.0
1.7
1.4
1.1
1.1
1.1
.9
.9
.9
.9
.9
.6
.6
.6
.6
.6
.6
.6
.6
.6
.6
.6
.6
.6
.3
.3
.3
.3
.3
.3
.3
.3
.3
.3
.3
.3
.3
.3
.3
.3
.3
.3
.3
.3
.3
.3
.3
.3
100.0
Cumulative
Percent
27.7
41.7
54.6
59.4
63.1
66.0
68.6
70.9
72.9
74.9
76.6
78.0
79.1
80.3
81.4
82.3
83.1
84.0
84.9
85.7
86.3
86.9
87.4
88.0
88.6
89.1
89.7
90.3
90.9
91.4
92.0
92.6
93.1
93.4
93.7
94.0
94.3
94.6
94.9
95.1
95.4
95.7
96.0
96.3
96.6
96.9
97.1
97.4
97.7
98.0
98.3
98.6
98.9
99.1
99.4
99.7
100.0
- 125 -
most ugly place
Valid
z
Rocha
Dumps
Castillos
Chuy
19 de Abril
Aguas Dulces
Streets Castillos
Velazques
La Coronilla
Ciudades
Campo
Valizas
Barra Valizas
La paloma
Lascano
Plaza Rocha
Cebollati
Cabo Polonio
Banados
Wetlands
18 de julio
Laguna Merin
Frontera
Esmeralda
Canal andreoni
Barrios
Rutas
Muros
Banados india muerta
Cementerio
Total
Frequency
122
48
40
28
18
12
10
8
7
7
7
5
5
4
4
3
3
2
2
2
2
1
1
1
1
1
1
1
1
1
1
1
350
Percent
34.9
13.7
11.4
8.0
5.1
3.4
2.9
2.3
2.0
2.0
2.0
1.4
1.4
1.1
1.1
.9
.9
.6
.6
.6
.6
.3
.3
.3
.3
.3
.3
.3
.3
.3
.3
.3
100.0
Valid Percent
34.9
13.7
11.4
8.0
5.1
3.4
2.9
2.3
2.0
2.0
2.0
1.4
1.4
1.1
1.1
.9
.9
.6
.6
.6
.6
.3
.3
.3
.3
.3
.3
.3
.3
.3
.3
.3
100.0
Cumulative
Percent
34.9
48.6
60.0
68.0
73.1
76.6
79.4
81.7
83.7
85.7
87.7
89.1
90.6
91.7
92.9
93.7
94.6
95.1
95.7
96.3
96.9
97.1
97.4
97.7
98.0
98.3
98.6
98.9
99.1
99.4
99.7
100.0
- 126 -
most beautiful place
Valid
Castillos
z
Playa
Polonio
Punta Diablo
Agua Dulce
Fortaleza
Todo
Santa Teresa
La Paloma
Don Bosco
Palmares
Rocha City
Barra De Valizas
Laguna Negra
Monte ombues
Lagunas
Campo
Alrededores
Zona Castillos
Sierras
La Pedrera
Chuy
Camino del Indio
Plaza
La Coronilla
Paisajes
Represa India Muerta
Banados
Cerro oratorio
Sierra lechiguana
Dunas
Monte Indigena
Puerto
Potrerillo
Laguna
A. Valiza
valizas
Mi casa
Centro
Cerro Verde
Zoo
Total
Frequency
41
38
36
36
29
29
22
13
10
9
9
9
6
6
5
5
5
4
4
4
3
3
2
2
2
2
1
1
1
1
1
1
1
1
1
1
1
1
1
1
1
1
350
Percent
11.7
10.9
10.3
10.3
8.3
8.3
6.3
3.7
2.9
2.6
2.6
2.6
1.7
1.7
1.4
1.4
1.4
1.1
1.1
1.1
.9
.9
.6
.6
.6
.6
.3
.3
.3
.3
.3
.3
.3
.3
.3
.3
.3
.3
.3
.3
.3
.3
100.0
Valid Percent
11.7
10.9
10.3
10.3
8.3
8.3
6.3
3.7
2.9
2.6
2.6
2.6
1.7
1.7
1.4
1.4
1.4
1.1
1.1
1.1
.9
.9
.6
.6
.6
.6
.3
.3
.3
.3
.3
.3
.3
.3
.3
.3
.3
.3
.3
.3
.3
.3
100.0
Cumulative
Percent
11.7
22.6
32.9
43.1
51.4
59.7
66.0
69.7
72.6
75.1
77.7
80.3
82.0
83.7
85.1
86.6
88.0
89.1
90.3
91.4
92.3
93.1
93.7
94.3
94.9
95.4
95.7
96.0
96.3
96.6
96.9
97.1
97.4
97.7
98.0
98.3
98.6
98.9
99.1
99.4
99.7
100.0
- 127 -
Bar Chart
Most natural place
Most natural place
Palmares
Don Bosco
Monte Ombues
z
Polonio
Playa
Castillos
Laguna negra
Fortaleza
Lagunas
Agua Dulce
Laguna Castillos
Campo
Punta Diablo
Monte Nativo
Potrerillo
Valizas
Sierra Lechiguana
Barra Valizas
Guardia del Monte
Cerro de los rocha
La Coronilla
Santa teresa
Cueva del tigre
Banado del Indio
Sierras
1
2
2
2
2
2
2
3
3
3
3
4
8
7
4
9
9
12
10
Cerro Oratorio
Banados
Dunas
Sierra San Miguel
Los moros
Chuy
La Esmeralda
Velazques
Alrededores
Cascadas
Todo
Serrania
Las Dunas
Laguna de Rocha
Mar
Isla del Padre
Isla Negra
La Paloma
Puerto Botes
Cerro la Virgen
0
2
4
6
8
10
12
14
Percent
most useful place
most useful place
Playa
z
Campo
Cabo Polonio
Castillos
Palmares
Lagunas
La Paloma
Agua Dulce
Balnearios
Rocha
Santa Teresa
Ciudades
Fortaleza
Chuy
Todo
Don Bosco
Bosque Ombues
La Coronilla
Monte Ombues
Barra Valizas
Estancias
Pradera
Centros estudiantile
Hospital
3 4
23
13
5
28
14
Arenas negras
Estancias turisticas
Rural Areas
Puerto La Paloma
Punta Diablo
Zoo
Montes
Guardia del monte
Valizas
Arroyo Balizas
Fauna y Flora
Costa Cebollati
Laguna Castillos
Mar
Cerro Pensadores
Laguna negra
Laguna de rocha
Banados
Su Casa
Zona Rural
Agricultura
Chacras
represa
La pedrera
Montes Eucaliptus
Oceano
Museos
Campana
Potrerillo
La esmeralda
Cantera India Muerta
0
Percent
10
20
30
- 128 -
most ugly place
most ugly place
z
Rocha
Dumps
Castillos
Chuy
19 de Abril
Aguas Dulces
Streets Castillos
Velazques
La Coronilla
Ciudades
Campo
Valizas
11
8
5
3
35
14
Barra Valizas
La paloma
Lascano
Plaza Rocha
Cebollati
Cabo Polonio
Banados
Wetlands
18 de julio
Laguna Merin
Frontera
Esmeralda
Canal andreoni
Barrios
Rutas
Muros
Banados india muerta
Cementerio
0
10
20
30
40
Percent
most beautiful place
most beautiful place
Castillos
z
Playa
Polonio
Punta Diablo
Agua Dulce
Fortaleza
Todo
Santa Teresa
La Paloma
Don Bosco
Palmares
Rocha City
Barra De Valizas
Laguna Negra
Monte ombues
Lagunas
Campo
Alrededores
Zona Castillos
Sierras
La Pedrera
Chuy
Camino del Indio
Plaza
La Coronilla
Paisajes
Represa India Muerta
Banados
Cerro oratorio
Sierra lechiguana
Dunas
Monte Indigena
Puerto
Potrerillo
Laguna
A. Valiza
valizas
Mi casa
Centro
Cerro Verde
Zoo
1
1
1
0
1
1
1
2
2
3
3
3
3
2
Percent
8
8
6
4
4
10
10
6
8
11
10
12
12
14
- 129 -
Question 27. "Agropecuaria" activities in Rocha are bad for the
environment.
Statistics
Agri-food production is bad for env
N
Valid
347
Missing
3
Mode
1
Agri-food production is bad for env
Valid
Missing
Total
Totally disagree
Partially agree
Totally agree
No opinion
Total
System
Frequency
125
96
71
55
347
3
350
Percent
35.7
27.4
20.3
15.7
99.1
.9
100.0
Agri-food production is bad for env
40
36
30
28
20
20
16
Percent
10
0
Totally disagree Partially agree
Totally agree
Agri-food production is bad for env
No opinion
Valid Percent
36.0
27.7
20.5
15.9
100.0
Cumulative
Percent
36.0
63.7
84.1
100.0
- 130 -
Question 28. Castillos deserves the "Environmental Capital" title
Statistics
Castillos deserves title
N
Valid
Missing
Mode
348
2
2
Castillos deserves title
Valid
Missing
Total
Totally disagree
Yes, but it has to improve
Totally agree
No opinion
Total
System
Frequency
35
271
30
12
348
2
350
Castillos deserves title
100
80
78
60
Percent
40
20
0
10
9
Totally disagree
Totally agree
Yes, but it has to i
Castillos deserves title
No opinion
Percent
10.0
77.4
8.6
3.4
99.4
.6
100.0
Valid Percent
10.1
77.9
8.6
3.4
100.0
Cumulative
Percent
10.1
87.9
96.6
100.0
- 131 -
Question 29. Hunting should be banned around Castillos and the
Negra and Castillos LAgoon
Statistics
Hunting should be banned around lagoons
N
Valid
348
Missing
2
Mode
3
Hunting should be banned around lagoons
Valid
Missing
Total
Totally disagree
Partially agree
Totally agree
No opinion
Total
System
Frequency
33
73
228
14
348
2
350
Percent
9.4
20.9
65.1
4.0
99.4
.6
100.0
Hunting should be banned around lagoons
70
66
60
50
40
30
Percent
20
21
10
9
4
0
Totally disagree Partially agree
Totally agree
Hunting should be banned around lagoons
No opinion
Valid Percent
9.5
21.0
65.5
4.0
100.0
Cumulative
Percent
9.5
30.5
96.0
100.0
- 132 -
Question 30. Which is the main environmental problem in Castillos
City?
Statistics
Worst env problem in Castillos is
N
Valid
302
Missing
48
Mode
2
Worst env problem in Castillos is
Valid
Missing
Total
Frequency
30
37
111
124
302
48
350
Plastics
Other
Local Dump
Creeks Contamination
Total
System
Percent
8.6
10.6
31.7
35.4
86.3
13.7
100.0
Worst env problem in Castillos is
50
40
41
37
30
Percent
20
10
10
12
0
Plastics
Local Dump
Other
Worst env problem in Castillos is
Creeks Contamination
Valid Percent
9.9
12.3
36.8
41.1
100.0
Cumulative
Percent
9.9
22.2
58.9
100.0
- 133 -
Question 31. Cities in Rocha are bad for the Environment.
Statistics
Rocha cities are bad for env
N
Valid
343
Missing
7
Mode
1
Rocha cities are bad for env
Valid
Missing
Total
Totally disagree
Partially agree
Totally agree
No opinion
Total
System
Frequency
117
108
49
69
343
7
350
Percent
33.4
30.9
14.0
19.7
98.0
2.0
100.0
Rocha cities are bad for env
40
34
30
31
20
20
14
Percent
10
0
Totally disagree Partially agree
Rocha cities are bad for env
Totally agree
No opinion
Valid Percent
34.1
31.5
14.3
20.1
100.0
Cumulative
Percent
34.1
65.6
79.9
100.0
- 134 -
Question 32. Humans and their activities part of PA
Statistics
Humans and agriculture should part of PA
N
Valid
342
Missing
8
Mode
2
Humans and agriculture should part of PA
Valid
Missing
Total
Always
Sometimes
Exceptionally and
with restrictions
Never
Total
System
Frequency
95
129
Percent
27.1
36.9
Valid Percent
27.8
37.7
Cumulative
Percent
27.8
65.5
89
25.4
26.0
91.5
29
342
8
350
8.3
97.7
2.3
100.0
8.5
100.0
100.0
Humans and agriculture should part of PA
40
38
30
28
26
20
Percent
10
8
0
Always
Exceptionally and wi
Sometimes
Humans and agriculture should part of PA
Never
- 135 -
Question 33. More PA in the Castillos area will be good for job
creation.
Statistics
More PA create jobs
N
Valid
Missing
Mode
344
6
3
More PA create jobs
Valid
Missing
Total
Totally disagree
Partially agree
Totally agree
No opinion
Total
System
Frequency
25
64
238
17
344
6
350
Percent
7.1
18.3
68.0
4.9
98.3
1.7
100.0
More PA create jobs
80
69
60
40
Percent
20
19
0
7
Totally disagree Partially agree
More PA create jobs
5
Totally agree
No opinion
Valid Percent
7.3
18.6
69.2
4.9
100.0
Cumulative
Percent
7.3
25.9
95.1
100.0
- 136 -
Question 34. Are you willing to separate plastics in your house to help
Castillos be the Environmental Capital?
Statistics
Would you recycle
N
Valid
Missing
Mode
345
5
3
Would you recycle
Valid
Missing
Total
No
Maybe
Yes
No opinion
Total
System
Frequency
9
32
295
9
345
5
350
Percent
2.6
9.1
84.3
2.6
98.6
1.4
100.0
Would you recycle
100
86
80
60
40
Percent
20
9
0
No
Would you recycle
Maybe
Yes
No opinion
Valid Percent
2.6
9.3
85.5
2.6
100.0
Cumulative
Percent
2.6
11.9
97.4
100.0
- 137 -
Question 35. Have you seen Castillos' dump?
Statistics
Have you seen dump?
N
Valid
Missing
Mode
346
4
2
Have you seen dump?
Valid
Missing
Total
No
Less than a year ago
More than a year ago
4
Total
System
Frequency
108
134
103
1
346
4
350
Have you seen dump?
50
40
39
30
31
30
Percent
20
10
0
No
More than a year ago
Less than a year ago
Have you seen dump?
4
Percent
30.9
38.3
29.4
.3
98.9
1.1
100.0
Valid Percent
31.2
38.7
29.8
.3
100.0
Cumulative
Percent
31.2
69.9
99.7
100.0
- 138 -
Question 36. Would you take the garbage out less times a week if this
improves environmental quality in Castillos?
Statistics
Garbage 2-3 times a week
N
Valid
346
Missing
4
Mode
3
Garbage 2-3 times a week
Valid
Missing
Total
No
Maybe
Yes
No opinion
Total
System
Frequency
33
24
276
13
346
4
350
Percent
9.4
6.9
78.9
3.7
98.9
1.1
100.0
Garbage 2-3 times a week
100
80
80
60
40
Percent
20
0
10
No
7
Maybe
Garbage 2-3 times a week
Yes
No opinion
Valid Percent
9.5
6.9
79.8
3.8
100.0
Cumulative
Percent
9.5
16.5
96.2
100.0
- 139 -
Question 38. You think the garbage cans distribution in Castillos is.
Statistics
Garbage cans in Castillos are
N
Valid
340
Missing
10
Mode
2
Garbage cans in Castillos are
Valid
Missing
Total
Very good
Need more
Very bad
Cans should
be eliminated
Total
System
Frequency
25
253
44
Percent
7.1
72.3
12.6
Valid Percent
7.4
74.4
12.9
Cumulative
Percent
7.4
81.8
94.7
18
5.1
5.3
100.0
340
10
350
97.1
2.9
100.0
100.0
Garbage cans in Castillos are
80
74
60
40
Percent
20
13
0
7
Very good
5
Need more
Garbage cans in Castillos are
Very bad
Cans should be elimi
- 140 -
Who should be in charge of the protection of nature in Rocha?
Statistics
Who should be in charge of protection of N
N
Valid
332
Missing
18
Mode
3
Who should be in charge of protection of N
Valid
Missing
Total
Politicians
Foreign experts
Local experts
Rochenses
Total
System
Frequency
4
16
112
200
332
18
350
Percent
1.1
4.6
32.0
57.1
94.9
5.1
100.0
Who should be in charge of protection of N
70
60
60
50
40
34
30
Percent
20
10
5
0
Politicians
Foreign experts Local experts
Who should be in charge of protection of N
Rochenses
Valid Percent
1.2
4.8
33.7
60.2
100.0
Cumulative
Percent
1.2
6.0
39.8
100.0
- 141 Appendix C
Complete Results of the Landscape Perception Ranking
This appendix includes all the results of the Landscape Perception Ranking.
This study was part of the survey conducted in Castillos and included
approximately 350 respondents. The respondents were shown two sets of
landscapes and asked to rank them according to usefulness, naturalness, and
fragility. By using photographs in the analysis of landscape perception the author
wanted to obtain information on how castillenses relate to the different ecosystems
existent in the surroundings. This information could be valuable when planning
and presenting proposals for future protected areas in Castillos’ area of influence.
The methodology and justification for this type of study is included in appendix D.
- 142 Most FragileSideA
SortedbyPhotographnumber
No
Picture
1 Wetland
2 Wetl. &Capy
3 Wetl. &Catt
4 RicePlant.
5 Grassl. &Cat
Count
Percentage
Rank1 Rank2 Rank1+2 Rank5 Rank4 Rank5+4 Rank1 Rank2 Rank1+2 Rank5 Rank4 Rank5+4
40
123
163
70
34
104
11.4
35.1
46.5
20
9.7
29.7
199
52
251
17
22
39
56.9
14.9
71.8
4.9
6.3
11.2
16
60
76
34
89
123
4.6
17.1
21.7
9.7
25.4
35.1
33
51
84
105
79
184
9.4
14.6
24
30
22.6
52.6
30
31
61
90
93
183
8.6
8.9
17.5
25.7
26.6
52.3
Sortedpor Rank1
No
Picture
2 Wetl. &Capy
1 Wetland
4 RicePlant.
5 Grassl. &Cat
3 Wetl. &Catt
Count
Percentage
Rank1 Rank2 Rank1+2 Rank5 Rank4 Rank5+4 Rank1 Rank2 Rank1+2 Rank5 Rank4 Rank5+4
199
52
251
17
22
39
56.9
14.9
71.8
4.9
6.3
11.2
40
123
163
70
34
104
11.4
35.1
46.5
20
9.7
29.7
33
51
84
105
79
184
9.4
14.6
24
30
22.6
52.6
30
31
61
90
93
183
8.6
8.9
17.5
25.7
26.6
52.3
16
60
76
34
89
123
4.6
17.1
21.7
9.7
25.4
35.1
Sortedpor Rank1 +2
No
Picture
2 Wetl. &Capy
1 Wetland
4 RicePlant.
3 Wetl. &Catt
5 Grassl. &Cat
Count
Percentage
Rank1 Rank2 Rank1+2 Rank5 Rank4 Rank5+4 Rank1 Rank2 Rank1+2 Rank5 Rank4 Rank5+4
199
52
251
17
22
39
56.9
14.9
71.8
4.9
6.3
11.2
40
123
163
70
34
104
11.4
35.1
46.5
20
9.7
29.7
33
51
84
105
79
184
9.4
14.6
24
30
22.6
52.6
16
60
76
34
89
123
4.6
17.1
21.7
9.7
25.4
35.1
30
31
61
90
93
183
8.6
8.9
17.5
25.7
26.6
52.3
Sortedpor Rank5
No
Picture
4 RicePlant.
5 Grassl. &Cat
1 Wetland
3 Wetl. &Catt
2 Wetl. &Capy
Count
Percentage
Rank1 Rank2 Rank1+2 Rank5 Rank4 Rank5+4 Rank1 Rank2 Rank1+2 Rank5 Rank4 Rank5+4
33
51
84
105
79
184
9.4
14.6
24
30
22.6
52.6
30
31
61
90
93
183
8.6
8.9
17.5
25.7
26.6
52.3
40
123
163
70
34
104
11.4
35.1
46.5
20
9.7
29.7
16
60
76
34
89
123
4.6
17.1
21.7
9.7
25.4
35.1
199
52
251
17
22
39
56.9
14.9
71.8
4.9
6.3
11.2
Sortedpor Rank5+4
No
Picture
4 RicePlant.
5 Grassl. &Cat
3 Wetl. &Catt
1 Wetland
2 Wetl. &Capy
Count
Percentage
Rank1 Rank2 Rank1+2 Rank5 Rank4 Rank5+4 Rank1 Rank2 Rank1+2 Rank5 Rank4 Rank5+4
33
51
84
105
79
184
9.4
14.6
24
30
22.6
52.6
30
31
61
90
93
183
8.6
8.9
17.5
25.7
26.6
52.3
16
60
76
34
89
123
4.6
17.1
21.7
9.7
25.4
35.1
40
123
163
70
34
104
11.4
35.1
46.5
20
9.7
29.7
199
52
251
17
22
39
56.9
14.9
71.8
4.9
6.3
11.2
- 143 Most Useful SideB
SortedbyPhotographnumber
No
Picture
1 Wetland
2 Wetl. &Capy
3 Wetl. &Catt
4 RicePlant.
5 Grassl. &Cat
Count
Percentage
Rank1 Rank2 Rank1+2 Rank5 Rank4 Rank5+4 Rank1 Rank2 Rank1+2 Rank5 Rank4 Rank5+4
66
131
197
42
29
71
18.9
37.4
56.3
12
8.3
20.3
177
81
258
9
24
33
50.6
23.1
73.7
2.6
6.9
9.5
23
40
63
29
87
116
6.6
11.4
18
8.3
24.9
33.2
19
35
54
177
55
232
5.4
10
15.4
50.6
15.7
66.3
30
28
58
58
120
178
8.6
8
16.6
16.6
34.3
50.9
Sortedpor Rank1
No
Picture
2 Wetl. &Capy
1 Wetland
5 Grassl. &Cat
3 Wetl. &Catt
4 RicePlant.
Count
Percentage
Rank1 Rank2 Rank1+2 Rank5 Rank4 Rank5+4 Rank1 Rank2 Rank1+2 Rank5 Rank4 Rank5+4
177
81
258
9
24
33
50.6
23.1
73.7
2.6
6.9
9.5
66
131
197
42
29
71
18.9
37.4
56.3
12
8.3
20.3
30
28
58
58
120
178
8.6
8
16.6
16.6
34.3
50.9
23
40
63
29
87
116
6.6
11.4
18
8.3
24.9
33.2
19
35
54
177
55
232
5.4
10
15.4
50.6
15.7
66.3
Sortedpor Rank1 +2
No
Picture
2 Wetl. &Capy
1 Wetland
3 Wetl. &Catt
5 Grassl. &Cat
4 RicePlant.
Count
Percentage
Rank1 Rank2 Rank1+2 Rank5 Rank4 Rank5+4 Rank1 Rank2 Rank1+2 Rank5 Rank4 Rank5+4
177
81
258
9
24
33
50.6
23.1
73.7
2.6
6.9
9.5
66
131
197
42
29
71
18.9
37.4
56.3
12
8.3
20.3
23
40
63
29
87
116
6.6
11.4
18
8.3
24.9
33.2
30
28
58
58
120
178
8.6
8
16.6
16.6
34.3
50.9
19
35
54
177
55
232
5.4
10
15.4
50.6
15.7
66.3
Sortedpor Rank5
No
Picture
4 RicePlant.
5 Grassl. &Cat
1 Wetland
3 Wetl. &Catt
2 Wetl. &Capy
Count
Percentage
Rank1 Rank2 Rank1+2 Rank5 Rank4 Rank5+4 Rank1 Rank2 Rank1+2 Rank5 Rank4 Rank5+4
19
35
54
177
55
232
5.4
10
15.4
50.6
15.7
66.3
30
28
58
58
120
178
8.6
8
16.6
16.6
34.3
50.9
66
131
197
42
29
71
18.9
37.4
56.3
12
8.3
20.3
23
40
63
29
87
116
6.6
11.4
18
8.3
24.9
33.2
177
81
258
9
24
33
50.6
23.1
73.7
2.6
6.9
9.5
Sortedpor Rank5+4
No
Picture
4 RicePlant.
5 Grassl. &Cat
3 Wetl. &Catt
1 Wetland
2 Wetl. &Capy
Count
Percentage
Rank1 Rank2 Rank1+2 Rank5 Rank4 Rank5+4 Rank1 Rank2 Rank1+2 Rank5 Rank4 Rank5+4
19
35
54
177
55
232
5.4
10
15.4
50.6
15.7
66.3
30
28
58
58
120
178
8.6
8
16.6
16.6
34.3
50.9
23
40
63
29
87
116
6.6
11.4
18
8.3
24.9
33.2
66
131
197
42
29
71
18.9
37.4
56.3
12
8.3
20.3
177
81
258
9
24
33
50.6
23.1
73.7
2.6
6.9
9.5
- 144 Most Useful SideA
SortedbyPhotographnumber
No
1
2
3
4
5
Picture
Wetland
Wetl. &Capy
Wetl. &Catt
RicePlant.
Grassl. &Cat
Count
Percentage
Rank1 Rank2 Rank1+2 Rank5 Rank4 Rank5+4 Rank1 Rank2 Rank1+2 Rank5 Rank4 Rank5+4
20
18
38
200
50
250
5.7
5.1
10.8
57.1
14.3
71.4
47
40
87
32
129
161
13.4
11.4
24.8
9.1
36.9
129
32
69
101
24
61
85
9.1
19.7
28.8
6.9
17.4
24.3
99
89
188
33
39
72
28.3
25.4
53.7
9.4
11.1
20.5
120
101
221
28
38
66
34.3
28.9
63.2
8
10.9
18.9
Sortedpor Rank1
No
5
4
2
3
1
Picture
Grassl. &Cat
RicePlant.
Wetl. &Capy
Wetl. &Catt
Wetland
Count
Percentage
Rank1 Rank2 Rank1+2 Rank5 Rank4 Rank5+4 Rank1 Rank2 Rank1+2 Rank5 Rank4 Rank5+4
120
101
221
28
38
66
34.3
28.9
63.2
8
10.9
18.9
99
89
188
33
39
72
28.3
25.4
53.7
9.4
11.1
20.5
47
40
87
32
129
161
13.4
11.4
24.8
9.1
36.9
129
32
69
101
24
61
85
9.1
19.7
28.8
6.9
17.4
24.3
20
18
38
200
50
250
5.7
5.1
10.8
57.1
14.3
71.4
Sortedpor Rank1 +2
No
5
4
3
2
1
Picture
Grassl. &Cat
RicePlant.
Wetl. &Catt
Wetl. &Capy
Wetland
Count
Percentage
Rank1 Rank2 Rank1+2 Rank5 Rank4 Rank5+4 Rank1 Rank2 Rank1+2 Rank5 Rank4 Rank5+4
120
101
221
28
38
66
34.3
28.9
63.2
8
10.9
18.9
99
89
188
33
39
72
28.3
25.4
53.7
9.4
11.1
20.5
32
69
101
24
61
85
9.1
19.7
28.8
6.9
17.4
24.3
47
40
87
32
129
161
13.4
11.4
24.8
9.1
36.9
129
20
18
38
200
50
250
5.7
5.1
10.8
57.1
14.3
71.4
Sortedpor Rank5
No
1
4
2
5
3
Picture
Wetland
RicePlant.
Wetl. &Capy
Grassl. &Cat
Wetl. &Catt
Count
Percentage
Rank1 Rank2 Rank1+2 Rank5 Rank4 Rank5+4 Rank1 Rank2 Rank1+2 Rank5 Rank4 Rank5+4
20
18
38
200
50
250
5.7
5.1
10.8
57.1
14.3
71.4
99
89
188
33
39
72
28.3
25.4
53.7
9.4
11.1
20.5
47
40
87
32
129
161
13.4
11.4
24.8
9.1
36.9
129
120
101
221
28
38
66
34.3
28.9
63.2
8
10.9
18.9
32
69
101
24
61
85
9.1
19.7
28.8
6.9
17.4
24.3
Sortedpor Rank5+4
No
1
2
3
4
5
Picture
Wetland
Wetl. &Capy
Wetl. &Catt
RicePlant.
Grassl. &Cat
Count
Percentage
Rank1 Rank2 Rank1+2 Rank5 Rank4 Rank5+4 Rank1 Rank2 Rank1+2 Rank5 Rank4 Rank5+4
20
18
38
200
50
250
5.7
5.1
10.8
57.1
14.3
71.4
47
40
87
32
129
161
13.4
11.4
24.8
9.1
36.9
129
32
69
101
24
61
85
9.1
19.7
28.8
6.9
17.4
24.3
99
89
188
33
39
72
28.3
25.4
53.7
9.4
11.1
20.5
120
101
221
28
38
66
34.3
28.9
63.2
8
10.9
18.9
- 145 Most FragileSideB
SortedbyPhotographnumber
No
Picture
1 Palmar
2 NativeFore.
3 Wetland
4 Grassland
5 Eucalyptus
Count
Percentage
Rank1 Rank2 Rank1+2 Rank5 Rank4 Rank5+4 Rank1 Rank2 Rank1+2 Rank5 Rank4 Rank5+4
115
75
190
35
33
68
32.9
21.4
54.3
10
9.4
19.4
84
111
195
30
35
65
24
31.7
55.7
8.6
10
18.6
52
62
114
40
62
102
14.9
17.7
32.6
11.4
17.7
29.1
20
26
46
105
121
226
5.7
7.4
13.1
30
34.6
64.6
48
44
92
108
67
175
13.7
12.6
26.3
30.9
19.1
50
Sortedpor Rank1
No
Picture
1 Palmar
2 NativeFore.
3 Wetland
5 Palmar
4 Eucalyptus
Count
Percentage
Rank1 Rank2 Rank1+2 Rank5 Rank4 Rank5+4 Rank1 Rank2 Rank1+2 Rank5 Rank4 Rank5+4
115
75
190
35
33
68
32.9
21.4
54.3
10
9.4
19.4
84
111
195
30
35
65
24
31.7
55.7
8.6
10
18.6
52
62
114
40
62
102
14.9
17.7
32.6
11.4
17.7
29.1
48
44
92
108
67
175
13.7
12.6
26.3
30.9
19.1
50
20
26
46
105
121
226
5.7
7.4
13.1
30
34.6
64.6
Sortedpor Rank1 +2
No
Picture
2 NativeFore.
1 Palmar
3 Wetland
5 Eucalyptus
4 Pradera
Count
Percentage
Rank1 Rank2 Rank1+2 Rank5 Rank4 Rank5+4 Rank1 Rank2 Rank1+2 Rank5 Rank4 Rank5+4
84
111
195
30
35
65
24
31.7
55.7
8.6
10
18.6
115
75
190
35
33
68
32.9
21.4
54.3
10
9.4
19.4
52
62
114
40
62
102
14.9
17.7
32.6
11.4
17.7
29.1
48
44
92
108
67
175
13.7
12.6
26.3
30.9
19.1
50
20
26
46
105
121
226
5.7
7.4
13.1
30
34.6
64.6
Sortedpor Rank5
No
Picture
5 Eucalyptus
4 Pradera
3 Wetland
1 Palmar
2 NativeFore.
Count
Percentage
Rank1 Rank2 Rank1+2 Rank5 Rank4 Rank5+4 Rank1 Rank2 Rank1+2 Rank5 Rank4 Rank5+4
48
44
92
108
67
175
13.7
12.6
26.3
30.9
19.1
50
20
26
46
105
121
226
5.7
7.4
13.1
30
34.6
64.6
52
62
114
40
62
102
14.9
17.7
32.6
11.4
17.7
29.1
115
75
190
35
33
68
32.9
21.4
54.3
10
9.4
19.4
84
111
195
30
35
65
24
31.7
55.7
8.6
10
18.6
Sortedpor Rank5+4
No
Picture
4 Pradera
5 Eucalyptus
3 Wetland
1 Palmar
2 NativeFore.
Count
Percentage
Rank1 Rank2 Rank1+2 Rank5 Rank4 Rank5+4 Rank1 Rank2 Rank1+2 Rank5 Rank4 Rank5+4
20
26
46
105
121
226
5.7
7.4
13.1
30
34.6
64.6
48
44
92
108
67
175
13.7
12.6
26.3
30.9
19.1
50
52
62
114
40
62
102
14.9
17.7
32.6
11.4
17.7
29.1
115
75
190
35
33
68
32.9
21.4
54.3
10
9.4
19.4
84
111
195
30
35
65
24
31.7
55.7
8.6
10
18.6
- 146 Most Natural SideB
SortedbyPhotographnumber
No
Picture
1 Palmar
2 NativeFore.
3 Wetland
4 Grassland
5 Eucalyptus
Count
Percentage
Rank1 Rank2 Rank1+2 Rank5 Rank4 Rank5+4 Rank1 Rank2 Rank1+2 Rank5 Rank4 Rank5+4
139
101
240
10
16
26
39.7
28.9
68.6
2.9
4.6
7.5
106
116
222
19
21
40
30.3
33.1
63.4
5.4
6
11.4
48
50
98
33
42
75
13.7
14.3
28
9.4
12
21.4
13
17
30
60
186
246
3.7
4.9
8.6
17.1
53.1
70.2
13
34
47
196
53
249
3.7
9.7
13.4
56
15.1
71.1
Sortedpor Rank1
No
Picture
1 Palmar
2 NativeFore.
3 Wetland
4 Grassland
5 Eucalyptus
Count
Percentage
Rank1 Rank2 Rank1+2 Rank5 Rank4 Rank5+4 Rank1 Rank2 Rank1+2 Rank5 Rank4 Rank5+4
139
101
240
10
16
26
39.7
28.9
68.6
2.9
4.6
7.5
106
116
222
19
21
40
30.3
33.1
63.4
5.4
6
11.4
48
50
98
33
42
75
13.7
14.3
28
9.4
12
21.4
13
17
30
60
186
246
3.7
4.9
8.6
17.1
53.1
70.2
13
34
47
196
53
249
3.7
9.7
13.4
56
15.1
71.1
Sortedpor Rank1 +2
No
Picture
1 Palmar
2 NativeFore.
3 Wetland
5 Eucalyptus
4 Grassland
Count
Percentage
Rank1 Rank2 Rank1+2 Rank5 Rank4 Rank5+4 Rank1 Rank2 Rank1+2 Rank5 Rank4 Rank5+4
139
101
240
10
16
26
39.7
28.9
68.6
2.9
4.6
7.5
106
116
222
19
21
40
30.3
33.1
63.4
5.4
6
11.4
48
50
98
33
42
75
13.7
14.3
28
9.4
12
21.4
13
34
47
196
53
249
3.7
9.7
13.4
56
15.1
71.1
13
17
30
60
186
246
3.7
4.9
8.6
17.1
53.1
70.2
Sortedpor Rank5
No
Picture
5 Eucalyptus
4 Grassland
3 Wetland
2 NativeFore.
1 Palmar
Count
Percentage
Rank1 Rank2 Rank1+2 Rank5 Rank4 Rank5+4 Rank1 Rank2 Rank1+2 Rank5 Rank4 Rank5+4
13
34
47
196
53
249
3.7
9.7
13.4
56
15.1
71.1
13
17
30
60
186
246
3.7
4.9
8.6
17.1
53.1
70.2
48
50
98
33
42
75
13.7
14.3
28
9.4
12
21.4
106
116
222
19
21
40
30.3
33.1
63.4
5.4
6
11.4
139
101
240
10
16
26
39.7
28.9
68.6
2.9
4.6
7.5
Sortedpor Rank5+4
No
Picture
5 Eucalyptus
4 Grassland
3 Wetland
2 NativeFore.
1 Palmar
Count
Percentage
Rank1 Rank2 Rank1+2 Rank5 Rank4 Rank5+4 Rank1 Rank2 Rank1+2 Rank5 Rank4 Rank5+4
13
34
47
196
53
249
3.7
9.7
13.4
56
15.1
71.1
13
17
30
60
186
246
3.7
4.9
8.6
17.1
53.1
70.2
48
50
98
33
42
75
13.7
14.3
28
9.4
12
21.4
106
116
222
19
21
40
30.3
33.1
63.4
5.4
6
11.4
139
101
240
10
16
26
39.7
28.9
68.6
2.9
4.6
7.5
- 147 Most Useful SideB
SortedbyPhotographnumber
No
Picture
1 Palmar
2 NativeFore.
3 Wetland
4 Grassland
5 Eucalyptus
Count
Percentage
Rank1 Rank2 Rank1+2 Rank5 Rank4 Rank5+4 Rank1 Rank2 Rank1+2 Rank5 Rank4 Rank5+4
57
45
102
48
92
140
16.3
12.9
29.2
13.7
26.3
40
26
62
88
30
80
110
7.4
17.8
25.2
8.6
22.9
31.5
15
30
45
160
60
220
4.3
8.6
12.9
45.7
17.1
62.8
76
93
169
37
62
99
21.7
26.6
48.3
10.6
17.7
28.3
144
86
230
42
23
65
41.1
24.6
65.7
12
6.6
18.6
Sortedpor Rank1
No
Picture
5 Eucalyptus
4 Grassland
1 Palmar
2 NativeFore.
3 Wetland
Count
Percentage
Rank1 Rank2 Rank1+2 Rank5 Rank4 Rank5+4 Rank1 Rank2 Rank1+2 Rank5 Rank4 Rank5+4
144
86
230
42
23
65
41.1
24.6
65.7
12
6.6
18.6
76
93
169
37
62
99
21.7
26.6
48.3
10.6
17.7
28.3
57
45
102
48
92
140
16.3
12.9
29.2
13.7
26.3
40
26
62
88
30
80
110
7.4
17.8
25.2
8.6
22.9
31.5
15
30
45
160
60
220
4.3
8.6
12.9
45.7
17.1
62.8
Sortedpor Rank1 +2
No
Picture
5 Eucalyptus
4 Grassland
1 Palmar
2 NativeFore.
3 Wetland
Count
Percentage
Rank1 Rank2 Rank1+2 Rank5 Rank4 Rank5+4 Rank1 Rank2 Rank1+2 Rank5 Rank4 Rank5+4
144
86
230
42
23
65
41.1
24.6
65.7
12
6.6
18.6
76
93
169
37
62
99
21.7
26.6
48.3
10.6
17.7
28.3
57
45
102
48
92
140
16.3
12.9
29.2
13.7
26.3
40
26
62
88
30
80
110
7.4
17.8
25.2
8.6
22.9
31.5
15
30
45
160
60
220
4.3
8.6
12.9
45.7
17.1
62.8
Sortedpor Rank5
No
Picture
3 Wetland
1 Palmar
5 Eucalyptus
4 Grassland
2 NativeFore.
Count
Percentage
Rank1 Rank2 Rank1+2 Rank5 Rank4 Rank5+4 Rank1 Rank2 Rank1+2 Rank5 Rank4 Rank5+4
15
30
45
160
60
220
4.3
8.6
12.9
45.7
17.1
62.8
57
45
102
48
92
140
16.3
12.9
29.2
13.7
26.3
40
144
86
230
42
23
65
41.1
24.6
65.7
12
6.6
18.6
76
93
169
37
62
99
21.7
26.6
48.3
10.6
17.7
28.3
26
62
88
30
80
110
7.4
17.8
25.2
8.6
22.9
31.5
Sortedpor Rank5+4
No
Picture
3 Wetland
1 Palmar
2 NativeFore.
4 Grassland
5 Eucalyptus
Count
Percentage
Rank1 Rank2 Rank1+2 Rank5 Rank4 Rank5+4 Rank1 Rank2 Rank1+2 Rank5 Rank4 Rank5+4
15
30
45
160
60
220
4.3
8.6
12.9
45.7
17.1
62.8
57
45
102
48
92
140
16.3
12.9
29.2
13.7
26.3
40
26
62
88
30
80
110
7.4
17.8
25.2
8.6
22.9
31.5
76
93
169
37
62
99
21.7
26.6
48.3
10.6
17.7
28.3
144
86
230
42
23
65
41.1
24.6
65.7
12
6.6
18.6
- 148 Appendix D
Methodology for Landscape Perception Section
Included in the survey were two sets (A and B) of 5 color photographs,
which were presented to every participant, who was asked to rank the
photographs. This thesis is based on understanding local people’s perception of
Nature and PA. In order to do so I considered necessary, and valid (Seole 1998;
Feyerabend 1993), to use a wide range of methods that go from “experiencing”
the local environment to semi-structured interviews and questionnaires. The
following quote from Scott (2002: 272) resumes the reasons for including this
type of study in the survey.
“…perception does not depend just on the physical landscape
components, but also on the values, past experiences and socicultural conditioning of the observer. Landscape responses are
therefore viewed as a product of the interaction of people with the
physical and cultural environments at particular times”
Lothian, in his study on the perceptions of beauty, distinguishes between
two views of landscape, which he calls the “objectivist and subjectivist
paradigms” (1999: 178). The objectivist will argue that beauty is in the
landscape, while the subjectivist will judge beauty “from the interpretation by
the mind behind the eyes” (ibid.). My study follows the subjectivist paradigm in
which “landscape provides the means of understanding the cognition,
perception and preferences of human observers” (ibid.). In my case,
respondents were not asked to judge beauty or preference, but certain qualities
of the landscape –naturalness, fragility and usefulness- all of which could
clearly not be studied under the objectivist paradigm.
Except for two photographs, the rest were taken by me at the beginning
of my field-work (end of May 2003). All the photographs (except the rice pad)
were taken on the same cloudy day and when possible the same amount of sky
(overcast) was shown. The sets of photographs included the following scenes:
Set A
1. Wetland with little green
coverage
2. Wetland with capybaras
3. Wetland with cattle grazing
4. Rice pad
5. Grassland with cattle
Set B
1. Palm tree landscape
2. Native forest landscape
3. Wetland with plant coverage
landscape
4. Grassland landscape
5. Eucaliptus
monocolture
landscape
- 149 -
Set A was composed almost entirely by wetland scenes. Wetlands are a very
large ecosystem in the area and the center of discussion, conflicts, and
problems. I expected the analysis of different scenes from this particular
landscape would provide some insights on to how Castillenses perceive the
different aspects of wetlands. In addition, the other characteristic and large
ecosystem of the area (grassland) was included in this set (with one
photograph) to observe a comparison between them. The inclusion of cattle in
the scene was intentional and the purpose was to have the opportunity to
compare not only wetland and grassland perceptions but also two different
possible uses of this ecosystem. Capybaras are a source of food and income for
some Castillenses and I wanted to analyse which sectors, if any, would
consider the wetlands with capybaras as more useful than the wetlands with
cattle. Cattle ranching is a major source of foreign currency for the country and
an important activity in the area. However, Castillos seems to be in a transition
from a ‘rural services’ society to a possible ‘tourism services’ society and cattle
ranching does not require much labour, so “cattle ranching” scenes were
included in both sets to assess opinions of different sectors of Castillos’ society
towards this activity. At the same time, having wetlands with capybaras and
wetlands with no visible fauna would help assess the importance of these
mammals for the local population, and compare it with the importance of cattle
ranching and rice production.
Set B was composed of 5 different characteristic landscapes from the
area (for a description of regional and national landscapes of Uruguay see
Gudynas and Evia 2000). No animals were included in this set, all pictures
were taken by me in the same season and all but one (eucalyptus plantation)
show the same amount of overcast sky. It is important to note that pictures
were taken on the same season because Brown and Daniel (1995) have
reported that seasonality can have an effect in the preference for a landscape.
At the same time, the amount of sky and whether conditions were identical so
as to avoid idiosyncratic aspects to affect the ranking. (Kaplan and Kaplan
1989)
Although wetlands are composed by water, scenes with more striking
local views of water, like lakes, rivers or the ocean, were not included because
there is a general preference -in different cultural backgrounds- for land cover
types with water (Benayas del Alamo 1994; Kaplan et al 1989), in addition to
this, “Daniel and Ittelson (1981) point out that responses to very diverse
environments reflect stereotypical reactions to the symbolic environment rather
than a perceptual response based on specific landscape characteristics” (Vining
and Stevens 1986: 175). Including lakes in the sets would have brought up a
whole new set of issues that are being addressed in other sections of the
survey.
- 150 The use of photographs to evaluate landscape perceptions has been
applied in landscape planning and environmental psychology studies for more
than 30 years (Hagerhall 2001; Coeterier 1983; Kaplan and Kaplan 1989a;
Kaplan and Kaplan 1989b; Kaplan et al. 1989; Ryan 2002; Shuttleworth 1980;
Williams and Cary 2002). Moreover, psychology and geography share a long
history of collaboration (Kitchin et al. 1997). A crucial question the research
has to ask is if the responses would vary if the assessment was done in the
actual site. According to Kaplan and Kaplan, “the quick and straight forward
answer to these questions is that people’s responses to the two-dimensional
representation are surprisingly similar to what they are in the setting itself”
(1989:16). Several other studies support this conclusion (Levin 1977; Coeterier
1983; Shuttleworth 1980 –last two also recommends color over black and white
photographs; Brown and Daniel 1995; Buhyoff et al 1978 –use a ranking
system)
Although some of the rules for the use of pictures recommend to “avoid
sore thumbs (if a scene has something visually striking that most other scenes
don’t have)…” (Kaplan and Kaplan 1989: 209; also see above quote of Daniel
and Ittelson 1981), I made specific use of visually striking objects –i.e. the
capybara or cattle- in order to classify the different scenes.
A problem in the methodology is the use of only one photograph for each
scene. Studies recommend the use of several photographs of each scene
(Kaplan 1975; Shuttleworth 1980; Vinings and Stevens 1986). However, due to
time and economic constraints, only one photograph of each scene was
included. The use of ranking instead of rating was another factor in the
decision to include only one photograph per scene.
Finally, a logical methodological question would be: why photographs of
landscape and not an oral description of the landscape or the use of one word
like “palmar” or “monte” (native forest), or “pradera” (grassland)? There are two
main reasons for choosing photographs instead of an oral description. 1) I did
not conduct all the surveys myself and providing an oral description would
have opened the door for bias from the interviewer. 2) The photographs used to
“describe” the selected landscapes (particularly in set B) are clearly identified
with the “real” landscapes. After the survey was finished I asked the
participants I interviewed to “tell me what the picture was about” (for set B)
and all the participants mentioned palmar or butia for landscape 1, monte
nativo or monte for landscape 2, banado or humedal for landscape 3, pradera
or campo for landscape 4, and eucalyptus for landscape 5.
- 151 Bibliography for Methodology for Landscape Perception
Benayas del Alamo, J 1994. Landscape Perception. In Naturopa 75: 11.
Brown, T and Daniel, T 1995. Context effects in perceived environmental
quality assessment: scene selection and landscape quality ratings. In Sinha, A
(ed.) Readings in Environmental Psychology: Landscape Perception. Academic
Press Limited, London.
Buyhoff, G; Wellman, J; Harvey, H and Fraser, R 1978. Landscape Architects’
Interpretations of Peoples’ Landscape Preferences. In Journal of Environmental
Management 6: 255-262.
Coeterier, J 1983. A photo validity test. In Journal of Environmental Psycology
3: 315-323.
Feyerabend, P 1993. Against Method. Third Edition, Verso, London, UK.
Hagerhall, C 2001. Consensus in Landscape Preference Judgements. In
Journal of Environmental Psychology 21: 83-92.
Kaplan, R 1975. Some Methods and Strategies in the Prediction of Preference.
In Zube, E; Brush, R and Fabos, J Landscape Assessment: Values, Perceptions,
and Resources: 118-129. Dowden, Hutchinson & Ross, Inc. Stroudsburg,
Pennsylvania.
Kaplan, R and Kaplan, S 1989b. The Experience of Nature: a psychological
perspective. Cambridge University Press. Cambridge, New York.
Kaplan, R; Kaplan, S and Brown, T 1989. Environmental Preference: A
comparison of Four Domains of Predictors. In Environment and Behavior 21 (5):
509-530.
Kaplan, S and Kaplan, R 1989a. The Visual Environment: Public Participation
in Design and Planning. In Journal of Social Issues 45 (1): 59-86.
Kitchin, R; Blades, M and Golledge, R 1989. Relations Between Psychology and
Geography. In Environment and Behavior 29 (4) 554-573.
Levin, J 1977. Riverside preference: On-site and photographic reactions.
Unpublished master’s thesis, University of Michigan, Ann Arbor
Lothian, A 1999. Landscape and the philosophy of aesthetics: is landscape
quality inherent in the landscape or in the eye of the beholder?. In Landscape
and Urban Planning 44: 177-198.
Ryan, R 2002. Preserving rural character in New England: local residents’
perceptions of alternative residential development. In Landscape and Urban
Planning 61: 19-35.
Scott, A 2002. Assessing Public Perception of Landscape: the LANDMAP
experience. In Landscape Research 27 (3): 271-295.
- 152 Seale, C (ed.) 1998. Researching Society and Culture. Sage Publications,
London, UK.
Shuttleworth, S 1980. The use of Photographs as an Environment Presentation
Medium in Landscape Studies. In Journal of Environmental Management 11:
61-76.
Vining, J and Stevens, J 1986. The Assessment of Landscape Quality: Major
Methodological Considerations. In Smardon, R; Palmer, J and Felleman, J
(eds.) Foundations for Visual Project Analysis, Chapter 10. John Wiley & Sons,
New York.
Williams, K and Cary, J 2002. Landscape Preferences, Ecological Quality, and
Biodiversity Protection. In Environment and Behavior 34 (2): 257-274.
- 153 Appendix E
Maps with Areas of Preference for Conservation
In this appendix several maps relating the response to question 40 to
responses to other questions are provided. This is done under the same
conditions as appendix B, the information could help the reader understand
other factors of Castillos’ situation and could also be used to provide
information helpful towards the materialization of the project.
- 154 -
E-1
E-2
E-3
E-4
- 155 -
E-5
E-6
E-7
E-8
- 156 Appendix F
Castillos’ Dump
Castillos dump is located up hill, up stream and very close to the city. The
following pictures are intended to provide the reader with a clear image of the
situation of the dump.
After being collected in Castillos the garbage is carried by truck to the dump.
Pictures A1 and A2 below show that Castillos has no recycling program in
place and everything discarded ends at the dump.
A2
A1
Trucks will discharge the garbage as far into the dump as possible where
garbage is then burned openly. However, every few days the garbage piles
needs to be moved further into the dump in order to create space for the trucks
to enter (Pictures A3 and A4).
A3
A4
- 157 -
When garbage is pushed forward it is very hard for the operator of the bulldozer to
avoid pushing too much and making garbage fall the opposite end of the dump, the
end facing Castillos city (Picture A5).
A5
Due to the location of the dump, garbage that falls off is either carried by water or
blown by the wind and ends up in the creeks that then flow through Castillos city,
located to the right hand side of Picture A6).
A6
- 158 -
The relatively good news is that Castillos has a new option for the dump easily
available. This new option is a quarry that is still occasionally used but is of
relatively low importance and could be used as a new dump. The location is right
beside the present dump (Picture A6) and therefore is far from ideal for it is uphill
and upstream from the city. However, a combination of recycling activities in the
households (for which there is support from the population as graph A1 shows),
composting in a way to be decided by local citizens and authorities, and proper
adaptation of the quarry (Pictures A7 and A8) could provide a much better, and
relatively cheap option for Castillos. Presently the ground is being tested to assess
if the quarry is an appropriate location that will not affect groundwater.
A7
A8
Graph A1. In Question 34
of the survey interviewees
were asked if they would
accept classifying plastics
and glass in their houses in
order to collaborate with
Castillos’ environment.
Only 10% answered maybe
or no.
- 159 Appendix G
Uruguay and the Environment
The objective of this appendix is to provide a glimpse of the main
environmental topics discussed at the legislature level in Uruguay and the
general areas of interest with regards to the environment.
Topic Areas of Uruguayan NGOs
40
Graph A1:
These were the
areas of concern of
Uruguayan
Environmental
NGOs in 1992.
Each NGO could
choose more than
one area of
concern.
37
35
30
30
24
25
20
22 21 21
20 20 19
15 14
13 13
15
10
5
ntal E
ducat
ion
Natur
a
l
R
Envir
esour
onme
ces
nt and
Sust.
D ev
Socia
l Ecolo
Envir
gy
onme
nt and
Conta
Health
minan
ts and
Herbic
Huma
id
n Env
ironm
e
n
t
Protec
ted Ar
Water
eas
Conta
minat
Envir
ion
onme
ntal P
o
li
cies
Envir
onme
ntal L
aw
Rural
Develo
pmen
Atmos
t
pheric
Pollut
ion
0
Envir
onme
Built with
information from:
Instituto de
Comunicacion y
Desarrollo (ICD)
1993.
Environmental Proyects in Uruguay 1992
6
6
5
5
4
4
3
3
3
2
2
2
2
2
1
rs
he
ste
wa
id
iqu
dL
Ot
nt
re
me
on
vir
En
So
lid
nd
an
as
atu
Are
dN
an
m
ris
ra
Lab
ou
ion
tec
ted
..
m.
Pol
lut
Tou
me
Pro
s
rce
for
nta
l In
sou
Re
al
tur
on
vir
Na
En
Ag
ric
ult
ure
an
dN
atu
re
0
Graph A2: This
graph shows the
environmental
related proyects
carried out in
1992 with
international
funding and/or
by national and
international
organizations or
NGOs.
Built with
information
from: Instituto de
Comunicacion y
Desarrollo (ICD)
1993.
- 160 -
Verbal depostions in both chambers
Graph A3: This
graph shows
verbal discussions
related to the
environment in
both chambers in
the 1990-1995
period.
20
20
20
18
15
16
15
14
12
10
10
8
6
4
Built with
information from:
Gudynas and
Santandreu 1999
2
2
2
C
Ta
p
w
at
er
O
th
on
er
an
s
se
d
rv
s
ew
at
io
ag
n
e
of
N
at
ur
e
Po
llu
In
tio
fr
N
n
a
uc
st
ru
le
ar
ct
ur
En
e
er
gy
an
EI
d
A
Po
llu
tio
n
0
Topics Discussed in Environment Commissions of Both
Chambers
Graph A4: Each
chamber has a
12
Commission on
12
the
10
10
Environment.
10
This table shows
the topics
8
discussed in
both
6
Commissions
during the 19904
1995 period:
3
2
2
on
Y
ati
cip
rti
NI
n
tio
llu
Po
MB
Pa
Pro
tec
ted
Ar
he
ea
s
rs
0
Ot
Built with
information
from:
Gudynas and
Santandreu
1999


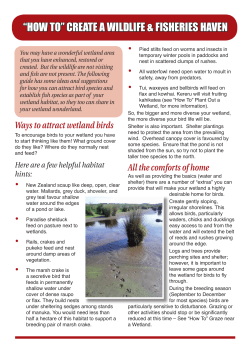

© Copyright 2026