
This electronic theses or dissertation has been
This electronic theses or dissertation has been downloaded from the King’s Research Portal at https://kclpure.kcl.ac.uk/portal/ Title:An exploratory study of older people living alone in Chongming, Shanghai Author:Yu Chen The copyright of this thesis rests with the author and no quotation from it or information derived from it may be published without proper acknowledgement. END USER LICENSE AGREEMENT This work is licensed under a Creative Commons Attribution-NonCommercial-NoDerivs 3.0 Unported License. http://creativecommons.org/licenses/by-nc-nd/3.0/ You are free to: Share: to copy, distribute and transmit the work Under the following conditions: Attribution: You must attribute the work in the manner specified by the author (but not in any way that suggests that they endorse you or your use of the work). Non Commercial: You may not use this work for commercial purposes. No Derivative Works - You may not alter, transform, or build upon this work. Any of these conditions can be waived if you receive permission from the author. Your fair dealings and other rights are in no way affected by the above. Take down policy If you believe that this document breaches copyright please contact [email protected] providing details, and we will remove access to the work immediately and investigate your claim. An exploratory study of older people living alone in Chongming, Shanghai Yu Chen A thesis submitted in fulfilment of the requirements for the degree of Doctor of Philosophy Florence Nightingale School of Nursing & Midwifery King’s College London November 2013 ABSTRACT Background The number of older people living alone is increasing due to dramatic population ageing and changes in living arrangements. Little is known about older people living alone in Mainland China and their quality of life (QoL) where collectivism and filial responsibility are emphasised. Aims This study aimed to explore the health status, life circumstances and QoL of older people living alone in Chongming, Shanghai. Methods A cross-sectional survey of a stratified random cluster sample of 521 community-dwelling older people aged 60 years and above and living alone was conducted in Chongming, Shanghai. The structured questionnaire included validated measures to assess the health status, loneliness, social support, physical activity, health services utilisation and satisfaction, housing and QoL. Results Over two fifths of the participants rated their health as good despite 44.5% reporting chronic diseases and 47.6% reporting being depressed. Most participants reported a high level of functional ability and were satisfied with their health services and overall dwelling conditions. However, over four fifths of the participants reported moderate/moderately high levels of loneliness. The social support mean score was 30.5, lower than the Chinese population 1 norm. The participants’ health status, loneliness, social support, physical activity, health services satisfaction and satisfaction with overall dwelling conditions varied across the sample. Over two fifths of the participants perceived their QoL as good. Satisfaction with overall dwelling conditions, self-rated health, functional ability, depression, economic level, social support, loneliness, occupation and satisfaction with health services were predictors of QoL accounting for 68.8% of the variance. Additionally, depression and occupation had an interaction effect upon QoL. Conclusions Older people living alone in Chongming, Shanghai are a disadvantaged heterogeneous group who need special attention. The proposed QoL model provides the basis for further enquiry regarding the needs of different sub-groups and future policy interventions. 2 ACKNOWLEDGEMENTS I would like to express my sincere gratitude to all those people who made this thesis possible. First, I would like to thank my supervisors, Professor Alison While and Dr. Allan Hicks, for their insightful and valuable advice and guidance, full support and continuous encouragement. I am deeply grateful to all older people who agreed to participate in this study and shared their experiences of living alone. Many thanks to all the data collectors and the leaders of selected towns and communities for their support and help during the data collection phase. I would like to record many thanks to Mr. Peter Milligan for his statistical consultations throughout the study process. Sincere thanks to Professor Ann Bowling for her permission to use the copyrighted questionnaire. I also thank Professor Yan Hu and Professor Haiou Xia from Fudan Unversity for their assistance with the development of the Chinese version of the instruments. Special thanks to the China Scholarship Council, King’s College London and Fudan University for their financial assistance. I am also very grateful to School of Nursing, Fudan University for the opportunity for me to pursue a doctoral degree at King’s College London. I would like to thank all my friends for their precious friendship and support. 3 Finally, I would like to express my heartfelt thanks to my family for their endless care, support and encouragement, especially to my husband, lovely daughter and parents for their perseverance and love. 4 TABLE OF CONTENTS ABSTRACT .................................................................................................. 1 ACKNOWLEDGEMENTS ............................................................................ 3 TABLE OF CONTENTS ............................................................................... 5 LIST OF TABLES ....................................................................................... 10 LIST OF FIGURES ..................................................................................... 13 LIST OF APPENDICES ............................................................................. 14 CHAPTER 1 INTRODUCTION 1.1 Background to the study ................................................................... 15 1.2 Aim, objectives and research questions ............................................ 17 1.3 Operational definition of terms .......................................................... 18 1.4 Structure of the thesis ....................................................................... 19 CHAPTER 2 LITERATURE REVIEW 2.1 Chapter introduction .......................................................................... 21 2.2 Population ageing and living arrangements change ......................... 21 2.2.1 Global population ageing ............................................................ 21 2.2.2 Population ageing in China ......................................................... 22 2.2.3 Population ageing in Shanghai ................................................... 23 2.2.4 Changes in living arrangements in China ................................... 26 2.2.5 A brief summary of population ageing ........................................ 27 2.3 Profile of older people living alone .................................................... 28 2.4 Quality of life ..................................................................................... 35 2.4.1 Definition and concepts of quality of life ..................................... 36 2.4.2 Related factors of quality of life of older people .......................... 38 2.4.2.1 Health status ........................................................................ 39 2.4.2.2 Loneliness ............................................................................ 51 5 2.4.2.3 Social support ...................................................................... 53 2.4.2.4 Physical activity .................................................................... 56 2.4.2.5 Housing ................................................................................ 59 2.4.2.6 Socio-demographic factors .................................................. 62 2.4.3 A brief summary of the literature regarding quality of life ............ 70 2.5 Health status, life circumstances and quality of life of older people in China ................................................................................................. 72 2.5.1 Health status ............................................................................... 72 2.5.2 Loneliness .................................................................................. 81 2.5.3 Social support ............................................................................. 83 2.5.4 Physical activity .......................................................................... 90 2.5.5 Health services ........................................................................... 92 2.5.6 Housing ...................................................................................... 95 2.5.7 Measurements of quality of life of older people in China ............ 96 2.5.8 A brief summary of the health status, life circumstances and quality of life of older people in China ........................................................... 101 2.6 Conceptual framework for the study ................................................. 103 2.7 Chapter summary ........................................................................... 104 CHAPTER 3 METHOD 3.1 Chapter introduction ........................................................................ 107 3.2 Study aim and objectives ................................................................ 107 3.3 Study design ................................................................................... 108 3.3.1 Type of study ............................................................................ 108 3.3.2 Study site .................................................................................. 109 3.3.3 Subjects .................................................................................... 111 3.3.4 Sample size .............................................................................. 112 3.4 Questionnaire development ............................................................ 114 3.5 Ethical considerations ..................................................................... 124 3.6 Pilot study ....................................................................................... 125 3.7 Main study ...................................................................................... 128 6 3.7.1 Sampling procedure ................................................................. 129 3.7.2 Data collectors training ............................................................. 130 3.7.3 Data collection .......................................................................... 131 3.8 Data analysis .................................................................................. 133 3.8.1 Validation of the scales in the main study ................................. 133 3.8.2 Statistical analysis to fulfil the research objectives ................... 134 3.9 Chapter summary ........................................................................... 136 CHAPTER 4 FINDINGS: STATUS OF HEALTH, LIFE CIRCUMSTANCES AND QUALITY OF LIFE OF OLDER PEOPLE LIVING ALONE IN CHONGMING 4.1 Chapter introduction ........................................................................ 137 4.2 Psychometric properties of the scales in the main study ................ 137 4.2.1 Psychometric properties of the Chinese OPQOL ..................... 137 4.2.2 The reliabilities of other scales ................................................. 146 4.3 Characteristics of the participants ................................................... 147 4.4 Health status ................................................................................... 149 4.4.1 Chronic and acute diseases ..................................................... 149 4.4.2 Cognitive function ..................................................................... 152 4.4.3 Depression ............................................................................... 154 4.4.4 Functional ability ....................................................................... 156 4.4.5 Self-rated health ....................................................................... 160 4.5 Loneliness ....................................................................................... 162 4.6 Social support ................................................................................. 164 4.7 Physical activity ............................................................................... 169 4.8 Health services ............................................................................... 172 4.9 Housing ........................................................................................... 175 4.10 Quality of life ................................................................................. 178 4.11 Additional information from the participants .................................. 181 4.12 Chapter summary ......................................................................... 182 7 CHAPTER 5 FINDINGS: FACTORS RELATED TO QUALITY OF LIFE OF OLDER PEOPLE LIVING ALONE IN CHONGMING AND THE EXPLANATORY QUALITY OF LIFE MODEL 5.1 Chapter introduction ........................................................................ 184 5.2 The relationships between reported quality of life and socio-demographic, health and life circumstances variables ........... 184 5.2.1 The relationships between reported quality of life and socio-demographic variables ............................................................. 184 5.2.2 The relationships between reported quality of life and health status, loneliness, social support, physical activity, health services satisfaction and satisfaction with overall dwelling conditions ................................ 185 5.2.3 The predictors of quality of life .................................................. 188 5.3 An explanatory model of the quality of life of older people living alone in Chongming ........................................................................................ 192 5.4 Chapter summary ........................................................................... 198 CHAPTER 6 DISCUSSION 6.1 Chapter introduction ........................................................................ 199 6.2 Psychometric properties of the Chinese OPQOL ............................ 200 6.2.1 Validity of the Chinese OPQOL ................................................ 200 6.2.2 Reliability of the Chinese OPQOL ............................................ 206 6.2.3 A brief summary of the psychometric properties of the Chinese OPQOL .............................................................................................. 208 6.3 Characteristics of older people living alone in Chongming .............. 208 6.4 Health status, loneliness, social support, physical activity, health services utilisation and satisfaction, housing and quality of life of older people living alone in Chongming .................................................... 209 6.4.1 Health status ............................................................................. 210 6.4.1.1 Physical health ................................................................... 210 6.4.1.2 Cognitive function ............................................................... 214 6.4.1.3 Depression ......................................................................... 217 6.4.1.4 Functional ability ................................................................ 219 8 6.4.1.5 Self-rated health ................................................................. 222 6.4.2 Loneliness ................................................................................ 225 6.4.3 Social support ........................................................................... 228 6.4.4 Physical activity ........................................................................ 231 6.4.5 Health services ......................................................................... 233 6.4.6 Housing .................................................................................... 236 6.4.7 Quality of life ............................................................................. 238 6.5 Factors related to quality of life of older people living alone ............ 241 6.5.1 Satisfaction with overall dwelling conditions ............................. 242 6.5.2 Self-rated health ....................................................................... 243 6.5.3 Functional ability ....................................................................... 244 6.5.4 Depression and occupation ...................................................... 245 6.5.5 Economic level ......................................................................... 246 6.5.6 Social support ........................................................................... 247 6.5.7 Loneliness ................................................................................ 249 6.5.8 Health services satisfaction ...................................................... 250 6.5.9 Other related factors of quality of life ........................................ 251 6.5.10 A brief summary of related factors of quality of life of older people living alone in Chongming ................................................................. 256 6.6 Chapter summary ........................................................................... 256 CHAPTER 7 CONCLUSION 7.1 Chapter introduction ........................................................................ 258 7.2 Synthesis of major findings and discussions against research objectives .......................................................................................................... 258 7.3 Contribution of the study ................................................................. 260 7.4 Critique of the study design and methods ....................................... 261 7.5 Implications for practice and policy ................................................. 266 7.6 Recommendations for further research ........................................... 276 REFERENCES ......................................................................................... 278 APPENDICES .......................................................................................... 328 9 LIST OF TABLES Table 2.1 The related factors of quality of life of older people .................... 72 Table 3.1 Characteristics of the pilot participants (n=30) ........................... 126 Table 3.2 The modified questions in the questionnaire ............................ 127 Table 3.3 The reliabilities of the scales in the pilot study ......................... 128 Table 3.4 The research questions and corresponding statistical methods..136 Table 4.1 The reliability of the Chinese OPQOL ...................................... 139 Table 4.2 Results of the exploratory factor analysis ................................. 142 Table 4.3 The reliability of the Chinese OPQOL with a new factor structure ................................................................................................................... 144 Table 4.4 Correlations between scores of the OPQOL and the ADL Scale, SSRS, RULS-V3 (Spearman’s rho) ........................................................... 145 Table 4.5 Mann-Whitney U test between the depressed and non-depressed groups on the OPQOL ............................................................................. 146 Table 4.6 The reliabilities of the scales in the main study ........................ 146 Table 4.7 Characteristics of the participants (n=521) ................................. 148 Table 4.8 Reports on the number of chronic diseases ............................. 150 Table 4.9 The cases of chronic diseases ................................................. 150 Table 4.10 The number of chronic diseases of the participants by different socio-demographic characteristics ........................................................... 151 Table 4.11 The cognitive function of the participants ............................... 152 Table 4.12 The cognitive function of the participants by different socio-demographic characteristics ........................................................... 153 Table 4.13 Reports on the Geriatric Depression Scale ............................ 154 Table 4.14 The presence of depression in the participants by different socio-demographic characteristics ........................................................... 155 Table 4.15 The functional ability of the participants ................................. 156 Table 4.16 Description of the dependency on activity of daily living ......... 158 10 Table 4.17 The activity of daily living of the participants by different socio-demographic characteristics ........................................................... 159 Table 4.18 Reports on self-rated health ................................................... 160 Table 4.19 The self-rated health of the participants by different socio-demographic characteristics ........................................................... 161 Table 4.20 The loneliness level of the participants ................................... 162 Table 4.21 The loneliness level of the participants by different socio-demographic characteristics ........................................................... 163 Table 4.22 The scores of the Social Support Rate Scale ......................... 164 Table 4.23 Sources of instrumental support that the participants received ................................................................................................................... 165 Table 4.24 Sources of emotional support that the participants received .. 165 Table 4.25 The subjective support from different sources ........................ 166 Table 4.26 Frequency and percentage of each item in support utilisation...166 Table 4.27 The overall social support level of the participants by different socio-demographic characteristics ........................................................... 168 Table 4.28 Reports on adequacy of physical activity ............................... 169 Table 4.29 Frequency of the participants’ physical activity ...................... 169 Table 4.30 The adequacy of physical activity of the participants by different socio-demographic characteristics ........................................................... 171 Table 4.31 The participants’ satisfaction with health services .................. 173 Table 4.32 The health services satisfaction of the participants by different socio-demographic characteristics ........................................................... 174 Table 4.33 Frequency and percentage of dwelling satisfaction ................ 176 Table 4.34 Satisfaction with overall dwelling conditions of the participants by different socio-demographic characteristics ............................................. 177 Table 4.35 The participants’ self-perceived overall quality of life ............. 178 Table 4.36 Frequency and percentage for each item in the Older People’s Quality of Life Questionnaire .................................................................... 179 Table 5.1 Mann-Whitney U test or Kruskal-Wallis test of variables on rank of quality of life ............................................................................................. 186 11 Table 5.2 Multi-way ANOVA on rank of quality of life ............................... 188 Table 5.3 Predictors’ estimated marginal mean and 95% CI of rank of quality of life ........................................................................................................ 189 Table 5.4 Estimated marginal mean and 95% CI of rank of quality of life for depression*previous occupation .............................................................. 191 12 LIST OF FIGURES Figure 3.1 Location of Shanghai .............................................................. 110 Figure 3.2 Location of Chongming County ............................................... 111 Figure 3.3 The flow chart for sampling procedure .................................... 130 Figure 3.4 The flow chart for data collection ............................................. 132 Figure 4.1 The type of medical institution that the participants visited most often ......................................................................................................... 172 Figure 5.1 The effects of depression and occupation upon the quality of life ................................................................................................................... 192 Figure 5.2 The related factors of quality of life in the bivariate analyses .. 194 Figure 5.3 The related factors of quality of life in the multivariate analysis ................................................................................................................... 195 Figure 5.4 Summary of the findings of quality of life of older people living alone ........................................................................................................ 196 Figure 5.5 An explanatory model of the quality of life of older people living alone ........................................................................................................ 197 Figure 7.1 Implications for practice and policy in the improvement of QoL of older people living alone in Chongming ................................................... 275 13 LIST OF APPENDICES Appendix 1 Quality of life of older people in China: a systematic review .. 328 Appendix 2 Depression and related factors in older people in China: a systematic review ..................................................................................... 342 Appendix 3 Loneliness and social support of older people in China: a systematic literature review ...................................................................... 358 Appendix 4 Questionnaire in the pilot study (English) .............................. 369 Appendix 5 Questionnaire in the pilot study (Chinese) ............................. 381 Appendix 6 Ethical approval ..................................................................... 393 Appendix 7 Questionnaire in the main study (English) ............................. 395 Appendix 8 Questionnaire in the main study (Chinese) ........................... 407 Appendix 9 Training manual (English) ..................................................... 419 Appendix 10 Training manual (Chinese) .................................................. 426 Appendix 11 Information sheet (English) ................................................. 432 Appendix 12 Information sheet (Chinese) ................................................ 435 Appendix 13 Consent form (English) ........................................................ 437 Appendix 14 Consent form (Chinese) ...................................................... 439 Appendix 15 Publications during PhD study ............................................ 440 14 CHAPTER 1 INTRODUCTION 1.1 Background to the study Population ageing, which is a process whereby older individuals account for a proportionally larger share of the total population (United Nations 2009), has now become apparent across the world, and is unprecedented in the history of humanity (United Nations 2001). The population of older people is growing by 2.0% each year, considerably faster than the population as a whole. This older population is expected to continue growing faster than other age groups, and the annual growth rate will reach 2.8% in 2025-2030 (United Nations 2001). As population ageing is pervasive, China, which is the most populous country in the world, is also experiencing this phenomenon. In 2000, China reached the threshold of an ageing society, that is the population aged 60 years and above accounts for more than 10.0% of the total population or the population aged 65 years and above accounts for more than 7.0% of the total population (Peng 2011, Xie 2004). The speed of population ageing in China is accelerating and the rapid pace is projected to last for a long period of time. Population ageing brings about major challenges to social care needs such as retirement benefits and old-age home support. It also has major consequences for health care, because older people have progressive, generalised impairment of function with ageing resulting in a loss of the adaptive response to stress and a growing risk of age associated diseases (Ren 2002). One of the important features of the demographic profile of older populations is the increase in older people living alone which is predicted to accelerate 15 quickly towards the middle of the 21st century (Rolls et al. 2010). With changes in lifestyle and family values, improvement in living conditions, the trend towards family nuclearisation and the growing population flow of younger people, living arrangements are changing and the number of older people living alone is increasing. The global proportion of older people aged 60 years and above and living alone is now estimated to be 14.0% (United Nations 2009). Older people living alone are usually identified as an “at risk” group who warrant specific attention (World Health Organization 1977). They are more likely to need outside help in the case of illness or disability, to be socially isolated and poorer (Casey & Yamada 2002). They also tend to have lower levels of life satisfaction and a lower quality of life (QoL) (Lee 2005). Although the proportion of older people living alone in China is lower than those in many Western countries (United Nations 2009), the impact of living alone upon Chinese older people may be more apparent. Traditionally, Chinese people are strongly influenced by Confucian teaching which emphasises interdependence and group harmony (Xiang et al. 2008). Filial responsibility is important and older people are often cared for by younger family members. That means children are the primary source of support for older people with the son’s family being expected to live with parents until their death. Therefore, intergenerational co-residence is very common in China (Li et al. 2009). Multiple generations living under one roof gives Chinese older people a sense of pride as well as instrumental and emotional support, which has consequences for their subjective assessment of health (Li et al. 2009). There are many studies focusing upon older people living alone in Western countries or in Hong Kong and Taiwan. But studies of older people living 16 alone in Mainland China are relatively limited. As life experiences among people vary across different countries and different cultures, little is known about the health status, life circumstances and QoL of older people living alone in Mainland China. Therefore, this study aims to explore the health status, life circumstances and QoL of older people living alone in Chongming County which is a district of Shanghai, to understand their health status, loneliness, social support, physical activity, health services utilisation and satisfaction, housing and QoL; to find out the significant factors related to their QoL; and to develop an explanatory model of QoL. The study results should provide an in-depth understanding of older people who live alone in Chongming, and evidence to help health and social care providers and policy makers identify the most vulnerable sub-groups and implement appropriate health and social care interventions to maintain or enhance their QoL. 1.2 Aim, objectives and research questions The aim of this study was to explore the health status, life circumstances and QoL of older people living alone in Chongming, Shanghai. The following objectives together with research questions were set: 1. To explore the health status, loneliness, social support, physical activity, health services utilisation and satisfaction, housing and QoL of older people living alone in Chongming, Shanghai. Q1.1 What is the physical health, mental health, functional ability, self-rated health, loneliness, social support, physical activity, health services utilisation and satisfaction, housing and QoL of older people living alone in Chongming, Shanghai? 17 Q1.2 Dose the physical health, mental health, functional ability, self-rated health, loneliness, social support, physical activity, health services satisfaction and satisfaction with dwelling conditions differ across the different socio-demographic characteristics of the sample? 2. To explore the significant factors related to QoL of older people living alone in Chongming, Shanghai. Q2.1 What are the relationships between the reported QoL and socio-demographic variables, physical health, mental health, functional ability, self-rated health, loneliness, social support, physical activity, health services satisfaction and satisfaction with dwelling conditions? Q2.2 What are the predictors of QoL? 3. To develop an explanatory model of QoL of older people living alone in Chongming, Shanghai. Q3.1 What is the QoL model that is suitable for older people living alone in Chongming, Shanghai? 1.3 Operational definition of terms Older people According to the definition of “older people” described in the “Law of the People’s Republic of China on Protection of the Rights and Interests of the Elderly” (Standing Committee of the National People’s Congress 1996), older people in this study refers to people aged 60 years and above. Living alone Living alone refers to a state of a one-person household, that is staying and sleeping alone in one’s dwelling with none else sharing the dwelling (Rolls et 18 al. 2010). Health status Health status includes the presence of chronic diseases, the number of chronic diseases, the presence of acute diseases, cognitive function, depression, functional ability and self-rated health. Life circumstances Life circumstances refer to loneliness, social support, physical activity, health services utilisation and satisfaction and housing. Quality of life There is no unified definition of QoL. This study adopts a widely used definition suggested by the World Health Organization Quality of Life Group (WHOQOL Group), that is, “individuals’ perceptions of their position in life in the context of the culture and value systems in which they live and in relation to their goals, expectations, standards and concerns” (1995, p. 1403). 1.4 Structure of the thesis The thesis comprises seven chapters. Chapter 1 introduces the background of the study, lists the research objectives and research questions, defines some key terms, and describes the thesis structure. Chapter 2 is a comprehensive review of the literature regarding population ageing issues, views on older people living alone, QoL including its definition, concepts and the related factors of QoL of older people, and health status, life circumstances and QoL of older people in China. Chapter 3 sets out the methods used in the study, including the description of Chongming as the 19 study site, questionnaire development, sampling procedure, the pilot study and the main study data collection. The statistical methods to fulfil the research objectives are also described in Chapter 3. The study findings are presented in two chapters. Chapter 4 presents the reliability and validity of the scales used in the main study, the characteristics of the participants, their health status and life circumstances including physical health, mental health, functional ability, self-rated health, loneliness, social support, physical activity, health services utilisation and satisfaction and housing, their QoL, and the comparisons of health status and life circumstances across the different socio-demographic characteristics. Chapter 5 presents the important factors related to QoL. The explanatory model of QoL of older people living alone is also reported in this chapter. Chapter 6 presents the discussion of the findings regarding the psychometric properties of the Chinese version of a QoL questionnaire for its utility in China, and the health status, life circumstances and QoL of older people living alone in Chongming. It also discusses the related factors of QoL of older people living alone. The final chapter draws conclusions, acknowledges the limitations of the study, and highlights the implications for social and health care practice and policy and future research. 20 CHAPTER 2 LITERATURE REVIEW 2.1 Chapter introduction This chapter presents a comprehensive literature review to provide the context of the proposed research and a rationale for the study. It is presented in four sections. The first section describes the context of population ageing including global ageing and ageing in China and Shanghai, and introduces the changes in living arrangements. The second section outlines the profile of older people living alone. The third section synthesises the theoretical and empirical studies about older people’s QoL including its definition, concepts and related factors. The fourth section presents the published evidence relating to the health status, life circumstances and QoL of older people in China identified through a systematic search of seven databases (Web of Science, PsycINFO, MEDLINE, PubMed, CINAHL, China Academic Journal and VIP Database for Chinese Technical Periodicals). 2.2 Population ageing and living arrangements change 2.2.1 Global population ageing Population ageing is unprecedented all over the world (United Nations 2009). In 1950, there were 205 million older people aged 60 years and above, accounting for 8.0% throughout the world. In 2000, there were approximately 600 million older people, tripling the number of 50 years earlier. In 2009, the number of older people surpassed 700 million, accounting for 11.0% of the world’s total population. It is estimated that the number of older people will 21 exceed the number of children for the first time in 2045, and the proportion of older people will rise to 22.0% in 2050 (United Nations 2009, World Health Organization 2008). This means that one in five people will be 60 years old and above by the year 2050, and that there will be two billion older people alive in the world, tripling the number of 2000. Population ageing first occurred in the developed countries and the proportions of older people in these countries as a whole are higher than those in developing countries. However, older people are increasing rapidly in developing countries at a faster rate than that which occurred in the developed countries. The average annual growth rate of people aged 60 years and above is 3.0% in developing countries and 1.9% in developed countries in recent years, and the rate is expected to rise to 3.4% in developing countries and decrease to 1.1% in developed countries by 2025-2030 (United Nations 2009). 2.2.2 Population ageing in China China, as one of the developing countries with a population of 1.3 billion, is also undergoing population ageing. Nearly one out of five older people in the world live in China (China National Committee on Ageing 2007). The results of the Fifth National Population Census in 2000 showed that older people aged 60 years and above had reached 130 million accounting for 10.3% of the total population, indicating that China has entered the ageing society (Xie 2004). By the end of October in 2010, there were approximately 177 million older people aged 60 years and above, accounting for 13.3% of China’s total population (National Bureau of Statistics of China 2011). 22 The annual growth rate of older people aged 60 years and above was 2.9% on average from 1982 to 2004, while the natural population growth rate was 1.2% on average (China Ageing Affairs Office 2006). After 2004, the older population is growing at an annual rate of 3.3%, which is almost five times the average annual growth rate of the national population (China Ageing Affairs Office 2006). It is estimated that the number of Chinese older people will increase by 200 million every 12 to 13 years, equivalent to the total population of some populated countries (Jiang 2005). At this growth rate, it will take China just 27 years to double its proportion of older people from 7.0% to 14.0%, compared to more than 45 years to achieve the same increase in some developed countries (Kincannon et al. 2005). The rapid growth rate is about to catch up with Japan, which has the fastest ageing rate in the world (Jiang 2005). The proportion of older people aged 65 years and above is expected to rise to 20.0% and 25.0% respectively during the periods of 2015-2035 and 2040-2050 (Peng 2011). The absolute size of the older population is expected to reach 248 million in 2020 and 400 million in 2050 (Cao et al. 2010). 2.2.3 Population ageing in Shanghai Shanghai, as one of the largest cities and the economic, financial, trade and shipping centre of China, had a total population of 23.5 million in 2011 which accounted for 1.8% of China’s total population (National Bureau of Statistics of China 2011, Shanghai Municipal Statistics Bureau 2012). It is the first city in China to be designated as an ageing society, defined as one in which more than 10.0% of the population is aged 60 years and above or more than 7.0% of the population is aged 65 years and above (Chen & Chen 2006, Xie 2004). 23 Like many other cities, both in developed and developing countries, Shanghai has undergone a dramatic demographic transition in the past few decades. Before 1949, population growth showed a high birth rate, high mortality and low growth characteristics with lower socio-economic circumstances (Hua & Fan 2010). The average life expectancy was 35 years of age. Since the foundation of the People’s Republic of China in 1949, people’s living standards have improved greatly, economic and health levels have developed enormously and mortality has fallen markedly. Thus, population growth has shown a high birth rate, low mortality and high growth characteristics (Hua & Fan 2010). The average life expectancy rose to 73 years of age in 1979 (Shanghai Municipal Statistics Bureau 2012). Such a population pattern continued until the late 1970s. At that time, China launched the “one-child policy” (Zhang 2010). People’s concept of fertility also changed, and the birth rate began to decline. However, longevity has continued to increase and the average life expectancy of population has reached 80 years of age since 2004, much higher than the average of 71 years life expectancy for China as a whole (Gerontological Society of Shanghai 2010). Due to fertility and mortality reductions, Shanghai reached a negative population growth of -0.8‰ in 1993 (Shanghai Municipal Statistics Bureau 2009), and became the first city in China that had a negative population growth (Li 2005). The term “demographic transition” was proposed in 1945 by Frank Notestein (Kirk 1996). It refers to the secular shift in fertility and mortality from high and sharply fluctuating levels to low and stable ones (Lee & Reher 2011). The theory is based on an interpretation of demographic history developed in 1929 by the American demographer Warren Thompson who observed changes, or transitions, in birth and death rates in industrialised societies over the past 200 years (Montgomery 2000). Traditionally, the demographic 24 transition involves four stages (Montgomery 2000). In stage one, birth and death rates are both very high and roughly in balance. This balance results in very slow population growth. In stage two, the death rates drop rapidly while the birth rates remain high or perhaps even rise slightly. The imbalance leads to an increasingly rapid growth of population. In stage three, the birth rates start to fall and the death rates remain at a low level. The population growth is nearly stable but still increases. In stage four, there are both low birth and death rates. The population size is stable and the population age structure has become old. According to the demographic transition model, the transition of population from high fertility and high mortality to low fertility and low mortality means that Shanghai is at stage four of the model. The process of population ageing in Shanghai has taken place so sharply that its older population increased from 10.0% to 18.0% within 20 years, a transition that has taken about 100 years in many European countries (Zhang 2010). By the end of 2003, there were 2.5 million older people aged 60 years and above accounting for 18.9% of Shanghai’s registered population, which indicates that the proportion of older people in Shanghai has reached the average level of developed countries (Nie 2004). By the end of 2012, Shanghai’s older people aged 60 years and above had reached 3.7 million accounting for 25.7% of registered residents (Gerontological Society of Shanghai 2013). It is forecast that the process of population ageing will continue. In 2040, the number of people aged 60 years and above is estimated to reach 7.3 million, which will be three times that of 2000 (Poston et al. 2005). Shanghai’s older people will account for 41.9% of the total population in Shanghai, or 1.9% of older people in China (Poston et al. 2005). 25 2.2.4 Changes in living arrangements in China Living arrangements refer to the size and household structures, which reflect familial interaction and availability of support from family members (Bongaarts & Zimmer 2002). They are important to people when they grow older and experience life changes such as retirement, death of a spouse or other family members, change in economic circumstances and decline in health (Yahaya et al. 2010). Traditionally, it is a moral obligation for junior members of the family to respect and take care of their older parents in the Chinese culture (Sun 2002). Therefore, it is very common for older people to co-reside with their children and rely on them as the major source of support. Nearly 68.7% of older people in China lived in intergenerational households in 2000 in comparison to only 17.8% of older people in the United States (US) living with children and/or grandchildren (United Nations 2005, Zeng & Wang 2003). However, this kind of living pattern is changing. With the trend towards family nuclearisation and a global tendency for a larger span of generations, the majority of individuals are living in small families (Chen 2007). Thus the family size is shrinking. In China, the average household size in 2010 was 3.1 persons, reduced by 0.3 compared to that in 2000 (National Bureau of Statistics of China 2011). The average household size in Shanghai in 2010 was 2.5 persons, declining from 2.8 in 2000 (Shanghai Municipal Statistics Bureau 2011a). One of the reasons for the changes in living arrangements is population flow. The uneven economic development between different areas and accelerating urbanisation are driving younger people to move to relatively economically developed regions to seek employment and a better life (Wu et al. 2010). In addition, since the “reform and open policy” of China in the late 1970s, increasing numbers of Chinese people are migrating to other countries to work, study or for other reasons (Chen 2007). Population flow 26 leaves older people living in their hometown without their children. The change in family values is another reason. The “open policy” has introduced many Western values and influenced people. Some older people prefer to live separately from their children, especially those who are relatively younger, and more financially and physically independent (Velkoff 2001, Yu & Xu 2006). Additionally, with the economic development and the improvement of people’s living standards, living conditions have gradually improved. Several generations no longer need to live in one crowded household leaving older people living separately from their younger relatives. In light of the changes in living arrangements, the number of older people living alone in Mainland China is growing. Approximately 10.3% of older people lived alone in 1982, while the figure rose to 11.1% in 2000 (Wang 2009). In Shanghai, according to the survey conducted by the Shanghai Research Centre on Ageing, there were nearly 223, 600 older people who lived alone in 2011, which has increased by 18.5% compared with that in 2009, and this number has grown to 233,500 by the end of 2012 (Gerontological Society of Shanghai 2012, 2013). 2.2.5 A brief summary of population ageing The world’s population is ageing and the ageing trend will continue for a long time. China has a large number of older people and an increasing velocity of population ageing. Unlike in many developed countries, the process of population ageing in China is taking place in a much shorter period of time before modernisation and affluence, which means China has to cope with the rapid changes with limited resources (China Ageing Affairs Office 2006, Meng & Luo 2008). On the other hand, the changing living arrangements arising 27 from family fragmentation with migration and emigration of younger people for economic and other reasons (Li & Tracy 1999, Phillips et al. 2008) results in the increase of older people living alone. In the context of Chinese traditional culture in which strong family ties and values and interdependence are emphasised, older people living alone seem to be a unique group (Lai & Leonenko 2007). They are worthy of specific attention as the phenomenon of living alone is not consistent with the norms of the Chinese culture (Lai & Leonenko 2007). This together with the enormous demographic changes requires evidence to inform health and social care provision. 2.3 Profile of older people living alone Living arrangements are salient for older people because as people grow older the immediate environment becomes more and more important in terms of their personal sustainability (Yahaya et al. 2010). Living alone is an objective measure of living arrangements. Older people living alone have been described as a particular group who could be targeted for specific attention (Iliffe et al. 1992). With the increasing ageing population, more attention is being placed on this group regarding their health status, life circumstances and QoL. Lee (2005) interviewed 109 older people aged 60 years and above and living alone in Hong Kong. He reported that most participants were in their late 70s, female, widowed, had lower levels of education, and reported poor self-rated health and a high satisfaction with their living environment. Approximately two thirds of the participants (63.3%) reported a high QoL. Mental health (β=0.33, p<0.01), life satisfaction (β=0.29, p<0.01), the number of days in hospitals (β= -0.21, p<0.01), self-esteem (β=0.20, p<0.05) and age (β=0.18, p<0.05) were 28 predictors of QoL. Those who were older, reported a better mental health, higher satisfaction with their life and higher self-esteem, and stayed in hospitals for fewer days reported a higher QoL. In order to explore the QoL of older people living alone in Taiwan, Lin et al. (2008) recruited a random sample of 192 older people who were at least 65 years and lived alone. As in Lee’s (2005) sample, most of the participants were female, widowed and had lower levels of education. Using the World Health Organization Quality of Life Scale-Brief Version (WHOQOL-BREF; The WHOQOL Group 1998), Lin et al. (2008) reported that the QoL of older people living alone was lower than that of the healthy adult people surveyed by the World Health Organization. Education level, residential area, the number of chronic diseases, self-rated health, depression, social support and socio-economic status influenced different dimensions of QoL, with three variables being the predictors of QoL across all the dimensions, namely, residential area (p<0.001), depression (p<0.05) and social support (p<0.05). Older people who lived alone in a rural area, suffered from depression and received less social support had a greater likelihood of having a low QoL. Additionally, Zhong (2004) conducted a survey with 286 older people aged 80 years and above living alone in Shanghai, and reported that most of them were female with a low level of education. Overall, the participants reported financial strain, poor self-rated health, poor functional ability, a low level of psychological well-being and a low level of social interactions. On the whole, less than one fifth of the participants (14.7%) rated their living status as good. Although the lack of details about sampling procedure and the validity and reliability of the researcher-developed questionnaire limited the generalisability of this study, some of the findings such as older people living 29 alone having poorer health status, lower levels of psychological well-being and lower levels of social interactions have been supported by some other studies (Chou & Chi 2000, Li et al. 2009, Zhang H.C. et al. 2010). For example, Li et al. (2009) analysed the data from two phases of the Chinese Longitudinal Healthy Longevity Survey (CLHLS) which included 9093 people aged 77-122 years and were conducted in 1998 and 2000 respectively, and reported that living alone increased the risk of poor self-rated health. Zhang H.C. et al. (2010) compared two groups of older people (living alone vs. not living alone) in terms of their psychological well-being and social support, and reported that older people living alone scored significantly lower on both psychological well-being and social support. Moreover, Gaymu and Springer (2010) investigated the influence of living conditions upon life satisfaction of older people living alone from an international perspective. Their data were drawn from the first phase of the Survey of Health, Ageing and Retirement in Europe (SHARE) which was conducted in ten European countries in 2004 and included 3501 older people aged 60 years and above and living alone. The results showed that women were on average twice as likely to live alone as men. The multivariate analysis indicated that a high level of functional ability (men: OR=5.39; women: OR=4.23), a high level of education (men: OR=1.61; women: OR=1.32), participation in social activities (men: OR=1.57; women: OR=1.36) and an advanced age (men: OR=1.06; women: OR=1.02) increased the life satisfaction of older people living alone. By comparing the differences between Hong Kong Chinese older people living alone (n=105) and those living with others (n=149), Chou and Chi (2000) concluded that older people living alone were a particularly vulnerable group 30 of the elderly population. Those living alone were younger (χ2=13.9, p<0.05), reported a higher level of worry about their financial situation (t=4.11, p<0.01), did not have enough money for their daily needs (t=2.78, p<0.01), and were less likely to be married (χ2=50.5, p<0.01) than their counterparts who were not living alone. The living alone participants reported more depressive symptoms (t=2.61, p<0.05) and poorer self-rated health (t=3.65, p<0.001) although their functional ability, cognitive function, number of somatic complaints and number of chronic diseases were similar to those living with others. In addition, Chou and Chi (2000) also found that older people living alone reported smaller social networks of relatives (p<0.01), received less instrumental and emotional support (p<0.05), and reported a lower level of life satisfaction (t=4.71, p<0.001). This echoes the findings of a study conducted by Chou et al. (2006) who interviewed a random sample of 2003 Hong Kong older people aged 60 years and above. They reported that older people living alone were more likely to express financial strain (χ2=12.8, p<0.01), rate their health as poor (χ2=4.7, p<0.05), be depressed (χ2=8.3, p<0.01), and receive less family support (p<0.01). They further reported that living alone was a significant factor related to depression among older women despite adjustment for other variables, which was consistent with the findings reported by Dean et al. (1992) who found that living alone had a direct effect upon depression (β=0.18, p<0.05) with older people living alone reporting more serious depressive symptoms. It was also consistent with the findings reported by Mui (1998) who found that living alone was the third strongest predictor of depression (β=0.26, p<0.01) among 147 older Chinese immigrants in the US. Furthermore, in a longitudinal study regarding the influence of living 31 arrangements during five years upon the 10-year subsequent cognitive decline among 1004 men aged 70-89 years in Finland, Italy and the Netherlands (van Gelder et al. 2006), living alone was identified to be associated with cognitive decline. The participants who changed their living arrangements during the five-year period from living with others to living alone had a two times greater cognitive decline, and those who lived alone all the time had a 3.5 times greater cognitive decline, compared to those who lived with others during five years. Living alone was also identified as a strong predictor of mortality among Italian men (Scafato et al. 2008). A random sample of 5376 older people aged 65 years and above participated in the baseline survey of the Italian Longitudinal Study on Ageing in 1992, with 1977 dying during the 10-year follow-up. The cumulative survival probability showed that cohabiting men lived longer than their living alone counterparts. Moreover, the Cox proportional hazard model showed that there was a significantly increased mortality risk of 42.0% among older men living alone (HR=1.42, p<0.05) compared to those not living alone after the adjustment for some confounders. The findings from the aforementioned studies suggested that older people living alone seemed to be an “at risk” group. Most of them had a lower level of education, more precarious finances, poorer self-rated health, more difficulties in functional ability, a greater decline in cognitive function, a tendency of depression and loneliness, less social interactions, lower levels of social support, a lower QoL and a higher risk of mortality (Feng & Chen 2008, Kharicha et al. 2007, Saito et al. 2005, Stanley et al. 2010, Victor et al. 2005a). However, Ng et al. (2004) did not find any significant differences in 32 the psychological well-being between older people living alone and those living with their family members; although the small sample size of 90 and the convenience sampling method weaken the quality of this study. Ng et al. (2004) explained that the results might be related to a change in older people’s attitudes towards living alone, as living alone might reduce the chance and severity of tension caused by intergenerational conflicts. Similarly, in a two-year follow-up survey in Japan, living alone was not identified as a significant risk factor of poor psychological well-being of 963 older people aged 65 years and above, after the adjustment for some confounders such as age, gender, marital status and health status (Kawamoto et al. 2005). Additionally, there was no statistically significant difference in overall QoL between older people living alone and those living with others in one community in Italy (Bilotta et al. 2012). In that study, 239 older community-dwelling out-patients who were 65 years and above and were consecutively referred to a geriatric medicine clinic completed the Older People’s Quality of Life Questionnaire (OPQOL; Bowling 2009). The mean score of overall OPQOL in two groups was 116.3 (living alone) and 115.8 (not living alone) respectively (p=0.81). In contrast, some studies have reported that older people living alone might have advantages for their health. Living alone lowered the risk of older people’s functional disability as they might have to deal with daily living activities by themselves (Lawton et al. 1984, Li et al. 2009). Mui and Burnette (1994) analysed the data from the 1982 National Long-Term Care Channelling Demonstration project and reported that American older people living alone had better self-rated health (p<0.0001), fewer chronic diseases (t=13.2, p<0.0001), less cognitive impairment (p<0.0001), and less functional 33 disability (t=32.4, p<0.0001) compared to those living with others. The results were consistent with the findings in 702 women aged 65 years and above that older people living alone reported fewer chronic diseases than those living with others (p<0.05), and scored the least impaired in cognitive function (p<0.05), physical self-maintenance (PSM) activities (p<0.05) and instrumental activities of daily living (IADLs) (p<0.01) (Magaziner et al. 1988). In addition, Michael et al. (2001) conducted a prospective longitudinal study among 28,324 female nurses aged 60 years and above to examine the association between living arrangements and functional health status. They reported that, after controlling for baseline physical function and other covariates, older women who lived alone were not at risk of decreased physical function during the four-year follow-up, and were not more isolated compared with those who lived with a spouse. Moreover, living alone was strongly associated with less risk of decline in mental health and was moderately associated with less risk of decline in vitality. Michael et al. (2001) pointed out that these older women living alone were neither socially isolated nor at increased risk of poor health status. They even fared better regarding psychological well-being compared to women living with a spouse. The results were similar to those reported by Sarwari et al. (1998) who conducted a two-year prospective study among a random sample of 619 older women aged 65 years and above and found that, for women without severe physical impairment, living alone was related to less deterioration in IADLs compared with living with a spouse (RR=0.60) or living with others (RR=0.62). Furthermore, Iliffe et al. (1992) pointed out that older people who lived alone did not seem to be an “at risk” group compared with those living with others, because there were no significant differences in the number of chronic 34 diseases, cognitive impairment and mobility impairment between these two groups. Furthermore, life satisfaction was higher among those living alone (χ2=4.54, p<0.05). In summary, there is little consensus as to the profile of older people living alone. On one hand, they were identified as having a poorer health status, higher levels of loneliness, less social support, a lower QoL and a higher risk of mortality in many studies. On the other hand, some researchers have reported that older people living alone were not a vulnerable group requiring specific assessment. These discrepant findings need to be further examined. Further, most of the studies were conducted in Western countries or in Hong Kong and Taiwan, and few were conducted in Mainland China. Taking into account that culture plays an important role in life experiences, a comprehensive understanding of the health status, life circumstances and QoL of older people living alone in Mainland China is needed. 2.4 Quality of life The increasing population of older people is a fulfilment of an ancient human desire for longevity, but it brings new demands to improve older people’s health, independence and active contributions to society, and to respond effectively to the physical, psychological and social challenges of older age (Bowling et al. 2002, Chen et al. 2013). In other words, the “quality” should be added to people’s extended lives. Thus, QoL has become a central point and research focus in many fields, such as medicine, health sciences and social sciences (Shek & Lee 2007). The term, which became commonly used in Western countries after World War II, initially referred to material wealth such as having a house, a car, more and better appliances, money to travel and 35 retire (Alexander & Willems 1981). Gradually, its use was broadened to other non-material factors (Lau & Mckenna 2001). With the change from a bio-medical model to a bio-psycho-social model and the increasing awareness that a good life did not merely mean a long life, QoL has been used in health care since mid-1970s (Jiang 2002). It has become popularised and attracted much research attention and internationally interest. 2.4.1 Definition and concepts of quality of life Although QoL has been used broadly by various researchers, its definition remains inconsistent reflecting different theoretical perspectives (Mogos et al. 2013). It is a multi-level concept which spans a wide range of topics and disciplines (Brown et al. 2004). Some researchers have defined QoL on the basis of objective indicators. For example, Schalock (1990) described QoL as: a “statistic of direct normative interest that facilitates concise, comprehensive, and balanced judgements about the conditions of major aspects of society” (p.144). Erikson (1993) believed that QoL was: “the individual’s command over resources in the form of money, possessions, knowledge, mental and physical energy, social relations, security and so on, through which the individual can control and consciously direct his living conditions” (p. 73). In addition, general health and functional ability were equated with QoL in some health care studies, where researchers focused on health which was defined by the World Health Organization (1946) as: “a state of complete physical, mental and social well-being” (p. 100). On the other hand, some researchers have tried to define QoL on the basis of the individual’s subjective perceptions. Abrams (1973) believed that QoL was the degree of satisfaction or dissatisfaction felt by people with various aspects of their lives. Andrews (1974) defined QoL as: “the extent to which pleasure and satisfaction 36 characterise human existence” (p. 280). Among the numerous studies aimed at understanding and explaining QoL, one of the influential definitions of QoL was developed by George and Bearon (1980), who described QoL from four dimensions, of which two were subjective and two were objective. The subjective evaluations were life satisfaction and related measures and self-esteem and related measures. The objective evaluations were general health and functional status and social economic status. Although these four dimensions may not assess the whole QoL, George and Bearon (1980) asserted that they were the four central dimensions. Lawton’s (1991) definition of QoL is also commonly cited and is described as: “the multi-dimensional evaluation, by both intrapersonal and social-normative criteria, of the person-environment system of an individual in time past, current and anticipated” (p. 6). This definition is characterised by socio-normative approaches in the objective dimensions (objective environment, behavioural competence) and individualistic approaches for the subjective dimensions (perceived QoL, psychological well-being), which were identified as important components of QoL by Lawton (Netuveli & Blane 2008). Later in 1995, The WHOQOL Group defined QoL as: “individuals’ perceptions of their position in life in the context of the culture and value systems in which they live and in relation to their goals, expectations, standards and concerns” (1995, p. 1403). This definition highlights the characteristics of QoL as subjective including both positive and negative facets of life, and multi-dimensional including physical domain, psychological domain, level of 37 independence, social relationships, environment and spirituality/religion/personal beliefs (The WHOQOL Group 1995). In summary, it is difficult to define QoL as different people have different opinions about their QoL, and “cultural, ethical, religious and other personal values influence perceptions of meaning and consequences of QoL” (Zhan 1992, p. 796). But it is well recognized that QoL is a multi-level and complex concept which comprises both objective and subjective dimensions and is dependent on the perceptions of individuals (Bowling et al. 2002). It is also noteworthy that QoL should not be used interchangeably with other terms such as happiness, morale, life satisfaction, well-being, successful ageing and health (Lau & Mckenna 2001). 2.4.2 Related factors of quality of life of older people The QoL of older people has attracted much research attention with the unprecedented population ageing (United Nations 2009). The goal of achieving a prolonged life has begun to shift to achieving a life “worth living”, that is adding “quality” to life to improve older people’s health, independence, activity, and social and economic participation (Bowling 2009). Assessment of older people’s QoL has become a commonly used end-point of health technology assessment and the stated end-point of policies aiming to promote active ageing (World Health Organization 2002). In order to assist older people to improve their QoL, it is important to know about the related factors of QoL. Moreover, the identification of related factors can help to develop theoretical models of QoL and inform interventions which aim to promote QoL. 38 However, different people have used different definitions of QoL, which has resulted in diversity and no widely accepted measurements. Some researchers assert that QoL can be assessed by using objective indicators, such as income, education and health status, which have the advantage of not being influenced by observer bias (Farquhar 1995). In contrast, some have proposed to use subjective indicators such as life satisfaction, self-esteem and happiness. They have argued that objective indicators are insensitive to the feelings of people and their reliabilities are difficult to measure, whereas subjective indicators reflect people’s responses, feelings and perceptions of their lives which are real and the basis of their actions (Farquhar 1995). Therefore, taking account of people’s subjective feelings of their lives is a useful way to assess QoL and to broaden the understanding of its concept (Lee 2005). However, some researchers have argued that QoL cannot be measured purely by either an objective approach or a subjective approach rather that it should be measured holistically (Shek et al. 2005, Zhan 1992). Despite the variation in the measurements of QoL, several related factors have been identified in previous studies using a systematic approach to literature identification and a narrative synthesis. The systematic literature review conducted to identify the key related factors of QoL of older people in China is in Appendix 1. 2.4.2.1 Health status Growing old is often associated with disease, frailty and dependency, and thus ill-health is widely regarded as an outcome of life course and age-related inequality (Milne et al. 2007). Health plays a dominant role in influencing people’s life satisfaction and happiness (Michalos et al. 2000). The importance of health to older people’s QoL has been identified in many 39 studies (Kunzmann et al. 2000, Michalos et al. 2000). Bowling (1995) pointed out that the older the person was, the more likely it was that health was identified as the most important factor influencing their QoL. General health, physical health, mental health and functional ability are often used as indicators to reflect older people’s health status. General health Cheng et al. (2004) used a mixed methods approach to identify the determinants of QoL of older people in Hong Kong. They first conducted five focus groups involving 52 older people representing different ages (60-74 years and 75 years or above) and socio-economic backgrounds (lower-class and middle-class). The participants were asked to describe what QoL was from their own perspectives which generated a total of 99 statements. A questionnaire comprising these statements was then administered to 1616 older people and factor analysis was used to explore the important factors of QoL. Finally, eight focus groups involving 62 older people confirmed the factors with health being identified as the primary concern of QoL. Similarly, in Lau et al.’s (1998) study, all participants in two focus group interviews rated good health as the most important for them to have a good life. A high QoL was achievable if they had fewer diseases, less pain and the ability to perform activities of daily living (ADLs) and normal life roles. In quantitative studies, self-rated health has been broadly used as a reliable, sensitive and easily obtained measurement of the general state of health (Ocampo 2010). Its significant relationship with QoL has been reported in previous studies with older people perceiving good health reporting a higher QoL (Chou & Chi 1999, Low & Molzahn 2007, Woo et al. 2005). 40 Lee et al. (2006) recruited a convenience sample of 1920 older people aged 65 years and above from 32 senior centres and 242 public health centres in Korea to conduct a correlational survey. Self-rated health was assessed by three items developed by the research team but their development was not described explicitly. QoL was measured using the 12-item Short Form Health Survey (SF-12; Ware et al. 1996). Lee et al. (2006) found a positive relationship between self-rated health and QoL (r=0.49, p<0.001). They further reported that self-rated health had a predictive effect upon QoL (β=0.32, p<0.001). Self-rated good health was considered to contribute to a high QoL by enhancing the positive perceptions of an individual’s health as well as enhancing the older person’s ability to engage in health promoting behaviours (Lee et al. 2006). However, the convenience sampling method may have limited the representativeness of the sample and the generalisability of the study findings. In Malaysia, a multi-stage stratified sample of 299 older people aged 60 years and above who lived alone were interviewed with QoL being measured using one single item, “In general, how do you perceive your QoL?” (Yahaya et al. 2010). Self-rated health was found to be significantly associated with QoL (χ2=26.61, p<0.01). Self-rated health was further identified as a predictor of QoL in the multinomial logistic regression model. Older people who rated their health as poor were more likely to report a low QoL (OR=0.12), while those who rated their heath as good were more likely to report a high QoL (OR=3.06). In addition, Halvorsrud et al. (2010) conducted a cross-sectional survey among a stratified random sample of 89 Norwegian people aged 61-90 years old to explore predictors of their QoL. The WHOQOL Assessment for Older 41 Adults (WHOQOL-OLD; The WHOQOL-OLD Group 2005) was used to measure QoL, and one single-item question: “How satisfied are you with your health?” was used to measure self-rated health. The results of a path analysis showed a direct effect of self-rated health upon QoL. Additionally, self-rated health was a mediator between environmental factors, such as satisfaction with dwelling conditions, feelings of safety in daily life, access to health services and social activities, and QoL. Despite the small sample size, the importance of self-rated health in older people emerged as an influencing factor of QoL. The important effect of self-rated health upon QoL is supported in another study of 360 older people aged 60 years and above in China (Zhang et al. 2008). In the bivariate analysis, QoL, which was measured using the Index of Well Being (IWB; Fan 1999a), differed across the self-rated health groups (F=5.97, p<0.001). Further, self-rated health was found to directly affect QoL in the path analysis. In addition, gender, education and income affected QoL indirectly via self-rated health. However, caution must be applied, as this study was conducted in a low economic rural area of China and the findings might not be generalised to other areas. Physical health Physical health is one of the dimensions of health defined by the World Health Organization (1946). Chronic diseases are the major health problems of older people so that the presence of chronic diseases and the number of chronic diseases are sometimes used as the indicators of physical health. Jia et al. (2004) used the 36-item Short Form Health Survey (SF-36; Ware & Gandek 1998) to investigate QoL and its related factors among a random cluster sample of 198 older people aged 60 years and above living in one community 42 of a city in China. However, the reason that the community was selected as the study site was not clearly reported. The results of bivariate analyses showed that the presence of chronic diseases was significantly related to different dimensions of the SF-36 with older people having chronic diseases reporting a lower QoL. This finding was consistent with those reported in other studies (Liu & Guo 2008, Zhang et al. 2007). The presence of chronic diseases was identified as one of the predictors of QoL (β= -0.06, p<0.05) among a stratified random cluster sample of 590 older people aged 60 years and above in a rural area of a mountainous county in China (Liu & Guo 2008). In that study, older people were asked to indicate any chronic disease that they suffered, from a list of 28 conditions such as hypertension, diabetes, heart disease and cancer. QoL was measured using the 13-item version of the Life Satisfaction Index (LSI-Z; Wood et al. 1969). Older people who reported having chronic diseases were more likely to report a low QoL. The results confirmed the importance of physical health to older people’s QoL, regardless of the study’s weakness regarding generalisability due to its restricted location. In order to explore the influencing factors of QoL of older people in one city in China, Zhang et al. (2007) recruited a random sample of 378 residents aged 60 years and above and utilised the European Quality of Life-5 Dimensions (EQ-5D; The EuroQol Group 1990) for the measurement of QoL. The results of the bivariate analyses showed that there were no significant differences in QoL across a variety of independent variables except the presence of chronic diseases. Older people who had chronic diseases scored higher on the EQ-5D (p<0.001). Moreover, having chronic diseases was the most significant predictor of low QoL in the multiple linear regression model 43 (β=0.22, p<0.001). In Chan et al.’s (2006a) study, physical health was measured using the Physical Health Problem Checklist comprising 15 common health problems (Yip 2003). Chan et al. (2006a) found that the number of diseases was negatively correlated with QoL which was measured using the WHOQOL-BREF (The WHOQOL Group 1998) among 179 older people aged 65 years and above in Hong Kong (r= -0.27, p<0.01). However, it had no significant impact upon QoL in the multiple regression analysis. Similarly, there was a negative correlation between the number of diseases and QoL in Lee’s (2005) study, where QoL was measured using a single item (r= -0.30, p<0.01). In addition, the number of days in hospital and the number of days confined to bed for most of days in the previous three months were used as indicators of physical health. Lee (2005) found that staying in hospital and in bed for fewer days were both significant variables correlated with higher QoL (r= -0.21, p<0.05; r= -0.32, p<0.001) with the number of days in hospital emerging as a predictor of QoL (β= -0.21, p<0.01). Furthermore, in a longitudinal survey conducted among a stratified random sample of 260 older people aged 70 years and above (Chou & Chi 1999), QoL at three-year follow-up was bivariately associated with physical health. QoL was measured by the Life Satisfaction Index-A Form (LSI-A; Neugarten et al. 1961), and physical health was measured by chronic diseases, somatic complaints and visual ability. Older people who reported less chronic diseases, less somatic complaints and good vision were more likely to report a high QoL. The results highlighted the determinative effect of physical health upon QoL. However, it is worth noting that these results were based upon the 44 data from nearly twenty years ago. Mental health Depression Old age is a phase in life where there is a greater probability of social disruptions such as bereavement, physical disability, cognitive decline, diminishing social resources and role transions, all of which contribute to depression (Netuveli & Blane 2008). Depression is the most frequent mental disorder in old age with almost one in six older people experiencing late life depression (Xie et al. 2010). Depression can lead to increased costs related to non-mental health problems (Unutzer et al. 1997) and an increase in mortality from other diseases such as heart disease, myocardial infarction and cancer (Mykletun et al. 2007). It is also an important cause of suicide in older people (Kaneko et al. 2007). The World Health Organization (2004) has estimated that depression will be the second leading cause of disease burden worldwide by the year 2020. Many previous studies have demonstrated the relationship between depression and low QoL (Chou & Chi 1999, Liu & Guo 2008, Woo et al. 2005). Chan et al. (2006a) compared the QoL of 80 clinically diagnosed major depressive disorder patients aged 65 years and above with those of 179 non-depressed older people, and found that the depression group reported significantly lower scores in QoL than the non-depression group (t=18.3, p<0.001). Depression, measured by the 15-item Geriatric Depression Scale (GDS; Sheikh & Yesavage 1986), had a moderately negative correlation with QoL in two groups, and was the most important predictor that contributed significantly to the variance in QoL (in depression group: r= -0.53, β= -0.47; in non-depression group: r= -0.66, β= -0.47). The findings supported those of 45 Brett et al. (2012) who reported that depression had a considerable impact upon older people’s approach and response to life circumstances and had the greatest influence on QoL. Depression together with other variables were predictors of low QoL in a study with a stratified random sample of 1248 Swedish older people who were 75 years or older and returned the postal questionnaire (Hellstrom et al. 2004). In that cross-sectional survey, QoL was measured using eight questions selected from a questionnaire based on the Life Quality Gerontology Centre Scale, Lund (Nordbeck 1996), however, the measurement of depression was not described. In another study conducted in Sweden, depression was a strong explanatory factor for the variance of QoL (β= -0.66, p<0.001) among a random sample of 199 older people aged 85 years and above (von Heideken Wagert et al. 2005). The participants were interviewed using the 15-item GDS (Sheikh & Yesavage 1986) as the depression measurement tool and the 17-item Philadelphia Geriatric Center Morale Scale (PGCMS; Lawton 1975) as the QoL measurement tool. The results of the multiple regression analysis showed that older people with no depression were more likely to report a higher QoL. Depression was also found to have the strongest impact upon QoL by Chachamovich et al. (2008) who reported that even a slight increase in depression levels was associated with a significant decrease in QoL. A total of 4316 older people aged 60 years and above from Europe, Asia, South America and North America participated in that study and completed the 15-item GDS (Sheikh & Yesavage 1986), the WHOQOL-BREF (The 46 WHOQOL Group 1998) and the WHOQOL-OLD (The WHOQOL-OLD Group 2005). The results of the hierarchical multiple linear regression showed that depression accounted for the vast majority of the variance of the WHOQOL-BREF scores (β= -0.61, p<0.05; R2 change=0.36) and the WHOQOL-OLD scores (β= -0.66, p<0.05; R2 change=0.42). As reported in some studies, depression had an impact upon many aspects of people’s lives. It leads to physical decline, impaired daily functioning, an increase in chronic illnesses, more feelings of hopelessness and helplessness, and a decrease in social activities (Chan et al. 2006b, Chen et al. 2012). Its detrimental effects upon both physical and psychological health of older people eventually impaired their QoL. Cognitive function Cognitive impairment is associated with the ageing process and is one of the main mental health problems of older people (Powell & Whitla 1994). It has been identified as decreasing QoL through the decreased functional ability, role participation and socialisation, and the increased rates of depression (Lau & Mckenna 2001). Deng et al.’s (2010) study, which measured cognitive function using the Mini Mental State Examination (MMSE; Folstein et al. 1975), found a positive correlation between cognitive function and QoL as measured by the PGCMS (Lawton 1975) in a cluster sample of 732 older people aged 90 years and above (r=0.19, p<0.001). Cognitive function was also an important predictor of QoL with a better function being associated with a higher QoL (β=0.14, p<0.001). Considering that the participants were the “oldest old” (above 90 years old) and the response rate were low (51.5%), the generalisability of the study findings may be problematic. 47 In Canada, St. John and Montgomery (2010) compared the QoL of older people with differing cognitive status. They categorised 1620 older people aged 65 years and above into three groups: normal, cognitive impairment no dementia (CIND) and dementia, according to both their scores of the modified MMSE (3MS; Teng & Chui 1987) and the results of a clinical examination for dementia. Life satisfaction was used as the indicator of QoL and was assessed by the Terrible-Delightful Scale (Michalos 1980). The results of the bivariate analyses showed that older people with dementia or CIND had lower QoL scores than those with normal cognition (F=11.47, p<0.001). Furthermore, cognitive function was significantly related to QoL even after other factors being controlled for in the linear regression model (β=0.02, p<0.05). This result was similar to that of Missotten et al.’s (2008) study of 465 older Belgian people. The scores of the Alzheimer Disease related Quality of Life (ADRQL; Rabins et al. 1999) in the dementia group were significantly lower than those in the mild cognitive impairment and normal cognition groups (p<0.005), however, there were no significant differences between the latter two groups. Within the dementia group, cognitive function, which was measured using the MMSE (Folstein et al. 1975) and cognitive scale of the Cambridge Examination for Mental Disorders of the Elderly (CAMCOG; Roth et al. 1986), was positively correlated with QoL (p<0.001) and had a significantly independent impact upon QoL (β=0.07, p<0.001). It showed that cognitive function was related to QoL with older people having a poorer cognition reporting a lower QoL. Functional ability Old age is generally accompanied by frailty, proneness to illness and the 48 experience of physical discomfort, which may prevent people conducting tasks independently in their daily lives (Lau et al. 1998). Therefore, the assessment of older people’s functional ability can reflect their health status. It has been demonstrated that being able to take care of oneself and being functionally independent are valued by older people, and thus functional ability may have an impact upon their QoL (Chan et al. 2006a). Four studies (Chan et al. 2006a, Chou & Chi 1999, Deng et al. 2010, Woo et al. 2005) conducted in China indicated a significant relationship between older people’s functional ability and their QoL. Functional ability was shown to be bivariately associated with QoL with older people having limitations in PSM activities or IADLs reporting a lower QoL. In these studies, functional ability was measured using different scales including the Barthel Index (Mahoney & Barthel 1965), the 15-item Modified Barthel Index (MBI; Woo et al. 1994), the IADL Scale (Lawton & Brody 1969), the ADL Scale (Zhang et al. 1995) and a researcher-developed composite scale. In Turkey, a total of 1301 people aged 65-91 years old were recruited to investigate their QoL and functional ability, among whom 1.4% were dependent, 21.2% were partially dependent and 77.4% were independent according to the results of PSM and IADL scales (Arslantas et al. 2009). The findings indicated the effect of functional ability upon QoL with those being independent reporting the highest QoL while those being dependent reported the lowest QoL (F=81.86, p<0.001). The results were partially echoed in another study in Turkey addressing the relationship between functional ability and QoL among older people with a chronic disease (Ozturk et al. 2011). In that study, functional ability was evaluated using the Functional Independent Measure (FIM; Kucukdeveci et al. 2001) and Physical Mobility Scale (PMS; Nitz et al. 2006), and QoL was assessed using the Nottingham Health Profile 49 (NHP; Kucukdeveci et al. 2000). The significant correlations between FIM, PMS and NHP were found in women but not in men. However, the convenience sampling method and the small sample size (n=100) undermine the quality of Ozturk et al.’s (2011) study, and limit the complex multivariate analyses for investigating the predictive effect of cognitive function upon older people’s QoL. The significant relationship between functional ability and QoL was also demonstrated in a study conducted in Korea (Lee et al. 2006). Functional ability included the ability to carry out PSM activities and IADLs, however, the detailed scale information was not reported. In the bivariate analyses, the PSM and IADL scores were negatively correlated with the QoL score (r= -0.38, -0.43; p<0.001). PSM was further identified as one of the important influencing factors of QoL in the multiple regression analysis (β= -0.18, p<0.001). The results were consistent with those of Paskulin et al.’s (2009) study of a random sample of 288 Brazilian older people aged 60 years and above, with those being less dependent on ADL, as measured by the Older American Resources and Services Scale (OARS; Fillenbaum 1984), reporting a higher QoL which was measured using the WHOQOL-BREF (The WHOQOL Group 1998). Moreover, Asawaka et al. (2000) stated that functional health status was a prerequisite for higher QoL in older people. They conducted a longitudinal survey to investigate the effect of functional decline upon the QoL among 692 Japanese older people aged 65 years and above. During a two-year period of follow-up, the participants who experienced functional decline showed a large decline in QoL. 50 2.4.2.2 Loneliness Loneliness can be defined as a deficit between actual and desired levels of social contact, which is a subjective aversive emotional state reflecting the lived experience of individuals in their social world (Luanaigh & Lawlor 2008, Yang & Victor 2008). Loneliness may occur in people of all ages but it is believed to be a common and more serious problem for older people, because they have reduced social contacts due to ill health, disability, the loss of intimate relationships and the loss of a role in society with ageing (Heylen 2010). An extensive literature has demonstrated the adverse impact of loneliness upon physical and psychological health, such as cognitive decline, depression, anxiety, stress and the increased risk of all-cause mortality and suicide, which may eventually impair QoL (Lauder et al. 2004, Penninx et al. 1997, Rubenowitz et al. 2001, Sevil et al. 2006, Tilvis et al. 2000, Victor et al. 2000). In Liu and Guo’s (2007, 2008) study, loneliness measured using the UCLA Loneliness Scale (Russell et al. 1980) was identified to be significantly negatively correlated with all the dimensions of the SF-36 (Ware & Gandek 1998) (p<0.01). Loneliness was further identified as an important predictor of QoL for all the participants (β= -0.11, p<0.001), and the second strongest predictor of QoL for the empty-nest older people (i.e. older people living alone or living with a spouse only) (β= -0.19, p<0.001), with those reporting a higher level of loneliness being more likely to report a lower QoL. The findings were consistent with another study using the same measurements of loneliness and QoL (Chen & Huang 2005) In Sweden, 4278 older people aged 75 years and above were recruited to a study exploring the relationship between QoL and loneliness, social networks 51 and other factors (Ekwall et al. 2005). In that study, the participants were asked about their intense feelings of loneliness, whether they thought they were lonelier than others of the same age, and whether they had experienced feelings of loneliness during the last year. All of the questions were used to measure loneliness. QoL was assessed using the SF-12 (Ware et al. 1996). In the logistic regression analysis, the three loneliness items were shown to have statistical significance, indicating the predictive ability of loneliness regarding lower QoL (p<0.05). As loneliness is a complex phenomenon, there are several competing theoretical perspectives on loneliness and approaches to its definition (Yang & Victor 2008). Given that “loneliness” and “social isolation” are sometimes referred to interchangeably, the relationship between social isolation and QoL can be interpreted as the relationship between loneliness and QoL. For example, Hawton et al. (2011) investigated the impact of social isolation upon the QoL among 393 older people aged 50 years and above in the United Kingdom (UK). The participants were categorised as being “at risk of social isolation”, “social isolation” and “severe social isolation” according to their frequency of contact with family, friends or neighbours. QoL was measured using the EQ-5D (The EuroQol Group 1990) and the SF-12 (Ware et al. 1996). The two QoL measurement scores of the “severe social isolation” group were significantly lower than those of other two groups (p<0.01). In addition, social isolation was found to be independently related to the EQ-5D and the SF-12 when other variables were accounted for (β= -0.11, -0.10; p<0.01). As the participants were those deemed to be socially isolated or at risk of social isolation who differed from those being not socially isolated, Hawton et al. (2011) advised cautious interpretation of the strength of the relationship between social isolation and QoL. 52 Furthermore, in a prospective two-year follow-up cohort study of 2808 older people aged 55 years and above in Singapore, loneliness was found to be a robust related factor of and a strong contributor to QoL (Lim & Kua 2011). The participants were asked whether they felt lonely at the present moment. QoL was assessed using the mental component summary scale (MCS) of the SF-12 (Ware et al. 1996). At baseline, older people who felt fairly lonely or very lonely (denoted as “lonely”) reported a lower QoL than those who did not feel lonely (t= -7.81, p<0.001). Loneliness was associated with lower QoL when covariates were controlled for, and its contribution to QoL was greater than other factors (R2=0.095, p<0.001). Moreover, the baseline loneliness was also significantly associated with lower QoL at two-year follow-up (R2=0.145, p<0.001). 2.4.2.3 Social support Social support refers to the social resources that individuals perceive to be available or are actually provided to them by non-professionals in the context of both formal support groups and informal helping relationships (Wong et al. 2007). It is a natural product of the relationships that exhibit certain properties or involve certain types of interactions, which can fill the gap between the social network and the need for social contact (Kuhirunyaratn et al. 2007). Social support is a key environmental factor enhancing older people’s health, participation and security. It can decrease loneliness and depression, reduce the risk of cognitive impairment, improve psychological well-being and life satisfaction, and is a predictor of survival of the very old (Aquino et al. 1996, Chalise et al. 2010, Deng et al. 2010, Fratiglioni et al. 2000, Yeh & Lo 2004). 53 More than a decade ago, Farquhar (1995) pointed out the importance of social support as a valued component of a high QoL. She reported that, among 210 older people who were 65 years and above and lived in the UK, family relationships were mentioned most frequently as the thing which gave their life quality. Other important social support aspects reported were social activity and social contacts with others. Later in two studies conducted in Hong Kong (Cheng et al. 2004, Lau et al. 1998), one adopted a qualitative method and the other adopted a mixed methods approach, most participants highlighted social support as being important for a good life. They valued interpersonal relations and engagement in social interactions which made them livelier and happier in their old age. Using the Social Support Rate Scale (SSRS; Xiao 1999) and the Family APGAR (Smilkstein 1978), Deng et al. (2010) found that both of the instruments’ scores were positively correlated with the PGCMS (Lawton 1975) score (r=0.16, 0.35; p<0.001), and family support was the strongest predictor of QoL of the very old in China (β=0.33, p<0.001). Besides the positive correlation between the overall SSRS and PGCMS, three dimensions of the SSRS, namely, objective support, subjective support and support utilisation were also identified to be correlated with the PGCMS and its different dimensions. This finding was similar to those reported in other studies regarding the relationship between QoL and social support using the SSRS (Huang et al. 2005, Liu & Guo 2008, Wang et al. 2010, Yu et al. 2008). In addition, in some studies (Phillips et al. 2008, Sun et al. 2011, Zhang et al. 2008) social support was assessed under two categories, namely, quantity of support and quality of support. The quantity of social support referred to social network size, frequency of social interaction and support level derived 54 from social networks. The quality of social support referred to satisfaction with the support received from different social support sources. Both categories played vital roles in promoting QoL. Older people who had a smaller social support network, received less support, did not have contact with other people regularly and were not satisfied with their social support reported a lower QoL. Qian and Zhou (2004) analysed data from the first phase of the CLHLS conducted in 1998 to examine how different sources of social support affected the QoL of older people aged between 80 and 110 years. Social support included two dimensions: objective behaviours and subjective perceptions. Objective behaviours were measured based on living arrangements and whether non-resident children visited regularly. Subjective perceptions were measured based on whether the participants would receive care if they became sick. QoL was measured using a single question of, “How would you rate your self-reported QoL?” The results of the logistic regression analyses provided strong evidence of the benefit of social support to QoL. Older people living in a nursing home were more than twice as likely to report a high QoL as those living with their children (OR=2.41, p<0.01), while those living alone were least likely to report a high QoL (OR=0.44, p<0.01). Qian and Zhou (2004) asserted that living arrangements represented sources of received support, and that support from peers, friends or community were more positively associated with QoL than support from family members. On the other hand, compared with older people who did not receive children’s regular visits, those being visited by children regularly were 48% more likely to report a high QoL (OR=1.48, p<0.01). Regarding the subjective perception, its effect upon QoL was stronger than 55 objective behaviours. Older people who perceived that their family members would take care of them if they were sick were 3.48 times as likely to report a high QoL than those who perceived that nobody would help them (OR=3.48, p<0.01), and those who perceived that non-family members would take care of them were 2.68 times as likely to report a high QoL (OR=2.68, p<0.01). Similarly, the results from one study in Nepal (Chalise et al. 2007) also showed that different sources of social support had different effects upon QoL despite the small sample size and the restricted study site. A total of 177 older people (60 years and above) from one caste/ethnic group were recruited to investigate their social support, QoL and other information. Social support was measured using a researcher-developed questionnaire comprising questions about various types of social support received (SSR) and social support provided (SSP) during the last one year. QoL was measured using the Life Satisfaction Index K (LSIK). The logistic regression analyses showed that receiving support from spouse and children living together, and providing support to spouse, children living together and children living apart were statistically significant in improving either males’ or females’ QoL (p<0.01). 2.4.2.4 Physical activity There is no consistent definition of physical activity. It has been defined as housework, exercise, leisure activities or occupational activities across different studies (Poon & Fung 2008). Broadly defined, physical activity refers to any bodily movement produced by skeletal muscles that requires energy expenditure (World Health Organization 2010). The World Health Organization (2005) has reported that being engaged in physical activity can delay functional decline and the onset of chronic diseases, improve mental 56 health and promote social contacts. Physically active older people can maintain healthy functioning longer than sedentary older people (Landi et al. 2007). Physical inactivity on the other hand can be the strongest behavioural predictor of depression and disability (Lautenschlager et al. 2004), and has been identified as the fourth leading risk factor for global mortality (World Health Organization 2010). Adequate physical activity may contribute to higher QoL through improving functional ability, enhancing psychological well-being and promoting social interactions (Paskulin et al. 2009, Shibata et al. 2007). Lee et al. (2006) reported that there was a statistically significant increase in the QoL of the older people who were physically active (t=5.15, p<0.001), and adequate physical activity was a significant predictor of a high QoL (β= -0.06, p<0.05). In this study, the participants who engaged in exercise at least three times per week and 30 minutes per session were identified as physically active. The positive effect of adequate physical activity was emphasised in a study conducted in Spain (Salguero et al. 2011), where 436 older people were recruited to investigate the relationship between physical activity and QoL with the Yale Physical Activity Survey (YPAS; Dipietro et al. 1993) and the SF-36 (Ware & Gandek 1998) being used as measurement tools. The results of the Pearson correlation analysis showed that physical activity was significantly correlated with different dimensions of the SF-36. Furthermore, the results of the multivariate analysis of covariance (MANCOVA) demonstrated an important effect of physical activity upon QoL. The scores of various dimensions of the SF-36 differed between the less and more active older people with those being more active having higher scores on the SF-36. 57 Similarly, in Acree et al.’s (2006) study, the scores of all dimensions of the SF-36 (Ware & Gandek 1998) were higher among the older people who regularly participated in physical activity of at least moderate intensity for more than one hour per week (higher physical activity) than those who were less physically active (p<0.05). A total of 112 people aged 60-89 years old were recruited to the study, and their physical activity level was assessed using the Johnson Space Center physical activity scale (Jackson et al. 1990). In addition, after adjusting for gender and hypertension, the higher active group still had higher scores in five dimensions of the SF-36 (p<0.05), indicating the predictive effect of physical activity upon QoL. However, it is noted that the participants were recruited from newspaper advertisements and media flyers posted in public facilities, which might have resulted in selection bias. Together with the small sample size, the results may therefore not be generalisable to other older populations. The relationship between physical activity and QoL was also investigated among 1005 older people in Sweden (Rennemark et al. 2009). Self-reported light and strenuous physical activity, as measured by asking the frequency of engaging in light/intensive exercise during the last 12 months, were identified to be positively correlated with four indicators of QoL, i.e. well-being, engagement, emotional support and social anchorage. Furthermore, the results of the multivariate logistic regression showed an independent and beneficial effect of light and strenuous physical activity upon different QoL indicators. Rennemark et al. (2009) pointed out that the beneficial effect of physical activity might be connected with generating pleasure and relaxation. Adequate physical activity was also identified as having long-term and multi-faceted benefits upon the QoL of older people (Kahana et al. 2002). A 58 random sample of 1000 older people aged 72 years and above participated in the baseline survey with 357 remaining in the study after an eight-year follow-up. The participants were asked how often they participated in sports or other exercise activities from “rarely or never” to “several hours a day”. After adjusting for socio-demographic variables, baseline measures of the relevant outcome variables and the number of chronic diseases at baseline, physical activity was found to contribute to some QoL indicators. Older people who exercised more often reported less limitations in IADLs (β= -0.13, p<0.01), a higher level of positive affect (β=0.11, p<0.05), more sense of meaning in life (β=0.11, p<0.05) and a decreased risk of mortality (OR=0.86, p<0.01). In addition, one randomised controlled trial conducted in the UK has confirmed the efficacy of physical activity for improving older people’s QoL despite the small sample size (McMurdo & Burnett 1992). Eighty-seven older people aged 60-81 years were randomly allocated to an exercise group or health education group. Those in the exercise group attended a 45-minute aerobic exercise class three times per week. After a 32-week intervention, the participants in the exercise group showed significantly higher QoL in comparison with the baseline data (p<0.001). Their QoL were also higher than those in the health education group (p=0.05). 2.4.2.5 Housing Housing has been identified as the single-most important element in the life of older people, aside from their spouses or significant others (Phillips et al. 2004). Older people have more ties and binding memories with their home than young people because they spend a large part of their time there which 59 may partly be due to the lack of travel for work and the possibly restricted physical mobility (Phillips et al. 2004, Phillips et al. 2005, Pynoos & Regnier 1991). The results of time-use surveys conducted in New Zealand showed that older people spent more than 90.0% of their time indoors, mostly in their home (Baker et al. 2007). Housing encompasses many physical attributes which are integral to life (Zebardast 2009). Housing is also the focal point of intimate relationships, relationships with friends and relatives, and leisure relationships. It has certain benefits for physical health and psychological well-being (Perez et al. 2001). The participants in two studies conducted in Hong Kong expressed that “having a comfortable residence” “with essential facilities” gave them a feeling of satisfaction (Cheng et al. 2004, Lau et al. 1998). In Evans et al.’s (2002) study, dwelling conditions including infrastructure, amenities, support for mobility impairment and spatial requirements were significantly related to the QoL (β=0.32, p<0.001) among a sample of 497 American older people who were at least 60 years old and living independently in the community. Older people who had a poorer quality of dwelling conditions reported less positive psychological well-being. One reason might be that dilapidated dwelling conditions were perceived as evidence of failure in life and the inability of escape from adverse situations (Phillips et al. 2005). In a study examining the QoL of a random sample of 133 older people aged 75 years and above in Sweden (Iwarsson & Isacsson 1997), housing was found to have a bivariate correlation with QoL (r= -0.37, p<0.001). In that study, objective housing accessibility, which was measured using the Enabler (Iwarsson & Isacsson 1996), was utilised as the indicator of housing. QoL was measured using the Goteborg Quality of Life Instrument (Tibblin et al. 1990). 60 The results indicated that the more housing accessibility problems that the participants reported, the lower QoL they had. Iwarsson and Isacsson (1997) emphasised that inaccessible housing represented a potential health problem and threatened the independence of older people, thus housing evaluation was valuable regarding any QoL investigation and intervention. On the other hand, some researchers (Levy-Leboyer & Ratiu 1993, Schwirian & Schwirian 1993) have argued that the subjective aspect, namely, residential satisfaction had greater influences upon QoL than the dwelling conditions. Residential satisfaction, which refers to the individual’s appraisal of the conditions of their residential environment in relation to their needs, expectations and achievements, was identified as taking a mediating role between dwelling conditions and QoL in Phillips et al.’s (2005) study. A total of 518 older people aged 60 years or above living in Hong Kong were recruited to the study. The results of the bivariate analyses showed that both dwelling conditions and residential satisfaction were positively correlated with QoL which was measured using five items extracted from the WHOQOL-BREF (The WHOQOL Group 1998) (p<0.001). Moreover, the results of a multivariate analysis showed that the effect of dwelling conditions upon QoL was fully mediated by residential satisfaction. The participants who perceived their dwelling conditions as unsatisfactory with respect to their dwelling expectations and needs were more likely to report a lower QoL. The study findings were partially consistent with those of Lee’s (2005) study, where residential satisfaction had a positive correlation with QoL (r=0.21, p<0.05) but had no significance in the regression model. Smith et al. (2004) analysed both objective and subjective aspects of housing and their relationships with QoL among 600 older people who were 60 years 61 and above and lived in deprived areas in the UK. Nine questions regarding various housing problems such as a shortage of space, lack of adequate heating facilities and leaky roof were used to assess objective housing properties. In addition, the participants were asked to rate their residential satisfaction from “very satisfied” to “very dissatisfied”. Two standard measurements, i.e. the PGCMS (Lawton 1975) and the Satisfaction with Life Scale (SWLS; Diener et al. 1985) in addition to one single-item question were used to assess QoL. The results showed that housing problems and residential satisfaction were correlated with the three QoL measures with older people reporting less housing problems or more residential satisfaction being likely to report a higher QoL (p<0.01). The study demonstrated the significant relationship between housing and QoL despite the limitation that the sample was restricted to older people living in deprived areas and being more socially disadvantaged. 2.4.2.6 Socio-demographic factors Age QoL is perceived to change during the lifespan. Older people have a growing risk of age associated diseases and progressive impairment of function with ageing, which may induce a lower QoL (Ren 2002). Deterioration in QoL with increasing age has been identified in many studies. Aghamolaei et al. (2010) investigated a random sample of 1000 older people and found that those aged 75 years and above reported more problems in most dimensions of the SF-36 (Ware & Gandek 1998) than those aged 60-74 years (p<0.05). Chen et al. (2004) also found a significant relationship between age and QoL. The participants in that study were divided into five age groups with QoL differing across different age groups. In the Pearson correlation analysis, age was 62 negatively correlated with almost all the dimensions of the SF-36 (p<0.01). The bivariate relationship between age and QoL has been repeated in other studies (Arslantas et al. 2009, Jia et al. 2004, Lee 2005, Zhang et al. 2008, Zhao et al. 2009) Additionally, age was a predictor of QoL regardless of other factors. In Aghamolaei et al.’s (2010) study, the age over 75 years increased the risk of decreasing physical (OR=2.69, p<0.001) and mental (OR=1.58, p<0.01) aspects of QoL. Hoi et al. (2010) used the EQ-5D (The EuroQol Group 1990) to investigate the QoL of 2873 Vietnamese older people aged 60 years and above, and found that the QoL remarkably decreased in advanced age groups. The variation in QoL by age group was greater after adjusting for the effects of other socio-demographic variables, and was greater when compared with those of the other factors. The results were consistent with those reported in some other studies (Mwanyangala et al. 2010, Sun et al. 2011, Zhang et al. 2007, Zhou et al. 2011). According to the results of a path analysis, Zhang et al. (2008) found that age influenced QoL indirectly through income level and education level. The “young old” (age between 60-74 years) generally had a higher level of income and education and thus reported a higher QoL. Moreover, advanced age was identified as the predictor of older women’s low QoL three years later (β= -0.17, p<0.05) in Chou and Chi’s (1999) longitudinal study in Hong Kong. However, in Paskulin et al.’s (2009) study advanced age was independently associated with higher QoL. The participants aged over 80 years rated their QoL higher than those aged 60-69 years on the psychological dimension (β=0.17, p<0.01) and social relationships dimension (β=0.13, p<0.05) on the 63 WHOQOL-BREF (The WHOQOL Group 1998) and the overall QoL (β=0.16, p<0.01). The results were explained by the interaction between age and ADL dependence. Paskulin et al. (2009) stated that ADL dependence had a stronger impact upon the QoL in the “young old” group because of the social expectations that the “young old” were more independent. The positive relationship between age and QoL has been supported by other researchers (Chen 2001, Uotinen et al. 2003). Gender In most studies, women were reported to be more likely to have a lower QoL (Abbasimoghadam et al. 2009, Chen et al. 2004, Guallar-Castillon et al. 2005, Haug & Folmar 1986, Jia et al. 2004, Mwanyangala et al. 2010). Chen et al. (2004) found that gender was significantly correlated with QoL among a random cluster sample of 1516 older people aged 65 years and above, with the scores of different dimensions of the SF-36 (Ware & Gandek 1998) in males being higher than those in females (p<0.01). The correlation between gender and QoL was still significant after adjustment for age (p<0.05). The results were supported by Abbasimoghadam et al. (2009) who found that women scored lower for all the dimensions and total SF-36. When the scores were adjusted for age, the differences between men and women remained significant (p<0.001). In addition, gender had an important effect upon the total score of the SF-36 in a stepwise regression model (p<0.05). Moreover, among a multi-stage cluster sample of 3260 older people aged 60 years and above in Spain (Guallar-Castillon et al. 2005), women were more than twice as likely to report a lower QoL as men. The odds ratio of suboptimal health on each dimension of the SF-36 (Ware & Gandek 1998) among women versus men ranged 2.01-3.45 (p<0.0001), indicating a 64 substantial gender difference in QoL. The data which were derived from 5131 interviews of people aged 50 years and above in rural Tanzania (Mwanyangala et al. 2010) provided further evidence. Women were found to be 27% (OR=1.27, p<0.001) more likely than men to report a lower QoL which was measured using the eight-item version of the WHOQOL instrument (Schmidt et al. 2006). Regarding the possible explanation that women tended to report a lower QoL, Zhou et al. (2011) pointed out that men earned more money than women and consequently had a higher social class which might enable a higher QoL. This was supported by the results of a path analysis in Zhang et al.’s (2008) study where gender influenced QoL indirectly via health status, income and education level. In addition, Guallar-Castillon et al. (2005) investigated the difference in QoL between men and women by evaluating the change in the odds ratio before and after the adjustment for socio-demographic, lifestyle, social network and health-related variables. The results showed that the adjustment for some socio-demographic variables, such as head-of-family status and education level, and lifestyle variables such as physical activity and body mass index, reduced the odds ratio on some dimensions of the SF-36 (Ware & Gandek 1998). It seemed that these variables explained the gender difference in QoL. Pinquart and Sorensen’s (2001a) meta-analysis drew the similar conclusion. They synthesised findings from 300 empirical studies on gender difference in QoL and found that older women reported significantly lower QoL. However, the gender difference decreased when health, social resources and some socio-economic factors were controlled for. 65 Education Education level is often identified as a proxy for social class and an important factor related to QoL. People with a higher level of education have a greater opportunity for a good job, which consequently affects living standards and health care and increases the sense of control over lives (Hoi et al. 2010). Aside from this, a higher level of education provides the knowledge and life skills for better access to information and resources to promote QoL (Ross & Wu 1995). Although the categorisation of education level used are different, previous studies have found that people having a higher level of education reported a higher QoL (Hoi et al. 2010, Jia et al. 2004, Paskulin et al. 2009, Yahaya et al. 2010, Zhang et al. 2007, Zhang et al. 2008, Zhao et al. 2009). The participants in Zhang et al.’s (2008) study were dichotomised into “literate” and “illiterate” groups with the former scoring significantly higher on QoL than the latter (t= -3.53, p<0.001). Education level was further identified as the strongest predictor of QoL in the multiple linear regression model with older people having a higher level of education reporting a higher QoL (β=1.13, p<0.001). Education level, which was categorised as “formal” and “not formal” in Yahaya et al.’s (2010) study, was a statistically significant factor in differentiating the high QoL group from the normal group (OR=1.76, p<0.05). It was reported that older people who received a formal education reported a higher QoL. In Hoi et al.’s (2010) study, education level was grouped into “illiterate”, “read and write only”, “primary/secondary school”, and “high school and higher”. The results of the hierarchical linear regression analysis showed that literacy 66 was a good predictor of having a higher QoL (p<0.05). Older people who could read and write or had a formal education reported significantly higher EQ-5D (The EuroQol Group 1990) scores. In addition, education was categorised into three levels in Paskulin et al.’s (2009) study, i.e. “less than four years of schooling”, “elementary school”, and “high school/university level”. Education level was included into five multiple linear regression models respectively to evaluate its impact upon each dimension of the WHOQOL-BREF (The WHOQOL Group 1998) and the overall QoL. High school/university level was the predictor of the physical health (β=0.20, p<0.01), psychological (β=0.31, p<0.001) and environment (β=0.27, p<0.01) dimensions as well as overall QoL (β=0.19, p<0.05). While elementary school was the predictor of the psychological dimension (β=0.18, p<0.05) and overall QoL (β=0.20, p<0.01). The results demonstrated the predictive effect of education level upon QoL with older people having an elementary or higher level of education being more likely to report a higher QoL. Occupation The role of occupation in QoL is similar to that of education, being regarded as a proxy measure for social class or socio-economic status (Lin et al. 2008). Different occupations may result in differences in health, social adaptability, psychological well-being, life attitude and life satisfaction, thus leading to differences in QoL (Zhu & He 2005). Ning et al. (1999) randomly investigated 1109 older people aged 60 years and above and found that the QoL (measured by the LSI-A [Neugarten et al. 1961]) of older people who were engaged in non-manual occupations before 67 retirement was higher than that of those who were blue-collar workers and peasants, while peasants scored the lowest QoL (F=6.60, p<0.01). They concluded that the peasants were in a low social class and had a poor social adaptability which induced lower QoL. In Qian and Zhou’s (2004) study, previous occupation was grouped into “professional or governmental”, “worker or farmer”, and “housework or others”. QoL was found to differ across the occupational groups with the proportion of older people reporting a high QoL being highest in the “professional or governmental” group (p<0.01). Former professionals or government employees were 30% more likely to report a high QoL than workers or farmers (OR=1.30, p<0.05). In addition to previous occupation, the information of current employment was collected in Lin et al.’s (2008) study. The results of the regression analyses showed that previous occupation was an important predictor of the psychological dimension (β=0.93, p<0.01) and environment dimension (β=0.68, p<0.05) scores on the WHOQOL-BREF (The WHOQOL Group 1998), and the current occupation was a predictor of the social relationships dimension score (β=0.96, p<0.05). Older people who had not worked previously or did not work after retirement were regarded as having a poor socio-economic status which negatively affected their QoL. In Tehran, a multi-stage cluster random sample of 5600 older people aged 60-110 years was recruited to investigate their QoL and related socio-demographic factors (Abbasimoghadam et al. 2009). Previous occupation (housekeeper, private or state) and current occupation (employee, jobless or retired) were both selected as occupation-related variables. Both of 68 them had significant relationships with the overall SF-36 (Ware & Gandek 1998) in the bivariate analyses (p<0.001). Furthermore, previous and current occupations were identified to have independent effects upon QoL. Older people who had a previous state sector job reported a higher QoL than those having a private sector job or being unemployed, because a state sector job indicated a higher level of income and welfare and a financial security for a better life. With regard to current occupation, older people who were currently employed reported a higher QoL. It was suggested that being an employee increased the chance of having a regular income and maintaining relationships with others, and increased the feelings of personal efficiency, which had positive effects upon QoL (Abbasimoghadam et al. 2009). Financial status Financial status is a basic guarantee of the resources to sustain life. Only if the basic needs are met can people really experience a feeling of well-being (Zhang et al. 2008). It is related to a sense of security and self-esteem, confidence in life, and the coping resources available to individuals. It was identified as an important factor related to QoL through influencing older people’s physical, psychological and social health (Feinglass et al. 2007). Money was ranked the second most important QoL component by the participants in one qualitative study in Hong Kong (Lau et al. 1998). It was considered to be important for daily living expenses related to basic survival and participation in valued social activities. Similar results have been reported in some studies using monthly/yearly income as the indicator of financial status with older people having more income reporting a higher QoL (Jia et al. 2004, Zhang et al. 2008, Zhao et al. 2009, Zhou et al. 2011). A path analysis demonstrated a causal relationship between income and QoL (Zhang et al. 69 2008). It showed that income influenced QoL directly and had an indirect effect upon QoL via health status. In addition, some studies used the subjective indicator of self-perceived financial status to assess older people’s financial situation (Chou & Chi 1999, Lee 2005, Liu & Guo 2008, Woo et al. 2005). This indicator is identified to be more important than actual income as it reflects people’s satisfaction with their financial situation. Older people who reported that they had enough money to live on perceived a higher QoL than those who expressed financial strain in their daily lives. Self-perceived financial status was also identified as a strong determinant of the three-year-later QoL in a longitudinal study (Chou & Chi 1999), where financial status was assessed by asking the participants whether they had enough money for daily expenses and to what extent they would worry if the need for unexpected expenditure arose. In the bivariate analyses, financial status was moderately correlated with QoL three years after baseline (men: r= -0.44, p<0.001; women: r= -0.57, p<0.001). In the stepwise multiple regression analysis, financial status was significantly associated with three-year-later QoL in both male and female participants (β= -0.24, p<0.05; β= -0.24, p<0.01) with those having enough money and not worrying about unexpected expenditure reporting a higher QoL. 2.4.3 A brief summary of the literature regarding quality of life QoL is popular as an end-point in the evaluation of public policy and spans a wide range of disciplines with no widely accepted or supported definitive theory and measurements (Brown et al. 2004). It is a multi-dimensional 70 concept, and its interpretation is influenced by different cultural backgrounds. Promoting and improving people’s QoL is one of the most important goals in health and social care, especially in the care of older people where cure or complete relief is not always possible (Borglin et al. 2006). There is a substantial amount of literature addressing related factors of older people’s QoL. Some factors have been identified across the studies, such as health status including physical health, mental health and functional ability, loneliness, social support, physical activity, housing, and some socio-demographic factors (Table 2.1). Understanding the related factors of QoL is necessary for developing a QoL model. It is also needed to identify vulnerable groups who are at risk of low QoL so that appropriate interventions can be developed to improve their QoL. However, the majority of the reviewed studies had relatively small sample size and adopted a convenience sampling method. Some studies were carried out in a restricted area (e.g. rural area or economically deprived area) or one single site. In some studies, variables were measured using un-validated instruments or the instruments were not reported clearly. These methodological issues could therefore limit the generalisability of their results. In addition, some studies were conducted more than ten years ago and it is not clear whether these related factors remain significant today. Because the speed of population ageing has increased dramatically since the beginning of the 21st century and will continue to increase in the near future, people’s QoL experiences may change with time (United Nations 2009, Lau & Mckenna 2001). Further, few studies have included all the variables that may influence QoL, which suggests the need for further research which includes a comprehensive range of factors. Moreover, the different social and cultural 71 contexts raise the question whether some related factors of QoL found in Western countries can also be found in China, and whether these factors related to the QoL of general older population (living alone and not living alone) are the same as those related to the QoL of older people living alone. Table 2.1 The related factors of quality of life of older people Related factors Indicator Health status General health self-rated health Physical health presence of chronic diseases, number of chronic diseases Mental health depression, cognitive function Functional ability ability to perform PSM activities or IADLs Loneliness Social support objective support, subjective support, support utilisation; quantity of support, quality of support; sources of support Physical activity Housing dwelling conditions, residential satisfaction Socio-demographic factors Age Gender Education Occupation previous occupation, current occupation Financial status income, self-perceived financial status 2.5 Health status, life circumstances and quality of life of older people in China 2.5.1 Health status Physical health A variety of studies regarding chronic diseases of older people have been conducted in different geographic areas. In Guiyang city, the prevalence of chronic diseases among a cluster sample of 966 older people aged 60 years and above was 57.8% (Huang et al. 2000). Hypertension (24.3%) was the 72 most frequently reported disease, followed by arthritis (15.9%) and chronic obstructive pulmonary disease (11.8%). A total of 70.2% of the participants in Xiao and Song’s (2006) study conducted in Hubei province had chronic diseases. The three most prevalent diseases were cardiovascular disease (CVD) (31.8%), chronic obstructive pulmonary emphysema (15.3%) and hepatic disease (11.8%). The results were similar to those found in Liu and Ni’s (2003) study, where 633 older people aged 60 years and above in Hefei city were recruited and 70.6% reported having chronic diseases with an average number of 2.2. Among all the reported diseases, hypertension ranked first with a prevalence of 35.1%. Chou and Chi (2002) interviewed a stratified random sample of 260 Hong Kong older people aged 70 years and above and reported a prevalence of 79.2% of chronic diseases. The range of total number of chronic diseases was 0-5 with an average of 1.3. The most commonly reported disease was arthritis (62.3%), followed by hypertension (23.1%) and osteoporosis (13.1%). The prevalence of chronic diseases of older people in Guangzhou city was 82.0% (Zhong et al. 1999). A total of 1027 older people who were 60 years and above and lived in one community were recruited to the study. Hypertension, diabetes, chronic bronchitis, pulmonary emphysema and arthritis were found to be the five most common diseases. A higher prevalence of chronic diseases was reported by Lv H. et al. (2001) who investigated the health status among a stratified random cluster sample of 1424 older people aged 60 years and above. They found that 82.6% of the participants had been diagnosed with chronic diseases with about 50.0% 73 having more than two chronic diseases (the exact proportion was not reported). The most prevalent disease was hypertension, followed by chronic bronchitis, cardio-cerebrovascular diseases and diabetes. In summary, the prevalence of chronic diseases of older people in China was different across the studies with all being near or over 60.0%. Among the diseases, hypertension was the most commonly reported major problem. Other common diseases included heart disease, arthritis, chronic pulmonary diseases and diabetes. Cognitive function Surveys of cognitive function of older people in China started in the early 1980s (Yu et al. 1989). The reported cognitive function varied across the studies due to the different measurements, assessment criteria and samples. In 1987 in Shanghai, Yu et al. (1989) recruited 5055 older people aged 55 years and above to investigate their cognitive function using the MMSE (Folstein et al. 1975) with the score of equal to or less than 17 indicating a severe cognitive impairment and the score between 18 and 23 indicating a mild cognitive impairment. Overall, 14.4% of the participants were identified as having mild cognitive impairment and 4.1% were severe cases. Among a cluster sample of 510 older people aged 65 years and above (Xiao & Song 2006), 469 (92.0%) were reported to have intact cognitive function with the MMSE (Folstein et al. 1975) score of 21 to 30, 33 (6.5%) had mild cognitive impairment with the score of 10 to 20, and eight (1.5%) had severe cognitive impairment with the score less than 10. 74 However, in Li et al.’s (2009) study, a cut-off point of less than 18 on the MMSE (Folstein et al. 1975) was used to indicate cognitive impairment. Li et al. (2009) analysed the data of the first phase (1998) of CLHLS which included a random sample of older Chinese people from almost half of the counties and cities of 22 provinces in China. They reported that 15.8% of the 9093 participants aged between 77 and 120 years had cognitive impairment. Using the same measurement, Wang Y.R. et al. (2012) investigated the cognitive function of a random cluster sample of 713 empty-nest older people. A total of 153 participants were identified as having impaired cognitive function by adopting different cut-off points according to the different education levels (less than 17, 20 and 24 for illiteracy, primary school, and high school or above respectively), which accounted for 21.5% of the sample. In addition to the MMSE (Folstein et al. 1975), the Short Portable Mental Status Questionnaire (SPMSQ; Pfeiffer 1975) is another cognitive function measurement which is widely used. A total of 1903 Hong Kong older people in Chou and Chi’s (2005) study were dichotomised as “poor cognitive function” with the SPMSQ score equal to or less than seven, and “not poor cognitive function” with the score over seven. In the “young old” group (aged between 60-69 years), 25.8% were identified as having a poor cognitive function, and the proportion in the “old old” (aged between 70-79 years) and “oldest old” (aged 80 years and above) groups was 35.7% and 52.5% respectively. For all the participants, 31.6% reported a poor cognitive function. In light of the wide discrepancy across the different studies in terms of cognitive function, Nie et al. (2011) conducted a meta-analysis to analyse the prevalence of mild cognitive impairment of older people in China. There were 75 22 studies selected for the analysis according to the inclusion criteria: case collection based on field survey; the study based on population samples rather than volunteers; the population in most studies was 60 years and above; only the best paper was included for the duplicate papers reporting the same study. The results showed that the pooled prevalence of mild cognitive impairment was 12.7% (95% CI: 9.7%-16.5%). Depression Some studies with various measurement tools have been conducted to investigate older people’s depression in China. The systematic review of the empirical literature relating to depression in older people in China is in Appendix 2. A cross-sectional survey with a large stratified random sample of 1200 older people aged 65 years and above was conducted in Taiwan (Tsai et al. 2005). Using five as the cut-off point of the 15-item GDS (Sheikh & Yesavage 1986), just over one quarter of the participants (27.5%) were found to be depressed. The similar prevalence (25.7%) was reported in another study conducted in Taiwan with the same measurement and cut-off point among a convenience sample of 1313 older people aged 65 years and above living in a rural area (Liu et al. 1997). A high rate of 57.4% was found in Wang’s (2001) study which adopted seven as the cut-off point of the 15-item GDS (Sheikh & Yesavage 1986). In that study, 195 older people aged 65 years and above were randomly recruited from five villages and the mean score of the GDS was 7.6 (SD=3.9) indicating a moderate prevalence of depression in the sample. In addition, eight was used as the cut-off point of the 15-item GDS (Sheikh & 76 Yesavage 1986) in some studies (Chan & Zeng 2009, Chi et al. 2005, Chou & Chi 2005, Jia et al. 2007, Lam & Boey 2005, Lv T.Y. et al. 2001). Lv T.Y. et al. (2001) investigated a stratified cluster sample of 778 older people aged 65 years and above living in Shanghai and reported a prevalence of 20.8% for depression with a higher rate in women than men. In another study in Shanghai (Jia et al. 2007), a convenience sample of 229 empty-nest older people aged 60 years and above were interviewed, and 15.3% of them were found to be depressed. In a later study conducted in Macau, 11.9% of the participants, who were older women aged 60 years and above, were identified as depression (Chan & Zeng 2009). Moreover, in four studies conducted in Hong Kong, the prevalence of depression varied across the different samples with different gender and age distributions. By randomly drawing samples from the General Household Survey database local census lists, Chi et al. (2005) reported that the prevalence of depression among 917 older people aged 60 years and above was 12.5%. Using the same sampling frame, Chou and Chi (2005) found a prevalence of depression of 31.1%, 22.4% and 19.1% for the “oldest old”, “old old” and “young old” groups respectively. The prevalence for all the participants was approximately 21.4%. However, in two old urban areas, the prevalence of depression was 29.7% among a purposive sample of older people aged 60-89 years (Lam & Boey 2005). A higher prevalence of 35.0% was reported by Woo et al. (1994) who carried out a survey among 1611 people who were 70 years old and above and received old age and disability allowances. The prevalence of depression in six studies using the 30-item GDS (Yesavage et al. 1983) ranged from 19.7%-79.7% (Fan et al. 2007, Gao et al. 77 2009, Wang et al. 2009, Xie et al. 2010, Xing et al. 2005, Zhang Z. et al. 2010). It is noteworthy that the prevalence in two studies which focused on empty-nest older people was much higher than that in the other four studies (52.0% and 79.7% vs. 19.7%-30.8%). Wang et al. (2009) recruited 50 empty-nest older people aged 60 years and above and reported that 36.0% of them (n=18) had mild depression and 16.0% (n=8) had severe depression. In Xie et al.’s (2010) study, a random cluster sample of 415 older people aged 60 years and above was drawn from five villages, of whom 55.7% (n=231) were empty-nesters. In the empty-nest group, 184 (79.7%) participants were reported to have depression, with 167 (72.3%) having mild depression and 17 (7.4%) having severe depression. Based on the data from a longitudinal study, Lue et al. (2010) explored the prevalence of depression among a random sample of 1487 older people aged 65 years and above in Taiwan by using the 10-item Centre for Epidemiological Studies Depression scale (CES-D; Anderson et al. 1994). The results showed that the prevalence was 20.4% in 1999 and decreased to 19.7% in 2003. In summary, the prevalence of depression of older people in China varied from 11.9% to 79.7% across the studies with different samples, study sites, methodologies, measurement tools and criteria for depression. Functional ability Functional ability is one of the most common factors that influence health, dependency, institutionalisation and health care needs in older people (Fried et al. 1994, Mor et al. 1994). It is often operationalised by measuring the 78 ability to perform ADLs, including “basic” biological function (PSM activity), such as eating and bathing, and “instrumental” function (IADL) required to function in the community and needed more complicated skills, such as shopping and doing housework (McCusker et al. 1999). The process of interpreting ADL ability is complex because of the great variety and lack of standardisation of the instruments, including the varied daily activities, the different scoring methods and the different cut-off points (Del Duca et al. 2009). He et al. (1989) recruited 5252 older people aged 55-99 years to assess their functional ability using the 20-item ADL Scale (Stemmler et al. 1994) in 1987. The results showed that 35.5% of the participants had difficulty in performing one or more ADLs. Using public transportation was the most frequent activity that 29.5% reported to perform with help, followed by carrying water, cutting nails, shopping and making a telephone call. On the other hand, the participants had least limitations in feeding, taking medicine and grooming with the dependency rate being less than 3.0%. A lower rate of functional disability was reported in Lv H. et al.’s (2001) study, where functional ability was measured using the ADL Scale (Zhang et al. 1995). Among 1424 participants, 19.2% reported a reduced functional ability to different degrees with 9.8% having severe functional impairment. Based on the Beijing Multi-dimensional Longitudinal Study on Ageing, Tang et al. (1999) investigated the functional ability which was measured using the World Health Organization disability scale (Ferrucci et al. 1991) among a stratified random cluster sample of 3440 older people aged 60 years and over. The results showed that the majority of the participants were able to perform ADLs with 6.5% being dependent on PSM activities and 7.9% being 79 dependent on IADLs. Of the PSM activities, bathing was the most difficult activity for the participants to perform, with the dependency rate varying from 0.8% to 20.5% across the age groups. While eating was the easiest activity with the dependency rate ranging from 0-8.5% across different age groups. Of the IADLs, doing heavy housework was the most difficult activity with the dependency rate varying from 4.0% to 49.1% across the age groups. In contrast, moving out of doors was the easiest activity with the dependency rate ranging from 0.4% to 13.4% across the age groups. However, the dependency in PSM activities was as high as 91.1% among 1042 older women who were 60-98 years old and lived in Macau (Chan & Zeng 2009). Measured by the 10-item MBI (Collin et al. 1988), 93 participants (8.9%) were identified to be mildly to totally independent in self-care performance and 91.1% were identified to be totally dependent. A further 11 items were set to assess the participants’ ability to perform IADLs: shopping alone, making exchange when shopping, doing heavy housework, switching on/off TV, opening and reading a magazine or newspaper, looking up numbers, dialling, receiving and making calls, preparing light foods, planning and cooking full meals, travelling by taking a bus or taxi, visiting relatives or friends, and taking medications in the right dose at the right time. Among these activities, travelling by taking a bus or taxi (8.5%) and visiting relatives or friends (8.0%) were the most frequent activities that the participants were unable to do, whereas opening and reading a magazine or newspaper (0.1%) and switching on/off TV (0.6%) were the two activities that least participants were unable to perform. In addition to assessing both aspects of ADLs, some studies only assessed PSM activities or IADLs. For example, Chen (2007) reported that 15.2% of 80 the participants, who were 60-92 years and lived in one community in Shanghai, needed various kinds of help in IADLs which was measured using the IADL Scale (Murtagh & Hubert 2004). Among the eight activities, doing laundry was the one necessitating some level of assistance most often (10.6%), followed by shopping (10.1%), cooking (9.3%), going out (9.2%) and household chores (8.0%). Dong and Simon (2010) assessed older people’s ability to perform PSM activities. They asked 404 people aged 60 years and above for their self-reported abilities in eating, dressing, bathing, walking, transferring, grooming, incontinence and toileting. The results showed that approximately 26.2% of the participants had difficulty in doing these activities with transferring and using toilet being the two activities needing help at most. 2.5.2 Loneliness Loneliness describes a deficit between the actual and desired quality and quantity of social engagement, which is associated with an individual’s evaluation of their overall level of social interaction (Victor et al. 2005a). It is a condition with distressing, depressing, dehumanising and detached feelings that a person endures when there is a gaping emptiness in his or her life due to unfulfilled social and/or emotional needs (Killeen 1998). A systematic review of the empirical literature relating to loneliness of older people in China (presented in Appendix 3) indicated that the prevalence of older people’s loneliness in China varied across the studies reflecting the different samples and measurement tools. Lin et al. (2009) reported a prevalence of 10.0% among 230 older people aged 60 years and above. 81 Loneliness was measured by asking one single question, “Do you feel lonely?” Although Lin et al. (2009) asserted that loneliness was not common in the older population according to the prevalence data, the interpretation needs to be cautious due to the unrepresentative sample and unreported sampling method. Moreover, Yang and Victor (2008) analysed the data from two national surveys, namely, the Survey of the Support System for the Elderly in China (SSSE) of 1992 and the Survey of the Aged Population in China (SAP) of 2000, to explore the risk factors for loneliness among older people over 60 years. The large and representative sample made it possible to have a clear picture of the prevalence of loneliness of older people in China. In SSSE, 20,083 participants were asked, “Do you feel lonely?” with three options of “yes”, “no” and “hard to say”. A total of 15.6% of the participants replied “yes” to this question. On the other hand, 20,255 participants in SAP were asked, “What do you think of the following statements?” one of which was, “I often feel lonely”, with the same three response options. The prevalence of loneliness increased with 29.6% of the participants answering “yes”. In addition to using a single question to confirm the presence or not of loneliness, the UCLA Loneliness Scale (Russell et al. 1980) is widely used to measure the intensity of loneliness. Liu and Guo (2007) found that 50.8% of the participants in their study reported a low level of loneliness with a score of 20-34, followed by 40.7% with a moderate level (score ranged 35-49) and 8.5% with a moderately high level (score ranged 50-64). However, in Wu et al.’s (2010) study 19.0% of the 1144 participants who were empty-nest older people reported a low level of loneliness, with 56.3% and 82 24.7% expressing moderate and moderately high levels of loneliness respectively. Similarly, 21.9% of the participants in Wang et al.’s (2011) study were found to have a low level of loneliness. Among the stratified cluster sample of 5652 rural older people, 57.1% reported a moderate level, 20.3% reported a moderately high level and 0.7% reported a high level of loneliness. In contrast, in Taiwan Wang et al. (2001) reported that 39.8% of the participants experienced a low level of loneliness, 56.7% experienced a moderate level and only 3.5% experienced a high level of loneliness. However, Wang et al. (2001) adopted a different classification of loneliness with a score of 20-40, 41-60 and 61-80 indicating a low, moderate and high level of loneliness respectively. In summary, there have been two approaches to the measurement of loneliness. One used a single item to establish the presence/absence of loneliness. The other used the validated scale to measure the severity of loneliness. In light of the differences in sampling procedures and loneliness measures, it is impossible to draw conclusions regarding the prevalence of loneliness of older people in China. However, according to the comparison of two national surveys, Yang and Victor (2008) estimated that there was a rising temporal trend of loneliness due to China’s dramatic social and economic changes. 2.5.3 Social support For a very long time, and still today in some developing countries, an important goal of human reproduction was old age support (Qian & Zhou 2004). Support for older people has multiple dimensions or different 83 components, one of the most important of which is sources of social support. According to the convoy model of social support (Chalise et al. 2007), each individual is surrounded by a convoy which includes specific people who make up the person’s social networks and affect his/her well-being. Types of networks vary and older people can receive social support from different sources, which may have different impact upon them. The systematic review of the empirical literature relating to social support of older people in China is in Appendix 3. Support from family Taking care of older family members is one of the major themes of Confucian philosophy and traditional norms in the Chinese culture. It is also stipulated in marriage laws, the “Law of the People’s Republic of China on Protection of the Rights and Interests of the Elderly”, and the Chinese Constitution that younger people have the obligations to support older people (Yang 1996). Many studies focusing upon social support of Chinese older people referred to family support and regarded it as the primary source of care. For example, Li and Tracy (1999) interviewed 100 rural older people aged 60 years and above, and asked them whether someone would give any help if they would be sickness or disability, and whether someone in the family had helped with house chores or functional needs. Over four fifths of the participants (87.0%) reported that they could receive help from family members when in need. Among family members, the spouse was the first choice for seeking help, followed by children. On the whole, most of the older people preferred confiding their troubles to 84 their spouses (Li 2007). They received support with daily living activities, functional needs and spiritual consolation mainly from their spouses (Li & Tracy 1999, Zhao & Xu 2003). However, when referring to financial support, children were identified as the major source. Most of the older people perceived that their children would give them help if they did not have enough money to live on, and also they would choose to rely on their children when they were in financial difficulties (Krause et al. 1998, Li 2007, Li & Tracy 1999, Pei & Pillai 1999, Wang & Liang 2010, Zhao & Xu 2003). In light of the significant position of family members as sources of social support, family support has been identified as playing an important role in older people’s life. Its relationship with QoL was emphasised in section 2.4.2.3. In addition, some studies have investigated its effect upon mental health (Wang & Shi 2008). Chi and Chou (2001) investigated Hong Kong older people’s network size, network composition and social contact frequency, and their relationships with depression. They reported that older people who had more family members seen once a month (r= -0.19, p<0.01), more family members with whom they felt close (r= -0.24, p<0.01; β= -0.11, p<0.01), more frequent contact with family members (r= -0.20, p<0.01; β= -0.09, p<0.01), and whose social networks of people seen once a month consisted completely or mostly of family members (r=0.07, p<0.05; β=0.09, p<0.05) were less likely to report depression. In another study conducted in Hong Kong (Chou & Chi 2003), receiving less support from family members who did not live together was identified as a predictor of three-year-later depression among a stratified random sample of 260 older people aged 70 years and above (β= -0.11, p<0.05). This result from the longitudinal study further supports the importance of family support. 85 Additionally, Leung et al. (2007) used a Chinese modified version of the Family Emotional Involvement and Criticism Scale (FEICS; Shields et al. 1992) to measure the family function of 507 older people who were 65 years and older and lived in Taiwan. The results of the bivariate analyses showed that family involvement had negative correlations with depression and anxiety (r= -0.19, -0.22; p<0.01), and a positive correlation with cognitive function (r=0.13, p<0.01), whereas criticism had positive correlations with depression and anxiety (r=0.29, 0.31; p<0.01). Moreover, family criticism was a predictor of depression and anxiety (β=0.27, p<0.01; β=0.17, p<0.001). The results indicated that receiving family support and keeping the family in harmony was important for Chinese older people (Leung et al. 2007). By using a researcher-developed social support questionnaire and a mental health questionnaire, Wang and Shi (2008) interviewed a convenience sample of 1250 empty-nest older people. They reported that receiving support from spouses and children were negatively correlated with mental problems (p<0.01). These two variables were also important predictors of mental health (p<0.001) with older people receiving more support from their spouses and children reporting less mental problems. Support from friends Support from friends is flexible and can provide emotional intimacy, companionship and social referents for self-evaluation. It is voluntary in nature, which is believed to be less detrimental to autonomy than support from family members (Cantor 1979, Lee & Shehan 1989). Thus, some studies investigated support from friends and its effects upon older people. 86 Zhao and Xu (2003) interviewed a random sample of 120 empty-nest older people and reported that nearly 80.0% (exact figure was not reported) visited their friends regularly and 45.5% chose to confide in friends when they were in trouble. Further, 56.9% of the participants in Phillips et al.’s (2008) study reported that they had an average of 5.8 friends with whom they kept in contact regularly. Most of the participants (94.8%) were satisfied with the support that they received from friends. With regard to the role of friendship support in older people’s lives, it was measured with different indicators across the different studies. The results of correlation analyses showed that friendship related indicators, such as receiving support from friends, the number of friends with whom older people were in regular contact, the number of friends seen once a month, the number of friends with whom older people felt close, and the frequency of contact with friends, were negatively correlated with mental problems and positively correlated with psychological well-being (Chi & Chou 2001, Phillips et al. 2008, Wang & Shi 2008). However, when all variables were included in multivariate analyses, the effect of support from friends became insignificant (Chi & Chou 2001, Chou & Chi 2003, Wang & Shi 2008). Just as Yeung and Fung (2007) claimed, friends were not a better source of social support than family members, and older Chinese people did not rely heavily upon friendship support. In contrast, Siu and Phillips (2002) asserted that friendship support was more important in maintaining psychological well-being than family support after interviewing 60 older women aged 60 years and above in Hong Kong. The results of the hierarchical regression analysis showed that the variable of 87 “importance of friendship” was a significant predictor of psychological well-being, while the variable of “importance of family” had no significance. Support from neighbours Only a few studies regarding social support of older people in China have addressed support from neighbours. In Li’s (2007) study, only 6.1% of the participants reported that they could get help from neighbours when they had difficulties in ADLs. Phillips et al. (2008) interviewed 518 older people in Hong Kong and found that more than half of the participants (52.7%) contacted their neighbours regularly, and each participant had an average of 3.7 neighbours with whom they kept relationships. However, the frequency of contact was only once a year. Overall, most of the participants (93.4%) were satisfied with the support from neighbours. As regards the effect of support from neighbours, the number of neighbours with whom older people were in regular contact had a significant positive correlation with psychological well-being (r=0.25, p<0.001). Support from the Government/organizations In addition to support from family members, friends and neighbours, which is identified as informal social support, social support also includes formal support, such as support from the Government, social organizations, agencies or other formal systems (Zhao & Xu 2003). Studies exploring this kind of support are limited and older people received relatively less support from these resources. Pei and Pillai (1999) analysed the data from the SSSE conducted in 1992 to 88 examine the effect of government support. Using pension income and financial support as the indicators of support from the Government, they found that nearly half of the participants (48.6%) received financial support but the overall pension coverage was only 38.8%. The low level of formal support was also reported in two other studies (Li & Tracy 1999, Wang & Liang 2010), where many older people had never received any financial support from the Government or other organizations (92.0% and 88.6% respectively). The effect of social support from the Government upon older people is inconclusive. It was reported to have a negative correlation with only one of the eight mental problems in the bivariate analyses, but the relationship was not significant in the multivariate analysis (Wang & Shi 2008). However, the results of a logistic regression in Pei and Pillai’s (1999) study showed that formal support was significantly related to older people’s sense of well-being. Those who received a pension reported a better sense of well-being while the receipt of financial support from the Government contributed negatively to the sense of well-being. It was explained that financial assistance primarily targeted those who were very poor and had no family support, and thus could be a stigma of poverty (Pei & Pillai 1999). In summary, Chinese older people’s sources of social support mainly included family members, friends, neighbours, the Government and other social organizations. Family was identified as the primary source for old age care and support in China, and thus family support has attracted more research interest compared to the support from other social network members. It also had far more positive effects upon older people’s psychological well-being and mental health. The impact of support from friends upon Chinese older 89 people was inconclusive. In contrast, studies referring to the support from neighbours, the Government or other social organizations are scarce and the majority of older people did not rely on these sources when they were in trouble or needed help. 2.5.4 Physical activity As mentioned before, physical activity has significance for older people’s health and QoL (section 2.4.2.4). Physical inactivity has been identified as the fourth leading risk factor for global mortality (6.0% of deaths globally), and is estimated as being the principal cause for approximately 21.0%-25.0% of breast and colon cancer burden, 27.0% of diabetes burden and approximately 30.0% of ischaemic heart disease burden (World Health Organization 2010). However, levels of physical inactivity are rising in many countries (World Health Organization 2010), which provides impetus for investigating Chinese older people’s status of physical activity and the important factors which might contribute to increased levels of physical activity. In Zhou et al.’s (2011) study, a two-stage stratified cluster sample of 4230 older people aged 60 years and above was recruited to investigate their physical activity using one item of “whether you took regular exercise”. Only 2.2% of the rural participants reported that they took part in physical activity regularly (twice per week for at least three months), whereas 66.6% of the urban participants reported regular physical activity. The participation rate was only 35.0% for the total sample. A similar rate of adequate physical activity was reported in two other studies. 90 In Xi’an city (Wei 2007), 202 out of 606 participants (33.3%) reported taking adequate physical activity with the criteria of at least three days of 40 minutes of exercise per week. Those who were male, aged 80 years and above and had no formal education were more likely to report inadequate physical activity. In Du and Li’s (2012) study, 123 out of 350 participants (35.1%) met the criteria of adequate physical activity which was defined as undertaking a minimum of 30 minutes of any kind of activity on at least three days a week. Male, the age of 60-69 years and having no chronic diseases were independent factors related to undertaking adequate physical activity. Additionally, the proportion of older people who engaged in at least three leisure-time physical activity sessions per week was 46.6% in Taiwan (Ku et al. 2009) suggesting nearly half of this sample undertook adequate physical activity if these activities were of sufficient intensity and duration. There were significant differences in the adequacy of physical activity across the participants with different genders, age groups, education levels, marital status, living arrangements, income satisfaction, lifestyle behaviours and health status. Contrary to the findings of Wei’s (2007) study, males with advanced age were more physically active than females in the younger age groups. In addition, the participants with higher levels of education, satisfied with their income, having no difficulties in ADLs and having chronic diseases were more likely to report an adequate physical activity. In summary, the criteria of adequate physical activity varied across the different studies. Therefore, the exact prevalence of adequate physical activity among Chinese older people is unclear. But the prevalence appears to be low, as less than half of the older people undertook adequate levels of physical activity. Some demographic and health-related variables such as age, 91 gender, education level and the presence of chronic diseases were related to the adequacy of physical activity. 2.5.5 Health services Ageing is often associated with poorer health and more diseases, and thus leads to increased needs for and utilisation of health services. Older people are major users of health services. Their options to seek and satisfaction with health services are critical to improving the quality of health services, reducing and preventing chronic diseases with its attendant disabilities and dependencies, promoting active ageing, and improving their QoL (Dodge 2008). Asians have been identified as underutilising health services (Miltiades & Wu 2008). The results of the Third National Household Health Survey in 2003 in China confirmed this and reported that the rate of visiting a doctor decreased by 6.2% compared to 1998 (Zhang & Chen 2006). The proportion of participants who should have visited a doctor was 54.3%, an increase of 13.5% among urban older people and 37.2% among rural older people (Zhang & Chen 2006). Aside from national surveys, Chinese older people’s health services utilisation and satisfaction have been investigated in some other studies. In Bo’s (2001) study which was conducted in rural areas of Guangdong province, 45.3% of the participants were satisfied or very satisfied with their health services and only 9.2% did not feel satisfied. However, nearly half of them (47.6%) reported that they had difficulty in affording their health service expenses. Furthermore, the major reason for not seeking health care when they were sick was problems with health care costs. 92 Liu et al. (2007) also conducted a survey regarding the health services utilisation of older people in rural areas of a mountainous county. Among a random sample of 490 older people aged 60 years and above, 44.9% utilised health services in the past three months either by visiting or telephoning a doctor. More than half (57.1%) expressed positive attitudes towards health services and only 4.3% reported that the health services were bad. Among those who perceived that their needs for health treatment were not met, the most commonly reported barrier was concern about the cost, followed by a lack of coverage of health insurance. Other barriers to seeking health services included the difficulty in accessibility such that they could not find out where to go for help and it took too long to get to the provider’s office, negative social attitudes such that they did not think visit a doctor would help and they had had a bad experience with health services, and inconvenience such that they could not get an appointment soon enough. The results that concern about health care cost was the primary barrier to the use of health services were also reported by Ou and Zhu (2000). They recruited a stratified random cluster sample of 787 older people aged 60 years and above, and reported that up to 70.9% of the participants who suffered diseases in the last two weeks did not visit a doctor. Economic difficulty was the major reason which accounted for 56.9% of the total. Other reasons for not consulting a doctor included perceiving their diseases as being mild (16.7%), the poor hospital conditions (8.8%), self-medication (4.9%) and difficulty in mobility (4.9%). In addition, among the participants who required hospitalisation, 34.6% did not receive it. The major reason was also economic difficulty (37.0%), followed by difficulty in mobility (29.6%) and perceiving their diseases as being mild (11.1%). With regard to the type of hospital that they attended most often, more participants (26.9%) preferred 93 attending tertiary hospitals, while some others chose to attend secondary hospitals (12.8%) or private clinics (10.2%). However, the proportion of not being hospitalised in Yang et al.’s (2008) study, where 463 rural people aged 65 years and above were randomly recruited, was as high as 63.6% among 77 participants who should have been hospitalised. The primary reason that they were not admitted to hospital was economic difficulty, accounting for 63.3% of the total. When being asked the type of hospital that they went to seek most often, 87.7% of the participants reported that community hospitals were the first choice because of the close distance and relatively low health care costs. A health services utilisation rate of 35.0% was reported in one community in Shanghai (Xu et al. 2007), where 386 out of 697 older people suffered from diseases and 244 had consulted a doctor in the last two weeks. Among the 244 participants, more than half (52.5%) went to community hospitals, followed by tertiary hospitals (26.4%), district hospitals (20.7%) and private clinics (0.4%). Among those who did not seek medical consultations, the majority (77.5%) indicated that it was unnecessary because their illnesses were minor problems. Other reasons included inconvenience of transportation, economic difficulty and uncertainty of treatment effects. In summary, older people in China have reported a low rate of health services utilisation. But they were fairly satisfied with the health services that they received. The ability of affording health care costs played a vital role in seeking health services. Older people preferred attending community hospitals or tertiary hospitals most often when they needed medical help. 94 2.5.6 Housing For many older people, the home not only provides security and refuge but also represents a place for expressing individuality and independence (Milne et al. 2007). Although many studies focusing upon people’s housing, such as housing quality and housing satisfaction, have been conducted in Western countries (Lawton 1980, Macintyre et al. 2003, Perez et al. 2001, Windley & Scheidt 1983), few have been conducted in China especially in Mainland China. Only two studies which were conducted in Hong Kong investigated older people’s housing-related variables including dwelling conditions and residential satisfaction. In one study (Lee 2005), residential satisfaction which referred to older people’s subjective appraisal of their physical living environment was measured. A total of 63.3% of the participants were satisfied or very satisfied with their physical living environment with women reporting a higher residential satisfaction than men. In the other study (Phillips et al. 2005), both dwelling conditions and residential satisfaction were measured among 518 older people. Dwelling conditions comprised three components: interior dwelling conditions including indoor lighting, ventilation, crowdedness, temperature, lighting public spaces and noise pollution, exterior dwelling conditions including green areas/parks, passages, flyover/subways, crossing/traffic density security/management and in recreational/sitting/rest stairs, block, and security management areas, concerns and road including security of estate/community, security devices, special facilities, background of residents and presence of a lift/escalator. The results indicated that the three components of dwelling conditions were evaluated as fairly good on the whole. Additionally, residential satisfaction was measured with the levels of satisfaction with the dwelling unit, block/estate and community/district. The 95 results indicated that the participants were fairly satisfied with their living environment. 2.5.7 Measurements of quality of life of older people in China As stated in section 2.4, there has been no unified definition of QoL so far. A variety of QoL measurements have been developed and utilised reflecting varied conecptualisations of QoL and approaches to data collection. A literature review identified eight measurements that have been used in China to assess older people’s QoL (Chen et al. 2013). World Health Organization Quality of Life Scale-Brief Version (WHOQOL-BREF) The WHOQOL-BREF (The WHOQOL Group 1998) is one of the most widely used scales of QoL in health and health care. It comprises 26 items rated on a five-point Likert scale distributed across four dimensions: physical health, psychological well-being, social relationships and environment with a higher score indicating a higher QoL. The WHOQOL-BREF has been tested in 23 countries with good to excellent psychometric qualities and was identified as a high quality instrument in almost all languages. Adapted from the original version, the Taiwan version of the WHOQOL-BREF comprises 28 items with two additional cultural-specific items, i.e. “being respected/accepted” and “eating/food”, being added to the “social relationships” and the “environment” dimensions respectively (Yao et al. 2002). Good reliability and validity of the scale has been reported in some studies (Hwang et al. 2003, Yao et al. 2002). Similar to the Taiwan version, 96 the Hong Kong version of the WHOQOL-BREF (HK-WHOQOL-BREF) comprises the same 28 items, except that “eating” and “being respected” are both categorised within the “psychological well-being” dimension (Leung et al. 2005). It has good reliability and validity with a Cronbach’s α coefficient ranging from 0.67 to 0.79 and a test-retest reliability coefficient ranging from 0.64 to 0.90 for application among older people in Hong Kong (Chan et al. 2006a). Quality Survey Scale for Elderly Population The Quality Survey Scale for Elderly Population was developed by the Chinese Medical Association (Yu et al. 1996). It comprises 11 items using a three-point Likert scale addressing 11 aspects of QoL: self-rated health, living habits, functional ability, relations with family members, living conditions, financial status, psychological status, nutritional status, social interactions, physical fitness and life satisfaction to yield a score range of 11 to 33 with a higher score indicating a higher QoL. The scale had an acceptable split-half reliability with Pearson’s r being 0.72, and a satisfactory internal consistency with Cronbach’s α coefficient over 0.70. The discriminant validity was supported by different QoL scores across the different marital status, health status and age groups. The construct validity was supported by a four factor structure (Sun et al. 2003). 36-item Short Form Health Survey (SF-36) The SF-36 (Ware & Gandek 1998) is a well-established standard health-related QoL instrument. It contains 36 items measuring eight concepts with a higher score indicating a higher QoL: physical functioning (PF), role 97 limitation due to physical health (RP), bodily pain (BP), general health perceptions (GH), vitality (VT), social functioning (SF), role limitations due to emotional problems (RE) and mental health (MH). The SF-36 Chinese version (Li et al. 2002) has been verified as suitable within the Chinese culture with satisfactory internal consistency reliability and two-week test-retest reliability (Li & Mao 2008, Zhang et al. 2004). European Quality of Life-5 Dimensions (EQ-5D) The EQ-5D (The EuroQol Group 1990) is another scale used to assess health-related QoL. It comprises two parts: the EQ-5D descriptive system and the EQ visual analogue scale (EQ VAS). The EQ-5D descriptive system comprises five dimensions: mobility, self-care, usual activities, pain/discomfort and anxiety/depression with each dimension using a three-point Likert item of “no problems” (level 1), “some problems” (level 2) and “extreme problems” (level 3). A health state profile is defined by combining one level from each dimension. For example, state “11223” indicates no problems with mobility and self-care, some problems with performing usual activities, moderate pain or discomfort, and extremely anxious or depressed (The EuroQol Group Executive Office 2011). The health state can also be converted into a single summary index by applying a scoring algorithm. The EQ VAS is a 20-cm vertical analogue scale representing perceived overall health status with the endpoints labelled “best imaginable health state” and “worst imaginable health state”. The EQ-5D results can be presented using the health state profile, the index value or the EQ VAS score. The Chinese version of the EQ-5D has reported satisfactory validity in some studies (Wang et al. 2005, Zhao et al. 2010). 98 The Philadelphia Geriatric Center Morale Scale (PGCMS) The PGCMS (Lawton 1975) reflects people’s subjective well-being and has been used as a micro-indicator of QoL. It comprises three dimensions, i.e. agitation, attitude towards own ageing and lonely dissatisfaction. The score is calculated by the sum of total item scores with a higher score indicating a higher subjective QoL. Two validated versions with different items have been developed and used in China, i.e. the 15-item Hong Kong-Chinese version of the PGCMS (Liang & Bollen 1983) and the 23-item Chinese version of the PGCMS (Fan 1999b). The 15-item PGCMS generated a two-factor structure when it was used in Hong Kong older people. The concurrent validity was demonstrated by good correlations between the scale and the GDS with Pearson’s r ranging from -0.56 to -0.77 (Wong et al. 2004). The 23-item PGCMS has been validated with the Cronbach’s α coefficient being 0.77 and the test-retest reliability coefficient being 0.80 (Deng et al. 2010, Yao et al. 1995). Index of Well Being (IWB) The IWB (Campbell et al. 1976) is also a measurement assessing people’s subjective well-being. It comprises nine items with two components: index of general affect (IGA) (eight semantic differential items) and life satisfaction questionnaire (ISQ) (one item). The eight items in IGA are summed and then divided by 8. The score of ISQ is multiplied by 1.1, and added to the average score of IGA to create a single score with a higher level indicating a higher QoL. The Chinese version of the IWB (Fan 1999a), with the Cronbach’s α coefficient of IGA of 0.89, test-retest reliability coefficient of 0.43, criterion-related validity compared with ISQ of 0.55, is easy to understand and 99 suitable for older people to complete (Zhang et al. 2008). Life Satisfaction Index (LSI) The Life Satisfaction Index-A Form (LSI-A; Neugarten et al. 1961) which assesses life satisfaction has been used as the indicator of QoL. The Chinese version (Chi & Boey 1993) which was used in Hong Kong comprises 18 items rated on a two-point scale from 0 to 1. It measures five different components, including zest versus apathy, positive self-concept, congruence between desired and achieved goals, resolution and fortitude, and mood tone, with a higher score indicating a higher level of life satisfaction. The scale has been validated with reported Cronbach’s α coefficients of 0.81 and 0.84 (Chou & Chi 1999). A short modified version of the LSI-A, namely LSI-Z (Wood et al. 1969), was developed later. It comprises 13 items rated on a three-point scale with “satisfaction” being scored 2, “don’t know” being scored 1, and “dissatisfaction” being scored 0. The Chinese version of the LSI-Z has been used with a reported Cronbach’s α coefficient exceeding 0.70 (Lee 2005, Liu & Guo 2008). Single question Instead of validated QoL instruments, the single question has been used as an indicator of overall global measure of QoL (Lee 2005). The participants were asked to rate the statement “I am happy much of the time” with responses from “strongly agree” to “strong disagree”. 100 In summary, eight different measures of QoL have been used in China, of which seven are validated instrument tools and one is a single-item indicator. Among the validated scales, the WHOQOL-BREF and the Quality Survey Scale for Elderly Population are macro-indicators assessing global context of QoL, and the remaining five are micro-indicators addressing health-related QoL (SF-36, EQ-5D) or subjective aspect of QoL (PGCMS, IWB, LSI). Taking into consideration that QoL has a multi-faceted nature, the application of the instrument assessing one aspect of QoL is worth considering. In addition, only the Quality Survey Scale for Elderly Population was developed for older people, but some items are not applicable in today’s society. Ageing and increased frailty can affect several areas of one’s life. Therefore, whether the instruments developed for all populations are adequately sensitive among older people is contestable (Chen et al. 2013). Moreover, most of the scales were developed based on theoretical concepts or professional’s definitions and standards of QoL (Bowling 2009, Farquhar 1995). Thus, whether the items included in these scales have any relevance to older people themselves and reflect their own perspectives should be taken into account in selecting suitable measurements to evaluate older people’s QoL. 2.5.8 A brief summary of the health status, life circumstances and quality of life of older people in China The prevalence of chronic diseases of older people in China varied across the different studies with all approaching or exceeding 60.0%. Hypertension was the most common reported disease. With regard to mental health, the prevalence of depression ranged from 11.9% to 79.7% with different methodologies, measurement tools and criteria for depression. Similarly, there were no conclusive data on the prevalence of the other mental health 101 problem, namely, cognitive impairment, which could have been due to different samples, measurements and evaluation criteria. Functional disability is often associated with advancing age, and older people’s functional ability is an important indicator of their independence. Most of older people in the studies undertaken in China had a high level of ability in performing ADLs with more than half being totally independent with these daily activities. The most frequently reported difficult ADLs were mainly in relation to transportation and doing heavy housework. In light of the methodological issues, especially differences in loneliness measures, which included one single item establishing the presence of loneliness and validated scales measuring loneliness levels, it was difficult to estimate the rate of loneliness among older people in China. But the prevalence is estimated to be increasing. Social support can fill the gap between the social network and the need for social contact (Kuhirunyaratn et al. 2007) thereby alleviating loneliness. Family members were the primary source of social support. Family support played an important role in the older people’s psychological well-being and mental health. Friends were also an important source although their impact upon Chinese older people was inconclusive. In addition, support from neighbours, the Government or other social organizations were addressed in a limited number of studies with few older people receiving support from these sources. Despite the different criteria, the reported prevalence of adequate physical activity was low among older people with less than half being adequately physically active. Regarding health service utilisation, Chinese older people appear to underutilise health services. The major barrier to visiting a doctor or hospitalisation was economic difficulty. Additionally, most of older people 102 chose to attend community hospitals or tertiary hospitals when they needed medical help. In regard to housing status of older people in China, only two studies which were conducted in Hong Kong focused on dwelling conditions or residential satisfaction. The QoL of older people in China was assessed by using eight different measures across the different studies, with seven being validated scales and one being a single-item question. But the suitability of these measurements in assessing older people’s QoL should be taken into consideration because only two scales are generic instruments and only one of these two scales was developed for older people. In addition, the majority of these scales were based on theoretical or experts’ opinion of QoL, and few reflected people’s own view, which is a challenge to the relevance of the scales to older people. 2.6 Conceptual framework for the study Quality of life is a vague and amorphous concept and there is no consensus on the definition of QoL of older people (Brown et al. 2004, Lee 2005). Different theoretical or conceptual frameworks have been used in the QoL research, such as Maslow’s hierarchy of human needs, theories of successful ageing, activity theory, continuity theory and frameworks based on psychological well-being, happiness, life satisfaction or social expectations (Brown et al. 2004, Lee 2005). However, there is no widely accepted or supported theoretical or conceptual framework of QoL (Brown et al. 2004). Therefore, the conceptual framework for this study was developed in light of the extensive empirical literature regarding older people’s QoL and its related factors. Physical health, cognitive function, depression, functional ability, self-rated health, loneliness, social support, physical activity and housing 103 have been identified as important factors related to QoL. Older people’s socio-demographic characteristics such as age, gender, education level, occupation and financial status may also influence their QoL. Older people are the major users of health services and some studies have suggested that health services satisfaction has a positive relationship with QoL (Dodge 2008, Joseph & Nichols 2007), In order to provide a more comprehensive understanding of QoL of older people living alone in China, health services satisfaction is also investigated, although it was rarely addressed in the research regarding the related factors of QoL of community dwelling older people. Bowling (2009) has pointed that QoL is a subjective experience in which what contributes to that experience is paramount, including the person’s life circumstances and the context of his/her life, and that the QoL research should take a societal perspective into account and reflect the individual’s perspectives. Therefore this study focused upon the views of older people living alone themselves as the basis for understanding their QoL. 2.7 Chapter summary This chapter presented a comprehensive literature review of demographic transition, the profile of older people living alone, definition, concepts and related factors of QoL, as well as the health status, life circumstances and QoL of older people in China. With population ageing and profound changes in living arrangements, the number of older people living alone is increasing. A substantial number of studies have been conducted in Western countries focusing upon older people living alone in terms of their health status, life circumstances and QoL, and have identified them as an “at risk” group requiring specific attention. However, some discrepant findings have shown 104 that older people living alone were not a vulnerable group. This inconsistency highlights the necessity for further research of older people living alone in China, as people’s life experiences vary across different countries and different cultures. The Chinese culture emphasises filial piety, interdependence and collectivism, therefore the findings obtained within Western cultures may not be generalisable to Chinese society. QoL is a frequently studied topic and a central variable of people’s life. However, there is no agreement regarding its definition, concepts and measurements. Despite these variations, physical health, depression, cognitive function, functional ability, loneliness, social support, physical activity, housing and some socio-demographic factors have been identified as related to older people’s QoL. These factors contribute to a better understanding of QoL of older people, and form the basis for developing a cultural specific QoL model which is important for implementing appropriate and effective interventions to improve older people’s QoL. However, some methodological issues emerged from the reviewed studies, such as a relatively small sample size, the convenience sampling method, restricted study sites and relatively few included independent variables, could affect the generalisability of their findings. Based on the identified underpinning factors of QoL, a review of previous empirical studies focusing upon these variables provides a comprehensive understanding of physical health, mental health, functional ability, loneliness, social support, physical activity, health services and housing of older people in China. It also indicates that the utilisation of QoL measurements which have been used in China should be taken into consideration as these measurements may not be suitable for older people very well. 105 In light of the existing literature, it is necessary to conduct research focusing upon older people living alone in China to understand their health status, life circumstances and their QoL, and to explore the significant factors related to their QoL, in order to develop an explanatory model of QoL of older people living alone. The next chapter will present the details of study methods. 106 CHAPTER 3 METHOD 3.1 Chapter introduction This chapter describes the study design, questionnaire development, pilot study and data collection procedure in detail. In addition, the statistical methods selected to address the research questions are explained. 3.2 Study aim and objectives This study was informed by the conceptual framework and the challenges of a rapidly ageing population in China, together with the importance of profiling the needs of older people living alone as a basis for policy development. This study aimed to explore the health status, life circumstances and QoL of older people living alone in Chongming, Shanghai. The specific objectives and research questions were: 1. To explore the health status, loneliness, social support, physical activity, health services utilisation and satisfaction, housing and QoL of older people living alone in Chongming, Shanghai. Q1.1 What is the physical health, mental health, functional ability, self-rated health, loneliness, social support, physical activity, health services utilisation and satisfaction, housing and QoL of older people living alone in Chongming, Shanghai? Q1.2 Does the physical health, mental health, functional ability, self-rated health, loneliness, social support, physical activity, health services 107 satisfaction and satisfaction with dwelling conditions differ across the different socio-demographic characteristics of the sample? 2. To explore the significant factors related to QoL of older people living alone in Chongming, Shanghai. Q2.1 What are the relationships between the reported QoL and socio-demographic variables, physical health, mental health, functional ability, self-rated health, loneliness, social support, physical activity, health services satisfaction and satisfaction with dwelling conditions? Q2.2 What are the predictors of QoL? 3. To develop an explanatory model of QoL of older people living alone in Chongming, Shanghai. Q3.1 What is the QoL model that is suitable for older people living alone in Chongming, Shanghai? 3.3 Study design 3.3.1 Type of study This study adopted a correlational survey to fulfil the research objectives. The correlational survey design facilitates the identification of many interrelationships of study variables in a situation (Burns & Grove 2009). It is valuable in mapping and understanding the phenomenon and the nature of health-related conditions and behaviours prior to experimentation and is critical in the development of effective interventions. In addition, it is efficient in collecting extensive information about a problem grounded in realism 108 during a time-limited period (Polit & Beck 2012). In light of these strengths, the correlational survey design was selected for this study. 3.3.2 Study site This study was conducted in Chongming County (Figures 3.1 and 3.2), which is the only county of Shanghai. It consists of three islands (Chongming Island, Hengsha Island and Changxin Island) with a geographic area of 1411 km 2 and a population of approximate 0.69 million (Statistics Bureau of Chongming 2013). Among this total population, there are more than 0.19 million (28.5%) older people aged 60 years and above (Gerontological Society of Shanghai 2013). The proportion of older people is ranked the second across all districts and the first in the suburban districts of Shanghai (Gerontological Society of Shanghai 2013). The average life expectancy for Chongming residents reached 80.8 years in 2010. In the same year, Chongming was awarded “Longevity County of China”, which made it one of the fifteen “Longevity Counties of China” (Gerontological Society of China 2011). Because of its special geographic position, the transportation from Chongming to the city centre was very inconvenient before the completion of Chongming bridge-tunnel in 2009. The only means of transport was a ferry with limited schedules which was often hampered by bad weather. This inconvenience has become the largest obstacle hindering economic development of Chongming. It has always been the most economically backward district of Shanghai (Shanghai Municipal Statistics Bureau 2012). Therefore, more and more young and middle-aged people are moving to the city centre to establish their careers while an increasing number of older people are left behind in their homes so that the number of older people living 109 alone is steadily increasing. According to the 2011 Shanghai Monitored Statistical Information on Population of the Elderly and Development of Old Age Program, by the end of 2011, there were 20,300 older people living alone in Chongming accounting for 10.8% of Chongming older people, or 9.1% of those living alone in Shanghai (Gerontological Society of Shanghai 2012). In light of the large proportion of older people living alone in Chongming as well as the study’s purpose of exploring the health status, life circumstances and QoL of older people living alone, Chongming was considered to be a suitable study site. Shanghai Figure 3.1 Location of Shanghai 1 1 Source: http://www.gdgeo.net/Photo/ShowClass.asp?ClassID=33&page=2 110 Chongming County Figure 3.2 Location of Chongming County 2 3.3.3 Subjects The target population of this study was community-dwelling older people living alone in Chongming County. As described in Chapter 1 (p. 18), in China older people comprise those who are 60 years and above, which is the same as the definition of “older people” used by the United Nations (2006). Although most developed countries have accepted the age of 65 years as the threshold for describing older people, it does not adapt well to many developing countries. Living alone in this study was defined as staying and sleeping alone in one’s dwelling without sharing this dwelling with other people (see Chapter 1, p. 18). Those who received paid and/or unpaid personal assistance, but only from care-givers who did not live in the same house, for a limited period of time during the day and never at night were also considered to be living alone (Bilotta et al. 2012). 2 Source: http://en.wikipedia.org/wiki/File:Shanghai_administrative_Chongming.svg 111 The sample inclusion criteria were that the participants were able to communicate in Mandarin or Chongming dialect and had no moderate or severe cognitive impairment indicated by a score under six on the SPMSQ (Pfeiffer 1975). Those with hearing, language and communication difficulties and those with moderately or severely impaired capacity as evidenced by the results of cognitive function tests were excluded. 3.3.4 Sample size Sample size is a critical determinant of the standard error and power and should be large enough to detect differences or relationships that actually exist in the population (Newton & Rudestam 1999, Polit & Beck 2012). A power analysis is often used to estimate the adequacy of sample size to obtain significant results (Burns & Grove 2009). To estimate the required sample size, the level of significance (α), power (1-β) and the effect size (ES) must be specified. Usually, the level of significance is set at 0.05 and the minimum acceptable level of power is 0.80 (Cohen 1977). An effect size is sometimes calculated based on available findings from pilot studies or previous similar studies. When there are no relevant earlier findings, conventions based on expectations of a small, medium or large effect for different types of statistical analysis are used (Polit & Beck 2012). In this study, the sample size was estimated according to different statistical methods, namely, testing differences in group means and multivariate analysis. In order to explore the significant variables related to QoL, a bivariate analysis to compare the differences of QoL across the participants with different characteristics was used initially. Assuming the α was 0.05 and the power was 0.80, the sample size needed in each group was estimated to be 64 with 112 an estimated value of d for medium level of 0.5 (two-group comparison), or 53 (three-group comparison) to 44 (four-group comparison) with an estimated η2 of 0.06 for a medium effect (Polit & Beck 2012). The sample size is an important consideration in the multivariate analysis which was used to explore the predictors of QoL. Newton and Rudestam (1999) recommended the rules for approximating the appropriate sample size in building a model, assuming an α of 0.05, a power of 0.80 and a medium effect size: 1. When computing the proportion of variance that the model explains, the sample size should equal at least 50+8k, where k is the number of independent variables. In this study, a sample size of 202 was required with 19 independent variables, such as the presence of chronic diseases, the presence of acute diseases, cognitive function, depression, functional ability, loneliness, social support, physical activity and socio-demographic variables. 2. When computing the proportion of variance that an individual variable explains, the sample size should be at least 104+k. In this way, a sample size of this study was at least 123 with 19 independent variables. Because not everyone invited to participate in the study agrees to do so, the percentage of people who are likely to cooperate should be considered (Polit & Beck 2012). The drop-out percentage of 30.0% was expected in this study due to refusals, incomplete or lost data. In conclusion, a sample of at least 289 was deemed necessary to test the 113 differences in physical health, mental health, functional ability, loneliness, social support, physical activity, health services satisfaction and satisfaction with dwelling conditions across the older people with different socio-demographic characteristics, explore the significant variables related to QoL and develop a model of QoL of older people living alone. 3.4 Questionnaire development A structured questionnaire comprising eight sections was developed to collect data about the physical health status, mental health status, functional ability, self-rated health, physical activity, loneliness, social support, health services utilisation and satisfaction, housing, QoL and socio-demographic information of older people. The instruments and variables used were introduced as follows: Physical health status The participants were asked to list all chronic diseases that they had and to report whether they had experienced any kind of acute diseases in previous four weeks. Cognitive function The Short Portable Mental Status Questionnaire (SPMSQ; Pfeiffer 1975) was used to assess cognitive function. It comprises 10 items testing some intellectual areas including orientation, remote and recent memory, general knowledge and mathematical ability. The participants were asked the questions without access to any information such as a newspaper, calendar 114 and identity card which might aid to their memory. All answers were recorded and one point was given to each correct answer. The total score was calculated by summing the 10 items, yielding a score range of 0-10. As the SPMSQ score is influenced by education, the education level was taken into account in the scoring. If the participant had no formal education or primary school only, one point was added. If the participant had an education beyond high school, one point was subtracted. An adjusted score of 8-10 (0-2 errors) indicated intact cognitive function, 6-7 (3-4 errors) indicated mild cognitive impairment, 3-5 (5-7 errors) indicated moderate cognitive impairment, and 2 or under (8-10 errors) indicated severe cognitive impairment. The SPMSQ is brief enough to permit assessment without causing participants fatigue, so that it is both suitable for and accepted by older people (Yeh & Liu 2003). Moreover, it is easily administered and can be accurately applied by people without formal neurological training (Welch & West 1999). The SPMSQ has been extensively used and tested with adequate reliability and validity (McDowell 2006). The Cronbach’s α coefficient of 0.83 and the test-retest reliability coefficient of 0.85 were reported in 36 nursing home residents (Lesher & Whelihan 1986). A four-week test-retest reliability coefficient ranging from 0.81 to 0.83 was also reported in some studies (McDowell 2006). The correlation between the SPMSQ and some standard tests of cognitive function was 0.57 (the Basic Life Skills Assessment), 0.60 (the Bender test), 0.66 (the Digit Span test), and 0.69 (the MMSE) respectively. The Chinese version of the SPMSQ was first validated by Guo (1998) among 361 older people aged 60 years and above. The results showed that most item-item and item-total correlations were above 0.30, the split-half reliability was 0.69, and the criterion-related validity (with the MMSE) was 0.56. The scale has now been widely used with a 115 Cronbach’s α coefficient ranging from 0.90 to 0.98 across different studies (Lin 2007, Yeh & Liu 2003). Depression The 15-item Geriatric Depression Scale (GDS; Sheikh & Yesavage 1986), which is widely used for the detection of depression in older people, was used in this study. It is a short form of the original version comprising 30 items (Yesavage et al. 1983) and was considered to be more suitable in this study because it was quick to administer, simple to rate and not onerous for the participants (Almeida & Almeida 1999). The scale comprises 15 items regarding depressive symptoms experienced in the previous one-week period. Each item was rated on a dichotomous scale of “yes” or “no” yielding a score range of 0 to 15 with a higher score indicating a higher level of depression. Previous studies have indicated an acceptable test-retest reliability (Lyness et al. 1997, Shah et al. 1996) and the validity for screening depression according to other validated scale or diagnostic criteria, such as the Montgomery Asberg Depression Rating Scale (MADRS), the International Classification of Diseases, 10th revision (ICD-10) and the Diagnostic and Statistical Manual of Mental Disorders, 4th edition (DSM-Ⅳ) (Almeida & Almeida 1999, Herrmann et al. 1996). The Chinese version of the 15-item GDS has been used in many studies with good reliability and validity (He et al. 2008, Lee et al. 1993, Liu et al. 1998). Lai et al. (2010) examined its factor structure among a random sample of 228 older people living alone in Mainland China and yielded a four-factor model consisting of “positive and negative mood”, “energy level”, “inferiority” and “disinterested”, which demonstrated the applicability of the GDS to older Chinese people living 116 alone. As described in Chapter 2, different cut-off points (five, seven and eight) have been adopted in different studies. Eight was applied in this study, as it has been validated for the detection of depression with a high sensitivity of 96.3% and a specificity of 87.5% (Boey 2000, Lee et al. 1994, Woo et al. 1994). In addition, the adoption of eight as the cut-off point avoided a misleadingly high prevalence of depression (Lam & Boey 2005). Older people who scored equal to or greater than eight were considered to have depression. Functional ability The Activity of Daily Living (ADL) Scale (Lawton & Brody 1969) was used to measure functional ability. It includes 14 items with two composites: Physical Self-Maintenance (PSM) Scale and Instrumental Activity of Daily Living (IADL) Scale. PSM refers to activities related to basic physical functioning including feeding, dressing, grooming, walking, bathing and toileting. IADL refers to activities related to more complex skills including using the telephone, using transportation, shopping, preparing meals, doing housework, doing laundry, taking medicine and managing finances. Lawton and Brody (1969) tested the scale in 265 older people and reported a Guttman reproducibility coefficient of 0.96 of the PSM Scale and 0.93 of the IADL Scale. A Pearson correlation between pairs of nurses who independently rated 36 patients with varied self-care deficits was 0.87. In addition, an agreement of 0.91 was reported between two research assistants who rated 14 patients independently. The validity was demonstrated by the correlations between the scale and the Physical Classification (PC), the Mental Status Questionnaire (MSQ) and the Behavior and Adjustment rating scales (BA). 117 There are some variations in the response categories and formats across the different ADL Scale editions (McDowell 2006, Wiener et al. 1990). The Chinese version is a four-point rating scale with a lower score indicating a higher level of functional ability: performing the activity totally independent (=1), with some help (=2), with a lot of help (=3), totally dependent (=4). Its internal consistency with Cronbach’s α coefficient was 0.84-0.94 (Yao et al. 2009) and test-retest reliability coefficient was 0.50 (Zhang et al. 1995). The convergent validity was supported with moderate correlations between this scale and other functioning measurements (Zhang et al. 1995) For the overall ADL, a score of 14-16 indicated a high level of functional ability, 17-21 indicated a moderate level, and 22 and above indicated a low level. For the PSM and IADL dimensions, those who could accomplish all activities independently were regarded as having a high level of PSM/IADL, those who accomplished at least one activity with some help or at most one activity with a lot of help were regarded as having a moderate level of PSM/IADL, and those who accomplished two or more activities with a lot of help were regarded as having a low level of PSM/IADL. Self-rated health Self-rated health was measured by asking, “How would you rate your current health status?” with five possible responses: very good, good, neutral, poor and very poor. Loneliness Loneliness was measured by the UCLA Loneliness Scale version 3 118 (RULS-V3; Russell 1996). It is a 20-item questionnaire to assess subjective feelings of loneliness or social isolations in adults, with 11 items worded in a negative (lonely) direction and nine items worded in a positive (non-lonely) direction. Each item was rated with four possible responses: never (=1), rarely (=2), sometimes (=3) and always (=4), yielding a score range of 20-80 with a higher score denoting a higher level of loneliness. According to Perry’s (1990) loneliness classification scheme, a score of 20-34 indicated a low level of loneliness, 35-49 indicated a moderate level, 50-64 indicated a moderately high level, and 65-80 indicated a high level. The RULS-V3 had a satisfactory internal consistency with a Cronbach's α coefficient of 0.89 and a high test-retest reliability coefficient of 0.73 when it was tested in older people (Russell 1996). The convergent validity was supported by significant correlations with other loneliness measurements (Russell 1996). Confirmatory factor analysis provided support for viewing the scale as a uni-dimensional measure (Russell 1996). The Chinese version of the RULS-V3 has been widely used with a reported Cronbach’s α coefficient of 0.82-0.88 in some studies (Wang 1995, Wang et al. 2001, Wu et al. 2010). Social support Social support was measured by the Social Support Rate Scale (SSRS). The scale was developed reflecting the Chinese context (Xiao 1999) and comprises three dimensions: objective support, subjective support and support utilisation. Objective support reflects people’s social networks and the actual support that they received. It was measured by stating living arrangements (living alone, with friends, with family members, with strangers) and listing all the sources of received instrumental support (financial 119 assistance and solving actual problems) and emotional support. The score of objective support is the sum of the score on different living arrangements and the number of sources. Subjective support reflects perceptions of social support that people have. It refers to the subjective experience of being respected, supported and understood (Xiao 1994). It was measured by stating the number of close friends that people perceived that they had and the extent to which people perceived that they could receive support from neighbours, colleagues, spouse/partner, parents, children, siblings and other family members (none, little, some, a lot). It was scored with 1, 2, 3 and 4 according to the number of close friends and on each four-point Likert item. Support utilisation measured the extent to which people sought and made use of social support from never (=1) to always (=4), including confiding or asking for help if in trouble, and attending social activities. The total score for the SSRS ranges from 12 to 65 with a higher score indicating a higher level of social support. The scale has been widely used in China with a Cronbach's α coefficient from 0.89 to 0.94 and a test-retest reliability coefficient of 0.92 (Deng et al. 2010). Taking into account the participants’ characteristics of living alone, the item regarding living arrangements was deleted when the scale was used in this study. Physical activity Self-report frequency of engaging in sitting activities, walking, recreational activities and household activities per week was used to measure physical 120 activity. Recreational activities ranged from low intensity activities such as tai chi, to high intensity activities such as jogging. Household activities included light house work such as dusting, and heavy house work such as scrubbing floors. The participants who spent at least half an hour of moderate or/and strenuous exercise on at least five days per week were regarded as being adequate in physical activity (Haskell et al. 2007). Health services utilisation and satisfaction Health services utilisation was assessed in terms of the participants’ preferences for health services seeking and the type of hospital. They were asked whether they sought health services when they were sick. Those answering “yes” continued to state the type of hospital that they had attended most often (community hospital, township hospital, the Central Hospital of Chongming County, tertiary hospital and other). Health services satisfaction was measured by asking one single question of “On the whole, how satisfied are you with the health services?” using a five-point scale: very satisfied, satisfied, neutral, dissatisfied and very dissatisfied. Housing The measurement of housing included objective and subjective aspects. The objective aspect referred to housing tenure which was dichotomised as “public rental housing” and “private housing”. The subjective aspect referred to the level of satisfaction with some components of residential environment. It was measured by rating the dwelling size, bathroom, kitchen, distance from 121 children or relatives, convenience of public transport and dwelling conditions overall on a five-point scale: very satisfied, satisfied, neutral, dissatisfied and very dissatisfied. Quality of life The Older People’s Quality of Life Questionnaire (OPQOL; Bowling 2009) was used to measure QoL. It is a multi-dimensional measurement scale comprising 35 items within eight dimensions: life overall (four items), health (four items), social relationships/leisure and social activities (eight items), independence, control over life and freedom (five items), home and neighbourhood (four items), psychological and emotional well-being (four items), financial circumstances (four items), and religion/culture (two items). Each item was rated on a five-point Likert scale from strongly agree (=5) to strongly disagree (=1) with a higher score indicating a higher QoL. This scale was derived directly from older people’s views of what gave their life quality and what took quality away, and cross checked against theoretical models for assessment comprehensiveness (Bowling & Stenner 2011). The psychometric properties were tested in a sample of community-dwelling older people in England (Bowling 2009, Bowling & Stenner 2011). It had a satisfactory reliability with a Cronbach's α coefficient ranging from 0.75 to 0.90 across the sub-groups and a four-week test-retest reliability coefficient ranging from 0.40 to 0.78. The criterion validity was indicated by moderate to strong correlations with self-perceived QoL with a Spearman’s rank correlation ranging from -0.35 to -0.66. The construct validity was supported by significant correlations between dimensions and similar measures (e.g. “health” dimension and self-rated health), and no significant correlations 122 between different pairs (e.g. “health” and “religion/culture” dimensions). Considering the current prominent social problem of high health care costs in China and the likely increase of health care costs with ageing, the OPQOL used in this study was modified by adding one item “I have enough money to afford my health-care expenses”. Socio-demographic data The socio-demographic data collected included age, gender, ethnic group, marital status, occupation, education level, monthly income and residential area. Marital status was divided into five groups: widowed, divorced, separate, never married and other. Regarding occupation, the participants were asked to report their previous occupations before retirement and their current occupations (if they had any). Education level was grouped into “no formal education”, “primary school only”, “junior high school only”, “senior high school only” and “college or above”. Monthly income refers to the total amount of income per month from all sources such as property income, business income and pension. It was categorised into “<500 RMB”, “500-999 RMB”, “1000-1999 RMB” and “≥2000 RMB” (Shanghai Municipal Statistics Bureau 2011b). Residential area was dichotomised as “urban” or “rural”. One open question regarding the older people’s opinions or experiences of living alone was put at the end of the questionnaire. An open question can: “provide forthright and valuable insights into people’s perceptions of the issues involved and to get a feel for the words and phrases that they use” (Jackson & Furnham 2000, p. 116). 123 After the English version of the initial questionnaire was drafted, the OPQOL which had no Chinese version was translated. The proper translation of survey items from the language of one culture to another is a major issue in conducting research in other cultures (Krause et al. 1998). In order to avoid some inherent translation problems, Brislin’s (1970) steps for translating were adopted. The researcher translated the OPQOL into Chinese. One bilingual expert translated it back from Chinese to English blindly. The back-translated and original versions were compared and discussed by two native English speaking experts. Items with different meanings were re-translated and blindly back-translated again by another bilingual expert. The Chinese OPQOL was further discussed by all translators and the researcher until the agreed version was produced. Four older people living alone in Chongming were conveniently selected to assess the understandability, linguistic appropriateness and clarity of the Chinese version of the questionnaire. Some adjustments were made in light of the feedback. After these procedures, the Chinese version of the questionnaire was ready for the study (the English and Chinese versions of the initial questionnaire used in the pilot study are presented in Appendices 4 and 5). 3.5 Ethical considerations Ethical approval was gained from King’s College Research Ethics Committee (PNM/10/11-147, Appendix 6). The main ethical considerations of this study were beneficence, participants’ right to self-determination and full disclosure, confidentiality and anonymity. The study did no harm to the participants and they did not suffer from any distress or inconvenience. All participants were 124 given full information of the study and one week to consider their voluntary participation. They were assured that their participation was voluntary. They had the right to omit any question which they did not want to answer. They could withdraw at any time during the study without giving a reason before their anonymous data were included in the dataset. The participants’ consent was gained before the questionnaire completion. Each questionnaire was assigned an identification number and the participant’s name was not recorded. Any identifiable information would not be contained on any reports or publications arising from this study. The participants’ personal identification data were kept separately in China from all the other information obtained to render the data anonymous. All questionnaires and other printed documents were stored in a locked filing cabinet and only the research team had access to the collected data, which assured the data confidentiality. In addition, every member in the research team agreed not to use the data freely for any purpose except for this study. 3.6 Pilot study A pilot study is a necessary and important procedure before the main study. It helps to prevent the researcher from failing to achieve the research objectives due to some unforeseen errors (Chen 2007). It can test the questionnaire for accuracy of translation, readability and acceptability. It can also help to estimate the time duration of completing the questionnaire and possible costs of the study. Thirty older people who lived alone in Chongming and agreed to complete the questionnaire twice (the interval was two weeks) were conveniently recruited to the pilot study. The inclusion and exclusion criteria were the same as those for the main study. The characteristics of the pilot study participants are 125 presented in Table 3.1. All the 30 people were interviewed face to face by the researcher to complete the questionnaire, and afterwards they were asked to provide comments about the questionnaire and the survey process, e.g. whether the questionnaire was clear and understandable and whether they felt uneasy during the interview. Table 3.1 Characteristics of the pilot participants (n=30) Frequency (n) Percentage (%) Age (years) 80.8 (6.6) 60 – 69 2 6.7 70 – 79 8 26.7 20 66.6 Male 11 36.7 Female 19 63.3 30 100 No formal education 14 46.7 Primary school 15 50.0 Junior high school 0 0 Senior high school 1 3.3 23 76.7 Blue-collar worker 6 20.0 Non-manual occupation 1 3.3 20 66.6 500 – 999 2 6.7 1000 – 1999 3 10.0 ≥2000 5 16.7 ≥80 Mean (SD) Gender Marital status Widowed Education Previous occupation Peasant Monthly income (RMB) <500 All the questionnaires were completed with no item non-response within average 45 minutes. Some comments provided by the pilot study participants are summarised: 1. Such a study focusing on the health status, life circumstances and QoL of older people living alone was welcomed. 126 2. The face-to-face interview was a suitable approach for collecting data. 3. On the whole, the questionnaire was easy to understand. But it took a little bit more time to complete the GDS and RULS-V3. More explanation was necessary regarding these two scales. In addition, after analysing the data, the questions regarding health services utilisation was modified. Question C4, which asked the participants whether they had experienced any acute diseases in the previous four weeks, was a skip question and only two participants (6.7%) answered “yes”, and thus could continue to answer question C5 regarding whether they went to seek health services and what kind of hospital they had attended. To ensure that enough information regarding health services utilisation was obtained, the option of “Skip to question C6” in question C4 was deleted and question C5 “Did you go to seek health services” was revised as “Do you go to seek health services when you are sick?” The two questions which were modified after the pilot study are listed in Table 3.2. Table 3.2 The modified questions in the questionnaire Original questions Modified questions C4. In the last 4 weeks, have you suffered C4. In the last 4 weeks, have you suffered from from any kind of acute diseases? any kind of acute diseases? Yes Yes No (Skip to question C6) No C5. Did you go to seek health services? C5. Do you go to seek health services when you are sick? The reliability and validity of each scale used in the pilot study were initially tested. The face validity was measured through consulting with the pilot study participants and three experts on nursing or gerontology from Fudan University. Although face validity should not be considered as a strong evidence for an instrument’s validity, it is helpful for subjects completing the 127 instrument if it has a satisfactory face validity (Polit & Beck 2012). These scales were considered to have relevance to what they were supposed to measure. Moreover, all the scales except the OPQOL have been widely used in China, so that they should have satisfactory face validity. The Cronbach’s α coefficient was calculated to test the internal consistency and the intra-class correlation coefficient (ICC) was calculated to test the two-week test-retest reliability (see Table 3.3). Most of the scales showed satisfactory internal consistency with the Cronbach’s α coefficient being over 0.70 (LoBiondo-Wood & Haber 1998). The internal consistency of the SPMSQ (Pfeiffer 1975) met the acceptable threshold of being over 0.50 as suggested by Tuckman (1999). The ICCs for all the scales were above 0.60 indicating excellent to good stability (Fleiss 1986). Thus, the final version of the questionnaire was developed and ready for use in the main study (the English and Chinese versions of the questionnaire used in the main study are presented in Appendices 7 and 8). Table 3.3 The reliabilities of the scales in the pilot study Scales Internal consistency Test-retest reliability (Cronbach’s α ) (ICC) Short Portable Mental Status Questionnaire 0.63 0.69 Activity of Daily Living Scale 0.77 0.88 Geriatric Depression Scale 0.87 0.81 UCLA Loneliness Scale 0.79 0.68 Social Support Rate Scale 0.71 0.70 Older People’s Quality of Life Questionnaire 0.88 0.87 3.7 Main study The main study was approved and supported by the heads of the committees of the selected towns in Chongming. Therefore, the profile of the towns such 128 as the number of communities and the number of older people living alone in each community was obtained. 3.7.1 Sampling procedure Sampling is the process of selecting a portion of the population to represent the entire population so that inferences about the population can be made (Polit & Beck 2012). The key consideration about sampling is representativeness, which is necessary to minimise the magnitude of sampling error (Polit & Beck 2012). The probability sampling, in which each element in the population has an equal, independent chance of being selected, is the only viable method to obtain representative sample (Polit & Beck 2012). In this study, a multi-stage stratified random cluster sampling technique was used. Firstly, 18 towns in Chongming were stratified into two groups reflecting their economic level (low and high) (Statistics Bureau of Chongming 2011). Secondly, one town was randomly selected from each group. Finally, a number of communities were randomly selected from each selected town until the proposed sample size was met. In all, nine communities were selected. All the older people who lived in these communities and met the inclusion criteria were invited to be recruited to the sample. Figure 3.3 presents the sampling procedure. 129 18 towns Stratified Group 1: Group 2: Towns with a high economic level Towns with a low economic level Random sampling One town: MZ One town: XH Random sampling Five communities: Four communities: MD, ZH, MJ, WA, HD JQ, XD, XM, XJ All eligible people Figure 3.3 The flow chart for sampling procedure 3.7.2 Data collectors training A total of 18 people (10 in Town MZ, 8 in Town XH) who were staff of community committees or community residents were selected as data collectors to assist the data collection. These data collectors were familiar with the older people and had interview experience. A half-day training session was held in each town with a training manual (Appendices 9 and 10), copies of questionnaire, information sheet (Appendices 11 and 12) and consent form (Appendices 13 and 14) being distributed. 130 In the training session, the researcher first introduced the background, significance, objectives and other information of the study. The data collection procedure and techniques were also introduced. In order to make sure that each data collector understood the questionnaire, a detailed explanation of each item was provided. At the end of the training, two data collectors were invited to practice role playing to demonstrate their understanding of the instruction. 3.7.3 Data collection Data collection was undertaken from November 2011 to March 2012. All potential participants were given detailed information and the information sheet during door-to-door visits. One week later, they were contacted again to ascertain their wishes regarding study participation. Those who agreed to participate were offered a face-to-face interview at their homes, community committee offices or other places reflecting their preferences. During the face-to-face interview, the SPMSQ (Pfeiffer 1975) was administered to assess the potential participants’ cognitive function. If a score under six was obtained, the participant was excluded from further participation in the study due to his/her poor cognitive function and the interview was terminated. Those with good cognitive function were given the informed consent form. Once consent was gained, the questionnaires were given to the participants for self-completion, or the data collectors assisted the participants using an interview to complete the questionnaires. The completed questionnaires were collected immediately. The researcher observed the interview process on the first day of each data collector’s field work and provided feedback immediately afterwards. During 131 the data collection period, a meeting was conducted once a month to assess the progress, and to review and discuss data collection techniques to ensure full adherence to the structured questionnaire. Moreover, frequent contacts with data collectors via telephone took place to know whether they encountered any problems or whether they had any reflections. These strategies were adopted to ensure high quality of data collection. A total of 640 potential participants were identified, of whom 97 were ineligible because of poor cognitive function, 22 declined to participate, and 521 completed the survey, yielding a response rate of 95.9%. Figure 3.4 shows the data collection procedure. Information sheets were given to all potential participants during door-to-door visits (n=640) One week later Face-to-face interview (n=618) SPMSQ Good cognitive function Poor cognitive function Questionnaire Excluded (n=521) (n=97) Figure 3.4 The flow chart for data collection 132 3.8 Data analysis Data were entered and analysed using SPSS 16.0 for Windows. In order to reduce data input errors and ensure the accuracy for further data analysis, all questionnaires were double-checked with the electronic data by a college student. Frequency tables, histograms and bar charts were generated to check the appropriateness of data, such as out-of-range numbers, obvious impossible values and missing data. 3.8.1 Validation of the scales in the main study The OPQOL (Bowling 2009) was developed within the UK context and had not been used in China. Therefore, psychometric testing of the Chinese OPQOL needed to be performed to assess its utility among Chinese older people. Reliability was assessed using internal consistency and test-retest reliability. The internal consistency was assessed by Cronbach’s α coefficient, and the test-retest reliability was measured by calculating ICC between two sets of scores obtained two weeks apart using the pilot study dataset. The convergent validity was tested by assessing Spearman’s rank correlations between the OPQOL and the ADL Scale (Lawton & Brody 1969), SSRS (Xiao 1999) and RULS-V3 (Russell 1996). The discriminant validity was assessed by comparing the differences of QoL between depressed and non-depressed groups using Mann-Whitney U test. Exploratory factor analysis (EFA) was performed by principal component analysis (PCA) and varimax rotation to test the construct validity. An Eigenvalue greater than 1 was set to decide the number of factors and the factor loading greater than 0.40 was set as the criteria (Polit & Beck 2012). Although other scales had been validated in China, their internal consistency was also re-assessed in this study. 133 3.8.2 Statistical analysis to fulfil the research objectives Descriptive statistics such as mean, medium, standard deviation (SD), score range, frequency and percentage were used to describe the physical health, mental health, functional ability, self-rated health, loneliness, social support, physical activity, health services utilisation and satisfaction, housing and QoL of the participants. The χ2 test was used to explore whether physical health, mental health, functional ability, self-rated health, loneliness, social support, physical activity, health services satisfaction and satisfaction with overall dwelling conditions were different across the participants with different socio-demographic characteristics. It is a non-parametric statistical method to test the difference in proportions in two or more independent groups (Burns & Grove 2009). The Mann-Whitney U test and Kruskal-Wallis test were used to explore the relationships between QoL and socio-demographic variables, physical health, mental health, functional ability, self-rated health, loneliness, social support, physical activity, health services satisfaction and satisfaction with overall dwelling conditions. Both tests are non-parametric procedures for testing the difference across different groups. The Mann-Whitney U test is used for two independent groups, and the Kruskal-Wallis test is used when the number of groups is greater than two (Polit & Beck 2012). It is noteworthy that the OPQOL is a Likert scale and the data produced from this kind of instrument should be treated as ordinal measures (Polit & Beck 2012). Therefore, non-parametric statistical methods were appropriate for testing the difference in ranks of scores of the different independent groups when the assumptions for parametric tests are not met (Burns & Grove 2009). 134 In a correlational survey, many variables are usually interrelated in highly complex ways, to which univariate and bivariate analyses are not sensitive (Tabachnick & Fidell 2001). Multivariate statistics can assess the complex interrelationships between many independent and dependent variables. Further, it is possible to keep the overall Type Ⅰ error rate at 5.0% no matter how many variables are tested (Tabachnick & Fidell 2001). Analysis of Variance (ANOVA) is used to understand the effects of one or more independent variables on a dependent variable by analysing total variability in a continuous dependent measure and contrasting variability due to independent variables with that attributable to individual differences of error (Polit & Beck 2012). It is suitable when independent variables are categorical and dependent variables are continuous (Tabachnick & Fidell 2001). Therefore, the multi-way ANOVA was selected to explore the predictors of QoL with variables having significant relationships with QoL in the bivariate analyses being entered into model. As described earlier, the data produced from the OPQOL should be treated as ordinal measures. However, mathematical operations with ordinal-level data are restricted and many statistical procedures such as ANOVA are based on interval scales (Polit & Beck 2012). Therefore, the original data of QoL were replaced with ranks in ANOVA because ranks are essentially interval-level measurement. Table 3.4 summarises the detailed statistical methods for answering the research questions. 135 Table 3.4 The research questions and corresponding statistical methods Research questions Statistical methods 1. What is the physical health, mental health, functional ability, Descriptive statistics self-rated health, loneliness, social support, physical activity, health services utilisation and satisfaction, housing and QoL of the participants? 2. Does the physical health, mental health, functional ability, self-rated 2 χ test health, loneliness, social support, physical activity, health services satisfaction and satisfaction with overall dwelling conditions differ across the different socio-demographic characteristics of the sample? 3. What are the relationships between QoL and socio-demographic Mann-Whitney U variables, physical health, mental health, functional ability, self-rated test and health, loneliness, social support, physical activity, health services Kruskal-Wallis test satisfaction and satisfaction with overall dwelling conditions? 4. What are the predictors of QoL? Multi-way ANOVA 3.9 Chapter summary This chapter has described the study method in detail. The study design, questionnaire development, ethical considerations, pilot study, main study and statistical analysis have been described in sequence. A correlational survey design was selected to explore the health status, life circumstances and QoL of older people living alone in Chongming. Appropriate instruments were selected and the one having no Chinese version was translated. A pilot study with 30 conveniently recruited older people living alone was conducted, which helped to facilitate further study in terms of acceptability of the questionnaire, feasibility of data collection and study costs. In the main study, data were collected among a stratified random cluster sample of 521 older people living alone. Descriptive, bivariate and multivariate statistical methods were selected to analyse data to fulfil the research objectives. Next chapter will report the results of the data analysis. 136 CHAPTER 4 FINDINGS: STATUS OF HEALTH, LIFE CIRCUMSTANCES AND QUALITY OF LIFE OF OLDER PEOPLE LIVING ALONE IN CHONGMING 4.1 Chapter introduction This chapter describes the psychometric properties of the instruments used in the main study and the characteristics of the participants. In addition, it addresses the first research objective which is to describe the health status, loneliness, social support, physical activity, health services utilisation and satisfaction, housing and QoL of older people living alone in Chongming. Two questions, namely, the status of health, life circumstances and QoL of older people living alone in Chongming, and the differences of the health and life circumstances across the different socio-demographic characteristics of the sample are answered. 4.2 Psychometric properties of the scales in the main study 4.2.1 Psychometric properties of the Chinese OPQOL The internal consistency and two-week test-retest reliability of the Chinese OPQOL and its dimensions are set out in Table 4.1. The Cronbach’s α coefficient of the total scale was 0.90 indicating a satisfactory internal consistency (LoBiondo-Wood & Haber 1998). Moreover, five of the eight dimensions also demonstrated satisfactory internal consistency with the “health” dimension meeting the acceptable limit (Tuckman 1999). However, the α coefficients were low in the “social relationships/leisure and social 137 activities” and “independence, control over life, freedom” dimensions. The ICCs of the total scale and its five dimensions were over 0.60 indicating excellent to good test-retest reliability. However, the ICCs of the “social relationships/leisure and social activities”, “home and neighbourhood” and “psychological and well-being” dimensions were under 0.60 indicating moderate test-retest reliability (Fleiss 1986). 138 Table 4.1 The reliability of the Chinese OPQOL Overall OPQOL Life overall Q1. I enjoy my life overall. Q2. I am happy much of time. Q3. I look forward to things. Q4. Life gets me down. Health Q5. I have a lot of physical energy. Q6. Pain affects my well-being. Q7. My health restricts me looking after myself or my home. Q8. I am healthy enough to get out and about. Social relationships/leisure and social activities Q9. My family, friends or neighbours would help me if needed. Q10. I would like more companionship or contact with other people. Q11. I have someone who gives me love and affection. Q12. I’d like more people to enjoy life with. Q13. I have my children around which is important. Q31. I have social or leisure activities/hobbies that I enjoy doing. Q32. I try to stay involved with things. Q33. I do paid or unpaid work or activities that give me a role in life. Independence, control over life, freedom Q14. I am healthy enough to have my independence. Q15. I can please myself what I do. Q16. The cost of things compared to my pension restricts my life. Q17. I have a lot of control over the important things in my life. Q34. I have responsibilities to others that restrict my social or leisure activities. 139 Internal consistency (Cronbach’s α) 0.90 Test-retest reliability (ICC) 0.87 0.80 0.88 0.67 0.82 0.42 0.54 0.42 0.82 Table 4.1 (Continued) Home and neighbourhood Q18. I feel safe where I live. Q19. The local shops, services and facilities are good overall. Q20. I get pleasure from my home. Q21. I find my neighbourhood friendly. Psychological and emotional well-being Q22. I take life as it comes and make the best of things. Q23. I feel lucky compared to most people. Q24. I tend to look on the bright side. Q25. If my health limits social/leisure activities, then I will compensate and find something else I can do. Financial circumstances Q26. I have enough money to pay for household bills. Q27. I have enough money to pay for household repairs or help needed in the house. Q28. I have enough money to afford my health-care expenses. Q29. I can afford to buy what I want to. Q30. I cannot afford to do things I would enjoy. Religion/culture Q35. Religion, belief or philosophy is important to my quality of life. Q36. Cultural/religious events/festivals are important to my quality of life. 140 Internal consistency (Cronbach’s α) 0.70 Test-retest reliability (ICC) 0.53 0.73 0.56 0.73 0.79 0.97 0.72 The EFA was performed to test the factorial structure of the Chinese OPQOL. The ratio of subjects to items was 14.5:1 exceeding the recommended minimum ratio of 10:1 (Watson & Thompson 2006). The Kaiser-Meyer-Olkin (KMO) measure of sampling adequacy was 0.91 and Bartlett’s Test of Sphericity was statistically significant (Chi-Square 1.004E4, p<0.001), which signified that the correlation matrix was appropriate for factor analysis (Ferguson & Cox 1993). Table 4.2 shows the results of the EFA which was performed by PCA and varimax rotation. Eight factors were extracted and explained 63.77% of the total variance. Factor 1 mainly described the leisure and social activities dimension of QoL, explaining 13.11% of the rotated variance. Factor 2 mainly reflected the psychological well-being dimension, explaining 9.98% of the rotated variance. Factor 3 mainly described the health and independence dimension, explaining 8.92% of the rotated variance. All the five items in factor 4 described financial circumstances and explained 7.58% of the rotated variance. All the four items in factor 5 reflected social relationships and explained 7.53% of the rotated variance. Factor 6 was labelled as “home and neighbourhood”, which explained 6.70% of the rotated variance. Factor 7 consisting of two items described the culture and religion dimension, explaining 6.14% of the rotated variance. Factor 8 consisted of only one item and explained 3.81% of the rotated variance. 141 Table 4.2 Results of the exploratory factor analysis Item No. Factor 1: Factor 2: Factor 3: Factor 4: Factor 5: Factor 6: Factor 7: Factor 8: leisure and social activities psychological well-being health and independence financial circumstances social relationships home and neighbourhood culture/ religion safety 33 0.759 0.117 0.119 0.115 0.147 0.150 0.097 -0.038 32 0.709 0.062 0.194 0.029 0.287 0.014 0.247 -0.071 34 -0.680 -0.049 0.151 0.028 0.140 -0.068 0.023 -0.061 31 0.661 0.119 0.178 -0.036 0.253 -0.023 0.332 -0.127 25 0.583 0.160 0.119 0.238 0.155 0.055 0.162 0.069 5 0.538 0.286 0.382 0.188 0.003 0.111 -0.047 0.116 17 0.458 0.046 0.416 0.062 0.073 0.397 0.021 0.163 2 0.240 0.708 0.289 0.175 0.154 0.155 0.081 0.088 1 0.323 0.687 0.180 0.259 0.143 0.079 0.072 0.056 20 0.042 0.562 0.167 0.126 0.147 0.516 0.139 0.240 23 0.345 0.539 0.027 0.325 0.183 0.158 -0.034 0.167 3 0.343 0.536 0.103 0.194 0.243 0.052 0.135 0.268 4 -0.210 0.496 0.335 0.174 0.110 0.080 0.019 -0.105 13 0.173 0.430 -0.204 -0.160 0.358 0.106 0.137 0.256 24 0.356 0.372 0.091 0.126 0.307 0.268 0.084 -0.053 7 0.011 -0.034 0.746 0.027 0.094 0.087 0.169 -0.249 6 -0.005 0.037 0.665 0.094 -0.065 0.023 0.070 0.263 14 0.394 0.317 0.650 0.156 0.020 0.129 -0.074 0.123 8 0.298 0.213 0.642 0.016 0.159 0.036 0.012 0.004 142 Table 4.2 (Continued) Item No. Factor 1: Factor 2: Factor 3: Factor 4: Factor 5: Factor 6: Factor 7: Factor 8: leisure and social activity psychological well-being health and independence financial circumstances social relationships home and neighbourhood culture/ religion safety 15 0.321 0.206 0.543 0.077 0.053 0.242 -0.037 0.191 28 0.107 0.123 0.101 0.811 0.041 0.123 -0.045 0.040 27 0.276 -0.031 0.119 0.715 0.091 0.101 -0.055 0.160 16 -0.108 0.292 -0.063 0.593 0.109 0.006 0.093 -0.197 26 0.200 0.279 0.145 0.552 -0.021 0.398 0.156 0.078 30 -0.208 0.154 0.267 0.404 0.061 -0.323 0.180 0.287 11 0.040 0.398 0.063 0.098 0.675 0.050 0.152 0.050 10 -0.345 0.026 -0.076 -0.135 -0.668 -0.225 0.046 -0.158 12 -0.365 -0.063 -0.028 -0.238 -0.655 -0.032 -0.123 -0.257 9 -0.090 0.342 0.095 -0.051 0.652 0.176 0.128 -0.101 19 0.015 0.065 0.052 0.150 0.110 0.694 0.077 0.032 22 0.303 0.266 0.144 0.074 0.277 0.563 0.073 0.257 21 0.060 0.394 0.051 -0.057 0.341 0.489 0.131 0.091 29 0.306 0.140 0.276 0.372 -0.008 0.465 0.200 -0.041 35 0.182 0.087 0.076 0.046 0.130 0.138 0.917 0.069 36 0.199 0.112 0.064 0.031 0.113 0.122 0.915 0.064 18 0.009 0.227 0.099 0.066 0.204 0.228 0.100 0.724 % of rotated 13.108 9.980 8.922 7.582 7.529 6.701 6.143 3.806 variance Note: The bold values represent factor loadings great than 0.40. 143 The eight-factor structure of the Chinese OPQOL was basically similar to that of the English version. But differences were also found such as re-allocation of items. In addition, the low internal consistency of the “social relationships/leisure and social activities” and “independence, control over life, freedom” dimensions and the moderate test-retest reliability of the “social relationships/leisure and social activities”, “home and neighbourhood” and “psychological and well-being” dimensions suggested that the original factor structure of the OPQOL might not fit very well within older people living alone in China. The reliability was therefore retested based on the new factor structure. The findings presented in Table 4.3 showed better internal consistency and test-retest reliability of the Chinese OPQOL with a new eight-factor structure. Six of the eight dimensions yielded Cronbach’s α coefficients of 0.70 and above indicating satisfactory internal consistency. The “home and neighbourhood” dimension showed a relatively low but acceptable α coefficient of 0.66. As there is only one item in the “safety” dimension, its internal consistency could not be calculated. Six dimensions showed excellent to good test-retest reliability with the ICCs exceeding 0.60. While the “social relationships” and “safety” dimensions demonstrated moderate test-retest reliability. Table 4.3 The reliability of the Chinese OPQOL with a new factor structure Internal consistency Test-retest reliability (Cronbach’s α) (ICC) Leisure and social activities 0.72 0.62 Psychological well-being 0.85 0.85 Health and independence 0.80 0.87 Financial circumstances 0.70 0.85 Social relationships 0.76 0.53 Home and neighbourhood 0.66 0.80 Culture/religion 0.97 0.72 - 0.57 Dimension Safety Convergent validity is the evidence that different methods of measuring a 144 construct yield similar results (Polit & Beck 2012). In other words, the scale should correlate with similar/relevant measures. As QoL is a multi-dimensional concept comprising social and psychological well-being as well as physical well-being (Shek & Lee 2007), social support, loneliness and functional ability were used to assess the convergent validity of the OPQOL. Table 4.4 shows the correlations between scores of the OPQOL and its dimensions and the ADL Scale, SSRS and RULS-V3. The overall OPQOL score was significantly correlated with functional ability, social support and loneliness, with the participants with better functional ability, a higher level of social support and a lower level of loneliness reporting a higher QoL. In addition, all the dimensions had significant correlations with functional ability, social support and loneliness except that there was no correlation between the “safety” dimension and functional ability. Particularly the “health and independence” dimension correlated more closely with functional ability, and the “social relationships” dimension correlated more closely with social support. The results therefore indicated that the Chinese OPQOL had a satisfactory convergent validity. Table 4.4 Correlations between scores of the OPQOL and the ADL Scale, SSRS, RULS-V3 (Spearman’s rho) ADL SSRS ** 0.49 ** 0.36 ** 0.48 ** 0.26 ** 0.32 ** 0.53 ** 0.34 ** RULS-V3 ** -0.53 ** -0.37 ** -0.40 ** -0.45 ** -0.28 ** -0.43 ** -0.47 ** -0.36 ** -0.39 Overall OPQOL -0.50 Leisure and social activities -0.52 Psychological well-being -0.31 Health and independence -0.58 Financial circumstances -0.24 Social relationships -0.23 Home and neighbourhood -0.35 Culture/religion -0.11 0.31 Safety -0.07 0.23 ** ** ** ** ** ** ** ** ** ** p<0.01 Discriminant validity tests hypothesized differences across diverse groups completing the same instrument (Bonomi et al. 2000). Table 4.5 shows the results of discriminant validity analysis of the Chinese OPQOL. As has been noted in many studies depression affects various aspects of life (Kaneko et al. 145 2007, Mykletun et al. 2007, Unutzer et al. 1997), and the mean ranks of overall OPQOL and all dimensions were significantly higher in the non-depressed group than the depressed group, confirming the discriminant validity of the Chinese OPQOL. Table 4.5 Mann-Whitney U test between the depressed and non-depressed groups on the OPQOL Depressed Non-depressed (n=248) (n=273) Mean Rank Mean Rank Overall OPQOL 160.45 352.34 -14.54 Leisure and social activities 197.53 318.66 -9.21 Psychological well-being 190.29 325.23 -10.29 Health and independence 235.84 283.85 -3.70 Financial circumstances 219.17 299.00 -6.13 Social relationships 212.39 305.16 -7.69 Home and neighbourhood 184.12 330.84 -11.37 Culture/religion 217.25 300.74 -6.76 Safety 216.89 301.07 -8.61 Z ** ** ** ** ** ** ** ** ** ** p<0.001 4.2.2 The reliabilities of other scales The reliabilities of other scales used in the main study, i.e. the SPMSQ, ADL Scale, 15-item GDS, RULS-V3 and SSRS, were also tested by assessing their internal consistency. Table 4.6 presents the Cronbach’s α coefficient of each scale, which was considered to be satisfactory (LoBiondo-Wood & Haber 1998). Table 4.6 The reliabilities of the scales in the main study Internal consistency (Cronbach’s α) 0.71 Scales Short Portable Mental Status Questionnaire Activity of Daily Living Scale 0.92 Geriatric Depression Scale 0.82 UCLA Loneliness Scale 0.89 Social Support Rate Scale 0.76 146 4.3 Characteristics of the participants The characteristics of the participants are presented in Table 4.7. The participants ranged in age from 60-99 years old with an average age of 76.5 years. They were divided into three age groups with less than a quarter (24.2%) being in the “young old” group (60-69 years old). Those in the “old old” group (70-79 years old) accounted for 38.4% of the sample and those in the “oldest old” group (80 years and above) accounted for 37.4%. Nearly two thirds of the participants (66.0%) were female. The distribution of genders showed no difference across the different age groups (χ2=2.15, df=2, p>0.05). Most of the participants were widowed (96.1%) and rural residents (90.0%). A majority of the participants (n=514, 98.7%) had living children and the average number was 2.6 (SD=1.1). A large proportion of the participants reported a low level of education with 46.8% having no formal education and 40.9% having primary school education only. There was a gender difference in the education level with the women having lower levels of education than the men (χ2=53.27, df=2, p<0.001). A total of 78.3% of the participants reported being a peasant and only 2.7% were engaged in a non-manual occupation before retirement. The difference in genders across the previous occupations was also significant with more men being non-manual employees or blue-collar workers than women (χ2=28.25, df=2, p<0.001). Regarding monthly income, more than half of the participants (58.9%) reported that their monthly income were less than RMB 500 which indicated a low economic level (Shanghai Municipal Statistics Bureau 2011b). The monthly income was different across the participants’ genders (χ2=28.71, df=3, p<0.001), education levels (χ2=20.71, df=6, p=0.002) and previous occupations (χ2=2.311E2, df=6, p<0.001). Women, having no formal education and being a peasant, were more likely to report a low monthly income while men, having a junior high school degree or above and engaging in a non-manual occupation were more likely to report a monthly income 147 being over RMB 2000. There was no relationship between age and monthly income (χ2=11.59, df=6, p>0.05). Table 4.7 Characteristics of the participants (n=521) Frequency (n) Percentage (%) Age (years) Mean (SD) 76.5 (8.3) 60 – 69 126 24.2 70 – 79 200 38.4 ≥80 195 37.4 Male 177 34.0 Female 344 66.0 521 100 Widowed 501 96.1 Divorced 10 1.9 Separated 5 1.0 Never married 5 1.0 Gender Ethnicity Han Marital status Number of living children 2.6 (1.1) Education No formal education 244 46.8 Primary school 213 40.9 Junior high school 55 10.6 Senior high school 5 0.9 College and above 4 0.8 408 78.3 Blue-collar worker 99 19.0 Non-manual occupation 14 2.7 <500 307 58.9 500 – 999 110 21.1 1000 – 1999 57 10.9 ≥2000 47 9.1 469 90.0 52 10.0 Previous occupation Peasant Monthly income (RMB) Residential area Rural Urban Note: The categorisation of previous occupation was based on China’s occupational classification. Monthly income included property income, business income, pension and incomes from other sources. 148 4.4 Health status The participants’ health status included physical health, mental health, functional ability and self-rated health. Physical health was assessed by the presence of chronic diseases and acute diseases, and the number of chronic diseases. Mental health was assessed by measuring cognitive function and depression. In order to examine the chronic disease, cognitive function, depression, functional ability and self-rated health across the participants with different socio-demographic characteristics, education level was divided into three groups in light of the small number of responses in the “senior high school” and “college and above” groups. Economic level was categorised according to monthly income (Shanghai Municipal Statistics Bureau 2011b) with being less than RMB 500 denoting the low level, RMB 500-999 denoting the medium-low level, RMB 1000-1999 denoting the medium-high level, and more than RMB 2000 denoting the high level. 4.4.1 Chronic and acute diseases Nearly half of the participants (n=232, 44.5%) reported having a chronic disease with a range of 1-5 diseases (M=1.7, SD=0.9). Among the 232 participants, 119 (51.3%) reported one disease, 74 (31.9%) reported two diseases, and 39 (16.8%) reported three or more diseases (Table 4.8). The five most prevalent chronic diseases were hypertension (57.3%), heart disease (28.9%), musculoskeletal problems (17.2%), diabetes (16.4%) and stroke (15.1%). Table 4.9 sets out the cases of reported chronic diseases. Only 4.8% (n=25) of the participants reported any acute diseases in the previous four weeks. In light of the small number of responses, the participants who reported three, four and five chronic diseases were combined into one group. The number of chronic diseases of the participants by different socio-demographic characteristics is set out in Table 4.10 and shows that the proportion of older people without any chronic diseases was lower in the “oldest old” group 149 (p<0.001). Accordingly, older people in this group reported a significantly higher proportion of three or more chronic diseases. The difference in the number of chronic diseases was also significant across the different education levels (p<0.001). Older people with no formal education reported more chronic diseases than those having received some formal education. With regard to economic level, the proportions of older people reporting three or more chronic diseases were relatively higher in the medium-high and high level groups (p<0.01). Those living in the rural areas reported less chronic diseases than those living in the urban areas (p<0.05). There were no significant relationships between gender and previous occupation and the number of chronic diseases (p>0.05). Table 4.8 Reports on the number of chronic diseases Number of chronic diseases Frequency (n) Percentage (%) 0 289 55.5 1 119 22.8 2 74 14.2 3 26 5.0 4 10 1.9 5 3 0.6 Table 4.9 The cases of chronic diseases Type of chronic disease n Percent of cases (%) Hypertension 133 57.3 Heart disease 67 28.9 Musculoskeletal problems 40 17.2 Diabetes 38 16.4 Stroke 35 15.1 Chronic digestive diseases 21 9.1 Visual problems 18 7.8 Other 15 6.5 Chronic respiratory diseases 12 5.2 Hearing problems 7 3.0 Hyperlipidemia 4 1.7 Cancer 3 1.3 Chronic urinary system diseases 2 0.9 150 Table 4.10 The number of chronic diseases of the participants by different socio-demographic characteristics n Age (years) Gender Education Economic level Residential area 1 n % n 2 % 3+ n % n % 60 – 69 126 83 65.9 29 23.0 12 9.5 2 1.6 70 – 79 200 127 63.5 42 21.0 25 12.5 6 3.0 ≥80 195 79 40.5 48 24.6 37 19.0 31 15.9 Male 177 101 57.1 41 23.1 20 11.3 15 8.5 Female 344 188 54.6 78 22.7 54 15.7 24 7.0 No formal education 244 116 47.5 48 19.7 49 20.1 31 12.7 Primary school 213 124 58.2 60 28.2 23 10.8 6 2.8 64 49 76.6 11 17.2 2 3.1 2 3.1 Peasant 408 223 54.7 97 23.8 57 14.0 31 7.6 Not peasant 113 66 58.4 22 19.5 17 15.0 8 7.1 Low level 307 167 54.7 85 27.7 37 12.1 17 5.5 Medium-low level 110 69 62.7 18 16.4 15 13.6 8 7.3 Medium-high level 57 24 42.1 10 17.5 16 28.1 7 12.3 High level 47 28 59.5 6 12.8 6 12.8 7 14.9 Rural 469 264 56.3 111 23.7 61 13.0 33 7.0 Urban 52 25 48.1 8 15.4 13 25.0 6 11.5 Junior high school and above Previous occupation 0 χ 2 p 48.356 <0.001 2.077 0.557 42.717 <0.001 1.046 0.790 26.590 0.002 7.983 0.046 Note: Previous occupation was dichotomised into “peasant” and “not peasant” in light of the small number of responses in the “non-manual occupation” group. The bold data indicated noteworthy statistically significant results. 151 4.4.2 Cognitive function Among the participants, 87.1% had intact cognitive function with the scores on the SPMSQ ranging 8-10, and the remainder were identified as having mild cognitive impairment with the scores on the SPMSQ ranging 6-7 (Table 4.11). Prior to data collection, 97 older people were excluded because of poor cognitive function with a score under six on the SPMSQ (see p. 130), which accounted for 15.7% (97/618) of the total who agreed to participate in the study. Table 4.11 The cognitive function of the participants Cognitive function Intact cognitive function Mild cognitive impairment Frequency (n) Percentage (%) 454 87.1 67 12.9 The cognitive function of the participants by different socio-demographic characteristics is presented in Table 4.12. The differences in cognitive function were statistically significant across the different age groups, education levels, previous occupations and residential areas. Older people with advancing age and lower levels of education were more likely to have mild cognitive impairment (p<0.001). More peasants demonstrated mild cognitive impairment than the blue-collar workers and non-manual employees (p<0.05). Older people who lived in the urban areas were more likely to have an intact cognitive function than those who lived in the rural areas (p<0.05). There was no statistically significant difference in cognitive function between the men and women (p>0.05). Similarly, the differences among older people with different economic levels were not statistically significant either (p>0.05). 152 Table 4.12 The cognitive function of the participants by different socio-demographic characteristics n Age (years) Gender Education Economic level Residential area n Mild cognitive impairment % n % 60 – 69 126 125 99.2 1 0.8 70 – 79 200 182 91.0 18 9.0 ≥80 195 147 75.4 48 24.6 Male 177 158 89.3 19 10.7 Female 344 296 86.0 48 14.0 No formal education 244 185 75.8 59 24.2 Primary school 213 205 96.2 8 3.8 64 64 100 0 0 408 347 85.0 61 15.0 Blue-collar worker 99 94 94.9 5 5.1 Non-manual occupation 14 13 92.9 1 7.1 Low level 307 276 89.9 31 10.1 Medium-low level 110 89 80.9 21 19.1 Medium-high level 57 49 86.0 8 14.0 High level 47 40 85.1 7 14.9 Rural 469 404 86.1 65 13.9 Urban 52 50 96.2 2 3.8 Junior high school and above Previous occupation Intact cognitive function Peasant Note: The bold data indicated statistically significant results. 153 χ 2 p 43.076 <0.001 1.081 0.299 53.103 <0.001 7.388 0.025 6.145 0.105 4.188 0.041 4.4.3 Depression The scores on the 15-item GDS ranged from 0 to 15 with a mean of 7.4 (SD=3.5). A total of 248 participants scored eight or over yielding a prevalence of depression of 47.6% (see Table 4.13). Table 4.13 Reports on the Geriatric Depression Scale GDS score Frequency (n) Percentage (%) <8 273 52.4 ≥8 248 47.6 Table 4.14 sets out the presence of depression in the participants by different socio-demographic characteristics. There were statistically significant differences across the participants of different age groups, education levels, previous occupations, economic levels and areas of residence. Older people with increasing age, lower levels of education and lower economic levels, being peasants and living in the rural areas were more likely to have depression (p<0.001). However, there was no gender difference in the presence of depression (p>0.05). 154 Table 4.14 The presence of depression in the participants by different socio-demographic characteristics n Age (years) Gender Education Economic level Residential area n Non-depression % n % 60 – 69 126 46 36.5 80 63.5 70 – 79 200 84 42.0 116 58.0 ≥80 195 118 60.5 77 39.5 Male 177 77 43.5 100 56.5 Female 344 171 49.7 173 50.3 No formal education 244 140 57.4 104 42.6 Primary school 213 90 42.3 123 57.7 64 18 28.1 46 71.9 408 221 54.2 187 45.8 Blue-collar worker 99 25 25.3 74 74.7 Non-manual occupation 14 2 14.3 12 85.7 Low level 307 176 57.3 131 42.7 Medium-low level 110 45 40.9 65 59.1 Medium-high level 57 19 33.3 38 66.7 High level 47 8 17.0 39 83.0 469 237 50.5 232 49.5 11 21.2 41 78.8 Junior high school and above Previous occupation Depression Peasant Rural Urban 52 Note: The bold data indicated statistically significant results. 155 χ 2 p 21.766 <0.001 1.805 0.179 21.524 <0.001 33.105 <0.001 35.896 <0.001 16.199 <0.001 4.4.4 Functional ability The scores on the ADL Scale ranged from 14 to 47 with a median of 14, which indicated that the participants’ average level of functional ability was high. Similarly, the score ranges of the PSM Scale and IADL Scale were 6-17 and 8-32 with the medians of 6 and 8 respectively, indicating a good physical self-maintenance ability and instrumental competence. Among all the participants, more than two thirds (72.0%) reported a high level of ADL with the score range of 14-16 with those reporting a high level of PSM accounting for 86.2% of the sample, which was higher than those who had a high level of IADL (60.3%). Accordingly, the proportion with a low level of IADL was more than twice than that of PSM (14.0% and 6.5% respectively). Table 4.15 presents the frequency, percentage, score range and median of ADL, PSM and IADL. Table 4.15 The functional ability of the participants Frequency Percentage (n) (%) Activity of daily living Low level 74 14.2 Moderate level 72 13.8 375 72.0 High level Physical self-maintenance Low level 13 6.5 Moderate level 59 11.3 449 86.2 High level Instrumental activity of daily living Low level 73 14.0 Moderate level 134 25.7 High level 314 60.3 Range Median 14 – 47 14 6 – 17 6 8 – 32 8 Among all the listed activities of PSM, taking a bath/shower was the most frequent activity that the participants reported being able to perform with help or totally dependently (n=66, 12.7%) followed by physical ambulation (n=45, 8.7%). On the other hand, the participants reported the least difficulty with feeding with 98.5% (n=513) being able to perform it independently. In IADLs, 156 making a telephone call was the most frequent activity that 30.5% (n=159) of the participants performed with help or dependently, followed by going out by public transportation (n=156, 29.9%) and shopping (n=120, 23.1%). Taking medicine was the instrumental activity that most participants (n=490, 94.0%) could do on their own. The frequency and percentage of each item in the ADL Scale for participants are set out in Table 4.16. The ADL of the participants by different socio-demographic characteristics is presented in Table 4.17. As can be seen, the differences in the older people’s functional ability across the age groups and education levels were significant. Older people with increasing age and lower levels of education were more likely to report lower levels of functional ability (p<0.001). Regarding the influence of occupation on functional ability, the peasants reported more ADL limitations than those who were engaged in other occupations before retirement (p<0.01). Gender, economic level and residential area had no significant relationships with functional ability (p>0.05). 157 Table 4.16 Description of the dependency on activity of daily living List of activities Performs independently n Performs with some/a lot of help Performs dependently % n % n % Physical self-maintenance Physical ambulation 476 91.3 43 8.3 2 0.4 Feeding 513 98.5 7 1.3 1 0.2 Dressing 504 96.7 17 3.3 0 Grooming 504 96.7 17 3.3 0 Taking a bath/shower 455 87.3 60 11.5 6 1.2 Getting to the bathroom on time 507 97.3 13 2.5 1 0.2 Going out by public transportation 365 70.1 134 25.7 22 4.2 Cooking 450 86.4 60 11.5 11 2.1 House keeping 427 82.0 84 16.1 10 1.9 Doing laundry 435 83.5 75 14.4 11 2.1 Taking medicine 490 94.0 30 5.8 1 0.2 Shopping 401 76.9 90 17.3 30 5.8 Handling money 425 81.6 82 15.7 14 2.7 Making a telephone call 363 69.5 105 20.1 54 10.4 Instrumental activity of daily living 158 Table 4.17 The activity of daily living of the participants by different socio-demographic characteristics n Age (years) Gender Education Economic level Residential area Moderate level High level n % n % n % 60 – 69 126 2 1.6 2 1.6 122 96.8 70 – 79 200 11 5.5 25 12.5 164 82.0 ≥80 195 61 31.3 45 23.1 89 45.6 Male 177 20 11.3 26 14.7 131 74.0 Female 344 54 15.7 46 13.4 244 70.9 No formal education 244 53 21.7 56 23.0 135 55.3 Primary school 213 19 8.9 15 7.1 179 84.0 64 2 3.1 1 1.6 61 95.3 Peasant 408 70 17.2 58 14.2 280 68.6 Not peasant 113 4 3.5 14 12.4 95 84.1 Low level 307 52 16.9 48 15.7 207 67.4 Medium-low level 110 13 11.8 14 12.7 83 75.5 Medium-high level 57 5 8.8 4 7.0 48 84.2 High level 47 4 8.5 6 12.8 37 78.7 Rural 469 70 14.9 66 14.1 333 71.0 Urban 52 4 7.7 6 11.5 42 80.8 Junior high school and above Previous occupation Low level χ 2 p 1.232E2 <0.001 1.893 0.388 66.727 <0.001 14.698 0.001 9.637 0.141 2.562 0.278 Note: Previous occupation was dichotomised into “peasant” and “not peasant” in light of the small number of responses in the “non-manual occupation” group. The bold data indicated statistically significant results. 159 4.4.5 Self-rated health More than two fifths of the participants (n=225, 43.2%) rated their health as good (38.8%) or very good (4.4%), and 15.2% (n=79) reported a poor health status (12.5% for poor; 2.7% for very poor) (see Table 4.18). Table 4.18 Reports on self-rated health Self-rated health Frequency (n) Percentage (%) 23 4.4 Good 202 38.8 Neutral 217 41.6 Poor 65 12.5 Very poor 14 2.7 Very good The self-rated health was further divided into three groups as “good”, “neutral” and “poor”. The participants who rated their health as good or very good were categorised into the “good” group, and those who rated their health as poor or very poor were categorised into the “poor” group. As can be seen from Table 4.19, older people with a younger age and a higher level of education were more likely to rate their health as good (p<0.001). Those who were engaged in non-manual occupations before retirement rated their health better than those who were peasants and blue collar workers (p<0.05). Amongst the different economic level groups, older people in the low level group were most likely to report poor self-rated health (p<0.05). There were no significant differences of gender and residential area groups in self-rated health (p>0.05). 160 Table 4.19 The self-rated health of the participants by different socio-demographic characteristics n Age (years) Gender Education Economic level Residential area Neutral Poor n % n % n % 60 – 69 126 80 63.5 43 34.1 3 2.4 70 – 79 200 100 50.0 76 38.0 24 12.0 ≥80 195 45 23.1 98 50.2 52 26.7 Male 177 80 45.2 67 37.9 30 16.9 Female 344 145 42.2 150 43.6 49 14.2 No formal education 244 89 36.5 102 41.8 53 21.7 Primary school 213 90 42.3 100 46.9 23 10.8 64 46 71.9 15 23.4 3 4.7 408 167 40.9 172 42.2 69 16.9 Blue-collar worker 99 47 47.5 43 43.4 9 9.1 Non-manual occupation 14 11 78.6 2 14.3 1 7.1 Low level 307 113 36.8 140 45.6 54 17.6 Medium-low level 110 59 53.6 39 35.5 12 10.9 Medium-high level 57 26 45.6 24 42.1 7 12.3 High level 47 27 57.4 14 29.8 6 12.8 Rural 469 202 43.1 197 42.0 70 14.9 Urban 52 23 44.2 20 38.5 9 17.3 Junior high school and above Previous occupation Good Peasant Note: The bold data indicated statistically significant results. 161 χ 2 p 70.173 <0.001 1.743 0.418 35.548 <0.001 11.403 0.022 14.716 0.023 0.331 0.848 4.5 Loneliness The loneliness scores ranged from 20 to 63 with a median of 45 indicating a moderate level of loneliness among the participants. A total of 15.4% (n=80) of the participants reported a low level of loneliness with the scores on the RULS-V3 ranging 20-34, 58.9% (n=307) reported a moderate level with the score of 35-49, and 25.7% (n=134) reported a moderately high level with the score of 50-63. No participants were identified as having a high level of loneliness (see Table 4.20). Table 4.20 The loneliness level of the participants Loneliness level Frequency (n) Percentage (%) 80 15.4 Moderate 307 58.9 Moderately high 134 25.7 Low The loneliness level of the participants by different socio-demographic characteristics is shown in Table 4.21. There was an age difference in the participants’ levels of loneliness with the “young old” reporting slightly lower levels while the “oldest old” reported higher levels (p<0.05). In addition, the loneliness level varied across the different occupational groups, economic levels and residential areas (p<0.001). Those who were peasants, had a lower economic level and lived in the rural areas reported a higher level of loneliness than those who were not peasants, had a higher economic level and lived in the urban areas. There were no significant differences in loneliness between males and females or across the three education levels (p>0.05). 162 Table 4.21 The loneliness level of the participants by different socio-demographic characteristics n Age (years) Gender Education Economic level Residential area n % Moderate level n % Moderately high level n % 60 – 69 126 15 11.9 84 66.7 27 21.4 70 – 79 200 35 17.5 121 60.5 44 22.0 ≥80 195 30 15.4 102 52.3 63 32.3 Male 177 29 16.4 96 54.2 52 29.4 Female 344 51 14.9 211 61.3 82 23.8 No formal education 244 39 16.0 133 54.5 72 29.5 Primary school 213 30 14.1 129 60.6 54 25.3 64 11 17.2 45 70.3 8 12.5 Peasant 408 45 11.0 249 61.1 114 27.9 Not peasant 113 35 31.0 58 51.3 20 17.7 Low level 307 41 13.4 176 57.3 90 29.3 Medium-low level 110 7 6.4 78 70.9 25 22.7 Medium-high level 57 9 15.8 33 57.9 15 26.3 High level 47 23 48.9 20 42.6 4 8.5 Rural 469 59 12.6 284 60.5 126 26.9 Urban 52 21 40.4 23 44.2 8 15.4 Junior high school and above Previous occupation Low level χ 2 p 9.660 0.047 2.580 0.275 8.461 0.076 27.946 <0.001 53.424 <0.001 28.084 <0.001 Note: Previous occupation was dichotomised into “peasant” and “not peasant” in light of the small number of responses in the “non-manual occupation” group. The bold data indicated statistically significant results. 163 4.6 Social support The scores of overall social support, objective support, subjective support and support utilisation are summarised in Table 4.22. The mean score of overall social support was 30.5, which was lower compared to the norm for Chinese people of 34.6 (Xiao 1994) suggesting a relatively low level of social support of the participants. Among the three aspects of social support, the participants received less objective support with the mean score being only 4.7. Table 4.22 The scores of the Social Support Rate Scale Range Mean SD Overall social support 15 – 51 30.5 6.1 Objective support 0 – 14 4.7 2.2 Subjective support 8 – 32 19.3 4.1 Support utilisation 3 – 12 6.5 1.7 Tables 4.23 and 4.24 set out the reported sources of instrumental and emotional support that the participants received when they were in trouble. Children were identified as the most important source providing financial support and help to solve actual problems (n=497, 95.4%), followed by relatives (n=235, 45.1%) and spouse/partner (n=173, 33.2%). Similarly, children (n=496, 95.2%), relatives (n=303, 58.2%) and spouse/partner (n=178, 34.2%) were the three major sources of emotional support for the participants. It seemed that the participants received support mainly from family members, especially from their children. It is noteworthy that official organizations ranked fourth and sixth in the instrumental and emotional support sources respectively, which suggested that official organizations were an important source of formal objective support for the participants. 164 Table 4.23 Sources of instrumental support that the participants received n Percent of cases (%) Children 497 95.4 Relatives 235 45.1 Spouse/Partner 173 33.2 Official organizations 74 14.2 Other family members 52 10.0 Friends 40 7.7 Work units 21 4.0 Other 7 1.3 No source 4 0.8 Colleagues 2 0.4 Social organizations 1 0.2 Table 4.24 Sources of emotional support that the participants received n Percent of cases (%) Children 496 95.2 Relatives 303 58.2 Spouse/Partner 178 34.2 Other family members 122 23.4 Friends 81 15.5 Official organizations 73 14.0 Other 53 10.2 Colleagues 25 4.8 Work units 17 3.3 No source 6 1.2 Social organizations 5 1.0 Regarding subjective support, nearly half of the participants (n=237, 45.5%) reported having one or two close friends who could help or support them, 29.1% (n=152) reported having three, four and five friends, and 15.2% (n=79) reported having more than six friends. While, about one tenth of the participants (n=53, 10.2%) perceived that they had no friends to help or support them. The majority of the participants (n=486, 93.3%) perceived that they could receive some or a lot of support from children, which made children the primary source of subjective support. Neighbours and other family members were also important sources of subjective support from 165 whom 79.8% (n=416) and 76.4% (n=398) of the participants perceived that they could receive some or a lot of support. Table 4.25 summarises the frequency and percentage of each item of subjective support. Table 4.25 The subjective support from different sources None n Little % Some A lot n % n % n % Neighbours 20 3.9 85 16.3 331 63.5 85 16.3 Colleagues 199 38.2 84 16.1 196 37.6 42 8.1 Spouse/Partner 422 81.0 12 2.3 35 6.7 52 10.0 Parents 470 90.2 23 4.4 19 3.7 9 1.7 Children 15 2.9 20 3.9 156 29.9 330 63.3 Siblings 106 20.3 66 12.7 229 44.0 120 23.0 50 9.6 73 14.0 299 57.4 99 19.0 Other family members With regard to support utilisation, as is shown in Table 4.26, almost half of the participants sometimes or always asked for help (n=281, 53.9%) or confided (n=248, 47.6%) when they were in trouble. However, more than four fifths (n=438, 84.1%) never or rarely attended social activities. Table 4.26 Frequency and percentage of each item in support utilisation Never n Rarely % n Sometimes % Always n % n % Confiding when in trouble 45 8.6 228 43.8 217 41.6 31 6.0 Asking for help when in trouble 48 9.2 192 36.9 242 46.4 39 7.5 368 70.6 70 13.4 60 11.5 23 4.5 Attending social activities In order to compare the overall social support level across the participants with different socio-demographic characteristics, the participants were divided into three groups according to the frequency distribution of overall social support. Those who scored the lowest 27.0% were categorised into the “low level” group and those who scored the highest 27.0% were categorised into the “high level” group (Wiersma & Jurs 1990). The results showed that the differences in social support level were statistically significant across the participants with different socio-demographic characteristics except gender. Among the age groups, the social support level decreased from the “young 166 old” group to the “oldest old” group (p<0.01). Older people with a junior high school degree or above reported a higher level of social support than those with no formal education or a primary school degree only (p<0.001). Those who were peasants, having a lower economic level and living in the rural areas were more likely to report a lower level of social support (p<0.001) (see Table 4.27). 167 Table 4.27 The overall social support level of the participants by different socio-demographic characteristics n Age (years) Gender Education Economic level Residential area Moderate level n % n % High level n % 60 – 69 126 22 17.5 64 50.8 40 31.7 70 – 79 200 45 22.5 104 52.0 51 25.5 ≥80 195 63 32.3 99 50.8 33 16.9 Male 177 43 24.3 87 49.1 47 26.6 Female 344 87 25.3 180 52.3 77 22.4 No formal education 244 61 25.0 142 58.2 41 16.8 Primary school 213 58 27.2 105 49.3 50 23.5 64 11 17.2 20 31.2 33 51.6 Peasant 408 117 28.7 228 55.9 63 15.4 Not peasant 113 13 11.5 39 34.5 61 54.0 Low level 307 80 26.1 184 59.9 43 14.0 Medium-low level 110 31 28.2 51 46.4 28 25.4 Medium-high level 57 13 22.8 20 35.1 24 42.1 High level 47 6 12.8 12 25.5 29 61.7 Rural 469 125 26.7 250 53.3 94 20.0 Urban 52 5 9.6 17 32.7 30 57.7 Junior high school and above Previous occupation Low level χ 2 p 15.041 0.005 1.130 0.568 35.195 <0.001 73.572 <0.001 66.407 <0.001 37.205 <0.001 Note: Previous occupation was dichotomised into “peasant” and “not peasant” in light of the small number of responses in the “non-manual occupation” group. The bold data indicated statistically significant results. 168 4.7 Physical activity The adequacy of physical activity and frequency of physical activity levels over the last four weeks prior to data collection are shown in Tables 4.28 and 4.29 respectively. Only 16.7% (n=87) of the participants reported taking the recommended activity levels of a minimum of 30 minutes of moderate/strenuous exercise on at least five days a week (Haskell et al. 2007). Less than one tenth of the participants (8.2%) never walked outside the home for more than half an hour per week and 30.7% spent at least five days engaged in sitting activities. Most of the participants reported performing light exercises or light housework at least one day per week (75.4% and 90.8% respectively). Table 4.28 Reports on adequacy of physical activity Physical activity Frequency (n) Adequate Inadequate Percentage (%) 87 16.7 434 83.3 Table 4.29 Frequency of the participants’ physical activity Activities Never 1-2 days 3-4 days 5-7 days n % n % n % n Sitting activities 36 6.9 168 32.2 138 26.5 Walking outside 43 8.2 202 38.8 146 Light exercise 109 20.9 219 42.0 Moderate exercise 237 45.5 149 Strenuous exercise 390 74.8 41 215 Light housework Heavy housework Don’t know/ Not sure % n % 160 30.7 19 3.7 28.0 103 9.8 27 5.2 98 18.8 76 14.6 19 3.7 28.6 64 12.3 44 8.4 27 5.2 67 12.9 24 4.6 23 4.4 17 3.3 7.9 202 38.8 88 16.9 183 35.1 7 1.3 41.2 166 31.9 36 6.9 66 12.7 38 7.3 Table 4.30 presents the adequacy of physical activity of the participants across the different socio-demographic characteristics. Age, gender and education level were statistically associated with physical activity, with being younger (p<0.001), male (p<0.05) and having a higher level of education 169 (p<0.001) being more likely to report adequate physical activity. There were no statistically significant differences in the adequacy of physical activity across the participants of different previous occupations, economic levels and from different residential areas (p>0.05). 170 Table 4.30 The adequacy of physical activity of the participants by different socio-demographic characteristics n Age (years) Gender Education Economic level Residential area n Inadequate % n % 60 – 69 126 48 38.1 78 61.9 70 – 79 200 29 14.5 171 85.5 ≥80 195 10 5.1 185 94.9 Male 177 39 22.0 138 78.0 Female 344 48 14.0 296 86.0 No formal education 244 13 5.3 231 94.7 Primary school 213 48 22.5 165 77.5 64 26 40.6 38 59.4 408 60 14.7 348 85.3 Blue-collar worker 99 23 23.2 76 76.8 Non-manual occupation 14 4 28.6 10 71.4 Low level 307 48 15.6 259 84.4 Medium-low level 110 16 14.5 94 85.5 Medium-high level 57 11 19.3 46 80.7 High level 47 12 25.5 35 74.5 Rural 469 79 16.8 390 83.2 Urban 52 8 15.4 44 84.6 Junior high school and above Previous occupation Adequate Peasant Note: The bold data indicated statistically significant results. 171 χ 2 p 60.932 <0.001 5.486 0.019 54.235 <0.001 5.622 0.060 3.530 0.317 0.072 0.789 4.8 Health services All the participants sought health services when they were sick. Of these, 520 (99.8%) went to medical institutions, and one was visited at home by the community doctor because of his mobility problem. Among those who went to medical institutions, nearly half (n=257, 49.4%) visited the community hospital most often. A total of 27.9% (n=145) visited the county hospital and 21.5% (n=112) visited the township hospital. Few participants mostly attended tertiary hospital (n=2, 0.4%) or other type of hospital such as private clinic (n=4, 0.8%). Figure 4.1 sets out the type of medical institution that the participants visited most often. 27.9% 49.4% 21.5% 0.4% 0.8% Figure 4.1 The type of medical institution that the participants visited most often 172 On the whole, the majority of the participants were satisfied or very satisfied with their health services (n=333, 63.9%) with only 1.5% (n=8) expressing dissatisfaction. Just over one third (n=180, 34.6%) rated their health services as neutral (Table 4.31). Table 4.31 The participants’ satisfaction with health services Satisfaction with health services Frequency (n) Percentage (%) 11 2.1 Satisfied 322 61.8 Neutral 180 34.6 Dissatisfied 8 1.5 Very dissatisfied 0 0 Very satisfied In light of the response distribution, satisfaction with health services was divided into two groups to compare the differences relating to the different socio-demographic variables. The participants who were satisfied or very satisfied with their health services were categorised into the “satisfied” group, and the remainder were categorised into the “dissatisfied” group. There were significant differences across the occupational groups and economic level groups in the satisfaction with health services with older people who were engaged in non-manual occupations before retirement (p<0.05) and had a high economic level (p<0.01) being more satisfied with their health services. Age, gender, education level and residential area had no significant relationships with satisfaction with health services (p>0.05) (see Table 4.32). 173 Table 4.32 The health services satisfaction of the participants by different socio-demographic characteristics n Age (years) Gender Education Economic level Residential area Satisfied n % n % 60 – 69 126 53 42.1 73 57.9 70 – 79 200 71 35.5 129 64.5 ≥80 195 64 32.8 131 67.2 Male 177 65 36.7 112 63.3 Female 344 123 35.8 221 64.2 No formal education 244 79 32.4 165 67.6 Primary school 213 89 41.8 124 58.2 64 20 31.2 44 68.8 408 155 38.0 253 62.0 Blue-collar worker 99 32 32.3 67 67.7 Non-manual occupation 14 1 7.1 13 92.9 Low level 307 126 41.0 181 59.0 Medium-low level 110 32 29.1 78 70.9 Medium-high level 57 22 38.6 35 61.4 High level 47 8 17.0 39 83.0 Rural 469 170 36.2 299 63.8 Urban 52 18 34.6 34 65.4 Junior high school and above Previous occupation Dissatisfied Peasant Note: The bold data indicated statistically significant results. 174 χ 2 p 2.883 0.237 0.047 0.828 5.103 0.078 6.334 0.042 13.166 0.004 0.054 0.816 4.9 Housing Almost all the participants (n=516, 99.0%) possessed and lived in their own houses. Most of them were satisfied or very satisfied with the dwelling size (n=378, 72.5%), distance from their children or relatives (n=372, 71.4%), kitchen (n=354, 68.0%) and bathroom (n=345, 66.2%). However, satisfaction with convenience of public transport was relatively low with less than half of the participants (n=251, 48.2%) being satisfied or very satisfied. On the whole, more than two thirds of the participants (n=364, 69.8%) were satisfied with their dwelling conditions. The frequency and percentage of dwelling satisfaction are set out in Table 4.33. The participants were divided into three groups according to the frequency of satisfaction with overall dwelling conditions with “satisfied” and “very satisfied” groups being combined into one group named “satisfied”, and “dissatisfied” and “very dissatisfied” groups being combined into one group named “dissatisfied”. As can be seen from Table 4.34, there were no significant differences in the satisfaction with overall dwelling conditions across the participants in the different age and education level groups (p>0.05), but the differences across those groups with different genders, occupations, economic levels and residential areas were statistically significant. Women tended to be more satisfied with their dwelling conditions than men (p<0.01). Older people who were peasants, having a low economic level and living in the rural areas were more likely to be dissatisfied with their dwelling conditions (p<0.01). 175 Table 4.33 Frequency and percentage of dwelling satisfaction Very satisfied Satisfied n % n Dwelling size 22 4.2 356 Bathroom 21 4.0 Kitchen 18 Distance from children or relatives Neutral % Dissatisfied Very dissatisfied n % n % n % 68.3 116 22.3 24 4.6 3 0.6 324 62.2 126 24.2 47 9.0 3 0.6 3.5 336 64.5 134 25.7 32 6.1 1 0.2 21 4.0 351 67.4 101 19.4 47 9.0 1 0.2 Convenience of public transport 15 2.9 236 45.3 148 28.4 119 22.8 3 0.6 Dwelling conditions overall 20 3.8 344 66.0 121 23.2 32 6.2 4 0.8 176 Table 4.34 Satisfaction with overall dwelling conditions of the participants by different socio-demographic characteristics n Age (years) Gender Education Economic level Residential area Neutral Satisfied n % n % n % 60 – 69 126 7 5.6 32 25.4 87 69.0 70 – 79 200 14 7.0 42 21.0 144 72.0 ≥80 195 15 7.7 47 24.1 133 68.2 Male 177 21 11.9 41 23.1 115 65.0 Female 344 15 4.4 80 23.2 249 72.4 No formal education 244 18 7.4 54 22.1 172 70.5 Primary school 213 16 7.5 55 25.8 142 66.7 64 2 3.1 12 18.8 50 78.1 Peasant 408 34 8.4 85 20.8 289 70.8 Not peasant 113 2 1.8 36 31.8 75 66.4 Low level 307 28 9.2 75 24.4 204 66.4 Medium-low level 110 6 5.5 16 14.5 88 80.0 Medium-high level 57 1 1.8 22 38.6 34 59.6 High level 47 1 2.1 8 17.0 38 80.9 Rural 469 35 7.5 98 20.9 336 71.6 Urban 52 1 2.0 23 44.2 28 53.8 Junior high school and above Previous occupation Dissatisfied χ 2 p 1.476 0.831 10.443 0.005 3.762 0.439 10.400 0.006 20.388 0.002 15.176 0.001 Note: Previous occupation was dichotomised into “peasant” and “not peasant” in light of the small number of responses in the “non-manual occupation” group. The bold data indicated statistically significant results. 177 4.10 Quality of life Less than half of the participants (n=236, 45.3%) perceived that they had a very good or good overall QoL with 9.2% (n=48) rating their QoL as poor or very poor. The participants’ self-perceived overall QoL and distribution of each item in the OPQOL are set out in Tables 4.35 and 4.36 respectively. Most participants agreed or strongly agreed that having children around was important (n=444, 85.2%), their family, friends or neighbours would help them if needed (n=440, 84.5%), their neighbourhood were friendly (n=438, 84.1%), they were healthy enough to get out and about (n=424, 81.4%), they had someone who gave them love and affection (n=422, 81.0%) and they felt safe where they lived (n=422, 81.0%). The participants rated highly on these aspects of their QoL. On the other hand, more than three quarters of the participants reported that they would have liked more companionship or contact with other people (n=404, 77.5%) and they would have liked more people to enjoy life with (n=393, 75.4%). Additionally, almost three quarters reported that they did not have enough money to pay for household repairs or help needed in the house (n=383, 73.5%) and that the cost of things restricted their life (n=371, 71.2%), more than half reported that they did not have enough money to afford health-care expenses (n=311, 59.7%) and they could not afford to do things they would enjoy (n=293, 56.2%). The participants appeared least satisfied with these aspects of their QoL. Table 4.35 The participants’ self-perceived overall quality of life Self-perceived overall quality of life Frequency (n) Percentage (%) 11 2.1 Good 225 43.2 Neutral 237 45.5 46 8.8 2 0.4 Very good Poor Very poor 178 Table 4.36 Frequency and percentage for each item in the Older People’s Quality of Life Questionnaire Strongly agree Agree % Strongly disagree n % 36 6.9 3 0.6 26.7 41 7.9 3 0.6 148 28.4 60 11.5 1 0.2 6.5 214 41.1 258 49.5 13 2.5 192 36.9 178 34.2 132 25.3 9 1.7 2.7 152 29.2 195 37.4 149 28.6 11 2.1 11 2.1 85 16.3 178 34.2 232 44.5 15 2.9 I am healthy enough to get out and about. 62 11.9 362 69.5 63 12.1 32 6.1 2 0.4 My family, friends or neighbours would help me if needed. 42 8.1 398 76.4 72 13.8 7 1.3 2 0.4 I would like more companionship of contact with other people.* 17 3.3 387 74.2 98 18.8 17 3.3 2 0.4 I have someone who gives me love and affection. 37 7.1 385 73.9 88 16.9 10 1.9 1 0.2 I’d like more people to enjoy life with.* 24 4.6 369 70.8 90 17.3 33 6.3 5 1.0 129 24.8 315 60.4 67 12.9 8 1.5 2 0.4 I have social or leisure activities/hobbies that I enjoy doing. 8 1.6 210 40.3 194 37.2 95 18.2 14 2.7 I try to stay involved with things. 3 0.6 250 48.0 176 33.8 83 15.9 9 1.7 I do paid or unpaid work or activities that give me a role in life. 5 1.0 176 33.8 191 36.6 135 25.9 14 2.7 I am healthy enough to have my independence. 38 7.3 289 55.5 135 25.9 53 10.2 6 1.1 I can please myself what I do. 23 4.4 320 61.4 102 19.6 72 13.8 4 0.8 The cost of things compared to my pension/income restricts my life.* 67 12.9 304 58.3 106 20.3 42 8.1 2 0.4 I have a lot of control over the important things in my life. 19 3.7 330 63.3 131 25.1 37 7.1 4 0.8 Items n % n I enjoy my life overall. 22 4.2 307 58.9 153 29.4 I am happy much of the time. 19 3.6 319 61.2 139 I look forward to things. 11 2.1 301 57.8 2 0.4 34 I have a lot of physical energy. 10 1.9 Pain affects my well-being.* 14 My health restricts me looking after myself or my home.* Life gets me down.* I have my children around which is important. 179 % Neither agree nor disagree n % Disagree n Table 4.36 (Continued) Strongly agree Agree Items n I have responsibilities to others that restrict my social or leisure % 0 Neither agree nor disagree n % Disagree n % Strongly disagree n % n % 65 12.5 244 46.8 187 35.9 25 4.8 activities.* I feel safe where I live. 23 4.4 399 76.6 67 12.9 29 5.5 3 0.6 The local shops, services and facilities are good overall. 18 3.4 302 58.0 162 31.1 36 6.9 3 0.6 I get pleasure from my home. 26 5.0 354 67.9 116 22.3 23 4.4 2 0.4 I find my neighbourhood friendly. 19 3.6 419 80.4 76 14.6 6 1.2 1 0.2 I take life as it comes and make the best of things. 18 3.5 393 75.3 91 17.5 15 2.9 4 0.8 I feel lucky compared to most people. 18 3.5 306 58.7 146 28.0 47 9.0 4 0.8 I tend to look on the bright side. 8 1.5 385 73.9 110 21.1 18 3.5 0 If my health limits social/leisure activities, then I will compensate and 4 0.8 210 40.3 225 43.1 79 15.2 3 0.6 I have enough money to pay for household bills. 7 1.3 249 47.8 123 23.6 131 25.1 11 2.1 I have enough money to pay for household repairs or help needed in 1 0.2 37 7.1 100 19.2 353 67.7 30 5.8 I have enough money to afford my health-care expenses. 1 0.2 83 15.9 126 24.2 278 53.4 33 6.3 I can afford to buy what I want to. 4 0.8 246 47.2 149 28.6 111 21.3 11 2.1 I cannot afford to do things I would enjoy.* 20 3.8 273 52.4 141 27.1 81 15.5 6 1.2 Religion, belief or philosophy is important to my quality of life. 25 4.8 123 23.6 255 49.0 95 18.2 23 4.4 Cultural/religious events/festivals are important to my quality of life. 25 4.8 123 23.6 258 49.5 91 17.5 24 4.6 find something else I can do. the house. * The item was coded reversal. 180 4.11 Additional information from the participants Sixteen participants answered the open question and provided additional information regarding their opinions or experiences of living alone. Of these, 13 expressed their hopes that their pensions could be increased. An older woman said: “I have a very low income. The money is not enough to live on. I hope the pension can be increased by a large margin.” Some participants mentioned the context of rising prices alongside the hopes for increasing pensions. For example, one older man reported: “I have a hard life. The prices are increasing these years, which puts a greater strain on my life. I hope the Government can control the soaring prices and increase older people’s pensions.” Likewise, one woman reported the high costs of living together with the high health care expenses: “I really hope my income can be increased. The price instability and the high health care expenses lead to a lower standard of living. I am afraid I will not have enough money to use health care services if I become seriously ill.” Two participants expressed that they felt lonely and needed to be taken care of: “I want someone to take care of me. I feel lonely. ” “I hope the Government can take more care of older people who live alone, and help us to have a good later life.” However, one participant described her positive experience of living alone: 181 “I enjoy living alone which brings freedom and makes me happy.” 4.12 Chapter summary This chapter presents the psychometric properties of the instruments, especially the OPQOL, used in the main study, and the participants’ status of health, life circumstances and QoL. It also assesses whether the participants’ health status and life circumstances differed across the different socio-demographic characteristics. The prevalence of chronic disease of older people living alone in Chongming was 44.5%. Among the reported diseases, hypertension was the most common disease that people suffered from. Regarding mental health, most of the participants were cognitive intact, and nearly half of the participants reported having depression. The average level of functional ability was high with more participants reporting a lower level of IADL than PSM. Taking a bath/shower and making a telephone call were the most frequent activities of PSM and IADL with which the participants had difficulty. Approximately half of the participants rated their health as good. The overall level of loneliness among older people living alone in Chongming was moderate with a majority of the participants reporting moderate to moderately high levels. In addition, their overall social support level was low. Children, relatives and spouse/partner were the major sources of objective support, and children, neighbours and other family members were the major sources of subjective support. The utilisation of social support was relatively low with few people sometimes or always attending social activities. 182 The participants reported a low level of physical activity with only 16.7% engaging in adequate physical activity. All the participants sought health services when they were sick, and half of them went to the community hospital. Most of the participants reported being satisfied with their health services. Almost all the participants lived in their own houses, and majority of them were satisfied with their overall dwelling conditions. However, their satisfaction with the convenience of public transport was low. Less than half of the participants perceived their QoL as good. They were most satisfied with “having children around” but least satisfied with “companionship or contact with other people”. They also gave special attention to and expressed less satisfaction with their financial circumstances. The bivariate analyses showed that the participants’ physical and mental health, functional ability, self-rated health, loneliness, social support, physical activity, health services satisfaction and satisfaction with overall dwelling conditions differed across the different socio-demographic characteristics. Next chapter will report the related factors of QoL to build a QoL model of older people living alone in Chongming. 183 CHAPTER 5 FINDINGS: FACTORS RELATED TO QUALITY OF LIFE OF OLDER PEOPLE LIVING ALONE IN CHONGMING AND THE EXPLANATORY QUALITY OF LIFE MODEL 5.1 Chapter introduction This chapter addresses the second and third research objectives which are to explore the significant factors related to QoL of older people living alone in Chongming and to develop an explanatory model of QoL. It is presented in three sections. The first section presents the results of the Mann-Whitney U and Kruskal-Wallis tests examining the relationships between reported QoL and socio-demographic, health and life circumstances variables. The second section presents the results of the multi-way ANOVA which explores the predictors of QoL. The third section presents the explanatory QoL model. 5.2 The relationships between reported quality of life and socio-demographic, health and life circumstances variables 5.2.1 The relationships between reported quality of life and socio-demographic variables Amongst the socio-demographic variables, age, education level, previous occupation, economic level and residential area had significant relationships with QoL. There were no significant differences across the participants regarding gender or marital status (p>0.05). The participants in the “oldest old” group reported the lowest QoL, while those in the “young old” group reported the highest QoL (p<0.001). In addition, the QoL differed between the participants living in different areas with those living in the urban areas reporting a higher QoL (p<0.01). 184 Education level, previous occupation and economic level reflected socio-economic status. The participants with a higher level of education (p<0.001) or a higher economic level (p<0.001) were more likely to report a higher QoL. Additionally, the mean rank of the QoL of the participants differed across the previous occupation groups. It was higher in those who were engaged in non-manual occupations before retirement than blue-collar workers and peasants. For the latter two occupations, the blue-collar workers reported a higher mean rank than the peasants (p<0.001). 5.2.2 The relationships between reported quality of life and health status, loneliness, social support, physical activity, health services satisfaction and satisfaction with overall dwelling conditions The presence of chronic and acute diseases, the number of chronic diseases, cognitive function, depression, functional ability and self-rated health were variables reflecting the participants’ health status. All these variables had significant relationships with QoL except the number of chronic diseases. The participants who reported no chronic diseases (p<0.001), acute diseases (p<0.001) or depression (p<0.001), had intact cognitive function (p<0.01) and reported better self-rated health (p<0.001) were more likely to report a higher QoL. ADL was used as the indicator of functional ability. The participants who reported a high level of functional ability had the highest mean rank of QoL, while those reporting a low level had the lowest mean rank (p<0.001). There were statistically significant differences in QoL across the participants with different levels of loneliness. The mean rank of QoL decreased with the increase of loneliness severity (p<0.001) with the participants having a moderately high level of loneliness reporting the lowest QoL. The QoL of the participants with different levels of social support, using overall social support as the indicator, were significantly different with those reporting a higher level of social support being more likely to report a higher QoL (p<0.001). 185 Physical activity was also significantly related to QoL with the participants engaging in adequate physical activity reporting a higher QoL than those whose activity levels were not adequate (p<0.001). Additionally, there were significant relationships between QoL and health services satisfaction and satisfaction with overall dwelling conditions. Older people who expressed satisfaction with their health services reported a higher QoL than those who expressed dissatisfaction (p<0.001). Those who were satisfied with their overall dwelling conditions reported the highest QoL, while those who were not satisfied reported the lowest QoL (p<0.001). Table 5.1 sets out the results of the relationships between QoL and socio-demographic variables, the presence of chronic diseases, the number of chronic diseases, the presence of acute diseases, cognitive function, depression, functional ability, self-rated health, loneliness, social support, physical activity, health services satisfaction and satisfaction with overall dwelling conditions. Table 5.1 Mann-Whitney U test or Kruskal-Wallis test of variables on rank of quality of life Variable Groups n Mean Rank Z or H p Age (years) 60 – 69 126 298.58 H= 39.789 <0.001 70 – 79 200 281.97 ≥80 195 230.90 Male 177 261.33 Z= -0.036 0.972 Female 344 260.83 Widowed 501 261.02 H= 1.547 0.672 Divorced 10 259.35 Separated 5 320.70 Never married 5 202.40 No formal education 244 230.34 H= 23.913 <0.001 Primary school 213 277.08 64 324.38 408 242.20 H= 34.897 <0.001 Blue-collar worker 99 316.33 Non-manual occupation 14 417.50 Gender Marital status Education Junior high school and above Previous occupation Peasant 186 Table 5.1 (Continued) n Mean Rank Z or H p Low level 307 220.41 H= 63.883 <0.001 Medium-low level 110 297.65 Medium-high level 57 312.59 High level 47 377.79 Rural 469 254.22 Z= -3.088 0.002 Urban 52 322.14 Z= -8.138 <0.001 H= 2.823 0.244 Z= -3.696 <0.001 Z= -3.449 0.001 Z= -14.538 <0.001 H= 114.851 <0.001 H= 195.263 <0.001 H= 111.731 <0.001 H= 93.385 <0.001 Z= -4.101 <0.001 Z= -8.428 <0.001 H= 158.644 <0.001 Variable Groups Economic level Residential area Presence of chronic diseases Yes 232 201.12 No 289 292.07 Number of chronic diseases 1 119 118.03 2 74 122.41 ≥3 39 100.62 Presence of acute diseases Yes 25 152.48 No 496 266.47 Cognitive function Mild impairment 67 201.81 Intact function 454 269.73 Depression Yes 248 160.45 No 273 352.34 Low level 74 120.59 Moderate level 72 181.84 High level 375 303.91 Poor 79 92.57 Neutral 217 226.50 Good 225 353.41 Moderately high level 134 157.90 Moderate level 307 276.39 Low level 80 374.61 Low level 130 177.14 Moderate level 267 256.26 High level 124 359.13 Inadequate 434 248.90 87 321.38 Functional ability Self-rated health Loneliness Social support Physical activity Adequate Health services satisfaction Dissatisfied 188 187.06 Satisfied 333 302.74 Satisfaction with overall dwelling conditions Dissatisfied 36 98.90 Neutral 121 146.64 Satisfied 364 315.05 Note: The bold data indicated statistically significant results. Mann-Whitney U test for 2 groups; Kruskal-Wallis test for 3 or more groups 187 5.2.3 The predictors of quality of life The following 16 independent variables which had statistically significant relationships with QoL in the bivariate analyses were entered into the multi-way ANOVA model in turn to identify the combination of variables that had predictive impact upon QoL: age, education level, previous occupation, economic level, residential area, self-rated health, the presence of chronic diseases, the presence of acute diseases, cognitive function, depression, functional ability, physical activity, loneliness, social support, health services satisfaction and satisfaction with overall dwelling conditions. The results of the multi-way ANOVA on the rank of QoL are presented in Tables 5.2 and 5.3. Satisfaction with overall dwelling conditions, self-rated health, functional ability, depression, economic level, social support, loneliness, previous occupation and health services satisfaction were significant predictors. Together they accounted for 68.8% of the variance in QoL. In addition, one interaction term remained in the model, namely, depression*previous occupation. Table 5.2 Multi-way ANOVA on rank of quality of life 2 Source of variation F ratio p Partial η Satisfaction with overall dwelling conditions 36.30 <0.001 0.127 Self-rated health 21.83 <0.001 0.080 Functional ability 18.24 <0.001 0.068 Economic level 9.53 <0.001 0.054 Social support 8.61 <0.001 0.033 Loneliness 3.49 0.031 0.014 Health services satisfaction 5.49 0.020 0.011 31.50 <0.001 0.059 3.23 0.041 0.013 12.14 <0.001 0.046 Depression Previous occupation Depression*previous occupation 2 2 R =0.699, adjusted R =0.688 188 Table 5.3 Predictors’ estimated marginal mean and 95% CI of rank of quality of life n Estimated marginal mean 95% CI 36 172.42 135.48 – 209.35 Neutral 121 168.30 140.98 – 195.62 Satisfied 364 251.07 225.40 – 276.75 79 148.51 118.01 – 179.01 Neutral 217 201.01 173.30 – 228.72 Good 225 242.27 213.37 – 271.18 Low level 74 166.35 134.47 – 198.24 Moderate level 72 189.05 158.24 – 219.85 375 236.39 211.29 – 261.49 Low level 307 157.56 128.52 – 186.60 Medium-low level 110 192.18 160.89 – 223.48 Medium-high level 57 218.74 186.54 – 250.95 High level 47 220.56 187.58 – 253.54 Low level 130 172.16 143.59 – 200.73 Moderate level 267 197.14 169.84 – 224.43 High level 124 222.49 193.93 – 251.06 Moderately high level 134 178.94 151.15 – 206.73 Moderate level 307 196.51 169.73 – 223.29 80 216.34 184.52 – 248.16 Dissatisfied 188 186.90 159.50 – 214.29 Satisfied 333 207.63 181.32 – 233.94 Satisfaction with overall dwelling conditions Dissatisfied Self-rated health Poor Functional ability High level Economic level Social support Loneliness Low level Health services satisfaction Satisfaction with overall dwelling conditions had the strongest impact upon QoL explaining 12.7% of the total variance (partial η2=0.127). The participants who were satisfied with their dwelling conditions overall reported a higher QoL (mean rank=251.07) than those who were neither satisfied nor dissatisfied (mean rank=168.30) and dissatisfied (mean rank=172.42) with their dwelling conditions (F(2, 501)=36.30, p<0.001). However, there was no significant 189 difference between the latter two groups regarding QoL (95% CI 3 : 140.98-195.62 vs. 95% CI: 135.48-209.35). Self-rated health and functional ability accounted for 8.0% and 6.8% of the variance in QoL respectively. The participants’ QoL increased with the increase of self-rated health and functional ability. Those who rated their health as good reported a higher QoL than those who rated their health as neutral or poor (mean rank=242.27, 201.01 and 148.51; F(2, 501)=21.83, p<0.001), and those who reported a high level of functional ability reported a higher QoL than those who reported a moderate and a low level of functional ability (mean rank=236.39, 189.05 and 166.35; F(2, 501)=18.24, p<0.001). Depression and previous occupation both had an impact upon QoL, accounting for 5.9% and 1.3% of the variance respectively. Furthermore, there was a significant interaction between these two factors on QoL. The interaction effect explained 4.6% of the total variance. Generally, the participants without depression reported a higher QoL than those who had depression. However, the effect of depression upon QoL varied across the different occupational groups (Table 5.4). Among those having no depression, the peasants reported a lower QoL than the blue-collar workers and the non-manual workers, and the non-manual workers reported the highest QoL (mean rank: peasants=246.11, blue-collar workers=263.76, non-manual workers=280.31). However, among those having depression, the peasants had a significantly higher QoL than the other two occupational groups (mean rank: peasants=183.55, blue-collar workers=98.92; non-manual workers=110.92). The difference between blue-collar workers (95% CI: 63.31-134.53) and non-manual workers (95% CI: 7.91-229.75) regarding QoL was not significant. The results indicated that the effect of depression was far more pronounced in blue-collar workers and non-manual workers than in peasants. Figure 5.1 presents the effects of depression and occupation upon the QoL. 3 CI: Confidence Interval 190 Economic level accounted for 5.4% of the variance in QoL. The participants with a low economic level had the lowest QoL followed by those with a medium-low economic level (mean rank=157.56, 192.18; F(3, 501)=9.53, p<0.001). Those with a medium-high and a high economic level had the highest QoL (mean rank=218.75, 220.56), but there was no statistically significant difference between these two groups (medium-high level: mean rank=218.75, 95% CI: 186.54-250.95; high level: mean rank=220.56, 95% CI: 187.58-253.54). Additionally, social support (partial η2=0.033), loneliness (partial η2=0.014) and health services satisfaction (partial η2=0.011) had some effect upon QoL. They explained about 1% of the total variance respectively. The participants who reported a higher level of social support, a lower level of loneliness and were satisfied with their health services reported a higher QoL. Table 5.4 Estimated marginal mean and 95% CI of rank of quality of life for depression*previous occupation Previous occupation Depression No Yes Total Total Peasant Blue-collar worker Non-manual occupation (n=408) (n=99) (n=14) 246.11 263.76 280.31 263.40 (224.08, 268.14) (239.35, 288.17) (228.53, 332.10) (240.31, 286.48) 183.55 98.92 110.92 131.13 (163.66, 203.45) (63.31, 134.53) (7.91, 229.75) (88.35, 173.91) 214.83 181.34 195.62 (196.35, 233.32) (158.58, 204.10) (129.96, 261.27) 191 Figure 5.1 The effects of depression and occupation upon the quality of life 5.3 An explanatory model of the quality of life of older people living alone in Chongming The bivariate analyses showed that QoL was significantly related to satisfaction with overall dwelling conditions, self-rated health, functional ability, depression, economic level, social support, loneliness, previous occupation, health services satisfaction, age, education level, the presence of chronic diseases, the presence of acute diseases, physical activity, cognitive function and residential area (Figure 5.2 sets out the findings). Further the multivariate analysis showed that satisfaction with overall dwelling conditions, self-rated health, functional ability, depression, economic level, social support, loneliness, previous occupation and health services satisfaction were predictors of QoL explaining 68.8% of the variance. In addition, there was an interaction effect between depression and previous occupation upon the QoL (Figure 5.3 sets out the findings). The summary of factors related to QoL is presented in Figure 5.4. In light of the findings, an explanatory model of the QoL of older people living alone in Chongming was developed (Figure 5.5). In this model, nine predictors are 192 around the core concept of QoL as the key factors influencing QoL. The sector area indicates the extent of the effect to which each factor contributes . Among these factors, satisfaction with dwelling conditions has the strongest impact upon QoL, followed by self-rated health, functional ability, depression and economic level. Social support, loneliness, previous occupation and health services satisfaction have significant but small effects upon QoL. In addition, there is an interaction effect between depression and previous occupation upon QoL, represented by a double arrow in Figure 5.5. Furthermore, the nine key factors are illustrated by different shadings indicating different categories. Self-rated health, functional ability and depression are health-related factors. Economic level and previous occupations are socio-economic factors. Satisfaction with dwelling conditions, social support, loneliness and health services satisfaction are regarded as environmental factors. Seven factors, i.e. age, education level, residential area, the presence of chronic diseases, the presence of acute diseases, cognitive function and physical activity, are at the outer layer surrounding QoL. These factors do not directly influence QoL but have relationships with the nine key factors. Age and education level are related to occupation, economic level, depression, functional ability, self-rated health, loneliness and social support. Residential area is related to occupation, economic level, depression, loneliness, social support and satisfaction with dwelling conditions. Relationships also exist between the presence of chronic diseases, the presence of acute diseases, cognitive function, physical activity and the three health-related predictors. Therefore, the effects of these seven factors upon QoL should also be taken into account. 193 Depression Economic level Social support Loneliness Functional ability Self-rated health Satisfaction with overall dwelling conditions Occupation Health services Quality of life satisfaction Residential area Age Cognitive function Physical activity Education Presence of acute Presence of diseases chronic diseases Figure 5.2 The related factors of quality of life in the bivariate analyses 194 Key p<0.001 p<0.01 Depression Functional ability Occupation Self-rated health Satisfaction with overall Quality of life dwelling conditions Economic level Health services Social support satisfaction Loneliness Figure 5.3 The related factors of quality of life in the multivariate analysis 195 Age Satisfaction with overall dwelling conditions Self-rated health Functional ability Education Depression Presence of chronic diseases Occupation Presence of acute diseases Quality of life Physical activity Economic level Cognitive function Health services Residential area Loneliness Social support satisfaction Figure 5.4 Summary of the findings of quality of life of older people living alone 196 Residential area Satisfaction with dwelling conditions Quality of life Key Health-related predictors of QoL Socio-demographic predictors of QoL Environmental predictors of QoL Variables having a relationship with QoL but not predictors Interaction Figure 5.5 An explanatory model of the quality of life of older people living alone 197 5.4 Chapter summary This chapter sets out the significant factors related to the QoL of older people living alone in Chongming to answer the questions Q2.1 and Q2.2 regarding the relationships between reported QoL and socio-demographic variables, health status, loneliness, social support, physical activity, health services satisfaction and satisfaction with overall dwelling conditions, and the predictors of QoL. An explanatory model of the QoL of older people living alone was proposed and elucidated at the end of this chapter. 198 CHAPTER 6 DISCUSSION 6.1 Chapter introduction With the dramatic population ageing and changing living arrangements, the number of older people living alone is increasing in China. Older people living alone are a special group requiring attention, especially relating to their QoL which is of pivotal concern for their health and social well-being. However, research focusing upon older people living alone in Mainland China is limited. The literature review highlighted the need to carry out such work to fill the research gap. Therefore, this study aimed to explore the health status, life circumstances and QoL of older people living alone in Chongming, Shanghai, to explore the significant factors related to their QoL, and to develop an explanatory QoL model. In order to fulfil the research objectives, a correlational survey using a face-to-face questionnaire interview with a stratified random cluster sample of 521 older people who were 60 years old and above and lived alone was conducted. This chapter presents a detailed discussion of the health status, life circumstances and QoL of older people living alone in Chongming and the factors related to their QoL. This chapter also discusses the psychometric properties of the Chinese OPQOL for its utility as an instrument to assess Chinese older people’s QoL. 199 6.2 Psychometric properties of the Chinese OPQOL A review of the measures of QoL of older people in China (Chapter 2) indicated the necessity to choose an appropriate measurement tool. The OPQOL (Bowling 2009) was selected for this study because it is a multi-dimensional scale based on the perspectives of older people themselves and has been used in older population surveillance and outcome assessment of health and social interventions (Bowling 2009, Bowling & Stenner 2011). Despite the satisfactory reliability and validity in three samples of older people in Britain, its psychometric properties had not been tested among Chinese older people. In addition, developing a culturally adaptive scale is important to enable cross-cultural studies and comparison across time and countries with the trend towards globalisation (Bonomi et al. 2000). The results showed that the Chinese OPQOL had an acceptable validity and reliability to be a useful instrument to measure the QoL of older people living alone in China. 6.2.1 Validity of the Chinese OPQOL Validity is the degree to which an instrument measures what it is supposed to measure (Polit & Beck 2012). The validity of the Chinese OPQOL was reflected by assessing construct validity, convergent validity and discriminant validity. Eight factors accounting for 63.77% of the variance were extracted by factor analysis: leisure and social activities (items 5, 17, 25, 31, 32, 33 and 34), psychological well-being (items 1, 2, 3, 4, 13, 20, 23 and 24), health and independence (items 6, 7, 8, 14 and 15), financial circumstances (items 16, 200 26, 27, 28 and 30), social relationships (items 9, 10, 11 and 12), home and neighbourhood (items 19, 21, 22 and 29), culture/religion (items 35 and 36) and safety (item 18). The factor structure is close to that of the English version, although not in total accord, with both versions comprising health, social relationships, social activities, home and neighbourhood, psychological well-being, financial circumstances and culture/religion dimensions, reflecting the multi-dimensional nature of QoL. However, differences were also found between the Chinese and English versions. Considering that the OPQOL was developed in accordance with the UK cultural norms, and that cultural variations may influence the constructs within instruments, the differences were not surprising. In the Chinese OPQOL, “leisure and social activities” and “social relationships” were two dimensions, however, they were combined into one dimension labelled “social relationships/leisure and social activities” in the English version. It may be more reasonable to split these two dimensions, as the former reflects participation in social activities and being active while the latter reflects social relationships and social support. Two dimensions measuring “health” and “independence, control over life and freedom” in the English version were combined as one dimension labelled “health and independence” in the Chinese version. This demonstrated the close relationship between health and independence, as the presence of illnesses and related symptoms can limit one’s independence (Bowling 2009). Moreover, the significant correlation between these two dimensions further justified the grouping of these two factors into a combined one (rs=0.63, p<0.001; figures were not reported in Chapter 4). 201 The items pertaining to the “life overall” dimension in the English version were grouped into the “psychological well-being” dimension in the Chinese version. These four items can be regarded as measuring life satisfaction, happiness and expectations in life, which pertain to the psychological aspect of QoL. In addition, the dimension of “life overall” seems to be too vague and broad to reflect a specific dimension of QoL, which might further justify the grouping of the four items in the Chinese OPQOL. It is noteworthy that the factor 8 labelled “safety” comprising only one item (Q18. “I feel safe where I live”) was identified in the Chinese OPQOL. Caution is needed when dealing with this factor because it is less than ideal to extract and characterise a factor with less than two items (Lea et al. 1998). In addition, the Eigenvalue of this factor was only 1.003, and the explained percentage of variance was only 3.81. It seems that this factor may be redundant across cultural contexts. The concept of “safety” in Western countries mainly refers to neighbourhood safety which was identified to be particularly salient to the English older people and as a predictor of their life satisfaction (Rioux & Werner 2011). Therefore, “I feel safe where I live” was loaded on the “home and neighbourhood” dimension in the English version. However, “safety” is likely to be psychological safety in addition to neighbourhood safety in the Chinese context. Few studies regarding the QoL of Chinese older people identified this factor as one of the components of QoL. Moreover, 81.0% of the participants in this study reported feeling safe where they lived indicating small variability on this statement. It is recommended that this item be reviewed for its relevance within the Chinese context, or that the item be modified to make explicit the meaning of “safety”. 202 Further examination of the structure of the Chinese OPQOL revealed some noteworthy results of item loadings. Two items (17 and 20) were cross-loaded on two factors. Item 17 “I have a lot of control over the important things in my life” had strong correlations with both factors 1 and 3, suggesting that this item might incorporate both social activities and independence factors, although it was allocated in the “leisure and social activities” factor due to the higher factor loading in this dimension. It is noted that the participants of this study were older people who lived alone and therefore mainly relied upon themselves with most having autonomy for their own decisions. For this sample, the most important things that they could control might be leisure and social activity and they had independence to choose the time, place or type of social activity. Therefore, control over the important things in their lives reflected the leisure and social activities aspect together with the independence aspect in this study. Item 20 “I get pleasure from my home” which pertained to the “psychological well-being” factor also had a high loading on the “home and neighbourhood” factor. The overlap of this item is explainable. Older people have more ties and binding memories with their home because they spend a large part of the time there which may partly be due to no need to travel for work and the possibly restricted physical mobility (Phillips et al. 2004, 2005). For older people living alone, home is a symbol of being an independent person, is related to their emotional selves, and allows them to remain connected to a meaningful past (Haslbeck et al. 2012). Home is not just a place to live but a place where they can truly be themselves which has certain benefits for their psychological well-being (Perez et al. 2001). 203 Item 22 “I take life as it comes and make the best of things” was loaded on the “home and neighbourhood” factor, although it seems to relate to “psychological well-being” according to its literal meaning. Further analysis of this item showed that it was closely correlated with the item 20 “I get pleasure from my home” which was cross-loaded on two factors as reported previously (rs=0.60, p<0.01; figures were not reported in Chapter 4). This close correlation may cause item 22 to be loaded on the “home and neighbourhood” factor. Another explanation may be that the participants were influenced by contextual framing from the previous items measuring home and neighbourhood. It is recommended that this item be revised or reframed for further use within the Chinese context. Although the factor loading of item 24 “I tend to look on the bright side” was less than 0.40, it was still kept in the “psychological well-being” factor in light of its acceptable factor loading of 0.37. Furthermore, this item reflects an important psychological aspect, namely, a sense of optimism which contributes to a high QoL in older people. Item 29 “I can afford to buy what I want to” was not loaded on the “financial circumstances” factor but on the “home and neighbourhood” factor. This may have been a translation problem. The translated item can also be interpreted as “I can buy what I want to”, which refers to various goods in local shops to meet basic life needs. It is suggested that this item should be modified to eliminate such ambiguity. In summary, the Chinese OPQOL has an eight-factor structure which was not identical to the English version. The structure reflected eight underlying dimensions of QoL of older people living alone in China. This confirmed the 204 construct validity, namely, QoL is a multi-dimensional concept related to a person’s perceptions of various aspects of life including physical, psychological, social and spiritual (The WHOQOL Group 1995). Regarding the convergent validity of the Chinese OPQOL, the total scale demonstrated moderate correlations with functional ability, loneliness and social support. In addition, the correlations were shown in the expected direction. The scores of overall OPQOL and each dimension except the “safety” were negatively correlated with the score on the ADL Scale, with older people having better functional ability reporting a higher QoL (minus signs reflected the different coding direction). Similarly, the score on the RULS-V3 was negatively correlated with the scores of overall OPQOL and all the dimensions, with more severe loneliness correlating with lower QoL (minus signs reflected the different coding direction). Also, as expected, there were positive correlations between the scores on the SSRS and OPQOL, with older people reporting a higher level of social support having a higher QoL. Moreover, some OPQOL dimensions correlated more closely with relevant measures, which were demonstrated by a moderate correlation between the “health and independence” dimension and functional ability, and a moderate correlation between the “social relationships” dimension and social support. The results provided evidence of convergence, i.e. different instruments measuring similar constructs were closely correlated (Bonomi et al. 2000), and therefore supported the convergent validity of the Chinese OPQOL. The results of Mann-Whitney U test showed that the OPQOL scores were different between the depressed and non-depressed groups. As expected, the depressed participants scored lower on the total scale and on all of its dimensions compared with those who were not depressed. The differentiation 205 between the different groups on the QoL supported the discriminant ability of the Chinese OPQOL. 6.2.2 Reliability of the Chinese OPQOL Reliability, which concerns an instrument’s consistency and accuracy, is a major criterion for assessing its quality and adequacy (Polit & Beck 2012). Internal consistency, which is usually tested by using Cronbach’s α coefficient, is one of the most widely used methods assessing the consistency of results across items within a test (Zywno 2003). An α coefficient over 0.70 is usually considered to be adequate (LoBiondo-Wood & Haber 1998) although the acceptable limit can be 0.50 (Tuckman 1999). The results demonstrated that the Chinese OPQOL, which had new dimensions being different from those of the English version, had good internal consistency with the Cronbach’s α coefficients of the total scale and most dimensions exceeding 0.70. The relatively low α coefficient of the “home and neighbourhood” dimension may be due to the loading problems of items 22 and 29 which have been discussed above. In addition, the results of factor analysis, which suggested that the “safety” dimension be modified for its proper use in older people living alone in China, made it difficult to assess the internal consistency of this dimension. Test-retest reliability is another important method assessing reliability of an instrument. The ICC, which reflects the proportion of total variance in item scores associated with differences between items themselves after the variance due to a specific source has been subtracted (Bonomi et al. 2000), was used in this study to assess test-retest reliability. According to Fleiss’s (1986) interpretation of ICC, the Chinese OPQOL and most of its dimensions 206 demonstrated excellent to good stability with the ICCs above 0.60, which is greater than those reported in the English version. The moderate stability of two dimensions (“social relationships” and “safety”) may be explained by the nature of some traits such as attitudes, emotions, behaviours and knowledge which change over time (Polit & Beck 2012). It may also be explained by changes in recent life experiences. The comments about life changes were not obtained in this study, however, Bowling and Stenner (2011), when measuring the test-retest reliability of the English version of the OPQOL, found that some of their participants reported life changes during the four-week follow-up, for example, a daughter and grandson had moved to their own house or a husband had been discharged from hospital. It is noteworthy that the Chinese OPQOL with the original eight dimensions showed lower internal consistency and test-retest reliability of some dimensions. Using an instrument which was developed in different cultures with different languages is much more than merely translating the original version. Conceptual equivalence and semantic equivalence between the original instrument and the translated instrument are required (Polit & Beck 2012). The OPQOL was derived from English older people including those living alone and not living alone, therefore the factor structure might not have been the best fit for Chinese older people who lived alone. In contrast, the Chinese OPQOL with new dimensions demonstrated more satisfactory reliability indicating the necessity of adapting instruments prior to use in other cultures. The findings further indicate that the experiences of QoL among older people were different due to the different social, economic and cultural contexts. 207 6.2.3 A brief summary of the psychometric properties of the Chinese OPQOL The results of the psychometric testing suggest that the Chinese OPQOL is an appropriate measurement tool for assessing the QoL of older people living alone in China. The eight-factor structure together with the reported convergent validity and discriminant validity confirmed the validity. The reliability of the total scale and most of its dimensions was good. However, the results of the EFA showing some loading problems of items 18, 22 and 29 in the “home and neighbourhood” and “safety” dimensions, and together with the relatively low or unobtainable internal consistency of these two dimensions suggest the need for further testing and refinement of the Chinese OPQOL. 6.3 Characteristics of older people living alone in Chongming The findings that most of the participants were in their late 70s (M=76.5), female (n=344, 66.6%), widowed (n=501, 96.1%) and less educated were similar to previous research findings (Lee 2005, Lin et al. 2008, Zhong 2004). This is not surprising, as women generally outlive men. The difference in life expectancy between women and men was 4.5 years in 2005-2010 globally and is expected to increase in the future (United Nations 2009). Thus, women comprise a majority of the older population with the global sex ratio of people aged 60 years and above being 83 males per 100 females (United Nations 2009). Because women have a higher life expectancy, older women are more likely to be widowed so that the majority of older people living alone comprises widowed women. The low level of education is common in developing countries. According to the report of the United Nations (2009), 208 the illiteracy rate among people aged 65 years and above was 46.0% in the less developed regions during 2005-2007. Moreover, the proportion of illiteracy was higher among older women with 58.0% of older women and 34.0% of older men aged 65 years and above being illiterate. This was congruent with the findings of this study, where 46.8% of the participants had no formal education and women reported significantly lower levels of education (χ2=53.3, p<0.001). As the only county of Shanghai, Chongming is primarily rural and dominated by agriculture. So it is not unexpected that the majority of the participants were peasants (78.3%), lived in the rural areas (90.0%) and reported lower economic levels (80.0%). The finding that fewer older women were engaged in non-manual or blue-collar occupations compared to men was consistent with traditional Chinese society which was male-centred (Worden et al. 1987). Previously, women rarely participated in the labour market and were less likely to be engaged in paid work. Even though they were employed, most of their jobs were non-skilled, less desirable and lower paid (Worden et al. 1987). 6.4 Health status, loneliness, social support, physical activity, health services utilisation and satisfaction, housing and quality of life of older people living alone in Chongming The first objective of this study was to explore the health status, life circumstances such as loneliness, social support, physical activity, health services utilisation and satisfaction and housing, and QoL of older people living alone in Chongming, Shanghai. 209 6.4.1 Health status 6.4.1.1 Physical health Approximately half of the study participants (44.5%) reported having chronic diseases with the average number of chronic disease being 1.7. The prevalence was lower than those reported in other studies regarding chronic diseases of older people in China where the rates ranged from 57.8% to 82.6% (Huang et al. 2000, Liu & Ni 2003, Lv H. et al. 2001, Zhong et al. 1999). The difference in the chronic disease prevalence is probably explained by the different samples. It may also be due to the different measurement methods. In Huang et al.’s (2000) study, medical records were referenced in addition to self-reported diseases. However, the participants’ chronic conditions in Zhong et al.’s (1999) study were assessed using physical examinations undertaken by community doctors and nurses, which resulted in a higher prevalence of 82.0%. Chronic disease, in this study, was measured by asking the participants whether they had any chronic disease and to list all these diseases. The use of self-report measures may lower the rate because older people may not fully report all their diseases. However, the prevalence of chronic disease in the current study was similar to the result of the Fourth National Health Services Survey (NHSS) which was conducted in 2008 by the Ministry of Health of China (2009). In that survey, 43.8% of older people aged 60 years and above were reported to have chronic diseases, which was an increase of 5.6% during the past five years. Among the chronic diseases, hypertension was most frequently reported with a prevalence of 57.3%. Other common diseases included heart disease, musculoskeletal problems, diabetes and stroke. The majority of the prevalent 210 chronic diseases were cardiovascular diseases (CVDs). The high prevalence of CVDs is well-documented in the literature (Huang et al. 2000, Liu & Ni 2003, Lv H. et al. 2001, Xiao & Song 2006, Zhong et al. 1999). According to the results of the Fourth NHSS (Ministry of Health of China 2009), hypertension and cerebro-vascular disease were the top two chronic diseases of older people with the prevalence of hypertension being much higher than other diseases. CVDs can lead to other serious conditions and has been identified as the single leading cause of death globally (World Health Organization 2012). They not only affect people’s health but also contribute to poverty due to high health spending and out of pocket expenditure, and place a heavy burden on countries’ economies (World Health Organization 2012). Over 80.0% of CVD deaths take place in low- and middle- income countries (World Health Organization 2012). A report from the World Health Organization (2011a) showed that CVDs were the primary cause of death in China, accounting for 38.0% of the total deaths. Physical inactivity, tobacco use especially in males, raised blood pressure, raised cholesterol and being overweight have been identified as important risk factors for Chinese people’s CVDs (World Health Organization 2011a). Most CVDs can be prevented or controlled by addressing these risk factors and implementing effective interventions (World Health Organization 2012). Although the current study did not include questions related to lifestyle behaviours such as cigarette smoking, alcohol consumption and food preference, and other physical health indicators such as body weight, the relatively high prevalence of CVDs in this study together with the fact that these diseases have serious effects but are preventable and controllable suggest the importance of health promotion interventions to decrease older people’s chronic diseases. In this study some socio-demographic factors were found to have 211 relationships with the number of chronic diseases. Age was an important factor with those with advancing age reporting more chronic diseases. As is well-known, physical health changes with the ageing process. Some biological factors such as changes in cellular division can result in functional decline of body organs, so that people with advancing age are prone to more diseases. Moreover, the association between diseases and getting older has been considered as the combination effect of intrinsic and extrinsic factors. Natural physical decline can be accelerated by the accumulative risk factors due to lifestyle and environmental effects over a life time (World Health Organization 2003). Education level has been identified as a social determinant of older people’s health (World Health Organization 2003). This study’s finding that older people with no formal education reported more chronic diseases corroborated this. No formal education can create a sense of powerlessness and loss of self-esteem in a rapidly changing society, and hinder older people from active participation in the society, thus increasing their vulnerability to more chronic diseases (World Health Organization 2003). In addition, older people with formal education may have more knowledge regarding health care and disease prevention, which consequently leads to fewer diseases. In contrast to previous findings that poverty was a strong predictor of poor health (World Health Organization 2003), the findings in this study revealed that the proportions of older people reporting two or more chronic diseases were higher in the medium-high and high economic level groups. A possible explanation may be that older people with a higher economic status have better access to health services and can afford health care costs, so that they detect more diseases during physical examinations. However, those with a 212 lower economic status may underutilise health services and undertake fewer regular health check-up due to barriers of affordability and accessibility, thus leading to less reported chronic diseases. The finding of the current study that older people living in the urban areas reported more chronic diseases than those living in the rural areas was inconsistent with general expectation, i.e. urban residents have a number of socio-economic advantages and thus enjoy better health status (Fang et al. 2009). However, it was supported by some previous studies (Ministry of Health of China 2009, Zhou et al. 2011). For example, Zimmer and Kwong (2004) analysed the data from the SSES conducted in 1992 to examine the associations between socio-economic variables and health status. They found that urban older people were significantly more likely to report two or more chronic diseases compared to their rural counterparts. A possible explanation for this result may be that older people living in the urban areas do indeed have more chronic diseases due to more unhealthy lifestyles such as smoking and poor dietary habits, higher levels of stress and more pollution (Zimmer & Kwong 2004). Another possible explanation is that chronic diseases are under-diagnosed among rural older people because they are less concerned about their health status (Zhou et al. 2011). In addition, the health services in rural areas are poorer than those in urban areas. Rural residents have greater difficulty in obtaining health services and receiving earlier and more accurate diagnoses due to either limited availability of or long distances to health care providers (Fang et al. 2009). The poor accessibility may also result in the reporting of less chronic diseases among older people living in the rural areas. 213 6.4.1.2 Cognitive function Ninety-seven older people were excluded from this study due to their poor cognitive function (moderate or severe cognitive impairment as indicated by the SPMSQ score under six), accounting for 15.7% of those who agreed to participate (97 out of 618). Although these people were not recruited for further data collection, the proportion of poor cognitive function provided information of the cognitive status of older people living alone in Chongming. Among the older people who were recruited to this study due to good cognitive function, 87.1% were identified as intact cognitive function and 12.9% were identified as mild cognitive impairment. The prevalence of mild cognitive impairment was almost the same as that reported in a meta-analysis conducted by Nie et al. (2011) who estimated that the average prevalence of mild cognitive impairment of older people in China was 12.7%. As discussed in Chapter 2, a variety of measurements have been used to assess older people’s cognitive function. In addition, the differences in cognitive state categories (intact cognitive function/mild cognitive impairment/severe cognitive impairment, intact cognitive function/impaired cognitive function, not poor cognitive function/poor cognitive function) made it complex to compare the cognitive function. Therefore, the comparable studies for this study would be those using the same measurement tool. For example, in Chou and Chi ’s (2005) study conducted in Hong Kong, 35.0% of the older people (702 out of 2003) who agreed to participate in the study were found to have poor cognitive function. However, the criteria of poor cognitive function in that study was defined as the SPMSQ score being equal to or under seven. The higher cut-off point might explain the higher prevalence of poor cognitive function in Chou and Chi’s study. 214 In contrast, Guo (1998) identified that 4.1% of the urban older people aged 60 years and above living in one city of China had poor cognitive function using the same assessment criteria as this study. The lower rate, compared with that reported in the current study, is probably explained by the different samples. In Guo’s (1998) study, all the participants were urban residents, while older people in this study mainly comprised rural residents who were more likely to report low cognitive function (which will be discussed later in this section). More importantly, the sample in this study was older people living alone who have been identified as having poorer cognitive function. Van Gelder et al. (2006) conducted a 15-year prospective study and reported that living alone was associated with cognitive decline. They pointed out that older people living alone might have less cognitive stimulation which resulted in a greater decline of cognitive function based on the “use it or lose it” hypothesis. In addition, most of the participants in this study were widowed. Bereavement, as an adverse life event, may cause stress, depression and other adverse health effects or the change of lifestyles, which may have a negative effect upon cognitive function (van Gelder et al. 2006). In this study, older people’s cognitive function was different across the different age groups, education levels, previous occupations and residential areas. The effects of age and education level upon cognitive function have been widely studied (Yao et al. 2009). Ageing is often associated with degenerated sensory, perception, memory, thinking and intelligence (Yao et al. 2009). In other words, age is a risk factor of cognitive decline. The participants with advanced age, in the current study, were more likely to report cognitive impairment, which was consistent with previous studies (Guo 1998, Lin et al. 2006, Yao et al. 2009, Zhang et al. 2001). With regard to the 215 education level, Pfeiffer (1975) had considered its effect upon cognitive function when he developed the SPMSQ. Therefore, the scoring method of the SPMSQ was based on different education levels. Afterwards many studies (Bauco et al. 1998, Guo 1998, Lin et al. 2006, Yao et al. 2009, Zhang et al. 2001) have identified that education level has a significant effect upon the maintenance of cognitive function. In this study, the proportion of the participants reporting intact cognitive function was highest in the “junior high school and above” group and lowest in the “no formal education” group, which confirmed the positive relationship of education level and cognitive function. It is argued that education provides regular and persistent stimulus for the development of high levels of cognitive function, and prevents the loss of connection or improves the connection of inosculating neurons (Yao et al. 2009). Occupation was another related factor of cognitive function. The peasants were more likely to have impaired cognitive function than the blue-collar workers and non-manual employees. The blue-collar and non-manual jobs require cognitive skills, provide more cognitive stimulation and develop people’s thinking and intelligence, and thus are beneficial for the maintenance of cognitive function (Ansiau et al. 2005). The other possible explanation is that the peasants had a lower level of education than those who were engaged in other two types of jobs (χ2=36.6, p<0.001), and thus had poorer cognitive function. There also existed a relationship between residential area and cognitive function. Compared with the older people living in the urban areas, those living in the rural areas were more likely to have cognitive impairment, which was consistent with those reported in previous research (Ao & Liu 2004, Li et 216 al. 2007, Xie & Gao 2010). The poorer cognitive function of rural residents may be linked to the difference in occupations. In this study, 85.3% of the participants living in the rural areas were peasants, while the proportion of peasants in urban residents was 15.4%. 6.4.1.3 Depression The finding of this study indicated that nearly half of the participants (47.6%) reported being depressed. The prevalence of depression was much higher than that in Chen et al.’s (1999) meta-analysis based on 10 cross-sectional studies conducted in Mainland China, where the average prevalence of depression of older people was estimated to be 14.8% (95% CI: 14.2%-15.6%). Compared with the studies using the same measurement tool (the 15-item GDS) and cut-off point (eight), the prevalence of depression in this study was also higher than those reported in other studies regarding Chinese older people where the prevalence ranged from 11.9% to 35.0% (Chan & Zeng 2009, Chi et al. 2005, Chou & Chi 2005, Jia et al. 2007, Lam & Boey 2005, Lv T.Y. et al. 2001). However, the result was similar to Chen et al.’s (2012) systematic review findings which showed that different living arrangements influenced older people’s depression, with those living alone reporting a higher prevalence of depression or more severe depressive symptoms. It was also supported by previous research which suggested that living alone was associated with higher levels of depression (Dean et al. 1992, Hsieh et al. 2010, Wilson et al. 2007). Living alone may cause social isolation, the loss of interaction with family members, friends or other social networks, or a relative lack of companionship or intimacy (Dean et al. 1992, Mui 1998). This issue may be 217 more apparent within the Chinese culture context, in which living with family members is a social and culture norm (Lai et al. 2010). Traditionally, Chinese older people prefer to live with their adult children and rely on them as their main source of financial, emotional and physical support (Chen 2007). They have high expectations of filial responsibilities, family togetherness and generational interdependence (Mui 1998). It is not uncommon that older parents live with their married child especially with an adult son which gives them a sense of pride. Therefore, living alone may engender disappointment, embarrassment and inferiority, which leads to depression (Lai et al. 2010, Mui 1998). Not surprisingly then, the participants in this study reported a high prevalence of depression. A considerable number of studies have investigated the relationships between socio-demographic variables and older people’s depression. In this study, all but gender were significant correlates of depression, with older people having advancing age and lower levels of education, being peasants, reporting lower economic levels and living in the rural areas being more likely to report depression. Age has been identified as a related factor of depression in some previous studies (Chong et al. 2001, Gao et al. 2009, Liu et al. 1997, Lv T.Y. et al. 2001). Using the data from the Taiwan Longitudinal Study on Ageing, Chiao et al. (2009) analysed depressive symptoms, as measured by the 10-item CES-D (Cheng & Chan 2005), of two birth cohorts of older people (1925-1929 vs. 1920-1924) over a 14-year period (1989-2003). The results of the growth curve modelling showed that the “negative affect” dimension of the CES-D increased with age and then levelled off, and the symptoms of “lack of positive affect” increased over time. In addition, the older cohort reported higher levels of depression than the younger cohort. However, some studies did not find a relationship between age and depression (Chan & Zeng 2009, 218 Lue et al. 2010, Tsai et al. 2005). The inconclusive results may be due to the interactions between age and other factors such as socio-economic status, cognitive function and functional ability (Gao et al. 2009, Lue et al. 2010). Older people having lower levels of education, being peasants and having lower economic levels are usually considered to be in the lower social class, which may result in a lower self-esteem. In addition, people with lower levels of education may have poorer abilities in handling problems or identifying appropriate strategies to relieve stress, and therefore are more likely to have depression (Chen et al. 2012). The significant role that poor socio-economic status played in the presence of depression has been supported by other researchers (Chiao et al. 2009, Chong et al. 2001, Woo et al. 1994). The finding that older people living in the rural areas reported a higher rate of depression was consistent with that reported in Chen et al.’s (1999) meta-analysis, in which the prevalence of depression in the rural and urban areas was 22.6% (95% CI: 20.8%-24.7%) and 11.2% (95% CI: 10.4%-12.0%) respectively. The higher prevalence of depression in the rural areas in this study may be linked with more peasants (χ2=1.349E2, p<0.001) and lower economic levels in the rural areas (χ2=1.162E2, p<0.001). Su et al. (2012) also asserted that the urban-rural differences in the prevalence of depression in China were due to the differences in terms of occupation and economic status. 6.4.1.4 Functional ability People’s ability to conduct routine activities in daily life changes with the ageing process. Older people usually encounter more difficulties and 219 obstacles in ADLs, which may hinder their independence. Thus, functional ability is an important determinant of living alone among older people. It is not surprising, therefore, that majority of the participants in this study (n=375, 72.0%) reported a high level of functional ability, as measured using the ADL Scale (Zhang et al. 1995). Most of the participants (more than 80.0%) could carry out each self-care activity independently, and more than two thirds were able to perform each IADL independently. As described in Chapter 2, a variety of measurements of functional ability have been used. Therefore, the most comparable studies for this study are those using the same measurement with the same scoring method. He et al. (1998) recruited a stratified cluster sample of 3019 older people aged 60 years and above in Shanghai, and reported that the mean score of the ADL Scale was 17.2. The score was slightly higher than the score of 16.9 in this study, indicating that the participants in He et al.’s (1998) study had a lower level of functional ability4. Similarly, some previous studies have reported that older people living alone had a higher level of functional ability compared with those living with others (Li et al. 2009, Magaziner et al. 1988, Sarwari et al. 1998). It may reflect that those who lived alone had the capacity to do so, due to their good functional ability. It may also be that older people living alone had to perform daily activities by themselves, thus decreasing the risk of functional dependency and disability (Li et al. 2009). In contrast, Kharicha et al. (2007) compared older people living alone with those living with others in terms of their health status, and reported that the former were more likely to have difficulties with PSMs (OR=1.39) and IADLs 4 The mean score of the ADL Scale was not reported in Chapter 4. For overall ADL, a higher score indicated a lower level of functional ability. 220 (OR=1.33) after adjusting for age, gender, education level and income. The contradictory result may be due to different chronic diseases. In Kharicha et al.’s (2007) study, the older people living alone reported more arthritis/rheumatism (50.7%), cataract (28.4%) and glaucoma (6.9%). These three diseases can result in difficulties in performing many ADLs with arthritis having been identified as the leading cause of disability (Tang et al. 1999). However, only 6.5%, 2.3% and 1.2% of the participants in this study reported suffering these diseases respectively (figures were not reported in Chapter 4). Further analysis of two aspects of functional ability showed that the proportion of the participants who reported a low level of IADL was higher than the proportion of those who reported a low level of PSM. Additionally, the activities that the participants needed more help to perform were those involving more components of mobility, strength, memory or social ability, such as taking a bath/shower, making a telephone call, going out by public transportation and shopping. The results were consistent with those reported in other studies (Del Duca et al. 2009, He et al. 1989). This is because human behaviour can be divided into different levels from life maintenance (the lowest level) to social behaviour (the highest level) with higher-level activities requiring more complexity of neuropsychological organization (Lawton & Brody 1969). Therefore, the ability to perform more complicated activities is more likely to deteriorate than the ability to perform simple activities. The strong relationship between age and functional ability is well-documented (Beydoun & Popkin 2005, Del Duca et al. 2009, He et al. 1998, Tang et al. 1999). Advanced age is directly related to lower levels of functional ability due to the irreversible ageing process. The finding that older people with higher levels of education were more likely to report a higher level of functional ability 221 was supported by previous research. Ho et al. (1997) conducted an 18-month longitudinal follow-up survey to investigate the predictors of functional decline among older people aged 70 years and above in Hong Kong. They reported that older people having no formal education had a higher risk of functional decline compared to those having secondary education or above (OR=2.0). Similarly, Beydoun and Popkin (2005) found that education level was strongly and inversely associated with the incidence of functional status decline, based on the data from two phases of the China Health and Nutrition Surveys (CHNS). More self-care knowledge, healthier lifestyle, better access to health services may explain the positive effect of education level upon functional ability. With regard to the relationship between occupation and functional ability, the peasants reported greater functional disability. This could be due to the difference in education level and access to resources in health services. Another possible explanation is that the peasants have been undertaking heavy manual work which requires more physical effort, exerting an accumulated effect upon functional ability (World Health Organization 2003). 6.4.1.5 Self-rated health It has been reported that older people living alone are more likely to report poorer self-rated health (Chou & Chi 2000, Chou et al. 2006, Li et al. 2009) compared with those not living alone. As older people living with others were not recruited to this study, it is not possible to directly compare the difference in terms of self-rated health between these two different living arrangements. But the finding can be compared with those reported in other studies conducted in China regarding older people’s self-rated health. 222 In contrast to previous findings (Chou & Chi 2000, Chou et al. 2006, Li et al. 2009), the rate of poor self-rated health in the current study (15.2%) was lower than those reported by other researchers. For example, in two studies (Chi et al. 2005, Chou & Chi 2005) conducted in Hong Kong and one study conducted in Anhui province (Zhou et al. 2008), 26.6%, 24.4% and 22.6% of the older people aged 60 years and above rated their health as poor, respectively. Furthermore, the results derived from a national survey conducted by the China Research Centre on Ageing (Zimmer & Kwong 2004) showed that 21.5% of the rural older people and 21.0% of the urban older people reported being in poor health. In addition to making comparisons with general older people (not confined to those living alone), the participants in this study also reported a lower rate of self-rated poor health than other older people living alone, such as those in Hong Kong (54.1%), Taiwan (33.1%), Malaysia (43.4%) and Japan (26.9%) (Huang & Lin 2002, Lee 2005, Sun et al. 2007, Yahaya et al. 2010). It could be argued that older people living alone in Chongming did not seem to consider themselves in poor health despite a high prevalence of depression. A possible explanation may lie with their good functional ability and a relatively low prevalence of chronic disease. Self-rated health was defined as how individuals evaluated their state of health from a subjective perspective, which encompasses physiological conditions, functional abilities, psychological well-being and social support (Ocampo 2010). Of these dimensions, physical health and functional status have been identified as having direct and strong effects upon self-rated health (Ocampo 2010). Older people are more likely to judge their general health from the point of view of the presence of a disease or the capacity to independently perform ADLs 223 (Ocampo 2010). Moreover, good functional ability may bring them a positive attitude towards their health when they take older individuals who are functional dependency as a reference. Thus the downward comparison can modify the standard against which their performance or functioning is judged thereby minimising disappointment and evaluating themselves favourably (Cheng et al. 2008). It is also possible that older Chinese people pay more attention to their physical health than mental health (Chen et al. 2012). Some symptoms of depression might be regarded as the normal biological results of ageing and were neglected by the participants (Halvorsrud et al. 2010). The participants’ self-rated health differed across the different age groups, education levels, occupations and economic levels. Advanced age, as discussed above, was related to more chronic diseases, a poorer cognitive function, more depression and a lower level of functional ability, which consequently induced to poorer self-rated health. This result was similar to those reported in previous research (Hirve et al. 2010, Ocampo 2010). Consistent with the findings that self-rated health was influenced by socio-economic variables (Damian et al. 1999, Maniecka-Bryla et al. 2011, Ocampo 2010), this study revealed that older people having a higher level of education, being non-manual workers and reporting a higher economic level tended to report a more positive perception of their health. This may have been due to their greater ability to deal with life stress, better access to information and resources to promote health, better access to health services and higher self-esteem (Hoi et al. 2010). It may also be explained by the effects that socio-economic variables had upon the aforementioned other health status indicators. 224 6.4.2 Loneliness The participants’ overall level of loneliness was moderate with 15.4%, 58.9% and 25.7% reporting a low level, moderate level and moderately high level of loneliness respectively. Compared with three studies conducted in rural areas regarding the loneliness of Chinese older people (Liu & Guo 2007, Wang et al. 2011, Wu et al. 2010) using the same measurement tool (the UCLA Loneliness Scale) and the same criteria of loneliness level (a score of 20-34, 35-49, 50-64 and 65-80 denoting a low, moderate, moderately high and high level of loneliness respectively), older people living alone in Chongming seemed to be lonelier. In those three studies, the prevalence of low, moderate and moderately high levels of loneliness was 19.0%-50.8%, 40.7%-57.1% and 8.5%-24.7%. Several theoretical perspectives such as cognitive theory and interactionist theory have been developed to conceptualise and define loneliness. The cognitive theory proposes that loneliness is an individual’s perception of experienced situation involving lacking companionship and/or some qualitative aspects of a relationship (de Jong Gierveld 1998). It emphasises the subjective evaluation of the social network (de Jong Gierveld 1998). In contrast, the interactionist theory views loneliness as a response to the absence of certain specific relationships with some persons or the absence of adequate social networks (Beal 2006). It emphasises the nature of social interactions (Beal 2006). Both theories related loneliness to a deficiency in social relations. Living alone is more likely to result in less social integration and greater social isolation due to smaller social networks. Therefore, older people living alone are prone to have a stronger feeling of loneliness, which has been demonstrated in some studies where living alone was identified as an important factor related to loneliness. 225 For example, Pan et al. (2010) recruited 694 older people aged 60 years and above living in a rural area to investigate their loneliness level and its related factors. They reported that older people living alone scored higher on the RULS-V3 (Russell 1996) than those who did not live alone. Similarly, in Liu et al.’s (2009) study, the score for the RULS-V3 (Russell 1996) in the “living alone” group was higher than that in the “not living alone” group. The results of a study conducted in Singapore (Lim & Kua 2011) showed that older people living alone were twice more likely to being lonely than their counterparts who lived with others (24.2% vs. 10.9%). Moreover, Yeh and Lo (2004) interviewed a stratified random sample of 4858 older people aged 65 years and above living in Taiwan, and found that those living alone were more likely to report a strong feeling of loneliness (OR=3.6) when some covariates were controlled for. Furthermore, living alone may have a greater impact upon the loneliness level of older people in China. The family fragmentation due to the migration and emigration of younger people arising from significant societal and economic change in China has not only resulted in the change of family structure, but also eroded family cohesion and intimacy between generations (Chen 2007). Nevertheless, the traditional Chinese collective family value still strongly influences older people, and adult children are still expected to support their parents in the modern collectivist society (Chen 2007, Tong et al. 2011). Therefore, those who live alone are more likely to perceive a difference between the expected and actual amount of support that they derived from their families, have a stronger sense of loss and encounter social stigma from others, thus resulting in a higher level of loneliness (Lim & Kua 2011, Tong et al. 2011). 226 The results in this study showed that the levels of reported loneliness were associated with age, previous occupation, economic level and residential area. The relationship between advanced age and higher levels of loneliness is well documented (Liang et al. 2006, Savikko et al. 2005, Victor et al. 2005a, Zhang X.J. et al. 2010). People’s opportunities for social contact and social engagement are limited by the physical and functional limitations, the loss of social roles and the diminished social network size with increasing age, which increases feelings of loneliness (Pinquart & Sorensen 2001b). The peasants reported a higher level of loneliness than those who were not peasants. This may be because the peasants have restricted social networks which are predominantly family-based. Another explanation may be that the peasants have a lower economic level. Economic level was found to be associated with loneliness in this study with older people having a lower economic level being more likely to report a higher level of loneliness. Access to financial resources influences the use of commercial social opportunities, the use of paid services and the engagement of a variety of social activities (Pinquart & Sorensen 2001b). Older people with a lower economic status may experience economic barriers to their socialisation with the inability to afford outdoor activities and inadequate housing and resources to host friends (Cohen-Mansfield et al. 2009). In addition, a lower economic status is considered to be associated with lower self-esteem which may inhibit people from developing new social networks (Pinquart & Sorensen 2001b). In these ways, occupation and economic level, as proxies for socio-economic status, impacted upon social contacts and thereby the experienced loneliness. The urban participants reported a lower level of loneliness than their rural 227 counterparts. Similar results have been found in a few previous studies (Savikko et al. 2005, Wang et al. 2011).This may reflect that the urban residential sample comprised a higher proportion of non-peasants with a higher economic level (p<0.001). Thus, sample differences may explain the contrasting levels of reported loneliness. Another possible explanation is that the impact of residential area upon loneliness was mediated by depression. There is a consistent relationship between depression and loneliness with older people having depression feeling lonelier (Prieto-Flores et al. 2011, Victor et al. 2000). In this study, the rural participants reported more depression, which might lead to a disruption of social relationships and consequently a higher level of loneliness. 6.4.3 Social support This study revealed that older people living alone reported a lower level of overall social support compared with the Chinese population norm. This finding was consistent with some previous studies conducted in Hong Kong, Taiwan and Mainland China (Chou & Chi 2000, Chou et al. 2006, Yeh & Lo 2004, Zhang H.C. et al. 2010). In Chou and Chi’s (2000) study, older people living alone reported fewer relatives, relatives seen once a month and relatives with whom they felt close. Yeh and Lo (2004) interviewed a stratified random sample of 4858 older people aged 65 years and above, among whom 427 (8.8%) lived alone. They reported that those living alone had less perceived positive social support. Zhang H.C. et al. (2010) reported that older people living alone had fewer contacts with relatives and friends and attended fewer social activities compared with those living with their children. Additionally, one third of those living alone (33.3%) felt neglected by their children, while only 0.9% of those living with children expressed this feeling. 228 Less old people living alone perceived children’s concern and love. However, Mui and Burnette (1994) found that, compared with older people living with others, those living alone received more ADL assistance and reported more frequent contact with friends and family members who lived apart. This discrepancy may be explained within a number of ways. Firstly, in Mui and Burnette’s (1994) study in the US, the sample was frail older people identified as being at high risk for institutionalisation and was referred by family and services providers. Therefore, the participants might have received more attention from their family members, friends or other care providers thus reporting more social support. Secondly, older people’s sources of social support are different within different cultures. Chinese culture values the family unit and filial piety, which dominates the family support system (Lim & Kua 2011). As discussed in Chapter 2, Chinese older people’s major sources of social support are family members especially their spouse and children. Other support sources such as friends, neighbours and social organizations play less important roles. This was echoed in the current study with most of the participants receiving instrumental and emotional support from their children (95.4% and 95.2%) and perceiving that their children could give them some or a lot of help (93.3%). However, a minority of the participants (less than 20.0%) had received support from other social network members. Therefore, older people’s support sources and support level could be reduced when their spouse passed away and their children lived apart from them. In contrast, in Western countries, support from friends has been identified as especially important for older people (Dean et al. 1992, Eshbaugh 2009, Pinquart & Sorensen 2001b). Older people are likely to seek support from friends 229 because they consider that friendship is flexible and can provide a better opportunity for being understood and for sharing experiences and attitudes (Pinquart & Sorensen 2001b). Lastly, cultural difference may lead to the difference in support utilisation in the US compared to China. As emphasised by Xiao (1994), support utilisation should be taken into account in the the assessment of social support because people might not make use of support effectively despite being provided with much support. Taylor et al. (2004) has pointed out that Asians make less use of social support than Westerners, because Asian cultural norms emphasise maintaining harmony within social groups so that seeking support might risk disturbing harmony by making inappropriate demands on the group or burdening the social networks. In this study, the findings revealed that most of the participants never or rarely attended social activities (84.1%), and approximately half of the participants never or rarely asked for help or confided when they were in trouble (46.1% and 52.4%). The lower level of support utilisation may further explain the lower level of overall social support of older people living alone in Chongming. In summary, the overall social support level of older people living alone in Chongming was relatively low due to their reduced sources and less utilisation of social support. The reported overall social support differed across the participants with different socio-demographic characteristics. The finding that people with advanced age reported a lower level of social support was consistent with those of other studies (Li et al. 2008, McLaughlin et al. 2011). This may be explained by less social contacts and social interactions and reduced sources 230 of social support with increasing age. Older people who had a higher level of education may have better communication and social interaction skills, and are better able to utilise social support. In addition, they are more likely to have a higher economic level arising from their occupation. This enables access to social activities, extends social networks and provides more opportunities to receive services of value to them. Moreover, older people with a higher socio-economic status and living in urban areas in China can receive more formal support because most non-peasants and urban residents can be enrolled in the social security system and directly benefit from the Government support. However, the coverage of the social security system is limited in rural areas. The system does not apply to each peasant either (Liu 2009). Even if rural residents or peasants are enrolled in the social security system, the benefits that they received are very low. In light of the possible explanations outlined above, the participants who had a higher level of education, were not peasants, had a higher economic level and lived in the urban areas reported a higher level of overall social support. 6.4.4 Physical activity The current study found that 16.7% of the participants undertook adequate physical activity as defined performing a minimum of 30 minutes of moderate or strenuous exercise on at least five days a week, much lower than that of previous studies. For example, in some studies regarding physical activity of Chinese older people, 33.3%-46.6% of the participants reported that they engaged in adequate physical activity (Du & Li 2012, Ku et al. 2009, Wei 2007, Zhou et al. 2011). In Giuli et al.’s (2012) study, 56.2% of the older people aged 65 years and above in Italy who performed non-sedentary recreational activities equal to or more than one hour per week were identified as 231 physically active. The differences in prevalence of adequate physical activity between this study and previous studies may be attributed to the different samples, measurements and assessment criteria. However, the prevalence was also lower compared to those reported in some studies using the same criterion of adequate physical activity. Persson and While (2012) recruited 225 older people aged 60 years and above from 10 venues in the UK and found that 48.0% were physically active. In another study conducted in Australia (Lim & Taylor 2005), 48.9% of the older people who were 65 years and older reported adequate physical activity. In addition, it is noteworthy that 89.4% of the participants spent more than 30 minutes per day doing sitting activities at least one day per week. Giuli et al. (2012) pointed out that older people might underestimate the need for physical activity despite the recognized health benefits of adequate physical activity. They were inclined to spend more time in sedentary activities, which resulted in physical inactivity. Moreover, 8.2% of the participants never walked outside their home for more than half an hour. Walking has been reported as being related to physical activity with older people walking outside home for any reason being likely to perform more physical activity (Persson & While 2012). Thus, these findings suggest that the physical activity level of older people living alone in Chongming was low. There were significant relationships between physical activity and age, gender and education level. The finding that the adequacy of physical activity decreased with increasing age was consistent with those reported in other studies (Chad et al. 2005, Giuli et al. 2012, Lim & Taylor 2005, Persson & While 2012). A decline in physical activity has been regarded as an 232 age-dependent occurrence due to the decline in physiological function (Giuli et al. 2012). Similar to other studies (Chad et al. 2005, Du & Li 2012, Ku et al. 2009, Lim & Taylor 2005), the prevalence of adequate physical activity was higher in older men. It may be because men engage more actively in recreational activity, while women tend to adopt a sedentary lifestyle (Giuli et al. 2012). Another possible explanation may be that women had a lower level of education (p<0.001). The significant relationship between physical activity and education level was found in this study with older people having a higher level of education being more likely to report adequate physical activity. This may be related to better knowledge of the benefits of adequate physical activity and being more likely to adopt a healthy lifestyle among people who have a higher level of education. 6.4.5 Health services Health services utilisation In contrast to previous research which was discussed in Chapter 2, where it was noted that Chinese older people had a low rate of health services utilisation, this study found a high rate of health services utilisation with all participants seeking health services when they were sick. The possible explanation for such a high rate may reflect the improved social health insurance coverage. The social health insurance system in China consists of three major programmes: the Urban Employee Basic Medical Insurance (UEBMI) covering urban employees in both public and private sectors, retired workers and laid-off workers; the Urban Resident Basic Medical Insurance (URBMI) 233 covering urban residents without formal employment; and the New Rural Cooperative Medical Scheme (NRCMS) for rural residents (Liu & Zhao 2012). Although the information regarding the social health insurance system was not collected in this study, the results from two studies conducted in Shanghai showed that more than 90.0% of older people enlisted with the social health insurance system (Miltiades & Wu 2008, Xu et al. 2007). Health insurance is often related to the affordability of health care services. Liu et al. (2007) found that older people who worried about health care costs were more likely to be uninsured. Difficulty in affording health care services has been regarded as the major barrier to the utilisation of health services (Bo 2001, Liu et al. 2007, Ou & Zhu 2000, Yang et al. 2008). Furthermore, many studies have confirmed that health insurance significantly affected health service utilisation (Miltiades & Wu 2008, Wagstaff et al. 2009). Therefore, it could be argued that the high rate of enrolment for the health insurance in Shanghai made it possible for older people to afford basic health care and so increase access to health services. It is also possible that the development of the primary health care system has had an effect upon health services utilisation. In the widely used behaviour model of health services utilisation, the health care system including health policy, resources and organizations served as an enabling factor which facilitated or impeded the use of health services (Andersen 1995). China is promoting the development of a primary health care system of “grassroots providers” by strengthening the quality and funding for community hospitals and launching a new programme for community doctors to improve their professional capacity (Eggleston 2012). A substantial number of people have realised the advantages of visiting community hospitals such as the relatively low health services costs, shorter waiting times and being closer to home. In 234 this study the majority of the participants (49.4%) chose to attend community hospitals when they were sick, similar to some other studies (Xu et al. 2007, Yang et al. 2008). Xu et al. (2007) suggested that building community hospitals could help to increase access to health services and lower costs for health care thereby decreasing barriers to health services utilisation. Thus the improved access to primary health care may have increased the likelihood that older people would utilise health services. Health services satisfaction Approximately two thirds of the participants (63.9%) were satisfied with their health services and only 1.5% of them were dissatisfied. Health services satisfaction is related to the extent to which people’s health services needs were met (Joseph & Nichols 2007). It reflects older people’s assessment of various aspects of their experience in health services including convenience, financial accessibility, humanness of staff, availability of care, quality of care and condition of facilities (Joseph & Nichols 2007). According to this definition, the findings suggested that the majority of the participants had their needs met in terms of many dimensions of health services. Moreover, the high services utilisation rate appeared to corroborate the findings. The health services satisfaction differed across the different occupational groups and economic levels with financial status playing an important role in the participants’ health services satisfaction, especially in the context of high and rising health care costs in China. Although the peasants can be enrolled in the NRCMS and the blue collar workers and non-manual workers are covered by the UEBMI, their benefit packages are different. The NRCMS is voluntary and has lower premiums and less generous benefit packages than 235 the UEBMI (Eggleston 2012). In contrast, the UEBMI is mandatory and financed by the Government, employers and employees with different proportions of contributions respectively. People who have a higher salary can get more subsidies from the insurance scheme. Older people who were non-manual workers therefore received more benefits while the peasants had to pay more out-of-pocket expenses. Obviously, older people who were engaged in non-manual occupations and had higher economic levels were more likely to be able to afford health-care costs and access to better health services thus reporting greater satisfaction. 6.4.6 Housing The majority of the older people (69.8%) in this study were satisfied with their dwelling conditions suggesting a good overall satisfaction in this sample. The result was consistent with those in previous studies which highlighted that older people had a relatively high level of dwelling satisfaction (Lee 2005, Perez et al. 2001, Rioux & Werner 2011). For example, Perez et al. (2001) reported that more than 85.0% of Spanish older people were satisfied with their housing. In Lee’s (2005) study, 63.3% of older people living alone in Hong Kong expressed satisfaction with their residential environment. Rioux and Werner (2011) reported that the dwelling satisfaction among 108 French people aged 72-86 years old was high with a mean score of 3.4 on the five-point dwelling satisfaction scale. The high satisfaction level in this study may be related to the high rate of home ownership (99.0%). Possessing and living in own housing gives older people a greater control over decisions regarding their home and has been identified as a predictor of dwelling satisfaction (Perez et al. 2001). Phillips et 236 al. (2004) have also argued that older people living in the public housing detached themselves from their living environment because they did not think that the housing was their property. Additionally, several studies (Perez et al. 2001, Windley & Scheidt 1983) have revealed that satisfaction with some housing attributes such as dwelling size, comfort of kitchen and bathroom, and location had a significant impact upon dwelling satisfaction. In this study, most of the participants were satisfied with the dwelling size, distance from their children or relatives, kitchen and bathroom, thus leading to a high satisfaction with their dwelling conditions. Moreover, the high satisfaction level of dwelling conditions may reflect the ability of older people living alone to adapt their environment to the desired living environment. The experience of living alone might render older people a sense of mastery over the social and living environments, thereby improving their satisfaction with dwelling conditions (Lee 2009). However, it is noteworthy that less than half of the participants (48.2%) were satisfied with the convenience of public transport. In Chongming, the bus is the only public transport mode. Bus stops are situated on the main roads which are far away from many people’s houses especially those in the rural areas. Older people have to walk a long distance and wait for long-intervals between buses. The inconvenience is exacerbated by physical frailty and reduced mobility with ageing. It is not surprising that the participants were least satisfied with the convenience of public transport. The socio-demographic factors related to the satisfaction with overall dwelling conditions were gender, previous occupation, economic level and residential area. The finding that women were more likely to report satisfaction has been echoed in other studies (Lee 2005, Perez et al. 2001). Perez et al. (2001) 237 interviewed a stratified random sample of 1148 older people aged 65-84 years old and living in Spain regarding their dwelling satisfaction. They found that female was a significant predictor of a higher dwelling satisfaction. Perez et al. (2001) pointed out that older women tended to be more strongly tied to their home because traditionally they spent more time at home and attached greater importance to their living environment. Being a peasant or having a lower economic level is a proxy of low socio-economic status which is usually related to poorer housing conditions and the lack of housing amenities. Therefore, the participants who were peasants and in the lower economic level groups were less satisfied with their dwelling conditions. The effect of residential area upon the satisfaction with dwelling conditions may be due to the fact that most of the rural residents were peasants with a lower economic level. In addition, the inconvenience of public transport in the rural areas may be another possible explanation. 6.4.7 Quality of life Less than half of the participants (45.3%) reported a good or very good overall QoL. The mean score of the OPQOL was 118.8 (figure was not reported in Chapter 4), lower than that of 560 British older people (M=134.7) aged 65 years and above (Bowling 2009). The results suggested that the QoL of older people living alone in Chongming was lower. A growing body of literature has investigated the effect of living alone upon older people’s QoL. In contrast to this study, Bilotta et al.’s (2012) study found that the overall QoL of older people living alone was similar to the QoL of older people living with others. While, this study’s finding is in agreement with 238 those of other studies regarding QoL of Chinese older people. For example, Lin et al. (2008) reported that the QoL of older people living alone in Taiwan was lower compared with the Taiwan adult population norm. Wang (2009) recruited 644 rural older people aged 60-97 years old living in one province in Mainland China to investigate their QoL across different living arrangements. He found that those living alone reported the lowest QoL. Moreover, Chinese older people living alone in Canada were identified as at risk of lower QoL compared with their Canadian counterparts (Gee 2000). This difference may be due to the difference across societies in expectations and obligations associated with the roles for family members (Chen & Short 2008). In many Western countries, it is the norm for older people to live separately from their adult children. They continue to live alone after their spouse passes away as long as they can care for themselves (Chou & Chi 2000). A trend of older people living alone has been observed over the past forty years (Gee 2000). Whereas, the strong normative expectation in China is that older people living together with and being looked after by their adult children. Multi-generational living is often regarded as an optimal happiness. Therefore, living alone may be less desirable for Chinese older people. A qualitative study with 19 Chinese older people living alone in Singapore (Wong & Verbrugge 2009) found that the majority of the participants (63.0%) were forced to live alone because of being widowed, having no children or being estranged by their children. In a study conducted in Mainland China, more than 80.0% of the older people who lived alone reported that they would have liked to live with their family members, suggesting that the living alone was forced rather than chosen (Chen & Short 2008). Although some researchers (Chen 2007, Gee 2000) have claimed that Western views have influenced and diminished traditional Chinese values, the Confucian thoughts and family 239 togetherness are still entrenched. For example, most participants (85.2%) in this study agreed that having children around was important to them. Therefore, it could be argued that living alone had a negative effect upon Chinese older people so that the participants in this study reported a lower overall QoL. Furthermore, it is worth noting that most of the participants would have liked more companionship or more people to enjoy life with (77.5% and 75.4% respectively) although they agreed that their family, friends or neighbours would help them if needed and they had someone who gave them love and affection (84.5% and 81.0% respectively). These findings suggested that the participants were less satisfied with their social relationships within their QoL because these four items were allocated in the “social relationships” dimension of the Chinese OPQOL. On the other hand, it further reflected the feeling of loneliness of the participants. Family members, friends or neighbours could give them help and love, but this kind of support was not enough to meet all that they desired, which was demonstrated by the finding that their overall social support level was low. It may also be that their social contacts with other people were less meaningful or close. It has been argued that one can feel lonely in the presence of others because the quality of the network is more important than the quantity of contacts (Beal 2006). In light of these possible reasons, the participants were not satisfied with their social relationships and expressed the feeling of loneliness. In addition to social relationships, financial status was another dimension relating to their QoL with which many participants were less satisfied. Most of them reported that they did not have enough money to pay for household repairs or help needed in the house (73.5%), the cost of things restricted their 240 life (71.2%), they did not have enough money to afford health-care expenses (59.7%) or to do things they would enjoy (56.2%). Compared with older people who lived with others, older people living alone are likely to receive less financial support and report more financial strain (Chou et al. 2006, Zhong 2004). Living alone is also identified as one predictive factor of poverty of older people in the UK (Rolls et al. 2010). The economic deprivation may be more noticeable in the current context in China, where the rapid economic changes and increasing inflation have resulted in the rise of cost of living (Tong et al. 2011). Together with the immature pension scheme and low income, older people living alone might have to face more challenges to make ends meet. Their financial problems were also identified by the results that 13 of the 16 participants who provided additional information regarding their experiences of living alone expressed the hope that their pension would be increased. In summary, older people living alone in Chongming reported a lower QoL, especially in two specific aspects, namely, social relationships and financial circumstances. 6.5 Factors related to quality of life of older people living alone The second objective of this study was to explore the significant factors related to QoL of older people living alone in Chongming, Shanghai. Most health and life circumstances variables and socio-economic variables were significantly associated with QoL in the bivariate analyses. Moreover, the results of the multivariate analysis revealed that approximately 70.0% of the variance in QoL could be explained by nine independent variables including satisfaction with overall dwelling conditions, self-rated health, functional ability, 241 depression, economic level, social support, loneliness, previous occupation and health services satisfaction (R2=0.688). Considering that QoL is a multi-dimensional and complex concept, the amount of variance is large. 6.5.1 Satisfaction with overall dwelling conditions The finding that satisfaction with overall dwelling conditions had an important effect upon QoL was supported by previous research which was conducted in different areas or countries such as Hong Kong, Spain and the UK (Lee 2005, Perez et al. 2001, Phillips et al. 2005, Smith et al. 2004). Furthermore, satisfaction with dwelling conditions was the strongest predictor of QoL with older people being satisfied with their dwelling conditions reporting a higher QoL. It suggests that housing played a vital role in the QoL of older people living alone in Chongming and as in other studies this finding may reflect the importance of place (Macintyre et al. 2002) and its halo effect upon individuals and their overall QoL. As older people tend to have more restricted spaces than younger people, they are more likely to remain at home and spend much time there (Phillips et al. 2005). Having adequate housing with essential and satisfactory facilities may provide a sense of security, stability and attachment. In the Chinese context, having no place to live is one of the worst scenarios in old age (Tong et al. 2011). In contrast, adequate housing brings a sense of pride and achievement to many older people. Therefore, older people’s perceptions of their dwelling conditions tend to exert a major impact upon their QoL. In addition, for those who live alone, satisfaction with dwelling conditions may reflect their ability to deal with their living environment. In Lee’s (2009) survey of older people living alone in Hong Kong, many participants stated that 242 “having a satisfactory living environment” or “having an adequate place to live until death” implied a high QoL. In light of these possible explanations, satisfaction with their dwelling conditions had the strongest effect upon the participants’ QoL. Thus the current study suggests the improvement of older people’s satisfaction with their dwelling conditions may be an alternative approach to enhance their QoL. 6.5.2 Self-rated health The importance of health to older people is undoubted. In health services research, health is often regarded as equivalent to QoL (Farquhar 1995). Self-rated health was one of the indicators used in this study to measure the participants’ health status. It was significantly associated with QoL in the bivariate analysis and was the second most important predictor identified in the multivariate analysis, with older people with better self-rated health reporting a higher QoL. The results corroborated previous findings derived from studies conducted in Korea, Malaysia, China and other countries (Lee et al. 2006, Woo et al. 2005, Yahaya et al. 2010, Zhang et al. 2008). For example, 202 Brazilian and 288 Canadian older people aged 60 years and above were randomly recruited to investigate their QoL with self-rated health being an important predictor of QoL in both samples (Paskulin & Molzahn 2007). In a convenience sample of 420 Canadian people aged 60-99 years old, self-rated health was reported to directly affect QoL in a pathway model (Low & Molzahn 2007). It is noteworthy that several indicators including physical health, mental health and functional ability were also used to assess health status. However, self-rated health appeared to be a better predictor of QoL compared with 243 other objective indicators. This echoed Angner et al.’s (2009) findings which showed that poor self-rated health was one of the predictors of low QoL while the presence of some chronic diseases and the number of chronic diseases did not have a predictive impact upon QoL. A possible explanation may be that older people tend to adapt to illness as time goes on, because most of them suffer chronic diseases with ageing. Lau et al. (1998) also claimed that older people had accepted the fact that old age was generally accompanied by illness and physical discomfort. From this perspective, it could be argued that the participants in this study who rated their health as good might report a high QoL despite having chronic diseases or somatic complaints. 6.5.3 Functional ability Functional ability was another health-related factor identified as independently associated with OoL of older people living alone in this study. The participants who reported a higher level of functional ability were likely to report a higher QoL. Similar findings have been reported in previous research in a variety of countries (Chan et al. 2006a, Lee et al. 2006, Paskulin et al. 2009). Good functional ability is a sign of self-maintenance which helps older people to maintain social contact with the outside world and participate in social activities, and promotes their experience of life (Lee 2005). Being able to do these things gives meaning to older people’s lives and consequently improves their QoL. More importantly, as the participants in this study lived alone, a high level of functional ability enabled them to stay living independently, thus playing a vital role in maintaining their QoL. In addition, older people having a poorer functional ability are more likely to depend on other people, such as family members or other care-givers, in their 244 daily lives. This reduces freedom, autonomy and self-efficacy which are particularly important to older people. Being independent was ranked the second most important factor influencing QoL among 584 older people aged 65 years and above in Taiwan (Hsu 2007). In that study, many participants reported that, having good physical function and being able to take care of themselves were important in old age, which allowed them to avoid becoming a burden of other people. The dependence in ADLs may also decrease self-esteem and consequently lower the QoL, especially when abilities to perform some PSM activities, such as feeding, dressing and toilet use, are disrupted. In Angner et al.’s (2009) study in the US, there were no relationships between QoL and objective health measures except for urinary incontinence which was regarded as being associated with stigma. Thus, it is suggested that improving functional ability might be an effective strategy to improve older people’s QoL. 6.5.4 Depression and occupation Consistent with previous international research (Brett et al. 2012, Chachamovich et al. 2008, Chan et al. 2006a, Chou & Chi 1999), this study revealed that depression had a relationship with QoL and was a predominant factor contributing to low QoL. Some depressive symptoms such as lack of the ability to enjoy life, difficulties in concentration, reduced energy, somatic discomfort and the lack of goals and hope affect many aspects of peoples’ lives and consequently reduce their QoL (Chan et al. 2006b). Additionally, depression-associated negative mood might cause the participants to perceive their QoL negatively thus resulting in a low reported QoL (Shmuely et al. 2001). 245 Notably, there was an interaction effect between depression and previous occupation upon QoL, which has not been reported previously. Some studies have revealed that older people who were in professional occupations before retirement were likely to have a higher QoL (Ning et al. 1999, Qian & Zhu 2004) due to their higher socio-economic status compared with those who were in manual occupations. This was confirmed in the non-depressed group in this study with the non-manual workers reporting the highest QoL while the peasants reporting the lowest QoL. However, in the depressed group, the peasants reported the highest QoL. One possible explanation for this finding is that the peasants were more likely to be content with their lives and had lower expectations of their QoL. The social comparisons and expectation theory indicates that a person’s appraisal of QoL is based on the discrepancy between past experience, current circumstances and aspirations for the future (Brown et al. 2004). According to this theory, people whose perceived gaps between what they have at present and what they had in the past are smaller are likely to assess their QoL better. Therefore, when the QoL was affected by depression, the decline in the peasants was less significant, due to their smaller “previous-real gap”, than those in the blue-collar workers and non-manual workers. Thus, the depressed peasants reported a higher QoL. 6.5.5 Economic level A number of studies in China have related economic level to QoL (Jia et al. 2004, Zhang et al. 2008, Zhao et al. 2009, Zhou et al. 2011). Similarly, a few studies in Israeli, Tanzania, India and the UK have identified a relationship between economic level and QoL (Litwin 2005, Mwanyangala et al. 2010, Netuveli et al. 2005, Siddhivinayak et al. 2010). This also emerged in the current study with the participants’ QoL being different across the different 246 economic level groups in the bivariate analysis. Moreover, the multivariate analysis indicated that economic level was one of the predictors of QoL. This finding contrasted with Lee’s (2005) study where economic status was significantly associated with QoL in the bivariate analyses but was not identified as a predictor of QoL. This discrepancy may be attributed to the socio-economic difference between the two samples. The participants in Lee’s study were recruited from public housing estates in an urban area of Hong Kong and majority of whom reported that they had enough or more than enough money to support their daily expenses. In contrast, the participants in this study reported lower economic levels and were not satisfied with their financial circumstances. Thus, the finding further confirmed the importance of economic status to QoL of older people living alone in Chongming. A lower level of economic status can exert strong negative effects upon older people by impairing their confidence in life, lowering self-esteem, reducing coping resources and deepening negative experiences and eventually lead to a lower QoL (Zhang et al. 2008). In this study, it might also negatively affect QoL by increasing the risk of depression (p<0.001), lowering self-ratings of health status (p<0.05) and decreasing the satisfaction with dwelling conditions (p<0.01). Notably, however, there was no statistical difference in the reported QoL between the medium-high and high economic level groups. A possible explanation for this may be that economic status influences QoL only at the poverty level (Cai 2004, Zhang et al. 2008). Once people’s basic needs are met, the effect of economic status is less influential. 6.5.6 Social support Similar to previous studies both in China (Deng et al. 2010, Huang et al. 2005, 247 Liu & Guo 2008) and other countries such as Nepal, Israel and the UK (Charlis et al. 2007, Litwin 2005, Netuveli et al. 2006), this study showed that social support was an important factor related to QoL with the participants reporting a higher level of social support having a higher QoL. It suggests that enhancing overall social support for older people living alone might be an effective way to improve their QoL. However, this study has revealed a generally low level of social support for the participants, which calls for strategies to improve their social support level. Additionally, the different impacts of different social support sources upon QoL need consideration. As has been discussed, support from family members is an especially important factor within the Chinese context. In Deng et al.’s (2010) study, family support and non-family support were both correlated with QoL of older people in China based on the results of a correlation analysis. However, only family support remained in the linear regression model. That study emphasised the vital role that family support played in maintaining older people’s QoL. Keeping the family in harmony is the most important goal for the Chinese, especially for people of older generations (Leung et al. 2007). Support from family members can comfort older people, reduce psychological distress and help them have a more positive attitude towards later life. Obviously, seeking strategies to effectively exert the impact of family support is one of the important steps to improve the QoL of older people living alone. However, it should be noted that living alone is likely to cause older people to receive weakened and non-immediate support from family members. This points to the need to seek potential support sources beyond family members to improve the social support level of older people living alone. 248 6.5.7 Loneliness Loneliness was significantly associated with QoL in the bivariate analysis. It was also an important predictor of QoL of older people living alone with those having a higher level of loneliness reporting a lower QoL. These findings resembled those of previous studies regarding the relationship between loneliness and QoL (Chen & Huang 2005, Ekwall et al. 2005, Lim & Kua 2011). For example, amongst a random sample of 107 Chinese older people aged 60 years and above, Chen and Huang (2005) found that the score on the RULS-V3 (Russell 1996) was negatively correlated with the score on each dimension of the SF-36 (Ware & Gandek 1998), indicating a negative relationship between loneliness and QoL. In a study in Sweden, Ekwall et al. (2005) found a predictive effect of loneliness upon QoL within 4278 older people. Lim and Kua (2011) found that loneliness was a strong contributor to a lower QoL in their prospective cohort study in Singapore. Interestingly, however, the score on the UCLA Loneliness Scale (Russell et al. 1980) did not correlate with the QoL score in a convenience sample of 60 older chronically ill Appalachians (Theeke et al. 2012). While loneliness, as measured by a single-item question asking whether the participants felt lonely for most of the past week, was significantly negatively correlated with QoL. This discrepancy can be attributed to the difference in the measurement of loneliness. Loneliness is identified as a social stigma in Appalachia which resulted in a low rate of self-identification of loneliness but a moderately high score on the UCLA Loneliness Scale (Russell et al. 1980). In other words, the presence or not of loneliness may be a more sensitive indicator to identify the relationship between loneliness and QoL in the context of Appalachian culture, compared with the severity of loneliness. So far, the utility of approaches to measure loneliness has been controversial (Victor et al. 2005b). Regardless 249 of the different measurements used across different studies, loneliness was consistently identified as an important factor related to low QoL of older people. Furthermore, in Liu and Guo’s study (2008), loneliness was a predictor of low QoL among 275 older people who lived alone, while it was not a predictor of QoL among 315 older people who lived with their children. It is suggested that the effect of loneliness upon QoL appeared to be stronger in older people living alone. As the participants in this study reported a moderate level of loneliness, the findings imply a need to reduce loneliness in order to improve their QoL. 6.5.8 Health services satisfaction This study found that there was a significant relationship between health services satisfaction and QoL. Being satisfied with the health services was also a predictor of higher QoL although it explained a small amount of variance. A possible explanation for these findings may be that older people who were satisfied with their health services were more likely to perceive that they had received effective care which could improve their utilisation of health services and adherence to treatment regimens, and consequently tended to recover more easily from health problems and reported a higher QoL (Ruggeri et al. 2005). Another possible explanation is that satisfaction with the health services is a good proxy for subjective health perception, which has been supported in some studies (Joseph & Nichols 2007, Ruggeri et al. 2005). Therefore, it is suggested that older people who reported satisfaction with their health services had better self-rated health, and consequently reported a higher QoL. It is also possible that those who reported a higher QoL had 250 better access to health care and received higher quality health services, so that they were more likely to be satisfied with their health services. Although the correlational survey design does not enable investigation of the causal relationship between health services satisfaction and QoL, the multivariate analysis in this study has demonstrated that health services satisfaction is an independent factor related to QoL. 6.5.9 Other related factors of quality of life The results of the bivariate analyses indicated that the majority of the variables which were measured in this study were associated with QoL. This confirmed previous findings that QoL is influenced by a variety of factors (Smith et al. 2004, Zhu & He 2005). However, age, education level, residential area, the presence of chronic diseases, the presence of acute diseases, cognitive function and physical activity were not significant in the multivariate analysis, which suggested that these variables might be of minor importance for and not better predictors of QoL of older people living alone in Chongming. Age, education level and residential area This study found that age had a negative relationship with QoL with the “oldest old” reporting the lowest QoL and the “young old” reporting the highest QoL, which was similar to the results in many previous studies (Jia et al. 2004, Lee 2005, Zhao et al. 2009). However, this finding was contrary to those of Paskulin et al.’s (2009) study and Woo et al.’s (2005) study where older people with advanced age reported a higher QoL. Part of the explanation may rest with the different samples and measurements of QoL. In addition, Paskulin et al.’s (2009) findings need to be interpreted with caution, as age 251 was found to have an interaction with functional ability. Therefore, the relationship between age and QoL in that study should take into account the effect of older people’s functional dependency. The participants in Woo et al.’s (2005) study were recruited from those who remained in a three-year follow-up survey, which may have reflected a survivor effect. Woo et al. argued that older people with advanced age in their study might have less morbidity and have accepted the ageing process, and thus reported a higher QoL. The finding that age was not a significant predictor of the participants’ QoL was supported by Zhang et al. (2008), who found that the QoL of older people differed across the age groups but age did not qualify for the regression model. Further, Zhang et al. reported that age exerted an impact upon QoL via income and education level. In this study, there was a relationship between age and depression, functional ability, self-rated health, loneliness and social support. Therefore, it is possible that the relationship between age and QoL was the result of the relationship between depression, functional ability, self-rated health, loneliness and social support and QoL. In other words, it is not age itself but the higher prevalence of depression, more ADL dependencies, poorer self-rated health, higher levels of loneliness and less social support with ageing induced a lower QoL. The bivariate relationship between education level and QoL of older people has been widely investigated (Jia et al. 2004, Litwin 2005, Zhao et al. 2009). It was also emerged in this study with older people having a higher level of education reporting a higher QoL. However, the significant bivariate relationship disappeared in the multivariate analysis, which mirrored the findings of Litwin (2005) who found that, when other variables were taken into 252 consideration, education level was less influential. Education level, occupation and economic level are usually regarded as markers of socio-economic status. The latter two variables were identified as predictors of QoL in this study. The analysis indicated that occupation and economic level might be stronger factors which influenced the QoL of older people living alone in Chongming when compared to education level. In addition, education level had a relationship with depression, functional ability, self-rated health and social support in this study. It may be that these variables explained the difference of QoL across the different education levels. This study revealed that residential area was related to QoL with older people living in the urban areas reporting a higher QoL than their rural counterparts. Such a finding was similar to those reported in some studies which were conducted in China (Lin et al. 2008, Qian & Zhou 2004, Zhou et al. 2011). The urban-rural inequality in socio-economic status has been identified as the major reason for the difference in QoL (Qian & Zhou 2004, Zhou et al. 2011). Rural older people in China usually have less income, fewer opportunities to good jobs resulting in poorer access to health care and lower pensions, and lower levels of education. It was also reflected in this study with rural residents being more likely to report a lower level of monthly income and be peasants (p<0.001). In addition, the participants living in the rural areas were more likely to report depression, a higher level of loneliness, a lower level of social support and dissatisfaction with their overall dwelling conditions. However, in contrast to the findings of Lin et al. (2008) and Qian and Zhou (2004), the residential area was not a predictor of QoL in this study. This may have been because the effect of residential area upon QoL was mediated by economic level, depression, loneliness, social support and satisfaction with overall dwelling conditions. 253 In summary, this study showed that age, education level and residential area, as socio-demographic variables, had a limited impact upon the QoL of older people living alone, which has been supported by the studies in German and the UK where socio-demographic variables accounted for less variance of QoL (Kunzmann et al. 2000, Smith et al. 2004). The presence of chronic diseases, the presence of acute diseases and cognitive function These three variables reflect the participants’ health status. Older people who reported having chronic and acute diseases and had intact cognitive function reported a higher QoL according to the results of the bivariate analyses. However, they had no predictive impact upon QoL, which was consistent with the findings of some other studies (Angner et al. 2009, Chan et al. 2006a). As self-rated health was identified as a predictor of QoL in this study, it could be argued that this factor was a better health-related variable influencing the QoL of older people living alone compared with the presence of chronic or acute diseases and cognitive function. Previous studies have recognised the importance of subjective evaluation, and have suggested that subjective health measurement, i.e. participants’ own ratings of their health status, is a better predictor of QoL than objective measurements such as the number of illnesses and physicians’ ratings (Michalos et al. 2000, Smith et al. 2004). Older people who suffer illnesses may rate their QoL as good by experiencing improvements in other dimensions of QoL or assigning greater weight to other dimensions (Angner et al. 2009). Angner et al. (2009) also argued that the presence of diseases played a limited role in or had a short-term impact upon the perception of QoL only after the diagnosis of the disease. 254 Additionally, the SPMSQ (Pfeiffer 1975) was administered to detect poor cognitive function of older people and those who failed the test were excluded from this study so that the sample only comprised participants having intact cognitive function and mild cognitive impairment. This may explain why cognitive function was not a significant predictor of QoL in this study. Physical activity The bivariate analysis in this study showed that physical activity was related to QoL with those participants engaging in adequate physical activity reporting a higher QoL. Many studies in different countries such as the US, Korea and Spain have reported the positive relationship (Acree et al. 2006, Lee et al. 2006, Salguero et al. 2011). Rejeski and Mihalko’s (2001) literature review of physical activity and QoL in older people also concluded that physical activity, in the form of endurance or resistance training exercise, positively influenced QoL by improving the perception of physical function and strengthening self-esteem. However, contrary to earlier findings (Acree et al. 2006, Lee et al. 2006, Rennemark et al. 2009), this study did not find that physical activity was independently related to QoL. It is possible that physical activity influenced QoL indirectly through other factors such as functional ability, depression and self-rated health. The beneficial effects of physical activity upon physical health and functional ability in older people have been widely recognised (World Health Organization 2005, Landi et al. 2007). In addition, many studies have noted its preventive effects upon depression or cognitive impairment (Lautenschlager et al. 2004, Rovio et al. 2005). Moreover, Rennemark et al. (2009) suggested that physical activity could generate social interactions which resulted in a feeling of support. In this 255 study, the participants who reported adequate physical activity were found to be more likely to have a higher level of functional ability (χ2=34.5, p<0.001), rate their health as good (χ2=27.3, p<0.001) and report a higher level of social support (χ2=23.1, p<0.001), and be less likely to have depression (χ2=3.9, p<0.05) (figures were not reported in Chapter 4). Therefore, functional ability, depression, self-rated health and social support might be important mediators between physical activity and QoL. 6.5.10 A brief summary of related factors of quality of life of older people living alone in Chongming Some important predictors of QoL which emerged in this study, such as self-rated health, functional ability, economic level, social support and loneliness, were similar to those reported in previous research despite social and cultural differences, albeit to different degrees. It seems that these factors are universally important to older people’s QoL. In contrast, the finding that satisfaction with overall dwelling conditions was the strongest predictor of QoL of older people living alone was seldom addressed in studies regarding QoL of older people in China. Additionally, the interaction effect between depression and previous occupation upon QoL was reported here for the first time. In addition, age, education level, residential area, the presence of chronic diseases, the presence of acute diseases, cognitive function and physical activity had some relationships with QoL, although they were not significant in the multivariate analysis. 6.6 Chapter summary Based on the study findings, this chapter first discussed the reliability and 256 validity of the Chinese OPQOL. Further, the profile of older people living alone in Chongming, including their socio-demographic characteristics, physical health, mental health, functional ability, self-rated health, loneliness, social support, physical activity, health services utilisation and satisfaction and housing, were interpreted. Finally, the factors related to QoL were discussed. 257 CHAPTER 7 CONCLUSION 7.1 Chapter introduction This chapter begins with the summary of major findings and discussion against study objectives. The contribution of the study is discussed followed by the critique of study design and methods. In addition, the implications for practice and policy are considered. The chapter ends with recommendations for further research. 7.2 Synthesis of major findings and discussions against research objectives Within the context of global population ageing and family fragmentation due to migration and immigration of younger people, older people are more likely to live alone. Those living alone are of special interest as they may be at higher risk of a lower QoL and the need for long-term health and social care services, especially in China where family ties and filial piety are championed. However, studies regarding older people living alone in Mainland China are limited. In order to explore the health status, life circumstances and QoL of older people living alone, a questionnaire survey was carried out. A total of 521 older people living alone in Chongming County of Shanghai were recruited to this study using a stratified random cluster sampling technique, representing a response rate of 95.9%. This study found that older people living alone had a lower level of education 258 and poorer financial status, reported poorer cognitive function, a lower level of social support and a lower level of physical activity, and were more likely to have depression and loneliness. Further, they reported a lower QoL but their functional ability and self-rated health did not seem to be poor. In addition, they reported a higher level of health services utilisation and health services satisfaction and higher satisfaction with their overall dwelling conditions. On the whole, these findings imply that older people living alone in Chongming are a disadvantaged group requiring particular attention. Based on the study findings, an explanatory model of the QoL of older people living alone has been developed. The higher explained variance (68.8%), in comparison with those reported in other studies (21.0%-66.0%) (Halvorsrud et al. 2010), suggested a good model for explaining QoL of older people living alone. The development and utilisation of a QoL model may help health and social care providers and policy makers better understand the QoL of older people living alone, identify the groups who are vulnerable to lower QoL, address their needs, and develop suitable interventions to improve their QoL. This model suggests that satisfactory dwelling conditions, good self-rated health, a higher level of functional ability, less depression, less financial strain, more social support, less loneliness and satisfactory health services are key elements for improving QoL. Additionally, it is suggested that previous occupation should be considered simultaneously. The model also suggests that age, education level, residential area, the presence of diseases, cognitive function and physical activity could influence QoL through those key elements. 259 7.3 Contribution of the study Previous studies have examined the effect of living alone upon older people but their findings were inconclusive. Part of the reason may be the difference in cultural context. However, little attention has been paid to older people living alone in Mainland China. Little is known about their life experiences, especially their QoL which has become an important outcome measure in health services, the social sciences and many other fields. This study is the first to explore the health status, life circumstances and QoL of older people living alone in Mainland China. It adds substantially to the understanding of the impact of living alone upon Chinese older people and also underscores the importance of the provision of care for the fast-growing number of older people who are living alone in China. In addition, this study proposed an explanatory model of QoL which has not been reported in previous research. The model could potentially be used to inform effective strategies to enhance the QoL of older people living alone in China. Moreover, in order to investigate the QoL of the participants, the OPQOL which was developed in the UK was translated adopting Brislin’s (1970) translation model for cross-cultural research and modified to reflect the Chinese context. The Chinese version of the OPQOL was identified as an appropriate QoL measurement which could be used in China to assess older people’s QoL. Using this questionnaire made it possible to conduct cross-cultural studies and comparisons of the QoL of older people across different countries. 260 7.4 Critique of the study design and methods A correlational survey design was selected to explore the older people’s health status, life circumstances and QoL. This research design is good for collecting detailed information from large numbers of people in a timely manner (Borders et al. 2004). It also permits the description of relationships among a variety of variables at a fixed point. However, the causal relationships between the related factors and QoL cannot be identified. Additionally, the recognition of the change of QoL across different time spans is prohibited due to the study design. Nevertheless, this study provided comprehensive data regarding the health status, life circumstances and QoL of older people living alone in Chongming as a starting point for further research regarding older people living alone in Mainland China. The study was conducted in nine communities. Gaining access to and support from these communities was a primary priority, which was also a big challenge for this study. The researcher had been living in Chongming for more than 20 years and therefore had available and reliable resources within Chongming. After several visits to the committees of two selected towns to seek consent and support, this study was approved by and gained the support and cooperation from the heads of the town committees. The study findings were obtained from 521 participants which is a large sample. In the previous research, a small sample size was a common limitation and impeded the full exploration of variables which may influence QoL, as a suggested rule of thumb regarding the minimum sample size of regression model is that there should be 10-20 times as many cases as variables (Halvorsrud et al. 2010). Since the current study had a large sample size, it was possible to include all related factors of QoL of older people which 261 have been identified previously in the literature. Indeed, the finding of a substantial amount of variance in explaining QoL (68.8%) could be attributed to the relatively large number of included variables. However, despite the number of variables, other factors which may be related to QoL were not included in this study. Including more variables may explain more variance in QoL, for example, spiritual well-being, life satisfaction, self-esteem, negative life events and lifestyle variables (e.g. tobacco use and alcohol use). A stratified random cluster sampling technique was used in the study, which enhances the representativeness of the sample. Thus, the study findings could be generalised to all older people living alone in Chongming who are similar to the participants: community dwelling, having no communication difficulties and having good cognitive function. However, the findings may not be generalisable to other populations of older people who live in other districts of Shanghai or other geographical regions of China, because Chongming County is an agriculture-dominated and economically depressed district of Shanghai. That is, the study participants live in a more deprived area. Their demographic characteristics, health status, life circumstances and QoL might be different from those who live in less deprived areas. The instruments used were carefully selected, and most of them (the SPMSQ [Pfeiffer 1975], the ADL Scale [Lawton & Brody 1969], the 15-item GDS [Sheikh & Yesavage 1986], the RULS-V3 [Russell 1996], and the SSRS [Xiao 1999]) have been widely used in China with good reliability and validity. The reliabilities of these instruments were also tested in this study yielding satisfactory internal consistency (the Cronbach’s α coefficient being over 0.70) and excellent to good test-retest reliability (the ICC being over 0.60). In addition, an in-depth psychometric testing of the Chinese OPQOL was 262 conducted to measure its utility among older people living alone in China. The findings also showed that this instrument was valid and reliable. Utilisation of these validated instruments could enhance data quality and minimise measurement error. But it is recognised that the reliability of some dimensions of the Chinese OPQOL was not satisfactory and there were some loading problems of some items. This suggests that further refinement and testing should be carried out for its adaptation for use in China. This study used data collectors to assist with data collection. Selecting appropriate data collectors was an important issure identified through the process of data collection. Polit and Beck (2012) suggested some characteristics of data collectors which should be considered, namely: experience, congruity with sample characteristics, unremarkable appearance, personality and availability. Based on these criteria, 18 data collectors were selected on the recommendations of heads of town committees. They were selected from local communities, could speak both Mandarin and Chongming dialect and had prior experience of collecting data. Another important issue in the data collection process was selecting a suitable time to visit potential participants to distribute the information sheet and invite them to participate in the study. Considering that many older people might go out to play mahjong or poker in the afternoon, most visits were conducted in the morning. For older people who could not be contacted for the first time, data collectors revisited them at least once at different times of the day or on different days of the week. Most of the older people were successfully visited for the first time with a few being visited three times. A face-to-face interview was adopted to collect data, reflecting that the 263 participants might have difficulties in completing self-administered questionnaires due to deteriorating vision or low literacy. This mode of questionnaire administration is especially suitable for older people, because it is the least burdensome method with no expectations regarding reading skills and only required the participants to have basic verbal and listening skills (Bowling 2005). Moreover, the data collector could clarify any ambiguous question during the interview to minimise the response error. Additionally, the face-to-face interview has been reported to achieve higher item response rates which were demonstrated in this study with no missing data, and higher participants’ preferences (Bowling 2005). But it should be noted that people tend to give more socially desirable and positive responses and are more likely to apply “yes-saying” in face-to-face interview surveys (Bowling 2005, Halvorsrud et al. 2010, Kalfoss & Halvorsrud 2009). Furthermore, the interview style, characteristics of interviewers and interviewers’ competency can also influence the validity of the data (Kalfoss & Halvorsrud 2009). Therefore, a great effort was made to ensure that data collectors followed the research protocol to maintain the data quality. For example, all data collectors were carefully trained before data collection. They were asked to have a commitment to this study and its protocol and the importance of their adherence to the protocol was emphasized. Additionally each data collector’s first interview was monitored, and frequent contacts were kept with the data collectors throughout the data collection. The participants had the choice to complete the questionnaire themselves or with the help of data collectors using a face-to-face interview, although most of them preferred to be interviewed. As there were no records regarding the 264 mode of questionnaire administration, this study could not compare the differences of health status, life circumstances and QoL of older people who completed the questionnaires in different ways, which might cause information bias. It would be worthwhile to undertake the comparisons in future research. This study had a high response rate of 95.9% which strengthens the validity of the dataset. A lower response rate is one of the issues that survey research with older people usually encounters (Kelsey et al. 1989). Liu et al. (1997) reported a response rate of 64% in their study. In Phillips et al.’s (2005) study and Deng et al.’s (2005) study, the response rates were approximately 50%. Furthermore, Lai (2009) conducted a telephone survey amongst a sample of older people in Hong Kong and achieved a response rate of 21.7%. The very low response rate was probably due to the method of data collection (telephone survey) and the older people’s skeptical attitudes towards strangers (Lai 2009). The data collectors in this study were culturally in tune with the sample and most of them used face-to-face interviews to collect data, which may explain the high response rate in this study. The participants were given a small gift such as towel, tooth paste or washing-up liquid as a token of appreciation for their participation, which might also increase the response rate. As there were no data for those older people who declined to participate in the study, it was not possible to analyse the characteristics of participants in comparison to those of non-participants. Although the response rate is high in this study, non-response may bias the findings. Barriball and While (1999) found that there were statistically significant differences between non-participants and participants in terms of some key outcomes in spite of a 265 90.3% response rate. Moreover, many studies focusing on older people have shown that non-participants are more likely to be older, have lower literacy, poorer physical health and more mental health problems, and thus are more likely to have a lower QoL (Freudenstein et al. 2001, Tsai et al. 2007). Older people with poor cognitive function were excluded from this study so that their data regarding health status, life circumstances and QoL is unknown. This may have also biased the study findings, especially the effect of cognitive function upon QoL. However, Gerritsen et al. (2007) have argued that that it is difficult to measure the QoL of cognitively impaired older people because they are not able to understand the questions and their answers may not be a true reflection of their inner state. All the data were obtained from older people themselves and self-report measures may result in information bias despite the fact that some studies have demonstrated the validity of the self-report measurement (Chou et al. 2006). For example, some participants might not be able to remember their chronic diseases or might not report their diseases correctly. Thus, the prevalence of chronic disease might be underestimated and the effect of chronic disease upon QoL might not be properly represented. Therefore, the use of data from multiple methods such as clinical assessment and direct observation in future studies would be beneficial despite its greater cost. 7.5 Implications for practice and policy The rapid population ageing and the changes in living arrangements has led to a rising number of older people living alone in China. The phenomenon of living alone will continue in the future. The current older people, born no later 266 than the 1950s, generally have a few children who are the next generation of older people and they have been affected by the “one child” policy which was initiated in the late 1970s and early 1980s (Chen 2007). The aged parents with only one child will be more likely to face the situation of “living alone” in their later years (Chen 2007). On the other hand, because of the “one child” policy, the middle generation couple together with the “one-grandchild-four-grandparents” will become the typical family structure in China (Chen 2007). However, the 4:2:1 inverted pyramid-shape family structure together with the changing intergenerational family constellation caused by economic development and urbanization is likely to weaken the capacity of families to care their older people (Wang G.J. 2012). This will put huge pressures on health and social care systems (Peng 2011) as well as families themselves. One of the characteristics of population ageing is that the population of older people is itself ageing (United Nations 2009). This raises the question of how to provide better long-term care provisions for older people living alone. With the trend of less potential care and support for older people from their families, providing affordable and accessible formal long-term social care has become an important issue (Wong & Leung 2012). However, the faster rate of population ageing relative to many Western countries has led China to have less time to adapt to the consequences of population ageing (Peng 2011, United Nations 2009). Coupled with the fact that China is a middle-income country with limited resources to meet the growing needs of older people, the corresponding health and social care services for older people living alone are not sufficiently available. Taking care of older people living alone is becoming and will continue to be a big challenge that China faces. 267 The results of this study indicate that older people living alone in Chongming are an “at risk” group. Therefore, it is important to raise public awareness of the negative impact of living alone upon older people, to pay more attention to and show concern for this special group, and to take actions to enhance their QoL. The QoL model developed in the study could be used potentially in the development of appropriate strategies to improve the QoL of older people living alone. The development and implement of these strategies will not only have benefits for this generation of older people in China, but also have implications for next generations of older people who will experience more social, cultural and economic changes. As satisfaction with dwelling conditions was the strongest predictor of QoL, the approaches to improve older people’s satisfaction with their dwelling conditions are needed. A project of toilet improvements in the rural areas was launched in 2007 by the Chongming County government, which improved the sanitary conditions for the rural residents and increased their satisfaction with their dwelling conditions. Therefore, it is suggested that similar projects addressing other dwelling improvements be carried out for older people living alone. Examples include installation or maintenance of gas cookers, installation of a shower or bathtub and the provision of low-cost housing repair. In addition, the participants in this study were not satisfied with the convenience of public transport. It indicates a need for policy makers to address the problem. Increasing the convenience to public transport may also help to increase the utilisation of health services and consequently improve the health status of older people. Moreover, it would provide more opportunities for older people to be involved in social life and social activities. As some indicators of health status including self-rated health, functional 268 ability and depression were found to significantly influence QoL, there is a need to establish a multidisciplinary health care team to provide home care services such as free health examinations, the provision of some inexpensive and essential drugs, education about self-care and the prevention of common chronic diseases, and the provision of essential physical training to improve functional ability (Zhang et al. 2008). The establishment of electronic health records for older people living alone is also necessary, so that the health care team could access older people’s health status records and develop individualised health care plans. Some home care services provided by community doctors or community nurses have been available to older people who live alone and have no living children. However, other older people living alone who have children living at other places are not eligible for these services (Tong et al. 2011). The provision of better home care services covering more older people would be helpful for maintaining or improving functional ability, reducing the risk of chronic diseases and depression and improving self-rated health amongst older people who live alone in Chongming, which fit with World Health Organization’s (2011b) healthy ageing initiatives. It may also increase people’s satisfaction with their health services. In addition, this study revealed that older people living alone reported more depression which negatively affected their QoL. Early detection of depression may be an effective approach to minimise the level of depression. It has been noted that some depressive symptoms are likely to be mistaken for the normal signs of ageing (Chen et al. 2012). Therefore, increasing awareness about depression, improving health care providers’ knowledge and skills for early recognition of depression, and identifying risk factors of depression are essential. Further, it is noteworthy that, although the peasants were at the 269 highest risk for having depression, the effect of depression upon QoL was more pronounced in the blue-collar workers and non-manual workers. Thus, it is necessary for health care providers to make a comprehensive assessment of depression and conduct an in-depth analysis of older people’s ability to deal with depression in order to identify those who are in need of services. This study showed that older people living alone were characterised by lower economic status and also suggests that improving economic level may be a crucial strategy for the enhancement of QoL. Therefore, it is necessary for policy makers to address the financial challenges of older people living alone who have to manage their lives within very limited financial resources within the context of rapid economic changes (Tong et al. 2011). The improvement of the social pension system, especially the system for rural residents, needs to be considered. In Shanghai, all older people living in the urban areas are insured by the Social Pension Insurance for Urban Residents. However, the New Rural Social Pension Scheme, which is designed for rural residents, is built upon voluntary participation and provides very low pension benefits to most recipients (Shen & Williamson 2010). In light of the limitations of the New Rural Social Pension Scheme, Shen and Williamson (2010) proposed an additional universal non-contributory scheme to ensure that all older people living in rural areas would be covered. There may be merit in developing such a pension scheme with a higher basic benefit amongst older people living alone in Chongming to alleviate poverty, increase economic stability and improve their QoL. As a lower level of loneliness was associated with a higher QoL, there is a need to reduce the feeling of loneliness of older people living alone. Social support is an important and key environmental factor enhancing older 270 people’s social interactions and alleviating loneliness (Yeh & Lo 2004). It was also identified as a predictor of QoL in this study. Since family members especially children were the major sources of social support and most of the older people living alone had living children, it is advocated that children, other family members and relatives maintain contact with older people as much as possible through visits to the home or through telephone calls at least. Lee (2005) reported that keeping a good relationship with children and belief in children’s support were positively correlated with QoL of older people living alone. In addition, Qian and Zhou (2004) reported that older people who were frequently visited by their children and perceived that their children would support them were more likely to report a high QoL. They argued that older people’s QoL did not depend on whether they had children but on whether their children visited them frequently. Children’s frequent visits made older people believe that their families were united and harmonious and they received reverence from their descendants (Qian & Zhou 2004). In addition to family support, support from other social network members should also be strengthened. Most participants in this study perceived that they could get support from neighbours or at least one friend, although they did not receive much instrumental or emotional support from these two sources. It suggests that neighbours and friends could be the potential support sources to provide companionship, help with household chores or other small errands, and encourage older people to actively participate in social activities (Windle et al. 2011). Studies have reported that friendships may hold deeper special meanings for older people living alone (Aday et al. 2006). Sharing experiences with friends who are often of a similar age and offer an understanding of lifestyles and attitudes can increase a sense of empowerment, increase perceptions of control over lives, and improve 271 self-concept (Aday et al. 2006). Neighbours can provide immediate support which is particularly important for older people whose family members do not live close by. Friends and neighbours make people more resilient to isolation and loneliness and can play an important role in preventing loneliness (Cantor 1979, Eshbaugh 2009). Additionally, community committees, social organizations or voluntary organizations should develop ongoing supportive group activities, such as health education lectures, peer-led or professionally-led counselling or discussion groups, recreational or health promotion activities, volunteering activities and lunch clubs, to bring older people living alone together. The provision of more chances for togetherness may help older people widen their social circles, increase social interactions and improve social involvement (Windle et al. 2011). Older people themselves need take an active part in these activities and better utilise social support. The QoL model suggests that improving satisfaction with health services could improve the QoL of older people living alone. One of the most important factors related to health services satisfaction was the affordability of health care. The finding that more than half of the participants reported that they did not have enough money to afford health-care costs together with the fact of “kan bing gui” (health-care being expensive) in China suggests a need to improve the social health insurance system. China has launched health care reform in 2009. Accelerating the expansion of social health insurance system was listed as one of the five key reform priorities (Eggleston 2012). With that in mind, it is recommended that all older people living alone be enrolled in the health insurance system with an expanded benefit package, so that satisfaction with health services could be increased. In addition, other 272 strategies such as improving health care providers’ capacities in clinical practice, improving the quality of health services, and improving the quality of facilities in hospitals may also be considered as potential ways of increasing health services satisfaction. The findings regarding physical activity suggest that it is necessary to promote physical activity among older people living alone. Although adequate physical activity was not a predictor of high QoL, it might improve QoL through reducing the onset of chronic diseases and the risk of depression, improving self-rated health and functional ability, and increasing social support. However, the development of intervention strategies to promote older people’s physical activity is in its infancy, and there is little evidence regarding the effectiveness of population-based interventions (Grant 2008, Lim & Taylor 2005). Grant et al. (2008) have suggested that health promotion programmes which aimed at increasing physical activity among older people should consider not only individual factors but also environmental factors. Therefore, the following approaches could be considered to increase physical activity level of older people living alone in Chongming. Firstly, a guideline on the adequate physical activity of older people should be developed. Secondly, it is recommended that health care providers advocate the possible benefits of physical activity, help older people build positive attitudes and strong intentions towards engaging in physical activity, and provide advice on maintaining or increasing physical activity level within routine health care contacts (Lim & Taylor 2005). For example, walking outside the home could be suggested and encouraged. Walking has been reported to contribute to lowering the risk of CVDs, promoting independent living and mental health, and increasing life expectancy even if the speed and 273 effort is not equivalent to moderate exercise (Lee & Buchner 2008, Persson & While 2012, Samawi 2013). More importantly, walking may be the simplest and most acceptable form of physical activity for older people, because it does not require a special skill or facilities and can be integrated into daily lives (Lee & Buchner 2008). Lastly, because the physical environment such as the availability and accessibility of facilities and resources plays an important role in participation in physical activity, policy makers or community committees should provide easily accessible, good and safe activity equipment and recreational areas for exercising (Persson & While 2012). By doing so, older people living alone can have more opportunities to participate in physical activity. The summary of implications for practice and policy is set out in Figure 7.1. As there are a variety of factors related to the QoL of older people living alone and the relationships between these factors are complex, it may not be easy to address all the problems over a short period of time through a single project. Some pilot interventions could be developed and implemented among older people who have advanced age, have a lower level of education or live in the rural areas, because they are more likely to have poorer health and poorer life circumstances. It must be emphasised that the improvement of QoL of older people living alone requires long-term continuous, comprehensive, systematic and well-integrated strategies with collaboration across people from all spheres of life such as policy makers, health care providers and social services providers. 274 Guideline on active physical activity Dwelling conditions Improvement of the improvement projects social pension system Encouragement and suggestions from health care providers Satisfaction with dwelling conditions Provision of activity life Increasing the convenience to facilities and resources Economic status Quality of Early detection public transport Physical activity Training health care providers Self-rated health Disease Depression Identifying risk factors Functional ability Increasing awareness Home care services Health services satisfaction Occupation Electronic health records Loneliness Comprehensive assessment Children’s frequent contact Improvement of the health insurance system Seeking other potential support sources Social support Group activities Figure 7.1 Implications for practice and policy in the improvement of QoL of older people living alone in Chongming 275 7.6 Recommendations for further research A mixed methods approach would be helpful for further understanding the life experiences of older people living alone. A follow-up study using qualitative approaches could be used to provide a deeper insight into the perceptions of health status, life circumstances and QoL of this group of people to verify the findings of this study. More information relating to the experiences of living alone from the perspectives of older people themselves, such as the reason of living alone, their coping strategies, their attitudes and perceptions towards living alone, their needs and preferred services, their perceptions of being admitted to nursing homes, could also be obtained from in-depth interviews. The heterogeneity of this sample should be noted. A comparison between participants with different reasons for living alone, such as voluntary and involuntary, or widowed, separated, divorced and never married, in terms of their health status, life circumstances and QoL would be illuminating. As the sample only consisted of older people living alone, it is difficult to examine the extent to which the findings obtained from living alone older people would be the same as those living with others. Therefore, it would be worthwhile to recruit those who do not live alone as a comparator group to directly compare the differences in health status, life circumstances and QoL between those two living arrangement groups. These studies would help inform a better understanding of the impact of living alone upon older people in China. The proposed explanatory model of QoL needs to be tested in further research. In addition, more variables need to be considered to explore more factors related to QoL of older people living alone, such as spiritual well-being, life satisfaction, self-esteem and negative life events. Considering that QoL is 276 dynamic and may vary with time (Lau & Mckenna 2001), there is a need to conduct a longitudinal survey to examine the changes in QoL in the context of rapid economic and social changes in China. A longitudinal survey would also help to further understand the causal and temporal relationships between the related factors and QoL. Additional research conducted in other districts of Shanghai or other cities of China using the same measurements is recommended to compare the health status, life circumstances and QoL of older people living alone in different areas. In addition, the Chinese OPQOL needs to be further tested with a wider range of older people. Some items need modification or reframing to eliminate ambiguity, such as the item “I can afford to buy what I want to” and the item “I take life as it comes and make the best of things”. Additionally, clarification of the objective aspect of safety, i.e. neighbourhood safety, in the item “I feel safe where I live” is needed. Confirmatory factor analysis is required to explore the fit of the eight-factor structure model of the Chinese OPQOL in older people in China. 277 REFERENCES Abbasimoghadam M.A., Dabiran S., Safdari R. & Djafarian K. (2009) Quality of life and its relation to sociodemographic factors among elderly people living in Tehran. Geriatrics & Gerontology International 9(3), 270-275. Abrams M. (1973) Subjective social indicators. In Social Trends, No 4. (Nissel M. ed.) HMSO, Cardiff. pp 35-50. Acree L.S., Longfors J., Fjeldstad A.S., Fjeldstad C., Schank B., Nickel K.J., Montgomery P.S. & Gardner A.W. (2006) Physical activity is related to quality of life in older adults. Health and Quality of Life Outcomes. doi: 10.1186/1477-7525-4-37. Aday R.H., Kehoe G.C. & Farney L.A. (2006) Impact of senior center friendships on aging women who live alone. Journal of Women & Aging 18(1), 57-73. Aghamolaei T., Tavafian S.S. & Zare S. (2010) Health related quality of life in elderly people living in Bandar Abbas, Iran: a population based study. Acta Medica Iranica 48(3), 185-191. Alexander J.L. & Willems E.P. (1981) Quality of life: some measurement requirements. Archives of Physical Medicine & Rehabilitation 62(6), 261-265. Almeida O.P. & Almeida S.A. (1999) Short versions of the Geriatric Depression Scale: a study of their validity for the diagnosis of a major depressive episode according to ICD-10 and DSM-Ⅳ. International Journal of Geriatric Psychiatry 14(10), 858-865. Anderson E.M., Malmgren J.A., Carter W.B. & Patrick D.L. (1994) Screening for depression in well older adults: evaluation of a short form of the CES-D (Center for Epidemiologic Studies Depression Scale). American 278 Journal of Preventive Medicine 10(2), 77-84. Andersen R.M. (1995) Revisiting the behavioral model and access to medical care: does it matter? Journal of Health and Social Behavior 36(1), 1-10. Andrews F.M. (1974) Social indicators of perceived life quality. Social Indicators Research 1(3), 279-299. Angner E., Ray M.N., Saag K.G. & Allison J.J. (2009) Health and happiness among older adults: a community based study. Journal of Health Psychology 14(4), 503-512. Ansiau D., Marquie J.C., Soubelet A. & Ramos S. (2005) Relationships between cognitive characteristics of the job, age and cognitive efficiency. International Congress Series 1280, 43-48. Ao J. & Liu Y.Z. (2004) Cognitive decline and related factors of Chinese oldest old. Chinese Mental Health Journal 18(2), 119-122. Aquino J.A., Russel D.W., Cutrona C.E. & Altmaier E.M. (1996) Employment status, social support, and life satisfaction among the elderly. Journal of Counseling Psychology 43(4), 480-489. Arslantas D., Unsal A., Metintas S., Koc F. & Arslantas A. (2009) Life quality and daily life activities of elderly people in rural areas, Eskisehir (Turkey). Archives of Gerontology and Geriatrics 48(2), 127-131. Asawaka T., Koyano W., Ando T. & Shibata H. (2000) Effects of functional decline on quality of life among the Japanese elderly. International Journal of Aging and Human Development 50(4), 319-328. Bauco C., Borriello C., Cinti A.M., Martella S., Zannino G., Rossetti C., Cacciafesta M. & Marigliano V. (1998) Correlation between MMSE performance, age and education in centenarians. Archives of Gerontology and Geriatrics 26(Suppl. 1), 23-26. Baker M., Keall M., Au E.L. & Hodwen-Chapman P. (2007) Home is where the heart is-most of the time. The New Zealand Medical Journal 120(1264), 279 U2769. Barriball K.L. & While A.E. (1999) Exploring variables underlying non-response in a survey of nurses and nurses’ aides in practices. Journal of Advanced Nursing 29(4), 894-904. Beal C. (2006) Loneliness in older women: a review of the literature. Issues in Mental Health Nursing 27(7), 795-813. Beydoun M.A. & Popkin B.M. (2005) The impact of socio-economic factors on functional status decline among community-dwelling older adults in China. Social Science & Medicine 60(9), 2045-2057. Bilotta C., Bowling A., Nicolini P., Case A. & Vergani C. (2012) Quality of life in older outpatients living alone in the community in Italy. Health and Social Care in the Community 20(1), 32-41. Bo P. (2001) Analysis of the present living quality of the older people in the countryside of Guangdong. Journal of Guangzhou Economic Management College 3(4), 57-61. Boey K.W. (2000) The use of GDS-15 among the older adults in Beijing. Clinical Gerontologist 21(2), 49–60. Bongaarts J. & Zimmer Z. (2002) Living arrangements of older adults in the developing world: an analysis of demographic and health survey household surveys. Journal of Gerontology: Social Sciences 57B(3), S145-S157. Bonomi A.E., Patrick D.L., Bushnell D.M. & Martin M. (2000) Validation of the United States’ version of the World Health Organization Quality of Life (WHOQOL) instrument. Journal of Clinical Epidemiology 53(1), 1-12. Borders T.F., Aday L.A. & Xu K.T. (2004) Factors associated with health-related quality of life among an older population in a largely rural Western region. The Journal of Rural Health 20(1), 67-75. Borglin G., Jakobsson U., Edberg A.K. & Hallberg I.R. (2006) Older people in 280 Sweden with various degrees of present quality of life: their health, social support, everyday activities and sense of coherence. Health and Social Care in the Community 14(2), 136-146. Bowling A. (1995) What things are important in people’s lives? A survey of the public’s judgements to inform scales of health related quality of life. Social Science & Medicine 41(10), 1447-1462. Bowling A. (2005) Mode of questionnaire administration can have serious effects on data quality. Journal of Public Health 27(3), 281-291. Bowling A. (2009) The psychometric properties of the Older People’s Quality of Life Questionnaire, compared with CASP-19 and the WHOQOL-OLD. Current Gerontology and Geriatrics Research. doi: 10.1155/2009/298950. Bowling A., Banister D., Sutton S., Evans O. & Windsor J. (2002) A multidimensional model of the quality of life in older age. Aging & Mental Health 6(4), 355-371. Bowling A. & Stenner P. (2011) Which measure of quality of life performs best in older age? A comparison of the OPQOL, CASP-19 and WHOQOL-OLD. Journal of Epidemiology and Community Health 65(3), 273-280. Brett C.E., Gow A.J., Corley J., Pattie A., Starr J.M. & Deary I.J. (2012) Psychosocial factors and health as determinants of quality of life in community-dwelling older adults. Quality of Life Research 21(3), 505-516. Brislin R.W. (1970) Back-translation for cross-cultural research. Journal of Cross-Cultural Psychology 1(3), 185-216. Brown J., Bowling A. & Flynn T. (2004) Models of quality of life: a taxonomy, overview and systematic review of the literature. Project report, European Forum on Population Ageing Research 281 Burns N. & Grove S.K. (eds) (2009) The Practice of Nursing Research: Appraisal, Synthesis, and Generation of Evidence. 6th ed. Saunders, St. Louis. Cai T.J. (2004) Self-rated life satisfaction and its determinants among Chinese elderly females living alone. Chinese Journal of Population Science S1, 70-74. Campbell A., Converse P.E. & Rodgers W.L. (eds.) (1976) The Quality of American Life: Perceptions, Evaluations, and Satisfaction. Russell Sage Foundation, New York. Cantor M.H. (1979) Neighbors and friends: an overlooked resource in the informal support system. Research on Aging 1(4), 434-463. Cao X.C., Xiang P.P. & Dong H.Z. (2010) The investigation report about Gross National Happiness Index of Tangshan’s elderly people 2008. Journal of Hebei Polytechnic University 10(1), 33-36. Casey B. & Yamada A. (2002) Getting older, getting poorer?: A study of the earnings, pensions, assets and living arrangements of older people in nine countries, OECD Labour Market and Social Policy Occasional Papers, No. 60, OECD Publishing. http://dx.doi.org/10.1787/345816633534 (Citation as instructed). Chad K.E., Reeder B.A., Harrison E.L., Ashworth N.L., Sheppard S.M., Schultz S.L., Bruner B.G., Fisher K.L. & Lawson J.A. (2005) Profile of physical activity levels in community-dwelling older adults. Medicine & Science in Sports & Exercise 37(10), 1774-1784. Chalise H.N., Kai I. & Saito T. (2010) Social support and its correlation with loneliness: a cross-cultural study of Nepalese older adults. International Journal of Aging & Human Development 71(2), 115-138. Chalise H.N., Saito T., Takahashi M. & Kai I. (2007) Relationship specialization amongst sources and receivers of social support and its 282 correlations with loneliness and subjective well-being: a cross-sectional study of Nepalese older adults. Archives of Gerontology and Geriatrics 44(3), 299-314. Chan M.F. & Zeng W. (2009) Investigating factors associated with depression of older women in Macau. Journal of Clinical Nursing 18(21), 2969-2977. Chan S.W.C., Chien W.T., Thompson D.R., Chiu H.F.K. & Lam L. (2006a) Quality of life measures for depressed and non-depressed Chinese older people. International Journal of Geriatric Psychiatry 21(11), 1086-1092. Chan S.W.C., Chiu H.F.K., Chien W.T., Thompson D.R. & Lam L. (2006b) Quality of life in Chinese elderly people with depression. International Journal of Geriatric Psychiatry 21(4), 312-318. Chachamovich E., Fleck M., Laidlaw K. & Power M. (2008) Impact of major depression and subsyndromal symptoms on quality of life and attitudes towards aging in an international sample of older adults. The Gerontologist 48(5), 593-602. Chen A.B., Li C.B., Zhang M.Y., He Y.L., Wu Y., Xu M.Y., Fang F. & Wu W.Y. (2004) A preliminary study of life quality of community elderly: its relationship between age and gender. Chinese Journal Practice 7(1), 26-28. Chen C.N. (2001) Aging and life satisfaction. Social Indicators Research 54(1), 57-79. Chen F.N. & Short S.E. (2008) Household context and subjective well-being among the oldest-old in China. Journal of Family Issues 29(10), 1379-1403. Chen H.L. (2007) Successful aging in urban Shanghai: social capital and the quality of life among older people. PhD Thesis, University of Hong Kong. Chen Q.E. & Huang J.Q. (2005) The survey of loneliness and quality of life of older people in community. Chinese Journal of Rehabilitation Medicine 283 20(5), 363-364. Chen R., Copeland J.R.M. & Wei L. (1999) A meta-analysis of epidemiological studies in depression of older people in the People’s Republic of China. International Journal of Geriatric Psychiatry 14(10), 821-830. Chen Y., Hicks A. & While A.E. (2012) Depression and related factors in older people in China: a systematic review. Reviews in Clinical Gerontology 22(1), 52-67. Chen Y., Hicks A. & While A.E. (2013) Quality of life of older people in China: a systematic review. Reviews in Clinical Gerontology 23(1), 88-100. Chen Z.L. & Chen X.B. (2006) Discussion on situation of the ageing in Shanghai and its countermeasures. Chinese Health Service Management 22(11), 671-673. Cheng S.T. & Chan A.C. (2005) The Center for Epidemiologic Studies Depression Scale in older Chinese: thresholds for long and short forms. International Journal of Geriatric Psychiatry 20(5), 465-470. Cheng S.T., Chan A.C.M. & Phillips D.R. (2004) Quality of life in old age: an investigation of well older persons in Hong Kong. Journal of Community Psychology 32(3), 309-326. Cheng S.T., Fung H.H. & Chan A.C.M. (2008) Living status and psychological well-being: social comparison as a moderator in later life. Aging & Mental Health 12(5), 654-661. Chi I. & Boey K.W. (1993) Hong Kong validation of measuring instruments of mental health status of the elderly. Clinical Gerontologist 13(4), 35-51. Chi I. & Chou K.L. (2001) Social support and depression among elderly Chinese people in Hong Kong. The International Journal of Aging and Human Development 52(3), 231-252. Chi I., Yip P.S.F., Chiu H.F.K., Chou K.L., Chan K.S., Kwan C.W., Conwell Y. & 284 Caine E. (2005) Prevalence of depression and its correlates in Hong Kong’s Chinese older adults. American Journal of Geriatric Psychiatry 13(5), 409-416. Chiao C., Weng L.J. & Botticello A. (2009) Do older adults become more depressed with age in Taiwan? The role of social position and birth cohort. Journal of Epidemiology and Community Health 63(8), 625-632. China Ageing Affairs Office. (2006) Report of Chinese population ageing tendency. China Ageing Affairs Office, Beijing. China National Committee on Ageing. (2007) The forecast of development trend of China’s population ageing. Chinese Women’s Movement 2, 15-18. Chong M.Y., Chen C.C., Tsang H.Y., Yeh T.L., Chen C.S., Lee Y.H., Tang T.C. & Lo H.Y. (2001) Community study of depression in old age in Taiwan: prevalence, life events and socio-demographic correlates. British Journal of Psychiatry 178(1), 29-35. Chou K.L. & Chi I. (1999) Determinants of life satisfaction in Hong Kong Chinese elderly: a longitudinal study. Aging & Mental Health 3(4), 328-335. Chou K.L. & Chi I. (2000) Comparison between elderly Chinese living alone and those living with others. Journal of Gerontological Social Work 33(4), 51-66. Chou K.L. & Chi I. (2002) Chronic illness and depressive symptoms among Chinese older adults: a longitudinal study. International Journal of Aging and Human Development 54(2), 159-171. Chou K.L. & Chi I. (2003) Reciprocal relationship between social support and depressive symptoms among Chinese elderly. Aging & Mental Health 7(3), 224-231. Chou K.L. & Chi I. (2005) Prevalence and correlates of depression in Chinese 285 oldest-old. International Journal of Geriatric Psychiatry 20(1), 41-50. Chou K.L., Ho A.H.Y. & Chi I. (2006) Living alone and depression in Chinese older adults. Aging & Mental Health 10(6), 583-591. Cohen J. (1977) Statistical Power Analysis for the Behavioural Sciences. Academic Press, New York. Cohen-Mansfield J., Shmotkin D. & Goldberg S. (2009) Loneliness in old age: longitudinal changes and their determinants in an Israeli sample. International Psychogeriatrics 21(6), 1160-1170. Collin C., Wade D.T., Davies S. & Horne V. (1988) The Barthel ADL Index: a reliability study. International Disability Studies 10(2), 61-63. Damian J., Ruigomez A., Pastor V. & Martin-Moreno J.M. (1999) Determinants of self assessed health among Spanish older people living at home. Journal of Epidemiology and Community Health 53(7), 412-416. de Jong Gierveld J. (1998) A review of loneliness: concept and definitions, determinants and consequences. Reviews in Clinical Gerontology 8(1), 73-80. Dean A., Kolody B., Wood P. & Matt G.E. (1992) The influence of living alone on depression in elderly persons. Journal of Aging and Health 4(1), 3-18. Del Duca G.F., da Silva M.C. & Hallal P.C. (2009) Disability in relation to basic and instrumental activities of daily living among elderly subjects. Revista de Saude Publica 43(5), 796-805. Deng J.L., Hu J.M., Wu W.L., Dong B.R. & Wu H.M. (2010) Subjective well-being, social support, and age-related functioning among the very old in China. International Journal of Geriatric Psychiatry 25(7), 697-703. Diener E., Emmons R.A., Larsen R.J. & Griffin S. (1985) The Satisfaction With Life Scale. Journal of Personality Assessment 49(1), 71-75. Dipietro L., Caspersen C.J., Ostfeld A.M. & Nadel E.R. (1993) A survey for assessing physical activity among older adults. Medicine & Science in 286 Sports & Exercise 25(5), 628-642. Dodge B.A. (2008) Primary health care for older people: a participatory study in 5 Asian countries. Retrieved from www.helpage.org/download/4c48e53c18ce1/ on 8 April 2013. Dong X.Q. & Simon M.A. (2010) Health and aging in a Chinese population: urban and rural disparities. Geriatrics and Gerontology International 10(1), 85-93. Du X.J. & Li Y.L. (2012) The related factors of physical activity of community dwelling older people. Chinese Journal of Gerontology 32(4), 794-795. Eggleston K. (2012) Health care for 1.3 billion: an overview of China’s health system. Stanford Asia Health Policy Program Working Paper No. 28. Retrieved from http://iis-db.stanford.edu/pubs/23668/AHPPwp_28.pdf on 26 June 2013. Ekwall A.K., Sivberg B. & Hallberg I.R. (2005) Loneliness as a predictor of quality of life among older caregivers. Journal of Advanced Nursing 49(1), 23-32. Erikson R. (1993) Descriptions of inequality: the Swedish approach to welfare research. In The Quality of life (Nussbaum M. & Sen A. eds.). Clarendon Press, New York. pp 67-83. Eshbaugh E.M. (2009) The role of friends in predicting loneliness among older women living alone. Journal of Gerontological Nursing 35(5), 13-16. Evans G.W., Kantrowitz E. & Eshelman P. (2002) Housing quality and psychological well-being among the elderly population. Journal of Gerontology: Pshchological Sciences 57B(4), 381-383. Fan S.H., Hua Q.Z., Ma Y., Yu Y., Zhang M.X., Nan J., Wang X.N. & Zhao Y.L. (2007) A study on incidence and risk factors of depression among aged people in community of Xi’an city. Chinese Nursing Research 21(2C), 483-485. 287 Fan X.D. (1999a) Index of Well-being, Index of general affect. In The Handbook of Mental Health Rating Scales. (Wang X.D., Wang X.L. & Ma H. eds). Chinese Mental Health Journal Press, Beijing. pp 82-83. Fan X.D. (1999b) Philadelphia Geriatric Center (PGC) Morale Scale. In The Handbook of Mental Health Rating Scales. (Wang X.D., Wang X.L. & Ma H. eds). Chinese Mental Health Journal Press, Beijing. pp 80-81. Fang H., Chen J. & Rizzo J.A. (2009) Explaining urban-rural health disparities in China. Medical Care 47(12), 1209-1216. Farquhar M. (1995) Elderly people’s definitions of quality of life. Social Science & Medicine 41(10), 1439-1446. Feinglass J., Lin S., Thompson J., Sudano J., Dunlop D., Song J. & Baker D.W. (2007) Baseline health, socioeconomic status, and 10-year mortality among older middle-aged Americans: findings from the health and retirement study, 1992-2002. Journal of Gerontology: Social Sciences 62B(4), S209-S217. Feng T. & Chen M. (2008) The comprehensive evaluation and analysis on life quality of empty-nest elderly in Xiamen City. South China Population 23(90), 37-43. Ferguson E. & Cox T. (1993) Exploratory factor analysis: a users’ guide. International Journal of Selection and Assessment 1(2), 84-94. Ferrucci L., Guralnik J.M., Baroni A., Tesi G., Antonini E. & Marchionni N. (1991) Values of combined assessment of physical health and functional status in community-dwelling aged: a prospective study in Florence, Italy. Journal of Gerontology 46(2), M52-M56. Fillenbaum G.G. (1984) The wellbeing of the elderly: approaches to multidimensional assessment. World Health Organization, Geneva. Fleiss J.L. (1986) The Design and Analysis of Clinical Experiments. Wiley, New York. 288 Folstein M.F., Folstein S.E. & McHugh P.R. (1975) “Mini Mental State”: a practical method for grading the cognitive state of patients for the clinician. Journal of Psychiatric Research 12(3), 189-198. Fratiglioni L., Wang H.X., Ericsson K., Maytan M. & Winblad B. (2000) Influence of social network on occurrence of dementia: a community-based longitudinal study. The Lancet 355(9212), 1315-1319. Freudenstein U., Arthur A.J., Matthews R.J. & Jagger C. (2001) Community surveys of late-life depression: who are the non-responders? Age and Ageing 30(6), 517-521. Fried L.P., Ettinger W.H., Lind B., Newman A.B. & Gardin J. (1994) Physical disability in older adults: a physiological approach. Journal of Clinical Epidemiology 47(7), 747-760. Gao S.J., Jin Y.L., Unverzagt F.W., Liang C., Hall K.S., Ma F., Murrell J.R., Cheng Y.B., Matesan J., Li P., Bian J.C. & Hendrie H.C. (2009) Correlates of depressive symptoms in rural elderly Chinese. International Journal of Geriatric Psychiatry 24(12), 1358-1366. Gaymu J. & Springer S. (2010) Living conditions and life satisfaction of older Europeans living alone: a gender and cross-country analysis. Ageing & Society 30(7), 1153-1175. Gee E.M. (2000) Living arrangements and quality of life among Chinese Canadian elders. Social Indicators Research 51(3), 309-329. George L.K. & Bearon L.B. (eds) (1980) Quality of Life in Older Persons: Meaning and Measurement. Human Sciences Press, New York. Gerontological Society of China. (2011) Chongming County of Shanghai became the fifteen “Longevity Counties of China”. Retrieved from http://www.gschina.org.cn/tongxun/201101/2011-11-29/1202.html on 13 May 2013. Gerontological Society of Shanghai. (2010) 2009 Shanghai monitored 289 statistical information on population of the elderly & development of old age program. Retrieved from http://www.shanghaigss.org.cn/news_view.asp?newsid=6895 on 3 April 2011. Gerontological Society of Shanghai. (2012) 2011 Shanghai monitored statistical information on population of the elderly & development of old age program. Retrieved form http://www.shanghaigss.org.cn/news_view.asp?newsid=8599 on 19 May 2013. Gerontological Society of Shanghai. (2013) 2012 Shanghai monitored statistical information on population of the elderly & development of old age program. Retrieved from http://www.shanghaigss.org.cn/news_view.asp?newsid=9143 on 19 May 2013. Gerritsen D.L., Steverink N., Ooms M.E., de Vet H.C.W. & Ribbe M.W. (2007) Measurement of overall quality of life in nursing homes through self-report: the role of cognitive impairment. Quality of Life Research 16(6), 1029-1037. Giuli C., Papa R., Mocchegiani E. & Marcellini F. (2012) Predictors of participation in physical activity for community dwelling elderly Italians. Archives of Gerontology and Geriatrics 54(1), 50-54. Grant B.C. (2008) Should physical activity be on the healthy ageing agenda? Social Policy Journal of New Zealand 33, 163-177. Guallar-Castillon P., Sendino A.R., Banegas J.R., Lopez-Garcia E. & Rodriguez-Artalejo F. (2005) Differences in quality of life between women and men in the older population of Spain. Social Science & Medicine 60(6), 1229-1240. Guo J.W. (1998) The preliminary study of simple assessment of cognitive 290 impairment in older people. Chinese Mental Health Journal 12(5), 268-269. Halvorsrud L., Kirkevold M., Diseth A. & Kalfoss M. (2010) Quality of life model: predictors of quality of life among sick older adults. Research and Theory for Nursing Practice: An International Journal 24(4), 241-259. Haskell W.L., Lee I.M., Pate R.R., Powell K.E., Blair S.N., Franklin B.A., Macera C.A., Heath G.W., Thompson P.D. & Bauman A. (2007) Physical activity and public health: updated recommendation for adults from the American College of Sports Medicine and the American Heart Association. Medicine and Science in Sports and Exercise 39(8), 1423-1434. Haslbeck J.W., McCorkle R. & Schaeffer D. (2012) Chronic illness self-management while living alone in later life: a systematic integrative review. Research on Aging 34(5), 507-547. Haug M.R. & Folmar S.J. (1986) Longevity, gender, and life quality. Journal of Health and Social Behaviour 27(4), 332-345. Hawton A., Green C., Dickens A.P., Richards S.H., Taylor R.S., Edwards R., Greaves C.J. & Campbell J.L. (2011) The impact of social isolation on the health status and health related quality of life of older people. Quality of Life Research 20(1), 57-67. He X.Y., Xiao S.Y. & Zhang D.X. (2008) Reliability and validity of the Chinese version of Geriatric Depression Scale: a study in a population of Chinese rural community dwelling elderly. Chinese Journal of Clinical Psychology 16(5), 473-475. He Y.L., Qu G.Y., Xiong X.Y., Chi Y.F., Zhang M.Q. & Zhang M.Y. (1989) The activities of daily living of older adults. Shanghai Archives of Psychiatry 7(3), 124-126. He Y.L., Zhang M.Y. & Li R.B. (1998) Changes of ADL in normal aging and its 291 relationship to dementia. Chinese Journal of Clinical Psychology 6(1), 20-23. Hellstrom Y., Persson G. & Hallberg I.R. (2004) Quality of life and symptoms among older people living at home. Journal of Advanced Nursing 48(6), 584-593. Herrmann N., Mittmann N., Silver I.L., Shulman K.I., Busto U.A., Shear N.H. & Naranjo C.A. (1996) A validation study of the Geriatric Depression Scale short form. International Journal of Geriatric Psychiatry 11(5), 457-460. Heylen L. (2010) The older, the lonelier? Risk factors for social loneliness in old age. Ageing & Society 30(7), 1177-1196. Hirve S., Juvekar S., Lele P. & Agarwal D. (2010) Social gradients in self-reported health and well-being among adults aged 50 and over in Pune District, India. Global Health Action. doi: 10.3402/gha.v3i0.2128. Ho S.C., Woo J., Yuen Y.K., Sham A. & Chan S.G. (1997) Predictors of mobility decline: the Hong Kong old-old study. Journal of Gerontology: Medical Sciences 52A(6), M356-M362. Hoi L.V., Chuc N.T. & Lindholm L. (2010) Health-related quality of life, and its determinants, among older people in rural Vietnam. BMC Public Health. doi: 10.1186/1471-2458-10-549. Hsieh Y.M., Sung T.S. & Wan K.S. (2010) A survey of nutrition and health status of solitary and non-solitary elders in Taiwan. The Journal of Nutrition, Health & Aging 14(1), 11-14. Hsu H.C. (2007) Exploring elderly people’s perspectives on successful ageing in Taiwan. Ageing & Society 27(1), 87-102. Hua D.F. & Fan Y.Y. (2010) Study on the Shanghai old-age social security of aging time. Asian Social Science 6(2), 40-43. Huang L.H. & Lin Y.C. (2002) The health status and needs of community elderly living alone. Journal of Nursing Research 10(3), 227-235. 292 Huang J.Q., Chen Q.E. & Shu X.F. (2005) A study on the relationship between quality of life and social support of elder in community. Chinese Journal of Behavioral Medicine Science 14(8), 725-726. Huang W.Y., Song S.C., Yang J.Y. & Zhao F.G. (2000) Impact of the chronic diseases in the elderly on ability of daily life in a community of Guiyang City. Chinese Journal of Prevention and Control of Chronic Non-communicable Disease 8(2), 81-83. Hwang H.F., Liang W.M., Chiu Y.N. & Lin M.R. (2003) Suitability of the WHOQOL-BREF for community-dwelling older people in Taiwan. Age and Ageing 32(6), 593–600. Iliffe S., Tai S.S., Haines A., Gallivan S., Goldenberg E., Booroff A. & Morgan P. (1992) Are elderly people living alone an at risk group? BMJ 305(6860), 1001-1004. Iwarsson S. & Isacsson A. (1996) Development of a novel instrument for occupational therapy assessment of the physical environment in the home-a methodological study on "The Enabler”. Occupational Therapy Journal of Research 16(4), 227-244. Iwarsson S. & Isacsson A. (1997) Quality of life in the elderly population: an example exploring interrelationships among subjective well-being, ADL dependence, and housing accessibility. Archives of Gerontology and Geriatrics 26(1), 71-83. Jackson A.S., Blair S.N., Mahar M.T., Wier L.T., Ross R.M. & Stuteville J.E. (1990) Prediction of functional aerobic capacity without exercise testing. Medicine and Science in Sports and Exercise 22(6), 863-870. Jackson C.J. & Furnham A. (eds) (2000) Designing and Analyzing Questionnaires and Surveys: A Manual for Health Professionals and Administrators. Whurr Publishers Ltd, London. Jia S.M., Feng Z.Y., Hu Y. & Wang J.Q. (2004) Survey of the living quality and 293 its effect factors for the aged people in urban community of Shanghai city. Journal of Nurses Training 19(5), 420-423. Jia S.M., Shi Y.J., Zhou H., Fu J. & Lv B. (2007) A survey on anxiety and depression and the influencing factors in the elderly of ‘empty nest’ in a community. Journal of Nursing Science 22(14), 8-10. Jiang D.F. (2002) Quality of life and its application in health assessment in older people. Guangxi Medical Journal 24(6), 860-862. Jiang Z.H. (2005) The population ageing in China and the countermeasures. Qiushi 6, 41-43. Joseph C. & Nichols S. (2007) Patient satisfaction and quality of life among persons attending chronic disease clinics in South Trinidad, West Indies. The West Indian Medical Journal 56(2), 108-114. Kahana E., Lawrence R.H., Kahana B., Kercher K., Wisniewski A., Stoller E., Tobin J. & Stange K. (2002) Long-term impact of preventive proactivity on quality of life of the old-old. Psychosomatic Medicine 64(3), 382-394. Kalfoss M. & Halvorsrud L. (2009) Important issues to quality of life among Norwegian older adults: an exploratory study. The Open Nursing Journal 3, 45-55. Kaneko Y., Motohashi Y., Yasaki H. & Yamaji M. (2007) Prevalence of depressive symptoms and related risk factors for depressive symptoms among elderly persons living in a rural Japanese community: a cross-sectional study. Community Mental Health Journal 43(6), 583-590. Kawamoto R., Yoshida O., Oka Y. & Kodama A. (2005) Influence of living alone on emotional well-being in community-dwelling elderly persons. Geriatrics and Gerontology 5(3), 152-158. Kelsey J.L., O’brien L.A., Grisso J.A. & Hoffman S. (1989) Issues in carrying out epidemiologic research in the elderly. American Journal of Epidemiology 130(5), 857-866. 294 Kharicha K., Iliffe S., Harari D., Swift C., Gillmann G. & Stuck A.E. (2007) Health risk appraisal in older people 1: are older people living alone an ‘at risk’ group? British Journal of General Practice 57(537), 271-276. Killeen C. (1998) Loneliness: an epidemic in modern society. Journal of Advanced Nursing 28(4), 762-770. Kincannon C.L., He W. & West L.A. (2005) Demography of aging in China and the United States and the economic well-being of their older populations. Journal of Cross-Cultural Gerontology 20(3), 243-255. Kirk D. (1996) Demographic transition theory. Population Studies 50(3), 361-387. Krause N., Liang J. & Gu S.Z. (1998) Financial strain, received support, anticipated support, and depressive symptoms in the People’s Republic of China. Psychology and Aging 13(1), 58-68. Ku P.W., Fox K.R. & Chen L.J. (2009) Physical activity and depressive symptoms in Taiwanese older adults: a seven-year follow-up study. Preventive Medicine 48(3), 250-255. Kucukdeveci A.A., McKenna S.P., Kutlay S., Gursel Y., Whalley D. & Arasil T. (2000) The development and psychometric assessment of the Turkish version of the Nottingham Health Profile. International Journal of Rehabilitation Research 23(1), 31-38. Kucukdeveci A.A., Yavuzer G., Elhan A.H., Sonel B. & Tennant A. (2001) Adaptation of the Functional Independence Measure for use in Turkey. Clinical Rehabilitation 15(3), 311-319. Kuhirunyaratn P., Pongpanich S., Somrongthong R., Love E.J. & Chapman R.S. (2007) Social support among elderly in Khon Kean Province, Thailand. Southeast Asian Journal of Tropical Medicine & Public Health 38(5), 936-946. Kunzmann U., Little T.D. & Smith J. (2000) Is age-related stability of 295 subjective well-being a paradox? Cross-sectional and longitudinal evidence from the Berlin Aging Study. Psychology and Aging 15(3), 511-526. Lai D., Tong H.M., Zeng Q. & Xu W.Y. (2010) The factor structure of a Chinese Geriatric Depression Scale-SF: use with alone elderly Chinese in Shanghai, China. International Journal of Geriatric Psychiatry 25(5), 503-510. Lai D.W.L. (2009) Depressive symptoms of elderly Chinese in Guangzhou, Hong Kong, and Taipei. Aging & Mental Health 13(5), 725-735. Lai D.W.L. & Leonenko W.L. (2007) Correlates of living alone among single elderly Chinese immigrants in Canada. International Journal of Aging & Human Development 65(2), 121-148. Lam C.W. & Boey K.W. (2005) The psychological well-being of the Chinese elderly living in old urban areas of Hong Kong: a social perspective. Aging & Mental Health 9(2), 162-166. Landi F., Onder G., Carpenter I., Cesari M., Soldato M. & Bernabei R. (2007) Physical activity prevented functional decline among frail community-living elderly subjects in an international observational study. Journal of Clinical Epidemiology 60(5), 518-524. Lau A., Chi I. & Mckenna K. (1998) Self-perceived quality of life of Chinese elderly people in Hong Kong. Occupational Therapy International 5(2), 118-139. Lau A. & Mckenna K. (2001) Conceptualizing quality of life for elderly people with stroke. Disability and Rehabilitation 23(6), 227-238. Lauder W., Sharkey S. & Mummery K. (2004) A community survey of loneliness. Journal of Advanced Nursing 46(1), 88-94. Lautenschlager N.T., Almeida O.P., Flicker L. & Janca A. (2004) Can physical activity improve the mental health of older adults? Annals of General 296 Hospital Psychiatry. doi:10.1186/1475-2832-3-12. Lawton M.P. (1975) The Philadelphia Geriatric Center Morale Scale: a revision. Journal of Gerontology 30(1), 85-89. Lawton M.P. (1980) Housing the elderly: residential quality and residential satisfaction. Research on Aging 2(3), 309-328. Lawton M.P. (1991) A multidimensional view of quality of life in frail elders. In The Concept and Measurement of Quality of Life in the Frail Elderly. (Birren J.E., Lubben J.E., Rowe J.C. & Deutchman D.E. eds). Academic Press, San Diego. pp 3-27. Lawton M.P. & Brody E.M. self-maintaining and (1969) Assessment instrumental activities of of older people: daily living. The Gerontologist 9(3), 179-186. Lawton M.P., Moss M. & Kleban M.H. (1984) Marital status, living arrangements, and the well-being of older people. Research on Aging 6(3), 323-345. Lea A., Watson R. & Deary I.J. (1998) Caring in nursing: a multivariate analysis. Journal of Advanced Nursing 28(3), 662-671. Lee G.R. & Shehan C.L. (1989) Social relations and the self-esteem of older persons. Research on Aging 11(4), 427-442. Lee H.B., Chiu H.F.K., Kowk W.Y., Leung C.M., Kwong P.K. & Chung D.W.S. (1993) Chinese elderly and the GDS short form: a preliminary study. Clinical Gerontologist 14(2), 37-42. Lee H.C.B., Chiu H.F.K. & Kwong P.P.K. (1994) Cross-validation of the Geriatric Depression Scale short form in the Hong Kong elderly. Bulletin of the Hong Kong Psychological Society 32, 72-77. Lee I.M. & Buchner D.M. (2008) The importance of walking to public health. Medicine & Science in Sports & Exercise 40(Suppl 7), S512-S518. Lee J.J. (2005) An exploratory study on the quality of life of older Chinese 297 people living alone in Hong Kong. Social Indicators Research 71(1-3), 335-361. Lee J.J. (2009) A pilot study on the living-alone, socio-economically deprived older Chinese people’s self-reported successful aging: a case of Hong Kong. Applied Research in Quality of Life 4(4), 347-363. Lee R.D. & Reher D.S. (2011) Introduction: the landscape of demographic transition and its aftermath. Population and Development Review 37(S1), 1-7. Lee T.W., Ko I.S. & Lee K.J. (2006) Health promotion behaviors and quality of life among community-dwelling elderly in Korea: a cross-sectional survey. International Journal of Nursing Studies 43(3), 293-300. Lesher E.L. & Whelihan W.M. (1986) Reliability of mental status instruments administered to nursing home residents. Journal of Consulting and Clinical Psychology 54(5), 726-727. Leung K.F., Wong W.W., Tay M.S.M., Chu M.M.L & Ng S.S.W. (2005) Development and validation of the interview version of the Hong Kong Chinese WHOQOL-BREF. Quality of Life Research 14(5), 1413-1419. Leung K.K., Chen C.Y., Lue B.H. & Hsu S.T. (2007) Social support and family functioning on psychological symptoms in elderly Chinese. Archives of Gerontology and Geriatrics 44(2), 203-213. Levy-Leboyer C. & Ratiu E. (1993) The need for space and residential satisfaction. Architecture & Comportement/Architecture & Behaviour 9(4), 475-490. Li A.Q. (2007) The elderly’s life pattern and social support system in empty-nest family--a case study of Xuzhou. Social Work 3, 43-45. Li B. & Mao F.Z. (2008) An evaluation of reliability and validity on SF-36 using for older people living in rural nursing home. Guangdong Medical Journal 29(10) 1731-1733. 298 Li H. & Tracy M.B. (1999) Family support, financial needs, and health care needs of rural elderly in China: a field study. Journal of Cross-Cultural Gerontology 14(4), 357-371. Li L., Wang H.M. & Shen Y. (2002) Development and psychometric tests of a Chinese version of the SF-36 health survey scales. Chinese Journal of Preventive Medicine 36(2), 109-113. Li L.W., Zhang J.A. & Liang J. (2009) Health among the oldest-old in China: which living arrangements make a difference? Social Science & Medicine 68(2), 220-227. Li M. (2005) The present situation of population in Shanghai and the corresponding measures. Journal of Nanjing College for Population Programme Management 21(2), 13-16. Li Z.L., Gao Y., Wan B.H. & Zou L.H. (2008) Analysis on the social support to the elderly in empty-nest families in city. Medicine and Society 21(1), 11-12. Li Z.W., Huang Y.Q. & Liu Y.Z. (2007) Survey on cognitive function and its influencing factors in aged people over 65 years old in China. Journal of the Fourth Military Medical University 28(16), 1518-1522. Liang J. & Bollen K.A. (1983) The Structure of the Philadelphia Geriatric Center Morale Scale: a reinterpretation. Journal of Gerontology 38(2), 181-189. Liang Q.X., Li Y.Y., Yang S.H., Zhou H.X., Wang Z.W. & Huang J.Q. (2006) The relationship between loneliness and living status of older people in rural area. Chinese Journal of Gerontology 26(9), 1259-1260. Lim K. & Taylor L. (2005) Factors associated with physical activity among older people--a population-based study. Preventive Medicine 40(1), 33-40. Lim L.L. & Kua E.H. (2011) Living alone, loneliness, and psychological 299 well-being of older persons in Singapore. Current Gerontology and Geriatrics Research. doi: 10.1155/2011/673181. Lin G.R., Wang W., Chen X.Y. & Zhang L.P. (2006) Investigation of the cognitive function of older people in communities. Journal of Community Medicine 4(1), 1-3. Lin M.X., Liu Y.C. & Zhan G.Z. (2009) Empirical study on the urban elderly people of ‘empty nest’ and their loneliness. Modern Preventive Medicine 36(1), 77-80. Lin P.C., Yen M.F. & Fetzer S.J. (2008) Quality of life in elders living alone in Taiwan. Journal of Clinical Nursing 17(12), 1610-1617. Lin Z.Y. (2007) Exploration of chronic pain and its related factors for the residents with arthritis. MSN Thesis, Fooyin University. Litwin H. (2005) Correlates of successful aging: are they universal? International Journal of Aging and Human Development. 61(4), 313-333. Liu C.Y., Lu C.H., Yu S. & Yang Y.Y. (1998) Correlations between scores on Chinese versions of long and short forms of the Geriatric Depression Scale among elderly Chinese. Psychological Reports 82(1), 211-214. Liu C.Y., Wang S.J., Teng E.L., Fuh J.L., Lin C.C., Lin K.N., Chen H.M., Lin C.H., Wang P.N., Yang Y.Y., Larson E.B., Chou P. & Liu H.C. (1997) Depressive disorders among older residents in a Chinese rural community. Psychological Medicine 27(4), 943-949. Liu H. & Zhao Z. (2012) Impact of China’s Urban Resident Basic Medical Insurance on health care utilization and expenditure. IZA discussion paper No. 6768. Available at SSRN: http://ssrn.com/abstract=2157910 (Citation as instructed). Liu L., Xu H.L. & Song S. (2009) Relationship of elderly loneliness, filial expectations, and intergenerational social support. Chinese Journal of Clinical Psychology 17(5), 636-638. 300 Liu L.J. & Guo Q. (2007) Loneliness and health-related quality of life for the empty nest elderly in the rural area of a mountainous county in China. Quality of Life Research 16(8), 1275-1280. Liu L.J. & Guo Q. (2008) Life satisfaction in a sample of empty-nest elderly: a survey in the rural area of a mountainous county in China. Quality of Life Research 17(6), 823-830. Liu L.J., Sun X., Zhang C.L. & Guo Q. (2007) Health-care utilization among empty-nesters in the rural area of a mountainous county in China. Public Health Reports 122(3), 407-413. Liu X.Y. (2009) Essays on public pension systems, with special reference to China. PhD Thesis, The University of Birmingham. Liu Z.R. & Ni J.F. (2003) Epidemiological study on quality of life among retired elderly population in Hefei. Chinese Journal of Public Health 19(2), 230-232. LoBiondo-Wood G. & Haber J. (eds) (1998). Nursing Research: Methods, Critical Appraisal, and Utilization. 4th ed. Mosby, St. Louis. Low G. & Molzahn A.E. (2007) Predictors of quality of life in old age: a cross-validation study. Research in Nursing & Health 30(2), 141-150. Luanaigh C.O. & Lawlor B.A. (2008) Loneliness and the health of older people. International Journal of Geriatric Psychiatry 23(12), 1213-1221. Lue B.H., Chen L.J. & Wu S.C. (2010) Health, financial stresses, and life satisfaction affecting late-life depression among older adults: a nationwide, longitudinal survey in Taiwan. Archives of Gerontology & Geriatrics 50(Suppl. 1), S34-S38. Lv H., Li S. & Ni Z.Z. (2001) The status of chronic conditions among the elderly and the influencing factors related to ADL of older people. Acta Universitatis Medicinalis Anhui 36 (1), 29-32. Lv T.Y., Ma M.Z., Cao Y.L., Yang Y.H., Yuan H.B., Wu S. & Li Z.F. (2001) 301 Study on depression of the old people in communities and the influencing factors. Journal of Nursing Science 16(7), 387-389. Lyness J.M., Noel T.K., Cox C., King D.A., Conwell Y. & Caine E.D. (1997) Screening for depression in elderly primary care patients. A comparison of the Center for Epidemiologic Studies-Depression Scale and the Geriatric Depression Scale. Archives of Internal Medicine 157(4), 449-454. Macintyre S., Ellaway A., Cummins S. (2002) Place effects on health: how can we conceptualise, operationalise and measure them? Social Science & Medicine 55(1), 125-139. Macintyre S., Ellaway A., Hiscock R., Kearns A., Der G. & McKay L. (2003) What features of the home and the area might help to explain observed relationships between housing tenure and health? Evidence from the west of Scotland. Health & Place 9(3), 207-218. Magaziner J., Cadigan D.A., Hebel J.R. & Parry R.E. (1988) Health and living arrangements among older women: dose living alone increase the risk of illness? Journal of Gerontology 43(5), M127-M133. Mahoney F.I. & Barthel D.W. (1965) Functional evaluation: the Barthel Index. Maryland State Medical Journal 14, 56-61. Maniecka-Bryla I., Drygas W., Bryla M. & Dziankowska-Zaborszczyk E. (2011) Determinants of self-rated health among the elderly living in a big city environment. Polish Journal of Environmental Studies 20(3), 691-699. McCusker J., Bellavance F., Cardin S. & Belzile E. (1999) Validity of an Activities of Daily Living questionnaire among older patients in the emergency department. Journal of Clinical Epidemiology 52(11), 1023-1030. McDowell I. (2006) Measuring Health: A Guide to Rating Scales and Questionnaires. 3rd ed. Oxford University Press, New York. 302 McLaughlin D., Adams J., Vagenas D. & Dobson A. (2011) Factors which enhance or inhibit social support: a mixed-methods analysis of social networks in older women. Ageing & Society 31(1), 18-33. McMurdo M.E.T. & Burnett L. (1992) Randomised controlled trial of exercise in the elderly. Gerontology 38(5), 292-298. Meng X. & Luo C.L. (2008) What determines living arrangements of the elderly in urban China? In Inequality and Public Policy in China (Gustafsson B.A., Shi L. & Sicular T. eds.). Cambridge University Press, New York. pp 267-286. Michael Y.L., Berkman L.F., Colditz G.A. & kawachi I. (2001) Living arrangements, social integration, and change in functional health status. American Journal of Epidemiology 153(2), 123-131. Michalos A.C. (1980) Satisfaction and happiness. Social Indicators Research 8(4), 385-422. Michalos A.C., Zumbo B.D. & Hubley A. (2000) Health and the quality of life. Social Indicators Research 51(3), 245-286. Milne A., Hatzidimitriadou E. & Wiseman J. (2007) Health and quality of life among older people in rural England: exploring the impact and efficacy of policy. Journal of Social Policy 36(3), 477-495. Miltiades H.B. & Wu B. (2008) Factors affecting physician visits in Chinese and Chinese immigrant samples. Social Science & Medicine 66(3), 704-714. Ministry of Health of China. (2009) Analysis report of National Health Services Survey in China, 2008. Ministry of Health of China, Beijing. Missotten P., Squelard G., Ylieff M., Di Notte D., Paquay L., De Lepeleire J. & Fontaine O. (2008) Quality of life in older Belgian people: comparison between people with dementia, mild cognitive impairment, and controls. International Journal of Geriatric Psychiatry 23(11), 1103-1109. 303 Mogos M.F., August E.M., Salinas-Miranda A.A., Sultan D.H. & Salihu H.M. (2013) A systematic review of quality of life measures in pregnant and postpartum mothers. Applied Research in Quality of Life 8(2), 219-250. Montgomery K. (2000) The demographic transition. Retrieved from http://www.uwmc.uwc.edu/geography/demotrans/demtran.htm on 22 September 2012. Mor V., Wilcox V., Rakowski W. & Hiris J. (1994) Functional transition among the elderly: patterns, predictors, and related hospital use. American Journal of Public Health 84(8), 1274-1280. Mui A.C. (1998) Living alone and depression among older Chinese immigrants. Journal of Gerontological Social Work 30(3/4), 147-166. Mui A.C. & Burnette J.D. (1994) A comparative profile of frail elderly persons living alone and those living with others. Journal of Gerontological Social Work 21(3-4), 5-26. Murtagh K.N. & Hubert H.B. (2004) Gender differences in physical disability among an elderly cohort. American Journal of Public Health 94(8), 1406-1411. Mwanyangala M.A., Mayombana C., Urassa H., Charles J., Mahutanga C., Abdullah S. & Nathan R. (2010) Health status and quality of life among older adults in rural Tanzania. Global Health Action. doi: 10.3402/gha.v3i0.2142. Mykletun A., Bjerkeset O., Dewey M., Prince M., Overland S. & Stewart R. (2007) Anxiety, depression, and cause-specific mortality: the HUNT study. Psychosomatic Medicine 69(4), 323-331. National Bureau of Statistics of China. (2011) Major figures of the sixth national population census. Retrieved from http://www.stats.gov.cn/zgrkpc/dlc/yw/t20110428_402722384.htm on 10 May 2011. 304 Netuveli G. & Blane D. (2008) Quality of life in older ages. British Medical Bulletin 85(1), 113-126. Netuveli G., Wiggins R.D., Hildon Z., Montgomery S.M. & Blane D. (2005) Quality of life at older ages: evidence from English longitudinal study of aging (wave 1). Journal of Epidemiology and Community Health 60 (4), 357-363. Neugarten B.L., Havighurst R.J. & Tobin S.S. (1961) The measurement of life satisfaction. Journal of Gerontology 16(2), 134-143. Newton R.R. & Rudestam K.E. (eds) (1999). Your Statistical Consultant: Answers to Your Data Analysis Questions. SAGE, California. Ng K.M., Lee T.M.C. & Chi I. (2004) Relationship between living arrangements and the psychological well-being of older people in Hong Kong. Australasian Journal on Ageing 23(4), 167-171. Nie H.W., Xu Y., Liu B., Zhang Y.D., Lei T., Hui X.P., Zhang L. & Wu Y. (2011) The prevalence of mild cognitive impairment about elderly population in China: a meta-analysis. International Journal of Geriatric Psychiatry 26(6), 558-563. Nie S. (2004) New demographic features in China and Shanghai region: socio-economic challenges. Retrieved from http://www.sinoptic.ch/shanghaiflash/texts/pdf/200404_Shanghai.Flash.p df on 25 January 2011. Ning H.D., Luo C.S., Zhang Q.X., Zhu Y.H., Wu S.Y., Liang H.Y. & Zhang X. (1999) An epidemiological study on quality of life among elderly population in Shenzhen. Chinese Journal of Prevention and Control of Chronic Non-communicable Diseases 7(4), 1-5. Nitz J.C., Hourigan S.R. & Brown A. (2006) Measuring mobility in frail older people: reliability and validity of the Physical Mobility Scale. Australasian Journal on Ageing 25(1), 31-35. 305 Nordbeck B. (1996) Quality of life and life satisfaction among centenarians. Gerontology Research Centre Lund 21, 1-16. Ocampo J.M. (2010) Self-rated health: importance of use in elderly adults. Colombia Medica 41(3), 275-289. Ou A.H. & Zhu Y. (2000) Analysis of a survey to health condition of the aged group and utilization of health services in Guiyang. Chinese Primary Health Care 14(3), 47-48. Ozturk A., Simsek T.T., Yumin E.T., Sertel M. & Yumin M. (2011) The relationship between physical, functional capacity and quality of life (QoL) among elderly people with a chronic disease. Archives of Gerontology and Geriatrics 53(3), 278-283. Pan J.Y., Zhang M., Wang M., Zan P.X., Wei H.C., Ye D.Q. & Huang F. (2010) Study on sleeping quality and loneliness among elderly people in rural area of Anhui Province. Chinese Journal of Disease Control and Prevention 14(4), 335-337. Paskulin L.M.G. & Molzahn A. (2007) Quality of life of older adults in Canada and Brazil. Western Journal of Nursing Research 29(1), 10-26. Paskulin L., Vianna L. & Molzahn A.E. (2009) Factors associated with quality of life of Brazilian older adults. International Nursing Review 56(1), 109-115. Pei X.M. & Pillai V.K. (1999) Old age support in China: the role of the state and the family. The International Journal of Aging and Human Development 49(3), 197-212. Peng X.Z. (2011) China’s demographic history and future challenges. Science 333(6042), 581-587. Penninx B.W.J.H., van Tilburg T., Kriegsman D.M.W., Deeg D.J.H., Boeke A.J.P. & van Eijk J.T.M. (1997) Effects of social support and personal coping resources on mortality in older age: the longitudinal aging study 306 Amsterdam. American Journal of Epidemiology 146(6), 510-519. Perez F.R., Fernandez-Mayoralas G., Rivera F.E.P. & Abuin J.M.R. (2001) Ageing in place: predictors of the residential satisfaction of elderly. Social Indicators Research 54(2), 173-208. Perry G.R. (1990) Loneliness and coping among tertiary-level adult cancer patients in the home. Cancer Nursing 13(5), 293-302. Persson A. & While A. (2012) Physical activity among older people and related factors. Health Education Journal 71(2), 144-153. Pfeiffer E. (1975) A Short Portable Mental Status Questionnaire for the assessment of organic brain deficit in elderly patients. Journal of the American Geriatrics Society 23(10), 433-441. Phillips D.R., Siu O.L., Yeh A.G.O. & Cheng K.H.C. (2004) Factors influencing older persons’ residential satisfaction in big and densely populated cities in Asia: a case study in Hong Kong. Ageing International 29(1), 46-70. Phillips D.R., Siu O.L., Yeh A.G.O. & Cheng K.H.C. (2005) The impacts of dwelling conditions on older persons’ psychological well-being in Hong Kong: the mediating role of residential satisfaction. Social Science & Medicine 60(12), 2785-2797. Phillips D.R., Siu O.L., Yeh A.G.O. & Cheng K.H.C. (2008) Informal social support and older person’s psychological well-being in Hong Kong. Journal of Cross-Cultural Gerontology 23(1), 39-55. Pinquart M. & Sorensen S. (2001a) Gender differences in self-concept and psychological well-being in old age: a meta-analysis. Journal of Gerontology: Psychological Sciences 56B(4), 195-213. Pinquart M. & Sorensen S. (2001b) Influence on loneliness in older adults: a meta-analysis. Basic and Applied Social Psychology 23(4), 245-266. Polit D.F. & Beck C.T. (eds) (2012) Nursing Research: Generating and Assessing Evidence for Nursing Practice. 9th ed. Lippincott Williams & 307 Wilkins, Philadelphia. Poon C.Y.M. & Fung H.H. (2008) Physical activity and psychological well-being among Hong Kong Chinese older adults: exploring the moderating role of self-construal. The International Journal of Aging and Human Development 66(1), 1-19. Poston D.L., Gu B.C. & Luo H. (2005) The effects of the fertility and mortality transitions on the elderly and eldercare in China. Population Science in China 1, 42-49. Powell D.H. & Whitla D.K. (1994) Normal cognitive aging: toward empirical perspectives. Current Directions in Psychological Science 3(1), 27-31. Prieto-Flores M.E., Forjaz M.J., Fernandez-Mayoralas G.F., Rojo-Perez F. & Martinez-Martin P. (2011) Factors associated with loneliness on noninstitutionalized and institutionalized older adults. Journal of Aging and Health 23(1), 177-194. Pynoos J. & Regnier V. (1991) Improving residential environments for frail elderly: bridging the gap between theory and application. In The Concept and Measurement of Quality of Life in the Frail Elderly (Birren J.E., Lubben J.E., Rowe J.C. & Deutchman D.E. eds). Academic Press, New York. pp 91-117. Qian Z.C. & Zhou M. (2004) Social support and quality of life: China’s oldest-old. Retrieved from http://paa2005.princeton.edu/papers/51243 on 13 September 2012. Rabins P.V., Kasper J.D., Kleinman L., Black B.S. & Patrick D.L. (1999) Concepts and methods in the development of the ADRQL: an instrument for assessing heath-related quality of life in persons with Alzheimer’s disease. Journal of Mental Health and Aging 5(1), 33-48. Rejeski W.J. & Mihalko S.L. (2001) Physical activity and quality of life in older adults. Journal of Gerontology: Series A 56A (Special Issue Ⅱ), 23-35. 308 Ren Z.H. (2002) The life and health status of urban elderly people in Beijing, China. MPhil Thesis, University of Oslo. Rennemark M., Lindwall M., Halling A. & Berglund J. (2009) Relationships between physical activity and perceived qualities of life in old age. Results of the SNAC study. Aging & Mental Health 13(1), 1-8. Rioux L. & Werner C. (2011) Residential satisfaction among aging people living in place. Journal of Environmental Psychology 31(2), 158-169. Rolls L., Seymour J.E., Froggatt K.A. & Hanratty B. (2010) Older people living along at the end of life in the UK: research and policy challenges. Palliative Medicine 25(6), 650-657. Ross C.E. & Wu C.L. (1995) The links between education and health. American Sociological Review 60(5), 719-745. Roth M., Tym E., Mountjoy C.Q., Huppert F.A., Hendrie H., Verma S. & Goddard R. (1986) CAMDEX. A standardised instrument for the diagnosis of mental disorders in the elderly with special reference to the elderly detection of dementia. The British Journal of Psychiatry 149, 698-709. Rovio S., Kareholt I., Helkala E.L., Viitanen M., Winblad B., Tuomilehto J., Soininen H., Nissinen A. & Kivipelto M. (2005) Leisure-time physical activity at midlife and the risk of dementia and Alzheimer’s disease. The Lancet Neurology 4(11), 705-711. Rubenowitz E., Waern M., Wilhelmson K. & Allebeck P. (2001) Life events and psychosocial factors in elderly suicides: a case-control study. Psychological Medicine 31(7), 1193-1202. Ruggeri M., Nose M., Bonetto C., Cristofalo D., Lasalvia A., Salvi G., Stefani B., Malchiodi F. & Tansella M. (2005) Changes and predictors of change in objective and subjective quality of life: multiwave follow-up study in community psychiatric practice. The British Journal of Psychiatry 187, 309 121-130. Russell D., Peplau L.A. & Cutrona C.E. (1980) The revised UCLA loneliness scale: concurrent and discriminant validity evidence. Journal of Personality and Social Psychology 39(3), 472-480. Russell D.W. (1996) UCLA Loneliness Scale (Version 3): reliability, validity, and factor structure. Journal of Personality Assessment 66(1), 20-40. Saito E., Sagawa Y. & Kanagawa K. (2005) Social support as a predictor of health status among older adults living alone in Japan. Nursing and Health Sciences 7(1), 29-36. Salguero A., Martinez-Garcia R., Molinero O. & Marquez S. (2011) Physical activity, quality of life and symptoms of depression in community-dwelling and institutionalized older adults. Archives of Gerontology and Geriatrics 53(2), 152-157. Samawi H.M. (2013) Daily walking and life expectancy of elderly people in the Iowa 65+ Rural Health Study. Frontiers in Public Health. doi: 10.3389/fpubh.2013.00011. Sarwari A.R., Fredman L., Langenberg P. & Magaziner J. (1998) Prospective study on the relation between living arrangement and change in functional health status of elderly women. American Journal of Epidemiology 147(4), 370-378. Savikko N., Routasalo P., Tilvis R.S., Strandberg T.E. & Pitkala K.H. (2005) Predictors and subjective causes of loneliness in an aged population. Archives of Gerontology and Geriatrics 41(3), 223-233. Scafato E., Galluzzo L., Gandin C., Ghirini S., Baldereschi M., Capurso A., Maggi S. & Farchi G. For the ILSA Working Group. (2008) Marital and cohabitation status as predictors of mortality: a 10-year follow-up of an Italian elderly cohort. Social Science & Medicine 67(9), 1456-1464. Schalock R.L. (1990) Attempts to conceptualise and measure quality of life. In 310 Quality of Life: Perspectives and Issues (Schalock R.L. & Begab M.J. eds.). American Association on Mental Retardation, Washington. pp141-148. Schmidt P., Clouth J., Haggenmuller L., Naber D. & Reitberger U. (2006) Constructing an index for the Subjective Well-being Under Neuroleptics scale (SWN), short form: applying structural equation modeling for testing reliability and validity of the index. Quality of Life Research 15(7), 1191-1202. Schwirian K.P. & Schwirian P.M. (1993) Neighboring, residential satisfaction, and psychological well-being in urban elders. Journal of Community Psychology 21(4), 285-299. Sevil U., Ertem G., Kavlak O. & Coban A. (2006) The loneliness level of patients with gynecological cancer. International Journal of Gynecological Cancer 16(Suppl. 1), 472-477. Shah A., Phongsathorn V., Bielawska C. & Katona C. (1996) Screening for depression among geriatric inpatients with short versions of the Geriatric Depression Scale. International Journal of Geriatric Psychiatry 11(10), 915-918. Shanghai Municipal Statistics Bureau. (2009) Shanghai Statistical Yearbook 2009. Retrieved from http://www.stats-sh.gov.cn/tjnj/nj09.htm?d1=2009tjnj/C0306.htm on 25 June 2013. Shanghai Municipal Statistics Bureau. (2011a) Major figures of the Sixth National Population Census of Shanghai in 2010. Retrieved from http://218.242.177.53/rkpc/moban.asp?id=4214 on 10 June 2011. Shanghai Municipal Statistics Bureau. (2011b) Shanghai Statistical Yearbook 2011. Retrieved from http://www.stats-sh.gov.cn/data/toTjnj.xhtml?y=2011e on 1 August 2012. 311 Shanghai Municipal Statistics Bureau. (2012) Shanghai Statistical Yearbook 2012. Retrieved from http://www.stats-sh.gov.cn/data/toTjnj.xhtml?y=2012 on 1 June 2013. Sheikh J.I. & Yesavage J.A. (1986) Geriatric Depression Scale (GDS): recent evidence and development of a shorter version. Clinical Gerontologist 5(1-2), 165-173. Shek D.T.L., Chan Y.K. & Lee P.S.N. (2005) Quality of life in the global context: a Chinese response. Social Indicators Research 71(1), 1-10. Shek D.T.L. & Lee B.M. (2007) A comprehensive review of quality of life (QOL) research in Hong Kong. Scientific World Journal 7, 1222-1229. Shen C. & Williamson J.B. (2010) China’s new rural pension scheme: can it be improved? International Journal of Sociology and Social Policy 30(5/6), 239-250. Shibata A., Oka K., Nakamura Y. & Muraoka I. (2007) Recommended level of physical activity and health-related quality of life among Japanese adults. Health and Quality of Life Outcomes. doi:10.1186/1477-7525-5-64. Shields C.G., Franks P., Harp J.J., McDaniel S.H. & Campbell T.L. (1992) Development of the Family Emotional Involvement and Criticism Scale (FEICS): a self-report scale to measure expressed emotion. Journal of Marital and Family Therapy 18(4), 395-407. Shmuely Y., Baumgarten M., Rovner B. & Berlin J. (2001) Predictors of improvement in health-related quality of life among elderly patients with depression. International Psychogeriatrics 13(1), 63-73. Siddhivinayak H., Sanjay J., Pallavi L. & Dhiraj A. (2010) Social gradients in self-reported health and well-being among adults aged 50 and over in Pune District, India. Global Health Action. doi: 10.3402/gha.v3i0.2128. Siu O.L. & Phillips D.R. (2002) A study of family support, friendship, and psychological well-being among 312 older women in Hong Kong. International Journal of Aging & Human Development 55(4), 299-319. Smilkstein G. (1978) The Family APGAR: a proposal for family function test and its use by physicians. The Journal of Family Practice 6(6), 1231-1239. Smith A.E., Sim J., Scharf T. & Phillipson C. (2004) Determinants of quality of life amongst older people in deprived neighbourhoods. Ageing & Society 24(5), 793-814. Standing Committee of the National People’s Congress. (1996) Law of the People’s Republic of China on Protection of the Rights and Interests of the Elderly. Standing Committee of the National People’s Congress, Beijing. Stanley M., Moyle W., Ballantyne A., Jaworski K., Corlis M., Oxlade D., Stoll A. & Young B. (2010) ‘Nowadays you don't even see your neighbours’: loneliness in the everyday lives of older Australians. Health & Social Care in the Community 18(4), 407-414. Statistics Bureau of Chongming. (2011) Chongming Statistical Yearbook 2009. Retrieved from http://cmtj.shcm.gov.cn/new_cmtjj_tjsj_tjnj/List/index.htm on 4 August 2012. Statistics Bureau of Chongming. (2013) 2012 Chongming National Economy and Social Development Stistical Bulletin. Retrieved from http://cmtj.shcm.gov.cn/new_cmtjj_tjsj_tjgb/2013-04-12/Detail_175787.ht m on 19 May 2013. St. John P.D. & Montgomery P.R. (2010) Cognitive impairment and life satisfaction in older adults. International Journal of Geriatric Psychiatry 25(8), 814-821. Stemmler M., Steinwachs K.C., Lehfeld H., Jentzsch J., Tritt K., Hulla F.W. & Erzigkeit H. (1994) Different methodological approaches for the construction of a therapy sensitive ADL scale for the assessment of 313 Alzheimer patients. In New Trends in the Diagnosis and Therapy of Alzheimer’s Disease (Jellinger K.A., Ladurner G. & Windisch M. eds). Springer, New York. pp 81-90. Su D., Wu X.N., Zhang Y.X., Li H.P., Wang W.L., Zhang J.P., Zhou L.S. (2012) Depression and social support between China’s rural and urban empty-nest elderly. Archives of Gerontology and Geriatrics 55(3), 564-569. Sun R.J. (2002) Older age support in contemporary urban China from both parents’ and children’s perspectives. Research on Aging 24(3), 337-359. Sun W., Watanabe M., Tanimoto Y., Shibutani T., Kono R., Saito M., Usuda K. & Kono K. (2007) Factors associated with good self-rated health of non-disabled elderly living alone in Japan: a cross-sectional study. BMC Public Health. doi: 10.1186/1471-2458-7-297. Sun X.J., Lucas H., Meng Q.Y. & Zhang Y.G. (2011) Associations between living arrangements and health-related quality of life of urban elderly people: a study from China. Quality of Life Research 20(3), 359-369. Sun Y.W., Jiang B.F., Xu T., Huang Y.M., Zeng Y.Y. & Zhong S.H. (2003) The reliability and validity of life quality survey scales for elderly population. Practical Preventive Medicine 10(4), 476-478. Tabachnick B.G. & Fidell L.S. (eds) (2001) Using Multivariate Statistics. 4th ed. Allyn and Bacon, New York. Tang Z., Wang H.X., Meng C., Wu X.G., Ericsson K., Winblad B. & Pei J.J. (1999) The prevalence of functional disability in activities of daily living and instrumental activities of daily living among elderly Beijing Chinese. Archives of Gerontology and Geriatrics 29(2), 115-125. Taylor S.E., Sherman D.K., Kim H.S., Jarcho J., Takagi K. & Dunagan M.S. (2004) Culture and social support: who seeks it and why? Journal of Personality and Social Psychology 87(3), 354-362. 314 Teng E.L. & Chui H.C. (1987) The modified mini-mental state (3MS) examination. The Journal of Clinical Psychiatry 48(8), 314-318. The EuroQol Group. (1990) EuroQol--a new facility of the measurement for health-related quality of life. Health Policy 16(3), 199-208. The EuroQol Group Executive Office. (2011) EQ-5D-3L user guide: basic information on how to use the EQ-5D-3L instrument. Version 4.0. Retrieved from http://www.euroqol.org/fileadmin/user_upload/Documenten/PDF/Folders _Flyers/UserGuide_EQ-5D-3L.pdf on 18 September 2012. The WHOQOL Group. (1995) The World Health Organization quality of life assessment (WHOQOL): position paper from the World Health Organization. Social Science & Medicine 41(10), 1403-1409. The WHOQOL Group. (1998) Development of the World Health Organization WHOQOL-BREF quality of life assessment. Psychological Medicine 28(3), 551-558. The WHOQOL-OLD Group. (2005) The WHOQOL-OLD Manual. World Health Organization Group, Copenhagen. Theeke L.A., Goins R.T., Moore J. & Campbell H. (2012) Loneliness, depression, social support, and quality of life in older chronically ill Appalachians. The Journal of Psychology 146(1-2), 155-171. Tibblin G., Tibblin B., Peciva S., Kullman S. & Svardsudd K. (1990) "The Goteborg Quality of Life Instrument''--an assessment of well-being and symptoms among men born 1913 and 1923. Methods and validity. Scandinavian Journal of Primary Health Care. Supplement 1, 33-38. Tilvis R.S., Jolkkonen K.P.J. & Strandberg T.E. (2000) Social networks and dementia. The Lancet 356(9223), 77-78. Tong H.M., Lai D.W.L., Zeng Q. & Xu W.Y. (2011) Effects of social exclusion on depressive symptoms: elderly Chinese living alone in Shanghai, 315 China. Journal of Cross-Cultural Gerontology 26(4), 349-364. Tsai Y.F., Yeh S.H. & Tsai H.H. (2005) Prevalence and risk factors for depressive symptoms among community-dwelling elders in Taiwan. International Journal of Geriatric Psychiatry 20(11), 1097-1102. Tsai S.Y., Chi L.Y., Lee C.H. & Chou P. (2007) Health-related quality of life as a predictor of mortality among community-dwelling older persons. European Journal of Epidemiology 22(1), 19-26. Tuckman B.W. (1999) Conducting Educational Research. 5th ed. Harcourt Brace College Publisher, Orlando. United Nations. (2001) World population ageing: 1950-2050. United Nations, New York. United Nations. (2005) Living arrangements of older persons around the world. United Nations, New York. United Nations. (2006) Integrating poverty and gender into health programmes: a sourcebook for health professionals. World Health Organization, Geneva. United Nations. (2009) World population ageing 2009. United Nations, New York. Unutzer J., Patrick D.L., Simon G., Grembowski D., Walker E., Rutter C. & Katon W. (1997) Depressive symptoms and the cost of health services in HMO patients aged 65 years and older: a 4-year prospective study. JAMA: the Journal of the American Medical Association 277(20), 1618-1623. Uotinen V., Suutama T. & Ruoppila I. (2003) Age identification in the framework of successful aging: a study of older Finnish people. International Journal of Aging & Human Development 56(3), 173-195. van Gelder B.M., Tijhuis M., Kalmijn S., Giampaoli S., Nissinen A. & Kromhout D. (2006) Marital status and living situation during a 5-year 316 period are associated with a subsequent 10-year cognitive decline in older men: the FINE study. Journal of Gerontology: Psychological Sciences 61B(4), 213-219. Velkoff V.A. (2001) Living arrangements and well-being of the older population: future research directions. Retrieved from www.un.org/esa/population/publications/bulletin42_43/velkoff.pdf on 10 June 2011. Victor C., Scambler S., Bond J. & Bowling A. (2000) Being alone in later life: loneliness, social isolation and living alone. Reviews in Clinical Gerontology 10(4), 407-417. Victor C.R., Scambler S.J., Bowling A. & Bond J. (2005a) The prevalence of, and risk factors for, loneliness in later life: a survey of older people in Great Britain. Ageing & Society 25(6), 357-375. Victor C., Grenade L. & Boldy D. (2005b) Measuring loneliness in later life: a comparison of differing measures. Reviews in Clinical Gerontology 15(1), 63-70. von Heideken Wagert P, Ronnmark B., Rosendahl E., Lundin-Olsson L., Gustavsson J.M., Nygren B., Lundman B., Norberg A. & Gustafson Y. (2005) Morale in the oldest old: the Umea 85+ study. Age and Ageing 34(3), 249-255. Wagstaff A., Yip W., Lindelow M. & Hsiao W.C. (2009) China’s health system and its reform: a review of recent studies. Health Economics 18(Suppl. 2), S7-S23. Wang D.F. (1995) Reliability and validity of the loneliness scale. Chinese Journal of Clinical Psychology 3, 23-25. Wang F. & Liang X. (2010) Study on the financial support of the left-behind rural elderly--a questionnaire survey in rural areas of Henan Province. Journal of Shangqiu Teachers College 26(11), 91-94. 317 Wang G.J., Su X. & Hatton-Yeo A. (2012) The security for Chinese older people in urban-rural one-child families. Working with Older People 16(2), 88-96. Wang G.Y., Zhang X.J., Wang K., Li Y.H., Shen Q., Ge X.J. & Hang W. (2011) Loneliness among the rural older people in Anhui, China: prevalence and associated factors. International Journal of Geriatric Psychiatry 26(11), 1162-1168. Wang H., Kindig D.A. & Mullahy J. (2005) Variation in Chinese population health related quality of life: results from a EuroQol study in Beijing, China. Quality of Life Research 14(1), 119–132. Wang J.J. (2001) Prevalence and correlates of depressive symptoms in the elderly of rural communities in Southern Taiwan. Journal of Nursing Research 9(3), 1-12. Wang J.J., Snyder M. & Kaas M. (2001) Stress, loneliness, and depression in Taiwanese rural community--dwelling elders. International Journal of Nursing Studies 38(3), 339-347. Wang J.Y., Cui N., Ji N.N. & Hu X. (2009) A survey on depression and the influencing factors in the elderly of “empty nest” in an urban area. Jilin Medical Journal 30(18), 2154-2156. Wang L.F. & Shi Y.J. (2008) Social support and mental health of the empty-nest elderly people in urban area. Chinese Mental Health Journal 22(2), 118-122. Wang W.L. (2009) Research on the quality of life for the rural elderly and the ways of living--a study in Guizhou. Journal of Guizhou University (Social Science) 27(5), 84-91. Wang Y.M., Li P., Zhang L.J., Liu F., Li Q.Y. & Wang H. (2010) Analysis on relativity between quality of life and social support of community empty nest elderly. Chinese Nursing Research 24(2c), 490-492. 318 Wang Y.R., Zheng Y.J. & Liang F. (2012) Analysis of the cognitive function status of the empty-nest elderly in Urumqi City. Journal of Nursing Administration 12(1), 12-13. Ware Jr J.E. & Gandek B. (1998) Overview of the SF-36 Health Survey and the International Quality of Life Assessment (IQOLA) Project. Journal of Clinical Epidemiology 51(11), 903-912. Ware Jr J.E., Kosinski M. & Keller S.D. (1996) A 12-item Short-Form Health Survey: construction of scales and preliminary tests of reliability and validity. Medical Care 34(3), 220-233. Watson R. & Thompson D.R. (2006) Use of factor analysis in Journal of Advanced Nursing: literature review. Journal of Advanced Nursing 55(3), 330-341. Wei G.X. (2007) Research on the correlation between senior citizen’s life satisfaction and physical exercise. China Sport Science and Technology 43(2), 55-60. Welch D.C. & West R.L. (1999) The Short Portable Mental Status Questionnaire: assessing cognitive ability in nursing home residents. Nursing Research 48(6), 329-332. Wiener J.M., Hanley R.J., Clark R. & Van Nostrand J.F. (1990) Measuring the activities of daily living: comparisons across national surveys. Journal of Gerontology 45(6), S229-S237. Wiersma W. & Jurs S.G. (eds) (1990) Educational Measurement and Testing. 2nd ed. Allyn and Bacon, Boston. Wilson K., Mottram P. & Sixsmith A. (2007) Depressive symptoms in the very old living alone: prevalence, incidence and risk factors. International Journal of Geriatric Psychiatry 22(4), 361-366. Windle K., Francis J. & Coomber C. (2011) Preventing loneliness and social isolation: interventions and outcomes. Social Care Institute for 319 Excellence. Research Briefing No. 39. Retrieved http://www.scie.org.uk/publications/briefings/files/briefing39.pdf from on 23 December 2012. Windley P.G. & Scheidt R.J. (1983) Housing satisfaction among rural small-town elderly: a predictive model. Journal of Housing for the Elderly 1(2), 57-68. Wong E., Woo J., Hui E. & Ho S.C. (2004) Examination of the Philadelphia Geriatric Morale Scale as a subjective quality-of-life measure in elderly Hong Kong Chinese. The Gerontologist 44(3), 408-417. Wong S.T., Yoo G.J. & Stewart A.L. (2007) An empirical evaluation of social support and psychological well-being in older Chinese and Korean immigrants. Ethnicity & Health 12(1), 43-67. Wong Y.C. & Leung J. (2012) Long-term care in China: issues and prospects. Journal of Gerontological Social Work 55(7), 570-586. Wong Y.S. & Verbrugge L.M. (2009) Living alone: elderly Chinese Singaporeans. Journal of Cross-Cultural Gerontology 24(3), 209-224. Woo J., Ho S.C., Lau J., Yuen Y.K., Chiu H., Lee H.C. & Chi I. (1994) The prevalence of depressive symptoms and predisposing factors in an elderly Chinese population. Acta Psychiatrica Scandinavica 89(1), 8–13. Woo J., Ho S.C. & Wong E.M.C. (2005) Depression is the predominant factor contributing to morale as measured by the Philadelphia Geriatric Morale Scale in elderly Chinese aged 70 years and over. International Journal of Geriatric Psychiatry 20(11), 1052-1059. Wood V., Wylie M.L. & Sheafor B. (1969) An analysis of a short self-report measure of life satisfaction: correlation with rater judgements. Journal of Gerontology 24(4), 465-469. Worden R.L., Savada A.M. & Dolan R.E. (1987) China: a country study. GPO for the Library of Congress, Washington. 320 World Health Organization. (1946) Preamble to the Constitution of the World Health Organization as adopted by the International Health Conference, New York, 19-22 June, 1946; signed on 22 July 1946 by the representatives of 61 States (Official Records of the World Health Organization, no. 2, p. 100) and entered into force on 7 April 1948 (Citation as instructed). World Health Organization. (1977) Prevention of mental disorders in the elderly. World Health Organization, Copenhagen. World Health Organization. (2002) Active ageing. A policy framework. World Health Organization, Geneva. World Health Organization. (2003) Ageing and health: a health promotion approach for developing countries. World Health Organization, Manila. World Health Organization. (2004) World health report. World Health Organization, Geneva. World Health Organization. (2005) Active aging: a policy framework. Pan American Health Organization, Brasilia. World Health Organization. (2008) WHO global report on falls prevention in older age. World Health Organization, Geneva. World Health Organization. (2010) Global recommendations on physical activity for health. World Health Organization, Geneva. World Health Organization. (2011a) Noncommunicable diseases: country profiles 2011. World Health Organization. Geneva. World Health Organization. (2011b) Global health and aging. Retrieved from: http://www.who.int/ageing/publications/global_health/en/ on 14 November 2013. World Health Organization. (2012) Cardiovascular diseases (CVDs). Retrieved from: http://www.who.int/mediacentre/factsheets/fs317/en/index.html 321 on 26 October 2012. Wu Z.Q., Sun L., Sun Y.H., Zhang X.J., Tao F.B. & Cui G.H. (2010) Correlation between loneliness and social relationship among empty nest elderly in Anhui rural area, China. Aging & Mental Health 14(1), 108-112. Xiang Y.T., Weng Y.Z., Leung C.M., Tang W.K. & Ungvari G.S. (2008) Subjective quality of life in outpatients with schizophrenia in Hong Kong and Beijing: relationship to socio-demographic and clinical factors. Quality of Life Research 17(1), 27-36. Xiao S.Y. (1994) The theoretical basis and applications of Social Support Rate Scale. Journal of Clinical Psychiatry 4(2), 98-100. Xiao S.Y. (1999) The Social Support Rate Scale. In The Handbook of Mental Health Rating Scales (Wang X.D., Wang X.L. & Ma H. eds). Chinese Mental Health Journal Press, Beijing. pp 127-131. Xiao Y.G. & Song G.J. (2006) Investigation on the community elderly people’s health status and requirements on nursing service. Journal of Nursing Administration 6(2), 9-12. Xie A. (2004) China population ageing: the current situation, prospect and characteristic. Statistical Research 8, 50-53. Xie J. & Gao Y.B. (2010) The cognitive function and its influencing factors of community-dwelling older people. Chinese Journal of Gerontology 30(24), 3759-3761. Xie L.Q., Zhang J.P., Peng F. & Jiao N.N. (2010) Prevalence and related influencing factors of depressive symptoms for empty-nest elderly living in the rural area of YongZhou, China. Archives of Gerontology and Geriatrics 50(1), 24-29. Xing F.M., Tian X.F. & Li J.M. (2005) Depressive status in retired elderly people and community nursing intervention. Chinese Journal of Clinical Rehabilitation 9(12), 222-223. 322 Xu J., Luo J.J., Hu J.Q., Wang W., Wang C., Luo J.N. & Chen W. (2007) Analysis on health need and utilization for the elderly in Gonghexin Community in Shanghai. Chinese Primary Health Care 21(9), 24-26. Yahaya N., Abdullah S.S., Momtaz Y.A. & Hamid T.A. (2010) Quality of life of older Malaysians living alone. Educational Gerontology 36(10-11), 893-906. Yang H.Q. (1996) The distributive norm of monetary support to older parents: a look at a township in China. Journal of Marriage and the Family 58(2), 404-415. Yang K.M. & Victor C.R. (2008) The prevalence of and risk factors for loneliness among older people in China. Ageing & Society 28(3), 305-327. Yang L., Cui Y., Tan D. & Fang P.Q. (2008) Study on the health status and application of health service of old population in rural area. Modern Preventive Medicine 35(6), 1076-1077. Yao C.S., He N.L. & Shen Q. (1995) The subjective well-being and its related factors of people in senior-citizen university. Chinese Mental Health Journal 9(6), 153-154. Yao G., Chung C.W., Yu C.F. & Wang J.D. (2002) Development and verification of validity and reliability of the WHOQOL-BREF Taiwan version. Journal of the Formosan Medical Association 101(5), 342-351. Yao S.Q., Zeng H. & Sun S.Y. (2009) Investigation on status and influential factors of cognitive function of the community-dwelling elderly in Changsha City. Archives of Gerontology and Geriatrics 49(3), 329-334. Yeh S.C.J. & Liu Y.Y. (2003) Influence of social support on cognitive function in the elderly. BMC Health Services Research. doi: 10.1186/1472-6963-3-9. Yeh S.C.J. & Lo S.K. (2004) Living alone, social support and feeling lonely 323 among the elderly. Social Behavior and Personality: an International Journal 32(2), 129-138. Yesavage J.A., Brink T.L., Rose T.L., Lum O., Huang V., Adey M. & Leirer V.O. (1983) Development and validation of a geriatric depression screening scale: a preliminary report. Journal of Psychiatry Research 17(1), 37-49. Yeung G.T.Y. & Fung H.H. (2007) Social support and life satisfaction among Hong Kong Chinese older adults: family first? European Journal of Ageing 4(4), 219-227. Yip K.S. (2003) Gender differences in mental illness in Hong Kong. Administration and Policy in Mental Health 30(4), 361-368. Yu C.M., Wu Y.Q., Yang Y.Q., Jiang L.P., Zhu X.H. & Li P. (2008) Analysis of the relationship between social support and quality of life of community empty nest elderly in Wenzhou. Chinese Journal of Nursing 43(5), 465-467. Yu E.S.H., Liu W.T., Levy P., Zhang M.Y., Katzman R., Lung C.T., Wong S.C., Wang Z.Y. & Qu G.Y. (1989) Cognitive impairment among elderly adults in Shanghai, China. Journal of Gerontology 44(3), S97-S106. Yu P.L., Yang C.Y. & He H.D. (1996) Recommended content and evaluation criteria of quality of life of older people (draft). Chinese Journal of Geriatrics 15(5), 320. Yu W. & Xu G.L. (2006) The DINK pattern of the second generation of the works from countryside and the older person lives alone--expanded connotation and extension of the DINK family pattern. Northwest Population Journal 110(4), 19-22. Zebardast E. (2009) The housing domain of quality of life and life satisfaction in the spontaneous settlements on the Tehran Metropolitan Fringe. Social Indicators Research 90(2), 307-324. Zeng Y. & Wang Z.L. (2003) Dynamics of family and elderly living 324 arrangements in China: new lessons learned from the 2000 Census. The China Review 3(2), 95-119. Zhan L. (1992) Quality of life: conceptual and measurement issues. Journal of Advanced Nursing 17(7), 795-800. Zhang H.C., Zhang X.F. & Guo S.Z. (2010) Relationship between mental health and social support in elderly people living alone. Chinese Journal of Public Health 26(4), 466-467. Zhang J.P., Huang H.S., Ye M. & Zeng H. (2008) Factors influencing the subjective well being (SWB) in a sample of older adults in an economically depressed area of China. Archives of Gerontology and Geriatrics 46(3), 335-347. Zhang L. (2010) Shanghai coming to grip with its aging population problems. EAI Background Brief No. 517. Retrieved from http://www.eai.nus.edu.sg/BB517.pdf on 22 September 2012. Zhang L., Shao C., Wang B., Long Y., Zhang Z.Y. & Li L.S. (2004) An evaluation of validity and reliability on Chinese version of the SF-36 health survey scales using for the Chinese military elderly. Chinese Journal of Geriatrics 23(2), 112-114. Zhang M.Y., Elena Y. & He Y.L. (1995) Activity of Daily Living Scale and its instruction. Shanghai Archives of Psychiatry Special, 5-6. Zhang Q., Zhang Q. & Li N.X. (2007) Analysis of quality of life and its influence factors of elderly persons in urban in Chengdu. Journal of Hygiene Research 36(5), 584-586. Zhang T.H. & Chen Y.D. (2006) Meeting the needs of elderly people in China. BMJ 333(7564), 363-364. Zhang W.H., Zhao G.F., Liu X.C., Ma D.D., Wang G.X. & Li C.Q. (2001) Cognitive function and related factors of urban elderly: a cross-sectional study. Chinese Mental Health Journal 15(5), 327-330. 325 Zhang X.J., Sun L., Yu Y.L., Shen Q., Zhang Z.H., Cui G.H., Zhang D.D. & Sun Y.H. (2010) Correlation between loneliness, family function and social support among elderly people. Chinese Journal of Clinical Psychology 18(1), 109-110. Zhang Z., Qian L.M., Miao J. & Wang R.X. (2010) A survey on depression and its influencing factors in the elderly of ‘empty nest’ in Kunming. The Journal of Practical Medicine 26(11), 2029-2031. Zhao F. & Xu Y. (2003) The analysis of the elderly’s life patterns and social support system in empty nest family. Journal of Nanjing Normal University 3, 61-67. Zhao F.L., Yue M., Yang H., Wang T., Wu J.H. & Li S.C. (2010) Validation and comparison of EuroQol and short form 6D in chronic prostatitis patients. Value in Health 13(5), 649–656. Zhao H.S., Xu A.Q., Jin Y.L. & Huang S.P. (2009) Quality of life of rural empty-nest older people in Xuzhou. Chinese Journal of Gerontology 29(8), 1006-1008. Zhong H.S., Kuang X.C., Wang Y.S., Xiao L.H. & Li Z.L. (1999) Research on the older people community nursing in Guangzhou City. Chinese Journal of Practical Nursing 15(5), 46-48. Zhong R.Y. (2004) An analysis of the living condition of the elders living alone in Shanghai and the policy related. Journal of Social Science 8, 66-70. Zhou B., Chen K., Wang J.F., Wang H., Zhang S.S. & Zheng W.J. (2011) Quality of life and related factors in the older rural and urban Chinese populations in Zhejiang Province. Journal of Applied Gerontology 30(2), 199-225. Zhou C.C., Chu J., Xu X.C., Qin X., Chen R.L. & Hu Z. (2008) Survey on depression of empty nest aged people in rural community of Anhui Province. Chinese Mental Health Journal 22(2), 114-117. 326 Zhu S.L. & He G.P. (2005) The influencing factors of quality of life of older people. Modern Nursing 11(19), 1604-1606. Zimmer Z. & Kwong J. (2004) Socioeconomic status and health among older adults in rural and urban China. Journal of Aging and Health 16(1), 44-70. Zywno M.S. (2003). A contribution to validation of score meaning for Felder-Soloman’s Index of learning styles. 2003 American Society for Engineering Education Annual Conference & Exposition. Retrieved from http://www4.ncsu.edu/unity/lockers/users/f/felder/public/ILSdir/Zywno_V alidation_Study.pdf on 22 October 2012. 327 APPENDICES Appendix 1 Quality of life of older people in China: a systematic review 328 329 330 331 332 333 334 335 336 337 338 339 340 341 Appendix 2 Depression and related factors in older people in China: a systematic review 342 343 344 345 346 347 348 349 350 351 352 353 354 355 356 357 Appendix 3 Loneliness and Social support of older people in China: a systematic literature review 358 359 360 361 362 363 364 365 366 367 368 Appendix 4 Questionnaire in the pilot study (English) N Florence Nightingale School of Nursing & Midwifery Older people living alone in Chongming This questionnaire is for a postgraduate research project. The project aims to explore the health status, life circumstances and quality of life of older people living alone in Chongming. Please complete the questionnaire according to the instructions set out in each section. There are no right or wrong answers. If you feel any of the questions inappropriate for you, please do not feel that you have to answer them. All the information will remain confidential to research team. Thank you for your participation and cooperation. 369 Section A: About cognitive function Instructions to the interviewer: Ask all the questions (1-10) and record all the answers. (Ask question 4a only if the resident does not have a telephone.) Record the total number of errors based on the answers to the 10 questions. Pre-question: What education has the respondent had? No formal education Primary school only Junior high school only Senior high school only Question College or above (√) if Response incorrect 1. What is today’s date (including month, day and year)? 2. What is the day of the week? 3. What is the name of this place? 4. What is your phone number? 4a. What is your street address? (Ask only if resident does not have a telephone) 5. How old are you? 6. When were you born? 7. Who is the current Chinese President? 8. Who was the Chinese President before him? 9. What is your mother’s name? 10. Can you count backward from 20 by 3’s? Score: Total Errors: Adjustments (+): Adjustments (-): Total Adjusted Score: © by Eric Pfeiffer (1974) 370 Section B: About your activities of daily living The following statements are about some of your activities of daily living. For each item please tick the appropriate box that best describes you. Can you finish the following tasks by yourself? Tasks Totally With With Totally independent some help a lot of help dependent 1. Going out by public transportation 2. Physical ambulation 3. Cooking 4. Feeding 5. House keeping 6. Doing laundry 7.Taking medicine 8. Shopping 9. Handling your own money 10. Making a telephone call 11. Dressing 12. Grooming 13. Taking a bath or shower 14. Getting to the bathroom on time © by Zhang et al. (1995) 371 Section C: About your physical activity and health C1 The following items are about your regular activities. Please rate how often you spent exercising for at least half an hour in total in each of the following activities per week in the last 4 weeks. Your activities Never 1-2 3-4 5-7 days days days Sitting activities such as reading or watching TV etc. Walking outside your home for any reason such as fun, exercise, shopping etc. Light exercise such as walking, tai chi, fishing etc. Moderate exercise such as carrying light loads, bicycling at a regular pace etc. Strenuous exercise such as jogging, swimming, heavy lifting, fast bicycling etc. Light house work such as dusting or washing dishes Heavy housework such as vacuuming, scrubbing floors, cleaning windows etc. C2 How would you rate your current health status? (Please tick one box) Very good Good Neutral Poor Very poor C3 Do you have any chronic diseases? No Yes (if, please list all chronic diseases) C4 In the last 4 weeks, have you suffered from any kind of acute diseases? Yes No (Skip to question C6) 372 Don’t know/ Not sure C5 Did you go to seek health services? Yes (if, what kind of hospital did you attend?) Community hospital Township hospital The Central Hospital of Chongming County Tertiary hospital Other (Please add more information)_________________________ No (if, please state the reason) C6 On the whole, how satisfied are you with the health services? (Please tick one box) Very satisfied Satisfied Neutral Dissatisfied Very dissatisfied Section D: About your social support The following statements are about your social support. For each item please tick the appropriate box that gives the best answer for you. 1. How many close friends do you have who can help you or support you? None 1-2 3-5 6 or more None 2. To what extent do you receive support from your neighbours? 3. To what extent do you receive support from your former or current colleagues? 4. To what extent do you receive support from your spouse /partner? 5. To what extend do you receive support from your parents? 6. To what extent do you receive support from your children? 7. To what extent do you receive support from your siblings? 8. To what extent do you receive support from other family members? 373 Little Some A lot Never Rarely Sometimes Always 9. How often do you confide when you are in trouble? 10. How often do you ask for help when you are in trouble? 11. How often do you attend social activities? 12. Who has given you financial support and helped to solve problems when you were in trouble in the past? (Please tick as many boxes as apply) No one Spouse/Partner Children Other family members Friends Relatives Colleagues Work units Official organizations Social organizations Other (Please add more information) 13. Who has given you emotional support when you were in trouble in the past? (Please tick as many boxes as apply) No one Spouse/Partner Children Other family members Friends Relatives Colleagues Work units Official organizations Social organizations Other (Please add more information) © by Shui Yuan Xiao (1999) Section E: About your quality of life The following items are about your quality of life. For each item please tick the appropriate box that best describes you/your view. Thinking about both the good and bad things about your life, how would you rate the quality of your life as a whole? Very good Good Neutral Poor 374 Very poor To what extend do you agree or disagree with each of the following statements? Strongly agree I enjoy my life overall. I am happy much of the time. I look forward to things. Life gets me down. I have a lot of physical energy. Pain affects my well-being. My health restricts me looking after myself or my home. I am healthy enough to get out and about. My family, friends or neighbours would help me if needed. I would like more companionship or contact with other people. I have someone who gives me love and affection. I’d like more people to enjoy life with. I have my children around which is important. I am healthy enough to have my independence. I can please myself what I do. The cost of things compared to my pension/income restricts my life. I have a lot of control over the important things in my life. I feel safe where I live. The local shops, services and facilities are good overall. I get pleasure from my home. 375 Agree Neitheragree Disagree Strongly nordisagree disagree Strongly agree I find my neighbourhood friendly. I take life as it comes and make the best of things. I feel lucky compared to most people. I tend to look on the bright side. If my health limits social/leisure activities, then I will compensate and find something else I can do. I have enough money to pay for household bills. I have enough money to pay for household repairs or help needed in the house. I have enough money to afford my health-care expenses. I can afford to buy what I want to. I cannot afford to do things I would enjoy. I have social or leisure activities/hobbies that I enjoy doing. I try to stay involved with things. I do paid or unpaid work or activities that give me a role in life. I have responsibilities to others that restrict my social or leisure activities. Religion, belief or philosophy is important to my quality of life. Cultural/religious events/festivals are important to my quality of life. © by Ann Bowling (2009) 376 Agree Neitheragree Disagree Strongly nordisagree disagree Section F: About where you live In which area do you live? Urban Rural What is your housing type? Public rental housing Private housing The following items are about your home. Please rate how satisfied are you with the following conditions. Very Satisfied Neutral Dissatisfied Very dissatisfied satisfied Dwelling size Bathroom Kitchen Distance from children or relatives Convenience of public transport Dwelling condition overall Section G: About yourself What is your date of birth? What is your gender? Male Female What is your ethnic group? What is your current marital status? Widowed Divorced Separate Never married Other (Please add more information) ____________________________ How many living children do you have? _____________ What is or was your occupation (current or before retirement)? In total, how much money do you have per month? (unit: RMB) <500 500-999 1000-1499 1500-1999 2000-2499 2500-2999 3000-3999 ≥4000 377 Section H: About your feelings The following statements describe how you have felt the past week. For each item please tick the appropriate box that gives the best answer for you. Yes 1. Are you basically satisfied with your life? 2. Have you dropped many of your activities and interests? 3. Do you feel that your life is empty? 4. Do you often get bored? 5. Are you in good spirits most of the time? 6. Are you afraid that something bad is going to happen to you? 7. Do you feel happy most of the time? 8. Do you feel helpless? 9. Do you prefer to stay at home, rather than going out and doing new things? 10. Do you feel you have more problems with your memory than most? 11. Do you think it is wonderful to be alive? 12. Do you feel pretty worthless the way you are now? 13. Do you feel full of energy? 14. Do you feel that your situation is hopeless? 15. Do you think that most people are better off than you are? © by Lee et al. (1993) 378 No The following statements describe how often you feel. For each item please tick the appropriate box that gives the best answer for you. Never 1. How often do you feel that you are “in tune” with the people around you? 2. How often do you feel that you lack companionship? 3. How often do you feel that there is no one you can turn to? 4. How often do you feel alone? 5. How often do you feel part of a group of friends? 6. How often do you feel that you have a lot in common with the people around you? 7. How often do you feel that you are no longer close to anyone? 8. How often do you feel that your interests and ideas are not shared by those around you? 9. How often do you feel outgoing and friendly? 10. How often do you feel close to people? 11. How often do you feel left out? 12. How often do you feel that your relationships with others are not meaningful? 13. How often do you feel that no one really knows you well? 14. How often do you feel isolated from others? 15. How often do you feel you can find companionship when you want it? 16. How often do you feel that there are people who really understand you? 17. How often do you feel shy? 18. How often do you feel that people are around you but not with you? 19. How often do you feel that there are people you can talk to? 20. How often do you feel that there are people you can turn to? © by Ping Liu (1999) 379 Rarely Sometimes Always Is there anything that you would like to tell me about being an older person living alone? Thank you very much for taking time to complete this questionnaire. For more information about this research, please contact Yu Chen on 13916878278. 380 Appendix 5 Questionnaire in the pilot study (Chinese) N Florence Nightingale School of Nursing & Midwifery 崇明县独居老人生活状况调查 此问卷为博士生课题研究所用,旨在了解崇明县独居老人的生活状况。请 根据您的实际情况仔细填写问卷,答案无所谓对与错、好与坏,只要反映您的 真实想法即可。您有权拒绝不愿意回答的问题。问卷只做学术研究之用,所有 资料保密。谢谢您的参与和配合! 381 请提问下列所有问题并记录相应回答。如果回答错误,请在“错”一栏的对应 题目处打“√”。 填表日期: ____年___月___日 受访者文化程度: 不识字 小学 高中/职校/技校/中专 大专/本科及以上 问题 初中 回 答 1. 今天是几年几月几日? 2. 今天是星期几? 3. 您现在在什么地方? 4. 您的电话号码是多少?(如果没有电话改 问地址) 5. 您今年几岁? 6. 您的出生年月日是多少? 7. 现任国家总书记是谁? 8. 前任国家总书记是谁? 9. 您的妈妈叫什么名字? 10. 20-3=___-3=___-3=___-3=___ -3=___-3=___ 总分: 回答错误的题目数: 调整后总分: © by Eric Pfeiffer (1974) 上述 10 项内容中若有表述不清的地方,请提出修改意见。 382 错 第一部分 日常生活能力 以下事项您是否能自己完成?请在表格中对应选项处打“√”。 项目 自己完全可以做 需要一些 帮助 需要较多 帮助 1. 坐车外出 2. 走路 3. 做饭 4. 吃饭 5. 做家务 6. 洗衣服 7. 吃药 8. 买东西 9. 处理自己的钱财 10. 打电话 11. 穿衣服 12. 梳头、刷牙等 13. 洗澡 14. 及时上厕所 © by Zhang et al. (1995) 上述 14 项内容中若有表述不清的地方,请提出修改意见。 383 自己完全 不能做 第二部分 身体活动及健康状况 1. 请问在过去 4 个星期,您每星期进行几次以下的活动(每天累计时间超过半 小时算一次)?请在表格中对应选项处打“√”。 不知道/ 项目 从不 1-2 天 3-4 天 5-7 天 不确定 静坐的活动,比如看书、看 电视等 因任何原因而走出家门(比 如娱乐、锻炼、买东西或其 他原因等) 轻度活动,比如散步、打太 极拳、钓鱼等 中等强度活动,比如提较轻 的物品、以一般速度骑自行 车等 高强度活动,比如慢跑、游 泳、提重物、快速骑自行车 等 轻体力家务劳动,比如掸灰 尘、洗碗等 重体力家务劳动,比如擦地 板、擦窗子等 2. 您认为您目前的身体状况如何? 非常好 好 一般 差 非常差 3. 您是否患有慢性疾病? 否 是 (请列出所有您患的慢性疾病) 4. 在过去 4 个星期,您有没有得过其他急性的疾病? 有 没有(请跳至第 6 题继续回答) 384 5. 您有没有去医院看病? 有(您去了哪类医院看病?) 村卫生室/社区卫生服务中心 县中心医院 乡镇医院 市三级医院 其他 (请说明) 没有(请说明原因) 6. 从总体来讲,您对于医疗保健服务的满意度如何? 非常满意 满意 一般 不满意 非常不满意 上述内容若有表述不清的地方,请提出修改意见。 第三部分 社会支持 以下问题用于反映您在社会中所获得的支持,请根据您的实际情况在对应选项 处打“√”。 1. 您有几个关系密切,可以得到支持和帮助的朋友? 一个也没有 1-2 个 3-5 无 2. 您的邻居给予您多少支持和照顾? 3. 您以前或现在的同事给予您多少支持和照顾? 4. 您的配偶 (恋人) 给予您多少支持和照顾? 385 6 个或 6 个以上 极少 一般 非常多 无 极少 一般 非常多 5. 您的父母给予您多少支持和照顾? 6. 您的子女给予您多少支持和照顾? 7. 您的兄弟姐妹给予您多少支持和照顾? 8. 您的其他家庭成员给予您多少支持和照顾? 从不 偶尔 有时 总是 9. 当您遇到烦恼时,您是否会向他人倾诉? 10. 当您遇到烦恼时,您是否向他人请求帮助? 11. 您是否参加团体(如党团组织、宗教组织、 工会等)组织的活动? 12. 在您遇到急难情况时,曾经得到的经济支持和解决实际问题的帮助的来源 有:(可多选) 无任何来源 配偶/恋人 子女 其他家人 朋友 亲戚 同事 工作单位 党团工会等官方组织 宗教、社会团体等非官方组织 其他(请列出) 13. 在您遇到急难情况时,曾经得到的安慰和关心的来源有:(可多选) 无任何来源 配偶/恋人 子女 其他家人 朋友 亲戚 同事 工作单位 党团工会等官方组织 宗教、社会团体等非官方组织 其他(请列出) © by Shui Yuan Xiao (1999) 上述内容若有表述不清的地方,请提出修改意见。 386 第四部分 生活质量 以下问题有关您的生活质量,请根据您的实际情况或真实想法在对应选项处打 “√”。 1. 总的来说,您如何评价自己的生活质量? 非常好 好 一般 差 非常差 2. 您是否同意以下观点: 非常 同意 总的来说,我很享受我的生活。 我大部分时间都很快乐。 我对生活充满期待。 生活让我沮丧。 我有充沛的精力。 疼痛影响了我的健康。 我的身体状况让我不能自己照顾自 己。 我身体还行,可以出门走走。 我的家人、朋友或邻居能在我有需要 的时候帮助我。 我希望能跟更多人在一起或多接触 其他人。 有人爱我、关心我。 我希望有更多的人和我一起享受生 活。 我的子女在身边,这对我很重要。 我很健康,能独立生活。 我能做我想做的事。 跟我的收入比起来,现在的物价影响 了我的生活。 我自己决定生活中很多重要的事情。 387 同意 中立 不同意 非常不 同意 非常 同意 同意 我住的地方很安全。 总的来说,家附近的商店、设施以及 其他服务都不错。 在家里我感到很愉快。 邻居们都很友好。 我主张随其自然,尽力而为。 跟大部分人比起来,我觉得自己很幸 运。 凡事我都试图往好的一面去想。 如果我的身体状况限制了社交或休 闲活动,我会做些力所能及的事补 偿。 我有足够的钱支付水、电、煤等日常 家庭开支 我有足够的钱支付房屋维修、翻新等 费用 我有足够的钱支付医疗费用。 我可以买我想买的东西。 我没有足够钱做我想做的事。 我有喜欢的社交、休闲活动或兴趣爱 好。 我试图参与做一些事情。 我从事有偿或无偿的工作或活动,让 自己有所作为。 我要照顾其他人,这阻碍了我的社交 或休闲活动。 宗教、信仰、生活理念对我的生活质 量很重要。 文化/宗教的活动/仪式对我的生活质 量很重要 © by Ann Bowling (2009) 上述内容若有表述不清的地方,请提出修改意见。 388 中立 不同意 非常不 同意 第五部分 1. 您住在: 居住情况 城镇 2. 您的房子属于 农村 租的房子 买的商品房/造的私房 3. 您是否满意目前的居住条件?请在对应选项处打“√”。 非常满意 满意 中立 不满意 非常不满意 居住面积 卫生间 厨房 到子女或亲戚家的方 便程度 到最近的公交车站的 方便程度 总的居住条件 上述内容若有表述不清的地方,请提出修改意见。 第六部分 您的基本情况 以下问题关于你的一些基本情况,请在横线处如实回答,或在对应选项处打“√”。 1. 出生年月:__________ 年____________ 月 2. 性别: 男 女 3. 民族:_______________ 4. 目前的婚姻状况: 丧偶 离异 分居 未婚 其他 5. 您现有几个子女?_________________ 6. 工作(请回答您现在的工作或退休前的工作)_______________________ 389 7. 您个人月平均收入(元): <500 500-999 1000-1499 1500-1999 2000-2499 2500-2999 3000-3999 ≥4000 第七部分 您的感受 以下问题关于您最近一周的感受,请选择最切合您情况的答案并在对应选项处 打“√”。 是 1. 您对生活基本上满意吗? 2. 您是否已放弃了许多活动与兴趣? 3. 您是否觉得生活空虚? 4. 您是否常感到厌倦? 5. 您是否大部分时间精力充沛? 6. 您是否害怕会有不幸的事落到您头上? 7. 您是否大部分时间感到幸福? 8. 您是否常感到孤立无援? 9. 您是否宁愿待在家里而不愿出去做些新鲜的事? 10. 您是否觉得记忆力比以前差? 11. 您觉得现在活着很惬意吗? 12. 您是否觉得像现在这样活着毫无意义? 13. 您觉得生活充满活力吗? 14. 您是否觉得您的处境已毫无希望? 15. 您是否觉得大多数人比您强得多? © by Lee et al. (1993) 上述 15 项内容中若有表述不清的地方,请提出修改意见。 390 否 下列是人们有时出现的一些感受。对每项描述,请指出您具有那种感受的频度, 并在对应选项处打“√”。 从不 1. 您常感到与周围人的关系和谐吗? 2. 您常感到缺少伙伴吗? 3. 您常感到没人可以信赖吗? 4. 您常感到寂寞吗? 5. 您常感到属于朋友中的一员吗? 6. 您常感到与周围的人有许多共同点吗? 7. 您常感到与任何人都不亲密了吗? 8. 您常感到您的兴趣与想法和周围的人不一样 吗? 9. 您常感到想要与人来往、结交朋友吗? 10. 您常感到与人亲近吗? 11. 您常感到被人冷落吗? 12. 您常感到您与别人来往毫无意义吗? 13. 您常感到没有人很了解您吗? 14. 您常感到与别人隔开了吗? 15. 您常感到当您愿意时就能找到伙伴吗? 16. 您常感到有人真正了解您吗? 17. 您常感到羞怯吗? 18. 您常感到人们围着您但并不关心您吗? 19. 您常感到有人愿意与您交谈吗? 20. 您常感到有人值得您信赖吗? © by Ping Liu (1999) 上述 20 项内容中若有表述不清的地方,请提出修改意见。 391 很少 有时 一直 其他意见或建议: 再次感谢您的配合和参与! 如想了解更多有关此次调查的情况,请联系: 陈瑜 (13916878278)。 392 Appendix 6 Ethical approval Yu Chen Room 1.32 James Clerk Maxwell Building 57 Waterloo Road SE1 8WA 20 July 2011 Dear Yu Chen PNM/10/11-147 An exploratory study of older people living alone in Chongming, Shanghai Thank you for sending in the amendments requested to the above project. I am pleased to inform you that these meet the requirements of the PNM RESC and therefore that full approval is now granted with the following provisos: 1. Section 1.4: Notify the Research Ethics Office of the identities of the data collection assistants once these are known. 2. Section 2.7: The Committee believes that your answer here should be ‘yes’ but assumes that an appropriate risk assessment has been, or will be, conducted. 3. Section 2.9: As the study is taking place overseas, it may not be automatically covered by King’s College London’s insurance policy. You should consult the following page of our website and contact the Finance department for further advice with respect to ensuring you have the necessary insurance cover for the study before the study commences: http://www.kcl.ac.uk/about/structure/admin/finance/staff/insurance/trials.html . Note that you can only commence the study once confirmation has been given by the Finance department with respect to any additional insurance arrangements needed. 4. Section 5.1: In future, please expand upon the justification for your sample size. 5. Submit, for record, copies of approach letters to gatekeeper organisations. 6. Submit, for record, copies of permission letters from gatekeeper organisations. 7. Please note that it is your responsibility to ensure that you have secured all of the necessary legal and ethical permissions required to conduct the study in China. 8. Information Sheet: i. Provide examples of the type of questions that will be posed to respondents. ii. Specify the incentive that will be offered to participants. 393 9. Consent form: The second bullet point should read “… with draw my data after the point of …” Please note that you are not required to submit responses to the above provisos. We will assume you will carry these out where appropriate as the above are conditions of your approval. Please ensure that you follow all relevant guidance as laid out in the King's College London Guidelines on Good Practice in Academic Research (http://www.kcl.ac.uk/college/policyzone/index.php?id=247). For your information ethical approval is granted until 19 July /2014. If you need approval beyond this point you will need to apply for an extension to approval at least two weeks prior to this explaining why the extension is needed, (please note however that a full re-application will not be necessary unless the protocol has changed). You should also note that if your approval is for one year, you will not be sent a reminder when it is due to lapse. If you do not start the project within three months of this letter please contact the Research Ethics Office. Should you need to modify the project or request an extension to approval you will need approval for this and should follow the guidance relating to modifying approved applications: http://www.kcl.ac.uk/research/ethics/applicants/modifications.html Any unforeseen ethical problems arising during the course of the project should be reported to the approving committee/panel. In the event of an untoward event or an adverse reaction a full report must be made to the Chairman of the approving committee/review panel within one week of the incident. Please would you also note that we may, for the purposes of audit, contact you from time to time to ascertain the status of your research. If you have any query about any aspect of this ethical approval, please contact your panel/committee administrator in the first instance (http://www.kcl.ac.uk/research/ethics/contacts.html). We wish you every success with this work. With best wishes Yours sincerely James Patterson – Senior Research Ethics Officer For and on behalf of Professor Gareth Barker, Chairman Psychiatry, Nursing & Midwifery Research Ethics Subcommittee Cc Alison While and Allan Hicks 394 Appendix 7 Questionnaire in the main study (English) N Florence Nightingale School of Nursing & Midwifery Older people living alone in Chongming This questionnaire is for a postgraduate research project. The project aims to explore the health status, life circumstances and quality of life of older people living alone in Chongming. Please complete the questionnaire according to the instructions set out in each section. There are no right or wrong answers. If you feel any of the questions inappropriate for you, please do not feel that you have to answer them. All the information will remain confidential to research team. Thank you for your participation and cooperation. 395 Section A: About cognitive function Instructions to the interviewer: Ask all the questions (1-10) and record all the answers. (Ask question 4a only if the resident does not have a telephone.) Record the total number of errors based on the answers to the 10 questions. Pre-question: What education has the respondent had? No formal education Primary school only Junior high school only Senior high school only Question College or above (√) if Response incorrect 1. What is today’s date (including month, day and year)? 2. What is the day of the week? 3. What is the name of this place? 4. What is your phone number? 4a. What is your street address? (Ask only if resident does not have a telephone) 5. How old are you? 6. When were you born? 7. Who is the current Chinese President? 8. Who was the Chinese President before him? 9. What is your mother’s name? 10. Can you count backward from 20 by 3’s? Score: Total Errors: Adjustments (+): Adjustments (-): Total Adjusted Score: © by Eric Pfeiffer (1974) 396 Section B: About your activities of daily living The following statements are about some of your activities of daily living. For each item please tick the appropriate box that best describes you. Can you finish the following tasks by yourself? Tasks Totally With With Totally independent some help a lot of help dependent 1. Going out by public transportation 2. Physical ambulation 3. Cooking 4. Feeding 5. House keeping 6. Doing laundry 7.Taking medicine 8. Shopping 9. Handling your own money 10. Making a telephone call 11. Dressing 12. Grooming 13. Taking a bath or shower 14. Getting to the bathroom on time © by Zhang et al. (1995) 397 Section C: About your physical activity and health C1 The following items are about your regular activities. Please rate how often you spent exercising for at least half an hour in total in each of the following activities per week in the last 4 weeks. Your activities Never 1-2 3-4 5-7 days days days Sitting activities such as reading or watching TV etc. Walking outside your home for any reason such as fun, exercise, shopping etc. Light exercise such as walking, tai chi, fishing etc. Moderate exercise such as carrying light loads, bicycling at a regular pace etc. Strenuous exercise such as jogging, swimming, heavy lifting, fast bicycling etc. Light house work such as dusting or washing dishes Heavy housework such as vacuuming, scrubbing floors, cleaning windows etc. C2 How would you rate your current health status? (Please tick one box) Very good Good Neutral Poor Very poor C3 Do you have any chronic diseases? No Yes (if, please list all chronic diseases) C4 In the last 4 weeks, have you suffered from any kind of acute diseases? Yes No 398 Don’t know/ Not sure C5 Do you go to seek health services when you are sick? Yes (if, what kind of hospital do you often attend? Please tick one box) Community hospital Township hospital The Central Hospital of Chongming County Tertiary hospital Other (Please add more information)_________________________ No (if, please state the reason) C6 On the whole, how satisfied are you with the health services? (Please tick one box) Very satisfied Satisfied Neutral Dissatisfied Very dissatisfied Section D: About your social support The following statements are about your social support. For each item please tick the appropriate box that gives the best answer for you. 1. How many close friends do you have who can help you or support you? None 1-2 3-5 6 or more None 2. To what extent do you receive support from your neighbours? 3. To what extent do you receive support from your former or current colleagues? 4. To what extent do you receive support from your spouse /partner? 5. To what extend do you receive support from your parents? 6. To what extent do you receive support from your children? 7. To what extent do you receive support from your siblings? 8. To what extent do you receive support from other family members? 399 Little Some A lot Never Rarely Sometimes Always 9. How often do you confide when you are in trouble? 10. How often do you ask for help when you are in trouble? 11. How often do you attend social activities? 12. Who has given you financial support and helped to solve problems when you were in trouble in the past? (Please tick as many boxes as apply) No one Spouse/Partner Children Other family members Friends Relatives Colleagues Work units Official organizations Social organizations Other (Please add more information) 13. Who has given you emotional support when you were in trouble in the past? (Please tick as many boxes as apply) No one Spouse/Partner Children Other family members Friends Relatives Colleagues Work units Official organizations Social organizations Other (Please add more information) © by Shui Yuan Xiao (1999) Section E: About your quality of life The following items are about your quality of life. For each item please tick the appropriate box that best describes you/your view. Thinking about both the good and bad things about your life, how would you rate the quality of your life as a whole? Very good Good Neutral Poor 400 Very poor To what extend do you agree or disagree with each of the following statements? Strongly agree I enjoy my life overall. I am happy much of the time. I look forward to things. Life gets me down. I have a lot of physical energy. Pain affects my well-being. My health restricts me looking after myself or my home. I am healthy enough to get out and about. My family, friends or neighbours would help me if needed. I would like more companionship or contact with other people. I have someone who gives me love and affection. I’d like more people to enjoy life with. I have my children around which is important. I am healthy enough to have my independence. I can please myself what I do. The cost of things compared to my pension/income restricts my life. I have a lot of control over the important things in my life. I feel safe where I live. The local shops, services and facilities are good overall. I get pleasure from my home. I find my neighbourhood friendly. 401 Agree Neitheragree nordisagree Disagree Strongly disagree Strongly agree I take life as it comes and make the best of things. I feel lucky compared to most people. I tend to look on the bright side. If my health limits social/leisure activities, then I will compensate and find something else I can do. I have enough money to pay for household bills. I have enough money to pay for household repairs or help needed in the house. I have enough money to afford my health-care expenses. I can afford to buy what I want to. I cannot afford to do things I would enjoy. I have social or leisure activities/hobbies that I enjoy doing. I try to stay involved with things. I do paid or unpaid work or activities that give me a role in life. I have responsibilities to others that restrict my social or leisure activities. Religion, belief or philosophy is important to my quality of life. Cultural/religious events/festivals are important to my quality of life. © by Ann Bowling (2009) 402 Agree Neitheragree nordisagree Disagree Strongly disagree Section F: About where you live In which area do you live? Urban Rural What is your housing type? Public rental housing Private housing The following items are about your home. Please rate how satisfied are you with the following conditions. Very Satisfied Neutral Dissatisfied Very dissatisfied satisfied Dwelling size Bathroom Kitchen Distance from children or relatives Convenience of public transport Dwelling condition overall Section G: About yourself What is your date of birth? What is your gender? Male Female What is your ethnic group? What is your current marital status? Widowed Divorced Separate Never married Other (Please add more information) ____________________________ How many living children do you have? _____________ What is or was your occupation (current or before retirement)? In total, how much money do you have per month? (unit: RMB) <500 500-999 1000-1499 1500-1999 2000-2499 2500-2999 3000-3999 ≥4000 403 Section H: About your feelings The following statements describe how you have felt the past week. For each item please tick the appropriate box that gives the best answer for you. Yes 1. Are you basically satisfied with your life? 2. Have you dropped many of your activities and interests? 3. Do you feel that your life is empty? 4. Do you often get bored? 5. Are you in good spirits most of the time? 6. Are you afraid that something bad is going to happen to you? 7. Do you feel happy most of the time? 8. Do you feel helpless? 9. Do you prefer to stay at home, rather than going out and doing new things? 10. Do you feel you have more problems with your memory than most? 11. Do you think it is wonderful to be alive? 12. Do you feel pretty worthless the way you are now? 13. Do you feel full of energy? 14. Do you feel that your situation is hopeless? 15. Do you think that most people are better off than you are? © by Lee et al. (1993) 404 No The following statements describe how often you feel. For each item please tick the appropriate box that gives the best answer for you. Never 1. How often do you feel that you are “in tune” with the people around you? 2. How often do you feel that you lack companionship? 3. How often do you feel that there is no one you can turn to? 4. How often do you feel alone? 5. How often do you feel part of a group of friends? 6. How often do you feel that you have a lot in common with the people around you? 7. How often do you feel that you are no longer close to anyone? 8. How often do you feel that your interests and ideas are not shared by those around you? 9. How often do you feel outgoing and friendly? 10. How often do you feel close to people? 11. How often do you feel left out? 12. How often do you feel that your relationships with others are not meaningful? 13. How often do you feel that no one really knows you well? 14. How often do you feel isolated from others? 15. How often do you feel you can find companionship when you want it? 16. How often do you feel that there are people who really understand you? 17. How often do you feel shy? 18. How often do you feel that people are around you but not with you? 19. How often do you feel that there are people you can talk to? 20. How often do you feel that there are people you can turn to? © by Ping Liu (1999) 405 Rarely Sometimes Always Is there anything that you would like to tell me about being an older person living alone? Thank you very much for taking time to complete this questionnaire. For more information about this research, please contact Yu Chen on 13916878278. 406 Appendix 8 Questionnaire in the main study (Chinese) N Florence Nightingale School of Nursing & Midwifery 崇明县独居老人生活状况调查 此问卷为博士生课题研究所用,旨在了解崇明县独居老人的生活状况。请 根据您的实际情况仔细填写问卷,答案无所谓对与错、好与坏,只要反映您的 真实想法即可。您有权拒绝不愿意回答的问题。问卷只做学术研究之用,所有 资料保密。谢谢您的参与和配合! 407 请提问下列所有问题并记录相应回答。如果回答错误,请在“错”一栏的对应 题目处打“√”。 填表日期: ____年___月___日 受访者文化程度: 不识字 小学 高中/职校/技校/中专 大专/本科及以上 问题 初中 回 答 1. 今天是几年几月几日? 2. 今天星期几? 3. 您现在在什么地方? 4. 您的电话号码是多少?(如果没有电话改 问住址) 5. 您今年几岁? 6. 您的出生年月日是多少? 7. 现任国家总书记是谁? 8. 前任国家总书记是谁? 9. 您的妈妈叫什么名字? 10. 20-3=___-3=___-3=___-3=___ -3=___-3=___ 总分: 回答错误的题目数: 调整后总分: © by Eric Pfeiffer (1974) 408 错 第一部分 日常生活能力 以下事项您是否能自己完成?请在表格中对应选项处打“√”。 项目 自己完全 可以做 1. 坐车外出 2. 走路 3. 做饭 4. 吃饭 5. 做家务 6. 洗衣服 7. 吃药 8. 买东西 9. 处理自己的钱财 10. 打电话 11. 穿衣服 12. 梳头、刷牙等 13. 洗澡 14. 及时上厕所 © by Zhang et al. (1995) 409 需要一些 帮助 需要较多 帮助 自己完全 不能做 第二部分 身体活动及健康状况 1. 请问在过去 4 个星期,您每星期进行几次以下的活动(每天累计时间超过 半小时算一次)?请在表格中对应选项处打“√”。 1-2 3-4 项目 从不 天 天 静坐的活动,比如看书、看电视 等 因任何原因而走出家门(比如娱 乐、锻炼、买东西或其他原因等) 轻度活动,比如散步、打太极拳、 钓鱼等 中等强度活动,比如提较轻的物 品、以一般速度骑自行车等 高强度活动,比如慢跑、游泳、 提重物、快速骑自行车等 轻体力家务劳动,比如掸灰尘、 洗碗等 重体力家务劳动,比如擦地板、 擦窗子等 5-7 天 2. 您认为您目前的身体状况如何? 非常好 好 一般 差 3. 您是否患有慢性疾病? 否 是 (请列出所有您患的慢性疾病) 4. 在过去 4 个星期,您有没有得过其他急性的疾病? 有 没有 410 非常差 不知道/ 不确定 5. 一般情况下,您生病了会不会去医院看病? 会(您主要选择去哪类医院看病?) 村卫生室/社区卫生服务中心 乡镇医院 县中心医院 市三级医院 其他(请说明)__________________________________ 不会(请说明原因) 6. 从总体来讲,您对于医疗保健服务的满意度如何? 非常满意 满意 第三部分 一般 不满意 非常不满意 社会支持 以下问题用于反映您在社会中所获得的支持,请根据您的实际情况在对应选项 处打“√”。 1. 您有几个关系密切,可以得到支持和帮助的朋友? 一个也没有 1-2 个 3-5 无 2. 您的邻居给予您多少支持和照顾? 3. 您以前或现在的同事给予您多少支持和照顾? 4. 您的配偶 (恋人) 给予您多少支持和照顾? 5. 您的父母给予您多少支持和照顾? 6. 您的子女给予您多少支持和照顾? 7. 您的兄弟姐妹给予您多少支持和照顾? 8. 您的其他家庭成员给予您多少支持和照顾? 411 6 个或 6 个以上 极少 一般 非常多 从不 偶尔 有时 总是 9. 当您遇到烦恼时,您是否会向他人倾诉? 10. 当您遇到烦恼时,您是否向他人请求帮助? 11. 您是否参加团体(如党团组织、宗教组织、 工会等)组织的活动? 12. 在您遇到急难情况时,曾经得到的经济支持和解决实际问题的帮助的来源 有:(可多选) 无任何来源 配偶/恋人 子女 其他家人 朋友 亲戚 同事 工作单位 党团工会等官方组织 宗教、社会团体等非官方组织 其他(请列出) 13. 在您遇到急难情况时,曾经得到的安慰和关心的来源有:(可多选) 无任何来源 配偶/恋人 子女 其他家人 朋友 亲戚 同事 工作单位 党团工会等官方组织 宗教、社会团体等非官方组织 其他(请列出) © by Shui Yuan Xiao (1999) 第四部分 生活质量 以下问题有关您的生活质量,请根据您的实际情况或真实想法在对应选项处打 “√”。 1. 总的来说,您如何评价自己的生活质量? 非常好 好 一般 差 412 非常差 2. 您是否同意以下观点: 非常 同意 总的来说,我很享受我的生活。 我大部分时间都很快乐。 我对生活充满期待。 生活让我沮丧。 我有充沛的精力。 疼痛影响了我的健康。 我的身体状况让我不能自己照顾自 己。 我身体还行,可以出门走走。 我的家人、朋友或邻居能在我有需 要的时候帮助我。 我希望能跟更多人在一起或多接触 其他人。 有人爱我、关心我。 我希望有更多的人和我一起享受生 活。 我的子女在身边,这对我很重要。 我很健康,能独立生活。 我能做我想做的事。 跟我的收入比起来,现在的物价影 响了我的生活。 我自己决定生活中很多重要的事 情。 我住的地方很安全。 总的来说,家附近的商店、设施以 及其他服务都不错。 在家里我感到很愉快。 邻居们都很友好。 413 同意 中立 不同意 非常不 同意 非常 同意 同意 中立 不同意 我主张随其自然,尽力而为。 跟大部分人比起来,我觉得自己很 幸运。 凡事我都试图往好的一面去想。 如果我的身体状况限制了社交或休 闲活动,我会做些力所能及的事补 偿。 我有足够的钱支付水、电、煤等日 常家庭开支。 我有足够的钱支付房屋维修、翻新 等费用。 我有足够的钱支付医疗费用。 我可以买我想买的东西。 我没有足够钱做我想做的事。 我有喜欢的社交、休闲活动或兴趣 爱好。 我试图参与做一些事情。 我从事有偿或无偿的工作或活动, 让自己有所作为。 我要照顾其他人,这阻碍了我的社 交或休闲活动。 宗教、信仰、生活理念对我的生活 质量很重要。 文化/宗教的活动/仪式对我的生活 质量很重要。 © by Ann Bowling (2009) 第五部分 1. 您住在: 城镇 2. 您的房子属于: 租的房子 居住情况 农村 买的商品房/造的私房 414 非常不 同意 3. 您是否满意目前的居住条件?请在对应选项处打“√”。 非常满意 满意 中立 不满意 非常不满意 居住面积 卫生间 厨房 到子女或亲戚家的方便程 度 到最近的公交车站的方便 程度 总的居住条件 第六部分 您的基本情况 以下问题关于你的一些基本情况,请在横线处如实回答,或在对应选项处打“√”。 1. 出生年月:__________ 年____________ 月 2. 性别: 男 女 3. 民族:_______________ 4. 目前的婚姻状况: 丧偶 离异 分居 未婚 其他 _______________________ 5. 您现有几个子女?_________________ 6. 工作(请回答您现在的工作或退休前的工作)______________________ 7. 您个人月平均收入(元): <500 500-999 1000-1499 1500-1999 2000-2499 2500-2999 3000-3999 ≥4000 415 第七部分 您的感受 以下问题关于您最近一周的感受,请选择最切合您情况的答案并在对应选项处 打“√”。 是 1. 您对生活基本上满意吗? 2. 您是否已放弃了许多活动与兴趣? 3. 您是否觉得生活空虚? 4. 您是否常感到厌倦? 5. 您是否大部分时间精力充沛? 6. 您是否害怕会有不幸的事落到您头上? 7. 您是否大部分时间感到幸福? 8. 您是否常感到孤立无援? 9. 您是否宁愿待在家里而不愿出去做些新鲜的事? 10. 您是否觉得记忆力比以前差? 11. 您觉得现在活着很惬意吗? 12. 您是否觉得像现在这样活着毫无意义? 13. 您觉得生活充满活力吗? 14. 您是否觉得您的处境已毫无希望? 15. 您是否觉得大多数人比您强得多? © by Lee et al. (1993) 416 否 下列是人们有时出现的一些感受。对每项描述,请指出您具有那种感受的频度, 并在对应选项处打“√”。 从不 1. 您常感到与周围人的关系和谐 吗? 2. 您常感到缺少伙伴吗? 3. 您常感到没人可以信赖吗? 4. 您常感到寂寞吗? 5. 您常感到属于朋友中的一员吗? 6. 您常感到与周围的人有许多共同 点吗? 7. 您常感到与任何人都不亲密了 吗? 8. 您常感到您的兴趣与想法和周围 的人不一样吗? 9. 您常感到想要与人来往、结交朋友 吗? 10. 您常感到与人亲近吗? 11. 您常感到被人冷落吗? 12. 您常感到您与别人来往毫无意义 吗? 13. 您常感到没有人很了解您吗? 14. 您常感到与别人隔开了吗? 15. 您常感到当您愿意时就能找到伙 伴吗? 16. 您常感到有人真正了解您吗? 17. 您常感到羞怯吗? 18. 您常感到人们围着您但并不关心 您吗? 19. 您常感到有人愿意与您交谈吗? 20. 您常感到有人值得您信赖吗? © by Ping Liu (1999) 417 很少 有时 一直 其他意见或建议: 再次感谢您的配合和参与! 如想了解更多有关此次调查的情况,请联系: 陈瑜 (13916878278)。 418 Appendix 9 Training manual (English) AN EXPLORATORY STUDY OF OLDER PEOPLE LIVING ALONE IN CHONGMING, SHANGHAI DATA COLLECTORS’ TRAINING MANUAL 2011.12 Acknowledgement: This Training Manual is adapted from the manual for Factors Influencing Utilization of Early Breast Cancer Detection in China 419 1 INTRODUCTION 1.1 Background and purpose of the research This research is a postgraduate research project, which is going to understand the health status, life circumstances and quality of life of older people living alone in Chongming identify related factors of quality of life of older people living alone in Chongming develop an explanatory model of quality of life of older people living alone in Chongming 1.2 Research procedure This research is a cross-sectional questionnaire survey. Older people aged 60 years and above, living alone in selected communities, without hearing, language and communication difficulties and having good cognitive function can be recruited in this research. Detailed information will be given to all potential participants through an information sheet during door-to-door visits. One week later, they will be contacted to ascertain their wishes. Those who agree to participate will be offered a face-to-face interview. The place of interview is determined by the participants. During the face-to-face interview, the participants will be asked some questions to test their cognitive function. Those with poor cognitive function will be excluded from further participation in the survey and the interview will be terminated. Those with good cognitive function will be given the informed consent form. Once consent has been gained, the questionnaire will be given to the participant for completion. The completed questionnaires will be collected immediately. 1.3 1.3.1 Ethical considerations Professional ethics and participants’ rights This research has been approved by King’s College Research Ethics Committee. The rights of participants include: 420 The right of informed consent. All potential participants must get complete and accurate information about the research survey so that they can make an informed decision whether they want to participate in the research. The right of self-determination. Each participant has the right to decide to be in the research or not. He/she can also refuse to answer any question which they do not want to answer. The right of withdrawal. Each participant has the right to withdraw from the research at any time without giving a reason before their anonymous data are included in the dataset. The right of privacy. It is prohibited to release data gathered for this research to any other agencies or people outside the research team without the written consent of the participant. 1.3.2 Importance of confidentiality Each questionnaire will be assigned an identification number and the participant’s name will not be recorded. Any identifiable information will not be contained on any reports or publications arising from this study. The participants’ personal identification data will be kept separately in China to all the other information obtained. All questionnaires and other printed documents will be stored in a locked filing cabinet in China and they will not be sent to the UK. Only the research team will have access to the collected data. All data are only used for this research and cannot be used for any other purpose. 2 2.1 GUIDE TO THE USE OF RESEARCH INSTRUMENTS Information sheet The information sheet contains the most important information of the research. It is necessary that all the potential participants be given the information sheet and understand the contents. You need to know it very well, as you may be 421 asked to explain it by some of the participants. Please listen to the instructions carefully. (Explain the information sheet.) 2.2 Short Portable Mental Status Questionnaire1 This questionnaire is to test the cognitive function of the potential participants. You should know how to use it correctly. Instruction for completion Q1 Scored correctly only when the exact month, day and year are given correctly. Q3 Scored correctly if any correct description of the location is given. “My home”, “Chongming”, “Shanghai” and the correct name of the estate are all acceptable. Q4 Scored correctly when the correct telephone number can be verified, or when the participant can repeat the same number at another point during the questioning. Q5 Scored correctly when stated age corresponds with the date of birth. Q6 Scored correctly only when the month, exact date and year are all given. Q10 Requires that the entire series (20, 17, 14, 11, 8, 5, 2) must be performed correctly in order to be scored as correct. Any error in the series or unwillingness to attempt the series is scored as incorrect. Note: All responses to be scored as correct must be given by the participants without reference to a calendar, newspaper, ID card, or other memory aide. Add one score if the participant had no formal education or a primary school education only. Subtract one score if the participant had a college or above education. 1 Reference: Pfeiffer E. (1975) A Short Portable Mental Status Questionnaire for the assessment of organic brain deficit in elderly patients. Journal of American Geriatric Society 23(10), 433-441. 422 Total adjusted sore 8-10 (0-2 errors): Intact cognitive function 6-7 (3-4 errors): Mild cognitive impairment 3-5 (5-7 errors): Moderate cognitive impairment 0-2 (8-10 errors): Severe cognitive impairment 2.3 Consent form The participants who have good cognitive function (scored 6 or above) will be asked to sign the consent form. It is a critical procedure before you distribute the questionnaire. Please listen to the instructions carefully. (Explain the consent form) 2.4 Questionnaire referring to health status, life circumstances and quality of life This questionnaire is the major instrument to collect data of health status, life circumstances and quality of life. Make sure that you know the questionnaire sufficiently. Please listen to the instructions carefully. (Explain the questionnaire question by question.) 3 3.1 YOUR JOB AS A DATA COLLECTOR Adherence to procedures As a data collector, you will carry out all research procedures precisely as they are presented in this manual and at training. It is very important that you understand and agree to the following responsibilities: Accept all duties of performing specified research tasks and will do so personally in accordance with the training and guidelines provided to you. Ensure the confidentiality of all information obtained during the study. 423 3.2 Collecting data You will be assigned a list of potential participants. Plan your workload properly with a clear picture of the scope of your assignment and your deadline. Visit the potential participants personally and introduce the research. Give them each an information sheet and answer any questions about the research. Tell them you will contact them again after one week. One week later, contact them via telephone or in-person to ascertain their wishes. Make arrangements for a survey timeslot and venues with those who are interested in the research. Use the screening questionnaire (the Short Portable Mental Status Questionnaire) to test the cognitive function of the participants. If the score under 6 is obtained, thank the participant and the interview is terminated. If the score equal to or above 6 is obtained, distribute the consent form and ask the participant to sign it if they wish to participate in the research. Distribute the questionnaire referring to the health status, life circumstances and quality of life. Read each question to the participant and record the answer. It can also be completed by the participant himself/herself. Collect the completed questionnaire. Sincerely thank the participant for spending time completing the questionnaire and for contributing to the success of the research. 3.3 Tips for making success YOU are important to obtain participants and collect data successfully. Keep in mind the following tips: 424 Display a thorough knowledge of the research. Be genuine. Convey respect for the participants. Let the participants know the worth and importance of the research. Let the participants know their value and importance to the research. They are unique and their information is uniquely valuable. Have a positive attitude. Persistence. Try to persuade the potential participants to participate in the research. Attempt to visit them at different times of the day and on different days of the week. Stress the confidentiality of the research. 4 PRACTICE Now, it is time to practice. You will be divided into several groups to practice every step involved in being an effective data collector by role playing. To make sure you are learning what you need in this training session, your performance will be monitored and feedback will be given when necessary. During this time, you can take advantage of the opportunity to ask any questions you might have. Specific items to be evaluated include: explaining the research information familiarity with the instruments obtaining informed consent the procedure of the face-to-face interview The practice helps us evaluate your preparedness and helps you make sure that you are doing everything properly. 425 Appendix 10 Training manual (Chinese) 崇明县独居老人生活状况调查 调查人员培训手册 二零一一年十二月 致谢:此培训手册改编自“影响中国妇女进行乳腺癌早期筛查的因素”这一研 究项目的培训手册 426 1 项目介绍 1.1 研究背景和目的 此研究是博士生研究课题,旨在 了解崇明县独居老人的健康状况、生活状况和生活质量 探索影响崇明县独居老人生活质量的相关因素 发展适合崇明县独居老人的生活质量理论模型 1.2 研究步骤 此研究是一项问卷调查,调查对象为居住在所选取的村/居委的 60 岁及以 上的独居老人,要求没有听力、语言和沟通障碍且有良好的认知功能。我们首 先将对所有 60 岁以上的独居老人进行登门造访,向他们详细介绍此研究,并派 发《科研项目信息介绍》。一星期后,再次与他们联系,确认他们的意愿。同意 参与研究者将被安排进行面对面访问。在访问开始时,我们首先会问老人一些 问题以检查他们的认知功能。认知功能较差的视为不符合条件,将被排除,访 问就此结束。认知功能良好者则签署知情同意书并填写问卷,问卷当场收回。 1.3 伦理问题 1.3.1 参与者权利 此研究通过英国伦敦大学国王学院研究伦理委员会审批。参与者的权利包 括: 知情同意权:所有老人必须获得完整、确切的有关此研究的信息,以决定 是否参与。 自主决定权:每位老人有权自己决定是否参与此研究。他/她也可以拒绝回 答任何不想回答的问题。 退出的权利:每位老人有权在他们的数据被输入数据库之前随时退出研究 而不需要任何理由。 隐私权:未经同意,严禁将此研究收集到的资料泄露给其他任何机构或研 究组以外的人。 1.3.2 保密的重要性 每份问卷将被编码,所以不会提及老人的名字。今后发表的文章中也不会 427 涉及他们的个人信息。老人的个人信息将与其他资料分开存放。所有问卷和其 他纸质材料将被锁在文件柜里,只有研究组成员能得到这些资料。所有资料仅 供本次研究之用,不能被用于其他目的。 2 研究工具的使用 2.1 《科研项目信息介绍》 《科研项目信息介绍》涵盖了此项研究的最重要信息。因此务必确保所有 老人拿到该介绍书并理解里面的内容。你当然也要非常熟悉该介绍书,以便在 必要时作出相应解释。请仔细听该介绍书的使用方法。 (讲解《科研项目信息介绍》) 2.2 认知功能问卷 (筛查问卷)1 该问卷用于检测老人的认知功能,你必须知道怎样正确使用该问卷。 问卷使用说明: 第 1 题:年、月、日全部正确才算答对。 第 3 题:任何能正确描述所在地点的回答都算正确。比如“家”、“崇明”、 “上海”、“**小区”、“**镇”等。 第 4 题:当老人说出电话号码后,需拨打该号码以确认是否正确。如无法 通过打电话来确认,可在后面的提问过程中再次提出同样问题,如果 2 次所说 的电话号码为同一个号码,即视为回答正确。 第 5 题:虚岁、周岁都算正确。 第 6 题:年、月、日全部正确才算答对,需与第 5 题的回答相对应。 第 10 题:按照 20, 17, 14, 11, 8, 5, 2 的顺序完全回答正确才算答对。 注意:老人要在没有任何提示(比如看日历、报纸、身份证等)的情况下 回答问卷中的问题。 如果老人不识字或只有小学文化程度,在总分中加 1 分。如果老人为大专 1 来源:Pfeiffer E. (1975) A Short Portable Mental Status Questionnaire for the assessment of organic brain deficit in elderly patients. Journal of American Geriatric Society 23(10), 433-441. 428 或以上文化程度,在总分中减 1 分。 调整后的总分在 8-10 分 (错 2 题及以下),为认知功能完好;6-7 分 (错 3-4 题),为轻度认知功能损害;3-5 分 (错 5-7 题),为中度认知功能损害;0-2 分(错 8 题及以上),为重度认知功能损害。 2.3 知情同意书 认知功能良好者(筛查问卷总分在 6 分及以上)将被要求签署知情同意书, 这是发放问卷前的一个关键步骤。请仔细听知情同意书的使用方法。 (讲解如何使用知情同意书) 2.4 有关健康状况、生活状况和生活质量的问卷 该问卷是用来收集健康状况、生活状况和生活质量相关资料的最主要研究 工具。请务必确保你充分掌握该问卷的内容。 逐题讲解问卷: 第二部分 身体活动及健康状况 第 1 题:以老人的自我感觉来评估运动强度 因任何原因走出家门:相当于评估“花多少时间用于走路”,如:出去买东 西、出去办事等任何原因的走路。 轻度活动:没有疲劳感或稍感疲劳,呼吸平缓或稍微加快。如:小区健身 场所使用健身器材、气功等。 中等强度活动:有疲惫感但可以维持,呼吸加快。如:跳舞、爬楼梯、遛 狗等。 高强度活动:明显疲惫,呼吸急促。如:快走、跳绳、打球等。 第 3 题:老人可能不理解什么是“慢性疾病”,可以给予一些提示,让他们 尽量回忆出所有疾病。常见的慢性疾病有:高血压、心脏病、白内障、听力障 碍、中风、糖尿病、关节炎、肿瘤、慢性呼吸系统疾病(肺气肿、老慢支、哮 喘等)、慢性肝脏疾病、慢性肾脏疾病、甲状腺疾病等。 第 4 题:急性疾病,指除了第 3 题中提到的需要长期治疗的慢性疾病以外 429 的病。比如感冒、拉肚子或其他意外受伤等。 第 5 题:社区卫生服务中心也包括大队卫生所,三级医院指市区的大医院, 比如中山医院、华山医院、新华医院等。 第 6 题:医疗保健服务:所有跟看病有关的内容。 第三部分 社会支持 第 3-7 题,如果没有同事、配偶(恋人)、父母、子女、兄弟姐妹,选“无” 第六部分 基本情况 第 6 题:如果写了具体的工作,请注明是以前的还是现在的。 第 7 题: “个人月平均收入”包括任何收入来源,比如退休工资、子女给的 钱、炒股的钱等等 3 调查人员须知 3.1 恪守研究步骤 作为一名调查人员,你必须严格遵守本手册中列明的以及培训时介绍的研 究步骤。请务必理解并同意以下职责: 接受完成此研究的所有职责,并按照培训时的要求和指南的要求亲自执行。 确保所收集信息的保密性。 3.2 收集资料 你将会得到一张列有 60 岁以上老人的姓名和住址的名单。你要对分配给你 的任务和期限有清晰的认识,然后恰当计划、安排你的工作。 亲自拜访那些老人并介绍此项研究。给他们《科研项目信息介绍》并回答 有关问题。告诉他们一星期后你将再与他们联系。 一星期后,打电话或亲自上门以确认他们是否愿意参与此研究。对于愿意 参与者,安排调查的时间和地点。 用筛查问卷测试老人的认知功能。得分在 6 分以下的视为不符合条件,向 他们表示感谢并结束调查。 得分在 6 分及以上者,要求他们签署知情同意书。 发放有关生活状况和生活质量的问卷。将问题逐一读给老人听,并记录答 案。问卷也可由老人自己填写。 430 回收填完的问卷。对老人花时间完成问卷以及对此项研究作出的贡献表示 感谢。 3.3 成功完成调查的要点 你,是成功招募到参与者并收集资料的关键。请记住以下一些要点: 表现出对此项研究的充分了解。 充满真诚。 尊重每个老人。 让老人们知道此项研究的价值和重要性。 让老人们知道他们对于此项研究的价值和重要性。他们以及他们提供的信 息是独一无二的。 拥有积极的态度。 坚持。尝试在不同的时间多次拜访老人以尽量说服他们参与此项研究。 强调研究的保密性。 4 练习 现在是练习时间。你们将被分成几组,通过角色扮演的方式练习怎样成为 一名合格的调查人员。为了确保你学到了所需的知识,我们会观察并评估你的 表现,在必要时给予反馈。在此期间,你可以提出任何问题。 评估的具体项目包括: 是否介绍了此项研究的相关信息 对研究工具的熟悉程度 是否获得知情同意 问卷调查的过程 通过练习有助于我们评估你是否已经准备好成为一名合格的调查人员,同 时也有助于你确保自己恰当进行每一步骤。 431 Appendix 11 Information sheet (English) INFORMATION SHEET FOR PARTICIPANTS REC Reference Number: PNM/10/11-147 YOU WILL BE GIVEN A COPY OF THIS INFORMATION SHEET PLEASE READ THIS INFORMATION THOROUGHLY BEFORE PROCEEDING WITH THE STUDY Study title: An exploratory study of older people living alone in Chongming, Shanghai We would like to invite you to participate in this postgraduate research project. You should only participate if you want to; choosing not to take part will not disadvantage you in any way. Before you decide whether you want to take part, it is important for you to understand why the research is being done and what your participation will involve. Please take time to read the following information carefully and discuss it with others if you wish. Ask us if there is anything that is not clear or if you would like more information. What’s the purpose of the study? The purpose of the study is to understand the health status, life circumstances and quality of life of older people living alone in Chongming and what kind of factors affect their quality of life. Who can take part in the study? We have used scientific random methods to select a few communities as the sample of the study. All older people aged 60 years and above, living alone in these communities, without hearing, language and communication difficulties are invited to take part in the study. 432 What will happen if I agree to take part? If you agree to take part in the study, we will arrange to visit you at your home or invite you to interview room in the community committee office. The place will be determined by your preference. We will ask you some questions to test whether you are eligible to participate. If you are eligible, you will be asked to sign a consent form and fill out a questionnaire related to your health status, life circumstances and quality of life. It will take you about 30 minutes to finish the questionnaire. Are there any harms and benefits of taking part in the study? You will be given a small gift as a thank-you for your time. There are may be no other direct benefits for you, but the information which you provide will be highly valued and will be used to gain further knowledge about how to maintain and enhance the quality of life of older people living alone in Chongming. You will be offered a summary of the final study report if you are interested. There will be no physical, social or economic risks to you if you participate in the study. What will happen to my information? Any information you provide to the study will be confidential and will be used for research purposes only. Each questionnaire will be assigned an identification number. That means the information you give us will be anonymised. Your name and address will be stored separately to all the other information obtained. All questionnaires and other printed documents will be stored in a locked cabinet in the researcher’s office. Electronic data with a password to open will be saved on a USB key which will be stored in another locked cabinet. When the research has been carried out, all collected data will be stored securely in line with King’s College London’s policy for two years. We will not tell anyone outside the research team anything about you or that you took part in the study. Only members of the research team will have access to the anonymised information. Only the researcher knows the password to open the electronic database. 433 Do I have to take part? It is up to you to decide whether to take part or not. If you decide to take part you are still free to withdraw at any time and without giving a reason. As your participation is not identifiable, it will not be possible for us to withdraw your data once you have returned your questionnaire. Researcher contact details Please feel free to contact Yu Chen at any time throughout the study. Tel: 13916878278 Email: [email protected] If this study has harmed you in any way you can contact King's College London using the details below for further advice and information: Professor Alison While, Florence Nightingale School of Nursing and Midwifery, King’s College London, Email: [email protected] Tel: 0044 20 78483022 434 Appendix 12 Information sheet (Chinese) 科研项目信息介绍 研究伦理委员会编号:PNM/10/11-147 您可以保留这份科研项目信息介绍,请在参与研究前详细阅读这些信息。 项目名称:崇明县独居老人生活状况调查 我们邀请您参与这个博士生研究项目。该项目为自愿参与,如果您不愿参 与也不会给您带来任何不利影响。在您决定是否参与该项目之前,您有必要了 解为什么要进行该项研究以及您需要做些什么。请花一定时间仔细阅读以下信 息,您也可以和他人一起讨论。如果您有任何不明白或者需要得到更多信息, 请随时向我们提出。 项目的研究目的是什么? 该项目旨在了解崇明县独居老人的健康状况、生活状况和生活质量,探究 影响他们生活质量的因素。 谁可以参与该项目? 我们采用科学的方法随机选取了一些村/居委,所有居住在这些村/居委的 60 岁及以上,没有听力障碍、语言障碍和沟通障碍的独居老人都可以参与。 如果我同意参与,我要做些什么? 如果您同意参与该项目,我们会在您家中或者村委会/居委会的办公室对您 进行访问,具体地点由您决定。我们首先会问您几个问题以确定您是否符合条 件。如果您符合条件,我们会让您签署一份知情同意书并填写一份问卷,大约 会花费您 30 分钟左右的时间。 435 参与该项目有没有利弊之处? 为了感谢您的参与,我们会送您一份小小的礼物,除此以外也许没有其他 直接的好处。但是您所提供的信息将被高度重视,并有利于我们进一步研究如 何提高崇明县独居老人的生活质量。如果您感兴趣的话,我们会向您提供一份 最终的研究报告总结。参与该项目不会给您带来任何风险或不舒适。 如何处理我所提供的信息? 您所提供的任何信息将绝对保密,并且只作研究之用。每一份问卷会被编 码,所以您的信息是匿名的。您的姓名和地址会和其他信息分开存放。所有问 卷以及其他纸质资料会被锁在研究者办公室的文件柜里,存有电子数据文档的 U 盘会被锁在另一个文件柜里,且该文档需要密码才能打开。研究结束后,所 有资料将按照英国伦敦大学国王学院的规定被安全地保存 2 年。我们不会向研 究组以外的任何人提及您,只有研究组成员能得到您提供的信息,只有研究者 本人知道打开电子数据文档的密码。 我必须要参与该项目吗? 由您自己决定是否参与该项目。如果您决定参与,您仍旧可以随时退出而 无需任何理由。由于您的信息是匿名的,所以一旦填完并递交问卷后您将无法 收回您的资料。 您可以在该项目进行期间随时与陈瑜联系。 电话:13916878278, Email: [email protected] 如果该项目给您造成不利影响,您可以联系英国伦敦大学国王学院,南丁格尔 护士和助产士学院的 Alison While 教授以获得更多建议和信息。 Email: [email protected], 电话:0044 20 78483022 436 Appendix 13 Consent form (English) CONSENT FORM FOR PARTICIPANTS IN RESEARCH STUDIES Please complete this form after you have read the Information Sheet and/or listened to an explanation about the research. Title of Study: An exploratory study of older people living alone in Chongming, Shanghai King’s College Research Ethics Committee Ref: PNM/10/11-147 Thank you for considering taking part in this research. The person organising the research must explain the project to you before you agree to take part. If you have any questions arising from the Information Sheet or explanation already given to you, please ask the researcher before you decide whether to join in. You will be given a copy of this Consent Form to keep and refer to at any time. I understand that if I decide at any time during the research that I no longer wish to participate in this project, I can notify the researchers involved and withdraw from it immediately without giving any reason. I understand that I will not be able to withdraw my data after the point of returning questionnaire. I consent to the processing of my personal information for the purposes explained to me. I understand that such information will be kept confidential. 437 Participant’s Statement: I agree that the research project named above has been explained to me to my satisfaction and I agree to take part in the study. I have read both the notes written above and the Information Sheet about the project, and understand what the research study involves. Name of participant: _________________________ Date: ______________________ Participant’s signature: _____________________________ 438 Appendix 14 Consent form (Chinese) 同意书 请在阅读完或听完科研项目信息介绍后签署此同意书。 项目名称:崇明县独居老人生活状况调查 研究伦理委员会编号:PNM/10/11-147 非常感谢您考虑参与此科研项目。研究人员必须在您同意参与前向您作有 关此项目的介绍。如果您对科研项目信息介绍中的内容或研究人员的介绍有任 何疑问,请在决定是否参与此项目前提出。我们会给您该份同意书的副本以作 保留。 我知道如果我在研究过程中不想继续参与该项目,我可以告知研究人员并 随时退出而无需任何理由。 我知道在我填完并递交问卷后,我将无法收回我的资料。 根据研究人员所介绍的研究目的,我同意提供我的个人信息,并且知道这 些信息会绝对保密。 参与者申明: 研究人员已经向我作过有关该项目的介绍,我同意参与此项目。我已经阅 读过上述要点和《科研项目信息介绍》,并且知道该项目涉及的内容。 参与者姓名: ________________________ 日期:___________________ 参与者签字:____________________________ 439 Appendix 15 Publications during PhD study 1. Chen Y., Hicks A. & While A.E. (2013) Validity and reliability of the modified Chinese version of the Older People’s Quality of Life Questionnaire (OPQOL) in older people living alone in China. International Journal of Older People Nursing. doi: 10.1111/opn.12042. 2. Chen Y., Hicks A. & While A.E. (2013) Loneliness and social support of older people in China: a systematic literature review. Health and Social Care in the Community. doi: 10.1111/hsc.12051. 3. Chen Y., Hicks A. & While A.E. (2013) Quality of life of older people in China: a systematic review. Reviews in Clinical Gerontology 23(1), 88-100. 4. Chen Y., Hicks A. & While A.E. (2012) Depression and related factors in older people in China: a systematic review. Reviews in Clinical Gerontology 22(1), 52-67. 440
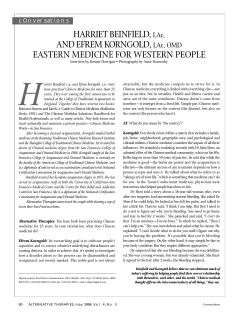
© Copyright 2026