ABC
docz
Explore
Log in
Create new account
Download
Report
business and industrial
company
annual report
Document 20709
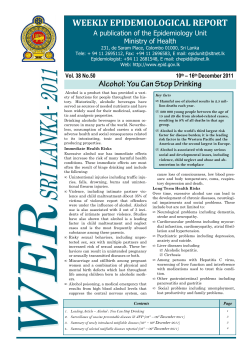
Vol. 38 No.50 ... – 16 December 2011
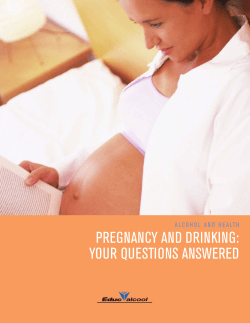
Pregnancy and Drinking: Your Questions Answered
2011 Burlington Water Quality Report
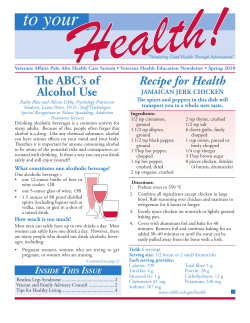
Recipe for Health The aBc’s of alcohol Use Jamaican Jerk chicken
Screening for alcohol use in pregnancy
4 Screening for alcohol consumption in pregnancy
95% Confidence
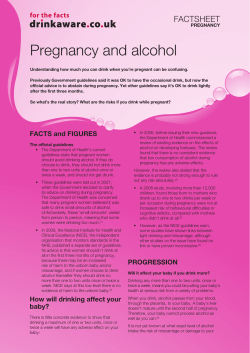
Pregnancy and alcohol FACTSHEET PREGNANCY
Document 4939
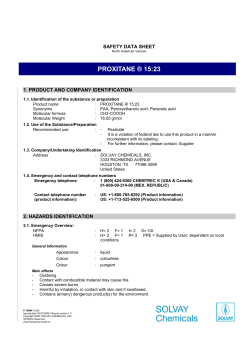
PROXITANE ® 15:23 SAFETY DATA SHEET 1. PRODUCT AND COMPANY IDENTIFICATION
LEED and Photoluminescent Exit Signs- Glow in the Dark goes Green
© Copyright 2026
About abcdocz
DMCA / GDPR
Report