
How to Position Hong Kong as a Maritime Centre for... A Study Final Report
Maritime Centre Report 2013
How to Position Hong Kong as a Maritime Centre for the Asia-Pacific Region
A Study
Final Report
Jointly prepared by:
Centre for Transport, Trade and Financial Studies,
City University of Hong Kong
and
One Country Two Systems Research Institute
March 2013
1
Maritime Centre Report 2013
Table of Contents
Figures...................................................................................................................................... 5
Tables....................................................................................................................................... 6
Executive Summary ................................................................................................................. 7
1
Introduction...................................................................................................................... 9
1.1 Background .............................................................................................................. 9
1.2 Hong Kong’s Current Cargo Flow......................................................................... 11
1.2.1 By Sea ................................................................................................11
1.2.2 By Air.................................................................................................13
1.3 Reasons Behind the Stagnant Growth in Sea and Land Cargo.............................. 16
1.3.1 Decreasing Intangible Cost Advantages ............................................16
1.3.2 Increasing Tangible Costs ..................................................................17
1.3.3 Competition from Neighbouring Seaports in the PRD ......................20
2.
1.4 Amid challenges— Prospects of Future Development.......................................... 21
Transforming and Upgrading the Maritime Industry..................................................... 23
2.1 International Maritime Centre(IMC) Redefined.................................................... 23
2.2 Maritime Industry’s True Economic Value ........................................................... 24
2.3 From London to Hong Kong— Right Time for Hong Kong to Develop
into an IMC .................................................................................................................... 27
3.
Current Situation and Challenges of Hong Kong’s Maritime Services......................... 29
3.1 Marine Insurance ................................................................................................... 29
3.1.1 Current Situation ................................................................................29
3.1.2 Challenges and Problems ...................................................................31
3.1.3 Short Summary...................................................................................33
3.2 Cruise Industry....................................................................................................... 33
3.2.1 Current Situation ................................................................................33
3.2.2 Challenges and Opportunities ............................................................37
3.2.3 Short Summary...................................................................................38
3.3 Maritime Arbitration.............................................................................................. 38
3.3.1 Current Situation ................................................................................39
3.3.2 Challenges and Problems ...................................................................42
3.3.3 Short Summary...................................................................................43
3.4 Ship Owning and Ship Management ..................................................................... 44
3.4.1 Current Situation ................................................................................44
3.4.2 Challenges and Problems ...................................................................48
3.4.3 Short Summary...................................................................................51
2
Maritime Centre Report 2013
3.5 Ship Registration.................................................................................................... 51
3.5.1 Current Situation ................................................................................51
3.5.2 Challenges and Problems ...................................................................55
3.5.3 Short Summary...................................................................................56
3.6 Ship broking and chartering................................................................................... 57
3.6.1 Current situation.................................................................................57
3.6.2 Challenges and Problems ...................................................................59
3.6.3 Short Summary...................................................................................60
3.7 Ship Finance........................................................................................................... 61
3.7.1 Current situation.................................................................................61
3.7.2 Challenges and Problems ...................................................................63
3.7.3 Short Summary...................................................................................64
3.8 Air Transit.............................................................................................................. 65
3.8.1 Current Situation ................................................................................65
3.8.2 Special Product Groups for Air Cargo ...............................................66
3.8.3 Challenges and Problems ...................................................................67
3.8.4 Short Summary...................................................................................69
4.
Experience from London, Singapore and Shanghai ...................................................... 70
4.1 IMC under Globalization ....................................................................................... 70
4.2 Constraints in the Development of Marine Insurance in Hong Kong ................... 71
4.3 Current Development of Maritime Services in London ........................................ 72
4.4 Experience from London’s Transformation........................................................... 75
4.5 Competitiveness and Policies of Shanghai as an IMC........................................... 77
4.5.1 World Port Ranking ...........................................................................77
4.5.2 Inland River Navigation .....................................................................78
4.5.3 Industrial Base....................................................................................78
4.5.4 Transportation Infrastructure..............................................................79
4.5.5 Shanghai Shipping Exchange.............................................................79
4.5.6 Higher Education in Marine: Shanghai Maritime University ............80
4.5.7 Government Policies of Shanghai as an IMC ....................................81
4.6 Competitiveness and policies of Singapore as an IMC ....................................... 82
4.6.1 Government Drive..............................................................................83
4.6.2 Private Sector .....................................................................................85
4.6.3 Industry Cooperation and Development ............................................86
4.6.4 Industry and Public Outreach.............................................................86
4.6.5 Conferences and exhibitions ..............................................................87
4.7 Competitiveness of Hong Kong as an IMC ........................................................... 87
4.7.1 Geographical Location .......................................................................87
3
Maritime Centre Report 2013
4.7.2 Premium Condition of the Port ..........................................................88
4.7.3 Maritime Industry Tradition...............................................................88
4.7.4 China as the Hinterland ......................................................................90
5.
Policy Suggestions ......................................................................................................... 91
5.1 Government structure: Set up a New Ministry of Transport for
Policymaking and Co-ordination ................................................................................... 91
5.2 Establishing Maritime Talents Training Centre..................................................... 92
5.3 Interaction among Maritime and Other Services ................................................... 95
5.3.1 Industry Chain Perspective.................................................................96
5.3.2 Financial Services under RMB Globalization..................................102
5.4 Development of Trade with ASEAN Countries .................................................. 105
5.4.1 Overall Trading with ASEAN Countries .........................................105
5.4.2 Join the ASEAN-China Free Trade Area (ACFTA) Agreement .....105
5.4.3 Speed up Ratification of Dual Tax Agreements...............................106
5.5 Signing DTA with Major Trading Partners ......................................................... 106
5.6 Provide Tax Incentives and Exemptions.............................................................. 108
5.7 Maritime Arbitration – Admiralty Court and Facilities....................................... 108
5.8 The Need for Logistics and Distribution Centre to Facilitate on-shore
Cargo flow— ............................................................................................................... 109
5.9 The Way to Home-port Cruise Centre ................................................................. 109
5.10 Better Business Environment for Marine Insurance............................................ 110
6.
Acknowledgements...................................................................................................... 111
4
Maritime Centre Report 2013
Figures
Figure 1.1 Hong Kong import and export statistics by mode of conveyance .........................................11
Figure 1.2 Total Container Traffic of Singapore, Hong Kong, Shanghai, Guangzhou and Shenzhen
(000' TEUs) ............................................................................................................................................12
Figure 1.3 Total Air Cargo of Singapore, Hong Kong, Shanghai, Guangzhou and Shenzhen (000'
Tonnes)...................................................................................................................................................14
Figure 1.4 South China Container Ports – Current and Planned ............................................................21
Figure 2.1 Classification of Maritime Clusters.......................................................................................24
Figure 3.1 Authorised Insurers in Marine Business in Hong Kong........................................................30
Figure 3.2 2010 International Arbitration Survey: Choices in International Arbitration........................39
Figure 3.3 Maritime Disputes involving HKIAC and SIAC ....................................................................1
Figure 3.4 Private Office - Rental Indices For Grade A Office In Core Districts (1999=100)...............50
Figure 3.5 Percentage Changes of Hong Kong’s Registered Ship Vessels And Gross Tonnages, From
1993 to 2011...........................................................................................................................................52
Figure 3.6 Number of Qualship Vessels by Flag Administration...........................................................54
Figure 3.7 Hong Kong International Airport Cargo Traffic (2000-2010) ..............................................66
Figure 4.1 GVA per Maritime Service Worker vs the Economy’s average ...........................................75
Figure 4.2 Total Container Traffic Comparison of Singapore, Hong Kong and Shanghai (000’TEUs) 77
Figure 5.1 Export of Services in Offshore Trade and Sea Transport......................................................99
Figure 5.2 Maritime Logistics and Intermodal Supply Chain ..............................................................100
Figure 5.3 Estimated CNH Trade Settlement .......................................................................................104
5
Maritime Centre Report 2013
Tables
Table 1.1 Comparison of Container Traffic Growth Percentages of Singapore, Hong Kong, Shanghai,
Guangzhou, Shenzhen (000' TEUs)........................................................................................................13
Table 1.2 Total Air Cargo of Singapore, Hong Kong, Shanghai, Guangzhou, Shenzhen (000' Tonnes)15
Table 1.3 Top Five Commodities by Air, 2010-2011.............................................................................16
Table 1.4 Road Haulage Tariffs Comparisons of Moving a FEU* Container: East PRD (Dongguan) to
US West Coast, 2006 (US$) ...................................................................................................................19
Table 1.5 Terminal Handling Charges in Hong Kong and Other Locations, 2006 (US$)......................19
Table 2.1 Economic Contribution of the Port Business..........................................................................25
Table 2.2 Economic Contribution of Maritime Services ........................................................................26
Table 3.1 Loss Ratio for Marine Cargo and Hull Insurances .................................................................30
Table 3.2 Cruise Passenger Statistics January-September 2011.............................................................35
Table 3.3 The Cruise Industry’s Selection Criteria 2007 .......................................................................35
Table 3.4 The World’s Top 10 Airports by Passenger Traffic ...............................................................36
Table 3.5 Comparison of Arbitration amongst Hong Kong, Singapore and Mainland China ................41
Table 3.6 Cost of Arbitration..................................................................................................................42
Table 3.7 Top 10 countries and territories with the largest controlled fleets (dwt), as at 1 January 2010
& 1 January 2011 ...................................................................................................................................46
Table 3.8 Number of Establishments and Persons Engaged in Ship Owning and Management ............47
Table 3.9 Business Receipts and Other Income of Ship Owning and Ship Management ......................47
Table 3.10 Top 10 Cities with Highest Cost of Living...........................................................................49
Table 3.11 Age Distributions of Local Vessels’ Crews of the 48 Companies........................................50
Table 3.12 The 10 Flags of Registration with the largest registered deadweight tonnage, as of 1 January
2010........................................................................................................................................................53
Table 3.13 Economic Benefits of Ship broking......................................................................................57
Table 3.14 The World’s Top 10 Airports By Cargo Volume (Tonnes) (Jan-Oct 2011).........................65
Table 3.15 Planned Developments of Airports in the Region ................................................................68
Table 4.1 International Market Share of UK Maritime Services............................................................73
Table 4.2 List of Principal International Maritime Related Institutions based in London......................73
Table 4.3 Direct Economic Impact of UK Maritime Services Sectors in in 2009..................................74
Table 5.1 Numbers of Students Pursuing Maritime-related Courses in 2006.........................................93
Table 5.2 Analysis of Activities of Export of Services in Offshore Trade 2002-2009...........................98
Table 5.3 Total Trade between Major Trading Regions 2006-2011 (HK$ Million) ............................105
Table 5.4 Hong Kong’s Top 20 Major Trading Partners in 2011 and DTA status...............................107
6
Maritime Centre Report 2013
Executive Summary
Since the 1970s, Hong Kong has emerged as an international maritime centre (IMC),
thanks to a synergetic partnership between the government and the maritime sector.
In face of increasing competition, especially from London, Singapore and Shanghai,
the question at hand is how best to secure, and even further, our position.
Once the world’s busiest port, Hong Kong now ranks third, after Shanghai and
Singapore. To compete, the SAR government needs to focus its efforts beyond
brick-and-mortar port development and port-related logistics business but on maritime
services, especially ship finance, ship insurance and cruise tourism.
The definition
of maritime clusters should be broadened to reflect the upstream evolution to reflect
its true economic contribution to our society for better policy planning. The
horizons of “Maritime” should be expanded to embrace sea, land and air transport.
From perspective of marine insurance, increased flow of cargo and continual presence
of ship owners are crucial for its future growth. A logistic park with best connection
to the cargo source in the Pearl River Delta (PRD) Region is essential and beneficial
to intermodal transportation and cargo flow within the city, especially for high-valued,
branded and high-ended products. There is an industrial aspiration that the SAR
government will negotiate with Mainland Government to designate Hong Kong a
“Tier 2” reinsurance region with higher priority for marine reinsurance cession in
China and introduce double tax deduction to encourage Hong Kong shippers /
exporters to change sales terms from the habitual FOB to CIF, thereby encourage
local placement of insurance.
Hong Kong’s maritime industry also suffers from a dearth of new talents because
there is little awareness among local youngsters of the bright job prospects the
industry stands to offer. It behoves educational institutions, namely, universities and
maritime training schools, to establish training schemes with ship operators to provide
internships and other exchange opportunities to broaden students’ exposure to the
industry. The SAR government should be more proactive in attracting overseas
talents by adopting preferential immigration policies.
7
Maritime Centre Report 2013
In addition to expanding the local talent pool, the SAR government needs to create a
business environment conducive to maritime services. The advantages of Hong
Kong’s simple low tax regime are quickly being eclipsed by the tax incentives offered
by competing IMCs.
Hong Kong has been a laggard in signing the avoidance of double taxation
agreements (DTAs), with only about half of its top 20 trade partners are covered by
one.
These pales in comparison with the 50 DTAs that Singapore and Mainland
China each have secured.
And to maintain its competitive advantages, Hong Kong
should join ASEAN-China Free Trade Area Agreement without delay.
Given its excellent legal infrastructure, Hong Kong is well positioned to build itself
into a regional maritime arbitration centre. To this end, the SAR government should
establish an admiralty court and encourage more domestic disputes from mainland
companies to be arbitrated here. Equally crucial is government support for the Hong
Kong International Arbitration Centre to establish branch offices in major mainland
cities in order to promote cross-border communications in maritime arbitration.
To maximize economic gain from the cruise terminal opening this year, the SAR
government should consider streamlining the visa process for cruise passengers,
especially those from the mainland.
Finally, to solidify Hong Kong’s IMC status, the SAR government should provide tax
exemptions, as Singapore currently does, for offshore marine insurers to encourage
them to set up offices here.
The international nature of marine insurance means
maritime risks anywhere in the world can be underwritten in Hong Kong.
Implementing preferential immigration policies to encourage insurance and
reinsurance professionals to work here will only facilitate the establishment of
regional head offices of such insurers.
8
Maritime Centre Report 2013
1
Introduction
1.1 Background
Hong Kong once was a port-orientated city.
The port industry propelled the
economy in many aspects, through the financial, insurance and logistics industries.
With its strong links to the mainland, particularly in the Pearl River Delta (PRD)
region, good geographical location and air connectivity, free flow of information and
capital,
transparent custom clearance services, efficient communication, legal and
financial systems, strong intellectual property rights protection, quality assurance, low
simple tax structure (with apparent price advantages for not charging GST or VAT)
and rich experience in shipping to the mainland, this international maritime centre
(IMC) was the busiest container port in the world.
Competitive advantages
notwithstanding, Hong Kong is losing ground to Singapore, Shanghai and other
Mainland ports.
In the mainland, increasing competition from ports in the PRD, such as Yantian,
Shekou, as well as Huangpu in Shanghai, has recently led to a decline in Hong
Kong’s port industry. Hong Kong ports played a dominant role in handling cargoes
and containers from PRD cities, but more and more of them are gradually being
handled by the ports in Shenzhen and Guangzhou.
In the past, even though Hong
Kong charged higher fees than mainland ports, its professional and excellent services
still attracted a large number of cargo and container handlers to use its services every
year. However, things have changed dramatically in the last decade. Mainland
port services have improved significantly thanks to the generous support they have
received from local governments.
Since nearly all of the manufacturing factories are
located in mainland cities, they are closer to mainland ports than to Hong Kong.
Thus, considering operational cost and transportation convenience, many cargo
owners now prefer to transfer their business to mainland ports over staying in Hong
Kong.
Not surprisingly, this is posing a grave threat to Hong Kong.
In the near
future, not only will Hong Kong lose the opportunity to benefit from China’s strong
export growth, but it will also be eclipsed by other ports in this region, especially the
Yantian and Nansha.
9
Maritime Centre Report 2013
Singapore and Shanghai have caught up with and effectively surpassed Hong Kong.
They are both ahead of Hong Kong in the volume of container traffic. Furthermore,
these two cities have rapidly become the destination of choice for overseas shipping
industry, including ship owners, charterers, maritime law firms, regional offices of
marine insurers and ship finance banks.
For example, Hong Kong-listed iron ore
miner Vale has a massive fleet of 19 very large ore carriers being built in China and
South Korea but are registered in Singapore. Citic Pacific has set up an entire
shipping department in Singapore -- rather than Hong Kong -- to oversee the
operation of its fleet of bulk carriers that carry magnetite ore from Australia to China.
Rival miner Rio Tinto has also established shipping operations in Singapore.
In face of all these challenges and threats, Hong Kong needs to redefine maritime
industry and maritime clusters.
For far too long, Hong Kong society and the SAR
government have merely focussed on port development and port-related logistics
business at the expense of other maritime clusters, especially ship finance, ship
insurance and cruise, maritime and trade services.
More than just the port industry,
“maritime industry” should be the focus, and it mainly consists of three sectors: port,
shipping and services. Maritime services have the highest value-added potential,
and the shipping sector’s value-added is greater than that of the port sector.
Such a redefinition, as this investigation will show, complements Hong Kong’s
long-term development goals. As it strives to become a world-class international
city, Hong Kong is eager to develop high value-added products and services. With
current well-established facilities in the financial and insurance sectors, Hong Kong
has outstanding advantages in developing its maritime services vis-a-vis Shenzhen,
Shanghai and Singapore. In additional, the centre of shipping and trade business has
recently been moving from Europe to Asia, and this presents an unprecedented
opportunity for Hong Kong’s maritime industry, particularly the service sector.
There is an urgent need in Asia to have a world-class maritime centre that serves as a
one-stop shop for ship owners, operators and other related parties. Among the
qualified candidates in Asia, the soundest choices are Singapore, Shanghai and Hong
Kong.
Singapore has a strong, proactive government, while Shanghai is backed by a
large, emerging hinterland.
This report will demonstrate by leveraging its
competitive advantages and redefining its role in the maritime industry, Hong Kong
can effectively seize this opportunity and harness its strengths to rise as Asia’s
high-end service provider in, as well as a leading IMC, especially in the finance and
insurance sectors.
10
Maritime Centre Report 2013
In this chapter, the recent declining trends Hong Kong’s air and sea cargo flows will
be examined, and the possible reasons for the decline will be scrutinized.
1.2 Hong Kong’s Current Cargo Flow
Figure 1.1 HK import and export statistics by mode of conveyance
Generally speaking, land transport and air transport have seen the greatest annual
growth rate in terms of the value of cargo imported and exported during the period
2005-2010, while by tonnage, more and more cargo was channelled by river in the
same period.
As highlighted in Figure 1.1, despite the annual decline of 5% in the
tonnage of cargo transported on land, land conveyance remained the dominant mode
of transport in 2010.
1.2.1 By Sea
Hong Kong was once the busiest port in the world, and its container traffic was the
11
Maritime Centre Report 2013
busiest in the world from 1989 to 20041.
According to the American Association of
Port Authorities, from 2005 to 2009 Singapore overtook Hong Kong in the top spot,
and since 2010 Shanghai has been the busiest container port in the world2. Moreover,
according to latest rankings released by the World Shipping Council3, Shanghai
overtook Singapore as the busiest port in 2010, and Hong Kong dropped to 3rd place
in terms of total container traffic (Figure 1.2). Meanwhile, as shown in Figure 1.2,
Shenzhen’s container traffic has been gradually catching up with Hong Kong’s, and it
is expected to surpass Hong Kong’s in five years.
Figure 1.2 Total Container Traffic of Singapore, Hong Kong, Shanghai, Guangzhou
and Shenzhen (000' TEUs)
Notes: Singapore uses the measure of freight, while others use metric.
differences of figures among sources can be expected.
Slight
Source: AAPA World Port
Ranking (2003-2009) and World Shipping Council 2010
1
Except in 1990, 1991 and 1998 when Singapore overtook Hong Kong to be No.1, Hong Kong
dominated in the first place.
2
In fact, Hong Kong’s real container traffic is still higher than Singapore’s. The statistical method
used by Singapore calculates the same container twice in terms of import and export respectively.
However, the Mainland ports’ container traffic already exceeds Hong Kong’s. Hong Kong is no
longer busiest port in the world.
3
The 28 members of the World Shipping Council represent approximately 90 percent of the global
liner vessel capacity and transport approximately 130 million TEU annually.
12
Maritime Centre Report 2013
In a bid to recover from the financial crisis, all of these five major ports in Asia
achieved outstanding performances in 2010, with Shenzhen sporting the highest
increasing rate and Singapore the lowest (Table 1.1). As a whole, mainland ports
have had very impressive performance in the last decade, and they are expected to
keep up the high growth for at least five to ten years.
In particular, the Port of
Guangzhou boasted growth rates of 41% in 2005, 42% in 2006 and 39% in 2007.
Even when reeling from the financial crisis, it still maintained increase 20% and 2%
in 2008 and 2009, respectively.
Thus, the Port of Guangzhou has great potential to
be a strong competitor in the PRD.
Table 1.1 Container Traffic Growth of Singapore, Hong Kong, Shanghai, Guangzhou
and Shenzhen (000' TEUs)
Notes: Singapore uses the measure of freight, while others use metric. Slight
differences of figures among sources can be expected. Source: AAPA World Port
Ranking (2003-2009) and World Shipping Council 2010
1.2.2 By Air
The PRD cities are the most important hinterlands of Hong Kong and they have made
critical contributions to Hong Kong’s air cargo business for a long time.
13
According
Maritime Centre Report 2013
to Hong Kong Air Cargo Terminal Limited4, import cargo accounted for 26% of the
total, and export and re-export accounts for 53% and 22%, respectively (due to
rounding error the figures do not add up to 100%) from January to September in 2011.
Also noteworthy is the fact that 62% of re-export cargoes were from China, 5
especially from the PRD cities.
Obviously, re-export cargoes from the PRD’s cargo
owners are very important to Hong Kong’s air cargo sector. With the world’s factory
located in this region, Hong Kong benefits from the region’s manufacturing sector.
Figure 1.3 shows Hong Kong still maintains its leading position in terms of air cargo
tonnages compared with other airports in Asia.
Among them, Shanghai has caught
up very quickly. It is because many Taiwanese manufacturing plants have relocated
to the Yangtze River Delta (YRD) cities in pursuit of lower costs and preferential
policies.
Suzhou industrial park is one example. As a result, local cargoes in YRD
cities have increased rapidly. The downward trends of these airports in 2008 and
2009 resulted from the global financial crisis, and they all have recovered by 2010.
Figure 1.3 Total Air Cargo of Singapore, Hong Kong, Shanghai, Guangzhou and
Shenzhen (000' Tonnes)
Notes: Data includes transit freight.
be expected.
6
Slight differences of figures among sources can
Source: Airport Council International (2004-2009) and Centre for
Asia-Pacific Aviation & AAHK
4
Hong Kong Air Cargo Terminals Limited is one of the leading air cargo terminal operators in the
world. It handles over 80% of Hong Kong’s air cargo.
5
Hong Kong Census and Statistics Department, External Trade (Jan 2011-Sep 2011)
6
Data from Singapore International Airport, Hong Kong International Airport, Shanghai Pudong
International Airport, Guangzhou Baiyun International Airport and Shenzhen Bao’an International
Airport are used in the calculations.
14
Maritime Centre Report 2013
Table 1.2 shows Shanghai’s air cargo volume increased by 17% in 2006, 18% in 2007,
and 27% in 2010. In the same period, Hong Kong’s growth rates are 5%, 5% and
23%, respectively. Singapore recorded the worst performance and it is expected to
be overtaken by Shenzhen and Guangzhou sooner or later.
More importantly,
7
FedEx’s new base in Guangzhou Baiyun international airport indicates Guangzhou’s
desire to be the regional air cargo hub and logistics centre that may dilute Hong
Kong’s current air cargo amount. Shortly after Guangzhou’s announcement,
Shenzhen Bao’an international airport also attracted UPS to open its new intra-Asia
hub in 2010, replacing operations at the former Clark Air Force Base in the
Philippines.8 As noted in the Table 1.2, Guangzhou’s Baiyun immediately registered
an increase of 39% after the FedEx opened its base there in 2009, and Shenzhen’s
Bao’an had an increase of 34% in 2010.
Table 1.2 Total Air Cargo of Singapore, Hong Kong, Shanghai, Guangzhou and
Shenzhen (000' Tonnes)
2006
2007
2008
2009
2010
Cargo
Change
Cargo
Change
Cargo
Change
Cargo
Change
Cargo
Change
Volume
%
Volume
%
Volume
%
Volume
%
Volume
%
Singapore
1,931
4%
1,918
-1%
1,883
-2%
1,660
-12%
1,841
11%
Hong Kong
3,611
5%
3,774
5%
3,660
-3%
3,385
-8%
4,168
23%
Shanghai
2,168
17%
2,559
18%
2,602
2%
2,543
-2%
3,227
27%
Guangzhou
653
-13%
694
6%
685
-1%
955
39%
1,144
20%
Shenzhen
359
-23%
616
72%
598
-3%
605
1%
809
34%
Notes: Slight differences of figures among sources can be expected.
Source: Airport Council International (2004-2009) and Centre for Asia-Pacific
Aviation & AAHK
It is also interesting to note which types of commodities are predominantly
transported by air.
As Table 1.3 shows, electronic and electrical accoutrements and
appliances made up most of the air cargo in 2010 and 2011, followed by pearls and
precious metals and other accessories.
7
8
All these commodities are high-value items.
New Asia-Pac FedEx hub opens in Baiyun Airport in Guangzhou, Transport weekly, 2009-11-02
UPS opens Asia-Pacific hub in Shenzhen, China Daily, 2010-02-10
15
Maritime Centre Report 2013
Table 1.3 Top five Commodities by Air, 2010-20119
Yearly Air Cargo
Item
2010
2011
16.2%
15.8%
10%
8.7%
office machines or automatic data processing machines
4.3%
4.8%
Watches and clocks
3.9%
3.3%
3.6%
3.7%
Telecommunications equipment, n.e.s.; and parts, n.e.s.,
and accessories of apparatus falling within telecommunications, etc.
Pearls, precious and semiprecious stones,
unworked or worked
Parts and accessories suitable for use solely or principally with
Electrical apparatus for switching or protecting electrical
circuits or for making connections to or in electrical circuits
(excluding telephone etc.)
1.3 Reasons behind the Stagnant Growth in Sea and Land Cargo
1.3.1 Decreasing Intangible Cost Advantages
With service quality and government efficiency, Hong Kong’s ports are able to offer a
number of intangible cost advantages to customers.
These include high service
frequency, high productivity, short vessel turnaround time, streamlined customs and
free port status, etc10. Hong Kong’s ports are comparatively strong in these fields,
and they are extremely important to cargo owners, so most of them are likely to
choose Hong Kong.
Under the support from both the local government and Hong Kong’s port operators,
such as Hutchcity-Whampoa and Modern terminals 11 , mainland ports, especially
those in the PRD, have improved quickly in the last several years the ports located.
They have established world-class hardware facilities, and also have trained hundreds
of qualified personnel to serve the ports. These improvements and the lower costs in
the mainland ports have lured many cargo owners to use their services.
In addition,
TDC Research, “The Future Position of Hong Kong as a Regional Distribution Centre”, 2006.
See also http://www.tdctrade.com
10
2008, HK Transport and Housing Bureau Transport Branch & GHK, “Study on Hong Kong Port
Cargo Forecasts 2005/2006 Executive Summary”, pp. 8
11
In Nov 2008, Shenzhen local government offered 39 million RMB subsidies to 7 shipping
companies, in order to encourage them to open new international calls in Shenzhen.
9
16
Maritime Centre Report 2013
with an increasing number of cargo owners flocking there, major ship owners also go
there to better serve their clients, instead of staying in Hong Kong.
As a result, service frequency and service quality have further improved in the
mainland ports.
Now 61 American ships and 58 European ship calls per week at
Shenzhen, compared with 59 and 63 calls in Hong Kong. Shenzhen’s shipping line
connectivity for the key trades, including lines to America, Europe, Australia, Asia,
the Mediterranean and the Middle East, etc.12, has already caught up with the ports of
Hong Kong.
Therefore, in terms of port service and shipping line connectivity, the
comparative intangible cost advantages of Hong Kong’s ports are fading significantly.
Yet, Hong Kong has maintained its intangible cost advantage of streamlined customs
compared with of mainland ports.
Thanks to the free-port status, Hong Kong’s
re-export goods are free to leave from Hong Kong as long as the customs house is
informed via email 14 days before departure. This is very different from the rules
for mainland ports, in that goods must get permission from China’s customs before
they are allowed to depart from the ports, thereby creating uncertainties.
Also, in the
mainland the large-scale enterprises receive priority from customs, which may not be
fair to the small and medium enterprises13.
Despite the streamlined customs advantage in Hong Kong, which highly depends on
the ideology of the local government, mainland ports have rapidly learnt from Hong
Kong’s example. Recently, mainland ports have also aimed to change their customs
system into a more friendly and convenient mode.
This gives additional confidence
to the cargo owners to freight via Mainland ports.
1.3.2 Increasing Tangible Costs
With respect to tangible costs, Hong Kong’s ports are more expensive to use than
mainland ports. This is the biggest challenge faced by Hong Kong when it competes
with the mainland. Among the costs, the road haulage tariffs and Terminal Handling
Charges (THCs) are the main costs that are higher than in the mainland.
12
2008, HK Transport and Housing Bureau Transport Branch & GHK, “Study on Hong Kong Port
Cargo Forecasts 2005/2006 Executive Summary”, pp. 9
13
Some of the interviewees pointed out the discrimination in PRC’s customs system, with priority
given to large-scale enterprises.
17
Maritime Centre Report 2013
Regarding the road haulage tariffs, around half of the south China’s direct containers
are moved by truck. As shown in Table 1.4, the road haulage tariffs for an FEU
container via Hong Kong’s ports are more than double what Yantian and Shekou
ports would charge.
The barge freight (all-in rate) via ports of Hong Kong is also
much more expensive in the ports of Hong Kong than of mainland ports.
Moving on to the terminal handling charges (THC), as shown in Table 1.4, Hong
Kong charges the highest fee in Asia.
For a TEU container freighting intra-Asia,
Hong Kong charges US$231, Singapore US$108, and mainland ports US$45.
In
fact, this terminal handling charge is imposed by ship operators to cover the service
fee of port operators, as well as miscellaneous fees, such as documentation fees and
exchange rate risks buffer, etc.
Given that Hong Kong’s ports are monopolised by a
small number of port operators, there is little competition among them.
In other
words, there is no pressure for the Hong Kong’s port operators to reduce fees.
Although port operations in Singapore are controlled by only two players, namely
PSA International and Jurong Port, they both have very strong ties with the local state.
PSA International was formerly the Port of Singapore Authority, and Jurong Port was
set up in 1963 by the Singapore Economic Development Board as part of its National
Industrial Estate Infrastructure Development Program. Clearly, these two operators
are supported by the Singapore government in order to develop the port business and
are not purely profit-seeking companies.14
The premium road haulage tariffs and terminal handling charges in Hong Kong lead
to the high tangible costs at of Hong Kong’s ports.
With less and less differentiation
in service quality between ports of Hong Kong and the mainland, the majority of
cargo owners will prefer to use mainland ports. In particular, the large-scale
enterprises, historically drivers of Hong Kong’s port industry, will also leave Hong
Kong.
14
This is likely to seriously impact Hong Kong’s port industry.
http://www.jp.com.sg/JurongPort/history/
18
Maritime Centre Report 2013
Table 1.4 Road Haulage Tariffs of Moving a FEU* Container from East PRD
(Dongguan) to US West Coast, 2006 (US$)
By Truck
By Barge
Via HKP
Via
Via Shekou
Yantian
/ Chiwan
Via HKP
Via Shekou
/ Chiwan
Ocean Freight Rate
1,850
1,850
1,850
1,850
1,850
Fee
1,377
1,377
1,377
1,377
1,377
Terminal Handling Charge (THC)
366
269
269
366
269
Truck to Port Terminal
300
120
120
N.A.
N.A.
Truck to Barge terminal
N.A.
N.A.
N.A.
52
52
Barge Freight (all-in rate)
N.A.
N.A.
N.A.
154
103
Total
3,893
3,616
3,616
3,799
3,651
Road Haulage Tariffs
Notes: FEU: Forty-foot equivalent unit (a 40 foot ISO container).
Source: GHK, April 2008, Study on Hong Kong Port Cargo Forecasts 2005/2006,
Executive Summary
Table 1.5 Terminal Handling Charges in Hong Kong and Other Locations, 2006 (US$)
Transpacific
Eastbound
Asia/Europe
Intra-Asia
FEFC
IADA
TSA
TEU
FEU
TEU
FEU
TEU
FEU
Hong Kong
$274
$366
$265
$353
$231
$340
Shenzhen
$141
$269
$141
$269
$45
$68
China Ports
$45
$68
$45
$68
$45
$68
Shanghai
$66
$88
$45
$68
$45
$68
Taiwan
$171
$214
$171
$214
$171
$214
Singapore
$108
$161
$108
$1,161
$108
$161
South Korea
$97
$132
$96
$131
$97
$132
Notes: FEU: Forty-foot equivalent unit (a 40 foot ISO container).
Source: GHK, April 2008, Study on Hong Kong Port Cargo Forecasts 2005/2006,
Executive Summary.
19
Maritime Centre Report 2013
1.3.3 Competition from Neighbouring Seaports in the PRD
For a long time, of mainland ports were underdeveloped with outdated facilities and
unprofessional services.
Many of the cargo owners in the mainland, especially those
located in Pearl River Delta cities, preferred to export from Hong Kong. In 1996,
direct ocean traffic from Hong Kong accounted for more than 96% of total export
from the mainland.
This figure decreased to 62%15 in 2003, when many new ports have been established
in the mainland, offering cargo owners more choices. By 2006, there were 61
container berths in the PRD, including 24 from Hong Kong’s ports.
This number is
expected to increase to 89 in 2010, with the locations shown in Figure 1.3. All of
these ports share the same hinterland— the PRD region.
According to Census and Statistics Department data released, in the first quarter of
2011, 45.7% of the total port cargo discharged in Hong Kong’s ports came from the
mainland, with 68% of them contributed by PRD cities16. Since the newly built
mainland ports also target PRD cargo, they directly compete with Hong Kong. Now
cargo owners in western PRD can choose the Nansha Port and those who located in
northern or eastern PRD can choose between Yantian port and Shekou Port (Figure
1.3). Given lower costs, convenient transportation and improved service quality,
cargo owners have growing motivation to use mainland ports, which also are much
closer to the manufacturing plants.
15 2008, HK Transport and Housing Bureau Transport Branch & GHK, “Study on Hong Kong Port
Cargo Forecasts 2005/2006 Executive Summary”, pp. 5
16
2011, 1st quarter, Census and Statistics Department, “Hong Kong Shipping Statistics”
20
Maritime Centre Report 2013
Figure 1.4 South China Container Ports – Current and Planned
Source: http://www.worldportsource.com/ports/CHN.php
1.4 Prospects of Future Development Amid Challenges
As mentioned above, Hong Kong faces the challenges of diminishing intangible cost
advantages, increasing intangible costs and competition from neighbouring ports
leading to its unconsolidated transport hub status, thus Hong Kong’s ports lack
upward drivers, with the possibility to go downwards.
Additionally, economic
recession in Europe and the United States, improving bilateral relations between the
mainland and Taiwan, and bankruptcy of small and medium enterprises in PRD
essentially worsen the situation.
Since the 2008 financial crisis, the US economy has suffered, and the latest
unemployment rate in September 2011 was at 9.1%. This reduces Americans’
consumption, and thus the volume of exports from China, especially from the PRD
cities.
It is the same case in Europe in that the sovereign debt crisis crushed the
confidence of the European economy and a great number of people have lost jobs.
21
Maritime Centre Report 2013
Some European countries even needed to cut social welfare in order to stave off debt
default.
Besides, bilateral relations between the mainland and Taiwan have improved under
Ma Ying-jeou’s presidency.
In November 2008, four agreements were signed,
including the “Cross-strait Sea Transport Agreement.” In this agreement, “the
mainland and Taiwan agree that vessels registered on either side of the Taiwan Strait
shall not fly their flag on the stern or mainmast of the vessel between entering and
leaving the other side’s ports, but shall fly their company flag for vessel identification.
Also both sides agree to provide facilitation for cross-strait goods and passengers to
pass through port customs and immigration controls. Most importantly, they agree
to mutually exempt each other’s shipping companies from the payment of business
and income tax on revenue derived from participation in cross-strait shipping17.” It
is predicted that Hong Kong will lose around 400,000 TEUs18 in container traffic
when direct transport between the mainland and Taiwan becomes well-developed.
In recent years, the Guangdong Provincial government has promoted industry
transformation and upgraded local enterprises by cancelling tax incentives, increasing
environment standards, adopting the minimum wage and launching new labour laws,
etc.
Some of the enterprises went bankrupt due to the sudden cost increase, while
others have relocated to inland provinces, such as Hunan, Jiangxi and Jiangsu, etc.
As a consequence, Guangdong Province’s cargo volumes and categories have
changed accordingly. Overcapacity at ports in the mainland, including Yantian port,
Shekou Port and Huangpu Port, coupled with Hong Kong’s ports, intensifies the
competition.
Not only are Hong Kong’s ports charging higher fees than others, but
after the relocations they have also become much farther from the manufacturing
plants than mainland ports.
17
2008, Cross-Strait Sea Transport Agreement
香港經濟日報, <港旅業添壓, 失百萬台客>, 2008 年 11 月 5 日
18
22
Maritime Centre Report 2013
2.
Transforming and Upgrading the Maritime Industry
It is a historical imperative that Hong Kong revisits its definition, concept and
perspective of the maritime industry. This is most easily done by learning from
other maritime centres like Singapore and the UK. The chapter will continue with a
discussion of the need for a full realisation and recognition of the true economic value
of the maritime industry to Hong Kong.
Finally, Hong Kong’s distinct opportunities
to take full advantage of the shifting trade patterns will be presented.
2.1 International Maritime Centre (IMC) Redefined
A maritime centre has three interrelated sectors, namely, a port sector, a shipping
sector and a maritime services sector.
a) Port sector contains matters related to the port and its operations.
b) Shipping sector refers to the process of transporting cargoes from one place to
another. Shipbuilding and ship repairing are included in this sector since
they are critical parts in this process and yield physical outputs.
c) The maritime service sector embodies ship registration, ship management,
ship financing, ship insurance, maritime arbitration, ship broking & chartering
and other professional service institutions19.
From the perspective of adding value, Hong Kong’s port sector belongs to the
downstream industry with lowest value added, and shipping business is in the middle
stream industry, while maritime services belong to the upper stream industry with
highest value added.
Traditionally, Hong Kong has only focused on the port section.
Thus, when Hong Kong was surpassed by Singapore and Shanghai in terms of port
container traffic, Hong Kong was very worried about its IMC status. Being the
exception in the maritime service section, Hong Kong has achieved great success in
its ship registration.
However, other maritime services, such as ship finance, ship
insurance and maritime arbitration are still not well developed.
If Hong Kong could
pay more attention to these maritime services, its international maritime centre status
won’t be shaken but only consolidated. In short, Hong Kong should recognise this
19 In order to get a proper classification of maritime centre, we have referred to the definition of the
Singapore maritime authority and 2005, 李惠權,《船舶註冊與航運中心的唇齒關係》.
23
Maritime Centre Report 2013
trend and determine as soon as possible the blueprint and policies in support of
maritime services.
Figure 2.1 Classification of Maritime Clusters
Hong Kong
Shanghai
Shipping Finance
Product, Shipping
Freight Index
Derivatives, Risk
Control
Port Infrastructure
Shipping Exchange
Market
Inland Waterways,
Railway and Airport
facilities
Integrated Information
Sharing Platform for
International Shipping
Centre
Ship Trading, Ship
Management, Ship Broking,
Shipping Consultants,
Marine Technologies and
Other Types of Shipping
Services Agencies
Ship Financing, Marine
Insurance and other
high-end services
Classification
Societies &
Surveyors
Shipbroking
Maritime Law
& Arbitration
Marine
Equipment &
Support Service
Ship Agents
Ship Finance
and marine
insurance
Management
Cruise
Source : 国务院关于推进上海加快发展现代服务业和先进制造业设国际金融中心和国际航运中心的意见
http://news.xinhuanet.com/politics/2009-04/29/content_11282770.htm
Shipping
Register
Shipowning,
Source: Hong Kong Maritime Industry Council
http://wwww.mic.gov.hk/eng/home/index.htm#
U.K.
Singapore
Ports
Cargo / Passenger
Terminal
Ship Chandlers
Ship Bunkering
Inland Water
Transport
Importers
Storage &
warehousing
Petro-chemicals
Other Transport
/ Freight
Forwarding
Maritime Services
Insurance, Reinsurance & P&I
Maritime Legal
Maritime Related Finance
Government Agencies
Education & Training
Maritime Related R&D / IT
Class Societies & Marine Surveying
Maritime Logistics & Supporting Services
Shipping
Cruise
Ship Management
Ship Broking &
Chartering
Services
• Ports
Shippers
Other Logistics
Services
• Shipping
• Leisure Marine
Shipping Lines/
Ship Owners
Offshore & Marine
Wholesale/Retail
of Marine
Equipment
•
•
•
•
•
•
•
Exploration &
Production
Defence
Offshore
Labour Suppliers
Shipbuilding &
Repair
Material
Suppliers
Maritime Services
Telecommunications
Research & development
New Technologies
Education & training
Ocean survey
Safety & salvage
• Shipbuilding
• Defence / Naval
• Minerals & aggregates
• Fisheries
Source: Dynamic European Maritime Clusters, 2006
Source: Maritime and Port Authority of Singapore
2.2 Maritime Industry’s True Economic Value
According to figures from the Hong Kong Maritime Industry Council (Table 2.1 and
Table 2.2), after Hong Kong’s reversion to China’s sovereignty, economic
contributions of port and “maritime service” were around 2-3% and 2%, respectively.
They only accounted for 6% of the total employment in Hong Kong.
24
Maritime Centre Report 2013
When looking at “port business” and “maritime service”, it is easy to get confused.
These concepts are not well defined, and indeed overlap. Thus, it is reasonable to
doubt the accuracy and reliability of the results above, and they are not able to reflect
the real contribution of Hong Kong’s maritime industry. In fact, the Hong Kong
SAR government has a very narrow definition of maritime industry, which mainly
emphasises the port section. Our interviewees gave estimates that are much higher
than government figures.
Kong’s GDP.
They believe that it may reach as high as 20-25% of Hong
Meanwhile, it is not only the government, but also Hong Kong’s
mainstream society that may have the same narrow understanding of maritime
industry.
Table 2.1 Economic Contribution of the Port Business20
Value Added
(Million HK $)
% of GDP
Employment
% of Total
Employment
1998
26,300
2.2
114,700
3.7
2000
29,500
2.4
110,800
3.5
2002
27,600
2.3
97,200
3
2004
34,700
2.8
109,500
3.3
2006
35,100
2.5
110,900
3.2
Source: Hong Kong Maritime Industry Council
20
a). Ship management service, ship owners or operators of sea-going vessels, on-land port service,
other services and sea freight services brokers; b). Other services related to sea freight, port related land
freight service, storage services, package services, inspection services, loading services and metage
service; and c). Ship brokers.
25
Maritime Centre Report 2013
Table 2.2 Economic Contribution of Maritime Services21
Value Added
(Million HK $)
% of GDP
% of Total
Employment
Employment
1998
23,100
1.9
78,800
2.5
2000
26,500
2.1
77,100
2.4
2002
25,900
2.1
76,400
2.4
2004
32,000
2.6
80,400
2.5
2006
32,600
2.3
86,900
2.5
Source: The Hong Kong Maritime Industry Council
As mentioned before, maritime clusters actually have a very wide scope, with the port
sector being only part of the picture.
The undervalued maritime services, such as
ship registration, ship management, ship-broking, ship chartering, ship insurance and
ship arbitration, and other related entertainment services, such as dining services,
living services, transportation services and other retail services around the ports, all
are directly or indirectly contributing to Hong Kong’s GDP.
In other words, if
maritime services are supported by more preferential policies, their economic
contributions can be even higher than 25%.
Thus, both the Hong Kong government and mainstream society should reconsider the
maritime clusters from an entirely economic perspective.
To be specific, Hong
Kong’s maritime industry should not only include the port section, but also many
other high value-added services. Essentially, it can be expected these maritime
services have great contributions to Hong Kong’s economy.
If Hong Kong is still
stuck in the current narrow definition of the maritime industry, its development will
not only be constrained, an economic driver but also be lost, especially in the
long-term.
21
a). Ship management service, ship owners or operators of sea-going vessels, on-land port service,
other services and sea freight services brokers; b). Sea passenger transport, ship owners or operators of
Hong Kong – Macau, ferry terminals services, small-scale ferry service; and c). Ship brokers.
26
Maritime Centre Report 2013
2.3 From London to Hong Kong— Right Time for Hong Kong to Develop into an
IMC
With the business centre moving from Europe to Asia, Hong Kong has the
opportunity to build itself into a new international maritime centre. Regarding the
sea-going vessels, Asia as whole has the most vessels and largest gross tonnage in the
world.
In 2010, the top 35 ship-owning countries (in terms of dwt) controlled 95.5%
of the world tonnage.
Among them, 16 of the countries are in Asia, 15 in Europe,
and four in the Americas22. In 2009, China overtook Germany as the second largest
nation, accounting for 8.8% of the world’s trade23. Thus the era that Europe and
America monopolised the world’s maritime business has become history, and Asia
must strengthen its role and soundness in the world’s maritime business. Moreover,
China’s 12th Five-year Plan has shown Beijing’s desire to develop its domestic
logistics industry, which can also benefit Hong Kong's maritime industry.
With the rapid growth of Asian countries, ship owners or operators expect higher
standards from the port and shipping facilities. This has driven the improvement of
shipbuilding and ship repairing in Asia. Now the world’s three largest shipbuilders
are Korea, Japan and China. However, Hong Kong maritime services still trails
London’s.
Asia lacks a qualified maritime centre that could compete with London.
In reality, ship owners and ship management companies in Asia still undertake their
ship financing deals, ship insurance deals, maritime arbitration cases and other
maritime services in London.
On one hand, London as a traditional international maritime centre has mature
policies and qualified talents. On the other hand, London is the largest pool in the
world with the most multinational ship owners, ship financing banks and ship
insurance companies, which have already developed long-term networks with one
another. As a result, all kinds of demand could be satisfied in London’s maritime
market, according to Lloyds. The gap between the rapidly increasing shipping
business in Asia and lagging maritime services stunts further development of
maritime industry.
From a long-term perspective, developing ship financing,
maritime arbitration, ship insurance and other services in Asia would lead to
significant advantages over those available in London. Closer to the world’s largest
22
23
2010, UNCTD, “overview of maritime transport”, P.37
2010, UNCTD, “overview of maritime transport”, P.65
27
Maritime Centre Report 2013
shipping market, Asia is able to provide tailored services to ship owners or operators
here.
This brings both opportunities and challenges to Hong Kong.
Backed by the
mainland, Hong Kong has a huge hinterland, and then-Vice-Premier Mr. Keqiang Li’s
visit in 2011 to Hong Kong showed great support from Beijing to develop the city’s
service industry. Most importantly, Hong Kong’s well-developed financial facilities
and legal systems give investors the confidence to run business in Hong Kong.
If
Hong Kong can seize the opportunity by utilising its own advantages to attract Asian
ship owners and operators to use the services here, Hong Kong can become another
IMC apart from London. With a growing number of ship owners or operators
coming to Asia, Hong Kong is expected to consolidate its status as a leading
international city as well.
28
Maritime Centre Report 2013
3.
Current Situation of Hong Kong’s Maritime Services and Challenges
Armed with a new definition of the maritime industry, we shall now discuss the
present state of maritime services in Hong Kong and the challenges faced by this
sector.
3.1 Marine Insurance
3.1.1 Current Situation
Marine insurance in general covers two types of loss or damage, including
quantifiable risk, such as Hull and Machinery (H&M) insurance covering loss or
damage of ships, cargo insurances dealing with cargo owners’ risks, and broader
indeterminate risks, such as third party liabilities. The latter is usually covered by
protection and indemnity insurance, commonly known as P&I, a form of marine
insurance provided by a P&I Club.
A P&I Club is a mutual (i.e. co-operative)
non-profit oriented insurance association that provides cover for its members, who
will typically be ship owners, ship operators or demise charterers. Given the
considerable value of ships and unpredictable nature of liabilities, H&M and P&I
services are much needed worldwide.
The International Group of P&I (IGP&I) is composed of 13 principal underwriting
member clubs, which provide liability cover for approximately 90% of the world’s
ocean-going tonnage.
Controlled by its members through a board of directors or
committee elected from the membership, each club covers a wide range of liabilities
related to the use and operation of ships for its members with an upper limit of around
US$8 million, including personal injury to crew, passengers and others on board,
cargo loss and damage, oil pollution, wreck removal and dock damage.
Group
members mutually cover each other’s exceeded liabilities up to US$50 million, with a
pre-set proportion. The remaining will be reinsured to a commercial insurer with
premiums. Currently there are eight out of 13 group clubs with their representative
offices in Hong Kong, making it the largest cluster of P&I Club representatives
outside the City of London, while four clubs have set up offices in Singapore.
29
Maritime Centre Report 2013
Figure 3.1 Authorized Insurers in Marine Business in Hong Kong
Table 3.1 Loss Ratio for Marine Cargo and Hull Insurances
30
Maritime Centre Report 2013
Figure 3.1 shows since 2002 the number of insurers engaged in local marine insurance
has been decreasing. In fact, the downward trend began in 199424. The most
probable explanation is twofold. First, as it required a large amount of reserved
funds, the profitability of marine insurance is unfavourable compared with other
property and casualty insurance. Table 3.1 shows the marine insurance business
actually has continued to make huge losses and has been the least profitable sector in
Hong Kong’s insurance industry for years25. The second reason is both H&M and
P&I insurance are highly technical and sophisticated, expertise about ships, ship
management and potential risks of ship operations are essential but hard to acquire.
Currently, there are no specific training courses or degree programs that produce
relevant talents; most practitioners acquire the scope of knowledge required through
either diligent self-study or on-the-job training.
Competent manpower is difficult to
find in Hong Kong, where most marine insurance businesses only perform the
brokerage function. Some ship owners or insurance subscribers prefer to do
business directly with their contacts in Britain and search for competent expertise,
even if it is located thousands of miles away.
3.1.2 Challenges and Problems
3.1.2.1 A Lack of Manpower
Table 3.1 shows how insurance companies have limited incentives to hire talents to
participate in or expand related business.
24
25
The vicious circle worsens the status of the
One Country Two Systems Research Institute, 2008,《香港國際航運中心的轉型與升級》.
Office of the Commissioner of Insurance, Annual Report
31
Maritime Centre Report 2013
marine insurance sector compared with other more profitable and popular insurance
sectors in Hong Kong. The entrance barrier is high and the salary of competent
marine insurance underwriters or brokers is higher than industry average.
Nonetheless, as opined by some marine insurance practitioners, because of the
specialty of the profession and great demand for marine insurance coverage, a
succession gap is a major problem faced by the sector. (Even if the entrance barrier
is not too high, there is still a need for appropriate training and relevant experience.)
In addition, there are no tailor-made training courses or degree programs for marine
insurance provided by the SAR government or private sector, again due to the lack of
awareness and regular personnel demand.
3.1.2.2 Competition from other cities in Asia
The establishment of Lloyd’s in Singapore and Lloyd’s in Shanghai has created
keener competition in Asia. Hong Kong’s traditional advantages, such as a simple
tax system, competency of manpower language abilities and a free market
environment, are diminished as we witness the development of Shanghai and
Singapore with strong government support. Hong Kong’s extremely high land cost
makes it impossible to establish an office of Lloyd’s, as it has set up shop in
Singapore and Shanghai.
Only Hong Kong’s Common Law and English-like law
system helps it to attract more marine insurance companies to come and try out the
Asia market before entering the mainland legal system.
3.1.2.3 Lack of effective risk management oriented financial innovations for P&I club
On one hand, given its non-profit-making and mutual insurance nature, P&I clubs in
Hong Kong function as a representative to provide services to members, mostly the
ship owners, the policy subscribers as well as the clubs’ owners. There is little
incentive for P&I clubs to proactively search for risk management oriented innovative
financial instruments to handle the potential risks, besides member profile
diversification and exchange rate fluctuation treatments.
On the other hand, there is little incentive for investors and financial institutions to
actively participate in maritime mutual insurance, as the system provides little to no
premium. However, as the P&I clubs’ major responsibility is to cover the
unpredictable liability of their members, more risk management oriented financial
innovations are necessary.
32
Maritime Centre Report 2013
3.1.3 Short Summary
Although it is less profitable, marine insurance remains indispensable to Hong Kong’s
maritime industry.
The succession gap is the biggest problem faced by Hong Kong
marine insurance development. Competent personnel will not easily leave the sector
because of above-average salaries, while the tremendous efforts entailed in acquiring
the complicated and sophisticated knowledge and the skills needed to join the
business virtually blocks entry by young people.
With increasing regional
competition mainly from Singapore and Shanghai, Hong Kong’s marine insurance
industry is suffering both internal and external challenges. The major advantage that
Hong Kong can still utilise is the maritime legal sector. Therefore, the need to create
a smooth cycle within the sizeable insurance sector and further the growth of the
allied legal sector is of the primary significance, and this requires favourable
government or regulatory support.
3.2 Cruise Industry
3.2.1 Current Situation
Cruise is classified as one of the maritime clusters in Singapore, the EU, the US,
Britain France, the Netherlands, Norway, Italy, Shanghai and many other maritime
centres.
The reason is obvious.
The cruise market has long been considered
supply-driven, for without ships and operational facilities to support the servicing of
the vessels, demand cannot manifest itself. Cruise vessels and facilities bring in
tourists who consume locally and offer ample business opportunities for penetration
of insurance including travel insurance, operator liability, crew liability etc.
Over the past two decades, the cruise industry has emerged as one of the fastest
expanding segments of the travel industry worldwide. The US, Canada and Europe
account for more than 80% of the world’s demand for cruises, and the Caribbean is
expected to remain the prime destination (50% of market share) due to its proximity
to the large North American market.
Other leading destinations are the
Trans-Panama Canal, the Mexican Rivera, Alaska and the Mediterranean. The
market is highly oligopolistic – in 2012 by passenger capacity Carnival Cruise Line
(CCL) ranks the 1st with 49.1%, Royal Caribbean (RCL) ranks the 2nd with 22.6%
total market carrying capacity.
33
Maritime Centre Report 2013
Between 1998 and 2008, the number of international cruise ship passengers rose from
17,069,100 to 33,358,300, an increase of more than 95%26. In 2009, international
cruise passenger throughput reached 605,711, and per capita spending of transit cruise
visitors was HK$1,67027.
growth.
In 2010, the Asian cruise industry experienced rapid
The unprecedented economic growth in Asia-Pacific has driven demand for
cruise vacation and brought about tremendous opportunities to the cruise market28.
In fact, developments in neighbouring ports have also enhanced the cruise tourism
appeal of the region in attracting more ship deployments and in facilitating
multi-destination itineraries. Hong Kong, as Asia’s one of the most important ports,
has become one of the must-go stops of round-the-world voyages of many renowned
cruise vessels such as Queen Mary II, Queen Elizabeth, Diamond Princess, Seabourn
Spirit, etc.
We are well positioned in the increasing affluent PRD, and our air connections with
regional markets provide superior access. Not surprisingly, the number of ship calls
to Hong Kong jumped by 28% year-on-year to 120, whereas international passenger
throughput increased by 9% to 660,291.
The mainland China, Hong Kong’s key
source market, contributed 66% of the total throughput29. In the first three quarters
of 2011, the total number of passengers was around 1.19 million with a 10.6%
year-on-year increase as per Hong Kong Tourism Board (HKTB) online research
report30.
Despite the rise in number of passengers and number of worldwide itineraries
including Hong Kong as one of the ports of call, few cruise lines home-ported in
Hong Kong.
Amongst 20 world-class cruise companies with itineraries involving
Hong Kong, few cruise vessels have been deployed to home-port at Hong Kong and
operate daily cruise experience tours31. Home-port cruise passengers stay longer
than transit cruise passengers (according to a survey conducted by HKTB, in 2010 the
length of stay of home-port passengers and transit passengers are 2.8 nights and one
night, respectively) and the per capita spending of home-port cruise passengers was
Travel & Tourism Economic Impact Executive Summary 2009 (2009),
http://www.wttc.org/bin/pdf/temp/exec_summary_2009.html
27 HKTB Annual Report 2009/2010
28 The Tourism Committee,
http://www.tourism.gov.hk/english/current/files/consultancy_studies.pdf
29 HKTB Annual Report 2010/2011,
http://www.discoverhongkong.com/eng/about-hktb/images/2010-2011-12.pdf
30 Online Research Publication of HKTB, http://partnernet.hktb.com/
26
32
Cruise South China, http://www.discoverhongkong.com/cruisesouthchina/eng/index.html
34
刪除:
Maritime Centre Report 2013
about double that of transit passengers. It is essential to strengthen the
competitiveness of Hong Kong as a home-port for cruise vessels.
Table 3.2 Cruise Passenger Statistics January-September 2011
Outside
HKSAR
HKSAR
(Estimated
Figures)
Grant Total
Transit
Cruise
Passenger
(Cruise-in/Cruise-out)
No.
Growth
of
(%)
Passengers
Home-porting Cruise
Passenger
(with Itineraries )
No.
Growth
of
(%)
Passengers
Other Cruise Passenger
(without Destination )
Total
No.
of
Passengers
Growth
(%)
No.
of
Passengers
Growth
(%)
60,402
-14.4
90,352
-6
370,491
15.9
521,245
7.2
6
-90.4
13,002
-44.7
658,097
15.7
671,105
13.3
60,408
-14.4
103,354
-13.6
1,028,588
15.8
1,192,350
10.6
Research conducted by the University of the Aegean in Greece, involving cruise
industry experts mainly in Greece and Cyprus, unveiled the vital factors the cruise
companies take into account in home-port selection.
The top 15 home-port selection
criteria reflect that the availability of an international airport is of vital importance for
every cruise home-port.
Table 3.3 Cruise Industry’s Selection Criteria 2007
Gravity of the home-port selection criteria
1
Availability of an international airport
2
Safe and secure environment
3
Air connections
4
Reliable air transport
5
Capacity for handling a large number of passengers simultaneously
6
Port depth
7
Infrastructure for passengers embarkation/disembarkation
8
Cabotage policy
9
Services related with security
10
Capacity of the airport
11
Places of historical interest
12
Incentives to cruise companies in order to start home-port operations
13
Political stability
14
Facilitation of the passengers
15
Proximity to cruise itineraries
Source: Which Home-port in Europe: The Cruise Industry’s Selection Criteria
2007 www.PortEconomics.eu
35
Maritime Centre Report 2013
Hong Kong International Airport is ranked 10th in the world in terms of passenger
traffic. This city has good air connection, is safe and secure, with a high frequency
and reliability of flight schedules in air transport. There is no doubt Hong Kong will
be preferred as the choice of home-port.
Nevertheless, the SAR government should
speed up initiatives in increasing the airport’s capacity, which is presently almost
saturated, through the establishment of a new cruise terminal, strengthening our
customers and quarantine facilities in handling passengers.
Table 3.4 The World’s Top 10 Airports by Passenger Traffic
Total
Rankings
Airport
1
ATLANTA GA, US(ATL)
85,165,259
2
BEIJING, CN(PEK)
71,284,796
3
LONDON, GB(LHR)
63,912,107
4
CHICAGO IL, US(ORD)
61,370,268
5
TOKYO, JP(HND)
56,969,971
6
LOS ANGELES CA, US(LAX)
56,819,805
7
PARIS, FR(CDG)
56,254,938
8
DALLAS/FORT WORTH TX, US(DFW)
53,126,399
9
FRANKFURT, DE(FRA)
52,191,355
10
HONG KONG INTERNATIONAL AIRPORT
48,587,000
Passenger
Notes: Data for Jan- Oct 2011 Source: Airports Council International
In September 2008, in line with the strategy to develop Hong Kong into a regional
cruise hub, to attract more cruise lines to home-port here, to improve our
infrastructure for passenger embarkation / disembarkation which is currently
inadequate for mega cruise vessels, the SAR government spent more than HK$5.8
billion to build a new cruise terminal in Kai Tak, with the first berth expected to go
into operation in mid-2013, followed by a second berth in less than two years. In the
new cruise terminals, the Customs, Immigration, Quarantine and Police (CIQP)
facilities will be able to clear 3,000 passengers per hour. It is estimated that with the
availability of new cruise facilitates, the economic benefits brought about by the
cruise industry will range from $1.5 billion to $2.6 billion per annum and between
5,300 and 8,900 jobs will be generated by 2023.
Besides, the SAR government has taken steps to expand the local market and
familiarise more people with the new forms of tourism.
36
Promotional efforts has
Maritime Centre Report 2013
expanded to collaborating with nearby mainland port cities in four provinces 32 ,
namely Guangdong, Guangxi, Fujian and Hainan. Enriching itineraries should
attract more local and mainland customers. However, no market segments or target
customers have been identified for the cruise industry.
The availability of
experienced manpower is also an issue.
3.2.2 Challenges and Opportunities
3.2.2.1 Visa issue hinders growth of market size
The market size is insufficient to attract big cruise companies to home-port in Hong
Kong their best vessels and arrange international itineraries.
While the local market
is currently beginning to mature, due to visa issues it remains difficult for mainland
tourists with international itineraries to depart from Hong Kong. This is because
Mainland Chinese passport holders are not allowed to board most international cruise
ships without a visa.
The SAR government should resolve this visa issue by issuing one-time visas to
cruise travellers.
This would produce immediate benefits for cruise business
involving Hong Kong and Taiwan.
3.2.2.2 Geographical competitiveness
Contrary to the SAR government’s belief that Hong Kong is well-positioned to
capture the growth and become the region’s cruise hub with its natural advantages and
excellent physical infrastructure, tourism practitioners tend to think Hong Kong’s
geographical location is one of its major drawbacks. They believe that the port
density within the region cannot fulfil the needs of tourists embarking from Hong
Kong, since they have to remain aboard ship for a long time until they reach another
port for sight-seeing. Tourists usually wish to visit as many ports as possible on
their itinerary.
Kong.
Therefore, it is unfavourable for cruise tours to start from Hong
The two major cruising areas in Asia are Southeast Asia and North Asia.
Singapore
is the preferred home-port for Southeast Asia itineraries, whereas Shanghai, Tianjin
and Dalian are actively competing for North Asia itineraries with their geographical
advantages.
37
Maritime Centre Report 2013
In this regard, the SAR government should co-operate more closely with mainland
cities in the south in developing products and regional itineraries, in order to
strengthen Hong Kong’s competitiveness in the region. Apart from opening new
cruise berths, the government should also hasten development in East Kowloon to
provide more supporting facilities such as dining, shopping, hotels and land
transportation options, thereby expanding attractions for cruise passengers arriving in
Hong Kong.
Presently, only the Star Cruise has its headquarters in Hong Kong.
The SAR
government should do more to attract the world’s largest cruise operators, such as
Carnival Corporation and Royal Caribbean Cruises (with an international office in
Singapore) to home-port for their cruise vessels in Hong Kong.
3.2.2.3 Insufficient manpower supply
Local cruise-related courses currently provided at universities (nine degree and
diploma courses) and training institutes (17 diploma and certification courses)33 are
mostly travel and tourism-oriented. Only nine out of a total of 26 courses focus on
relevant services training for cruise travels and travellers, covering cruise
management, planning, risk and crisis management, cruise selling, logistics services
for cruise, cruise agency training etc.
No cruise crew training is provided.
A
review of training policies is recommended.
3.2.3 Short Summary
The cruise industry has emerged as one of the fastest expanding segments of the travel
industry worldwide.
Though the SAR government has made multi-faceted efforts by
building the Kai Tak new cruise terminal and opening various training courses to
supply required manpower, more should be done on the visa issue, promotion and
product development, and the development of supporting facilities in East Kowloon
and attracting leading cruise operators to Hong Kong.
3.3 Maritime Arbitration
33
Tourism Commission 2011, http://www.tourism.gov.hk/english/ctkt/sd_circ.html
38
Maritime Centre Report 2013
3.3.1 Current Situation
Thanks to the rapid growth of the Asian economies and their growing acceptance of
arbitration as a form of alternative dispute resolution, there has been a substantial
increase in dispute referral to arbitration in recent years. The rise in arbitrations is
particularly obvious in the main international locations, including Hong Kong,
Shanghai and Singapore.
To sustain our position as a maritime service centre, we
must strengthen our competitiveness in maritime arbitration.
According to the ‘2010 International Arbitration Survey: Choices in International
Arbitration’, London, Paris, New York and Geneva are the seats used most frequently
with high levels of user satisfaction, and Singapore has emerged as a regional leader
in Asia. Moscow and the mainland are regarded most negatively as seats of
arbitration.
Figure 3.2 2010 International Arbitration Survey: Choices in International Arbitration
Hong Kong does not make the list, even though we have more maritime arbitration
cases than Singapore.
39
Figure 3.3 Number of Maritime Disputes involvingMaritime
HKIACCentre
and SIAC
Report 2013
Before delving into the reasons why Hong Kong has lagged behind London and
Singapore as the preferred seats of arbitration, we must understand the recent
development of arbitration laws in the city.
Hong Kong’s arbitration laws in have recently undergone a major overhaul. A new
Arbitration Ordinance went into effective 1st June 2011, abolishing the difference
between domestic arbitration and international arbitration based on the United Nations
Commission
on
International
Trade
Law (UNCITRAL)
Model Law,
an
internationally recognised model. This means the UNCITRAL Model Law is to be
applied to all arbitrations in Hong Kong. It now incorporates more detailed costs
and taxation provisions with an aim to reducing the costs of arbitration and judicial
intervention.34
The new ordinance retains the flexibility of having a “documents
only” hearing for smaller claims, which is generally more efficient and economical
than traditional oral hearings. It also incorporates maximum recoverable limits for
arbitrators’ fees and lawyers’ costs.
All these changes have made Hong Kong
arbitration significantly more user-friendly.
In terms of enforcement of awards, Hong Kong has adopted the New York
Convention on the Recognition and Enforcement of Foreign Arbitral Awards (“New
York Convention”) by virtue of the ratification of the UK in 1977 and subsequently
through China after the handover in 1997. The courts in Hong Kong therefore
recognise and readily enforce arbitral awards made in more than 140 countries, all
34
2011, Alexander McKinnon, City University of Hong Kong, Working Paper Series, “Hong Kong
And Singapore Ports: Challenges, Opportunities And Global Competitiveness”
40
Maritime Centre Report 2013
signatories to the New York Convention.
Similarly, Hong Kong awards can
generally be enforced through the courts of other signatory countries. However, as
the convention applies to only awards made in a different state, it no longer applies to
the enforcement of a Hong Kong award in the mainland China, and vice versa,
following Hong Kong’s return to Chinese sovereignty.
Enforcement has been made
possible through the enactment of a 1999 reciprocal arrangement, which has been
incorporated into the Hong Kong Arbitration Ordinance since 2000. In the same
year, the Hong Kong Maritime Arbitration Group (HKMAG) was formed as a
division of the HKIAC to provide extensive and professional services to parties who
wish to resolve their maritime disputes by arbitration.
Table 3.5 Comparison of Arbitration amongst Hong Kong, Singapore and Mainland
China
Hong Kong
Singapore
Mainland China
Governing
Arbitration
Dual-track system :
Arbitration Law
Legislation
Ordinance
Generally, for domestic
arbitration, the Arbitration
Act governs, for
International arbitration,
the International
Arbitration applies
Main Arbitral
Hong Kong
Singapore International
China International
Institution
International
Arbitration Centre (SIAC)
Economic and Trade
Arbitration Centre
Arbitration
(HKIAC)
Commission
(CIETAC)
Yes
Yes
Yes
Costs
Registration
Registration
Case filing
(for administered
Fee :US$1,000
Fee :RMB1,000
Fee :SGD1,000
arbitration under
Administrative fees:
Administrative fees:
Administrative fees:
the main arbitral
From 0.03% to 0.7%
From 0.5% to 3.5% of the
From 0.075% to 2% of
institution)
of the claim amount
claim amount
the claim amount
(min-US$1,500, max
(min-RMB10, 000, eqv.
(min-SGD 3,250, max
US$26,850)
US$1,563)
– SGD66, 500; USD
Enforcement –
Signatory to New
York Convention
eqv. Min $2,580,
Max$53,668)
41
Maritime Centre Report 2013
In terms of costs, governing legislation, main arbitral institution, and enforcement of
awards, we are no less competitive than Singapore and the mainland. In fact, the
number of maritime arbitrations in Hong Kong has been surging in the past five years,
and it is believed that mainland ship owners and operators are the key originators of
arbitration cases. Hong Kong has obvious cost advantages in arbitration.
Why are
we not on the list?
Table 3.6 Cost of Arbitration
3.3.2 Challenges and Problems
Neutrality and impartiality of the legal structure is the most important factor in the
selection of seats of arbitration.
Compared with Hong Kong, Singapore is a country
in which many businesses are confident as a neutral, independent third-country with a
sophisticated and established legal system and culture. Political neutrality and the
absence of bribery are also important factors. Hong Kong faces a big challenge in
this regard, and the SAR government must do its utmost to preserve the neutrality and
impartiality of our legal structure.
Under Singapore’s dual-track arbitration regime, the parties are provided with the
flexibility to opt into or out of a particular regime by agreement.
Awards obtained from Hong Kong are not enforceable in India, a recently emerging
trading partner, but awards from Singapore are. Historically, Singapore is one of
India’s preferred arbitral destinations due to its cultural affinity and geographical
proximity.
A significant number of lawyers of Indian origins are practising in
Singapore.
The reason being that Section 44 of the Indian Arbitration and
Conciliation Act of 1996 require an award be made in a convention country which has
42
Maritime Centre Report 2013
been identified in India’s Official Gazette as a country in which the convention
applies. Out of the 142 Convention countries, Singapore, but not Hong Kong is one
of the fewer than 50 countries identified in India’s Official Gazette.
In terms of facilities, the SIAC is located in Maxwell Chambers, opened in January
2010 to house top international arbitral institutions, including SIAC, AAA, ICDR,
ICC and barristers etc., under one roof and provide state-of-the-art hearing facilities
and support services. As an alternative to the SIAC, parties may also choose to refer
disputes to arbitration to be administered by other arbitral institutions, such as the ICC
International Court of Arbitration. The ICC maintains its Asia regional office in
Singapore. However, HKIAC is situated in the crowded venue of half a floor in
Two Exchange Square.
Maritime court and choices of arbitrators are the other drawbacks to surmount. As
early as in 2002, Singapore founded its maritime court, but Hong Kong does not have
any dedicated judge for maritime cases up till now. As recently as in 2011, there were
22 arbitrators in the Hong Kong Maritime Arbitration Group, while the Singapore
International Arbitration Centre has twice as many. Furthermore, in Singapore parties
may be represented by any person(s) as arbitrator(s), and non-resident arbitrators do not
require a work permit to sit as arbitrators.
Promoting Singapore as an arbitral seat with conferences and active involvement of
more arbitral institutions (such as ICC and AAA/ICDR) apparently have paid
dividends such that the city has emerged as Asia’s most popular n seat. Last but not
least, Singapore offers tax incentive: a 50% tax exemption on incremental qualifying
income earned by an approved law firm from international arbitration cases heard
there.
3.3.3 Short Summary
Whilst it is paramount to preserve neutrality and impartiality of our legal system, the
SAR government should:
actively facilitate enforcement in India of awards obtained in Hong Kong.
establish an admiralty court
should strive to attract more mainland companies to arbitrate domestic
disputes in Hong Kong, as many mainland ship owners and operators
come here for arbitration.
This would lead to a win-win situation
43
Maritime Centre Report 2013
whereby the standards of arbitration in the mainland will improve, while
boosting the local arbitration market in Hong Kong. This should also be
codified in a CEPA agreement.
support Hong Kong Arbitral Institution to establish branch offices in major
mainland cities and promote and facilitate communication amongst arbitration
organisations outside the Greater China Arbitration Forum (GCAF 大中華仲裁
論壇).
upgrade the existing HKIAC facilities and put all related institutions and
professionals under one roof.
consider launching the “form”. In 2011, Singapore launched the Singapore Sale
Form (“SSF”), a new ship sale form designed to tackle problems currently faced
by buyers and sellers and enhance the ship sale and purchase practices and
procedures presently adopted.
This makes Singapore the default seat of
arbitration in the event that disputes arise in a transaction. Clause No. 15 of the
Form provides that all disputes are to be submitted to arbitration in Singapore in
accordance with the SCMA Rules, which are modelled on the London Maritime
Arbitrators’ Association (“LMAA”) rules.
review work permit requirements for non-resident arbitrators and consider tax
incentives similar to those offered by Singapore.
3.4 Ship Owning and Ship Management
3.4.1 Current Situation
Among all the maritime services, ship owning and ship management play a critical
role in developing the sector as a whole.
Other services, such as ship finance, ship
insurance and ship chartering, always follow ship owning and ship management by
cultivating long-term and professional relationships with them. Once the services
have been well developed, they attract ship owners and ship managers. Thus, ship
owners or managers and maritime services are highly interactive, and they work
together to maximise the economic synergy.
Most of the ship owners in Hong Kong are Chinese, and they are either local or
mainlanders. Local ship owners are mainly family owned companies, such as the
IMC Group and OOCL, while mainland ship owners are mostly state-owned
companies, such as COSCO and China Shipping. Recently, some new, small-scale
ship owners have been booming in the mainland. A number of them were formerly
state-owned companies that were privatised in the 1990s.
44
Historically, Chinese
Maritime Centre Report 2013
companies are more focused on dry cargoes and lack experience in chemicals and oil
transport.
During the maritime industry’s early days, ship owners were generally individuals or
companies, and they did not always manage the shipment themselves, because some
of them lacked the essential sea-going experience and shipping-related knowledge to
do so. These ship owners had to entrust their vessels with professional management
companies.
Nowadays, things have changed. Many local owners have grown into international
operators.
No longer outsourcing management, they now have their own
management subsidiaries.
But small to medium-size ship owners, who are not able
to manage by themselves, still hire some professional management companies.
In
Hong Kong, Greek Indian, and Pakistani companies dominate the business of ship
management.
Overall, Hong Kong’s ship owning and ship management are well developed.
In
2010, vessels and tonnages by register owned, managed or operated by members of
Hong Kong Ship owners Association (HKSOA) 35 reached 1877 vessels and
114,254,890 dwt respectively36.
Table 3.7 shows Hong Kong-controlled fleets (dwt)
rank No. 7 in the world, accounting for 2.95% of the world’s total tonnage.
35 HKSOA is the most important representative of Hong Kong’s maritime industry, with its members
consisting of ship-owners, ship managers, ship brokers, maritime lawyers, classification societies, ship
financers and ship insurers, etc.
36
2010, HKSOA, Fleet Statistics
45
Maritime Centre Report 2013
Table 3.7 Top 10 countries and territories with the largest controlled fleets (dwt), as of
1 January 2010 & 1 January 2011
Figure as of 1 Jan 2011
Change of 2011 over 2010
Figure as of 1 Jan 2010
Percentage
Increase %
Percentage
Number
Increase
of Total
Number of
Ranking in vessel
DWT ('000) of Total
Ranking of
DWT ('000)
% in DWT
World
Vessels
numbers
World DWT
Vessels
DWT
Greece
Japan
Germany
China
Republic of Korea
United States
Norway
China, Hong Kong SAR
Denmark
China, Taiwan Province of
Singapore
United Kingdom
World Total
3,213
202,388
3,795
197,230
3,798
114,773
3,651
107,970
1,189
47,453
1,972
46,375
1,984
42,978
712
37,183
975
35,111
662
32,960
1,021
31,633
778
22,324
38,847 1,251,649
16.17%
15.76%
9.17%
8.63%
3.79%
3.71%
3.43%
2.97%
2.81%
2.63%
2.53%
1.78%
1
2
3
4
5
6
7
8
9
10
11
14
3,150
186,095
3,751
183,319
3,633
104,452
3,627
103,895
1,200
44,883
1,865
41,291
1,968
40,518
680
34,441
940
33,198
637
29,491
985
32,609
794
26,212
38,412 1,166,720
15.96%
15.73%
8.96%
8.91%
3.85%
2.68%
3.48%
2.95%
2.85%
2.53%
2.80%
2.25%
1
2
3
4
5
6
7
8
9
11
10
12
2%
1%
5%
1%
-1%
6%
1%
5%
4%
4%
4%
-2%
1%
9%
8%
10%
4%
6%
12%
6%
8%
6%
12%
-3%
-15%
7%
Increase
Change
in World's
in
share of
ranking
DWT
0.21%
0.03%
0.21%
-0.28%
-0.06%
1.03%
-0.05%
0.02%
-0.04%
0.10%
-0.27%
-0.47%
0
0
0
0
0
0
0
0
0
1
-1
-2
Source: Review of Maritime Transport 2011 & Review of Maritime Transport 2010
Note: Vessels of 1,000 GT and above were ranked by deadweight tonnage; excluding
the United States Reserve Fleet and the United States and Canadian Great Lakes
fleets (a combined tonnage of 5.7 million dwt).
Transport 2010
Source: Review of Maritime
From 2007 to 2009, the number of establishments and persons engaged in the sector
relating to ship owners or operators increased continuously. The number of
establishments increased from 121 to 176, and persons engaged jumped from 4,047 to
5,610 (Table 3.8). Though this service sector doesn’t hire a large number of people,
it still boasts significant economic contribution.
In 2007, its total revenue was
HK$103,172 million, a 34% increase from 2006. However, during the global
financial crisis, revenue plummeted from HK$111,304 million in 2008 to HK$75,284
million in 2009 (Table 3.9).
46
Maritime Centre Report 2013
Table 3.8 Number of Establishments and Persons Engaged in Ship Owning and
Management
2007
2008
No.
No.
No.
No.
Of
of
of
of
persons
establishments
No.
No.
of
of
persons
establishments
engaged
Ship
2009
persons
establishments
engaged
engaged
owners
or operators of
sea-going
56
2711
64
2910
104
3781
65
1363
67
1207
72
1829
121
4074
131
4117
176
5610
vessels
Ship
owners
or operators of
Hong
Kong-Pearl
River
Delta
Vessels
Total
Source: Summary Statistics on Shipping Industry of Hong Kong(June 2011)
Table 3.9 Business Receipts and Other Income of Ship Owning and Ship Management
2007
2008
2009
Million
% of
Million
% of
Million
HK$
change
HK$
change
HK$
% of change
Ship
owners
or operators of
sea-going
96,499
34%
105,081 9%
69,413
-34%
6,673
29%
6,223
5,871
-6%
75,284
-32%
vessels
Ship
and
owners
operators
of
Hong
Kong-Pearl
River
-7%
Delta
Vessels
Total
103,172 34%
111,304 8%
Source: Summary Statistics on Shipping Industry of Hong Kong (June 2011)
47
Maritime Centre Report 2013
As one of the largest habitats for ship owners and ship managers, Hong Kong
possesses some advantages, and the most essential ones are listed below.
Located in the PRD region, source of the world’s largest volume of exports,
Hong Kong can easily attract the cargoes from the mainland.
Established as an international financial centre, Hong Kong has welldeveloped financial facilities to help ship owners or operators raise funds.
Having inherited the British Common Law system, Hong Kong makes it easy
to coordinate with European and American business partners.
As the freest economy in the world, Hong Kong has low taxes, a simple tax
regime and a deregulated business environment, etc.
Although some ship owners or ship operators still maintain their headquarters or
offices in Hong Kong, recently a number of them have relocated their companies to
Singapore.
This may create challenges to Hong Kong (3.4.2).
3.4.2 Challenges and Problems
3.4.2.1 Increasing Tangible Costs
According to Mercer37’ s worldwide cost of living survey 2011, Hong Kong is one of
the cities with the world’s highest living cost in. Only three Asian cities made the
list, namely, Tokyo, Singapore and Hong Kong. Singapore’s cost of living ranking
jumped from 11th in 2010 to 8th in 2011.
This was mainly due to the relative
depreciation of the US dollar against the Singapore dollar (Table 3.10).
Besides the
cost of living, Grade A office rent in Hong Kong’s business districts is also very high,
having increased 2.67 times in last decade, with the most significant increases in the
Sheung Wan / Central district (Figure 3.4). According to the June 2011 rankings
released by Colliers International, Hong Kong’s Grade A office rent s is the highest in
the world, easily exceeding that in London, Paris and Tokyo. That’s why many ship
owners and operators have moved out of Hong Kong to cut cost.
Singapore is the main destination for owners and operators who jumped ship from
Hong Kong. As shown in Table 3.10, Singapore’s cost of living is not much lower
than Hong Kong’s, and it even surpassed Hong Kong’s in 2011. However, the
Singapore government offers tax rebates, land subsidies and other incentives to ship
owners and operators to offset costs and increase revenues significantly.
37
According
Mercer is the global leader for trusted HR and related financial advice, products and services.
48
Maritime Centre Report 2013
to a senior manager with an international ship operator, the Singapore government
even offered a 10-year tax-free scheme to attract qualified ship companies to set up
offices there.38
Table 3.10 Top 10 Cities with Highest Cost of Living
City
Country
March 2011
March 2010
Luanda
Angola
1
1
Tokyo
Japan
2
2
N'djamena
Chad
3
3
Moscow
Russia
4
4
Geneva
Switzerland
5
5
Osaka
Japan
6
6
Zurich
Switzerland
7
7
Singapore
Singapore
8
11
Hong Kong
China
9
8
Sâo Paulo
Brazil
10
21
Source: Mercer, Worldwide Cost of Living survey 2011
3.4.2.2 Shortage of Young Crewmembers
In addition to the high tangible costs, shortage of young blood among local crews is
another challenge. Nowadays, few young people are willing to be crewmen as they
could easily find jobs on land. Moreover, for most young people in Hong Kong,
becoming a crewmember is not an appealing career choice. They don’t see a very
bright future in the industry. More importantly, for several months a year crewmen
have to live apart from their families, something few people in Hong Kong are willing
to do.
38
“Wake up, Hong Kong”, Hong Kong Economic Times, pp.59
49
Maritime Centre Report 2013
Figure 3.4 Private Office - Rental Indices for Grade A Office Space In Core Districts
(1999=100)
Source: Hong Kong Census and Statistics Department
Note: Grade A - modern with high quality finishes; flexible layout; large floor plates;
spacious, well decorated lobbies and circulation areas; effective central
air-conditioning; good lift services zoned for passengers and goods deliveries;
professional management; parking facilities normally available.
Table 3.11 Age Distributions of Local Vessels’ Crews of the 48 Companies
Age
No. of Local Vessels' Crew
Percentage
14
1.75%
31-50
513
64.04%
51 or above
274
34.21%
Total
801
100%
Under 30
Source: Maritime Services Training Board, Vocational Training Council, 2008
Manpower Survey Statistical Report of the Local Vessels’ Crew, pp.4
Consequently, as shown in Table 3.11, 64% of Hong Kong’s local crews’ ages are
between 31 and 50, and only 1.75% of crewmembers younger than 30 years of age.
The shortage of local crews leads to difficulties for ship owners or operators in
finding qualified management talents locally. Thus many ship owners or operators
have to bring in crews from the mainland, India and Pakistan.
50
Maritime Centre Report 2013
However, few crewmembers prefer to work in Hong Kong given the pollution and
high rent. These problems are absent in Singapore; instead the government attract
foreign talents with affordable housing and friendly immigration policies. Finally,
Singapore’s comfortable weather and environment make it an ideal place to live.
In
Hong Kong, not only is there a dearth of local crews, but foreign talents as well.
This talent shortage is expected to impact the development of Hong Kong’s ship
owning and ship management.
3.4.3 Short Summary
Overall, the basis of Hong Kong’s ship owning and management has developed well
in the last decades.
Indeed, many local ship owners have evolved into ship operators,
with their own ship management companies. As a result, ship management
companies are not as important as they were in the old days, and they have gradually
dropped out of the picture altogether.
As they increased in scale, ship owners or ship
operators have become much more international and experienced.
To some extent, it
shows how Hong Kong’s maritime industry has evolved and modernized over time.
At the same time, though, Hong Kong’s increasing costs and talent shortage constrain
ship owners’ or operators’ further development.
In order to prevent them from
leaving for Singapore, Hong Kong needs to adopt policies to mitigate these problems.
If Hong Kong aims to consolidate and strengthen its role as a global maritime centre,
it has to retain the ship owners or operators, at least for the next few decades.
3.5 Ship Registration
3.5.1 Current Situation
Ship registration is a process by which a ship is documented and authorised in certain
countries or territories. A ship's flag state regulates the vessel and is required to
inspect it regularly, certify the ship's equipment & crew, and issue safety and
pollution prevention documents. Generally speaking, ship owners or operators will
take into account the registration fee, trade restrictions, taxation arrangement and
service efficiency when deciding where to register.
most important factor in their considerations.
The taxation arrangement is the
For example, Panama has the largest
registered deadweight tonnages in the world thanks to a very preferential tax regime
and minimum requirements for its ship owners or operators.
51
Maritime Centre Report 2013
Since 1997, the number of registrations has been increasing year after year, the most
significant jump being from 1999 to 2003. The slump in 2007 and 2008 was due to
the financial crisis and economic recession in Europe and the U.S. Similarly, the
registered tonnage was around 5.66 million tonnes in 1997 and shot up to 65.72
million tonnes in September 2011. To date, most of the registered ship vessels are
bulk carriers, accounting for 40.5% of all registered ships, followed by container
vessels and cargo ships.
Figure 3.5 Percentage Changes of Hong Kong’s Registered Ship Vessels and Gross
Tonnages (1993-2011)
Source: Marine Department
Under “One Country Two Systems”, as Beijing rarely interferes in Hong Kong’s local
affairs, ship owners have regained their confidence in Hong Kong’s political and
economic stability.
their ship vessels.
Gradually, ship owners have come back to Hong Kong with
Furthermore, the “Direct Link” between Taiwan and Hong Kong
eliminated the doubts that Hong Kong flagships would be discriminated against or
forbidden in Taiwan.
In addition, since 1999 the Hong Kong Marine Department has launched a number of
reforms, including cutting the registration fee, providing 24-hour register services,
setting up a public relations group and inspecting vessels for free, etc. Hong Kong’s
ship registration services are famous for being cost efficient, timesaving and of high
quality.
Since Hong Kong inherited Britain’s legal and administration system while
still having a similar culture to the mainland’s, many mainland ship owners or
52
Maritime Centre Report 2013
operators prefer to register in Hong Kong before expanding their international
business. In particular, China Shipping and Cosco have their ship vessels registered
in Hong Kong, accounting for the increase in registered gross tonnages. According
to the Hong Kong Marine Department, more than 70% of the registered ship owners
come from the mainland39, and 934 of the 1,877 ship vessels (49.8%) controlled by
HKSOA are Hong Kong-registered vessels. This goes to show that most Chinese
ship owners or operators prefer to register their ship vessels under Hong Kong’s flag.
Table 3.12 shows that in 2010, Hong Kong ranked as the world’s fourth largest
registry, behind Panama, Liberia and the Marshall Islands. All of the first three flags
are classified as flags of convenience, and Hong Kong has even outranked Greece in
terms of the number of registered ship vessels and deadweight tonnages.
This
indicates Hong Kong’s great success in recent years in attracting ship owners or
operators.
Table 3.12 The 10 Flags of Registration with the largest registered deadweight
tonnage, as of 1 January 2010
Number
Share of
of Vessels
World Total
Deadweight
Tonnage
(1000')
Share of
World Total
Panama
8,100
7.93%
288,758
22.63%
Liberia
2,456
2.40%
142,121
11.14%
Marshall Islands
1,376
1.35%
77,827
6.10%
China, Hong Kong
1,529
1.50%
74,513
5.84%
Greece
1,517
1.48%
67,629
5.30%
Bahamas
1,426
1.40%
64,109
5.02%
Singapore
2,563
2.51%
61,660
4.83%
Malta
1,613
1.58%
56,156
4.40%
China
4,064
3.98%
45,157
3.54%
Cyprus
1,026
1%
31,305
2.45%
World Total
102,194
1000%
1,276,137
100%
Notice: a. Ships of 100 GT and above; ranked by deadweight tonnage
Source: 2010 Maritime Review
392010
Nov 1st , DaGong Newspaper
53
Maritime Centre Report 2013
Ship vessels registered in Hong Kong enjoy many benefits.
First, Hong
Kong-registered fleets are rarely inspected by port state control officers, thanks to
their great safety, environmental and social records historically. According to Figure
3.6, the Hong Kong flag has been evaluated as one of the “qualifying flag
administrations” by the United States Coast Guide for as many as 40 times, including
the qualifying flag administration of 2011.
Figure 3.6 Number of Qualship Vessels by Flag Administration
Source: Annual Report 2010, Port State Control in the United States
Second, the Hong Kong flag is not a flag of convenience.
International Transport
Workers’ Federation (ITF) declares a registry as flag of convenience by taking into
account "the ability and willingness of the flag state to enforce international minimum
social standards on its vessels", "the degree of ratification and enforcement of ILO
Conventions and Recommendations", and "safety and environmental records". 40
Some ports do not allow the fleets of flag of convenience to load and discharge
cargoes. Thus, Hong Kong flag fleets are able to reduce the risk of being rejected in
overseas ports.
Third, Hong Kong registered fleets are protected overseas by the Chinese government.
These fleets could contact the local Chinese Consulate if they are in trouble. The
Chinese Consulate has the responsibility to offer support and assistance.
40
International Transport Workers' Federation
54
Maritime Centre Report 2013
Fourth, Hong Kong registered ship vessels enjoy a very preferential taxation regime.
Due to the international nature of shipping operations, operators are more susceptible
to taxation policies than other taxpayers. They are likely to go the registry with the
lowest taxes and registration fee.
Though Hong Kong has one of the lowest tax rate
regimes in the world, it still needs to make bilateral agreements with its trading
partners so as to enhance its competitiveness. There are three kinds of bilateral
agreements, namely, the agreements for the avoidance of double taxation (DTA), the
commitment of Reciprocal Tax Exemption (RTE) and Comprehensive DTA.
Hong
Kong has signed DTAs with Denmark, Germany, Netherlands, Norway, Singapore,
Sri Lanka, United Kingdom and United States, and secured commitments from Chile,
New Zealand and South Korea. Likewise, it signed Comprehensive DTAs with 21
countries, including Japan, France, New Zealand, Thailand and Switzerland.
Especially important is the fact that Hong Kong flagships enjoy a 29% tax rebate if
they run business in mainland ports and earnings derived from international
operations are exempt from profit tax in Hong Kong.
Last but not least, Hong Kong registered ship vessels usually enjoy easier access to
funding and at a lower cost. Ship-financing banks evaluate the credibility of ship
owners or operators by taking into account of the ship’s flag state. Since Hong Kong
is a well-recognised flag state, this increases the bank’s confidence in their credibility.
Nevertheless, the city’s mature financial market means a huge funding pool local ship
owners or operators can borrow from.
3.5.2 Challenges and Problems
3.5.2.1 Small Number of Comprehensive DTAs
Though the SAR government has a number of comprehensive DTAs with its main
trading partners, this achievement is dwarfed by Singapore’s 67 agreements. In fact,
Hong Kong’s simple low tax regime of holds both advantages and disadvantages.
While it attracts global ship owners or operators, the tax regime means low bargaining
power for the SAR government when negotiating with its trading partners.
Hong
Kong has very low and preferential tax policies, but there is else it could offer. Even
worse, its trading partners are worried about the outflow of tax income from their
countries, as their local companies have the incentive to pay the lower taxes in Hong
Kong rather than in their home countries.
55
And there is also another concern for the
Maritime Centre Report 2013
SAR government that some countries ask to include the airline industry in the
comprehensive DTA.41 This is not acceptable to the SAR government.
3.5.2.2 Lack of Expansion Opportunities in Overseas Market
Since the industry recovery in 2003, coupled with the rapid growth of China’s
economy, many new ships have been built or traded. Seizing this opportunity, the
Hong Kong Trade Development Council (HKTDC) improved promotions in the
mainland, thus a large number of mainland ship owners or operators register their ship
vessels in Hong Kong. Unfortunately, the global financial crisis led to economic
recessions in Europe and the United States. With lower demand from western
markets, ship owners or operators are pessimistic about the future prospects.
Thus,
fewer ships are built or traded. In countries dependent on shipping, Hong Kong is not
welcomed to promote its services there.
3.5.3 Short Summary
In general, ship registration has been well developed in Hong Kong, and the
increasing number of vessels registered is due largely to the Hong Kong Marine
Department’s efforts and mainland ship owners’ or operators’ contributions.
However, many ship owners or operators have transferred their ship vessels to
Singapore recently for its broader range of comprehensive DTA partnerships than
Hong Kong.
This has resulted in a great threat to Hong Kong, as it needs to
consolidate its success in the ship registration sector.
Aiming at being an
international maritime centre in Asia, Hong Kong should continuously attract ships to
register in Hong Kong in order to support the growth in other maritime sectors.
More importantly, it is believed the mainland is now emerging as a critical player in
the world’s maritime business, and Hong Kong reaps some benefits by approaching
mainland ship owners or operators. On one hand, Hong Kong is the ideal place for
these mainland ship owners and operators to expand their overseas market given the
internationalized business environment and easy communication.
On the other hand,
Hong Kong needs to retain the large base of locally registered ships so as to promote
its international maritime centre status and attract foreign ship companies and
maritime services providers to set up shop in Hong Kong.
41 Some interviewees disclosed that the SAR government is not willing to add the airline sector into
the comprehensive DTA. Though the reasons are still unclear, it may relate to the government’s tax
income expectation and Hong Kong airport’s further development.
56
Maritime Centre Report 2013
3.6 Ship broking and chartering
3.6.1 Current situation
Hong Kong has its tradition in being a regional broking and chartering centre.
In
2010, vessels owned, managed and operated by members of the Hong Kong Ship
Owners Association accounted for 4.6% of the world’s total number of ships and
9.4% of the world’s total deadweight tonnage.42 As the broking and chartering
business follows the ship owners, Hong Kong has been the regional base for many
world-class ship broking and chartering companies, such as Clarksons, Simpson
Spence & Young, and Wallems.
Brokers’ activities in Hong Kong cover multiple aspects of ship business, including
sales and purchase (S&P), ship building, ship chartering and ship repairing.
Table 3.13 Economic Benefits of Ship Broking43
2007
2008
2009
Number of Shipbrokers
184
318
213
(figures in brackets denote year on year percentage changes)
(4.5)
(72.8)
(-33)
Business Receipts and Other Income of Shipbrokers
678
1,059
696
(in HK$ million)
(72.4) (56.1)
(-34.2)
Value Added of Shipbrokers (in HK$ million)
459
466
(figures in brackets denote annual percentage changes)
(90.6) (39.9)
(-27.4)
Value Added Per Person of Shipbrokers (in HK$ million)
2.50
2.19
(figures in brackets denote annual percentage changes)
(82.4) (-19.1) (8.3)
(figures in brackets denote annual percentage changes)
643
2.02
Table 3.13 shows in Hong Kong the broking sector is quite small in terms of
employment, with roughly 200 to 300 employees, although since 2000 there have
been around 30 establishments44.
However, the overall business receipts and other
incomes and value added per person are considerable, generating a more than 400
percent increase from HK$160 million in 2000.
42 Hong Kong Maritime Industry Council, Summary Statistics on Shipping Industry of Hong Kong
2011.
43 Derived from Summary Statistics on Shipping Industry of Hong Kong 2011. Ibid.
44 Ibid
57
Maritime Centre Report 2013
Due to the highly specialised nature of the work, the industry is not easy to enter.
This is especially true for sale & purchase broking, which calls for all the usual
attributes of a skilled negotiator and a wide range of knowledge on the technical
aspects of ships to help finalise and execute the deal.
In addition, the business
usually thrives on personal relationships with ship owners.
Like London, Hong
Kong is a small world, and ship owners, shippers, brokers and charterers all know one
another. Business is usually conducted through personal relationships and networks.
In addition, it is a complex, difficult, labour-intensive business, generating return on
high volumes at low yields.
Yet, most competent and experienced personnel in
chartering aspire to become S&P brokers. Therefore, the industry worldwide faces
difficulties in finding competent manpower.
In Hong Kong, chartering generated around 90 million tonnes of bulk cargo, about
10% of the world’s major bulk trades45, and HK$273.51 million value added in
200346. More importantly, ship chartering helps stimulate the freight forwarding
industry, generating around HK$33,840 million in terms of business receipts and
other incomes, and creating about 13,000 jobs in 2003 47 .
However, unlike
shipbrokers, commission on the freight or charter hire averages at 1¼%, and ranges
from 2½% (very small ships) to 1% or sometimes less (for larger sizes) for S&P48.
The charterers bear the risks of market fluctuations, especially for bare-boat
chartering, as the agreement is customarily quite long, stretching from 10 to 15 years,
with prices fixed over the entire period.
Chartering and broking are not strictly separate businesses.
brokers and most brokers provide chartering services.
Charterers can be
As mentioned by industry
commentators, most big shipping companies and ship owners have their own internal
department take over the broking functions, or designate it to companies with
chartering operations and activities.
It is emphasised that the need for competent
manpower for ship management and operations is of the greatest concern.
The
reality that mainland state-owned shipping companies are becoming more and more
involved in Hong Kong’s maritime industry, in which the traditional business
functions of broking and chartering and even ship-building can all be handled within
the same company.
This is posing new requirements for more specialised and high
Hong Kong Port and Maritime Board, 2003, Study to Strengthen Hong Kong’s Role as an
International Maritime Centre, Maunsell Consultants Asia Ltd.
46 Ibid.
47 Ibid.
48 Jagmeet Makkar, 2006 “Commercial Aspects of Shipping: Market Players in Shipping”
45
58
Maritime Centre Report 2013
value-added services, such as hi-tech services for maritime satellite communications,
legal advisories and financial advisories for broking or chartering business.
3.6.2 Challenges and Problems
3.6.2.1 Challenges from other IMCs
Unlike London, where the Baltic Exchange represents all the shipbrokers and attracts
all players to look for business in a mature and extensive market, in Hong Kong the
chartering and broking business always follows the physical location of ship owners
in order to stay closer to the business and build up closer personal relationships with
owners.
Hence, attracting more ship owners to Hong Kong is most crucial to the
industry. Hong Kong’s special geographical and political position has played the
most important role in attracting ship owners who plan to re-orient their business
towards China.
Enticed by government subsidies and preferential policies in
Singapore, some Hong Kong ship owners have moved their business there, or are
going to. While it is still questionable these subsidies and incentives will last, the
current situation for Hong Kong is not optimistic.
In addition, Shanghai is attracting ever more shipping companies, broking companies,
and chartering companies to get a slice of the mainland market. In fact, various
industrial reports and commentators pointed out it is critical to attract more traders
and trading business, which usually need shipping services (approximately more than
95% international trade involves sea or air transportation services), in order to create
business potential for ship owners, charterers and brokers. However, the high rent
and manpower costs, as well as the environmental issues, e.g., air quality, are posing
major obstacles.
3.6.2.2 Talent Shortage
The difficulty of finding competent and experienced manpower for ship operation’s
management remains universal.
From 2009 to 2010, the ship management and
chartering sector’s manpower dropped by 6.3%, the managerial and executive level
manpower fell by 5.2%, while there was only a 1.3% manpower drop for the entire
transport logistics industry49.
In 2011, it is projected that manpower of the transport
Transport Logistics Training Board, Vocational Training Council, 2010 Manpower Survey of
the Transport Logistics Industry.
49
59
Maritime Centre Report 2013
logistics industry will increase by 1.2%, while for the chartering sector only an
increase of 0.5% is projected.
3.6.2.3 Business functions taken over
As ship companies grow bigger and bigger, more traditionally designated business
functions have been taken in-house. As a mature and large ship broking market is
lacking, big companies prefer to set up a designated department to handle the S&P,
ship building, chartering and repairing issues in order to guarantee service quality and
cost effectiveness.
To survive and fight for market share, it is essential to provide wider professional
services for brokers and charterers. The collaboration with other maritime services
sectors, such as ship finance, marine insurance, and maritime arbitrations has become
more critical for ship broking and chartering business.
3.6.3 Short Summary
The broking and chartering business used to follow the domiciles of ship owners.
Historically, with a large number of ship owners living here, Hong Kong has long
been the regional hub for broking and chartering business. Broking and chartering
business help the entire shipping industry and have an economic impact on various
aspects, including vessel sales and purchase, ship management, freight forwarding,
etc.
Hong Kong is facing stiff competition from Singapore and Shanghai in attracting
more ship owners and related maritime services.
Government support is the key to
luring ship owners to Singapore, while the mainland market attracts ship owners to
Shanghai.
60
Maritime Centre Report 2013
3.7 Ship Finance
3.7.1 Current situation
Shipping is a capital-intensive industry because vessels are extremely expensive both
to build and operate.
In fact, after the oil industry, shipping is the second most
capital-intensive industry in the world. By rough estimates, globally about $80
billion per year is spent on financing new builds alone50.
Bank loans have remained the primary source of financing for the shipping industry,
despite the fact that some of the largest companies are listed on the Hong Kong Stock
Exchange and have in recent years participated in the public bond markets. A recent
research survey of 32 ship owners / companies in Hong Kong showed the majority of
the ship owners (73%) use bank loans as primary financing.
In the next most
popular sources are retained earnings and leasing, the primary financing method for
33% and 27% of the companies respectively51. Especially for companies with a
shorter history (under 10 years), the bank loan is the cheapest with few rigid
conditions52.
On one hand, the shipping companies tend to be family-owned and
their operations lack transparency, making them unfavourable to investors in stock
markets. On the other hand, some ship owners also prefer to keep the affairs of their
companies private.
Today, in Hong Kong the shipping loan business is dominated by a limited number of
key players. Similar to the broking and chartering business, to capture market share
ship finance practitioners maintain a close relationship with big ship owners and
shipping companies. Besides, to get access to more business opportunities, it is
important for banks to understand the risks of each loan project, such as earnings
potential of projects, borrowers’ profitability, managerial capacity, operating risks,
financial standings, etc.
Considering the complexity of the business nature,
competent and experienced manpower is critical to the industry.
Due to the small
circle of ship owners, brokers, charterers, lawyers, managers, underwriters, bankers
Goulielmos, A.M., Psifia, M. (2006). Shipping Finance: Time to Follow a New Track, Maritime
Policy and Management, Vol. 33, 301-320.
51 Yvonne Yiyi Zeng, Stephen Gong, Heng-Qing Ye (2010), Ship Financing Practices in Hong Kong:
What Changes Has the Financial Tsunami Wrought?, International Forum on Shipping, Ports and
Airports (IFSPA).
52 Ibid.
50
61
Maritime Centre Report 2013
(all of whom know or know of each other), the turnover rate of ship finance
practitioners is low, and it is not easy for new comers to enter the business.
Besides pure bank loans, few related services have been provided to ship owners.
For example, as the dollar has been the vehicle currency in the shipping industry
world-wide for a very long time, the payments of all activities, including new builds,
second-hand vessel purchasing, operations and repairs, are denominated in dollars.
However, with the rise in mainland business engagement, and the fluctuation of
money markets, currency risks and interest rate risks become extra burdens for ship
owners.
Some in financial services provide ship owners with products such as
currency swaps and interest swaps to mitigate the risks, yet no other financial
products are specifically designed for borrowers.
The future of ship finance is seemingly good with the mainland’s shipbuilding
industries growing fast. However, the global financial crisis of 2008, resulting in a
loss of credit in both the financial and shipping markets, has sucked all the wind from
the sails, causing the BDI to tumble to 2611, and the VLCC world scale to fall to the
low 40’s level by the end of 2009.
In the past, the shipping market cycle was not
always in sync with the broader economy. The October 2008 collapse in the dry
bulk market coincided with the freefall of stock markets worldwide. Consequently,
assets losing more than half their value and defaults on borrowings and bankruptcies
became rampant.
In early 2010, Beijing came to the economy’s rescue with massive investments in
infrastructure and housing, creating a liquid, cheap credit market to spur domestic
consumption levels.
By opening its coffers and spending approximately US$1.7
trillion, Beijing put the brakes on the downward spiral the global economy was
entering -- with the side effect of massive inflation. The inevitable was delayed for a
year.
Non-performing assets, to a large extent written off by the four large state
banks, further dented the financial system.
By mid-2011, China was forced to
change its policies – restricting borrowing, raising reserve requirements for banks and
NBFCs several times in an attempt to curb inflation.
During this time, the massive order books for new ship-buildings that had been placed
since 2007 took the global shipping fleet to 611 million DWT at the end of 2011.
Ship delivery numbers rose 10% in 2007, driven primarily by ship owners looking to
substantially increase their fleet sizes when economic growth was strong.
There
seemed to be a bottomless pit of cheap, easy financing being made available by both
traditional and non-traditional ship financing companies.
62
The oversupply of cargo
Maritime Centre Report 2013
carrying capacity has resulted in a sharp surge of freight rates.
The container market
fared no better and rates fell by 65% to 80%. The crisis has pushed the shipping
markets, predominantly led by Europe, into one of the gloomiest and most depressed
environments
Chinese banks have lent to both foreign and domestic ship owners since the crisis
started in September 2008, replacing the traditional sources of financing from
Germany and the United Kingdom and helping owners take delivery of previously
ordered ships.
In 2009, China overtook Germany as the third largest ship-owning
country, Japan as the second biggest shipbuilding country and India as the busiest
ship-recycling country53. In addition, major state-owned shipping companies have
set up branches in Hong Kong, thereby bringing opportunities for the local ship
finance industry to expand their business in the mainland.
In fact, Hong Kong’s free
money market, simple tax system, and peg with the dollar, which protects financial
institutions against the risk of currency fluctuation, provides both lenders and
borrowers with an accessible low-cost environment.
Currently the only extensive
RMB offshore centre, Hong Kong is posed to tap into the emerging mainland market
for ship finance.
3.7.2 Challenges and Problems
3.7.2.1 The Credit Squeeze
Partly due to the mainland’s supply of and demand for shipping services, Hong
Kong’s shipping industry recovered quickly after the financial crisis. However, due
to the credit squeeze the bank loan policy for ship finance has become more restrictive,
with the term getting shorter.
Before, 58% of banks said maximum loan period for a
new build was between 10 and 15 years, but after the crisis, none would lend for
longer than 10 years54. For second-hand vessel purchases, the repayment periods
were even shorter. Gearing was getting smaller. Before, 91% said for a new build
the maximum loan amount to vessel price (LTV) ratio was above 70%, but after the
crisis, 64% said the maximum was 50%-60%, with just 36% of the banks indicating
United Nations Conference on Trade and Development (UNCTAD), Review of Maritime
Transport, 2010
54 Yvonne Yiyi Zeng, Stephen Gong, Heng-Qing Ye (2010), Ship Financing Practices in Hong Kong:
What Changes Has the Financial Tsunami Wrought?, International Forum on Shipping, Ports and
Airports (IFSPA).
53
63
Maritime Centre Report 2013
the maximum was above 60%, and 18% of the banks set the limit below 50%55. The
banks’ participation in loan syndication also dropped. As the major US dollar
offshore supply is in Europe’s money market, which is suffering from debt issues, the
impact of the credit squeeze is expected to get worse.
Besides the fluctuations in the shipping market, the overcapacity of vessel supplies
caused the price of both new and second-hand ships to fall by more than 20% between
2008 and early 2010
56
.
In the near future, the charter parties, as well as the owners,
will likely face an even more severe overcapacity problem as more vessels are under
construction or will be delivered shortly.
The trend of lower risk tolerance and higher requirements for collateral and
guarantees have created tougher financing situations for the younger and smaller ship
owners, while large ship owners having strong corporate fundamentals and close
banking relationship might not need such services. The gap between borrowing and
lending has squeezed the ship finance market in Hong Kong.
3.7.2.2 Difficulties in expanding outside Hong Kong
Although Hong Kong’s preferable business environment is conducive for the ship
finance industry to expand its business to other Asia markets, experts observed most
countries, such as Japan, Singapore and the mainland, ship finance is obtained
domestically. It is hard to keep a close relationship with senior level management of
the state-owned Chinese shipping companies because their personnel rotate
periodically.
For state-owned shipping companies elsewhere in Asia, their
reputation helps them secure easy finance domestically. .
3.7.3 Short Summary
Bank loans remain the preferable source of finance, mainly due to its lower costs and
ease of access.
bank loans.
Also, large family-owned businesses need not go public to take out
However, the post-crisis credit squeeze made the bank loan policies for
ship finance more restrictive and the gaps between borrowing and lending has
squeezed the local ship finance market.
Ibid.
United Nations Conference on Trade and Development (UNCTAD), Review of Maritime
Transport, 2010
55
56
64
Maritime Centre Report 2013
The mainland’s emergence in the market for ship finance has brought new business
opportunities to the Hong Kong. Nonetheless, obstacles remain in maintaining close
relationships with senior management of local branches of large state-owned Chinese
ship companies as well as expanding into the mainland market.
3.8 Air Transit
3.8.1 Current Situation
Hong Kong International Airport (HKIA) is one of the world’s busiest airports.
According to the rankings of Airport Council International57, HKIA’s total passenger
traffic ranks 10th (Table 3.4).
However, its cargo volume is still first among
international airports (Table 3.14).
Table 3.14 The World’s Top 10 Airports by Cargo Volume (Tonnes) (Jan -Oct 2011)
Rankings
Airport
Total Cargo
1
HONG KONG, HK(HKG)
3,620,085
2
MEMPHIS TN, US(MEM)
3,556,528
3
SHANGHAI, CN(PVG)
23,842,660
4
ANCHORAGE AK, US(ANC)
2,416,363
5
INCHEON, KR(ICN)
2,327,470
6
DUBAI, AE(DXB)
2,072,797
7
FRANKFURT, DE(FRA)
2,040,806
8
LOUISVILLE KY, US(SDF)
1,975,581
9
PARIS, FR(CDG)
1,918,773
10
TOKYO, JP(NRT)
1,772,671
Source: Airports Council International
The volume of air cargo is very much related to the economic performance of the
PRD, as it is Hong Kong’s largest hinterland and manufacturing base.
China has
long been dubbed “the factory of the world” and its strong export sector over the last
57
Airports Council International is the only global trade representative of the world’s airports.
Established in 1991, ACI represents airports’ interests with Governments and international
organisations such as ICAO, develops standards, policies and recommended practices for airports, and
provides information and training opportunities to raise standards around the world.
65
Maritime Centre Report 2013
decades has benefited its manufacturing industry, especially the labour-intensive
factories in the PRD. At the HKIA, more than 80% of the air cargoes come from the
PRD. As a consequence, Hong Kong’s cargo volume increased significantly over
the past decade (Figure 3.7).
Since the PRD is export-orientated and America and
Europe are its main clients, it experiences large volatilities in tandem with the global
economy. The 2008 crisis reduced the demand of American and European
customers and an immediate decline in international orders ensued for the PRD, thus
HKIA’s air cargo volume decreased.
However, the growth trend resumed in 2009
and 2010.
Figure 3.7 Hong Kong International Airport Cargo Traffic (2000-2010)
Source: Hong Kong International Annual Report (2000-2010)
3.8.2 Special Product Groups for Air Cargo
It was discussed in chapter 1.2 that Hong Kong’s ranking in the total volume of
container traffic has dropped to the third place and Shenzhen is closely trailing Hong
Kong. Against this backdrop, it is absolutely critical to ensure air cargo availability.
This will also benefit other maritime clusters such as cargo insurance.
Table 1.3
shows that air cargo mainly comprises electronics, jewellery and watches, and we
shall add red wine to this list. The pertinent question then becomes, “How to sustain
the availability of air cargo in the future in light of the declining figures?”
66
Maritime Centre Report 2013
First and foremost, it is crucial to appreciate certain features common to the four
product groups of electronics, jewellery, watches and red wine.58 They are all
high-value goods and in many cases are shipped express. Also, these products are
anticipated to have high local and regional market demands in the near future.
Moreover, not only are these high-value products sourced from the “factory of the
world” that is the mainland, but they are distributed to locations in the ASEAN region
and northeast Asia as well. This gives Hong Kong a unique advantage as a regional
logistics and distribution centre.
For example, the HKIA’s transport infrastructure in
offers high connectivity and high quality service.
There is also the requisite human
capital and resources that enable Hong Kong to handle these product groups.
Moreover, all these products bring immense economic benefits.
By virtue of Hong Kong’s close proximity to the PRD, where most of the world’s
manufacturing and assembling operations take place, assures steady air cargo flows of
electronics goods is. With respect to, the rapidly growing purchasing power in the
mainland and the ASEAN countries will lend momentum to the streams of jewelleries
and watches as air cargo for Hong Kong.
Furthermore, with regard to luxury items,
the security assurances offered in Hong Kong and the robust intellectual property
regime both serve to sustain air cargoes in the long term. Hong Kong can also
leverage its long-established position as a wine auction centre to maintain air cargo
flows of red wine.
All in all, good sourcing capabilities, high connectivity and high calibre service of the
HKIA, as well as the proximity to the PRD, will be ensure Hong Kong’s air cargo
availability well into the future.
3.8.3 Challenges and Problems
3.8.3.1 Difficulties to Cooperate among the Region’s Airports In
In the PRD there are five international airports: HKIA, Zhuhai International Airport,
Macau International Airport, Shenzhen Bao’an International Airport and Guangzhou
Baiyun International Airport. From a long-term perspective, coordinating with one
another is not a zero-sum game. However, when these airports were planning their
existing runway(s), they never considered other airports.
HKIA currently has two
58 This and the following paragraph draw on the findings of TDC Research, ‘The Future Position
of Hong Kong as a Regional Distribution Centre’, 2006.
67
Maritime Centre Report 2013
runways, one north runway, and the other south.
This results in HKIA’s flight paths
conflicting with other nearby airports’, especially those of Shenzhen and Macau
airports. It is because the Shenzhen’s and Macau’s runways run perpendicular to
HKIA’s in very close proximity.
Thus, even given the pressure HKIA is currently
under, it isn’t able to cooperate with either airport.
Besides, the PRD airspace’s is very complicated.
The three air traffic management
authorities oversee flight movements in their own area using different operating
procedures and standards.
All of them are subordinate to the Chinese military in the
rights of access to the region’s air space. There are no systematic or direct
communication platforms between the five airports. In addition, an “invisible wall”
exists between Hong Kong and Macau on the one hand, and the mainland on the other,
resulting in three separate aviation information zones.
When aircrafts leave HKIA
airspace, they are required to reach a specific altitude before they are allowed to climb
“over the wall” into mainland airspace. This costs extra flight time and fuel, as well
as creating logistical complications for air traffic controllers.
3.8.3.2 Facilities Upgrading in Other Airports Located in Pearl River Delta
Table 3.15 Planned Developments of Airports in the Region
Existing
Existing
Planned
Planned
Number of
Runways
Number of
Aircraft
Number of
Runways
Number of
Aircraft Stands
Stands
Hong Kong
2
96
3(+1)
N.A.
Guangzhou (Baiyun)
2
74
5(+3)
Over 150
Shenzhen (Bao’an)
2
68
3(+1)
145
Macau
1
24
2(+1)
43
21
2(+1)
21
Zhuhai
1
Source: Edited By One Country Two Systems Research Institute
To facilitate long-term growth, the region’s many airports each are mapping out
improvement plans, especially Guangzhou Baiyun and Shenzhen Bao’an, which are
HKIA’s major competitors in terms of passenger and cargo traffic.
Guangzhou
Baiyun’s goal is to be able to handle 75 million passengers and 2.2 million tonnes of
cargo per year by 2015, and 80 million passengers and four million tonnes of cargo by
68
Maritime Centre Report 2013
202059, with five runways and more than 150 aircraft stands.
Shenzhen Bao’an’s
target is to extend its capacity to handle 45 million passengers and 2.4 million tonnes
of cargo volume by 202060, with three runways and 145 aircraft stands (Table 3.15).
Currently, in terms of total passenger traffic and air cargo traffic, Hong Kong is still
leading. However, the story can look very different in the long term. Hong Kong
has quite a stable local market for the passenger traffic, with the main competition
with other airports over mainland travellers.
Due to a lack of local cargo owners,
HKIA must compete with other airports in the region for the cargo located in the PRD.
If HKIA is not able to maintain its competitiveness, these cargoes may go to other
airports.
3.8.4 Short Summary
Overall, in terms of both passenger traffic and cargo traffic HKIA’s performance is
still very outstanding.
However, the challenges of reaching maximum runway
capacity and increasing competition from the region’s other airports may threaten its
lead in the long run. In particular, facility expansions at Guangzhou Baiyun and
Shenzhen Bao’an cast doubt about the HKIA’s current two-runway system.
possible HKIA may be capacity-constrained by as early as 2015.
59
60
Data provided by Cathy Pacific
Interview detail with Shenzhen Airport Authority
69
(Jan 14, 2010)
It is
Maritime Centre Report 2013
4.
Experience from London, Singapore and Shanghai
4.1 IMC under Globalization
With the acceleration of economic globalization, the capability of a maritime centre to
facilitate global transport has been influenced by the shifting of the centre of gravity
of international trade business, coupled with the closer cooperation and more intense
competition among maritime centres globally.
At present, the major IMCs are London, New York, Rotterdam, Tokyo, Dubai, Hong
Kong, Singapore, and Shanghai. Based on their own geographical locations and
historical development, the positions, functions and characteristics of these IMCs in
the global maritime transportation industry are different.
Currently, IMCs come in
two categories of: time high-end maritime business services centres and region freight
distribution centres.
High-end maritime business services centres influence and control the global
maritime industry and market through providing industry supporting services, such as
financial and legal services, and market exchange information, such as the freight rate
indices.
London and New York are the typical high-end maritime business services
centres, in which freight distribution is no longer the main business concerned.
However, the regional freight distribution centres are more focused on the practical
maritime transport logistics services.
With state-of-the-art port infrastructure IMCs
such as Shanghai, Hong Kong, Singapore, Bushan, Dubai, Rotterdam, (ranked
Number 1, 2, 3, 5, 9, 10, respectively in the top 20 container terminals in terms of
throughput in TEUs in 2010 61 ) serve the region with huge freight distribution
capacity.
London dominates the up-stream services sectors, while Hong Kong focuses on the
middle stream, and is at a critical moment of transitioning and upgrading. Shanghai,
compared with Hong Kong and London, has focused on the down-stream of the
industrial chain, which includes port-related services.
However, in recent years
United Nations Conference on Trade and Development (UNCTAD), Review of Maritime
Transport, 2011 http://www.unctad.org/en/docs/rmt2011_en.pdf
61
70
Maritime Centre Report 2013
Shanghai has been dedicated to the development of high-end international maritime
services, both Singapore and London have sported recent development.
about all these will follow.
More details
4.2 Constraints in the Development of Marine Insurance in Hong Kong
While Hong Kong has traditionally served as a gateway to the mainland, Singapore
has long been a classic trans-shipment port.
Singaporean understood that the Straits
of Malacca and Singapore has been the object of international rivalry since as early as
the 15th Century. 62 In terms of tran-shipment, Singapore is the world’s most
important intermediate hub 63 thanks to its strategic location, infrastructure and
efficient, quality port services. 64
Singapore’s strategy involves attracting ship
owners and operators and providing for the businesses to be supported by maritime
services, such as world-class port facilities, legal services, ship financing, ship
management and ship broking.65 Key components of the strategy are regulation and
fiscal policies, and the government is constantly reviewing and updating the tax
regime, incentives and other regulations.
Furthermore, research and development is another feature that Singapore anticipates
will benefit all areas of the maritime industry.
Singapore has been investing heavily
in maritime education, such as programs focused on research and development within
the maritime industry and academic institutions. The Maritime Cluster Fund offers
financial assistance for training and a Maritime Innovation and Technology (MINT)
fund has been set up to provide funding for information technology, engineering,
science, and various research and development programs.
The Association of
Singapore Marine Industries also offers a number of scholarships.
Hence, Hong Kong needs to cultivate its maritime talents pool by improving training
and education schemes. Internship opportunities for students to broaden their
knowledge in the maritime industry are an example. More publicity campaigns are
necessary to increase public awareness.
It is recommended to begin offering
‘The importance of the Straits of Malacca and Singapore’ (1998) 2 Singapore Journal of
International and Comparative Law 301
63 Jean-Paul Rodrigue, ‘Maritime Transportation: Drivers for the Shipping and Port Industries’
(2010), 10
64 Jose Tongzon, ‘Key Success Factors for Transshipment Hubs: The Case of the Port of
Singapore’ in Tae-Woo Lee and Kevin Cullinane (eds), World Shipping and Port Development
(Palgrave MacMillan, 2005) 162
65 More information can be found at http://www.asmi.com/
62
71
Maritime Centre Report 2013
specialised courses in the subjects of ship finance, ship insurance and maritime law at
local universities. Hong Kong should also be more proactive in attracting foreign
talents by adopting preferential immigration policies.
4.3 Current Development of Maritime Services in London
London is one of the world’s largest time-honoured maritime centres in.
In the late
th
17 century, when the centre of gravity of seaborne trade shifted from Amsterdam to
London due to England’s economic and naval strength, and “London lay at the centre
of a maritime empire spanning the globe and controlling half of the world’s deep sea
shipping and three quarters of its shipbuilding”66.
The centre of gravity of seaborne trade kept shifting to the west until in recent
decades, when it began moving eastwards to the Asia-Pacific region, with China
becoming the new shipping business centre. In 2010, of the top eight container
terminals (in TEUs throughput), six cities, including Hong Kong, were in China67.
However, in terms of TEUs throughput and cargo volume, London lagged behind
major Chinese port cities68 with the volume of imports and exports in 2009 about
40% and 26% of China’s, respectively69.
Nonetheless, the decline in port transport industries has not diminished London’s
international maritime status. On the contrary, as the world’s Number One financial
centre in years70 in terms of the integration of competitiveness areas, including
business environment, people, taxation, infrastructure, cost competitiveness, and
market access, London fully utilised its competitive edge and successfully
transitioned from a regional distribution centre to a leading high-end IMC.
London’s maritime business service sectors enjoy world-wide dominance, especially
in the financial and broking areas. In 2010, London controlled 15% of global ship
finance, 20% of marine insurance underwriting business, 50% of tanker chartering,
more than 30% dry bulk chartering, around 50% of second hand ship sales and
Martin Stopford, Maritime Economics 2nd ed. 1997, Routledge, London
United Nations Conference on Trade and Development (UNCTAD), Review of Maritime
Transport, 2011 http://www.unctad.org/en/docs/rmt2011_en.pdf
68 In AAPA World Port Rankings 2008, London is ranked 78 in terms of total cargo volume and
58 in terms of TEUs throughput.
69 Derived from United Nations International Merchandise Trade Statistics, 2010 International
Trade Statistics Yearbook
70 Z/Yen, The Global Financial Centres Index 9, 2011
66
67
72
Maritime Centre Report 2013
purchases and dominate the P&I Club services by occupying 62% global market (See
Table 4.1).
Table 4.1 International Market Share of UK Maritime Services71
Industry
Global market share (%)
Ship finance
15
Insurance – underwriting
20
Insurance – P&I Club
62
Lloyd’s Register
16
Ship broking (estimate)
- Tanker chartering
50
-
Dry bulk chartering
30-40
-
Second hand tonnage
50
Due to London’s dominant position in the global maritime services, many principal
international institutions focusing on various maritime services are based in London,
which are shown in Table 4.2.
Table 4.2 List of Principal International Maritime Institutions based in London72
Institution based in London
Area of Activity
International Maritime
Shipping – safety, environment, administrative
Organisation (IMO)
matters, registers, standards, coastguards, pilotage
International Shipping
Manning, personnel and industrial relations issues
Federation (ISF)
International Chamber of
Shipping and related industry issues whatever their
Shipping (ICS)
nature other than items being handled
International Association of
Ship design, building, repair and maintenance
Classification Societies (IACS)
standards and their enforcement - surveying
International Association of Dry
All issues relating to dry bulk ships and their cargo
Cargo Ship owners
(INTERCARGO)
International Group of P&I
Ships and shipping insurance
Clubs
The CityUK, Maritime Services 2011
Derived from Hong Kong Port and Maritime Board, 2003, Study to Strengthen Hong Kong’s
Role as an International Maritime Centre, Maunsell Consultants Asia Ltd.
71
72
73
Maritime Centre Report 2013
The statistics of economic impact of UK’s maritime service sectors (MSS) and UK’s
maritime business service sector (MBSS) are listed below. The maritime service
sectors are defined to include the ports, shipping and maritime business services
sectors, while the maritime business services sectors include ship broking, insurance,
related financial and legal services and maritime-related activity at Lloyd’s Register,
primarily located in the City of London73.
Table 4.3 Direct Economic Impact of the Maritime Services Sectors in UK in 200974
GVA
Employment
Tax Revenue
(£mns)
('000s)
(£mns)
Port industry
6,900
112
2,300
Shipping industry
6,100
117
760
MBSS
1,500
11.1
495
Total
14,500
240
3,555
Table 4.3 lists the direct economic impact of the maritime services sectors in the UK,
which excludes all possible indirect and induced efforts.
The total gross value added
(GVA) generated is £14.5 billion and the jobs created directly by MSS were around
240,000.
Specific data of maritime business services sectors is provided in Figures 4.1 and 4.2.
It is can be noted despite the relatively small number of jobs, the MBSS is particularly
productive in terms of GVA per head, with workers on average generating around
£135,000 of GVA, which is about three times the UK economy’s average.
73 Oxford Economics, The economic impact of the UK’s maritime business services sector 2011,
The CityUK Maritime Services 2011
74 Source: Oxford Economics, The economic impact of the UK’s maritime business services sector
2011
74
Maritime Centre Report 2013
75
Figure 4.1 GVA per Maritime Service Worker vs the Economy’s Average
In 2010, 4,200 people were employed in 200 British ship broking firms, and legal
services providers hired a total of 1,272 employees.76
In addition, a total of 10,500 students were in maritime education in the UK, the
majority undergraduate students and nearly two-third Britons.
Manpower and
reserve of talents in maritime services are some of the key factors that support an
IMC’s development.
4.4 Experience from London’s transformation
The success of London in evolving into an international maritime services centre lies
in several aspects. Apart from the history, language, education, manpower, and the
concentration of international associations of various maritime services, a crucial
factor is London was able to keep creating more sustainable competitive edges with
existing resources and advantages.
The establishment and growth of the Baltic Exchange was the key for London’s
growth into the international maritime exchange centre. With a total membership of
nearly 600 companies and more than 2,000 individuals 77 , roughly 400 member
companies are based in the UK. The Exchange, the world’s only independent source
75
76
77
Ibid.
Ibid.
Baltic Exchange, http://www.balticexchange.com
75
Maritime Centre Report 2013
of maritime market information for the trading and settlement of physical and
derivative contracts, represents most ship brokers and charterers and facilitates the
ship-broking business world-wide. Through the Exchange, the ship brokers of UK
generated around £744 million in net overseas earnings, more than a third of the total
overseas earnings of the entire UK maritime business services sectors in 201078.
Besides supporting the ship broking and other maritime business services, more
importantly, the Exchange issues the daily index, tracking international shipping
prices of various dry bulk cargoes. The Baltic Dry Index (BDI) has become the major
global economic indicator of global supply and demand for the commodities shipping
industry, as the index chiefly provides an assessment of the price of moving the major
raw materials by sea.
The broking representation role of the Baltic Exchange has helped retain the industry
core players, including ship owners, shipbrokers, and charterers, so that when the
trade centre and world’s freight distribution centre moves the maritime business can
still remain in London.
The index captures the world’s attention, as the BDI reflects
not only the freight rate, but also the supply and demand for international goods
shipping, and thus captures the trend of international trade since more than 80% of
international trade is seaborne.
The second example is the Lloyd’s of London.
Dominating the world marine
insurance and re-insurance market, the Lloyd’s of London is an insurance market of
members. In 2010, more than £22,592 billion in gross premium was transacted at
Lloyd's, which reported a record pre-tax profit of more than £2.2 billion79.
ranked as the world’s fifth-largest reinsurer in 2010
80
Lloyd’s
and largest subscription
insurance market. Besides, Lloyd’s plays an important role in setting the business
policy of marine insurance, as the terms and forms designed by Lloyd’s have
significant influence worldwide.
Supported by Lloyds’ unique brand, London is
widely recognised as an international insurance centre, while London’s attraction as
the world’s top financial and insurance centre enhanced Lloyd’s competitive position,
as well as policyholder loyalty. Recently Lloyd’s has been actively researching new
insurance products, including energy insurance, satellite insurance and computer
issuance.
78
79
80
The CityUK, Maritime Services 2011
Lloyds Annual Report 2010.
S&P Report 2010, Lloyd’s
76
Maritime Centre Report 2013
It is clear that London’s success lay in the synergies of multiple factors as discussed
above. To create synergetic clusters is difficult. It requires time, innovations, and a
proactive search for a sustainable edge. However, once the synergetic clusters are
formed, the entire city will, just like London, enjoy a solid competitive advantage.
4.5 Competitiveness and Policies of Shanghai as an IMC
Located halfway along China's eastern coastline, Shanghai is one of the most
developed metropolises in a country with a booming economy and a mature market.
Shanghai has a strong industrial base, competitive scientific research capacity,
financial services system, maritime infrastructure and complex transportation system.
With China's rapidly growing of economy and active policies drive, Shanghai as an
IMC has substantial competitiveness.
4.5.1 World Port Ranking
Shanghai was first among the world’s ports in 2010 in terms of containers.
The
following figure shows except during the financial tsunami Shanghai's container
traffic rose the whole time, while Hong Kong's growth was much steadier.
Singapore's container traffic rose more slowly than Shanghai’s but much faster than
Hong Kong’s.
But Singapore caught up and exceeded Hong Kong in 2005 and
Shanghai in 2007.
Figure 4.2 Total Container traffic Comparisons of Singapore, Hong Kong and
Shanghai (000’TEUs)
container (1000 TEUs)
35,000
30,000
25,000
Singapore
20,000
Hong Kong
15,000
Shanghai
10,000
5,000
0
2002 2003 2004 2005 2006 2007 2008 2009 2010
year
Source: American Association of Port Authorities. Web: www.aapa-ports.org.
77
Maritime Centre Report 2013
4.5.2 Inland River Navigation
The Yangtze is the longest, best conditioned inland river in China, and the busiest
navigable river with the world’s largest transportation volumes. The Yangtze’s
transportation volume is double that of the Mississippi, and three times that of the
Rhine.
The Yangtze economic zone covers seven provinces and two cities with a
total GDP of RMB12,000 billion, 40% of China's total.
Located in the Yangtze’s
mouth, Shanghai serves as a crucial node linking inland river systems with the East
China Sea.
During the 11th Five Year Plan period, Shanghai has been building advanced inland
waterways, including Dalu line, Zhaojiagou, Sushen, and Hangshen waterways,
linking the city with Jiangsu and Zhejiang provinces, as well as Gaoqiao and
Yangshan port zones. By the end of 2008, there were 199 inland waterways in
Shanghai totalling in 2,146.4 km, of which 61.3 km is Class I waterway, 42.3 km
Class III, 123.5 km Class IV and 63.3 km Class V. Shanghai's inland transportation
volumes measuring 0.148 billion tonnes, originate mainly in Zhejiang, Jiangsu and
Anhui provinces.
Shanghai has 836 inland cargo ships, with capacity totalling
366,900 tonnes and 154 passenger ships with a total capacity of 68,947 tonnes.
Moreover, Shanghai has 1,872 productive berths, of which 27 berths are of 100 tonnes,
665 of 100 to 300 tonnes, 1,093 of 300 to 1,000 tonnes, and 84 above 1,000 tonnes.
Shanghai’s total inland berth throughput is 7.4 million tonnes.
4.5.3 Industrial Base
Shanghai has a strong industrial base in the Yangtze River Delta.
With less than 6%
of China's population and less than 1% of the land mass, the 16 cities in the region
generated 40% of China's GDP and attracted about 50%of the country’s foreign direct
investments.
The region’s 2010 economic output approached RMB7,000 billion, in
which six cities exceeded RMB500 billion.
The top five were: Shanghai with
RMB1,687.2 billion; Suzhou 916.9 billion; Hangzhou RMB594.6 billion; Wuxi
RMB575.8 billion, and Ningbo RMB 512.6 billion. Buttressed by the prosperous
manufacturing industries in the Yangtze River Delta, Shanghai will be able to handle
more freight at lower costs as it develops into a more mature maritime centre and
provides comprehensive services.
78
Maritime Centre Report 2013
Furthermore, Shanghai's shipbuilding industry has always been leading in China.
The world’s shipbuilding centre has shifted to Asia, with Korea, Japan and China
being the three major shipbuilding countries. According to insider analysis, the
world’s shipbuilding capacity will reach about 5,000 CGT by 2012, in which
four-fifths would be contributed by Korea, Japan and China.
Moreover, China's
shipbuilding capacity will exceed the other two and become the top shipbuilding
country.
Shipbuilding in Yangtze River Delta, given its intact shipbuilding systems and many
techniques and management talents, accounts for 60% of China's total. Waigaoqiao
Shipbuilding Company was founded by China State Shipbuilding Corporation
(CSSC), Bao Steel Group Corporation, Shanghai Electric (Group) Corporation etc.,
and is the premier modern assembly factory in China.
Since 2001Waigaoqiao has
signed contracts with Japan, Belgium, United States, Britain, Greece, Germany,
Turkey, Italy, Norway, Singapore, Taiwan and Hong Kong. At present, the
company is filling orders exceeding14 million DWT.
Besides, shipbuilding factories
around Shanghai in Zhejiang and Jiangsu province have been forming a cluster.
4.5.4 Transportation Infrastructure
The Yangtze River Delta is the most competitive in China, as well as an emerging
region in the world. Over the past two decades, an extensive transportation network
has been developing, such as the Huning Highway, Hangzhou Bay’s undersea tunnel,
the Yangshan Port Zone, the Yangtze Estuary deepwater channel, Pudong
International Airport, Hongqiao Comprehensive Transportation Hinge, JingHu High
Speed Railway etc.
4.5.5 Shanghai Shipping Exchange
Founded on November 28 1996, Shanghai Shipping Exchange (SSE) is the first
state-level shipping exchange in China. This indicated Beijing's willingness to
develop Shanghai into an IMC.
The SSE’s responsibilities include (1) collect information; (2) standardize shipping
market transactions; (3) adjust the freight rates; (4) embody the trading function of
79
Maritime Centre Report 2013
key shipping elements; (5) supervise market behaviour; and (6) improve the
information-publishing system.
More than 300 enterprises so far have joined the SSE.
Furthermore, the two
well-known indexes the SSE has developed are announced twice a month and have
become the most acceptable container index. The SSE container index shares the
"price-setting barometer" with London's BDI.
Leading shipping companies such as
Maersk, Kawasaki, Pacific Shipping Company, CMA-CGM, Hapag-Lloyd and others
have subscribed to the SSE Index.
4.5.6 Higher Education in Marine: Shanghai Maritime University
China's maritime higher education traces its origins to Shanghai. As the country’s
oldest institution of maritime higher education, Shanghai Maritime University was
established in 1909 by the National Post Bureau of the Late Qing Court as a
department of Nanyang College.
The university now offers nine doctoral and 56 Master’s degree-granting programs.
Its main colleges include Merchant College, Transport College, Logistics Engineering
College, Ocean Environmental and Engineering College, Information Engineering
College and the School of Law. Additionally, the university has established
communications & transport as the national key discipline, supplemented with five
national characteristic specialities, including marine navigation, logistics, mechanical
design, manufacture & automation, and port & harbour access engineering. The
university is equipped with a water training centre, a teaching-training vessel with
capacity of over 10,000 tonnes, two unrestricted navigation teaching-training vessels,
and 29 training vessels. A 4.8 thousand-tonne class teaching-training vessel, the
world’s largest teaching-training vessel, is presently under construction and shall
come into use during the12th Fifth Plan period.
The university has a current enrolment of more than 15,000 undergraduates and 2,500
graduate students. Known as "the cradle of China's shipping talents," it is committed
to comprehensively training the maritime talents China needs, and as many as five
million graduates have completed their studies here and obtained working positions in
the government, shipping companies, and other enterprises in the maritime industry.
80
Maritime Centre Report 2013
4.5.7 Government Policies of Shanghai as an IMC
4.5.7.1 Beijing's Policies
Beijing has decided to develop Shanghai as a maritime centre, and in 2009 the State
Council issued Opinions on Promoting the Development of Shanghai’s Modern
Service Industry and Advanced Manufacturing Industry, and Promoting the
Construction of Shanghai International Financial Centre and International Shipping
Centre. The opinions said the goal is basically to build Shanghai into an IMC by
2020 with concentrated shipping resources, maritime services, and efficient logistics
service.
Shanghai will be the maritime centre with Jiangsu and Zhejiang as the two
wings, having as hinterland the Yangtze River basin, and its related ports cluster in
the region. With close collaboration of the shipping hub, optimization of the modern
port transportation system, and Shanghai’s international aviation hub, the region will
be closely integrated as a modern maritime complex.
The opinions focus on the following areas:
(1) Develop in Shanghai a modern maritime service system, encompassing shipping
trade, shipping management, shipping brokerage, shipping consulting, ship
technology and utilising well the SSE as a shipping information and trade platform.
Policies of this area include (a) extend funds to Chinese capital's "flag of
convenience" ships in special cases; (b) exempt those running maritime related
enterprises, warehousing and inventory logistics enterprises registered in Yangshan
tax-free zone from corporate tax; (c) allow enterprises to open off-shore banking
accounts, and support account settlement of overseas businesses.
(2) Establish auxiliary services of a modern maritime industry, such as financial
services, shipping finance, shipping insurance, equity financing and other financial
innovations.
Policies in this area include (a) allow large ship building companies to expand their
business to financial leasing, and encourage these companies to enter the inter-bank
short-term loan market on a daily basis and issue bonds; (b) encourage competitive
financial institutions and maritime enterprises to set up maritime insurance institutes
in Shanghai; (c) improve the financial industry environment and exempt those
maritime insurance companies registered in Shanghai from corporate tax; (d) further
81
Maritime Centre Report 2013
develop the financial derivative products and the derivative products of freight index
for risk control.
(3) Develop cruise industry
Policies in this area include (a) allow foreign cruise companies to register in Shanghai
and, under certain restrictions, sail from Chinese ports to international destinations; (b)
encourage foreign cruise companies to take Shanghai or others as ports of call and
gradually develop Shanghai into a home-port; (c) gradually build up a cruise related
financial service system, such as insurance, loan etc.
4.5.7.2 Shanghai's Government Policies
The Municipal People's Government of Shanghai closely followed Beijing's policy
drive and issued its own opinion, Implementing the Opinions of the State Council on
Propelling Shanghai to Accelerate the Development of a Modern Service Sector and
an Advanced Manufacturing Sector and Build an International Financial Centre and
an International Shipping Centre, outlining its strategies to build Shanghai into a
maritime centre.
Besides implementing Beijing's policies, Shanghai emphasised its talents policies.
A
"Thousand Talents Program" will be launched by Shanghai to attract more
high-quality talents to the financial and maritime industry with attractive housing,
education, medical insurance and residency permits. Moreover, Shanghai will
re-organise maritime related disciplines across higher education institutions, increase
funding for maritime studies.
In the meantime, bring enterprises and educators
together and introduce foreign maritime education and training institutes.
4.6 Competitiveness and policies of Singapore as an IMC
Sitting at the nexus of the world’s major trade routes, Singapore as an island nation
has promoted itself as the hub not only for ships but also for the entire maritime
community, as well as an ideal platform for industry players to network, exchange
ideas, and grow new business opportunities. As a strong government, the Singapore
government has been pushing hard to build the city into an IMC in all aspects.
82
Maritime Centre Report 2013
4.6.1 Government Drive
4.6.1.1 Maritime and Port Authority of Singapore
The Maritime and Port Authority of Singapore (MPA) is responsible for the overall
development and growth of the Port of Singapore, including terminal operators, such
as PSA Corporation and Jurong Port Pte Ltd.
The MPA was established in 1996
with the mission to develop Singapore into a premier global hub port and IMC and
advance and safeguard its strategic maritime interests. As the driving force behind
Singapore's port and maritime development, the MPA assumes the roles of port
authority, port Regulator, port planner, IMC champion, and national maritime
representative, and partners with the industry and other agencies to enhance safety,
security and environmental protection in the port’s waters, facilitate port operations
and growth, expand the cluster of maritime services, and promote maritime R&D and
manpower development.
4.6.1.2 Benefits of ship registration under Singapore flag
Administered by the MPA, the Singapore Registry of Ships (SRS), established in
1966, is internationally recognised for its efficient services, high operational and
pollution control standards, and good safety records. It now ranks among the
world’s top 10 largest registries, with more than 3,000 registered vessels totalling 43.7
million gross tonnes, and is the preferred choice of flag for many international ship
owners.
4.6.1.3 Tax advantages and financial incentives
The MPA provides a series of schemes of tax exemptions and financial support.
The
main Maritime Sector Incentive (MSI) schemes are as follows:
1. MSI-Approved International Shipping Enterprise (MSI-AIS) Award
An MSI-AIS company will enjoy tax exemptions on qualified shipping income for
either a 10-year renewable period or a five-year non-renewable period, with the
option of graduating to the 10-year renewable award at the end of the 5-year period.
83
Maritime Centre Report 2013
2. MSI-Maritime Leasing (MSI-ML) Award
Ship or container leasing companies, funds, business trusts or partnerships will enjoy
tax concessions for up to five years on their qualifying leasing income under the
MSI-ML award.
An approved manager of the asset-owning entity will be awarded a
concessionary tax rate of 10% on its qualifying management income.
Operating and qualifying finance leases are both covered under the MSI-ML award,
to allow asset-owning flexibility in leasing and chartering options.
3. MSI-Shipping-related Support Services (MSI-SSS) Award
An approved MSI-SSS company will enjoy a concessionary tax rate of 10% on the
incremental income derived from the provision of the following qualifying approved
shipping-related support services for five years: ship broking; forward freight
agreement (FFA) trading; ship management; ship agency; freight forwarding and
logistics services; and corporate services rendered to qualifying approved related
parties who are carrying on business of shipping-related activities
Singapore-registered vessels enjoy not only tax advantages and financial incentives,
but also benefits from a high-quality ship registry due to its:
Adoption of international standards: Singapore is a party to all the major
International Maritime Organisation (IMO) conventions on ship safety and
marine pollution prevention.
Good safety record: The SRS is on the “white list” of key port state control
regimes, with a dedicated flag state control unit (FSCU) that actively monitors,
identifies and regularly penalises any non-conforming ships.
Experienced and responsible administration: The SRS is a hands-on and
efficient administration, quick to respond to the needs of the shipping
community with diligence and high-quality service. With more than 30 years
of experience, it is recognised as a non-flag-of-convenience (FOC) registry by
both the United Nations Conference on Trade and Development (UNCTAD)
and the International Transport Workers’ Federation (ITF).
Choice of classification societies: Nine internationally recognised
classification societies, in addition to MPA, are authorised to survey and issue
tonnage, safety and pollution prevention certificates to Singapore ships:
o
American Bureau of Shipping (ABS)
o
Bureau Veritas (BV)
84
Maritime Centre Report 2013
o
China Classification Society (CCS)
o
o
Det Norske Veritas (DNV)
Germanischer Lloyd (GL)
o
Korean Register of Shipping (KRS)
o
Lloyd's Register (LR)
o
Nippon Kaiji Kyokai (ClassNK)
Registro Italiano Navale (RINA)
o
Flexibility on crew nationality: Owners of a Singapore-registered ship can
employ officers and crews of any nationality.
In order to maintain quality
and competence, all crew members must meet the standards of the
International Convention on Standards of Training, Certification and
Watchkeeping for Seafarers (STCW) 1978.
Recognition of foreign certificates of competency: Singapore allows foreign
officers and engineers who hold valid and relevant foreign certificates of
competency (COC) to serve so long as owners apply for a Certificate of
Endorsement (COE).
No prior approval is required for their crew who hold
foreign COC.
Tax exemption: Profits derived from the operation of a Singapore vessel are
exempt from income tax.
There are also various forms of tax incentives to encourage the development of
different maritime sectors:
For ship finance, there is a withholding tax exemption on interest payable on
loans obtained from foreign lenders to finance the purchase or construction
of ships.
Withholding tax exemptions on interest and related payments on loans
obtained from foreign lenders to finance the purchase of containers and
intermodal equipment.
Tax exemption schemes for captive insurers, specialised insurers and marine
hull and liability insurers.
4.6.2 Private Sector
Besides the related government department, Singapore also harnesses the private
sector. Established in 2004, the Singapore Maritime Foundation (SMF), was created
to forge a strong partnership between the public and private sectors. As a private
sector-led body, the SMF benefits from strong industry support in tapping directly
85
Maritime Centre Report 2013
into the community for new ideas and initiatives that benefit Singapore’s maritime
fraternity. It works closely with the Singapore government to advance the vision of
developing Singapore into a premier IMC.
As the bridge between the government and the private maritime sector, the SMF helps
initiate ideas and drive proposals to boost the sector’s development and grow the
overall economy.
The SMF’s main responsibilities include: providing forums and
organising international events for exchanging, generating and developing ideas and
proposals; building up networks to turn Singapore into an IMC; acting as the catalyst
in fostering mutual co-operation among various sectors of the maritime industry;
serving as the government’s partner from the private sector in promoting Singapore as
an IMC and developing the manpower to support the maritime industry.
SMF’s functions are crucial for Singapore to develop into an IMC.
Details are as
follows:
4.6.3 Industry Cooperation and Development
The SMF listens and responds to industry feedback to form working groups in order
to address specific issues of interest to the industry.
To this end, SMF formed a few working groups to project industry voices on the
regulatory rules and policies such as the ship finance workgroup (SFWG), marine
insurance workgroup (MIWG) and maritime arbitration workgroup (MAWG). In
particular, the MAWG spearheaded the formation of the Singapore Chamber of
Maritime Arbitration in a bid to position Singapore at the forefront of maritime
arbitration.
4.6.4 Industry and Public Outreach
SMF organises and supports a range of events and initiatives to raise the profile of the
sector.
SMF has adopted a multi-pronged approach to create greater public
awareness of the maritime industry, both locally and overseas, as well as highlighting
the career opportunities and attracting young talents to join the maritime workforce.
86
Maritime Centre Report 2013
Besides, SMF has a number of maritime publications to facilitate industry information
exchange.
4.6.5 Conferences and exhibitions
SMF has successfully attracted international leading conferences, significantly
improving its image of being an IMC.
For instance, the SMF organises Sea Asia
Conference and Exhibition, highlighting Asia’s pivotal role in the global shipping
world.
The SMF takes Sea Asia as a chance to elevate Singapore’s status as a leading IMC
and make it the focal point for maritime leaders to discuss pertinent issues and
challenges faced by the industry, especially in Asia.
4.7 Competitiveness of Hong Kong as an IMC
4.7.1 Geographical Location
Within five hours' flight time, key mainland cities and Asia’s regional centres in can
be accessed from Hong Kong. Therefore, more regional headquarters and offices of
multinational firms are located in Hong Kong than in any other Asia-Pacific city.
More than one-third of the multinational firms active in Asia-Pacific have their
regional headquarters here. No other business hub or regional maritime centre in
Asia-Pacific can match this share as.
Singapore is not able to compete with Hong Kong with respect to geographical
location. It takes approximate three hours to fly to Hong Kong; 5.5 to Beijing; five
to Shanghai; 6.5 to Tokyo and six to Seoul.
flight times are nearly halved.
When travelling from Hong Kong, the
Besides, Hong Kong is close to the mainland,
attached to the PRD area, one of the country’s fast-growing areas of maritime industry.
Against this strong backdrop, Hong Kong is a super strategic regional centre of
China’s maritime industry.
87
Maritime Centre Report 2013
4.7.2 Premium Condition of our Port
Harbour waters are vast and can simultaneously berth 50 liners.
Water depth in the
port area, is on average 12.2 m, and ocean liners of thousands of tonnes clock in and
out of its ports. The port has three bays and two typhoon shelters from the wind to
mitigate the effects of the waves.
The Victoria Harbour, located between Hong Kong Island and the Kowloon peninsula,
is one of the deepest maritime ports in the world, and has unique natural conditions.
Its waters spans 59 square metres, varies from 1.2 km to 9.6 km in width, and can
accommodate ocean liners.
It has three main entrance channels and is the portal of
entry into Hong Kong, with 72 berths for ocean-going ships to dock.
Total length of
piers and public cargo working areas for the entire port area development is nearly 7
km, with an entry and exit berthing time of only a dozen hours, and the high
efficiency of the world’s major ports.
4.7.3 Maritime Industry Tradition
4.7.3.1 Legal System
Hong Kong's legal system, where English common law prevails, is separate from the
mainland's.
The impartial judiciary is independent of the legislature and the
executive branches, and is drawn from several British Commonwealth jurisdictions as
well as from Hong Kong itself. It is a widely respected system in which the rule of
law and the independence of the judiciary are the prevailing principles. The High
Court maintains specialist lists to deal with admiralty and commercial disputes.
Many of the world's leading maritime law firms have offices in Hong Kong, which
boasts an independent bar and a well-regarded and thriving arbitration centre.
With its intimate commercial and constitutional relationship with the mainland and a
legal foundation in the English system, Hong Kong has a unique position in the legal
world. The decisions of the English Courts and those of other Commonwealth
jurisdictions continue to have a high precedential value in the Hong Kong Courts.
88
Maritime Centre Report 2013
4.7.3.2 The World’s Freest Economy
Hong Kong is well known as an international financial centre.
In 2011, Hong Kong
remained the freest economy in the world for the 16 consecutive years, which means
it has strong fiscal discipline, low taxes, open markets, free flow of information,
goods and capital, clean government and a level playing field for business.
Hong
Kong offers the highest level of economic freedom, with a score of 9.01 out of 10,
followed by Singapore with a rating of 8.68. The United States is the 10th freest
economy with a rating of 7.60. In addition, Hong Kong is ranked the third largest
receiver of FDI in 2010.
4.7.3.3 Efficient and Clean Government
Measuring business regulations, Hong Kong is the world's second easiest place to do
business, after Singapore.
The fifth annual ranking of the “Best Countries for
Business” by Forbes has placed Hong Kong in the second spot, after Denmark and
ahead of such developed economies as the US, the UK, Australia, New Zealand,
Canada, and Singapore.
The rankings compared 128 economies across 11
parameters, including property rights, technology, corruption, red tape, investor
protection, stock market performance, trade freedom, monetary freedom, personal
freedom, tax burden, and market performance.
A quick analysis of Hong Kong’s rankings in the 11 pillars indicates that the
economy’s strengths lie in its trade freedom, low taxes, investor protection and
monetary freedom. It also scored high on technology and the lack of corruption.
4.7.3.4 Culture and Society
Hong Kong is a highly international and multicultural city with deep influence of
traditional Chinese culture everywhere. As an SAR of China, Hong Kong is the only
Chinese city infused with high degrees of internationalization and localization which
is much attractive to Chinese maritime industry and talents.
89
Maritime Centre Report 2013
4.7.4 China as the Hinterland
Given China's rapid economic growth as well as the maritime industry boom, Hong
Kong is indispensable and irreplaceable to Chinese enterprises in deploying future
maritime industry strategies.
The tremendous impact of Chinese maritime enterprises, such as the COSCO Group,
CSCL, SINO etc., is to be reckoned with.
While they usually maintain a low profile,
it does not mean that they are not powerful and influential. With superb financial
strength, they are less concerned about the SAR government policies. Given the
presence of these Chinese maritime enterprises, its geographic location and its being a
strategic part of China, Hong Kong cannot be supplanted by Singapore no matter how
hard its government tries. Singapore government's promotional measures may be
attractive to local or small to medium-size shipping companies, but they are
apparently less attractive to maritime enterprises that do not excessively care about
tax exemptions and other financial favours.
As the maritime industry’s centre of
gravity has shifted to Asia and China's shipping and port- building grow rapidly,
Hong Kong will have the mainland as a strong support, something hard for Singapore
to compete with.
90
Maritime Centre Report 2013
5.
Policy Suggestions
5.1 Government Structure: Set up a New Ministry of Transport for
Policymaking and Co-ordination
The Marine Department is responsible for all navigational matters in Hong Kong and
the safety standards of all classes and types of vessels. The functions of the Marine
Department are: facilitate the safe and expeditious movement of ships, cargoes and
passengers within Hong Kong waters; ensure compliance with international and local
safety and marine environmental protection standards in respect of ships registered
and licensed in Hong Kong or using Hong Kong waters; administer the Hong Kong
Shipping Register and develop policies, standards and legislation in line with
international
conventions; ensure
compliance
with
international
and
local
requirements on the competency of seafarers for ships registered and licensed in Hong
Kong and using its waters, and to regulate the registration and employment of Hong
Kong seafarers; co-ordinate maritime search-and-rescue operations within Hong
Kong’s international area of responsibility and ensure compliance with international
conventions; combat oil pollution in Hong Kong waters, collect vessel-generated
refuse and scavenge floating refuse in specified areas of Hong Kong waters; and
provide and maintain in the most cost-effective manner the number of government
vessels that departments need in order to conduct their business.
The Martime Industry Council (MIC) was re-organised in June 2003 from the Hong
Kong Port and Maritime Board by the SAR government following the
recommendation of the "Study to Strengthen Hong Kong's Role as an International
Maritime Centre", as a step forward to enhance the competitiveness and attractiveness
of Hong Kong's maritime industry. It is a dedicated high-level advisory body made
up of the private sector and government officials to advise the government on the
measures and initiatives to develop Hong Kong's maritime industry. It also assists
the SAR government in promoting the comprehensive maritime services and the
edges of operating maritime business in Hong Kong.
Neither the Marine Department nor the MIC is a decision maker.
They merely
provide basic maritime services since Hong Kong adopts the philosophy of minimum
government – that privately owned and operated industry should have minimal
government interference.
91
Maritime Centre Report 2013
This is double-edged sword. On one hand, the minimal government allows the
industry and the market to find their own right tracks by the “invisible hand”; on the
other hand, the minimal government might not be proactive enough to seize the
opportunities that promote Hong Kong as an IMC, especially in face of severe
competition from other emerging maritime centres around the world. Therefore, a
new Maritime Authority responsible for maritime industry decision-making and
centralised services is needed. Such an authority would help to centralise the current
scattered functions under various governmental departments, facilitate interaction
between the maritime industry and the government, and come up with better policies
and regulations.
5.2 Establish Maritime Talents Training Centre
Hong Kong needs to set up its maritime talents pool by improving its maritime talents
training schemes. In particular, it is encouraged to establish partnerships between
ship operators and maritime training schools.
Students would be offered internship
opportunities to broaden their knowledge in the maritime industry. More campaigns
and promotions are necessary to increase public awareness. Meanwhile, it is
recommended to introduce some selective courses on ship finance, ship insurance and
maritime law at local universities.
Finally, the SAR government should be more
proactive in attracting overseas talents to by adopting preferential policies, such as
easy immigration policies and affordable rental housing.
As previously mentioned, many local students have little or no desire to become
crewmembers since they are not willing to leave their homes and families for
extended periods of time. Faced with this fact, the SAR government has launched a
number of initiatives, including offering maritime scholarships, sea-going training
incentive schemes, ship repair training incentive schemes, student exchange subsidies
and maritime internship subsidies, etc.
However, these policies have not turned out
to be most efficacious.
For instance, the process to become a crewman is not widely known among the
younger generations. Generally speaking, students of local middle school have three
paths to become professional crewmembers:
a) Hong Kong Polytechnic University,
b) Maritime Services Training Institute, and
c) Hong Kong Institute of Vocational Education in Tsing Yi.
92
Maritime Centre Report 2013
According to figures in Table 5.1, in 2006, there were a total of 194 graduates from
these three institutions. Unfortunately, only two graduates out of 29 from “Bachelor
of Science Degree / Bachelor of Business Administration Degree (with Honours) in
International Shipping and Transport Logistics,” finally became crewmembers.
Obviously, as things stand, the small size of the qualified talents pool in Hong Kong
could hardly satisfy local market demand. As a result, more crewmen need to be
trained locally, while tapping talents from foreign countries and mainland cities.
Table 5.1 Numbers of Students Pursuing Maritime-related Courses in 2006
No. of
Institute
Graduates
The Hong Kong Polytechnic University (HK PolyU) (Department of Logistics)
a.) Master of Science Degree / Postgraduate Diploma in International Shipping and
Transport Logistics
b.) Master of Philosophy Degree / Doctor of Philosophy Degree in Logistics
c.) Bachelor of Science Degree / Bachelor of Business Administration Degree (with
Honours) in International Shipping and Transport Logistics
d.) Higher Diploma in International Transport Logistics
34
N.A.
29
69
Maritime Services Training Institute (MSTI)
e.) Diploma in Maritime Studies
25
Hong Kong Institute of Vocational Education, Tsing Yi (IVE TY) (Department
of Engineering)
f.) Higher Diploma in Mechanical Engineering (* figures of the Transport
Technology Stream)
37
Source: Legislative Council Panel on Economic Services, Training to Meet the
Manpower Need in the Maritime Industry (23 April 2007)
In order to attract local young students and foreign talents, strategic partnerships
between foreign institutes and Hong Kong’s marine institutes and ship operators are
highly recommended.
First, local ship operators and marine institutes should enter into some bilateral
agreements to provide internship programs, career briefings and graduate
opportunities to students in the marine institutes.
Second, the SAR government should widen the scope of maritime related
scholarship programs available to local young students.
Third, joint programs in the maritime sector between Hong Kong’s institutes and
institutes in London and Europe are needed to strengthen local crews’ global
93
Maritime Centre Report 2013
networks, increasing Hong Kong’s awareness in attracting qualified overseas
talents.
Providing internship opportunities would enable students to learn more about the life
and work at sea.
Furthermore, it would afford them the opportunity to communicate
with the senior crewmen and managers, thereby deepening their industry knowledge.
The main purpose of the internships is to change their misunderstanding or negative
image of being crewmen.
Indeed, possessing sea-going experience gives students
significant advantages in their future career paths, especially in maritime services,
such as insurance, maritime finance, maritime arbitration and even the marine
department, etc.
Additionally, for those students who are not in maritime training institutes, they need
more information about the industry. The youth who want to become crewmen
outside maritime training institutes may lack relevant information. In fact, few
young people have any idea of a crewmember’s career path and attractive salary.
Generally speaking, a crewman’s beginning monthly salary is around HK$12,000, but
after certification and eight years of experience, he can expect HK$80,000 to
HK$100,000. This is much higher than the salary of many middle level managers.
Thus, the Maritime Awareness Week held by Hong Kong Maritime Industry Council
has to carry on, and more publications, promotional videos, and campaigns are needed
to further raise awareness.
Nevertheless, some business school students and law school students may also be
interested in the maritime sector and what they need are knowledgeable instructors
and elective maritime courses in universities. With intense competition in the
financial and law sectors, there are many more choices in maritime sector for these
students.
Though the Hong Kong Polytechnic University has established an
International Shipping and Transport Logistics department with both bachelor’s and
master’s degrees, there are few professors who are familiar with the maritime industry.
In order to strengthen college students’ understanding, programs to be coordinated by
Hong Kong universities or overseas universities are needed. Meanwhile, students
would be offered exchange programs at their partner universities.
By building a
global network, students, graduates and professors would be able to communicate
with one another and exchange opinions. This, to some extent, can help increase
Hong Kong’s international status.
94
Maritime Centre Report 2013
Last but not least, overseas promotion is also important since Hong Kong needs a
huge number of foreign talents. Nowadays, the SAR government has already
promoted its seaman training courses and maritime law courses in the mainland’s
maritime universities, and excellent students are able to get scholarship funding from
the SAR government.
These schemes have attracted many qualified mainland
students, but still few from overseas. Thus, such promotions and qualified talent
schemes are recommended to expand to more countries, such as the Philippines, India
and Pakistan, etc.
5.3 Interaction between Maritime and Other Services
Following the analysis on the experience of London in the past century as the global
maritime services centre, key lessons learnt lie in two closely correlated aspects.
First, persistently look for and develop a new competitive edge is essential for IMCs
to retain or upgrade their pre-eminent status.
Second the new competitive edge
comes from an IMC’s existing strength, in terms of geographical location, legal
system, business environment, talents supply, etc.
Directly competing with London for global market share in certain existing maritime
business services dominated by London, such as ship broking and marine insurance,
cannot be effectively accomplished, at least not in the short run. For instance, as
mentioned above, industry experts argue that the major functions of local marine
insurance representative office are broking the business between the local customers
and the London office, rather than taking over the business locally, and it is hard if not
impossible to challenge London’s traditional role as the global marine insurance
centre. Many challenges still persist in the local ship broking business, such as the
issue that big companies would rather set up their own broking departments to handle
the need for chartering and S&P.
Likewise, the absence in Hong Kong of an
exchange akin to London’s Baltic Exchange, which can represent all shipbrokers and
creates the market for all core participants such as shipbrokers, charterers, ship
owners, etc., means that the ship broking business ecology in Hong Kong is in a very
small circle where business is done through personal relationships rather than a
mature market system. This results in the dilemma that the business lacks new
talents, while the entry barrier is blocking the younger generation from moving in.
This situation happens more or less in other major maritime business services sectors
in Hong Kong.
95
Maritime Centre Report 2013
It is fair to argue the objective of Hong Kong’s strategic development plan in the
maritime services sectors is mainly to become a regional maritime services centre.
Therefore, it is other Asia Pacific IMCs like Singapore and Shanghai, not London, that
Hong Kong is competing with. From this point of view, the competition will be
straightforward – fighting for more major customers, such as ship owners, and
attracting more London-based businesses to set up their regional base locally, as is
happening today.
Singapore has strong government support; Shanghai has
government support and direct access to the mainland market; Hong Kong has the
free market environment, a simple tax system, an English law-like legal system, and
the proximity to the mainland market and, more importantly, and is one of the world’s
financial centres.
Major suggestions to the institutional arrangement on how the public sector can help
to create better and richer prospects for Hong Kong to become a regional maritime
business services centre have long been proposed. These suggestions are: attract,
retain and nurture talents; communicate, and cooperate better with the private sector;
strengthen Hong Kong’s representation (of both the public and the private sector) in
the UK and Europe81; and more double taxation agreements with countries key to
various elements of Hong Kong’s maritime industries. More practical suggestions in
specific services domains would follow, such as: set up a maritime exchange in Hong
Kong; develop an admiralty court to focus exclusively on maritime matters; set up
Hong Kong based P&I clubs; raise the standing and status of the Hong Kong Institute
of Insurance and strengthen Hong Kong’s existing influence on specialist areas of
marine insurance and; attract more ship owners to get financing in Hong Kong.
These are all valid, useful and effective suggestions that can practically help Hong
Kong to maintain and advance its pre-eminent status as an IMC in Asia Pacific.
5.3.1 Industry Chain Perspective
In addition to enhancing current maritime business services, seeking and developing a
more sustainable competitive edge, it is important for Hong Kong to have a broader
view.
London is able to become the world’s most important maritime centre without
significant maritime transportation or port businesses involved there simply because
It is noteworthy that although in the Global Financial Centres Index 9 (by Z/Yen Group), Hong
Kong is ranked at World’s No. 3 and very close to the top 2 centres, London and New York, in
terms of numerical sores, without counting the assessments from Asian subjects, the score
dropped dramatically, and European assessments on Hong Kong are not satisfactory.
81
96
Maritime Centre Report 2013
the maritime business services sectors, which by nature are offshore, are clustered
there. The synergy of these clusters can significantly reduce transaction costs82, such
the search costs for services providers, negotiation costs, and services assurance costs.
When all relevant mature maritime services are available in one city, searching for
services will be more cost effective, negotiations will be smoother as the market
would have set the rules, and similarly the assurance cost will be reduced. Such cost
effectiveness can be produced in Hong Kong with more competitiveness through the
industry chain of trade and transport.
Transportation services including maritime transportation serve and facilitate
international trade with its offshore nature, while all relevant maritime business
services serve and facilitate the maritime transportation. London’s advantages mainly
come from the synergy of decent maritime business services, which attracts core
maritime business participants to form the virtuous cycle of the growing market and
services providers. Hong Kong, on the other hand, is a major global trade centre and
has a widely recognised legal system, free market environment, and simple tax system.
Given such advantages, creating synergy of maritime business services is no longer the
only way for Hong Kong to maintain and upgrade its IMC status. Rather, integrating
the services provided to the entire industry chain of trade and transport becomes the
key.
5.3.1.1 The offshore trade
In recent years, offshore trade83 in Hong Kong has grown rapidly at a rate of more
than 10% per year (See Table 5.2).
The concept of transaction cost was first raised by Ronald Coase, the laureate of the 1991
Nobel Prize in Economics, and advanced into Transaction Cost Economics by his successor, Oliver
E. Williamson, the recipient of the 2009 Nobel Prize in Economics. “In order to carry out a market
transaction it is necessary to discover who it is that one wishes to deal with, to inform people
that one wishes to deal with and to what terms, to conduct negotiations leading up to a bargain,
to draw up the contract, to undertake the inspection needed to make sure that the terms of the
contract are being observed, and so on.” said Coase in “The Problem of Social Cost” in Journal of
Law and Economics in 1960.
83 Offshore trade refers to the transaction services provided by establishments operating in one
location while the buyers and sellers are outsiders and the goods involved never enter or leave
the location where the trade happens for better tax arrangements.
82
97
Maritime Centre Report 2013
Table 5.2 Analysis of export of services in trade 2002-200984
Gross
Year-on-year
Value of good Year-on-year
margin/Commission
(HK$ million)
% change
involved
(HK$ million)
% change
2002
103,004
12
1,458,252
-
2003
116,506
13.1
1,666,605
14.3
2004
132,200
13.5
1,835,839
10.2
2005
149,000
12.7
2,087,164
13.7
2006
165,749
11.2
2,346,470
12.4
2007
185,959
12.2
2,658,938
13.3
2008
204,053
9.7
3,362,819
33.7
2009
196,602
(3.7)
2,931,156
(10.8)
In 2009, Hong Kong earned HK$196.6 billion from offshore trade, which constituted
29.3% of the value of total exports of services, the estimated sales value of goods
involved in offshore transactions are more than HK$2,931 billion. The US and the
mainland China were the two major destinations in terms of offshore trade earnings,
accounting for 28% and 21.1%, respectively, of the gross margin/commission earned
in 200985.
Unsurprisingly, more than 50.5% of the goods involved in offshore trade
in 2009 originated from the mainland, and were valued at around HK$1,482.7 billion.
The huge amounts of value involved in offshore trade business require relevant
“offshore” transportation services.
It is easy to see from Figure 5.1 the close
relationship, nearly a perfect positive correlation86, between maritime transportation
services and offshore trade, even though the goods involved never enter or leave
Hong Kong.
The relationship could be explained with a simple assumption that
when trade happens, relevant transportation services are needed and people intend to
look for such offshore services nearby.
Ibid. from 2002 to 2009
Census and Statistics Department of HKSAR, Report on Hong Kong Trade in Services Statistics
for 2009
86 The correlation coefficients of the earnings and year on year change rate between offshore
trade and sea transport in export services are 0.984 and 0.962 respectively, which indicated the
strong linear positive relationship between the two sectors.
84
85
98
Maritime Centre Report 2013
Figure 5.1 Export of Services in Offshore Trade and Sea Transport87
It is as important, if not paramount, for Hong Kong to provide decent maritime
business services and create synergy from the services cluster. The reason is simple.
Unlike Singapore and London, Hong Kong, with its proximity to the mainland, makes
it a more attractive tax haven to the Chinese market. Put differently, “offshore” is
not purely offshore given the personal relationships and market proximity, which help
to reduce the cost for business search, services search, negotiation, and service quality
assurance costs.
5.3.1.2 Hinterland Logistics
To develop into an IMC, Hong Kong cannot treat maritime services sectors, from
downstream to upstream business services, as isolated from its industry chain and the
services network for that industry chain.
Take hinterland logistics as an example. Figure 5.2 shows a fundamental industry
flow of maritime logistics to facilitate international trade. High-end maritime
business services, such as ship broking, marine insurance, ship finance, maritime legal
services cover majority services needed for sea transportation.
However, maritime
transportation, if the ultimate objective is to facilitate the international trade, is not
limited to ships and sea transportation. The management, financial, and legal
services which are serving sea transportations are well-suited to serve the following
hinterland logistics, and even traders.
87
In addition, the management of the services
Ibid, from 2002-2009.
99
Maritime Centre Report 2013
provided to the up and down stream of the maritime logistic supply chain will be itself
a service to sea transportations, as it is similar to existing maritime business services.
It can be argued that the hinterland logistics business and trading services e.g.,
logistics finance, hinterland logistics broking, hinterland logistics sub-insurance, trade
finance, trade consultancy, etc., are maritime services. Nonetheless, as they are in
the same industry chain, the synergy emerging from the cluster of services chain will
be as powerful as the synergy of maritime business services clustering.
is happening in London.
Such is what
As mentioned above, compared with London and
Singapore, the major advantage that Hong Kong has is that the maritime
transportation industry is not entirely offshore from the world’s trade centre. Hong
Kong is close to China, connected with Shenzhen, and with the high-speed railway it
is only two hours away from Guangdong and its neighbouring provinces.
Figure 5.2 Maritime Logistics and Intermodal Supply Chain88
Maritime Business
Trader
Trader
Utilising and expanding the existing pre-eminent status of international maritime,
trading, and financial centre, much more services can be created to cover the business
needs in hinterland logistics, no matter whether or not they are offshore services.
A
simple example is that currently a port cluster is showing up in South China,
88
John J. Liu, Supply Chain Management and Transport Logistics, 1st ed., Routledge, 2012
100
Maritime Centre Report 2013
especially in the Pearl River Delta, 10-plus ports are clustering within a few hundred
square miles, some of which have been regarded as major competitors to Hong Kong.
To look at it from a different angle, it is also a fresh opportunity for Hong Kong to
provide more offshore services to the offshore trade, as well as to hinterland logistics
in China, such as financial services.
Especially under the Closer Economic
Partnership Arrangement (CEPA), Hong Kong’s service providers have been allowed
to set up such logistics business in the mainland89, which enhances such opportunities
by creating more and deeper links among all transportation related industries.
5.3.1.3 Pricing Services
In addition to hinterland logistics, providing pricing services is another important
factor attracting business. Currently, BDI is the only world-wide recognised index
that reflects freight rate, but its mechanism of freight rate determination is criticised
by experts. “It is unreasonable to quote a price thousands of miles away, when most
trades are happening here”, said one expert.
In addition, a freight rate index of only
dry bulk carriers will not be sufficient for the entire maritime transportation industry.
Containerisation has significantly increased the efficiency of moving traditional
break-bulk cargoes, reducing shipping time by 84% and costs by 35%90. In 2009, an
estimated 125 million TEU or 1.19 billion metric tonnes worth of cargo -- almost one
quarter of the world's dry cargo -- was shipped by container91. At present, the freight
rate index of container ships is under study, which Shanghai has pioneered by issuing
the Shanghai Containerised Freight Index (SCFI). The influence of the index is
limited by many factors, such as the legal system, the language, and so forth.
Hong
Kong, similar to Shanghai, is one of the world’s largest container ports in terms of
TEUs and close to the mainland market, and enjoys the advantages that Shanghai
lacks. In other words, Hong Kong is in a better position to provide such pricing
services.
By providing pricing services of freight rates comparable to BDI, Hong Kong can
attract many more core industry participants, as the index provided here would be
closer to where trade happens.
Hence, this would be a more direct and accurate
Logistics
Services
Liberalization
Measures
under
CEPA,
http://www.tid.gov.hk/english/cepa/tradeservices/log_liberalization.html
90 Bohlman, Michael T. (September 2001) "ISO's container standards are nothing but good news"
ISO Bulletin (Geneva: International Standards Organisation): 12–15.
91 United Nations Conference on Trade and Development (UNCTAD), Review of Maritime
Transport, 2010
89
101
Maritime Centre Report 2013
reflection of the supply and demand for international goods shipping, and thus of the
trend of international trade.
In addition to freight rate pricing services, a lot of other similar services can be
provided in Hong Kong, such as maritime emissions pricing.
The European Union
is actively engaged in pursuing an international agreement on global measures to
reduce greenhouse gas emissions from international maritime transport. There is a
commitment from the EU to include these emissions into the existing EU reduction
commitment.
In this regard, the European Commission is considering possible
European action in 201292. This presents a challenge -- as well as an opportunity -for Hong Kong’s maritime industry. It is inevitable the maritime industry will be
included in global greenhouse gas reduction scheme.
The pricing services for
carbon emission in the maritime industry are yet unexplored.
5.3.2 Financial Services under RMB Globalization
In the maritime world, financial services centre on the vessel, like ship finance, and
the freight rates, like forward freight agreement. Due to the high volatility of the
business, ship finance usually involves high risks, while the return is relatively
inadequate.
Bank loans are the primary financing in Hong Kong.
Most banks
amongst the few providing such services will make such loans to “good” customers,
defined by the size of the business and quality of charter parties and a sound credit
history. The credit crunch has made such services increasingly difficult to acquire.
Besides the direct bank loan, alternative loan products, such as “owner financing” or
“alternative financing” are now more and more popular for the sake of both parties, as
they reduce the risk of bad debt and help the business run internationally. In Hong
Kong, such lease-to-own or lease-to-purchase arrangements are not being provided on
a regular base.
However, even with such flexible loan arrangements, the value of the vessel, which is
the key security for any type of bank loan, plunged continuously by more than 20%
from 2008 to 201093. Additionally, with booming ship building in 2010, the entire
maritime industry is, and will be, facing an overcapacity problem for quite some time,
increasing the risks involved in the bank loan-oriented ship finance sector. It is
therefore imperative to encourage the growth of alternative financing. In order to
Reducing
emissions
from
the
shipping
sector,
http://ec.europa.eu/clima/policies/transport/shipping/index_en.htm
93 United Nations Conference on Trade and Development (UNCTAD), Review of Maritime
Transport, 2010
92
102
Maritime Centre Report 2013
create more diversity in ship finance, the maritime centre should fully cooperate with
the mature and world-renowned financial centre it shares the city with. Attracting
more mainland ship owners / companies to issue shares or bonds in Hong Kong
market could be a good start to boost the ship finance diversity in Hong Kong.
The
recently promulgated “Notice on Cross-border Renminbi Foreign Direct Investment”
by the Ministry of Commerce and the “Renminbi Foreign Direct Investment (FDI)
Settlement Rules” by the People's Bank of China makes it more attractive for
mainland businesses to raise CNH in Hong Kong through the public market at lower
costs.
As Hong Kong is currently the only extensive RMB offshore centre in the world, the
financial services regarding CNH (RMB traded on the Hong Kong market) have not
been fully explored, especially in the maritime sectors.
Renminbi deposits in Hong
Kong went up 3.4% to 572.2 billion yuan at the end of July 2011 94 . The
RMB-denominated bond market in Hong Kong is around RMB200 billion and, when
compared with 2009 and 2010 yearend figures, around RMB38 billion and RMB68
billion95, respectively, the increasing rate is considerably high.
However, around a
96
mere RMB57 billion is issued by the non-financial corporates . Compared with the
supplies, there is still room for Dim Sum bonds to grow. The concern for CNH
equity market mainly arises from the lack of liquidity support of RMB in local market.
Figure 5.3 shows the RMB-denominated trade settlements in recent years.
Kong has dominated the market with 80% of market share.
94
95
96
Hong Kong’s Information Services Department.
Bloomberg
Ibid.
103
Hong
Maritime Centre Report 2013
97
Figure 5.3 Estimated CNH trade settlement
During his brief visit in Hong Kong, Vice-Premier of the State Council Li Keqiang
announced a series of measures to support the further development of Hong Kong as
the offshore Renminbi business centre.
The latest measures include the further
expansion of the RMB trade settlement scheme, support for the use of RMB for
foreign direct investments in the mainland, and an expanded issuance of RMB bonds
in Hong Kong by mainland entities, including financial institutions and corporations.
With such a distinguished position, Hong Kong’s pre-eminent IMC status could be
greatly enhanced. With the expansion of FDI and the emergence of China in various
sectors of the maritime industry, there will be more companies in the maritime
industrial supply chain to take the Hong Kong market as a main source of RMB
financing. To encourage this trend, closer collaboration with the mainland to
promote the globalisation of offshore RMB is essential.
Encouraging the
RMB-denominated trade settlement in maritime transportation is one of the most
direct effective means to promote RMB globalization and will demand multiple
correlated financial innovations, such as the RMB trade finance, products to support
CNH foreign exchange transactions, enhancement of RMB liquidity, and the foreign
third-party CNH usage.
97
Source From: Credit Agricole CIB, Hong Kong Branch, Hong Kong’s CNH Market
104
Maritime Centre Report 2013
5.4 Development of Trade with ASEAN countries
5.4.1 Overall Trading with ASEAN Countries
In 2010, ASEAN countries economy grew at an exceptionally high rate of more than
6%.
Despite Europe’s sovereign debt crisis, in January 2012 the IMF still forecast a
GDP growth of 5.6% for the ASEAN’s biggest five nations (ASEAN 5) in 2012 and
2013, while the world economic growth forecast for 2012 was just 3.3%.
ASEAN countries currently play a significant role in Hong Kong’s trade.
Back in
2006, total trade between Hong Kong and ASEAN countries was still below the trade
between Hong Kong and the US and the European Union. However, this trend has
changed in recent years.
than the US.
Since 2007, ASEAN has become a bigger trading partner
Since 2010, ASEAN has even overtaken the European Union.
Therefore, we should not underestimate the importance of ASEAN countries to Hong
Kong.
Table 5.3 Total Trade between Major Trading Regions 2006-2011 (HK$ Million)
Region
2011
China
2010
2009
2008
2007
2006
3,444,162 3,127,973
2,512,623
2,781,180
2,637,984
2,349,162
ASEAN
726,555
663,151
509,274
578,663
549,609
483,103
EU
663,356
586,498
517,017
614,835
568,325
533,593
North
580,867
547,369
459,225
549,466
544,980
532,857
America
5.4.2 Join the ASEAN-China Free Trade Area (ACFTA) agreement
The agreement between ASEAN and the mainland creates the largest regional trade
agreement, serving a population of nearly 1.9 billion.
This agreement facilitates the
free trade between the mainland and ASEAN by eliminating the tariff barrier between
ASEAN and China.
The advantages of entering the agreement are twofold.
105
Maritime Centre Report 2013
First, should Hong Kong not promptly join the agreement, Hong Kong’s domestic
exports to ASEAN countries may be disadvantaged as tariffs are now removed for
goods exported from the mainland.
Second, it will reduce the effect of CEPA, and Hong Kong local re-exporters or
traders will have more difficulties entering the ASEAN market. If goods are made
in Hong Kong, then they cannot enter ASEAN countries tariff-free, although they can
enter the mainland market without tariff.
However, if local re-exporters set up in the
mainland, then they can enjoy trade with ASEAN countries free of tariff.
Currently,
there is a third-party invoicing arrangement that allows Hong Kong wholesalers to
enjoy this agreement if they can produce a Certificate of Origin (CO) to certify that
the goods are from the mainland or ASEAN countries.
However, it will reduce
Hong Kong’s flexibility as Hong Kong can alter the goods and create additional
operational costs during the re-export process. Hong Kong must enter the ACFTA
to clear the uncertainties involved and maintain Hong Kong’s position in the re-export
trade.
5.4.3 Speed up Ratification of Dual Tax Agreements
Out of the 10 ASEAN countries, Malaysia, the Philippines, Cambodia and Myanmar
still have not signed any Dual Tax Agreements (DTA) with Hong Kong. Indonesia
and Laos (air only) agreements are still pending to be signed. As for Singapore, the
DTA signed was only for air and shipment and is not a full DTA. The SAR
government must rapidly secure DTAs with the unsigned parties to encourage more
bilateral trade between ASEAN and Hong Kong, or it will lose the competitive
advantage as the ASEAN countries build more relationships with one another during
their impending period of fastest growth.
5.5 Sign DTA with Major Trading Partners
Although ASEAN and the mainland are the major trading partners Hong Kong must
keep on engaging with, the existing major trading partners should also be kept in
mind.
DTA is a very effective tool in encouraging bilateral trade.
Below appears
the comparison between Hong Kong’s and Singapore’s DTA status with Hong
Kong’s top 20 trading partners.
106
Maritime Centre Report 2013
Table 5.4 Hong Kong’s Top 20 Major Trading Partners in 2011 and DTA Status
Country
Total Trade
DTA status with Hong DTA status with
Volume (HK$ MN) Kong
Singapore
(Yes means full DTA)
China
3,444,162.2
Yes
Yes
USA
542,139.9
Only Shipping
Both Air and Shipping
Japan
453,755.9
Yes
Yes
Taiwan
326,186.2
No
Yes
Singapore
310,799.5
Both Air and Shipping N/A
Korea
211,242.9
No
Yes – pending to sign
India
180,121.2
No
Yes
Germany
154,952.3
Both Air and Shipping Yes
Thailand
119,056.2
Yes
Yes
Malaysia
117,617.3
No
Yes
UK
107,825.5
Yes
Yes
Switzerland
104,191.1
Yes – pending to sign
Yes – pending to sign
France
81,367.3
Yes
Yes
Italy
75,063.6
No
Yes – pending to sign
Vietnam
65,729.5
Yes
Yes
Netherlands
64,002.8
Yes
Yes
Philippines
60,982.4
No
Yes
Australia
60,844.6
No
Yes
U.A.E
53,506.3
No
Yes
Belgium
49,831.6
Yes
Yes – pending to sign
107
Maritime Centre Report 2013
It is very clear with its current top 20 trading partners, Hong Kong lags far behind
Singapore in obtaining DTAs. Securing additional DTAs with the major trading
partners would most likely foster bilateral economic and trading activities and
encourage more countries to set up companies or regional offices here.
5.6 Provide Tax Incentives and Exemptions
From Section 4.5, one of the key lessons from Singapore is that its government has
provided various tax incentives and tax exemption schemes to encourage the
development of IMC by attracting companies to set up their offices there. During
our interviews, many maritime professionals voiced that concern that the Singapore
government has offered many maritime companies favourable policies that clearly
give it advantages over Hong Kong.
As discussed in Section 4.5.1, Singapore
provides a raft of tax exemptions and financial support schemes to attract marine
business, many of which have been recently revised and are expected to continue for a
long time.
The SAR government needs to formulate effective counter-measures by
providing tax incentives or exemption schemes in the critical sectors so as to retain
businesses.
5.7 Maritime Arbitration – Admiralty Court and Facilities
Given its excellent legal infrastructure and worldwide reputation, Hong Kong is well
positioned to develop itself into a regional maritime arbitration centre. Here are our
recommendations:
Actively participate to facilitate enforcement in India of awards by Hong Kong.
Establish an admiralty court.
Clarify with the Supreme People's Court in China (最高人民法院) whether or
not domestic disputes between mainland companies can be arbitrated here.
If
permitted, this would boost the local arbitration market, while the mainland’s
standards of arbitration may improve. And this should be included in a CEPA
agreement.
Support the Hong Kong Arbitral Institution in establishing branch offices in
major mainland cities in order to promote and facilitate communication amongst
arbitration organisations across the border.
Upgrade the current facilities of the HKIAC to house all related institutions and
professionals under one roof.
108
Maritime Centre Report 2013
Consider launching of the “Form”, modelled after the Singapore Sale Form
(“SSF”). In 2011, Singapore launched the SSF, a new ship sale form designed
to tackle problems currently faced by buyers and sellers and enhance current ship
trade practices and procedures.
This makes Singapore the default seat of
arbitration in the event that disputes arise out of a transaction.
SSF’s Clause 15
provides that any disputes are to be submitted for arbitration in Singapore in
accordance with the SCMA Rules, modelled on the London Maritime
Arbitrators’ Association rules.
Review work permit requirements for non-resident arbitrators and consider a tax
incentive similar to Singapore’s.
5.8 The Need for Logistics and Distribution Centre to Facilitate on-shore Cargo
Flow
Hong Kong has a world-class airport and a world-class container terminal.
To
leverage this strength, there is need for further development of a multi-modal
transport network so as to creating synergy with our infrastructure and efficient land
transportation links with the mainland. This facilitate more on-shore flow of cargo,
inventory management and distribution activities, adding a competitive edge to Hong
Kong as an IMC.
Here are our recommendations:
Provide land to build a world-class logistics, distribution and storage centre near
HKIA. For high-valued goods, which commonly use air as a transport mode,
distribution efficiency at low costs is very important. The SAR government’s
land subsidy to build a world-class logistics and distribution centre to connect air,
land and ocean transport seamlessly will be the key to encouraging on-shore cargo
flow and reinforce Hong Kong’s role as cargo distribution hub in south China.
Include courier service in the coming CEPA enhancement with the goal of
lowering the operating costs of the many local courier service companies. This
will increase Hong Kong’s distribution and logistics capability as a whole in
support of the development in south China.
5.9 The Way to Home-port Cruise Centre
With the new cruise terminal to be opened in 2013, Hong Kong is determined to
compete with other Asian cities in getting a slice of the quickly expanding cruise
market.
We believe hardware improvement is definitely an important right step
109
Maritime Centre Report 2013
toward this vision.
In addition, we recommend that Hong Kong develop the
following in order to fully realise the potential of the new terminal:
Issue one-time visas to cruise travellers.
home-port for regional cruises.
Co-operate more with southern mainland cities in developing regional itineraries
to strengthen our competitiveness within Asia. In addition to opening a new
cruise berth, the SAR government should also hasten development in East
This will make Hong Kong the ideal
Kowloon of more amenities, such as dining, shopping, hotels and land
transportation, making it more attractive for arriving cruise passengers.
5.10 Create a Better Business Environment for Marine Insurance
Marine insurance differs from other types of insurance in that it is by nature
international, and thus subject to international competition.
The flip side of this coin
is that marine insurance risk in other parts of the world can be underwritten here,
provided that Hong Kong creates an attractive enough environment for insurance
companies to set up offices.
To this end, we recommend the SAR government:
Provide tax exemptions, as Singapore currently does, for offshore marine
insurance businesses, to encourage companies to set up offices here
Enhance the immigration policy to encourage insurance and reinsurance
professionals to work here so as to facilitate the establishment of regional head
offices
110
Maritime Centre Report 2013
6. Acknowledgements
This report was made possible by the contributions of many parties. Numerous
practitioners from the insurance, logistics, shipping, tourism industries gave us their
unstinting support.
We specifically extend our gratitude to the following people for
generously sharing with us their views and providing valuable input:
-
Mr. Alvin Chan, Regional Marine Officer of Starr International Insurance (Asia)
-
Ltd;
Ms. Winnie Chan, Senior Administration Officer of Tourism Commission;
-
Mr. Yiu Kei Chan, Ex-Chairman, Institute of Chartered Shipbrokers, Hong Kong
Branch;
-
Mr. David Cheng, Chairman & CEO of Credit Agricole Asia Shipfinance
Limited/ Hong Kong Maritime Industry Council;
-
Mr. Ronnie Ho, Chairman of Jetour Holding Limited;
-
Mr. Peter Lau, Claims Director of Thomas Miller (Hong Kong) Ltd.;
-
Mr. Edward Lee, Managing Director of Steamship Mutual Management (Hong
Kong) Ltd.;
-
Mr. Timothy Lee, Underwriter of CATLIN Hong Kong;
-
Dr. Kelvin Leung, CEO of North Asia-Pacific, DHL Global Forwarding;
-
Mr. M.H. Liang, Chairman of Island Navigation Corporation Int'l Ltd;
Mr. Jun Ma, Managing Director of Deutshe Bank, Head of China and Hong
Kong Strategy;
-
Mr. Kaixiang Mo, CFO of HNA-Aviation Capital HK;
-
Mr. Gray Ng, Chairman of Hong Kong Courier Association;
Mr. Lawrence Ni, Deputy General Manager of China Merchants Holdings
International;
-
Mr. Tommy Poon, Manager of Tourism Commission;
-
Mr. Kai, Tang, Crew Manager of Sinotrans Ship Management Limited (Hong
Kong);
-
Mr. Frank Tso, Founder and Senior Chairman of IMC Group;
-
Mr. Roger F Tupper, Former Director of Marine Department;
-
Mr. Chunlin Wang, Executive Director of Pacific Basin Shipping Ltd.;
111
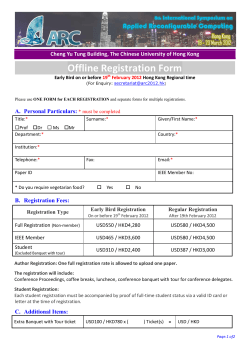


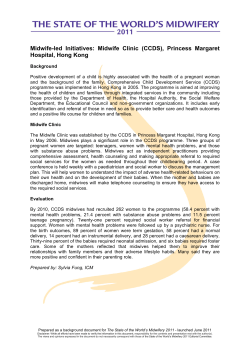


© Copyright 2026