
www.ssoar.info How to measure the deterrence effects of merger policy:
www.ssoar.info
How to measure the deterrence effects of merger policy:
frequency or composition?
Barros, Pedro P.; Clougherty, Joseph A.; Seldeslachts, Jo
Arbeitspapier / working paper
Zur Verfügung gestellt in Kooperation mit / provided in cooperation with:
SSG Sozialwissenschaften, USB Köln
Empfohlene Zitierung / Suggested Citation:
Barros, Pedro P. ; Clougherty, Joseph A. ; Seldeslachts, Jo ; Wissenschaftszentrum Berlin für Sozialforschung gGmbH (Ed.):
How to measure the deterrence effects of merger policy: frequency or composition?. Berlin, 2009 (Discussion Papers /
Wissenschaftszentrum Berlin für Sozialforschung, Forschungsschwerpunkt Märkte und Politik, Forschungsgruppe Wettbewerb und
Innovation 2009-13). URN: http://nbn-resolving.de/http://hdl.handle.net/10419/51207
Nutzungsbedingungen:
Dieser Text wird unter einer Deposit-Lizenz (Keine Weiterverbreitung
- keine Bearbeitung) zur Verfügung gestellt. Gewährt wird ein
nicht exklusives, nicht übertragbares, persönliches und beschränktes
Recht auf Nutzung dieses Dokuments. Dieses Dokument ist
ausschließlich für den persönlichen, nicht-kommerziellen Gebrauch
bestimmt. Auf sämtlichen Kopien dieses Dokuments müssen alle
Urheberrechtshinweise und sonstigen Hinweise auf gesetzlichen Schutz
beibehalten werden. Sie dürfen dieses Dokument nicht in irgendeiner
Weise abändern, noch dürfen Sie dieses Dokument für öffentliche oder
kommerzielle Zwecke vervielfältigen, öffentlich ausstellen, aufführen,
vertreiben oder anderweitig nutzen.
Mit der Verwendung dieses Dokuments erkennen Sie die
Nutzungsbedingungen an.
Terms of use:
This document is made available under Deposit Licence (No
Redistribution - no modifications). We grant a non-exclusive, nontransferable, individual and limited right to using this document. This
document is solely intended for your personal, non-commercial use. All
of the copies of this documents must retain all copyright information
and other information regarding legal protection. You are not allowed
to alter this document in any way, to copy it for public or commercial
purposes, to exhibit the document in public, to perform, distribute or
otherwise use the document in public.
By using this particular document, you accept the above-stated
conditions of use.
WISSENSCHAFTSZENTRUM BERLIN
FÜR SOZIALFORSCHUNG
SOCIAL SCIENCE RESEARCH
CENTER BERLIN
Paolo Buccirossi *
Lorenzo Ciari **
Tomaso Duso ***
Giancarlo Spagnolo ****
Cristiana Vitale *
Competition policy and productivity growth:
An empirical assessment
* LEAR
** EUI & LEAR
*** Humboldt University and the WZB
**** University of Rome Tor Vergata,
SITE, EIEF, CEPR
SP II 2009 – 12
October 2009
ISSN Nr. 0722 – 6748
Research Area
Markets and Politics
Schwerpunkt II
Märkte und Politik
Research Group
Competition and Innovation
Forschungs Gruppe
Wettbewerb und innovation
Zitierweise/Citation:
Paolo Buccirossi, Lorenzo Ciari, Tomaso Duso, Giancarlo Spagnolo,
Cristiana Vitale, Competition policy and productivity growth: An
empirical assessment, Discussion Paper SP II 2009 – 12,
Wissenschaftszentrum Berlin, 2009.
Wissenschaftszentrum Berlin für Sozialforschung gGmbH,
Reichpietschufer 50, 10785 Berlin, Germany, Tel. (030) 2 54 91 – 0
Internet: www.wzb.eu
ii
ABSTRACT
Competition policy and productivity growth: An empirical assessment *
by Paolo Buccirossi, Lorenzo Ciari, Tomaso Duso, Giancarlo Spagnolo,
Cristiana Vitale
This paper empirically investigates the effectiveness of competition policy by
estimating its impact on Total Factor Productivity (TFP) growth for 22 industries
in 12 OECD countries over the period 1995-2005. We find a robust positive and
significant effect of competition policy as measured by newly created indexes.
We provide several arguments and results based on instrumental variables
estimators as well as non-linearities, to support the claim that the established
link can be interpreted in a causal way. At a disaggregated level, the effect on
TFP growth is particularly strong for specific aspects of competition policy
related to its institutional set up and antitrust activities (rather than merger
control). The effect is strengthened by a good legal system, suggesting
complementarities between competition policy and the efficiency of law
enforcement institutions.
Keywords: Competition Policy, Productivity Growth, Institutions, Deterrence, OECD
JEL Classification: L4, K21, O4, C23
*
This paper is based on a research project we undertook for the Directorate General for
Economic and Financial Affairs of the European Commission, with the support of the
Directorate General for Competition. We are indebted to Jonathan Baker, Simon Bishop, Pascal
Courty, Robert Crandall, Adriaan Dierx, Fabienne Ilzkovitz, Bruce Lyons, Klaus Gugler,
Giovanni Mastrobuoni, Roderick Meiklejohn, Francesco Montaruli, Elisabeth Mueller, Damien
Neven, Susanne Prantl, Marc Roberts, Lars-Hendrik Röller, Jennifer Rontganger, Salmai Qari,
and Matt Weinberg for useful discussions and suggestions on various drafts of this paper. We
are also grateful to participants at the WZB Conference on ”Deterrence in Competition Policy”,
the ACLE conference on ”To Enforce and Comply”, the SFB conference 2009, the 3rd Lear
Conference on the Economics of Competition Law, the EARIE Conference 2009, and seminar
participants at the DIW Berlin and EUI for their comments. Gianmarco Calanchi, Bas Dessens,
Claudia Pollio, and Constanze Quade provided excellent research assistance in the building of
the database. Tomaso Duso gratefully acknowledges financial support from the Deutsche
Forschungsgemeinschaft through SFB/TR 15.
iii
ZUSAMMENFASSUNG
Wettbewerbspolitik
Bewertung
und
Produktivitätswachstum:
Eine
empirische
In diesem Beitrag untersuchen wir die Effektivität von Wettbewerbspolitik
anhand der empirischen Schätzung ihrer Auswirkung auf das totale
Faktorproduktivitätswachstum (TFP) für 22 Branchen in 12 OECD-Ländern über
den Zeitraum 1995-2005. Wir finden eine robuste positive und statistisch
signifikante Wirkung der Wettbewerbspolitik, welche von neu erstellten Indizes
gemessen wird. Wir präsentieren unterschiedliche Argumente und Ergebnisse
basierend auf Instrumental-Variablen Schätzern sowie Nichtlinearitäten, um den
geschätzten Zusammenhang als kausal interpretieren zu können. Auf einer
disaggregierten Ebene aufgeschlüsselt ist die Auswirkung auf das TFPWachstum besonders stark für spezifische Aspekte der Wettbewerbspolitik,
welche eher mit deren institutionellen Aufbau und kartellrechtlichen Tätigkeiten
in Zusammenhang stehen als mit der Fusionskontrolle. Wir zeigen, dass der
gemessene Effekt durch gute Rechtssysteme gestärkt wird, was auf
Komplementaritäten zwischen Wettbewerbspolitik und der Effizienz der Justiz
hindeutet.
iv
1
Introduction
The aim of this paper is to assess the effectiveness of competition policy in providing higher
welfare to the society thanks to improved efficiency and productivity. 1 While most economists,
starting from Adam Smith, agree that competition works in the general interest, there is no such
consensus on the ability of competition policy to be socially beneficial. Some economists, dating
back to the ”Austrian School” (e.g. Von Mises, 1940), argue that any state intervention that
interferes with free markets will make society worse off. According to them, competition policy
is not an exception, even though its aim is to safeguard effective competition.
More recently, Crandall and Winston (2003) claimed that, at least in the US, antitrust law
has been ineffective. They maintain that its poor performance is mostly due to the difficulty
of distinguishing genuine and healthy competition from anti-competitive behaviors (in all areas of competition law) and to the undervalued power of the markets to curb anti-competitive
abuses. They do not ask for a repeal of antitrust law, but urge applying it only for blatant
price-fixing and merger to monopoly. Baker (2003) and Werden (2003) disagreed with Crandall
and Winston’s point of view. They argue that the net effect of competition policy on social
welfare is positive. In their opinion, competition policy improves social welfare by also (or
mostly) inducing firms to forgo anti-competitive behaviors without an explicit intervention of
any competition authority, i.e. by deterring them. The debate appears still to be unsettled. As
noted by Whinston (2006), even in the most established area of competition policy, cartel deterrence, ’strong’ empirical evidence on the actual effects of the practices forbidden by antitrust
laws (e.g. competitors communicating on prices) and of active antitrust law enforcement on
social welfare is still missing.
This paper is an attempt to provide ’strong’ empirical evidence, at least with respect to the
effectiveness of the application of competition law in general. In order to do so, we estimate
the impact of competition policy and some of its components on total factor productivity (TFP)
growth on a sample of 22 industries in 12 OECD countries over the period 1995-2005. To mea1 By
competition policy we mean the set of prohibitions and obligations that forms the substantive rules of competition (or antitrust) law together with the array of tools available to competition authorities for policing and
punishing any violation of the same rules.
2
sure competition policy, we identify a set of its institutional and enforcement features that we
consider to be key in deterring anti-competitive behavior. We then aggregate these variables
to form a set of summary indicators, the Competition Policy Indicators (CPIs). We generate an
Aggregate CPI that summarizes all the key features of the competition policy of a country, as
well as more disaggregated ones that refer only to the features of competition policy relative to
specific behaviors (i.e. cartels, other competitive agreements and abuses of dominance - collectively referred to as ’antitrust’ - and mergers), or only to the ’institutional’ or the ’enforcement’
features of a competition policy.
In all specifications of our model, we control for country-industry and time-fixed effects,
product market regulation, trade liberalization, and other likely determinants of productivity
growth, and we find that the Aggregate CPI has a positive and highly significant effect on TFP
growth. When we use the more disaggregated CPIs, separating the effects of the institutional
and enforcement features, and distinguishing between mergers and antitrust, we find positive
and significant coefficients estimates for all these indicators, though institutions and antitrust
appear to have the strongest and a more significant impact on productivity growth. For the
Aggregate CPI we find the same result both when we estimate the model by OLS, as well as
in alternative IV specifications, which use either some political variables or the competition
policy in other countries as instruments for the policy. In addition to the IV estimation, our
identification strategy exploits the possible non-linearities in the effectiveness of competition
policy on TFP growth. Competition policy should be more effective in countries with better
legal institutions as well as in industries where no other sector-specific authorities are in charge
of regulating the competitive processes.
The interaction between competition policy and institutions is not only part of our identification strategy. Indeed, competition policy does not work in isolation. Our CPIs describe some
internal features of competition policy. However, the effectiveness of competition policy is also
likely to depend on external factors: the quality of a country’s institutions in general, and of its
judicial system, in particular. These external factors may matter for two main reasons. First, the
general quality of the institutions of a country creates an environment that affects the effectiveness of all public policies. In a context where public bodies in general are effective and efficient,
3
the bodies that preside over the enforcement of competition law also tend to be effective and
efficient. Hence, if we do not control for institutions, the CPIs might capture some features
that, instead, are a reflection of these more general factors. Second, inherent complementarities between competition policy and the judicial system might exist, as the enforcement of the
policy is often done by the courts directly or in appeal. For these reasons the courts, and the
legal system in general, may play an important role in determining the deterrence properties
of a competition policy regime.
When we add the dimension of the quality of the institutions to our estimate, we observe
that there are both direct effects of institutions on TFP growth and complementarities between
them and our measures of competition policy. Indeed, we find that the effects of competition policy are strengthened in countries where the cost of enforcing contracts are low and the
quality of the legal system is high, suggesting sizable institutional complementarities between
competition policy and the efficiency of legal institutions. These results suggest that competition policy contributes to the social welfare, especially in those countries where it is coupled
with efficient and effective institutions.
The remainder of the paper is organized as follows. In Section 2 we briefly provide the
theoretical background of our empirical research and relate our paper to the relevant literature.
Section 3 presents and discusses our empirical model and the identification strategy. Section 4
presents the data we use, the CPIs and how they have been built, and the political variables we
use as instruments in the policy equation. Section 5 discusses our results and performs some
robustness checks. Section 6 briefly concludes.
2
Theoretical background and literature review
Competition policy aims to enhance social welfare by deterring anti-competitive behaviors.
Therefore, the causal link between competition policy and efficiency goes through the impact
of the former on market competition. Competition can foster efficiency through three mechanisms: 1) it presses managers to reduce x-inefficiency (Hicks 1935, Leibenstein, 1966) (within
4
firm effect);2 2) through changes in market shares and entry/exit, it reallocates resources towards the most productive forms and sectors (between firm effect);3 3) it can provide firms
with an incentive to innovate, through the determination of economic rents.4 To measure these
different and interacting efficiencies we use total factor productivity (TFP) growth, which measures increases in the amount of output that can be produced with a given amount of inputs
(Inklaar et al., 2008).5
As we already mentioned, to better understand under which circumstances competition
policy works and make more robust inference on its effectiveness, we must recognize that it is
embedded in a wider and interconnected system of institutions and policies that might present
inherent complementarities (Aghion and Howitt, 2006). In our context, legal institutions stand
out as particularly relevant, since the enforcement of competition law is intimately linked to
the functioning of the judiciary system for the following reasons: i) competition law is enforced by public bodies and by private firms and individuals who can bring suits in courts for
alleged anti-competitive conducts; ii) in some jurisdictions the competition authority can only
challenge a conduct or a merger before a court; iii) even in those jurisdictions where the competition authority acts as an ’adjudicator’, its decisions are subject to judicial review, so that
courts have the last say on all competition policy interventions.
The interaction between a country’s legal rules and economic activities has recently attracted a large interest following the path breaking work by La Porta et al. (1997, 1998) arguing
that legal traditions spread around through conquests and colonization and shaped the subsequent evolution of legal and regulatory institutions. It has been shown that legal origins affect
2 This point is made theoretically by Nalebuff and Stiglitz (1983), and Vickers (1995).
Nickell et al. (1997), Griffith
(2001) and Bloom and Van Reenen (2006) provide empirical evidence of a positive relationship between competition
and x-efficiency.
3 Haskel (2000) provides empirical evidence of this selection process. Disney et al. (2003) and Syverson (2004)
show that competition reduces productivity dispersion suggesting that inefficient firms are forced to either catch-up
or to exit.
4 The relationship between competition and innovation may be non-monotone (Aghion et al., 2004, 2005, 2009).
However, the empirical evidence supporting these theoretical considerations is not univocal. Nickel (1996) and
Blundell et al. (1995, 1999) find a positive relationship between competition and innovative activity at the industry
level. Aghion et al. (2005) present evidence that supports the existence of a bell-shaped relationship between
competition and innovation at the firm level.
5 While under strict neoclassical assumptions, TFP measures disembodied technical change, in practice it includes a range of other effects including those from organizational and institutional change, from changes in returns to scale, and from unmeasured inputs such as research and development and other intangible investments.
Moreover, when using industry-level data, TFP reflects also the effects of reallocation of market shares across firms.
5
many other dimensions including bank ownership (La Porta et al. 2002), entry regulations
(Djankov et al. 2002), labor market regulation (Botero et al. 2004), and government ownership
of the media (Djankov et al. 2003a). Some studies also looked at how the characteristics of the
judiciary and other government institutions affect the security of property rights and contract
enforcement (Djankov et al., 2003b; La Porta et al., 2008).
On the basis of the results by Djankov et al. (2003a) and La Porta et al. (2004) we expect that
a lower level of formalism of the judicial procedures and greater judicial independence should
improve the quality of the judicial review of the decisions made by competition authorities.
Hence we will focus on several indicators of legal origin and the quality of the judiciary system
and look at how they interact with competition policy. In checking for the role of complementarities between the quality of the institutions and competition policy, we are close to the recent
work of Aghion and Howitt (2006), and more generally to the literature on institutions and
long-term economic performance as surveyed in Acemoglu et al. (2005), Glaeser et al. (2004),
and Beck and Levine (2005).
More importantly, our paper contributes to the thin empirical literature that evaluates the
effectiveness of competition policy. For example, Dutz and Hairy (1999) use a cross-section
of 52 countries and find a positive effect of antitrust effectiveness on GDP growth. However,
in their analysis they use ’subjective’ measures of competition policy that are based on the
perceptions of market participants and that, as a consequence, may not correctly represent the
objective features of a competition policy regime.6 Konings et al. (2001) and Hoekmann and
Kee (2003) look at the impact of the introduction of competition policy on industrial mark-ups
in two very different samples (the first one on Belgium and The Netherlands and the second on
a large panel of industries in developed and developing countries). Neither paper finds direct
evidence of a positive effect of the introduction of competition policy or competition law on
mark-ups.7 However, the interpretation of the results might be misleading as the employed
6 Similarly, Dutz and Vagliasindi (2000), using a small sample of transition economies, find a positive effect of
competition policy on productivity-related variables. Yet, again, they use ’subjective’ measures of institutional
quality.
7 See also Sproul (1993), who find that prices increase in industries after a cartel have been discovered and convicted; Clarke and Evenett (2003), who find that the vitamin cartel reduces cartel prices in jurisdictions where
antitrust conviction is more likely and costly; and Voigt (2006), who finds a positive effect of a set of indicators
of the quality of Competition Policy on total factor productivity, that however disappears when controlling for
6
measure of competition policy appears inadequate to capture those features that are likely to
impact on its effectiveness, the cross-country variation on the quality of competition policy
regimes, as well as the steady improvement of such policies over time.
Finally, especially for the empirical approach, our work is closely related to the literature
that examines the impact of regulation and other competition enhancing policies on productivity growth. Nicoletti and Scarpetta (2003) focus on the direct effect of privatization and
liberalization on TFP growth. They show that market-oriented regulatory reforms significantly
contributed to improving productivity in OECD countries during the nineties, especially by
reducing the gap to the technological frontier. Pavcnik (2002) find a direct impact of trade
liberalization on productivity improvements through the reallocation of resources to more efficient producers. Several other papers, instead, look at the effect of competition and entry on
productivity growth (e.g. Griffith and Harrison, 2004, and Aghion et al. 2009). They then use
policy variables, such as the introduction of the EU single market program or the UK privatization program, as instruments for competition proxied by the price-cost margin (PCM), and
entry. They show that the policies have a positive impact on competition and entry and these,
in turn, increase productivity.
3
The Model
We now present our empirical specification where we link the TFP growth to competition policy, which is based on the framework used in several recent papers (Nicoletti and Scarpetta,
2003; Griffith et al. 2004; and Griffith and Harrison, 2004). The discussion in section 2 suggests
that competition policy, by having an impact on competition, affects different forms of efficiency and, therefore, also TFP growth. Furthermore, to make robust causal inference on the
effectiveness of competition policy, we analyze the direct link between the policy and productivity. In this way, we avoid specifying any particular channel or notion of competition through
which the policy affects efficiency and which might be difficult to measure.8
institutional quality.
8 For instance, the PCM is a poor indicator of ’competition’. From a theoretical point of view, the PCM (imperfectly) captures only a short-run notion of competition. Even in this case, the relationship can be non linear and
an increase in competition may result in a higher PCM (Boone, 2000). From an empirical point of view, it is difficult to measure and interpret any PCM indicator which is not built on firm-specific data, especially when precise
7
The basic equation we want to estimate is thus the following:
∆TFPi,j,t = α + βCPIi,t−1 + δ∆TFPL,j,t − σ
TFPi,j,t
+ γXi,j,t−1 + χZi,t−1 + ε i,j,t
TFPL,j,t
(1)
where CPIi,t is one of our indicators that measure the deterrence effect of competition
policy in country i at time t, TFPL,j,t is the productivity of the country on the technological
frontier,
TFPi,j,t
TFPL,j,t
represents the productive gap or distance to the technological frontier, Xi,j,t−1
are country-industry-specific control variables (human capital, trade openness, R&D, and a
country-industry-specific trend), Zi,t are country-specific controls (product market regulation
and the quality of institutions). We assume that the error term takes the form ε i,j,t = ψi,j + φt +
ui,j,t , where the country-industry-specific fixed effects ψi,j account for unobserved heterogeneity and the full set of time dummies (φt ) controls for common macroeconomic shocks that may
affect TFP growth in all countries at the same time.9
3.1
Identification
The identification of a causal link between competition policy and productivity growth crucially relies on the ability to account for the potential endogeneity of our key policy variables.
Especially when looking at country-level aggregates, endogeneneity might arise from omitted
variable bias as well as from two-way causality and measurement errors. Being aware of the
difficulty in finding an unquestionable argument for identification, in this paper we adopt a
multi-steps approach, using several alternative strategies to pursue the ultimate goal of establishing a robust causal relationship between competition policy and TFP growth.
First, we believe that two-way causality is not a major concern in our case. In principle,
the application of competition policy might be focused on less competitive and productive
markets, which in turn might lead to a negative correlation between the CPIs and the error
term. However, our CPIs aggregate several institutional characteristics, which are unlikely to
respond swiftly to changes in TFP growth rates. Institutions face inertia and slowly evolve over
information about marginal costs are absent.
9 We find similar results if we estimate the same model with country, industry, and time fixed-effects, i.e. if we
assume ε i,j,t = ψi + ψj + φt + ui,j,t .
8
time quite independently of specific and short-run changes in market outcomes.10 Even those
variables that represent some relevant enforcement features, such as the human and financial
resources, depend on political decisions that generally take time to be put in practice. In any
case, in order to reduce the potential bias resulting from two-way causality, we use lagged values of the policy variables with respect to our dependent variable. This is a standard approach
that relies on the assumption that the lagged values of the policy are uncorrelated with the
error terms of the estimated equation (i.e. Griffith et al., 2004).
The main identification issue in the context of our model is related to the existence of an
omitted variable bias. The panel structure of our data-set allows us to control for time-invariant
unobserved individual heterogeneity at the industry-country level through fixed effects as well
as for time fixed-effects. However, there still might be time-varying unobserved heterogeneity. In particular, this might derive from the existence of several other competition enhancing policies or, in general, other policies correlated with competition policy that might affect
TFP growth rates. In our basic specifications, we control for those we believe to be the most
prominent policies affecting competition (product market regulation, liberalization, and privatization) and for trade openness. While we are confident that these controls should already
help mitigate the endogeneity problem, we nonetheless propose a twofold approach to provide
further evidence on the causal nature of the link between competition policy and productivity
growth.
First, we propose an instrumental variable estimation, which allows us to explicitly test
whether endogeneity matters and to control for another source of potential inconsistency of
OLS estimates: the existence of measurement errors. We use two different sets of instruments.
Following some recent contributions, which find political variables to determine policy outcomes (e.g. Besley and Case, 2000; Duso and Roller, 2003; Duso and Seldeslachts, 2009), we
use the government type and its ideological position on economic matters as a first set of instruments. A second possible set of instruments derives from a well-established practice in
industrial organization (e.g. Hausman 1997). This consists of using different aggregations of
10 For instance, the introduction of leniency programs or the adoption of the EU competition law model in Eastern
European countries are likely to be the consequence of the diffusion of some institutional innovations, rather than
a response to inadequate short-run market performances.
9
the potentially endogenous variables in other markets as an instrument for the same variables
in the market of interest. While the formulation of competition policy in a given country is
likely to be affected by the evolution of competition policy in neighboring countries, the latter
should not correlate with the rate of TFP growth in the country of interest. This provides the
exclusion restriction necessary for identification. The existence of a correlation among policies
in different countries is supported by the observable common trends in the evolution of competition policy during the last decades. These trends are possibly due to the leading policy-setting
role taken by jurisdictions such as the US or the EU, after which the other jurisdictions’ policies are modeled. Moreover, a vigorous international academic and policy debate established
a general consensus about the most efficient policies to adopt in the field of competition laws,
which surely also generate common trends in its evolution over time.11
Second, in addition to the IV approach, we exploit non-linearities in the effectiveness of
competition policy on TFP growth as a further identification strategy. There are two dimensions
of heterogeneity that we think are important. The first is related to country-specific characteristics. We expect competition policy to be more effective in those countries where the quality
of legal institutions is higher. As we discussed in section 2, in fact, national courts are strongly
involved in the enforcement of competition policy, as they often retain the power to adjudicate
antitrust cases either directly or in appeal. Yet, crucially for our identification strategy, courts
are not involved in the adoption of other productivity enhancing policies (for instance regulation, R&D subsidies or fiscal policy) or at least they are involved to a much lesser extent. The
second dimension of heterogeneity we look at is related to industry-specific characteristics. Our
data relate to industries belonging both to the manufacturing and service sectors. We expect the
former to be significantly more affected by competition policy. The reason is that services are
in general subject to strong sector-specific product market regulations, which therefore play a
more significant role in shaping the competitive environment and productivity outcomes than
11 The role of multinational cooperation for the discussion and adoption of best practices around the world increased over the years covered in our sample. Such cooperation, which took place within the OECD and other
international organizations, was fostered by the creation of the International Competition Network (ICN). This informal forum was initiated by the US in 1995 with the aim of providing a platform for competition authorities from
around the world to discuss the whole range of practical competition policy enforcement and policy issues. The
main objective of the ICN is exactly to spread best practice and promote convergence.
10
competition policy in these industries. This intuition indeed finds empirical support in the paper by Nicoletti and Scarpetta (2003), who find that (de)regulation plays a significantly greater
role in fostering productivity in service than in manufacturing.
4
Data sample and Descriptive Statistics
We estimate our model (1) on a sample of 22 industries in 12 countries over the period 19952005. The countries included in the study are: Canada, the Czech-Republic, France, Germany,
Hungary, Italy, Japan, the Netherlands, Spain, Sweden, the UK, and the US.12 We use data
both at the national level and at the industry level. National level data are used to measure
the policy variables (competition policy, product market regulation) and the quality of institutions. The remaining variables are measured at the industry level, which belong both to the
manufacturing and to the service sectors.13
In the following sections we introduce the main variables that we use in our regressions.
We begin by discussing our main explanatory variables, the competition policy indexes. We
then move to the discussion of the TFP growth measure and the other explanatory variables.
We conclude by introducing our instruments.
4.1
Measuring the Quality of Competition Policy: The CPIs
The ultimate aim of competition policy is to maximize social welfare. Hence, the quality of a
competition policy regime should be evaluated on the basis of the ability of this policy to deter
firms that operate within its jurisdiction from undertaking those behaviors that, by impairing
competition, reduce social welfare.
Following Becker’s (1968) approach, we consider that the level of deterrence is determined
by the size of the sanctions, the probability of detection and conviction, and the probability of
12 These
countries have been selected to be representative of different legal systems (common law and civil law),
to include both EU and non-EU countries and, among the EU countries, both founding members and countries that
have recently entered the Union, namely Hungary and the Czech Republic.
13 The 22 industries (ISIC rev.3 codes) included in the study are the following: agriculture, forestry and fishing;
mining and quarrying; food products; textile, clothing and leather; wood products; paper, printing and publishing; petroleum and coal products; chemical products; rubber and plastics; non-metallic mineral products; metal
products; machinery; electrical and optical equipment; transport equipment; furniture and miscellaneous manufacturing; electricity, gas and water; constructions; hotels and restaurants; transport & storage; communication;
financial intermediation; business services.
11
errors (see Buccirossi et al., 2009b). Several institutional and enforcement features of a competition policy regime might affect these three factors. The features which we believe have
the strongest impact on the level of deterrence of anti-competitive behaviors are: the degree
of independence of the competition authority (or CA) with respect to political or economic interests (formal independence); the separation between the adjudicator and the prosecutor in a
competition case (separation of powers); how close the rules that make the partition between
legal and illegal conducts are to their effect on social welfare (the quality of the law on the
books); the scope of the investigative powers the CA holds (powers during investigation); the
level of the overall loss that can be imposed on firms and their employees if these are convicted
(sanctions and damages); the toughness of a CA, which is given by its level of activity and the
size of the sanctions that are imposed on firms and their employees when these are convicted,
and the amount and the quality of the financial and human resources the CA can rely on when
performing its tasks.
We collected information on each of these features in order to build a set of indicators
that measure a country’s competition policy, the CPIs. We gathered these data separately
for the three possible infringements of the antitrust legislation (hard-core cartels, other anticompetitive agreements and abuses of dominance) and for the merger control policy in each
country and for each of the years in the sample. Most of this information was directly obtained
from the CAs of the 13 jurisdictions included in our sample through a tailored questionnaire.14
The data obtained from this survey were integrated with information derived from the country studies carried out by the OECD in the context of its reviews of regulatory reforms, from
the chapters on competition and economic performance in the OECD Economic Surveys and
from the CAs’ own websites and publications.15 Despite this extensive data gathering exer14 Our
sample includes 12 countries and 13 jurisdictions, as it includes the European Union. We only surveyed
the CAs which are either independent public bodies or ministerial agencies/departments, while we did not survey the courts (but we have collected data on their powers and activities). The bodies surveyed are: Competition
Bureau (Canada); Urad pro ochranu hospodarske souteze (Czech Republic); Directorate General for Competition
´´ erale
´´
de la Concurrence (France); BunAffairs (European Union); Conseil de la Concurrence (France); Direction Gen
deskartellaamt (Germany); Gazdas´agi Versenyhivatal (Hungary); Autorita` Garante della Concorrenza e del Mercato (Italy); Japan Fair Trade Commission (Japan); Nederlandse Mededingingsautoriteit (Netherlands); Servicio de
Defensa de la Competencia (Spain); Tribunal de Defensa de la Competencia (Spain); Konkurrensverket (Sweden);
Office of Fair trading (UK); Competition Commission (UK), Federal Trade Commission (US); Antitrust Division Department of Justice (US).
15 Despite the active collaboration of most CAs, it was not possible to collect all data on the enforcement charac-
12
cise, we encountered some difficulties in obtaining data on the toughness of the CAs and we
could include in our database only details on the maximum jail term imposed on managers of
firms involved in hard-core cartels (for those jurisdiction that have this type of sanction) and
the number of hard-core cartels and mergers investigated every year.16
We then scored all this data against a benchmark of generally-agreed best practice and
incorporated them in a set of summary indicators, the CPIs.17 In the remainder of this section,
we give a brief description of how we have constructed the CPIs.
The CPIs have a pyramidal structure. The information of the seven key features of competition policy are incorporated in a large number of low-level indexes that are progressively
linearly combined using a set of weights at each level of aggregation.18 The methodology employed to score and aggregate the data followed a series of steps, which are explained below.19
Each piece of information on a key policy feature is assigned a score, on a scale of 0-1,
against a benchmark of generally-agreed best practice (from worst to best).20 The best practice
is determined by relying on scientific papers and books, on documents prepared by international organizations such as the International Competition Network and the OECD, and on
teristics of the competition policy necessary to build the CPIs for the period considered. Hence, our database has
some missing observations. We tried to fill the gaps by asking the CAs to provide us with an imputation of the
missing observations based either on other data at their disposal or on their historical knowledge of the trends.
When this was not possible, whenever this was allowed by the characteristics of the other available data on that
specific feature, we performed some limited imputation of the missing data. Nevertheless, the database still has
some gaps. This means that in some cases we do not have all the information necessary to calculate a specific index.
To avoid calculating indexes whose value could be altered by the lack of information, we do not calculate an index
(at any level of aggregation) if 50%, or more, of the relevant information content was missing.
16 It is therefore clear that our measure of enforcement is less accurate than our measure of institutions. However, our CPIs capture most of the features that have a likely impact on the deterrence properties of the analyzed
competition policy regimes as they fully describe their institutional features and proxy the level of enforcement
by important variables such as the budget dedicated to the implementation of this policy, the amount of human
resources devoted to the same aim and their quality. Furthermore, we believe that the institutional features of a
competition policy regime play the greatest role in determining its effectiveness. As Kovacic (2009, 145) recently
pointed out ”Good policy runs on an infrastructure of institutions, and broadband-quality policy cannot be delivered on dial-up-quality institutions.”
17 In the case of merger control we have selected slightly different features because there are no sanctions for
potentially anti-competitive mergers.
18 We are aware that there might be complementarities among different aspect of competition policy that we may
miss by using this linearly additive specification. However, we believe that it would be difficult to choose a more
precise approximation of the relationship that could exist between these variables. Hence, we have selected this
aggregation form that has the advantage of being simple and at the same time rather complete.
19 This methodology is akin to the one developed by the OECD for the indicators of product market regulations
(PMR) and the competition law and policy indexes (CPL). See Boylaud, Nicoletti, and Scarpetta (2000), Conway
and Nicoletti, (2005) Conway and Nicoletti (2006) for the former and Høj (2007) for the latter.
20 When a data entry is quantitative it is normalized by dividing it by the highest corresponding value held by
any CAs in the sample, so that even quantitative information assumes a value between 0-1.
13
our judgement (see Buccirossi et al., 2009a).
All the information on a specific policy feature is summarized in a separate low-level index
using a set of weights to aggregate it. We have calculated separate indexes for each of the three
possible competition law infringements and for mergers, to take into account the differences in
the legal framework and, where possible, in the enforcement.21
The low-level indicators are subsequently aggregated into two medium-level indexes for
each of three types of possible competition law infringements and for mergers: one which summarizes the institutional features of the competition policy regime and one which summarizes
its enforcement features.
The medium-level indexes are then aggregated to form a number of different summary
indexes, which we generically refer to as the CPIs. More specifically, we calculate (for each
country and each year in the sample): i) one index that measures the deterrence properties of
the competition policy regime with regard to all antitrust infringements (the Antitrust CPI) and
one that measures its deterrence properties in the merger control process (the Mergers CPI); ii)
one index that assesses the institutional features (the Institutional CPI) and one that assesses
the enforcement features (the Enforcement CPI); iii) a single index that incorporates all the
information on the competition policy regime in a jurisdiction (the Aggregate CPI).
The weights employed in this aggregation process are based on the relevance that each item,
in our view, deserves. However, in order to check whether our choice of weights has a decisive
influence on the results, we also use two alternative weighting schemes. The first, aggregates
the features of competition policy using factor analysis.22 The correlation coefficient between
the values of the Aggregate CPIs built with our weights and the one built with the weights
obtained from the factor analysis is very high (equal to 0.96) and it is significantly different from
zero at the 1% level. The second alterative weighting scheme is based on random weighting.
We randomly generate, from an uniform distribution (0,1), 1000 sets of weights, which are then
normalized to sum to one. For each of these sets, we build one Aggregate CPI. In the results
section, we report the distribution of the estimates of the coefficients of these 1000 Aggregate
21 This has not always been easy. For example, the CAs rarely have separate divisions that deal with the different
types of infringements, hence we could not obtain separate data on the resources employed for each of them.
22 A complete description of this alternative methodology and the results can be found in Buccirossi et al. (2009a).
14
CPIs. More details on the structure and content of the CPIs as well as on the values of the
CPIs can be found in Appendix A, while a complete and in-depth discussion of the CPIs can
be found in Buccirossi et al. (2009a).
4.2
Main Variables
In this section we describe the main variables that we employ in our regressions. We start by
presenting TFP growth and then we move on to the control variables. All monetary measures
are in real terms, using 2000 as the base year.
TFP growth. The dependent variable in our empirical model comes from the EU-KLEMS
database.23 TFP growth is measured by the Solow residual within the growth accounting
framework as developed by Jorgenson et. al. (2005). Within this framework, TFP is measured
under certain restrictive assumptions, among which that of perfectly competitive product markets. This assumption is particularly problematic in our context, since we aim to measure the
impact that competition policy has on productivity by making markets more competitive. Following Griffith et al. (2004), we relax this assumption by multiplying the labor and capital
shares by the industry-level mark-up, which is estimated as the ratio between industry-level
value added and labor and capital costs (see Paquet and Roubidoux, 2001). In our sample, the
average TFP growth at the industry level ranges between -1.7% for the business services sector and 3.7% for the communications sector. The average TFP growth in the entire sample is
0.0096%. A more in-depth description of this and other TFP-based variables can be found in
Appendix B.
Technology Gap. We use TFP levels to determine the technology frontier at the countryindustry level and the technology gap between each country-industry and the frontier. Following the existing literature (Griffith et al. 2004; Nicoletti and Scarpetta, 2003), we obtain the
technology gap using a two-step procedure. First, we calculate the ratio between the level of
TFP in each country-industry and the geometric mean of the TFP levels in all the countries in23 The EU-KLEMS project is funded by the European Commission, Research Directorate General as part of the 6th
Framework Programme, Priority 8, ’Policy Support and Anticipating Scientific and Technological Needs’. The aim
of the project is to create a database on measures of economic growth, productivity, employment creation, capital
formation and technological change at the industry level for all European Union member states plus selected nonEuropean countries from 1970 onwards. For a short overview of the methodology and results of the EU KLEMS
database, see Timmer et al. (2007).
15
cluded in the sample for that industry. The frontier is defined as the country-industry with the
highest ratio. Second, we obtain the technology gap by subtracting all the observed countryindustry ratios from the frontier ratio.24
R&D. The variable we use in our regressions is the ratio between R&D expenditure and
the industry-level value added. We have gathered detailed data on the level of expenditure
in R&D in different industries from the OECD Analytical Business Enterprise Research and
Development (ANBERD) database, which covers 19 OECD countries, from 1987 to 2004. We
have taken data on value added from the EU-KLEMS database. Unfortunately, data on R&D
for the ’Agriculture, forestry and fishing’ sector and the ’Mining and quarrying’ sectors for all
countries involved in the study as well as data for Hungary are not available in ANBERD.
Human Capital. We measure human capital as the share of high-skilled labor employed
in each country-industry in a given year. We have taken the data on human capital from the
KLEMS database, which holds information on the level of educational attainment of workers
by industry for all the EU member countries, the US and Japan from 1970 to 2004. Unfortunately, data on Human Capital are not available for Canada.
Trade openness. We measure the degree of openness to trade by the ratio of industry import
over value added in each specific industry. The data come from the OECD STAN database,
which contains data on total exports and imports for 19 OECD countries, plus the EU, from
1987 to 2004, disaggregated by industry.
Product Market Regulation. We measure the tightness of product market regulation by
the aggregate PMR index, taken from the OECD PMR database. The aggregate PMR index
covers formal regulations in the following areas: state control of business enterprizes, legal and
administrative barriers to entrepreneurship, and barriers to international trade and investment.
The tightness of regulation is measured at the national level on a scale between 0 and 6, where
lower values indicate less tight regulation. Data on PMR are available for two years: 1998 and
2003.25
24 Given the potential measurement errors in the construction of the Technology Gap (see Appendix B), we test
the robustness of our results using Labor Productivity (value added per worker) as proxy for the distance from the
technology frontier.
25 We assume regulation before 1998 to be as tight as in 1998, and regulation after 2003 to be as tight as in 2003.
For the period between 1998 and 2003 we impute an average between the two available observations.
16
Quality of Institutions. The quality of the institutions of a country enters in our regressions
both as a control variable, and as an interaction with the competition policy indexes in order
to explore non-linearities in the effectiveness of competition policy. We use variables from four
different sources to proxy the quality of the national institutions.
The first source of data is the World Bank Worldwide Governance Indicators (WGI) database,
which collects aggregate and individual indicators for six dimensions of governance: voice and
accountability, political stability and absence of violence, government effectiveness, regulatory
quality, rule of law, control of corruption.26 The data cover 212 countries and territories over
the period 1996-2006 and are based on the views of a large number of enterprisers, citizens, and
experts. We use the index that measures the national rule of law. The index takes values from
-2.5 to 2.5, with higher values indicating better governance outcomes.
The second source of data is the Fraser Institute Database, which is used to construct the
’Economic Freedom of the World’ indexes. From this database, we use an aggregate index
(index 2) called ’legal system’, which aggregates information on variables measuring judiciary
independence, impartiality of the courts, protection of intellectual property, law and order,
and legal enforcement of contracts. These indexes, as the WGIs, are based on the perceptions
of enterprizes, citizens and experts. The indexes take values between 0 and 10, with higher
values indicating better governance outcomes.
The third source of data is the Doing Business database of the World Bank and the International Finance Corporation, which collects data representing ’objective measures’ of the overall
quality of the regulatory and institutional environment on 181 countries. The data we use in
our empirical model relate to the time and cost of enforcing debt contracts through the national
courts system.27 Finally, we use the legal origins dummies from La Porta et al. (1997).
Industry-level deviations from the trend. We use country-industry deviations from a linear and a quadratic trend to account for the effect of business cycles on TFP. When capacity
26 Note
that all these indexes are very much correlated and contain, therefore, very similar information.
time of enforcing debt contracts represents the estimated duration, in calendar days, between the moment
of issuance of judgment and the moment the landlord repossesses the property (for the eviction case) or the creditor
obtains payment (for the check collection case). The cost of enforcing contracts represents the estimated cost as a
percentage of the debt involved in the contract. For a full description, see Djankov et. al (2003b). Both variables
have been measured within the Doing Business Project from 2004 on. In our specifications, we use the end of sample
(2005) values, and assume it represents the quality of contracts enforcing for the entire sample period.
27 The
17
is constrained, TFP growth may in fact reflect short-run demand fluctuations. We measure a
different deviation from the trend for each country-industry using value added taken from the
EU-KLEMS database.
4.3
Instruments for Policy
In our IV regressions we use two different sets of instruments for the policies (competition policy and PMR). First, we use political variables, which are derived from the dataset developed
by Cusack and Fuchs (2002) which uses two main sources:28 the first is a database on political parties’ programmatic position developed in the Manifesto dataset by Klingemann et al.
(2006), while the second is the database developed by Woldendorp, Keman, and Budge (2000)
on government compositions for 48 countries from 1948 onwards. For each country and year
in our sample, we use a dummy variable measuring whether the government was led by a
coalition or a single party (Coal). Furthermore, we create measures of a government location
along the Manifestos political dimensions by taking a weighted average of the programmatic
positions of each of the parties belonging to government coalition. As weights, we have used
the number of each party’s votes. We used the following programmatic positions:
Market regulation (per403). This variable measures favorable mentions in the parties’ programs of the need for regulations to make private enterprizes work better, actions against
monopoly and trusts, in defence of consumer, and encouraging economic competition.
Economic planning (per404). This variable measures favorable mentions in the parties’
programs of long standing economic planning of a consultative or indicative nature.
Welfare state limitations planning (per505). This variable measures negative mentions in
the parties’ programs of the need to introduce, maintain or expand any social service or social
security scheme.
European Community (per108): This variable measures favorable mentions in the parties’
programs of the European Community in general, and on the desirability of expanding its
competency.
Second, as we mentioned in the previous section, as additional instruments for the CPI and
28 We are very grateful to Tom Cusack for providing us with the original data and the updates for the last years in
our sample.
18
for regulation for a given country we use different aggregations of the level of these variables
in other countries as possible instruments. In particular, we build different set of instruments
based on country grouping (EU countries vs. non-EU countries). We then use as instruments
for the policies (CPI and PMR) in one country the average value of these variables in all other
countries from the same group, as well as the average value of these variables in all countries
from other groups.29
Table 1 reports the preliminary statistics for the main variables discussed in these sections.
5
The Results
We start by considering the average effect of competition policy on total factor productivity
growth by using the various CPI indexes discussed above. All regressions in the next tables
include year dummies and industry-country fixed effects. We further control for other competition enhancing policies as measured by the OECD PMR index, trade liberalization, a countryindustry-specific deviation from the trend to account for potentially different business cycles at
the country-industry level, as well as for the other determinants of productivity growth, which
we have previously discussed. Most of the explanatory variables are lagged by one year to reduce possible endogeneity issues. Standard errors are clustered at the country level to allow for
correlation among industries in the same country. We estimate the model by OLS. Our sample,
after discarding some extreme outliers, consists of 1,847 country-industry-time observations.30
5.1
The Basic Model
In Column (1) of table 2 we report the results of the basic specification. The key result is that
the coefficient estimate for the Aggregate CPI is positive (0.0924) and statistically significant at
the 1% level: good competition policy is strongly positively correlated to productivity growth
in a statistically significant way.31 Estimates for all other control variables conform to our ex29 Moreover, we also try with alternative instruments, such as the US policies as instruments for EU countries, the
mean policies of EU member states (including the EC) as instruments for the US policies, and the mean between the
EU and US policies for the policies in non-European countries such as Canada and Japan.
30 We dropped the observations corresponding to the first and the last percentiles of the TFP growth distribution.
31 A coefficient estimate of 0.09 for the aggregate CPI implies an average elasticity of TFP growth with respect to
the aggregate CPI of around 4.66%. To give a more concrete idea of the economic meaning of this, we can look at
one example such as the ’food products’ industry in the UK. Over the period 2001-2004, the average productivity
19
pectations and to previous results reported in the literature and hence give us confidence about
the quality of our specification. In particular, the TFP level of the leader, the technology gap,
and import penetration have a positive and significant impact on TFP growth; while product
market regulation, in the form of barriers to competition, has a negative effect on productivity
growth, though this is not significant mimicking the findings by Nicoletti and Scarpetta (2003).
Finally, the country-industry-specific trend that we inserted to account for short-run cyclical
fluctuations in demand also has a positive and significant impact.
As we mentioned in section 4.2, there are two other important control variables - R&D and
human capital - for which we unfortunately have many missing values.32 Yet, we still want to
analyze whether their introduction substantially affects our results, especially in light of potential omitted variable bias. In column (2) we therefore add R&D to our basic specification, which
reduces the number of observations to 1,419. R&D has a positive though not significant impact
on TFP growth, while all other results, and especially the size and significance of the coefficient
estimate for the Aggregate CPI, are not affected. In column (3), we report the results for our
basic specification using the sub-sample where R&D is non-missing. Again, our results are almost not affected. In column (4) we add to our basic specification human capital as a further
control, which reduces the observation to 1,783. Again, this variable has a positive effect on
TFP growth, which, however, is not statistically significant but it does not substantially change
the other results. We finally introduce both R&D and human capital (column (5)) and run our
basic regression without these controls in the sub-sample where both variables are non-missing
(column (6)). Again, our main results are not affected, yet now the two controls are significant.
This can however be due to the sample selection effect, given that we run this specification on a
much smaller sub-sample (1,364 observations). From this point on, we therefore decide to use
our basic specification, so that we can use the maximum possible number of observations.33
growth rate in this industry was 2.23%. Our model implies that part of this growth rate is due to the effect of the
improvement of competition policy. In the same period, the average growth rate of the aggregate CPI was 3.75%.
Using our average coefficient would imply that, had competition policy not improved, the average TFP growth rate
would have been 1.92%.
32 In particular, R&D data are missing for Hungary and for several industries-years in other countries, while
Human Capital is missing for Canada.
33 We however run all regressions and robustness checks also adding R&D and human capital as additional controls. These results might be obtained from the authors upon request.
20
We then move to analyze the impact of the various dimensions of competition policy as
measured by our disaggregated indexes. In Table 3, we focus on the difference between institutions and enforcement in columns (1) and (2) and between mergers and antitrust in columns (3)
and (4). Again, we obtain similar results to our basic model: the various dimensions of competition policy have a positive and significant effect on productivity growth. With the exception
of the Antitrust CPI, the size of the effect is, however, always smaller than the one measured
by the Aggregate CPI and, in some cases, it is also less significant. In particular, the results for
the Enforcement CPI are the weakest, as the coefficient estimate drops to 0.04 and loses significance. Our interpretation for this result lays in the quality of the information summarized
in this index. As we mentioned, we do not have complete measures of antitrust enforcement
in terms of actions taken by the authorities but rather measures of the monetary and human
capital resources. By no means do we therefore want to imply that institutional features are
more important than enforcement features.
The established positive and significant relationship between the quality of competition
policy, and in particular of its institutional design in the area of antitrust, and productivity
growth is the key finding of this study. As we discussed thoroughly in section 3.1, one major
concern for the causal interpretation of this effect is the potential endogeneity of the policy. In
this section we started tackling this issue by lagging the policy variables and controlling for
most of the determinants of TFP growth discussed in the literature. The next sections aim at
providing further evidence to get more confidence in the causal interpretation of the established
link between competition policy and TFP growth.
5.2
Instrumental Variables
As discussed in Section 3.1, the next step that we propose in terms of identification strategy is to
use an instrumental variables (IV) approach. The results of these IV estimations are reported in
table 4. In the first three specifications (columns (1), (2), and (3)), we use the political variables
discussed in section 4.3 as instruments for the policy. Independent of whether we instrument
only for the Aggregate CPI (column (1)), for both the Aggregate CPI and PMR (column(3)),
or if we control for R&D while instrumenting both policies (column (2)), we always find a
21
positive and significant coefficient estimate for the Aggregate CPI, which is even larger than
those reported in our basic OLS specifications. This result is reassuring, as IV estimates are
consistent in presence of endogeneity. The used instruments seem to work properly: they are
correlated to the instrumented variables as shown by the high values taken by the F-statistic
for the excluded instruments in the first-stage regressions. Furthermore, they are not correlated
with the error term as shown by the Sargan statistic. Although being always consistent, IV
estimates are not efficient in the absence of endogeneity. We therefore run a Wu-Hausman to
test for endogeneity and cannot reject the null hypothesis that the polices are exogenous at the
1% level, hence OLS estimates should be preferred because they are more efficient.
Even though, as we motivated, the proposed instruments seem to be a reasonable choice,
one might still be concerned that they might be potentially correlated with other omitted factors. We therefore present a second set of results, based on a very different set of instruments.
Following an established literature in industrial organization, we use the policies in neighboring jurisdictions as instruments for the policies in a given country. We instrument for the
Aggregate CPI alone (column (4)), for both the Aggregate CPI and PMR (column (6)) and also
control for R&D while instrumenting for both policies (column (5)). Again, we consistently
estimate a positive and mostly significant coefficient for competition policy. Similarly to the
previous specifications, the instruments seem to be good in terms of correlation to the potentially endogenous variables (F-statistic for the excluded instruments), while they are uncorrelated to the error terms (Sargan test). Moreover, also in this case the Wu-Hausman test cannot
reject the null hypothesis of exogeneity, which might also partially explain the reduction in the
significance level, as the IV estimates are less efficient than OLS estimates.
These sets of results confirm our claim that the established positive link between competition policy and productivity growth can be interpreted in a causal way, as we can reject the
hypothesis that the policies are endogenous. Therefore, from now on we will focus on the OLS
estimates which, in the absence of endogeneity, are more efficient.
22
5.3
Non-Linearities
The final step of our identification strategy is based on the exploitation of non-linearities. The
idea is that competition policy is more effective in some countries than in others, due to their
better institutional environment, and in those sectors which are less subject to industry-specific
regulations. This should not be the case for other policies. Moreover, the analysis of such nonlinearities with respect to institutional details is an important contribution on a more theoretical
basis, as it allows us to identify the existence of complementarities between competition policy
and the efficiency of (legal) institutions and, therefore to provide a novel contribution to a
recently expanding literature (Aghion et Howitt, 2006). These results are reported in table 5.34
In the first column, we present our basic specification where we simultaneously control
for several institutional dimensions. Institutions seems to have a significant direct impact on
productivity growth.35 Yet, different from previous studies (e.g. Voigt, 2006), the positive and
significant effect of competition policy is not affected by these additional controls. This reinforces the view that our indicators are able to capture the specific features of a competition
policy regime, which we aimed to measure, and not the general quality of a country institutional environment.
In column (2) we then interact the Aggregate CPI with the dummies for legal origins. While
the effectiveness of competition policy seem to be significantly higher in countries with German
and Nordic legal origins, it is clearly less so in countries with French legal origins, which in our
sample are France, Italy, and Spain. These results seem to be in line with findings reviewed by
La Porta et al. (2008) who report that countries with civil law are associated with a heavier-hand
regulation, which seems to have an adverse impact on markets and economic performance.
Yet, as discussed by La Porta et al. (2008), legal origins can be viewed as the main determinants of several of other legal institutional variables. Therefore, we want to explore more
34 Notice
that, for lack of space, we do not report the coefficient estimates for all control variables, as they are
anyway very similar to those reported in our previous regressions.
35 Given that some of our institutional variables do not vary over time (e.g. legal origins and enforcement of
contracts), we cannot identify their direct effect on TFP growth, as this is not separable from the country-industry
fixed effects. Hence, we do not want to attach a direct meaning to the estimated coefficients, which represent the
deviation from the reference group, but just acknowledge that in this specification we control for other important
institutional dimensions.
23
deeply what specific characteristics of a legal system are important drivers of competition policy effectiveness. To exploit in the best possible way the limited variation in our institutional
data and, at the same time, to allow for non-linear effects through a step function, we have
transformed our continuous institutional variables into categorical variables based on their
distribution. Thus, for each institutional variable we have defined three dummies: low level ’l’
(up to the 33rd percentile of the distribution), medium level ’m’ (from the 33rd to the 66th percentile), and high level ’h’ (from the 66th percentile) of institutional quality. Finally, we interact
these dummies with the Aggregate CPI.
In column (3) we report results for the specification where we interact the Aggregate CPI
with dummies measuring the cost of enforcing contract (EC).36 Although competition policy
seems to have a positive and significant effect independently of the levels of contract enforcement, the effect is substantially larger - indeed more than double (0.240) - for those countries
with low enforcement costs (CPI lEC). Hence, our results support the view that competition
policy effectiveness might be reinforced in countries where law enforcement is more efficient.
In columns (4) and (5) we report the results of the specifications where we interact the Aggregate CPI with the Fraser ’Rule of Law’ (RL) index and the WGI’s ’Legal System’ (LS) index.37
In both cases, we observe competition policy to be less effective in countries with less efficient
legal institutions, such as a low rule of law or a poor legal system.
The reported results point out to complementarities between competition policy and some
dimensions of legal institutions. This does not mean that policies in countries with a worse
legal system or higher costs of enforcing contracts must be ineffective, but rather that their
(partial) ineffectiveness can be better explained by the bad functioning of the more general
legal institutions. Therefore, policy changes in this country must be adequately designed to
account for the additional constraints imposed by the legal system.
The second dimension of heterogeneity of the degree of competition policy’s effectiveness
is industry-specific. As we pointed out, most of the service industries in our sample (e.g.
36 Very
similar results are obtained by using the general index for contract enforcement. However, in that case we
lose Italy since there is no information on the time needed to enforce the contracts for this country.
37 We also try specifications where we use sub-components of the legal system index, specifically ’Independence
of the Judiciary’ and ’Impartiality of the Courts’ and find similar results.
24
electricity, gas, water, communication, financial intermediation) are subject to more or less
heavy-handed sector-specific regulations and the organization of competition matters in these
industries is delegated to sectoral authorities. Our claim is therefore that competition policy
should have less of a bite in such industries, but this should not necessarily be true for other
productivity-enhancing policies (e.g. fiscal policy and labor regulations). We report the results
of the specification where we estimate separate coefficients for the Aggregate CPI in service
and manufacturing sectors in column (6) of table 5. We find a large (0.130) and statistically
significant coefficient estimate in manufacturing, while the coefficient is much smaller and not
significant in the service industries.38
All results reported in this section point to the existence of significant and sizable non-linear
effects of competition policy on productivity growth. The estimated differential effects should
not be expected for other kinds of policies, which might constitute our problematic omitted
factors and generate endogeneity issues that would invalidate our causal inference. Hence,
this further identification step makes us again more confident of the causal nature of the link
we establish.
5.4
Extensions and Robustness Checks
We finally perform several robustness checks by using different CPIs and different measures
for productivity growth, as well as different sample sizes.
First, to show that our results are not driven by the subjective weights we have chosen to
build the CPIs, we use the two alternative weighting schemes, which were discussed in brief in
section 4.1. In column (1) of Table 6, we report the results obtained when using the Aggregate
CPI constructed with the weights generated by factor analysis.39 Our qualitative results are
unchanged and competition policy still has a positive and significant impact on TFP growth at
the 5% level, even though the point estimates for the policy effect is now a bit smaller (0.0726).
As a second robustness check, we run 1,000 regressions, each using a different Aggregate
CPI generated with a different set of weights randomly drawn from a uniform distribution
38 This
results mirrors one of the findings by Nicoletti and Scarpetta (2003), namely that entry liberalization has a
significant impact on TFP growth in the manufacturing industries but not in the service sectors (Table 7, column (4)
in their paper).
39 See Bucirrossi et al. (2009b) for an in-depth discussion of this step.
25
(0,1). We obtain therefore estimates for 1,000 β coefficients and their relative t-statistics, whose
distributions are represented in figure 1. The distribution of the coefficients, which is represented in the first panel, ranges between 0.052 and 0.11, with a mean value of 0.084, which is
close to our estimate in the basic specification. As it can be seen from the second panel of the
figure, all of the 1,000 coefficient estimates are statistically significantly different from zero (the
lowest t-value is 2.98).
A second concern with the CPIs relates to the role of the EU competition policy in the EU
member states. To correctly evaluate the effectiveness of each EU member state’s competition
policy, it is necessary to account for the fact the EU competition policy works alongside the national one. Therefore, for these countries, we have built a set of CPIs, which are an average of
each member states individual index and the EU index.40 The coefficient estimate for the Aggregate CPI is still positive, highly significant and larger in size (0.115) with respect to our basic
specification. This means that EU competition policy improves, on average, the effectiveness
of national competition policies.
Third, we need to consider the limitations of the TFP measure we use. Until now, following
Griffith et al. (2004), we have used a measure for TFP growth corrected for the mark-ups (as
measured by the PCM) to account for imperfect competition. However, we have some concerns
about the quality of an industry-level aggregated PCM measure. Hence, we propose an alternative specification where we use TFP measures (i.e. the growth rate, TFP of the leader, and the
technology gap) which are not corrected for the mark-ups. The coefficient estimate reported in
column (3) is still positive and significant at the 10% level.
Fourth, while TFP growth is constructed using detailed information on labor and capital
input (see Appendix B) provided by the KLEMS, the Technology Gap uses OECD data, which
are provided at a less detailed level of aggregation.41 For this reason, we employed as an
alternative a much simpler measure of productivity, in order to measure the technology gap:
40 Unfortunately, DG Competition did not provide us with information on enforcement features (such as the
budget and the composition of the staff), at the EU level. Hence, we can only use information about EU institutional
features. The precise definition of the variable is thus as follows: AggregateCPI EUit = 32 (0.5 ∗ Institutions CPIit +
0.5 ∗ Institutions CPIEU,t ) + 13 En f orcement CPIit
41 Unfortunately, we could not employ the KLEMS data to construct the technology gap, since the KLEMS does
not publish the series on capital stock and labor for all countries with the necessary level of detail.
26
labor productivity, as measured by value added per worker. In this specification, we kept
TFP growth as our dependent variable and used TFP growth on the frontier as an independent
variable (though the frontier is defined in terms of labor producibility). The coefficient estimate
reported in column (4) is still positive and significant at the 1% level.
Fifth, one might be concerned with the frequency of the data. TFP measures change quickly
over time as a response to demand shocks, while our policy measures, although showing some
significant time variation, present much more inertia. We therefore change the frequency of
the data and look at long-run effects. We propose three different specifications along this dimension. In the first one, whose results are reported in column (5), we take longer three-year
lags for all explanatory variables. Still, the coefficient of interest is similar in size to that of our
basic specification, though it loses a bit of significance, as expected given the long lag used.
In the second robustness check (column (6)), we define TFP growth over a time span of three
years, and sum up the figures from year t to year t + 2. We then ’lag’ all explanatory variables
by taking their value at the initial year, i.e. we look at how the value of competition policy in
year t affects TFP growth between year t and t+3. In doing so, the number of observations is
obviously reduced. We still find a positive and significant coefficient estimate (0.332) for the
Aggregate CPI. As expected the coefficient is much larger, as it represents the effect of the policy on the three-years TFP growth rate. In the final specification, we use three-year averages
for all variables (column (7)). Also in this case, the coefficient estimate for the Aggregate CPIs
is positive (0.0903) and significant.
Finally, given the heterogeneity of competition policy’s effectiveness across countries and
industries, one might be concerned that our average results do not hold to the exclusions of
particular countries and/or industries. We therefore run our basic regression on several subsamples, sequentially excluding one or two countries (156 sub-samples) or one or two industries (506 sub-samples). For each sub-sample, we run our basic regression. The distribution of
the β coefficients and their t-statistics are represented in figures 2 and 3. In all sub-samples, our
estimates for the CPI are positive and, in the very large majority of the cases (99.4%), they are
statistically significant at the 10% significant level at least. We observe insignificant coefficient
estimates in only 4 out of the 156 sub-samples where we simultaneously exclude two countries,
27
while none of the estimates are insignificant when we exclude one or two industries.42
6
Conclusions
The aim of competition policy is to ensure that firms undertake the least possible number of
behaviors that reduce social welfare by impairing competition. Hence, an effective competition
policy is one that deters most anti-competitive practices. Since by deterring anti-competitive
practices competition policy should make markets work effectively and foster efficiency, in
this paper we evaluated directly the impact of competition policy on the long-term economic
performance. Hence, we estimated the effect of the key institutional and enforcement features
of a competition policy, summarized in a set of indicators, the CPIs, on total factor productivity
in 22 industries of 12 OECD countries between 1995 and 2005.
Our results imply that good competition policy has a strong impact on TFP growth. The
coefficient for the Aggregate CPIs is positive and statistically significant in a variety of specifications of our model. The Aggregate CPI also remains highly significant when we control
for R&D, human capital, and the quality of a country’s institutions. All these variables have
a direct impact on TFP growth, but do not alter the fact that competition policy is effective in
increasing TFP. We obtain similar results when we look at a more disaggregated picture and
separately consider the effects of a competition policy’s institutional and enforcement characteristics and when we differentiate between the policing of antitrust infringements and the
merger control discipline. Yet, the institutional and the antitrust elements of the competition
policy appear to have the strongest impact on TFP growth. We adopt a multi-steps approach to
identification based on instrumental variable regressions and the exploitation of non-linearities.
We therefore provide careful support to the causal nature of the established link between competition policy and TFP growth. Furthermore, we observe complementarities between competition policy and the quality of legal institutions. The effect of the former is indeed larger in
42 The only specification for which the t-value is far from the critical level (p-value of 0.23) is when we simultaneously exclude the UK and the Czech Republic. The reason is that the coefficient estimates drops to 0.04, while
the standard error increases a bit with respect to our basic specification. If we add R&D and human capital as an
additional control, therefore running the regressions on a sub-sample of 1,364 observations, we obtain only slightly
different results. Still, none of the coefficient estimates for the CPI is negative and in only few cases they are not
significant (7.8% and 1.2% sub-samples in the two kinds of robustness checks respectively).
28
those countries where the enforcement costs are low and with a better legal system. Finally, our
main findings prove to be robust to several checks, such as various measures of productivity,
different aggregation techniques for the CPIs, and several sub-samples.
Our results provide support for the argument that investing resources in competition policy
is beneficial to the long-term performance of a country’s economy. Nevertheless, there is scope
for further refinements of our analysis. Currently, we have used data on 22 industries in 12
OECD countries over ten years, but it would be interesting to expand the database, so as to
include more countries over a longer time period. Further, the CPIs could be improved by
including more detailed information on the enforcement features, in particular on the sanctions
that are effectively imposed on convicted firms and individuals and on the resources employed
and the number of cases investigated by the EU Commission. However, such a refinement of
the CPIs is difficult because of the lack of available data. Indeed, if competition authorities
collected and kept data, in particular on the enforcement of competition policy, in an easily
accessible format, studying the effectiveness of competition policy would become much easier.
29
References
Acemoglu, Daron, Simon Johnson, and James A. Robinson, “Institutions as the Fundamental
Cause of Long-Run Growth,” in Philippe Aghion and Stephen Durlauf, eds., Handbook of
Economic Growth, Elsevier, 2005, pp. 1114–1174.
Aghion, Philippe and Peter Howitt, “Appropriate Growth Policy: A Unifying Framework,”
Econometrica, 2006, 4, 269314.
, Nick Bloom, Richard Blundell, Rachel Griffith, and Peter Howitt, “Competition and Innovation: An Inverted-U Relationship,” Quarterly Journal of Economics, 2005, 120, 701–728.
, Richard Blundell, Rachel Griffith, Peter Howitt, and Susanne Prantl, “Entry and Productivity Growth: Evidence from Microlevel Panel Data,” Journal of the European Economic
Association, 2004, 2, 265–276.
,
,
,
, and
, “The Effects of Entry on Incumbent Innovation and Productivity,” Review
of Economics and Statistics, 2009, 91, 20–32.
Baker, Jonathan B., “The Case for Antitrust Enforcement,” Journal of Economic Perspectives, 2003,
17, 2750.
Beck, Thorsten and Ross Levine, “Legal Institutions and Financial Development,” in Claude
M´enard and M. Shirley, eds., Handbook of New Institutional Economics, Springer, 2005,
p. 251278.
Becker, Gary, “Crime and Punishment: an economic approach,” Journal of Political Economy,
1968, 76, 169–217.
Besley, Timothy and Anne Case, “Unnatural Experiments? Estimating the Incidence of Endogenous Policies,” The Economic Journal, 2000, 110, 672–694.
Bloom, Nick and John Van Reenen, “Measuring and Explaining Management Practices Across
Firms and Countries,” Working Paper No. 12216, NBER 2006.
30
Blundell, Richard, Rachel Griffith, and John van Reenen, “Dynamic count data models of
technological innovation,” The Economic Journal of the Royal Economic Society, 1995, 105, 333–
344.
,
, and
, “Market share, market value and innovation in a panel of British manufacturing
firms,” Review of Economic Studies, 1999, 66, 529–554.
Boone, Jan, “Competitive Pressure: The Effects on Investments in Product and Process Innovation,” RAND Journal of Economics, 2000, 31, 549–569.
Botero, Juan, Simeon Djankov, Rafael La Porta, Florencio Lopez de Silanes, and Andrei
Shleifer, “The regulation of labor,” Quarterly Journal of Economics, 2004, 119, 1339–1382.
Boylaud, Oliver, Giuseppe Nicoletti, and Stefano Scarpetta, “Summary Indicators of Product
Market Regulation with an Extension to Employment Protection Legislation,” Economics
Department Working Paper, No. 226, OECD 2000.
Buccirossi, Paolo, Lorenzo Ciari, Tomaso Duso, Giancarlo Spagnolo, and Cristiana Vitale,
“Measuring the deterrence effect of competition policy: The Competition Policy Indexes,”
mimeo 2009a.
,
,
,
, and
, “Deterrence in Competition Law,” mimeo 2009b.
Caves, Douglas W., Laurits R. Christensen, and W. Erwin Diewert, “The Economic Theory
of Index Numbers and the Measurement of Input, Output, and Productivity,” Econometrica,
1982a, 50, 1393–1414.
,
, and
, “Multilateral Comparisons of Output, Input, and Productivity Using Superlative
Index Numbers,” The Economic Journal, 1982b, 92, 73–86.
Clarke, Julian L. and Simon J. Evenett, “The deterrent effects of national anticartel laws: evidence from the international vitamins cartel,” Antitrust Bulletin, 2003, 48, 689–727.
Conway, P. V. Janod and Giuseppe Nicoletti, “Product Market Regulation in OECD Countries:
1998 to 2003,” Economics Department Working Paper, No. 568, OECD 2005.
31
and
, “Product Market Regulation in the Non-Manufacturing Sectors of OECD Countries:
Measurement and Highlights,” Economics Department Working Paper, No. 530, OECD 2006.
Crandall, Robert W. and Clifford Winston, “Does Antitrust Policy Improve Consumer Welfare? Assessing the Evidence,” Journal of Economic Perspectives, 2003, 17, 3–26.
Cusack, Thomas and Susanne Fuchs, “Documentation Notes for Parties, Governments, and
Legislatures Data Set,” mimeo, Wissenschaftszentrum Berlin fr Sozialforschung 2002.
Disney, Richard, Jonathan Haskel, and Ylva Heden, “Restructuring and Productivity Growth
in UK Manufacturing,” Economic Journal, 2003, 113, 666–694.
Djankov, Simeon, Edward L. Glaeser, Rafael La Porta, Florencio Lopez de Silanes, and Andrei Shleifer, “The New Comparative Economics,” Journal of Comparative Economics, 2003a,
31, 595–619.
, Rafael La Porta, Florencio Lopez de Silanes, and Andrei Shleifer, “The Regulation of
Entry,” Quarterly Journal of Economics, 2002, 117, 1–37.
,
,
, and
, “Courts,” Quarterly Journal of Economics, 2003b, 118, 453517.
Duso, Tomaso and Jo Seldeslachts, “The Political Economy of Mobile Telecommunications
Liberalization: Evidence from the OECD Countries,” Journal of Comparative Economics, forthcoming.
and Lars-Hendrik Roller,
¨
“Endogenous Deregulation: Evidence from OECD Countries,”
Economic Letters, 2003, 81, 67–71.
Dutz, Mark and Hayri Aydin, “Does more intense competition lead to higher growth?,” Discussion Paper 2249, CEPR 1999.
and Maria Vagliasindi, “Competition Policy Implementation in Transition Economies: An
Empirical Assessment,” European Economic Review, 2000, 44, 762–772.
Glaeser, Edward L., Rafael La Porta, Florencio Lopez de Silanes, and Andrei Shleifer, “Do
Institutions Cause Growth?,” Journal of Economic Growth, 2004, 9, 271–303.
32
Griffith, Rachel, “Product market competition, efficiency and agency costs: an empirical analysis,” Working Papers, W01/12, IFS 2001.
and Rupert Harrison, “The link between product market reform and macroeconomic performance,” ECFIN economic papers No. 209, European Commission 2004.
,
, and Gareth Macartney, “Product Market Reforms, Labour Market Institutions and Un-
employment,” Economic Journal, 2006, 117, C142–C166.
, Stephen Redding, and John van Reenen, “Mapping the Two Faces of R&D: Productivity
Growth in a Panel of OECD Industries,” Review of Economics and Statistics, 2004, 86, 883895.
Haskel, Jonathan, “What raises productivity?
The Microeconomics of UK Productivity
Drowth,” Research Paper, Queen Mary, University of London 2000.
Hausman, Jerry, “Valuation of New Goods under Perfect and Imperfect Competition,” in Thimoty Bresnahan and Robert Gordon, eds., The Economics of New Goods, University of Chicago
Press, 1997, pp. 209–437.
Hicks, John R., “Annual Survey of Economic Theory: The Theory of Monopoly,” Econometrica,
1935, 3, 1–20.
Hoekman, Bernard and Hiua Looi Kee, “Imports, Entry and Competition Law as Market Disciplines,” Policy Research Working Paper No. 3031, World Bank 2003.
Høj, Jens, “Competition Law and Policy Indicators for the OECD countries,” Economics Department Working Papers No. 568, OECD 2007.
Inklaar, Robert, Marcel P. Timmer, and Bart van Ark, “Market Services Productivity,” Economic Policy, 2008, 23, 141–194.
Jorgenson, Dale W. and Daniel T. Slesnick, “Aggregate Consumer Behavior and Household
Equivalence Scales,” Journal of Business and Economic Statistics, 1987, 5, 219–232.
and James A. Stephenson, “Investment Behavior in United States Manufacturing, 19471960,” Econometrica, 1967, 5, 169–220.
33
, Mun S. Ho, and Kevin J. Stiroh, “Growth of U.S. Industries and Investments in Information
Technology and Higher Education,” in Carol Corrado, John Haltiwanger, and Daniel Sichel,
eds., Measuring Capital in the New Economy, National Bureau of Economic Research Inc, 2005,
pp. 403–478.
Klingemann, Hans-Dieter, Judith Bara, Ian Budge, Michael Macdonald, and Andrea
Volkens, Mapping Policy Preferences II: Estimates for Parties, Electors and Governments in Central
and Eastern Europe, European Union and OECD 1990-2003, Oxford: Oxford University Press,
2006.
Konings, Jozef, Patrick van Cayseele, and Frederic Warzynski, “The Dynamics of Industrial
Mark-ups in Two Small Open Economies: Does National Competition Policy Matter?,” International Journal of Industrial Organization, 2001, 19, 841–859.
Kovacic, William, “Assessing the Quality of Competition Policy: The Case of Horizontal
Merger Enforcement,” Competition Policy International, 2009, 5, 129–150.
La, Porta Rafael, Florencio Lopez de Silanes, and Andrei Shleifer, “The Economic Consequences of Legal Origins,” Journal of Economic Literature, 2008, 46, 285–332.
,
,
, and Robert W. Vishny, “Legal Determinants of External Finance,” Journal of Finance,
1997, 52, 1131–1150.
,
,
, and
, “Law and Finance,” Journal of Political Economy, 1998, 106, 1113–1155.
,
,
, and
, “Investor Protection and Corporate Valuation,” Journal of Finance, 2002, 57,
1147–1170.
Leibenstein, Harvey, “Allocative Efficiency vs. ”X-Efficiency”,” The American Economic Review,
1966, 56, 392–415.
Nalebuff, Barry J. and Joseph E. Stiglitz, “Information, Competition and Markets,” American
Economic Review, Papers and Proceedings, 1983, 73, 278–283.
34
Nickel, Stephen J., “Competition and Corporate Performance,” Journal of Political Economy,
1996, 104, 724746.
, Daphne Nicolitsas, and Neil Dryden, “What Makes Firms Perform Well?,” European Economic Review, 1997, 41, 783–796.
Nicoletti, Giuseppe and Stefano Scarpetta, “Regulation, Productivity and Growth: OECD
Evidence,” Economic Policy, 2003, 18, 9–72.
Paquet, Alain and Benoit Roubidoux, “Issues on the measurement of the Solow residual and
the testing of its exogeneity: Evidence for Canada,” Journal of Monetary Economics, 2001, 47,
595–612.
Pavcnik, Nina, “Trade Liberalization, Exit, and Productivity Improvements: Evidence from
Chilean Plants,” Review of Economic Studies, 2002, 69, 245–276.
Sproul, Michael F., “Antitrust and Prices,” Journal of Political Economy, 1993, 101, 741–754.
Syverson, Chad, “Product Substitutability and Productivity Dispersion,” Review of Economics
and Statistics, 2004, 86, 534–550.
Timmer, Marcel P., Mary O’Mahony, and Bart van Ark, “EU KLEMS Growth and Productivity
Accounts: An Overview,” http://www.euklems.net/data/overview 07I.pdf 2007.
Vickers, John, “Concepts of Competition,” Oxford Economic Papers, 1995, 47, 1–23.
Voigt, Stefan, “The Economic Effects of Competition Policy - Cross-Country Evidence Using
Four New Indicators,” mimeo 2006.
von
Mises,
Ludwig,
“Human
Action:
A
Treatise
of
Economics,”
http://mises.org/Books/HumanActionScholars.pdf., Ludwig von Mises Institute 1940.
Werden, Gregory, “The 1982 Merger Guidelines and the Ascent of the Hypothetical Monopolist Paradigm,” Antitrust Law Review, 2003, 71, 253–269.
Whinston, Michael D., Lectures on Antitrust Economics, Cambridge: MIT Press, 2006.
35
Woldendorp, Jaap, Hans Keman, and Ian Budge, Party Government in 48 Democracies (19451998), Dordrecht: Kluwer Academic Publishers, 2000.
36
7
Tables and figures
Table 1: Preliminary Statistics
TFP Growth
Obs.
1847
Mean
0.0096
St. Dev.
0.0686
Min.
-0.2818
Max
0.2727
TFP Leader
1847
0.0154
0.0931
-0.7863
0.6246
Technology Gap
1847
0.6891
0.6697
0
5.6063
R&D
1419
0.0269
0.0602
0
0.3921
Human Capital
1783
0.1171
0.0977
0.0058
0.5588
Trade openness
1847
1.0096
1.8350
0
17.2785
PMR
1847
1.6721
0.5227
0.9234
3.0336
CPI
1847
0.4976
0.1019
0.3167
0.7035
CPI institution
1847
0.6048
0.1114
0.3513
0.7735
CPI enforcement
1847
0.2802
0.1587
0.0499
0.7513
CPI antitrust
1847
0.5023
0.1032
0.3292
0.7047
CPI mergers
1847
0.4834
0.1137
0.1372
0.6999
Enforcement Costs
1847
22.1471
8.2423
9.4000
33.5000
Rule of Law
1847
1.4263
0.4141
0.5251
1.8801
Legal System
1847
8.1494
1.0655
5.5667
9.6246
Coal
1847
0.5253
0.4995
0
1
Market regulation (per403)
1847
1.3767
1.2564
0
5.5007
Economic planning (per404)
1847
0.3348
0.6229
0
2.6971
Welfare state limitation (per505)
1847
0.5264
0.5679
0
1.9637
We present preliminary statistics for all used variables in the selected estimation
sample.
37
Table 2: Basic OLS Regressions - Aggregated Index
(1)
OLS
0.0653∗∗
(0.0233)
(2)
OLS
0.0801∗∗∗
(0.0252)
(3)
OLS
0.0749∗∗
(0.0264)
(4)
OLS
0.0599∗∗
(0.0232)
(5)
OLS
0.0727∗∗
(0.0258)
(6)
OLS
0.0738∗∗
(0.0266)
L.Techno Gap
0.00748∗
(0.00413)
0.0191∗∗
(0.00618)
0.0202∗∗
(0.00643)
0.00845∗
(0.00424)
0.0208∗∗∗
(0.00607)
0.0212∗∗∗
(0.00644)
Industry trend
0.0445∗∗∗
(0.00518)
0.130∗∗∗
(0.00963)
0.130∗∗∗
(0.00948)
0.0369∗∗∗
(0.00522)
0.134∗∗∗
(0.00994)
0.130∗∗∗
(0.00948)
L.Import penetration
0.0144∗∗∗
(0.00396)
0.0133∗∗
(0.00506)
0.0155∗∗
(0.00542)
0.0147∗∗∗
(0.00415)
0.0133∗∗
(0.00504)
0.0153∗∗
(0.00543)
L.PMR
-0.0312
(0.0196)
-0.0288
(0.0190)
-0.0322∗
(0.0167)
-0.0390∗
(0.0205)
-0.0411∗
(0.0189)
-0.0356∗
(0.0170)
L.CPI
0.0924∗∗∗
(0.0243)
0.0968∗∗∗
(0.0257)
0.116∗∗∗
(0.0259)
0.0945∗∗∗
(0.0221)
0.0924∗∗∗
(0.0171)
0.121∗∗∗
(0.0270)
TFP leader
L.R&D
0.599∗
(0.324)
0.590
(0.341)
L.Human Capital
Constant
R2
Observations
-0.137∗∗
(0.0536)
0.269
1847
-0.269∗∗∗
(0.0470)
0.286
1419
-0.255∗∗∗
(0.0438)
0.280
1419
0.286
(0.172)
0.464∗
(0.215)
-0.00989
(0.0240)
0.273
1783
-0.553∗∗∗
(0.0670)
0.293
1364
-0.464∗∗∗
(0.0530)
0.282
1364
The dependent variable is TFP growth corrected for mark-ups. Standard errors in parentheses are robust
and allow for correlation among industries in the same country. In all regressions we insert country-industry
dummies and time dummies. The symbols ***, **, and * represent significance at the 1%, 5%, and 10% significance respectively.
38
Table 3: OLS Regressions - Dissagregated Indexes
(1)
OLS
0.0656∗∗
(0.0233)
(2)
OLS
0.0659∗∗
(0.0232)
(3)
OLS
0.0654∗∗
(0.0233)
(4)
OLS
0.0653∗∗
(0.0234)
Industry trend
0.0428∗∗∗
(0.00507)
0.0438∗∗∗
(0.00531)
0.0444∗∗∗
(0.00512)
0.0443∗∗∗
(0.00535)
L.Techno Gap
0.00748∗
(0.00416)
0.00755∗
(0.00419)
0.00747∗
(0.00413)
0.00751∗
(0.00415)
L.Import penetration
0.0142∗∗∗
(0.00397)
0.0144∗∗∗
(0.00396)
0.0144∗∗∗
(0.00397)
0.0144∗∗∗
(0.00395)
L.PMR
-0.0304
(0.0196)
-0.0266
(0.0250)
-0.0336
(0.0197)
-0.0249
(0.0206)
L.CPI institution
0.0705∗∗∗
(0.0227)
TFP leader
0.0400∗
(0.0195)
L.CPI enforcement
0.0957∗∗∗
(0.0255)
L.CPI antirust
0.0744∗∗∗
(0.0221)
L.CPI mergers
Constant
R2
Observations
-0.133∗∗
(0.0551)
0.268
1847
-0.117∗
(0.0594)
0.267
1847
-0.132∗∗
(0.0526)
0.269
1847
-0.143∗∗
(0.0587)
0.268
1847
The dependent variable is TFP growth corrected for mark-ups. Standard errors
in parentheses are robust and allow for correlation among industries in the same
country. In all regressions we insert country-industry dummies and time dummies. The symbols ***, **, and * represent significance at the 1%, 5%, and 10%
significance respectively.
39
Table 4: IV Regressions - Aggregated Index
(1)
IV
0.0638∗∗∗
(0.0186)
(2)
IV
0.0764∗∗∗
(0.0204)
(3)
IV
0.0640∗∗∗
(0.0186)
(4)
IV
0.0636∗∗∗
(0.0186)
(5)
IV
0.0770∗∗∗
(0.0203)
(6)
IV
0.0649∗∗∗
(0.0185)
Industry trend
0.0487∗∗
(0.0237)
0.128∗∗∗
(0.0382)
0.0486∗∗
(0.0237)
0.0491∗∗
(0.0238)
0.128∗∗∗
(0.0381)
0.0459∗
(0.0236)
L.Techno Gap
0.00737∗
(0.00400)
0.0187∗∗∗
(0.00535)
0.00722∗
(0.00401)
0.00736∗
(0.00400)
0.0188∗∗∗
(0.00533)
0.00737∗
(0.00399)
L.Import penetration
0.0146∗∗∗
(0.00361)
0.0146∗∗∗
(0.00426)
0.0146∗∗∗
(0.00361)
0.0147∗∗∗
(0.00361)
0.0144∗∗∗
(0.00425)
0.0145∗∗∗
(0.00360)
TFP leader
0.489∗∗∗
(0.174)
L.R&D
0.506∗∗∗
(0.173)
L.PMR
-0.0402∗∗∗
(0.0137)
-0.0451∗∗∗
(0.0170)
-0.0493∗∗
(0.0195)
-0.0410∗∗∗
(0.0142)
-0.0423∗∗
(0.0170)
-0.0388∗∗∗
(0.0133)
L.CPI
0.222∗∗
(0.102)
0.304∗∗
(0.136)
0.218∗∗
(0.102)
0.233∗∗
(0.115)
0.269∗∗
(0.137)
0.136
(0.0832)
-0.276∗∗∗
(0.0699)
51.00
-0.536∗∗∗
(0.146)
42.84
-0.212∗∗
(0.105)
77.33
-0.525∗∗∗
(0.145)
63.85
2.616(3)
0.21050
1847
2.880(3)
0.22832
1419
-0.258∗∗∗
(0.0750)
47.23
194.49
2.450(2)
0.40369
1847
0.781(1)
0.23658
1847
1.082(1)
0.55506
1419
0.222∗∗∗
(0.0799)
60.29
147.84
1.230(2)
0.50666
1847
Constant
First-stage F-test (CPI)
First-stage F-test (PMR)
Sargan test
Wu-Hausman test
Observations
The dependent variable is TFP growth corrected for mark-ups. Standard errors in parentheses are robust and allow
for correlation among industries in the same country. The instruments in the IV regressions reported in columns (1),
(2), and (3) are: coal, per108, per403, per404, per505. In Column(1) only the CPI is instrumented, wile in columns
(2) and (3) both CPI and PMR are instrumented. The instruments in the IV regressions reported in columns (4), (5),
and (6) are the average values of CPI and PMR among the other countries in the same group (European and nonEuropean countries) and among the other countries in a different group. In columns (1), (2), (4), and (5) only the CPI
is instrumented, while in columns (3) and (6) both CPI and PMR are instrumented. The value of the F-statistic for the
test of excluded instruments in the first-stage regressions is reported. The Sargan statistic is distributed as a χ2 and
the degrees of freedom parameters are in parentheses. We report the p-value for the Wu-Hausman F-Statistic. In all
regressions we insert country-industry dummies and time dummies. The symbols ***, **, and * represent significance
at the 1%, 5%, and 10% significance respectively.
40
Table 5: Interactions Regressions
L.CPI
(1)
OLS
0.0830∗∗∗
(0.0204)
L.CPI LOe
L.CPI LOg
L.CPI LOf
L.CPI LOn
(2)
OLS
(3)
OLS
0.0881∗∗∗
(0.0143)
0.182∗∗∗
(0.0324)
0.0206
(0.0406)
0.263∗∗
(0.117)
L.CPI lEC
L.CPI mEC
L.CPI hEC
0.240∗
(0.122)
0.110∗∗∗
(0.0256)
0.0938∗∗
(0.0368)
L.CPI lRL
L.CPI mRL
L.CPI hRL
(4)
OLS
(5)
OLS
0.0837∗∗
(0.0310)
0.0945∗∗∗
(0.0197)
0.117∗∗
(0.0532)
L.CPI lLS
0.0553
(0.0406)
0.0722∗∗∗
(0.0253)
0.0830∗∗∗
(0.0255)
L.CPI mLS
L.CPI hLS
L.CPI service
0.0172
(0.0473)
0.130∗∗∗
(0.0321)
L.CPI manifacturing
English legal origin
French legal origin
Nordic legal origin
Enforcement Cost
Rule of law
Legal system
R2
Observations
(6)
OLS
-0.291∗∗∗
(0.0366)
-0.304∗∗∗
(0.0427)
-0.202∗∗∗
(0.0348)
-0.01000∗∗∗
(0.000744)
0.0211
(0.0298)
0.0115∗
(0.00591)
0.273
1847
0.0359∗∗
(0.0139)
0.0717∗∗
(0.0247)
-0.0939
(0.0826)
-0.00627∗∗
(0.00265)
0.0471
(0.0391)
0.270
1847
0.271
1847
0.270
1847
0.0137∗
0.0069
0.270
1847
0.270
1847
The dependent variable is TFP growth corrected for mark-ups. Standard errors in parentheses
are robust and allow for correlation among industries in the same country. In all regressions
we insert country-industry dummies and time dummies. We control for the following variables
’TFP leader’, ’Techno Gap’, ’Industry trend’, ’PMR’, ’Import penetration’ and a constant term
but we do not report the coefficient estimates for space limitation and as they are comparable
with those reported in Table 2. The symbols ***, **, and * represent significance at the 1%, 5%,
and 10% significance respectively.
41
Table 6: Robustness Checks
(1)
(OLS)
FA
0.0657∗∗
(0.0232)
(2)
(OLS)
EU
0.0655∗∗
(0.0234)
(3)
(OLS)
Non corr
0.0372
(0.0340)
(4)
(OLS)
LP
0.0402
(0.0394)
(5)
(OLS)
Long run I
0.0734∗∗
(0.0248)
(6)
(OLS)
Long run II
0.0842
(0.272)
(7)
(OLS)
Long run I
0.0185
(0.139)
L.Techno Gap
0.00751∗
(0.00414)
0.00746∗
(0.00415)
0.0564∗∗∗
(0.0177)
0.00840∗∗∗
(0.00171)
-0.00270
(0.00556)
0.0672∗∗
(0.0286)
-0.00699
(0.0152)
Industry trend
0.0426∗∗∗
(0.00501)
0.0450∗∗∗
(0.00554)
0.0533∗∗∗
(0.00569)
0.0536∗∗∗
(0.00714)
0.0548∗∗∗
(0.00433)
0.00777
(0.0265)
0.00513∗∗
(0.00204)
-0.0315
(0.0200)
-0.0277
(0.0204)
-0.0141
(0.0213)
-0.0289
(0.0237)
0.00642
(0.0353)
-0.171
(0.0969)
-0.0406
(0.0377)
L.Import penetration
0.0143∗∗∗
(0.00399)
0.0143∗∗∗
(0.00393)
0.0183∗∗∗
(0.00524)
0.0172∗∗∗
(0.00400)
0.00792
(0.00511)
0.0812
(0.0506)
0.00499∗
(0.00270)
L.CPI
0.0726∗∗
(0.0235)
0.115∗∗∗
(0.0369)
0.0662∗
(0.0304)
0.102∗∗∗
(0.0298)
0.0792∗
(0.0397)
0.332∗
(0.156)
0.0903∗
(0.0480)
Constant
-0.126∗∗
(0.0546)
0.268
1847
-0.152∗∗
(0.0601)
0.268
1847
-0.233∗∗∗
(0.0430)
0.274
1850
-0.644∗∗∗
(0.0929)
0.302
1651
-0.230∗∗∗
(0.0628)
0.301
1275
0.0359
(0.182)
0.414
1479
0.0403
(0.0679)
0.394
802
TFP/LP leader
L.PMR
R2
Observations
In Columns (1), (2), (4), (5), (6), and (7) the dependent variable is TFP growth corrected for mark-ups. In column(3) the dependent variable is TFP growth non-corrected for mark-ups. Column (1) reports results for the model where the Aggregate
CPI is constructed on the base of the weights obtained by factor analysis (FA). Column (2) reports results for the model
where the Aggregate CPI for EU member states incorporates information about EU competition policy. Column (3) reports
results where all productivity measures are based on TFP non-corrected for mark-ups. Column (4) reports results where
the technology gap and the productivity level of the country at the frontier are based on labor productivity. Column (5)
reports results where all explanatory variables are lagged three years instead of one. Column (6) reports results based on a
three-year time horizon; the explanatory variables are measured at the beginning of the period. Column (7) reports results
based on a three-year time horizon; all variables are three-years averages. In this last specification, given the lack of degree
of freedom, we use 12 country and 22 industry fixed effects, instead of 264 country-industry fixed effects. The symbols ***,
**, and * represent significance at the 1%, 5%, and 10% significance respectively.
42
Figure 1: Distribution of the β Coefficients obtained by Random Weights
In the first panel, we represent the distribution of the estimated β coefficients from 1,000 regressions. In each of this
regression the CPI index is built using random weights derived from a uniform distribution (0,1) and normalized to sum to
1. In the second panel, we represent the distribution of the t-statistics for the estimated coefficients. The red lines represent
the critical value for significance at the 10% level.
Figure 2: Distribution of the β Coefficients and T-statistics obtained by Excluding Countries
In the first panel, we represent the distribution of the estimated β coefficients from 156 regressions. In each of this regression
we exclude one or two countries from our sample. In the second panel, we represent the distribution of the t-statistics for
the estimated coefficients. The red lines represent the critical value for significance at the 10% level.
43
Figure 3: Distribution of the β Coefficients and T-statistics obtained by Excluding Industries
In the first panel, we represent the distribution of the estimated β coefficients from 506 regressions. In each of this regression
we exclude one or two industries from our sample. In the second panel, we represent the distribution of the t-statistics for
the estimated coefficients. The red lines represent the critical value for significance at the 10% level.
44
A
The Indexes
The Competition Policy Indexes, CPIs, incorporate data on how the key features of a competition policy regime score against a benchmark of generally-agreed best practices and summaries them. The CPIs have a pyramidal structure which encompasses a large number of
sub-indicators that are progressively linearly combined using a set of weights at each level of
aggregation. This structure is described in Tables A1, A2 and A3.
Table A1 shows the content of low-level indexes. The weights used to sum the information
contained in each index are indicated in brackets.
45
Table A2 shows the eight medium-level indexes, which are given by the weighted average
of the relevant low-level indexes. The weights are indicated in brackets.
Table A3 shows the different CPIs we built and the weights (in brackets) used in the aggregation process.
We now turn to the values of the Aggregate CPIs for the countries in our sample over the period 1995-2005. Figures A1 to A3 give a general idea of the measure of the deterrence properties
of the competition policy in these countries and of the relevant changes occurred over time. It
is evident from them that there is substantial cross-sectional and cross-time variation. It should
be stressed that the institutional component of the aggregate index takes a greater weight (2/3),
hence the evolution of the Aggregate CPIs is mostly explained by the institutional features of
46
the competition policy which is relatively stable.43
To allow a clearer interpretation of the results we include only a limited number of countries
in each figure. Yet, to allow readers to easily perform comparisons among them, we report in
each figure the sample average. Figure A1 shows the Institutional CPIs for the three OECD
countries in our sample that are not part of the EU: Canada, Japan and the US.
The Aggregate CPIs of the non-EU countries changed more or less quickly over the period
under exam,44 and they differ considerably among each other. The aggregate CPI for the US
has very high values, which are constantly among the highest in the sample and well above
the sample average; the values for Canada are also above the sample average, while Japan’s
values are very low and among the lowest in the sample for the entire period. The reason
behind Japan’s low performance is manifold. First, Japan suffers from the lack of a leniency
program for cartels’ whistleblowers. Second, in Japan there is no separation between the body
that prosecutes violators of the antitrust law and the body that adjudicates such cases. Third,
the Japanese CA has limited human and financial resources. Further elements, are the absence
of the possibility to start a class action and the fact that the Japanese competition legislation
43 The
enforcement features undergo more frequent changes and so do the Enforcement CPIs. For the sake of
space we have only shown the values of Aggregate CPIs. For more details on the values of the other CPIs refer to
Buccirossi et al. (2009a).
44 Only for Japan are the changes in the Aggregate CPI lower than an average of 1% per year.
47
envisages the consideration of non strictly-economic goals when assessing the effects of abuses
of dominance.
Figure A2 depicts the Aggregate CPIs for the large EU member states in our sample: France,
Italy, Germany, Spain and the UK.
The first element to notice in this figure is that the data for the first five years in the sample are missing for Spain and France. This lack of information does not allow one to have a
clear picture of the trend for these two jurisdictions. Anyhow, the Aggregate CPIs for these
two countries, as well as for Italy, are consistently below the sample average. Both Spain and
France experience a substantial improvement between 2000 and 2003. The former benefited
from the introduction of class action in 2001 and of the powers to investigate business premises
in 2003. In the latter the quality of the institutional CPI improved because of the introduction
of a leniency program for cartels’ whistleblowers and of the obligation to notify mergers. Germany shows a good and constant performance. Notably, the CPIs for the UK start well below
all the values of the CPIs of the other countries, but over time they become the highest in the
group. This is due to the dramatic institutional changes that accompanied the introduction of
the Competition Act in 2000, which were coupled with a steady increase in the financial and
human resources of the two CAs.
Figure A3 depicts the Aggregate CPIs for the small EU member states in our sample: the
48
Czech Republic, Hungary, the Netherlands and Sweden.
Sweden is consistently the country with the highest CPI value, not just in this group, but
in the whole sample, yet this slowly declines over time because of a reduction, in real terms,
of the financial and human resources available to its CA. Instead, the CPIs for the other jurisdictions start below the sample average, but they all improve over time. The Czech Republic
experiences a first, considerable shift in 1996, due to the CA acquiring independence from the
government - previously all decisions were taken by a ministerial department. A further improvement takes place in 2004, when the power to investigate business premises is introduced,
but its CPI never moves above the average. In Hungary the major changes happen in 2000,
when there is an increase in the investigative powers of the CA and a shift in the criterion used
to set the sanctions for antitrust infringements, which changed from a discretionary decision
left to the adjudicator to an approach based on the firm’s turnover, and in 2002, because of an
increase in the budget of the CA.
The Netherlands did not have a CA before 1998. Hence, it was not possible to calculate a
CPI until that year. In subsequent years, the index steadily rises as a consequence of a regular
increase in the amount and in the quality of its CA’s resources.
These three figures give a general idea of the factors that affect the ability of a competition
policy regime to deter anti-competitive behavior in the jurisdictions included in our sample
49
and of how these have changed over time. It is evident from them that there is substantial
cross-sectional and cross-time variation.
Table A4 instead shows the ranking of the 12 countries in our sample based on the average
value of their Aggregate CPIs over the years 1995 to 2005 and on its value in 2005. Sweden
and the US are the best-scoring countries and this is true for each year in the sample, similarly France, Spain and Japan constantly have the lowest scores. The UK and Canada are the
countries that experience the most marked change.
B
The TFP Measures
In this appendix we describe in more detail the TFP growth and Technology Gap variables
employed in our regressions.
TFP growth. The measure of TFP growth employed in our regressions is taken from the
EU-KLEMS database.45 The database improves substantially on the existing industry level
databases, among which the OECD STAN database and its predecessor the ISDB database.
The main limitation of previously existing databases is that they provide industry-level series
on output, aggregate hours worked and aggregate capital stock, ignoring changes in the com45 The EU-KLEMS database is the result of a research project funded by the European Commission that involves
major national level economic and statistical research centers. Details about the EU-KLEMS project can be found at
the website: www.euklems.net. An overview of the methodology employed to collect data and build the measures
of productivity can be found in Timmer et al. (2007).
50
position of factor inputs. As a result, TFP measures based on these aggregate quantities might
be biased. On the contrary, the KLEMS database takes changes in the composition of the labor
force over time into account. Furthermore, it discriminates among different types of capital
input measures.
The TFP measure reported by the KLEMS database and employed in our regressions is
based on the growth accounting methodology, which essentially consists of decomposing output growth into the contribution of input growth (labor and capital) and TFP growth.46 TFP
measures within the growth accounting framework are based on several assumptions: in particular, it is assumed that markets are perfectly competitive and that inputs are fully utilized.
Under these assumptions, TFP growth can be written as follows:
∆TFPijt = ln(
Yijt
Lijt
Kijt
1
1
) − (αijt + αijt−1 )ln(
) − (1 − (αijt + αijt−1 ))ln(
)
Yijt−1
2
Lijt−1
2
Kijt−1
(2)
where Yijt is real value added, Lijt measures the labor input and the Kijt capital input. Within
the EU-KLEMS database, accurate measures of labor and capital input are based on a breakdown of aggregate hours worked and aggregate capital stock into various components. Hours
worked are cross-classified by various categories to account for differences in the productivity
of various labor types, such as high- versus low-skilled labor. Similarly, capital stock measures
are broken down into stocks of different asset types.47 The term αijt measures the labor share
in value added. For our study, given that we measure the effectiveness of competition policy in promoting competition and ultimately efficiency, the main concern related to the TFP
measure reported in the EU-KLEMS database is the assumption of perfect competition in the
product markets. In order to take the existence of imperfectly competitive product markets into
account, we modify the expression in equation (2) and multiply the labor share by industryspecific mark-ups.48
46 The
growth accounting methodology for computing productivity has long standing history. For a full account
of the methodology see Jorgenson et al. (1967, 1987, 2005) and Caves (1982a, 1982b).
47 The EU-KLEMS database covers all the countries involved in our study except for Canada. For measuring
TFP growth for Canada, we use data from the Groningen Growth and Development Centre (GGDC). The GGDC
methodology is totally analogous to the one adopted by the EU-KLEMS consortium, of which the GGDC is member.
The correlation between the EU-KLEMS TFP and the GGDC TFP is high (0.7) and strongly significant. However,
we run specifications excluding Canada and results remain qualitatively and quantitatively unchanged.
48 In this, we follow the existing literature that explores the determinants of TFP growth. See, for example, Griffith
51
We estimate industry level mark-ups as in Griffith and Harrison (2004), using the following
equation:
Markupijt =
ValueAddedijt
LaborCostsijt + CapitalCostsijt
(3)
where ValueAddedijt is nominal value added, Labor Costs is labor compensation and Capital Costs is capital compensation.49 The main source of data for computing mark-ups is still
the EU-KLEMS database.50 An important aspect to notice is that the measure of capital input
necessary to compute capital costs is a somewhat cruder measure than the one employed in the
construction of the TFP measure. In particular, we use an aggregate measure of capital stock,
not accounting for different types of capital assets.51 This capital stock measure is computed
starting from the real gross fixed-capital formation series available in the EU-KLEMS database,
using the perpetual inventory method.
Technology gap. One of the main regressors in our specifications is the technology gap
between a country-industry in a given year and the technological frontier. There are several
ways, which can potentially be used to measure the technology gap. In our study, we follow the
existing literature and use TFP level to compute the distance to the technological frontier.52 The
computation of the technology gap is made in two steps. The first step consists of evaluating
the level of TFP in each country-industry relative to a common reference point - the geometric
mean of the TFPs of all other countries in the same industry. This measure of the TFP level with
respect to the average is given by:
TFPijt = ln(
Yijt
Y jt
)−e
σijt ln(
Lijt
L jt
) − (1 − e
σijt )ln(
Kijt
K jt
)
where the output and input measures are the same employed in the measurement of TFP
et al. (2004), Aghion et al. (2009) and Nicoletti and Scarpetta (2003).
49 The Capital Costs measure is obtained by multiplying the capital stock for the user cost of capital, which takes
into account the real interest rate and the extent of capital depreciation. For details see Griffith et al. (2006).
50 For the computation of capital costs, we needed data on the inflation rate as well as on the yield on 10-years
Federal Reserve Bonds. These come from the OECD MEI (Main Economic Indicators) database.
51 The reason why we use an aggregate measure of the capital stock is that the series on gross fixed-capital formation disaggregated for different types of assets are publicly available in the EU-KLEMS database only for a limited
number of countries.
52 In the effort to verify the robustness of our results, we employ also a different measures of technology gap,
based on labor productivity (value added per worker) differences among country-industries. The results remain
basically unchanged, suggesting a stronger role for the technology gap in explaining TFP performance and weaker
one for TFP growth on the technological frontier.
52
growth, and the bar denotes a geometric mean.53 The variable e
σijt = 21 (αijt + α jt ) is the average
of the labour share in country i and the geometric mean labour share. The technology leader is
defined as the country-industry with the highest value for the TFP level relative to the common
reference point. The second step for computing the technology gap consists in subtracting
TFPijt from TFPLjt , where the latter is the TFP level in the identified country-industry leader.
The technology gap variable used in our regressions is thus: TechnoGapijt = TFPLjt − TFPijt
53 Data are aggregated using national level purchasing power parities (PPPs). For the base year we use for measuring real variables (2000), neither industry level PPPs for value added nor capital specific PPPs are available.
53
Bücher des Schwerpunkts Märkte und Politik
Books of the Research Area Markets and Politics
Kai A. Konrad, Tim Lohse (Eds.)
Einnahmen- und Steuerpolitik in Europa:
Herausforderungen und Chancen
2009, Peter Lang Verlag
Bob Hancké
Large Firms and Institutional Change. Industrial
Renewal and Economic Restructuring in France
2002, Oxford University Press
Kai A. Konrad
Strategy and Dynamics in Contests
2009, Oxford University Press
Andreas Stephan
Essays on the Contribution of Public Infrastructure to Private: Production and its Political
Economy
2002, dissertation.de
Roger D. Congleton, Arye L. Hillman, Kai A. Konrad
(Eds.)
40 Years of Research on Rent Seeking
2008, Springer
Kai A. Konrad, Beate Jochimsen (Eds.)
Föderalismuskommission II:
Neuordnung von Autonomie und Verantwortung
2008, Peter Lang Verlag
Mark Gradstein, Kai A. Konrad (Eds.)
Institutions and Norms in Economic Development
2007, MIT Press
Johannes Münster
Mobbers, Robbers, and Warriors
2007, Shaker Verlag
Kai A. Konrad, Beate Jochimsen (Eds.)
Der Föderalstaat nach dem Berlin-Urteil
2007, Peter Lang Verlag
Kai A. Konrad, Beate Jochimsen (Eds.)
Finanzkrise im Bundesstaat
2006, Peter Lang Verlag
Robert Nuscheler
On Competition and Regulation in Health Care
Systems
2005, Peter Lang Verlag
Pablo Beramendi
Decentralization and Income Inequality
2003, Madrid: Juan March Institute
Thomas R. Cusack
A National Challenge at the Local Level: Citizens,
Elites and Institutions in Reunified Germany
2003, Ashgate
Sebastian Kessing
Essays on Employment Protection
2003, Freie Universität Berlin
http://www.diss.fu-berlin.de/2003/202
Daniel Krähmer
On Learning and Information in Markets and
Organizations
2003, Shaker Verlag
Tomaso Duso
The Political Economy of the Regulatory Process:
An Empirical Approach
Humboldt-University Dissertation, 2002, Berlin,
http://edoc.hu-berlin.de/dissertationen/duso-tomaso2002-07-17/PDF/Duso.pdf
Peter A. Hall, David Soskice (Eds.)
Varieties of Capitalism
2001, Oxford University Press
Hans Mewis
Essays on Herd Behavior and Strategic Delegation
2001, Shaker Verlag
Andreas Moerke
Organisationslernen über Netzwerke – Die
personellen Verflechtungen von Führungsgremien
japanischer Aktiengesellschaften
2001, Deutscher Universitäts-Verlag
Silke Neubauer
Multimarket Contact and Organizational Design
2001, Deutscher Universitäts-Verlag
Lars-Hendrik Röller, Christian Wey (Eds.)
Die Soziale Marktwirtschaft in der neuen
Weltwirtschaft, WZB Jahrbuch 2001
2001, edition sigma
Michael Tröge
Competition in Credit Markets: A Theoretic
Analysis
2001, Deutscher Universitäts-Verlag
Torben Iversen, Jonas Pontusson, David Soskice
(Eds.)
Unions, Employers, and Central Banks
2000, Cambridge University Press
Tobias Miarka
Financial Intermediation and Deregulation:
A Critical Analysis of Japanese Bank-FirmRelationships
2000, Physica-Verlag
Rita Zobel
Beschäftigungsveränderungen und
organisationales Lernen in japanischen
Industriengesellschaften
2000, Humboldt-Universität zu Berlin
http://dochost.rz.hu-berlin.de/dissertationen/zobel-rita2000-06-19
Jos Jansen
Essays on Incentives in Regulation and Innovation
2000, Tilburg University
DISCUSSION PAPERS 2008
Dan Kovenock
Brian Roberson
Inefficient Redistribution and Inefficient
Redistributive Politics
SP II 2008 – 01
Dan Kovenock
Brian Roberson
Coalitional Colonel Blotto Games with Application
to the Economics of Alliances
SP II 2008 – 02
The Future of Fiscal Federalism
SP II 2008 – 03
Love and Taxes – and Matching Institutions
SP II 2008 – 04
Benny Geys
Jan Vermeir
Party Cues and Yardstick Voting
SP II 2008 – 05
Benny Geys
Jan Vermeir
The Political Cost of Taxation:
New Evidence from German Popularity Ratings
SP II 2008 – 06
The Alliance Formation Puzzle and Capacity
Constraints
SP II 2008 – 07
Johannes Münster
Repeated Contests with Asymmetric Information
SP II 2008 – 08
Kai A. Konrad
Dan Kovenock
Competition for FDI with Vintage Investment and
Agglomeration Advantages
SP II 2008 – 09
Kai A. Konrad
Non-binding Minimum Taxes May Foster Tax
Competition
SP II 2008 – 10
Florian Morath
Strategic Information Acquisition and the Mitigation
of Global Warming
SP II 2008 – 11
Domestic Rivalry and Export Performance: Theory
and Evidence from International Airline Markets
SP II 2008 – 12
Jonathan Beck
Diderot’s Rule
SP II 2008 – 13
Susanne Prantl
The Role of Policies Supporting New Firms:
An Evaluation for Germany after Reunification
SP II 2008 – 14
On the Stability of Research Joint Ventures:
Implications for Collusion
SP II 2008 – 15
Is the 50-State Strategy Optimal?
SP II 2008 – 16
The Impact of Horizontal Mergers on Rivals:
Gains to Being Left Outside a Merger
SP II 2008 – 17
Exploring Sources of Local Government Technical
Inefficiency: Evidence from Flemish Municipalities
SP II 2008 – 18
Local Governments in the Wake of Demographic
Change: Evidence from German Municipalities
SP II 2008 – 19
Group Contest Success Functions
SP II 2008 – 20
Measuring Local Government Technical
(In)efficiency: An Application and Comparison of
FDH, DEA and Econometric Approaches
SP II 2008 – 21
Vito Tanzi
Kai A. Konrad
Kjell Erik Lommerud
Kai A. Konrad
Dan Kovenock
Joseph Clougherty
Anming Zhang
Jo Seldeslachts
Tomaso Duso
Enrico Pennings
Dan Kovenock
Brian Roberson
Joseph Clougherty
Tomaso Duso
Benny Geys
Wim Moesen
Benny Geys
Friedrich Heinemann
Alexander Kalb
Johannes Münster
Benny Geys
Wim Moesen
DISCUSSION PAPERS 2009
Áron Kiss
Coalition Politics and Accountability
SP II 2009 – 01
Voter Involvement, Fiscal Autonomy and Public
Sector Efficiency: Evidence from German
Municipalities
SP II 2009 – 02
Salmai Qari
Kai A. Konrad
Benny Geys
Patriotism, Taxation and International Mobility
SP II 2009 – 03
Kai A. Konrad
Salmai Qari
The Last Refuge of a Scoundrel? Patriotism and
Tax Compliance
SP II 2009 – 04
Sven Chojnacki
Nils Metternich
Johannes Münster
Mercenaries in Civil Wars, 1950-2000
SP II 2009 – 05
Oliver Gürtler
Johannes Münster
Sabotage in Dynamic Tournaments
SP II 2009 – 06
Non-Partisan ‘Get-Out-the-Vote’ Efforts and Policy
Outcomes
SP II 2009 – 07
An Experimental Investigation of Colonel Blotto
Games
SP II 2009 – 08
Michael R. Baye
Dan Kovenock
Casper G. de Vries
Contests with Rank-Order Spillovers
SP II 2009 – 09
Florian Morath
Johannes Münster
Information Acquisition in Conflicts
SP II 2009 – 10
Wars, Presidents and Popularity:
The Political Cost(s) of War Re-examined
SP II 2009 – 11
Competition policy and productivity growth:
An empirical assessment
SP II 2009 – 12
Benny Geys
Friedrich Heinemann
Alexander Kalb
Dan Kovenock
Brian Roberson
Subhasish M.
Chowdhury
Dan Kovenock
Roman M. Sheremeta
Benny Geys
Paolo Buccirossi
Lorenzo Ciari
Tomaso Duso
Giancarlo Spagnolo
Cristiana Vitale
Bei Ihren Bestellungen von WZB-Papers schicken
Sie bitte unbedingt einen an Sie adressierten Aufkleber mit sowie je paper eine Briefmarke im Wert
von 0,51 Euro oder einen "Coupon Reponse International " (für Besteller aus dem Ausland)
Please send a self addressed label and postage
stamps in the amount of 0.51 Euro or a "CouponReponse International" (if you are ordering from
outside Germany) for each WZB-paper requested
Bestellschein
Order Form
Absender / Return Address:
Wissenschaftszentrum Berlin
für Sozialforschung
Presse- und Informationsreferat
Reichpietschufer 50
D-10785 Berlin-Tiergarten
Hiermit bestelle ich folgende(s)
Discussion paper(s):
Please send me the following
Discussion paper(s):
Bestell-Nr. / Order no.
Autor/in, Kurztitel /Author(s) / Title(s) in brief


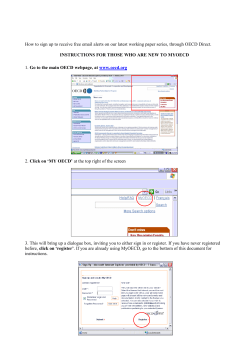

© Copyright 2026