
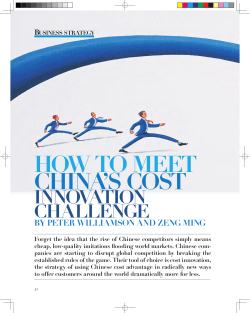
BACKGROUNDER How to Make China More Honest Key Points
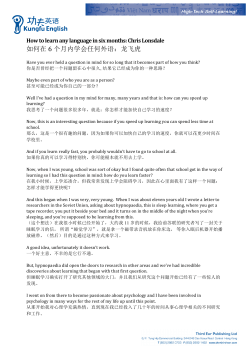
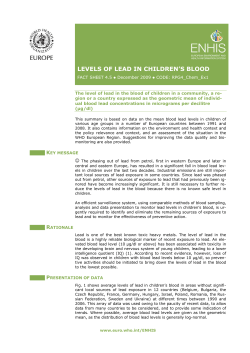
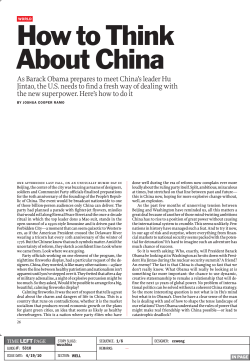
BACKGROUNDER
No. 2839 | September 4, 2013
How to Make China More Honest
Derek Scissors, PhD
Abstract
Official Chinese economic statistics, from unemployment to arable
land, are controlled by the Communist Party and therefore cannot be
trusted. The prevailing American and global view of China as a rising,
if presently troubled, economic superpower is based on this unreliable
data. Evaluation of selected economic, financial, and sociopolitical
indicators shows them to be inconsistent and most likely inaccurate, so
that American and global decision making is badly informed. A sustained effort to compile more accurate data on China would clarify
China’s global economic role and improve the basis for U.S. policymaking and limit taxpayer exposure.
Key Points
■■
■■
C
hina is far more economically open today than the Soviet Union
was when its collapse surprised the U.S. policy community in
1991. Still, the Chinese Communist Party controls and manipulates
the information it releases. The prevailing American view of the
People’s Republic of China (PRC) as a rising economic superpower,
even if struggling a bit, is based on this poor information. American
decision making requires considerably better data, so that policy
can be based on actual conditions in the PRC.
There are indicators, concerning unemployment, inflation, nonperforming financial assets, debt, public health, and inequality, that
would illuminate the true state of the Chinese economy, and to some
extent its societal well-being. These specific indicators are chosen
for their nature and their salience. They are quantifiable in nature,
requiring less judgment and suffering from less bias. They are numbers the PRC itself presents, though inaccurately, because they lie
This paper, in its entirety, can be found at http://report.heritage.org/bg2839
Produced by the Asian Studies Center
The Heritage Foundation
214 Massachusetts Avenue, NE
Washington, DC 20002
(202) 546-4400 | heritage.org
Nothing written here is to be construed as necessarily reflecting the views of The Heritage
Foundation or as an attempt to aid or hinder the passage of any bill before Congress.
■■
■■
■■
The U.S. understanding of China’s
economy is flawed. Chinese government data are manipulated for
political reasons, making them a
faulty basis for policymaking and
commercial decisions.
The key indicators of the real
economy—unemployment and
inflation—are misrepresented by
official figures. Unemployment is
much higher than Beijing claims;
inflation has been higher than
claimed, as well.
The most sensitive financial indicators, measuring various kinds
of debt, are often altered to hide
the extent of problems. China’s
financial system cannot be understood by loose comparisons to
America’s financial system.
Sociopolitical indicators, such
as income and life expectancy,
also appear altered. The reasons
behind stark income inequality
and uneven life expectancy, which
show bias in government policies,
are heavily suppressed.
It is past time for the U.S. to make
a concerted effort to gather better data on the Chinese economy—to improve American policymaking, and to clarify China’s
global role.
BACKGROUNDER | NO. 2839
September 4, 2013
at the core of Chinese prosperity and economic and
political stability. And they are often used as constitutive elements in outside assessments of China, or
simply repeated as the only data available.
The easy conclusion when examining these indicators is the party is attempting to hide areas of
considerable economic vulnerability. Information
about this vulnerability may offer the U.S. government leverage on both economic and political issues, a topic which others can explore.1 What
can be demonstrated now is that the continuation of China’s positive role in the global economy
requires far greater transparency, closer to that of
the Organisation for Economic Co-operation and
Development (OECD) economies. The PRC’s transparency failures are a considerable problem, for
both itself and its partners.
In response, the U.S. government should encourage the PRC to be more transparent. More important, it should initiate its own programs and support
existing private efforts to gather better data on key
Chinese indicators. An element of the U.S. government action should be strict limitations on U.S. taxpayer support—direct or indirect—for projects in
China and ventures with Chinese entities.
Macroeconomic Transparency
There is a worldwide obsession with Chinese
gross domestic product (GDP). GDP is a poor measure of national wealth and economic performance.
This is especially true in China where so many transactions are “empty”: China’s official benchmark of
fixed asset investment for 2012, for instance, was
about $1.75 trillion higher than the State Statistical
Bureau’s (SSB) number for gross fixed capital formation, the standard international measure.2 Land
or used machinery changes hands but creates no
additional value. Funds are said to be spent, with
no identified benefit. Fixed asset investment is dutifully reported every month, while gross fixed capital
formation appears only once a year.
What the party cares about in economic terms
is not GDP or fixed investment, but inflation and
unemployment. The former led to massive protests
for democratic reform, and ultimately violence,
from 1987 to 1989. Fear of the latter has driven
Chinese economic policy for 15 years, in particular
the panicked response to the global financial crisis
that ensured the current economic stagnation.3
Unemployment. The crucial nature of unemployment is straightforward: The jobless are more prone
to mass protest. High unemployment is a threat to
political stability in the PRC, as it is everywhere else.
This is why the only regularly published unemployment rate is “urban registered unemployed” (read:
whom the Ministry of Human Resources and Social
Security is willing to count). These are exclusively
urban workers in the jurisdiction where they are
officially registered, and who have worked for certain periods for surveyed employers (most of which
are state entities).
This definition accounts for the trend over time.
When the global financial crisis struck, China faced
the possibility of mass unemployment and responded with unprecedented bank lending.4 Yet official
employment actually rose sharply, because workers
fled a shrinking private sector for the state sector.
This also helps explain the perception that the state
sector has advanced at the expense of the private
sector. Because the Ministry of Human Resources
counts as it likes, the unemployment rate never
exceeds 5 percent, with the number of urban jobless
1.
The Claremont Institute, “The Coming China Nexus of the Global Markets and U.S. Security Community,” April 2012, http://www.pssi.cz/
download/docs/166_the-coming-china-nexus-of-the-global-markets-and-u-s-security-community.pdf (accessed August 12, 2013).
2.
Derek Scissors, “GDP: I Do Not Think It Means What You Think It Means,” The Heritage Foundation, The Foundry, June 13, 2013, http://blog.
heritage.org/2013/06/13/gdp-i-do-not-think-it-means-what-you-think-it-means/. In 2012, the State Statistical Bureau estimated gross
capital formation contributed 46 percent of GDP yet reported fixed investment equivalent to 70 percent of GDP. For an explanation of the gap
between investment measures, see Shen Minggao, “Macroreview: Deconstructing China’s Investment,” Caijing, July 16, 2013, http://english.
caijing.com.cn/2009-07-16/110198793.html (accessed August 9, 2013).
3.
“China’s Urban Unemployment Rate Rises to 4.2%,” China Daily, January 20, 2009, http://www.chinadaily.com.cn/business/2009-01/20/
content_7412656.htm (accessed August 9, 2013), and “China Reports Record 9.59 Trln Yuan in Loans in 2009,” China View, January 15, 2010,
http://news.xinhuanet.com/english/2010-01/15/content_12816059.htm (accessed August 9, 2013).
4.
Tan Yingzi and Xin Dingding, “20 Million Migrants Lost Jobs: Survey,” China Daily, March 2, 2009, http://www.chinadaily.com.cn/
china/2009-02/03/content_7440106.htm (accessed August 9, 2013), and Derek Scissors, “China’s Economy: Something Is Not Right in
Beijing,” Heritage Foundation WebMemo No. 2775, January 25, 2010, http://www.heritage.org/research/reports/2010/01/chinas-economysomething-is-not-right-in-beijing.
2
BACKGROUNDER | NO. 2839
September 4, 2013
CHART 1
Registered Urban Workers
175 MILLION
152.4 million
150
125
100
75
50
25
0
1998 2000 2002 2004 2006 2008 2010 2012
Source: National Bureau of Statistics, China Monthly Statistics,
Beijing.
B 2839
heritage.org
presently between 9 million and 10 million.
At the other end of the spectrum in terms of the
jobs challenge is a September 2010 government white
paper on human resources that puts the total labor
force at 1.07 billion, and the number of employed at
780 million. The 290 million who are not reported
as employed are mostly registered in rural areas.5
Many are farmers and therefore self-employed (and
perhaps also underemployed).
Between this and registered urban unemployed
are a host of unofficial estimates. One recently developed estimation technique is to compare the number of job seekers to urban jobs available, using data
from government job centers. Unlike the official
measure, this technique revealed a surge in joblessness when the global financial crisis struck. At
present, however, the number of job seekers used is
not even as large as the ministry’s partial figure for
annual urban labor-market entrants. It thus gives a
wildly optimistic picture of overall unemployment.6
It is hardly just China where published unemployment rates are misleading; even much richer
economies struggle. But no other country offers an
ostensible range of 10 million to 300 million idle or
partly idle laborers. If, say, 175 million people are
unhappy because they cannot find adequate work,
the PRC is extremely vulnerable to events that
threaten employment.
Consumer Purchasing Power. Casual observations about how much richer the PRC has become, in
terms of GDP per capita or foreign reserves, neglect
that the economy consists of people. What matters
is their wealth. This wealth has to be controlled
for inflation, and official inflation estimates are
inadequate.
The GDP deflator is the price change implied
by the difference between the on-year nominal
increase in GDP and announced “real” GDP growth.
When the Chinese economy is expanding rapidly,
the deflator rises far faster than the consumer price
index (CPI), making growth look slower. The main
reason for this is that the deflator includes housing. (Unlike the CPI, it also includes producer goods,
which see sharper price shifts in both directions.) A
separate index of housing prices ceased publication
at the end of 2010, because reported inflation hit
double figures in 2009 and 2010, and even that was
low compared to the values implied by space sold
and revenue. While none of the indicators is anywhere close to ideal, implications of changes in the
GDP deflator are often neglected. Closer examination and accounting for its makeup offers a different
perspective on some of the reported numbers.
The other side of purchasing power, of course, is
income. In rural areas, Chinese personal income previously lagged GDP growth, as more gains accrue to
state enterprises and their employees than everyone else. In urban areas, weaker income growth and
soaring housing prices have recently cut into gains in
purchasing power, even while GDP growth remained
solid. To correctly measure purchasing power
requires adjusting personal income by a proper measure of prices.
5.
“The Basic Situation of China’s Human Resources,” China.org, 2010, http://www.china.org.cn/government/whitepaper/2010-09/10/
content_20906151.htm (accessed August 12, 2013).
6.
Simon Rabinovitch, “Chinese Workers Find Jobs Still Plentiful Despite Slowing Growth,” The Financial Times, July 15, 2013, http://www.ft.com/
intl/cms/s/0/6e9e7582-ed38-11e2-ad6e-00144feabdc0.html#axzz2ZF38VWlZ (accessed August 9, 2013), and “Job Market Grim for New
Graduates,” China.org, June 7, 2012, http://www.china.org.cn/china/2012-06/07/content_25593348.htm (accessed August 9, 2013).
3
BACKGROUNDER | NO. 2839
September 4, 2013
CHART 2
Income Gains Using the GDP Deflator
REAL GROWTH IN
URBAN INCOME
REAL GROWTH IN
RURAL INCOME
REAL GDP GROWTH
15%
12%
9%
6%
Average:
9%
Average:
6.1%
Average:
5.1%
3%
0%
–3%
Source: National Bureau of Statistics, China Monthly Statistics, Beijing.
Using the GDP deflator to represent prices,
instead of the various deflators the statistics authority purports to use, real rural income growth averaged 4 percent annually for a decade (1999–2008)
before improving the past few years. On the flip side,
real urban income growth has averaged barely 4 percent from 2008 to 2012. These are substantial gains
but they are far from spectacular. Large portions of
the population are not as happy with China’s economic performance as top-line figures suggest, not
because of high aspirations but because they have
not seen particularly strong gains in the first place.
Regional Disparities
In both its foreign and domestic policies, the
party demonstrates concern about China’s territorial integrity. The concerns are primarily political,
such as the ethnic violence in the west, but there
is also an economic challenge. The PRC faces clear
and very large development gaps between its solid
middle-income east coast and its still largely lowerincome interior.
The nature and extent of these gaps is obscured
by Chinese and foreign data. Because the east coast
is economically larger, richer, and more integrated,
7.
B 2839
heritage.org
it is far more important to foreign partners, both
corporate and national, than the rest of the country.
Corporate headquarters, research houses, and visiting official delegations are therefore heavily concentrated in Beijing and Shanghai. The information
gathered by most foreign entities is about the China
that matters most to them, not necessarily the China
that matters most to the party.
The party may not have much better information.
It is by now well known that provincial GDP series do
not match national series.7 What is less well known
is that problems are even worse with other data. The
SSB now collects national data independently of the
provinces; the provinces generate their own data.
The latter are essentially useless.
The party did not choose economic reform for the
interior, it chose state-directed spending. As a result,
inland provinces claim rapid GDP growth based on
even more rapid investment growth. Reporting has
become absurd: There are now multiple provinces
whose fixed investment is larger than their GDP—
which would be impossible if fixed asset investment
was anything close to a legitimate measure. GDP,
and thus GDP per capita, is being heavily exaggerated, so that the gaps with the coast are understated.
“Local Exaggeration in GDP: 5.8 Trl Higher than Central Data,” Caijing, February 4, 2013, http://english.caijing.com.cn/2013-02-04/112486637.
html (accessed August 9, 2013).
4
BACKGROUNDER | NO. 2839
September 4, 2013
Fabrication is even worse in foreign investment statistics; here, provincial totals can exceed the reported national figure by 50 percent.8
This undercuts the common view that inland
provinces have been catching up to the coast. They
may have, but only temporarily, on the basis of
increasingly useless state spending. (Or they may
have only in the form of imaginary numbers.) The
party is certainly aware that the public statistics are
false9 and likely has a good sense of which regions
are potential sources of unrest. Political assignments are made accordingly and key economic programs, such as permitting labor movement, may be
shaped by awareness of regional disparities. To better evaluate the calculations behind Chinese policy
decisions, far better provincial-level data are needed.
Financial Transparency
GDP and inflation statistics are issued and pored
over every quarter. A long-term economic crisis
would most likely be due to unemployment. But
what wins attention on a weekly basis is Chinese
finance. Whenever signs of stress are perceived,
most recently the June 2013 interest-rate spike,
speculation begins on whether a domestic financial
crisis is imminent. In principle, a short-term crisis
could occur due to a default by a bank, major firm, or
local government arm.
However, a mistake continually made by foreign
observers is to treat the PRC’s financial system as
more or less equivalent to America’s financial system. Ninety-seven percent of Chinese banks’ assets
are held by state-owned institutions. (Fewer than 2
percent are held by foreign-owned banks, fewer than
1 percent by domestic private banks.)10 Even the
much-discussed non-bank finance—“shadow banking”—stems largely from state banks taking assets
and liabilities off their books, plus the investment
activities of state-owned insurers.
So there is far less counterparty risk than in the
U.S., and little meaningful competition. Benchmark
interest rates are irrelevant both to troubled state
firms, which enjoy costless borrowing through endless loan rollovers, and private firms, which pay far
more.11 Understanding Chinese finance requires
data, not severely strained comparisons to Lehman
Brothers.
Bank Debt. Non-performing bank assets are
the repository of economic failure. An unwise loan
funds an overly optimistic investment. The ensuing
increase in production is unwanted by the market
and an economic imbalance is created. Closing the
loop, the banks’ probability of repayment is lower. So
a rising amount of distressed assets signifies a failing economic model. And a high level of distressed
assets implies a systemic threat.
Small wonder that the party treats the systemwide level of non-performing loans as a state secret.
Estimating the total amount of bad loans used to be
a cottage industry in international finance. Then,
the government decided that as many state banks as
possible should seek multibillion-dollar initial public offerings (IPOs), and independent assessments
of asset quality were harshly suppressed. Bad loans
were offloaded to other entities prior to IPOs, and
massive amounts of cash were continuously injected
8.
“China to Collect More Accurate Investment Data,” China.org, March 6, 2013, http://news.xinhuanet.com/english/china/201306/03/c_132427804.htm (accessed August 9, 2013), and Kelly Liu, Kevin Daly, and Maria Estela Varua, “Determinants of Regional
Distribution of FDI Inflows Across China’s Four Regions,” International Business Research, Vol. 5, No. 12 (2012), http://www.ccsenet.org/
journal/index.php/ibr/article/view/22162 (accessed August 12, 2013).
9.
Cheng Yunjie and Wang Zichen, “Xinhua Insight: China Advance Reforms For Data Accuracy,” China.org, December 27, 2012, http://news.
xinhuanet.com/english/china/2012-12/27/c_132067664.htm (accessed August 9, 2013), and John Wong and Ding Lu, China’s Economy into
the New Century: Structural Issues and Problems, (Hackensack, NJ: World Scientific, 2002).
10. Grant Turner, Nicholas Tan, and Dena Sadeghian, “The Chinese Banking System,” Reserve Bank of Australia, September 2012, http://www.rba.
gov.au/publications/bulletin/2012/sep/pdf/bu-0912-7.pdf (accessed August 9, 2013), and “Is China Finally Ready for Private Banks?” The
Economic Observer, July, 18, 2013, http://www.eeo.com.cn/ens/2013/0718/246768.shtml (accessed August 9, 2013). An oft-cited figure of 70
percent state ownership refers to urban banks; in different fashion, rural banks are also all state-owned.
11. Sanjay Jain and Daisy Wu, “China Banks Sector—Debt Threats: Downgrading the Bank Sector on Asset Quality Concerns,” Credit Suisse,
June 20, 2011, http://arg.credit-suisse.com/doc/BK1273.pdf (accessed August 9, 2013), and Shang-Jin Wei, “Das (Wasted) Kapital: Is China
Investing Too Much?” VOX, June 16, 2007, http://www.voxeu.org/article/china-investing-too-much (accessed August 12, 2013).
5
BACKGROUNDER | NO. 2839
September 4, 2013
tAbLe 1
Deteriorating Setting for Lending
Year
Urban Fixed
Investment
Growth
Domestic and
Foreign Sales
Growth*
Pressure on
Loan Quality
2004
27.6%
28.9%
Falling
2005
27.2
21.8
Rising
2006
24.5
17.4
Rising
2007
25.8
19.1
Rising
2008
26.1
20.4
Rising
2009
30.5
3.7
Rising sharply
2010
24.5
26.9
Falling
2011
23.8
20.5
Rising
2012
20.6
10.4
Rising
* A weighted average of urban retail sales and exports.
Source: National Bureau of Statistics, China Monthly Statistics,
Beijing.
B 2839
heritage.org
by government financial arm Central Huijin,12 implying that distressed assets steadily accumulated over
time. All the while, official data on bad loans have
bordered on the absurd. Despite well over $1 trillion
in new loans in 2009 in an acknowledged downturn,
bad loans were said to fall. Nor did they rise later
on.13
The trend for bad assets is easy to identify, in
principle: If investment is rising clearly faster
than domestic and overseas sales, bad loans will
eventually rise no matter how strong demand is and
no matter what Beijing claims. On this view, pressure on loan quality began to accumulate in 2006,
though slowly enough that improvements in practices may have protected bank portfolios. That was not
true in 2009, when loan quality plummeted. A 2010
recovery was followed by a mediocre 2011 and poor
2012. The quality of official investment and sales
figures is an obvious problem but non-performing
assets are almost surely far larger in 2013 than 2006.
An exact figure is harder to come by. There are
likely closely held estimates, including within the
Chinese government. It may be useful for the U.S.
intelligence community to seek them out and make
them publicly available. These should be combined with assessments of the thresholds where a
non-commercial banking system is progressively
impaired.
Corporate Debt. The obvious counterpart
to bank debt is corporate debt. Chinese corporate accounting has long been a farce. In 2000, the
national audit office accused two-thirds of almost
1,300 state enterprises of cooking the books. Chinese
guidelines at the time were so minimal as to be useless by international standards, yet state firms still
could not meet them.14 Since then, domestic reports
of accounting problems have become politicized,
but American regulators have identified fraud at
Chinese companies and their foreign accountants.15
This fraud has affected U.S.–China commercial relations, reason enough for the U.S. government to
gather better information.
Another reason is to undercut the “Beijing
consensus.” Though the PRC has never officially
12. Richard McGregor, “E&Y Withdraws China NPL Report,” Financial Times, May 15, 2006, http://www.ft.com/intl/cms/s/0/11e4d368-e3c711da-a015-0000779e2340.html#axzz2ZnsKOOEI (accessed August 12, 2013), and Central Huijin Investment, Ltd., “Currently, Central
Huijin Holds Shares in the Institutions Listed Below,” December 31, 2012, http://www.huijin-inv.cn/hjen/investments/investments_2008.
html?var1=Investments (accessed August 12, 2013).
13. “China’s Non-Performing Loans Down in 2009,” Wall Street Pit, January 15, 2010, http://wallstreetpit.com/14073-chinas-non-performingloans-down-in-2009/ (accessed August 12, 2013), and “China’s Banks’ Non-Performing Loan Ratio About 1%,” The Wall Street Journal Market
Watch, July 15, 2013, http://www.marketwatch.com/story/china-banks-non-performing-loan-ratio-about-1-2013-07-15 (accessed August 12,
2013).
14. U.N. Economic and Social Commission for Asia and the Pacific, “Rejuvenating Bank Finance for Development in Asia and the Pacific,” October
28, 2002, http://www.unescap.org/drpad/publication/toc/fin_2206con.htm (accessed August 12, 2013), and Ray Ball, Ashok Robin, and
Joanna Shuang Wu, “Accounting Standards, The Institutional Environment and Issuer Incentives: Effect on Timely Loss Recognition in China,”
Asia-Pacific Journal of Accounting and Economics, Vol. 7, No. 2 (2000), pp. 71–96, http://www.tandfonline.com/doi/abs/10.1080/16081625.200
0.10510579#.UfBlG421F8E (accessed August 12, 2013).
15. U.S. Securities and Exchange Commission, “SEC Charges China Affiliates of Big Four Accounting Firms with Violating U.S. Securities Laws
in Refusing to Produce Documents,” 2012, http://www.sec.gov/News/PressRelease/Detail/PressRelease/1365171486452#.UfBnLY21F8E
(accessed August 12, 2013).
6
BACKGROUNDER | NO. 2839
September 4, 2013
embraced the concept, the Beijing consensus is
the claim that state-led development is superior to
market-led development—the “Washington consensus.” The crux of the evidence cited is the PRC’s
impressive GDP growth, presumably a result of its
mix of planning and market implementation of government plans, and the dominance of its very large
state-owned enterprises (SOEs).16
It is therefore important economically and diplomatically to analyze SOEs beyond their size and the
foreign currency provided to them by the government. Not coincidentally, such analysis is inhibited
not only by bad accounting practices but by protection of the corporate information of large SOEs as
state secrets, with severe associated penalties for
disclosure.17
While the evidence is limited, the size and
expansion of SOEs could mask debts that would be
unsustainable in a competitive system, and require
transfers from the rest of society. Chinese firms are
indeed large, with the second most appearances
on the Fortune 500 list (after U.S. firms). But these
firms show far more leveraging than their American
counterparts.18 Indeed, a state think tank indicated Chinese firms had the worst debt-asset ratios in
the major economies, at over 100 percent.19 Further
investigation would almost surely find more, hidden
weakness, discrediting the Beijing consensus and
reducing the appeal of working with Chinese state
investors.
Local Government Debt. The third main component of financial worries is local government
borrowing. Direct accumulation of debt by local governments is formally limited, but most long ago set
up investment vehicles to circumvent the restrictions. Local government debt is a component of the
evaluation of the Chinese economy in terms of policy trends, aggregate economic vulnerability, and
comparative regional performance.
After encouraging local governments to spend in
response to the 2008 financial shock, Beijing began
to fret and ordered an audit of local borrowing. The
result was reminiscent of that for firms: dozens of
cities and counties with debt-to-asset ratios over
100 percent and total debt of $1.61 trillion in 2010.
The total figure has certainly risen, the number of
distressed local governments probably has, too, and
there have been a series of official statements to the
effect that the problem has worsened.20 But there
has been no official update yet.
This may be due to fear of the future. Most foreign
observers focus on the possibility of an urban housing market collapse, which would harm employment
and bank assets and ultimately the wealth of ordinary people. A larger problem, at least regarding the
amount of money involved, is the value of land. In
addition to soaring real estate taxes, revenue from
land sales stood at a total of 5.3 trillion yuan from
1999 to 2008. In 2010 and 2011 alone, it was almost
5.9 trillion yuan. This rate of increase cannot possibly last and, indeed, there was a mild decline in
2012.21
More declines are coming, so local government
ability to service debt will also decline. A complete
16. Derek Scissors, “The China Models,” The Heritage Foundation, The Foundry, September 6, 2011, http://blog.heritage.org/2011/09/06/thechina-models/.
17. Michael W. Vella and Jerry Ling, “Traps for the Unwary in Disputes Involving China,” Jones Day, August 2012, http://www.jonesday.com/
traps_for_unwary/ (accessed August 12, 2013), and Keith B. Richburg, “China Sentences American Geologist to 8 Years for Stealing State
Secrets,” The Washington Post, July 5, 2010, http://www.washingtonpost.com/wp-dyn/content/article/2010/07/05/AR2010070500859.html
(accessed August 12, 2013).
18. Wu Ying, “Financial Repression Greatest Risk to China’s Economy,” China.org, December 24, 2011, http://www.china.org.cn/
opinion/2011-12/24/content_24233313.htm (accessed August 12, 2013).
19. “Warning Issued About High Debt,” China Daily, August 7, 2012, http://www.china.org.cn/business/2012-08/07/content_26154420.htm
(accessed August 12, 2013), and “Fortune 500 List Reveals Need for Structural Reform,” People’s Daily Online, July 12, 2013, http://english.
peopledaily.com.cn/90778/8324216.html (accessed August 12, 2013).
20. “China’s Own Account of Local Government Debts,” Reuters, June 7, 2011, http://www.reuters.com/article/2011/06/27/china-debthighlights-idUSL3E7HR0CX20110627 (accessed August 12, 2013), and Josh Chin and Dinny McMahon, “China Real Time Report: China’s
Local Debt Mystery,” The Wall Street Journal, July 5, 2013, http://blogs.wsj.com/chinarealtime/2013/07/05/chinas-local-debt-mystery/
(accessed August 12, 2013).
21. Wang Changyong and Xing Yun, “Revenue from Five Major Real Estate Taxes Has Soared,” Caixin Online, March 20, 2013, http://english.caixin.
com/2013-03-20/100504151.html (accessed August 12, 2013), and “China’s Land Sales Hit 2.69 Trillion Yuan in 2012,” China Daily, January
13, 2013, http://www.chinadaily.com.cn/china/2013-01/13/content_16109855.htm (accessed August 16, 2013).
7
BACKGROUNDER | NO. 2839
September 4, 2013
picture of the financial system, including true local
government debt and the likely trajectory of land
sales revenue, would answer vital questions. How
far will the central government be constrained by
the need to support local outlays? Is expanded public spending even possible on a net basis? Will some
local governments be forced to shrink outright, perhaps in poorer counties and provinces where this
would provoke discontent?
Sociopolitical Transparency
Economic data are published regularly; the problems with them stem from internal inconsistencies
that leave analysts endorsing one official Chinese
figure over another. Figures with more obvious
sociopolitical implications, such as those concerning income distribution or mortality, are typically
suppressed.
The party believes that the top threat to its rule
is internal corruption. Individual cases of corruption have proven manageable, but evidence of
increasing wealth concentration correlated with
party membership and rank might not be manageable. Given state dominance of the economy,
income inequality is a proxy for perception of corruption. Perhaps even more inflammatory than
inequality of income is inequality of health, both
in terms of how long people live and their causes of
death. This is the kind of information that can trigger political change.
Income Inequality. The party has acknowledged, and begun to address, urban–rural income
disparities. The SSB’s income statistics show urban
income 2.48 times larger than rural income in 1997,
with the absolute gap at a bit over RMB 3,000 ($365).
By 2009, the ratio was 3.33:1 and the absolute gap
was RMB 12,000 ($1,750). Either policy steps, statistical falsification, or both, partly stemmed the tide,
and the 2012 ratio was 3.10:1. However, the absolute
annual income gap still passed RMB 16,000 (over
$2,500).22
Rural areas remain somewhat isolated. What promotes dissatisfaction among hundreds of millions
of urban residents is seeing huge wealth disparities
right in front of them, most prominently expressed
in housing. After years of surprisingly focused
social complaints, the SSB published an overarching
inequality measurement, in this case 10 years of the
gini coefficient. From 2003 to 2012, the term of the
Hu Jintao government, the reported gini never fell
below 0.47, where 0.4 starts to indicate considerable
inequality.23
The numbers were released because the 2012
result was said to fall below the 2008 peak, and even
the 2003 figure. But it is highly doubtful that the general population accepts anything like this. In spring
2007, it was alleged24 that nearly all of the wealthiest were family members of high-ranking party cadres. As the term of the Hu government neared an end
in 2012, a set of reports in the Western media documented the extreme concentration of wealth at the
top of the party leadership.25 The responsible outlets
saw retaliation from Chinese censors but the stories
all corresponded with what ordinary urban Chinese
could see for themselves.
The percentage of national wealth held by the top
1 percent or 5 percent can be incendiary in any country, but much more so in the PRC. There, the wealth
of the top 5 percent is almost all due to the party’s
control of the economy, and heavily influenced by
systemic corruption. Figures on how much of the
Chinese “miracle” has not been shared will change
the perception of that miracle both outside and
inside China.
Public Health and Environment. Public health
is reported on constantly, but reliable numbers
are again conspicuously lacking. The World Bank
has done a series of reports over the past 20 years
22. China Monthly Statistics. The equivalent dollar values are a bit confusing due to the 30 percent appreciation of the RMB over this period.
23. Yang Lina, “Gini Coefficient Release Highlights China’s Resolve to Bridge Wealth Gap,” People’s Daily Online, January 21, 2013, http://english.
peopledaily.com.cn/90778/8101041.html (accessed August 12, 2013).
24. Carsten A. Holz, “Have China Scholars All Been Bought?” Far Eastern Economic Review, Vol. 170, No. 3 (April 2007), pp. 36–40, http://ihome.
ust.hk/~socholz/HaveChinaScholarsAllBeenBought-FEER30April07.pdf (accessed August 12, 2013).
25. Michael Forsythe, “China’s Billionaire People’s Congress Makes Capitol Hill Look Like Pauper,” Bloomberg, February 27, 2012, http://www.
bloomberg.com/news/2012-02-26/china-s-billionaire-lawmakers-make-u-s-peers-look-like-paupers.html (accessed August 12, 2013);
“The Family Fortunes of Beijing’s New Few,” The Financial Times, July 10, 2012, http://www.ft.com/intl/cms/s/0/86a82f3e-bc69-11e1-a47000144feabdc0.html#axzz2a4KVp89Y (accessed August 12, 2013); and David Barboza, “Billions in Hidden Riches for Family of Chinese
Leader,” The New York Times, October 25, 2012, http://www.nytimes.com/2012/10/26/business/global/family-of-wen-jiabao-holds-ahidden-fortune-in-china.html?pagewanted=all (accessed August 12, 2013).
8
BACKGROUNDER | NO. 2839
September 4, 2013
documenting the economic costs of environmental degradation. Initially suppressed, these have
been accepted, even repeated, by the party because
they always paled against reported economic performance. The pollution pattern is similar. China
accepts reporting about bad air and water pollution
when it can no longer be avoided, and quickly promises massive clean-up efforts.26
While such issues cause local protests and general disgruntlement, they are not directly life and
death issues. But birth defects and cancer rates
are, and domestic reporting has been suppressed in
these areas. Reliable national data on the trend in
cancer rates and birth defects, especially if broken
down geographically, would be a critical indicator of
the true level of “social stability.”
Life expectancy combines these health and environmental factors. It is possibly the single most
important indicator of societal welfare and strongly correlated with economic expansion. Declining
life expectancy is tied to the collapse of Soviet
Communism, an event which the PRC continues to
evaluate.27 China reports increasing life expectancy.
This was certainly credible at the outset of reform
and for some years after, but it is not clear that recent
figures should be accepted as reliable.
One main reason they might be inaccurate: The
way China exploits its coal resources is known to
be bad for public health. The PRC has long had
lax regulation of mining, production, and thermal
power generation.28 It now also accounts for half
the world’s coal output—on less than 7 percent
of the world’s land and fresh water. Coal mining
is land-intensive and even more water-intensive.
This combinations of factors has the obvious effect
on life expectancy at the local level—sharp reductions.29 Even if the national average life expectancy
has managed to continue to increase, it can only
have done so with widening regional gaps. A large
and expanding difference in life expectancy is perhaps the starkest inequality imaginable. Detailed,
trustworthy data on life expectancy would reveal
the extent of the PRC’s social and, ultimately, political cohesion.
Arable Land. A final issue combines the macroeconomic and social dimensions. For the sake of revenue, land can be seized by the government without
due process, to be sold to infrastructure projects or
property developers. It can be lost to pollution. Loss
of land means unemployment for farmers, it means
food-inflation pressure, it adds to income inequality,
it threatens public health through food quality, and
it ultimately undermines local government finances.
The problem here is not false Chinese figures;
arable land can be evaluated by satellite. The problem is failure by the PRC and independent observers
to fully evaluate the multiple implications of land
loss.30
26. Edward Wong, “China Lets Media Report on Air Pollution Crisis,” The New York Times, January 14, 2013, http://www.nytimes.com/2013/01/15/
world/asia/china-allows-media-to-report-alarming-air-pollution-crisis.html?_r=0 (accessed August 12, 2013); “China to Invest $277
Billion to Curb Air Pollution: State Media,” Reuters, July 24, 2013, http://www.reuters.com/article/2013/07/25/us-china-pollutionidUSBRE96O01Z20130725 (accessed August 16, 2013); Keith Bradsher, “China Report Shows More Pollution in Waterways,” The New York
Times, February 9, 2010, http://www.nytimes.com/2010/02/10/world/asia/10pollute.html (accessed August 12, 2013); and Sui-Lee Wee,
“China to Spend $301 Billion on Water Projects,” Reuters, January 20, 2011, http://www.reuters.com/article/2011/01/20/us-china-waterinvestment-idUSTRE70J2DL20110120 (accessed August 12, 2013).
27. R. H. Dinkel, “The Seeming Paradox of Increasing Mortality in a Highly Industrialized Nation: The Example of the Soviet Union,” Population
Studies: A Journal of Demography, Vol. 39, No. 1 (1985), http://www.tandfonline.com/doi/abs/10.1080/0032472031000141296#.UfL-GI21F8E
(accessed August 12, 2013), and A. Greer Meisels, “Lessons Learned in China from the Collapse of the Soviet Union,” China Studies Centre
Policy Paper No. 3, January 2013, http://sydney.edu.au/china_studies_centre/images/content/ccpublications/policy_paper_series/2013/
Lessons-learned-in-China-from-the-collapse-of-the-Soviet-Union.shtml.pdf (accessed August 12, 2013).
28. Xin Qiu and Honglin Li, “Energy Regulation and Legislation in China,” Environmental Law Institute, July 2012, http://www.epa.gov/ogc/china/
Qiu.pdf (accessed August 12, 2013).
29. Yuyu Chen, Avraham Ebenstein, Michael Greenstone, and Hongbin Li, “Evidence on the Impact of Sustained Exposure to Air Pollution on Life
Expectancy from China’s Huai River Policy,” National Academy of Sciences of the United States of America, May 28, 2013, http://www.pnas.
org/content/early/2013/07/03/1300018110 (accessed August 12, 2013).
30. Guilin Li, Ying Zhao, and Shenghui Cui, “Effects of Urbanization on Arable Land Requirements in China, Based on Food Consumption Patterns,”
Food Security, Vol. 5, No. 3 (June 2013), pp. 439–449, http://link.springer.com/article/10.1007/s12571-013-0265-9 (accessed August 12, 2013),
and Australian Government, Department of Foreign Affairs and Trade, “Feeding the Future: A Joint Australia–China Report on Strengthening
Investment and Technological Cooperation in Agriculture to Enhance Food Security,” December 2012, http://www.dfat.gov.au/publications/
feeding-the-future/feeding-the-future.html (accessed August 12, 2013).
9
BACKGROUNDER | NO. 2839
September 4, 2013
tAbLe 2
Life Expectancy and Coal
Year
Coal Production,
in Billions of Tons
Life Expectancy
2000
0.99
71.4
2001
1.06
–
2002
1.18
–
2003
1.33
–
2004
1.61
–
2005
1.82
–
2006
2.07
–
2007
2.19
–
2008
2.48
–
2009
2.96
–
2010
3.24
74.8
A fresh reason for urgency in gathering better
information is greater awareness of the PRC’s economic difficulties. There is increasing likelihood of
financial losses from current and previous Chinarelated transactions, losses that could drive speculative attacks on the stocks of the companies involved
and even be transmitted to American taxpayers in
various forms. Private entities should not be inhibited in any way by the U.S. government but should
proceed entirely at their own risk.
■■
■■
Source: National Bureau of Statistics, China Monthly Statistics,
Beijing.
B 2839
heritage.org
Urbanization is at the heart of current development
plans. At the micro level, not just farmers but urban
poor are harmed disproportionately by land loss, the
former due to loss of livelihood and the latter due to
the harsher impact of (correctly calculated) food inflation. At the macro level, urbanization impinge upon
protecting arable land, forcing even more resources to be diverted to protect food supply. The party’s
long-standing fear of dependence on imported food
is already frayed by $30 billion in soybean imports
annually. Without far better protection of arable land,
more large-scale food imports should be expected.
Recommendations for the U.S.
Recommendations that the U.S. government, the
private sector, international institutions, and China
itself improve the quality of the data provided are
old hat.31 Of course, if they had been heeded 10, or
even five, years ago, American policymaking would
have been much improved.
■■
■■
The U.S. government, through the relevant Cabinet departments and the intelligence community, should devote additional resources over an
extended period to compile independent data on
select Chinese macroeconomic, financial, and
sociopolitical indicators.
The U.S. government should press international
institutions, such as the World Bank, to adopt a
two-tier statistical classification system for publicizing economic data, where Tier 1 countries
provide high-quality national statistics and Tier
2 countries do not.
The U.S. government should not offer loans,
financial guarantees, insurance, or other support through financial institutions, such as the
Export-Import Bank or the Overseas Private
Investment Corporation, to projects where transparency is low, such as those involving Chinese
state entities.
Similarly, to be eligible to participate in federal
deposit insurance or any other government assistance, American financial institutions should be
required to fully and properly disclose all transactions with counterparties in low-transparency
environments.
Conclusion: Hard Thing, Worth Doing
Claims that Americans have adequate information on the Chinese economy are false. The same line
has been used for years: Old numbers were faulty but
31. Derek Scissors, “China Grows 10 Percent Again: Is this Believable?” Heritage Foundation WebMemo No. 3098, January 20, 2011, http://www.
heritage.org/research/reports/2011/01/china-grows-10-percent-again-is-this-believable.
10
BACKGROUNDER | NO. 2839
September 4, 2013
current numbers are satisfactory.32 This was said in
2004 about data from 1994, it is said now about 2004
data, and it will be said a decade from now about
today’s data.
It is certainly true that the SSB’s methods have
improved over time, for example, by relying less on
provincial reporting, and further improvement is
possible. It is equally true that the Communist Party
still controls and alters the flow of information, and
some important indicators, such as for unemployment and investment, have actually become more
misleading over time.
Whether the PRC’s economy rises, falls, or stagnates, it is big enough to be important to know why
ordinary people, local cadres, and the top leadership are behaving the way they are and how the U.S.
can better exert global influence. To gather better
numbers on any one of the indicators listed here
would be valuable, but would still offer an incomplete picture. To gather better numbers on all of
them will likely require sustained U.S. government
assistance over time, and be well worth it. Until
then, American taxpayers should not have to support commercial activities in a low-transparency
environment.
—Derek Scissor, PhD, is Senior Research Fellow in
Asia Economic Policy in the Asian Studies Center at
The Heritage Foundation.
32. For example, Tom Orlik, “Lies, Damned Lies, and China’s Economic Statistics,” The Wall Street Journal, July 25, 2012, http://online.wsj.com/
article/SB10000872396390444840104577548932454533806.html (accessed August 12, 2013) vs. Carsten A. Holz, “The Institutional
Arrangements for the Production of Statistics,” Organisation for Economic Co-operation and Development, China Governance Project, January
19, 2005, http://search.oecd.org/officialdocuments/displaydocumentpdf/?doclanguage=en&cote=std/doc(2005)1 (accessed August 12,
2013).
11


© Copyright 2026