
DIVERSITY AND ANALYTICS: HOW TO BUILD AND LEVERAGE DIVERSITY
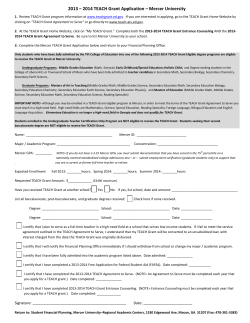
DIVERSITY AND ANALYTICS:
HOW TO BUILD AND LEVERAGE DIVERSITY
TO OUTPERFORM THE COMPETITION
CONFIDENTIAL
This presentation contains proprietary methodologies and tools that remain the property of Mercer.
© 2014, Mercer
© 2014 MERCER. ALL RIGHTS RESERVED.
Today’s Presenters
Brian Levine, PhD
Partner, Workforce
Analytics & Planning
Mercer
[email protected]
Tyronne Stoudemire
Principal, Diversity & Inclusion
Mercer
Alina Polonskaia
Principal, Diversity Networks
Mercer
[email protected]
[email protected]
QUESTIONS
To submit a question, use the floating panel on the top of
your screen and click the Q&A button:
CLICK HERE TO ASK A
QUESTION TO “ALL PANELISTS.”
© 2014 MERCER. ALL RIGHTS RESERVED.
1
Agenda
• Introduction: Four Challenges for D&I
• Challenge #1: Moving from Data to Insight
• Challenge #2: Understanding Cultural Impediments and Opportunities
• Challenge #3: Developing Inclusive Leadership
• Challenge #4: Bringing It Together and Sustaining Change
• Closing / Q&A
© 2014 MERCER. ALL RIGHTS RESERVED.
2
Why Diversity and Inclusion Matters
The business case
CRITICALITY OF
DRIVING PERFORMANCE
AND INNOVATION
• Diverse workforces and inclusive workplaces linked to innovation.
INCREASING
LEGISLATION AND
REGULATORY PRESSURE
• Legislation emerging in EMEA and APAC to bolster diversity.
MANAGING RISK,
AND REPUTATION
• External pressure for transparency from NGOs, government
agencies, and watch-dog groups.
• Improved culture, greater employee satisfaction and engagement, and
increased discretionary effort linked to financial performance.
• Increased scrutiny from enforcement agencies in the US.
• Greater focus on pay equity and board diversity globally.
• Companies lacking D&I awareness face expensive discrimination and
harassment lawsuits, lower morale, and recruiting/consumer brand
risk.
RAPIDLY CHANGING
DEMOGRAPHICS
• Global nature of workforce demands greater cultural competency.
• Aging population globally; several generations in the workplace;
greater awareness of and focus on individuals with disabilities.
• Increased purchasing power of diverse groups, including women,
minorities, and the LGBT community.
© 2014 MERCER. ALL RIGHTS RESERVED.
3
CHALLENGE #1:
MOVING FROM DATA TO INSIGHT
© 2014 MERCER. ALL RIGHTS RESERVED.
4
Mercer’s work with the WEF in 2013 identified significant opportunity
Source: The Human Capital Report/WEF 2013
© 2014 MERCER. ALL RIGHTS RESERVED.
5
Look Inside: The Internal Labor Market (ILM) Analysis® Perspective
An ILM map represents the flow of people into, through, and out
CLIENT EXAMPLE
© 2014 MERCER. ALL RIGHTS RESERVED.
6
ILM Maps Can Target Particular Workforce Segments
In this case, gender
CLIENT EXAMPLE
ILM map illustrating the flow of female talent (as a key talent segment) — women face a
“glass ceiling” between levels 6 and 7 and leave the company in high numbers at level 6.
© 2014 MERCER. ALL RIGHTS RESERVED.
7
Projections Showed that this Organization Would Not Achieve
Its Objectives Unless It Improved Hiring, Promotion, and
Retention of Women
Projections: % Female Senior Managers 2013-2022
40%
With adjusted hire,
promotion, and
termination %s
% Female (Senior Managers)
38%
36%
Aggressive target
34%
With adjusted
promotion %s
32%
30%
28%
With adjusted term %s
With adjusted hire %s
26%
Baseline
24%
22%
2012
2013
2014
2015
2016
2017
2018
2019
2020
2021
2022
Year
© 2014 MERCER. ALL RIGHTS RESERVED.
8
A Network of Senior Managers, by Gender
Case example
Male
Female
Men are more likely to
be tightly “clustered” with
other men.
Women are more likely to be in
“connector” positions with links
to different parts of the network.
Connectors — things we know
• Are in a position to be “brokers” of
relationships between distant parts of
a network.
• Can be “gatekeepers” that control the
flow of information from one part of a
network to another.
© 2014 MERCER. ALL RIGHTS RESERVED.
Clusters —
things we know
• Information travels faster
within clusters than
between (“old boys
clubs?”).
• Networks grow “unevenly”
— new members tend to
attach to others already in
a cluster.
9
Statistical Modeling Drives Insight
Need a disciplined approach to find evidence and drive strategy
Three conditions must be met to show that one factor drives another:
1. CORRELATION
The factors are related.
Span of
Control
Retention
TIME (Directionality)
One precedes the other.
Span of
Control
Retention
Time 1
Time 2
ISOLATION (Controls)
Other factors are ruled.out.
Span of
Control
Retention
drives
Gender
The key is to analyze
multiple variables and then
isolate those that directly
impact the outcome.
© 2014 MERCER. ALL RIGHTS RESERVED.
LOB
Tenure
10
What Actions Will Drive Improved Retention of Women and Minorities?
Modeling the drivers of VOLUNTARY turnover
CLIENT EXAMPLE
Sup's Span (+10 EEs)
48%
39%
Levels from Sup (+1)
Rating: Needs Improvement
17%
Female
15%
Promoted (Grade) in Yr
12%
Hired in Yr
12%
Non-white
9%
Tenure in Job (1 more yr)
5%
Base Pay ($70K v $60K)
-3%
-6%
Stock Option Value ($60K v $50K)
Rating: Excellent
-12%
-21%
Stock Option Receipt
-60%
-50%
-40%
-30%
-20%
-10%
0%
10%
20%
30%
40%
50%
60%
Percentage difference in turnover probability
© 2014 MERCER. ALL RIGHTS RESERVED.
11
Identifying Areas of Focus and Ensuring Program Alignment
Assessing risk at varying levels to understand systemic risk,
improve diversity, reinforce desired program norms
CLIENT EXAMPLE
© 2014 MERCER. ALL RIGHTS RESERVED.
12
Track core metrics, both lagging and leading
Diversity dashboards
CLIENT EXAMPLE
© 2014 MERCER. ALL RIGHTS RESERVED.
13
CHALLENGE #2: UNDERSTANDING CULTURAL
IMPEDIMENTS AND OPPORTUNITIES
© 2014 MERCER. ALL RIGHTS RESERVED.
14
The Value of Combining Analysis of Your Internal Labor Market
with Assessment of Cultural Dynamics
Cultural
Dynamics
• Assess cultural dynamics that
pose the most significant risks
and opportunities for inclusion
• Measure through interviews,
focus groups, and employee
surveys
• Provide further insight on
particular practices and
managerial strategies
What employees
and managers
SAY
Internal Labor
Market Dynamics
• Assess the opportunity to improve
diversity
• Identify the root-cause drivers of
differences in advancement, in
compensation, in retention
• Track diversity metrics, both lagging
and leading, to assess current state
and progress
What employees
and managers
DO
By combining what employees and managers SAY with what they DO, we can
obtain a holistic understanding of the facts and can effectively prioritize actions
© 2014 MERCER. ALL RIGHTS RESERVED.
15
Culture Assessment
Qualitative research can shed light on employee experiences
and perceptions throughout the life cycle
CLIENT EXAMPLE
Happiness Across Career/Life Stages
Inclusion and retention study: Women at the mid-career point are least satisfied and are more likely to leave.
© 2014 MERCER. ALL RIGHTS RESERVED.
16
Culture Assessment
Qualitative research can be linked to “hard data analysis” to
support robust strategies
ABC
© 2014 MERCER. ALL RIGHTS RESERVED.
17
CHALLENGE #3: BUILDING
INCLUSIVE LEADERSHIP SKILLS
© 2014 MERCER. ALL RIGHTS RESERVED.
18
The Power of Inclusive Leadership
The Head, Heart, and Guts model
Create
strategy
Manage complexity,
ambiguity, and risk
Make tough
choices
Manager
of Managers
Execute
strategy
Coach and nurture
talent, and align
teams
Manage conflicts,
allocate resources,
and take risks
First-Line
Supervisor
Use data to
understand
root causes
Build trust and
manage one-onone relationships
Give tough
feedback and
manage
performance
Build selfawareness
.
Act with empathy
Speak up
Executive
Individual
Contributor
© 2014 MERCER. ALL RIGHTS RESERVED.
19
The Power of Inclusive Leadership
Cross-cultural competence is one of the most effective tools
in inclusive leader’s toolkit
Definition: Cross-cultural competence is the ability to discern and take into account one’s own and
others’ worldviews; to be able to solve problems, make decisions, and resolve conflicts in ways that
optimize cultural differences for better, longer-lasting, and more creative solutions
CULTURAL
AWARENESS
CULTURAL
KNOWLEDGE
CULTURAL
SENSITIVITY
CULTURAL
COMPETENCY
“Me-Centered” Analysis
What are my values,
beliefs, customs, traditions,
styles, biases, stereotypes,
and behaviors?
(Who am I?)
Knowledge Analysis
Why are my values, beliefs,
customs, traditions, styles,
biases, stereotypes, and
behaviors the same or
different from others?
What additional cultural
knowledge, awareness,
and/understanding do I
need?
Sensitivity Analysis
Am I open to accepting and
respecting differences?
Why or why not? What are
the challenges for me?
Can I avoid assigning
judgments (be better or
worse, right or wrong) to
cultural differences? Why
or why not?
Competency Analysis
What adjustments, both in
the way I think and behave,
do I need to make in order
to effectively operate in a
different cultural cortex?
How do I realize the value
that is inherent in diverse
perspectives?
“Other-Centered”
Analysis
What are others’ values,
beliefs, customs, traditions,
styles, biases, stereotypes,
and behaviors?
© 2014 MERCER. ALL RIGHTS RESERVED.
20
The Power of Inclusive Leadership
An example: The Intercultural Development Inventory® (IDI)
The gap shows our perceived level of intercultural sensitivity is higher than our actual level.
(This is common). The goal is to close that gap by increasing our cultural navigation skills.
© 2014 MERCER. ALL RIGHTS RESERVED.
21
CHALLENGE #4: SUSTAINING CHANGE
© 2014 MERCER. ALL RIGHTS RESERVED.
22
Sustaining Change
Company-specific business case, goals, and metrics are the key
to success
Increased
organizational capacity for
innovation and growth
Business Case
Workforce
Attract,
develop, and
retain highquality, diverse
talent
D&I goals
Work
Environment
Create an
inclusive
organizational
culture
Metrics
Marketplace
Serve diverse
customers and
communities
Business Strategy
Mission and Values
© 2014 MERCER. ALL RIGHTS RESERVED.
23
Sustaining Change
Embedding D&I in key business and HR processes and practices
Talent Acquisition
Workforce
Planning,
Talent Review, and
Succession
Culture and
Engagement
Performance
Management
Change
Reward and
Recognition
Leadership and
Employee
Development
Corporate Social
Responsibility/
Sustainability
Business
Processes
© 2014 MERCER. ALL RIGHTS RESERVED.
24
Sustaining Change
Learn from experts and peers – the power of Networks
Key Attributes
Key Roles
•
Coach
•
Leader
•
Change agent
© 2014 MERCER. ALL RIGHTS RESERVED.
+
•
•
•
•
•
•
•
•
•
•
Strategic thinking
Business proficiency
Cultural proficiency
Analytical skills
Systems thinking
People management
Political astuteness
Process design
Program execution
Interpersonal insights and
influence
25
AN INVITATION
© 2014 MERCER. ALL RIGHTS RESERVED.
26
MERCER’S 2014 GLOBAL GENDER RESEARCH — AN INVITATION
A differentiating research framework: not just “best practices”
Our study will investigate how organizations can accelerate their own representation of
women and realize greater value — by linking practices to results.
From understanding how women engage in their work and move through their career to considering their
unique health and financial management needs, employers must identify and respond to the critical gender
issues impacting their business.
To that end, Mercer is launching a global research effort to benchmark organizational practices in these areas
and assess their impact on the representation and advancement of women in the workforce.
ESSENTIAL STRATEGIES FOR TODAY’S GENDER IMPERATIVE:
TALENT, HEALTH, AND FINANCIAL WELL-BEING
We will release our research findings and collaborate around solutions at
Mercer’s inaugural gender conference on November 5-6, 2014, in Washington, DC.
© 2014 MERCER. ALL RIGHTS RESERVED.
27
MERCER’S 2014 GLOBAL GENDER RESEARCH — AN INVITATION
Benefits of participation
Early, no-cost
access to the full
white paper report,
including a custom
Internal Labor
Market (ILM)®
map, which depicts
talent flows for
your organization
and projects future
representation,
plus reduced-cost
access to custom
reports
Preferential pricing
for global
workplace gender
equality
certification
through the EDGE
Certified
Foundation, with
whom we are
partnering
Recognition as a
primary
participating
organization in
research reports
and at our
inaugural gender
conference this
November 2014
We invite you to participate in this exciting research initiative by June 30, 2014.
PLEASE SEND AN EMAIL TO [email protected]
© 2014 MERCER. ALL RIGHTS RESERVED.
28
CLOSING / Q&A
© 2014 MERCER. ALL RIGHTS RESERVED.
29
What’s Coming Up Next
Workforce analytics webcasts, workshops, and data
Webcast Series
www.mercer.com/mercer-workshops
www.mercer.com/webcastseries
• Cameco
• Experian
• John Deere
• UMass Memorial Health Care
• Johnson Controls
• Diversity & Analytics
• Value of International Assignments (June 25)
Mercer’s Workforce
Metrics Benchmark Reports
www.imercer.com/wmrs
• Workforce composition and retention metrics.
• 66 countries.
• 6,000+ participants.
• Regional and custom editions available.
Mercer’s Global D&I Country Factbook
www.imercer.com/products/2013/diversity-factbook.aspx
© 2014 MERCER. ALL RIGHTS RESERVED.
30
Questions and Answers
Brian Levine, PhD
Partner, Workforce
Analytics & Planning
Mercer
[email protected]
Tyronne Stoudemire
Principal, Diversity & Inclusion
Mercer
Alina Polonskaia
Principal, Diversity Networks
Mercer
[email protected]
[email protected]
QUESTIONS
FEEDBACK
To submit a question, use the floating panel on the top of
your screen and click the Q&A button:
Please take a minute to fill out the
feedback form so we can continue to
improve. It will pop up in a new
window when the session ends.
Thank you!
CLICK HERE TO ASK A
QUESTION TO “ALL PANELISTS.”
© 2014 MERCER. ALL RIGHTS RESERVED.
31
© 2014 MERCER. ALL RIGHTS RESERVED.
32


© Copyright 2026