
How to spot bias and other potential problems in
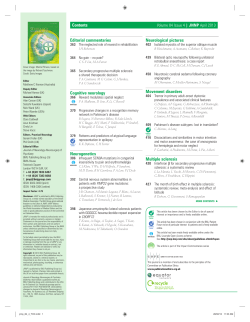
Downloaded from jnnp.bmj.com on September 22, 2014 - Published by group.bmj.com
181
NEUROSCIENCE FOR NEUROLOGISTS
How to spot bias and other potential problems in
randomised controlled trials
S C Lewis, C P Warlow
...............................................................................................................................
J Neurol Neurosurg Psychiatry 2004;75:181–187. doi: 10.1136/jnnp.2003.025833
T
hese days, all clinical trials should be
reported using the CONSORT guidelines1
(table 1); indeed JNNP recommends this in
its instructions for authors. However, not all
trials are reported in this way, and many
journals do not insist on it. Thus some trials
may have been carried out adequately but
reported inadequately, while others have been
carried out inadequately. Our aim in this article
is to guide clinicians in what to look for in a
report of a randomised controlled trial (RCT), so
they can assess whether the trial was done
adequately; we do not intend it to be a guide on
how to do an RCT, as there are many such guides
available.2
The two crucial principles in clinical research
are to minimise bias and to increase precision. If
a study is not designed with these two principles
in mind, no amount of analysis will sort them
out. We will discuss some of the major biases to
look out for, issues related to precision, and some
other aspects of statistical analysis.
BIAS
Bias is any departure of results from the truth.
An RCT is less susceptible to bias than other
study designs for assessing therapeutic interventions. However, just because a study is randomised does not mean it is unbiased. There are at
least seven important potential sources of bias in
RCTs, which are discussed below. When assessing bias, it is important to consider its magnitude
as well as its direction. Trials that have shown
large treatment effects may still be positive after
a small bias has been accounted for.
See end of article for
authors’ affiliations
.......................
Correspondence to:
Dr Steff C Lewis,
Neurosciences Trials Unit,
Division of Clinical
Neurosciences, Western
General Hospital, Crewe
Road, Edinburgh EH4
2XU, UK; steff.lewis@
ed.ac.uk
Received 19 August 2003
In revised form
24 November 2003
Accepted
24 November 2003
.......................
Poor allocation concealment
In a good trial, the treatment allocation is
concealed during the randomisation procedure.
In other words, at the time a clinician randomises a patient they will have no idea what the
next treatment allocation is going to be. If
allocation is concealed, it is not possible for a
clinician to avoid a particular treatment allocation for a particular patient. For example,
consider an RCT of surgical support stockings
versus no treatment to prevent deep venous
thrombosis after stroke. Say an incontinent
patient arrives and the nurse is considering
randomising. The nurse has access to the
randomisation list and knows that the next
random allocation is ‘‘stockings’’. Stockings on
incontinent patients are a lot of work, as they
need regular changing and washing, so the nurse
chooses not to randomise the patient. Because
incontinence is linked to stroke severity, in the
long run this practice would cause the ‘‘stock-
ings’’ arm of the trial to contain less severe
strokes than the ‘‘no stockings’’ arm, which
could bias the results of the trial, even though
treatment allocation was randomised.
Good methods of allocation concealment
include sequentially numbered, opaque, sealed
envelopes; tamper-proof, sequentially numbered
containers; pharmacy controlled lists; and telephone, fax, email, or internet contact with a
central randomisation office.3 4
Imbalance in baseline prognostic variables
In all trials, methods should be used to make
sure that the treatment groups are as similar as
possible. For example, there has been controversy over the results of the National Institute of
Neurological Disorders and Stroke (NINDS) trial
of thrombolysis for acute ischaemic stroke5
because the patients in the recombinant tissue
plasminogen activator (rt-PA) group had less
severe strokes than those in the control group,6
even though they were randomised. As less
severe patients would be expected to have better
outcomes than more severe patients, the trial
results may have been biased in favour of rt-PA.
The trialists adjusted for the imbalance in baseline severity in the analysis, but if the treatment
groups had been comparable to start with, the
arguments would not have arisen.
In a very large trial, randomisation should
ensure that the treatment groups are balanced,
but in small trials, imbalance can and does occur.
Thus in smaller trials stratification is often used
to increase the comparability of the treatment
groups. Stratification ensures that roughly equal
numbers of participants with a particular prognostic characteristic (perhaps age, or disease
severity) will be allocated to each treatment
group. It involves using separate randomisation
lists for each prognostic subgroup (for example,
for age ,80 and age >80).7. It has been
recommended8 that trials seeking to demonstrate
the superiority of one treatment over another
should consider stratifying randomisation when
the overall sample size is small (for example,
,200 patients per treatment arm for a dichotomous outcome), or when interim analyses are
planned that will involve small sample sizes
(stratification is recommended in all equivalence
trials). The stratification factors must be strongly
related to outcome. Thus in a trial of a treatment
for acute stroke, one would stratify for stroke
severity (which is strongly related to outcome),
but not for sex (which is only weakly associated
with outcome). In practice, it is probably more
important that the reader can see that the
treatment arms are balanced with respect to
www.jnnp.com
Downloaded from jnnp.bmj.com on September 22, 2014 - Published by group.bmj.com
182
Lewis, Warlow
Table 1 Checklist of items to include when reporting a randomised trial (from the
CONSORT statement)
Paper section and topic
Description
Title and
abstract
How participants were allocated to interventions (for example,
‘‘random allocation,’’ ‘‘randomised,’’ or ‘‘randomly
assigned’’).
Scientific background and explanation of rationale.
Eligibility criteria for participants and the settings and locations
where the data were collected.
Precise details of the interventions intended for each group
and how and when they were actually administered.
Specific objectives and hypotheses.
Clearly defined primary and secondary outcome measures
and, when applicable, any methods used to enhance the
quality of measurements (for example, multiple observations,
training of assessors).
How sample size was determined and, when applicable,
explanation of any interim analyses and stopping rules.
Method used to generate the random allocation sequence,
including details of any restriction (for example, blocking,
stratification).
Method used to implement the random allocation sequence.
(for example, numbered containers or central telephone),
clarifying whether the sequence was concealed until
interventions were assigned.
Who generated the allocation sequence, who enrolled
participants, and who assigned participants to their groups.
Whether or not participants, those giving the interventions,
and those assessing the outcomes were blinded to group
assignment. When relevant, how the success of blinding was
evaluated.
Statistical methods used to compare groups for primary
outcome(s); methods for additional analyses, such as
subgroup analyses and adjusted analyses.
Flow of participants through each stage (a diagram is strongly
recommended). Specifically, for each group report the
numbers of participants randomly assigned, receiving
intended treatment, completing the study protocol, and
analysed for the primary outcome. Describe protocol
deviations from study as planned, together with reasons.
Dates defining the periods of recruitment and follow up
Baseline demographic and clinical characteristics of each
group.
Number of participants (denominator) in each group included
in each analysis and whether the analysis was by ‘‘intention to
treat’’ . State the results in absolute numbers when feasible (for
example, 10/20, not 50%).
For each primary and secondary outcome, a summary of
results for each group, and the estimated effect size and its
precision (for example, 95% confidence interval).
Address multiplicity by reporting any other analyses
undertaken, including subgroup analyses and adjusted
analyses, indicating those prespecified and those exploratory.
All important adverse events or side effects in each
intervention group.
Interpretation of the results, taking into account study
hypotheses, sources of potential bias or imprecision, and the
dangers associated with multiplicity of analyses and outcomes.
Generalisability (external validity) of the trial findings.
General interpretation of the results in the context of current
evidence.
Introduction
Methods
Background
Participants
Interventions
Objectives
Outcomes
Sample size
Randomisation – sequence
generation
Randomisation – allocation
concealment
Randomisation – implementation
Blinding (masking)
Statistical methods
Results
Participant flow
Recruitment
Baseline data
Numbers analysed
Outcomes and estimation
Ancillary analyses
Adverse events
Discussion
Interpretation
Generalisability
Overall evidence
important prognostic baseline factors than to know the
details of how this was achieved, although it is generally
recommended that the stratification variables are presented
in trial reports.1
Unblinding and no blinding
If anyone involved in a trial is aware of the allocated
treatment, this may affect their judgement. In the Canadian
cooperative trial of cyclophosphamide and plasma exchange
in multiple sclerosis, neither of the active treatment groups
was shown to be superior to placebo when the outcomes were
blindly assessed by neurologists.9 However, in unblinded
outcome assessment by neurologists there was an apparent
treatment effect in one of the treatment groups. Trials can be
www.jnnp.com
designed so that the patient, the treatment team, the
outcome assessor, and even the trial statistician and any
data monitoring committee are all blinded to the allocated
treatment. However, it may be impossible to blind the
administering clinician to treatment allocation, particularly
in trials of interventions such as surgery or physiotherapy.
Blinding can even be difficult in some placebo controlled
drug trials; for instance, intravenous rt-PA often causes
bruising at the injection site. Probably the most important
thing is for the person who assesses the primary outcome to
be blinded to treatment allocation.
In general, the more blinding that is achieved, the less
biased the trial results should be. It is worth noting that there
is no single definition of the phrase ‘‘double blind’’, so trial
Downloaded from jnnp.bmj.com on September 22, 2014 - Published by group.bmj.com
How to spot bias and other potential problems in RCTs
reports should explain exactly who was blinded and how this
was achieved.10
Missing data
In general, the more information from randomised patients
that is missing, the more wary one should be of the trial
results. For example, in a trial of a drug to prevent severe
depression which actually works, more patients in the
placebo group would become depressed. These would be
more likely to stop taking a treatment that did not seem to
work, and also to default from attending follow up
appointments. If the results of those patients were missing
from the final analysis, it would make the placebo group
results look better than they actually were; at worst, it might
then appear that the treatment was not working at all, or at
best that it was working less well than was really the case. In
the presence of much missing data, one never really knows
what the true treatment effect is.
There are some circumstances when the exclusion of
patients does not bias the results.11 For instance, it is
allowable to exclude the data of a few ineligible patients
who were mistakenly randomised into a trial because of
human error. However, one must be sure that treatment is
not potentially harmful for the ineligible patients, so it would
not be appropriate to exclude patients with primary
intracerebral haemorrhage who were inadvertently randomised into a trial of thrombolytic therapy. One must also be
sure that the study results will not be applied to the ineligible
patients. For instance, if an acute stroke treatment was to be
given before computed tomography was done, then a few
people with brain tumours would receive the treatment. Thus
it would not be appropriate to exclude such patients from the
analysis of a trial in which they had been inadvertently
randomised.
Although excluding patients from the analysis in some
circumstances does not bias the results, if many patients were
excluded from a trial, one should question the quality of the
trial design and execution. It should certainly be clearly
described why any data are missing, and what effect this may
have had on the results.
One way that trials can minimise the problem of missing
patient information is to use central randomisation and
follow up. For example, the FOOD trial12 is a family of three
RCTs of feeding after stroke that uses this system. Baseline
data are collected during a randomisation phone call before
randomisation actually happens, and so are 100% complete.
The central office follows up all randomised patients, and in
February 2001, of 3012 patients randomised, only 10 had
permanently missing primary outcome data.
Lack of intention to treat analysis
Intention to treat means that patients are analysed in the
treatment group they were randomised to, whatever happens
later. Some trials analyse the data using an on-treatment
analysis where patients are only analysed if they received the
treatment they were randomised to. An intention to treat
analysis preserves the randomisation process. It has the
advantage of being more like standard clinical practice
(where patients will start on other treatments if the first
treatment they are given does not agree with them, or they
may choose not to take any treatment at all). It also takes
care of unexpected adverse events (patients cannot ‘‘drop
out’’ of the trial analysis if they have an adverse effect of
treatment) and is less open to fraud (the trialists cannot
exclude any patients who did not achieve the hoped-for
outcome).
Figure 1 shows an example of how an on-treatment
analysis can cause bias in practice. Patients with carotid
transient ischaemic attacks are randomised to receive either
carotid surgery or no surgery. If there is a delay of a few days
183
between randomisation and surgery, patients may have a
primary outcome event (in this case a stroke) after
randomisation but before the surgery is done. In the surgery
group, patients who suffer a severe stroke or die will not
receive surgery (and would therefore be removed from the
on-treatment analysis). However, in the no surgery group, if
patients have a stroke or die within a few days of
randomisation, they will have received their allocated
treatment (no surgery) and would therefore be counted in
the on-treatment analysis. The omission of early strokes from
the surgery group would cause fewer strokes to be counted in
the surgery arm, and therefore the on-treatment analysis
would be biased in favour of surgery. The intention to treat
analysis includes all patients and is therefore unbiased.
Counting death as a good outcome
It is important when reading a trial report to consider how
death has been analysed and what effect this may have had
on the results. For instance, the trial may measure the
proportion of patients who were disabled at follow up, using
all patients randomised as the denominator. In this case, the
trial is really comparing the proportion of patients who were
alive and disabled at follow up to the proportion of patients
who were not disabled at follow up, and this latter group
includes both those who were alive and not disabled, and
those who were dead. Thus death has been included as a
good outcome. It would be more sensible to measure the
proportion of patients who were alive and not disabled at
follow up.13
Competing interests
It has been shown that research funded by pharmaceutical
companies is more likely to have outcomes favouring the
sponsor than research funded from other sources.14 15
Pharmaceutical company research is certainly not of poorer
quality than other research, but the companies may have a
tendency not to publish unfavourable results. The number of
industry sponsored trials in stroke is increasing,16 so this
problem is not going to go away, but there are now guidelines
on the relation between sponsors and investigators that may
improve the situation.17
PRECISION
A treatment effect estimate is precise when the confidence
interval around it is very tight, and we are therefore confident
about its magnitude.
Size of trials
Larger trials provide more precise estimates of treatment
effects than small trials, and they may allow a few sensible
and predefined subgroup analyses 18. Small trials, with wide
confidence intervals around their estimates of treatment
effect, are clinically uninformative (although they may add to
an existing meta-analysis or generate enthusiasm to do
further bigger trials).
Trials that use continuous outcome measures (for example,
blood pressure or time taken to walk 10 metres) generally
have greater precision than trials of the same size that use
binary outcome measures (for example, dead versus alive,
hypertensive versus not). However, with continuous outcome
measures there may be more of a problem with missing data,
and it may be unclear how to score dead patients.
RCTs that measure the outcomes that really matter to
patients (such as death or dependency) often require large
numbers of patients to be followed up for long periods.19 20 To
reduce the size of the trial, some trialists use surrogate
outcomes. For instance, to investigate whether a neuroprotective drug reduces death and dependency after stroke, one
would probably have to randomise thousands of patients,
which would take several years. If one used the size of the
www.jnnp.com
Downloaded from jnnp.bmj.com on September 22, 2014 - Published by group.bmj.com
184
Lewis, Warlow
Figure 1 An example from a carotid surgery trial showing how an intention to treat analysis is less biased than an on-treatment analysis. An ontreatment analysis compares group 2 with groups 3 and 4. The omission of group 1 will cause fewer strokes to be counted in the surgery arm, and
therefore this analysis will be biased in favour of surgery. An intention to treat analysis compares groups 1 and 2 with groups 3 and 4, thus including all
strokes.
infarct on magnetic resonance imaging 48 hours posttreatment as a surrogate marker for efficacy, one could
substantially reduce the size and duration of the trial. This
would mean that a new treatment could be proved
efficacious and licensed much earlier, and so benefit
many more patients. However, such surrogate outcomes
often do not prove to be effective substitutes for the true
clinical outcome.19 One of the reasons for this failure may
be that the surrogate marker and the clinical outcome are
on different causal pathways. Alternatively, several
independent processes may cause the disease, only one of
which involves the surrogate marker.20 For instance, the
early ‘‘inflammatory’’ stage of multiple sclerosis may be
detected on magnetic resonance imaging, but this does not
necessarily relate to progression of the disease or later
disability. Thus if a trial used this evidence from MRI as a
surrogate marker of clinical outcome in multiple sclerosis, it
would only show the effects of treatment on the early
inflammatory lesions.
Power versus confidence intervals
The concept of power is very important when designing a
study. Assume that a drug reduces the absolute risk of having
a stroke by 10%. If a trial to measure this treatment effect was
repeated over and over, it would sometimes estimate it to be
greater than 10% and sometimes less than 10%. In some of
the trials, the estimated treatment effect would be so small
that the result would be statistically non-significant (as the
confidence interval for the estimate of the treatment effect
would overlap ‘‘no effect’’). If the trial is designed to have
80% power, then, if the treatment effect truly exists, if the
trial was repeated 100 times a statistically significant
treatment effect would be found in 80 of them. So one in
every five trials would falsely show a non-statistically
significant result.
However, although this is an essential concept when
designing a trial, once a trial has been completed it is more
important to concentrate on the width of the confidence
interval around the treatment effect than on the power
itself.21 When the study was designed, the power calculation was based on a guess at what the treatment effect
might be. After the study is completed, the result is known
and it makes no sense to use prestudy guesses to interpret
the result. The confidence interval around the treatment
www.jnnp.com
effect is based on the actual trial result, and this is what
really counts.
Early stopping
Some trials are planned to be large, but they end up small
because they are stopped early owing to an apparently huge
beneficial effect or a harmful effect. The results of such trials
should be treated with some scepticism, because if they had
been allowed to continue, the final estimated treatment effect
may well have been much smaller.22 In the initial stages of a
trial, the treatment effect tends to zig and zag through some
quite extreme values before settling down, and thus trials
that stop early may just have stopped on one of the random
highs or lows in the treatment effect estimate. Of course,
there may be ethical reasons why a trial has to stop because
of early unexpected harmful effects. However, for some
treatments (such as thrombolysis for acute stroke) and for
many surgical interventions, the trial data monitoring
committee should have carefully considered the possibility
that any early harm may be outweighed by later benefit.
‘‘Absence of evidence’’ and ‘‘evidence of absence’’
Care should be taken in the interpretation of non-statistically
significant results. It is quite common for investigators to
confuse ‘‘absence of evidence of effectiveness’’ with ‘‘evidence of absence of effectiveness.’’ Take, for example, a trial
examining the effect of a drug on death or dependency after
stroke. Nine of 20 patients treated with the drug are dead or
dependent at follow up compared with 10 of 20 untreated
patients, giving a p value of 0.8. However, although the point
estimate for the absolute treatment effect is 5% (10/20 minus
9/20), the 95% confidence interval for the difference in
proportions runs from 224% to +33%. It is therefore quite
plausible that the treatment could cause great harm, or great
benefit. Thus the conclusion of this trial is that we do not
know whether the drug works, and we would need to do a
larger trial to find out.
To assess ‘‘evidence of absence of effectiveness,’’ a trial
needs to be designed as an equivalence trial. RCTs cannot
prove that two treatments are of identical efficacy, but they
can prove that two treatments are of similar efficacy.23 In
equivalence trials, trialists need to prespecify what they mean
by clinical equivalence. Usually a range of equivalence for the
treatment difference is defined such that any value within
Downloaded from jnnp.bmj.com on September 22, 2014 - Published by group.bmj.com
How to spot bias and other potential problems in RCTs
185
the range is deemed clinically unimportant.24 When the trial
results are published, to show that two treatments are
equivalent the confidence interval for the treatment effect
must fall wholly within this predefined range of equivalence.25
whether or not there has been stratification for the baseline
variable in the randomisation process. When reading a trial
report, one should be most convinced when both adjusted
and unadjusted analyses are presented and agree with one
another.
ANALYSIS AND INFERENCES
Subgroups and multiple testing
A report of an RCT will often contain at least one subgroup
analysis, such as the treatment effect in young versus old
patients. Although there are many guidelines on appropriate
ways to do such analyses, inappropriate analyses are still
frequently presented.29
In fig 2, the effect of aspirin in male and female subjects
from the Canadian cooperative study group30 is shown—a
landmark trial in its time. The results in fig 2 are shown in a
forest plot,31 which is a convenient way of presenting
subgroup analysis results. In male subjects, the effect of
aspirin was statistically significant, and in female subjects it
was not. However, this method of inspection of subgroup p
values is incorrect. If one group has more subjects (as in this
case, where there are twice as many men in the trial as
women), then it is far more likely to have a significant p
value, and this has nothing to do with the magnitude of the
treatment effect in that group. The correct way to do a
subgroup analysis is to compare the size of the treatment
effect in one subgroup with the size of the treatment effect in
the other.32 In this case, the correct p value is 0.008, which is
statistically significant. However, this really shows the
dangers of subgroup analysis, because this one was not
prespecified, was not biologically plausible, and was later
proved wrong by the antiplatelet trialists’ collaboration metaanalysis.33
If one examines the effects of treatment in 20 subgroups in
an RCT, one will obtain, on average, one spurious false
positive result at p = 0.05 just by chance. This is more likely
than the chance of rolling two sixes with a pair of dice, which
happens with a probability of 0.028. Sometimes spurious
subgroup results can be dramatic.34 If inappropriate subgroup
analyses have been done (such as inspection of subgroup p
values), the number of false positive results could increase
drastically.29 If many subgroup analyses are shown, it is quite
likely that a couple of ‘‘statistically significant’’ subgroup
effects will occur, but this does not mean that they are
clinically meaningful. The ISIS 2 trial35 showed that aspirin
was less beneficial to people born under the star sign of
Gemini or Libra than other star signs, which puts the results
of the other subgroup analyses into perspective. If only a few
subgroup analyses are shown (possibly spread over several
publications from the same trial) but they are all statistically
significant, one should be very cautious about their interpretation, because the investigator may well have only
presented the statistically significant results, and may have
hidden the hundreds of non-significant results.
Baseline differences
In RCTs, many consider that it is not appropriate to test for
differences in the level of baseline factors between treatment
groups.26 27 In an RCT with two treatment groups, such tests
are testing the hypothesis that the two groups come from the
same population. However, if the randomisation was fair,
then the two groups will certainly have come from the same
population, and one ends up testing whether the randomisation was fair, not whether the two groups had similar
characteristics.26 One should be very wary if no baseline data
are presented at all.
Adjusted versus unadjusted analyses
Results of RCTs can be presented either adjusted or
unadjusted for any differences in baseline prognostic variables. Differences between treatment groups may bias the
results (as explained earlier), and ‘‘adjustment’’ is any
statistical method that alleviates this problem. To understand adjustment, consider the following example. Patients
who suffer strokes of moderate severity generally have
worse outcomes than those of mild severity. In a trial of a
drug in acute stroke, let us assume the proportion of
patients with mild stroke was much higher in the treated
group than in the untreated group. An unadjusted analysis
would overestimate the treatment effect, as the treated
patients were more likely to do well before treatment than
the untreated patients. However, one can calculate the
treatment effect in just the mild patients, and in just the
moderate patients, and then average these two (table 2).
The statistical procedures used to adjust results are often
more complex than this, but they follow the same basic
principle.
When reading a trial report, the unadjusted analyses are
easier to understand, as sometimes the adjusted results
seem to have come out of a statistical ‘‘black box’’ and it is
unclear exactly what has been done. However, adjusted
analyses have statistical advantages in some cases. The key
issue is the correlation between each baseline variable and
outcome.28 If this is high (say .0.5), then adjusting the
analyses for the baseline variable is important. This might
happen, for instance, if the same variable is measured at
baseline and as an outcome after treatment (for example,
measuring blood pressure before and after treatment in a trial
of a blood pressure lowering drug). However, if the
correlation between a baseline variable and outcome is low,
then there is probably no point adjusting for it. These
arguments apply no matter how large the trial is, and
Table 2 Adjusted and unadjusted analyses—a simple example from a hypothetical trial of a treatment for acute stroke where,
for some reason, a greater number of mild patients was randomised to the treatment being tested
All patients
Dead or dependent
Alive and independent
Total
Patients with moderate stroke
Patients with mild stroke
Treated
Untreated
Total
Treated
Untreated
Total
Treated
Untreated
Total
250
750
1000
420
580
1000
670
1330
2000
100
150
250
360
390
750
460
540
1000
150
600
750
60
190
250
210
790
1000
Calculating relative risks of being dead and dependent:
Overall unadjusted treatment effect is 250/10004420/1000 = 0.60
Treatment effect for those with moderate stroke is 100/2504360/750 = 0.83
Treatment effect for those with mild stroke is 150/750460/250 = 0.83
So an overall adjusted treatment effect would be 0.83.
www.jnnp.com
Downloaded from jnnp.bmj.com on September 22, 2014 - Published by group.bmj.com
186
Lewis, Warlow
Figure 2 The dangers of subgroup analysis: the Canadian cooperative study group 1978—difference in risk of stroke or death in 585 patients with
transient ischaemic attacks or stroke treated long term with aspirin versus no aspirin. n = number of patients with stroke or death; N = total number of
patients randomised. CI, confidence interval.
The results of subgroup analyses are more believable if
there are only a few subgroups, predefined using biologically
plausible arguments or from an a priori hypothesis generated
from previous studies, from a trial large enough to stand a
good chance of finding statistically significant treatment–
subgroup interactions,27 and best of all, confirmed in a
completely separate RCT. But in general, one should put most
emphasis on the primary result in all patients.
The effect of false positive results from multiple testing
occurs for all analyses, not just subgroup analyses. If the
investigator has analysed 20 different outcomes, it is likely
that one will be statistically significant just by chance.
Sometimes, a trial measures outcome at several time
points, and undertakes a separate analysis at each one.
Again, it is likely that one will be significant just by chance.
Matthews et al describe appropriate methodology for such
situations.36
Unit of analysis
Most of the examples discussed so far have related to
standard two arm parallel group trials—that is, patients are
randomised to one treatment or another, and after a period of
time an outcome is measured on each patient. However, there
are many other types of trial, and when reading a trial report,
it is important to check whether the analysis is appropriate to
the design, or whether the design is appropriate at all. For
instance, crossover trials are used in some areas of medicine.
In these trials each patient receives both treatments, but the
order in which they receive them is randomised. Crossover
trials have the advantage that each patient acts as their own
control. However, they only work in chronic conditions,
where the treatment cannot cure the disease, only alleviate
the symptoms. Thus they might be suitable in migraine, but
not in meningitis.
In most trials, the unit of randomisation and the unit of
analysis are the same. Patients are randomised to treatments,
and then the outcome is measured and analysed at the level
of the patient—that is, the outcome measure is measured
once on each patient (for example, death). However, there
are trials where the unit of randomisation is not the same as
the unit of analysis. In a trial of a drug to reduce the size of
secondary brain tumours, the patient would be randomised,
but if patients had more than one tumour, the outcome
might be recorded at the level of the tumour. The report of
such a trial should describe clearly that the analysis has taken
this design into account. It is important that this is done, as
one would expect the tumours in one patient to behave quite
similarly, thus reducing the variability in the estimate of
treatment effect. Similar problems occur in cluster randomised trials. These are trials where the unit of randomisation
is, for instance, a general practice surgery, or a residential
www.jnnp.com
home, but where the outcome is measured at the level of the
patient. This design must be taken into account in the
analysis.37
Recurrent events
In some areas of medicine, outcomes tend to be measured in
terms of rates of events. For instance, in multiple sclerosis
one may be interested in the number of relapses that patients
have within a fixed period. Similar data are obtained from
trials examining numbers of epileptic fits or headaches. These
data need to be analysed using appropriate statistical
methods which take account of the fact that some patients
are much more likely to suffer recurrent events than others.38
One should think carefully about what such results actually
mean. In epilepsy, one of 10 patients having 100 fits is rather
different from 10 of 10 patients having 10 fits each. Although
the mean number of fits is 10 in both scenarios, they are
clearly quite different situations.
Adverse events
In addition to considering the efficacy of a treatment, it is
essential to consider safety.39 In the elderly, there can be more
adverse effects of treatments than in the young (such as
postural hypotension and fainting in blood pressure lowering
trials). Even minor adverse events can be important when
considered across large populations. To take an extreme
example, let us assume that it was decided to give the whole
population over the age of 50 a statin to lower their
cholesterol levels, but that in many people this caused them
to have mild numbness in the hands. Such an adverse effect
might not be seen as a problem in a person who was seriously
ill and very likely to suffer a heart attack in the coming year
unless treated. However, in previously healthy people, the
adverse effect would not be accepted, and across a whole
population it could be disastrous. One should be wary of
trials where no adverse effects of treatment are reported, as
there are no magic bullets in medicine. One should also be
wary of trials where the length of follow up has been very
short, as adverse events may only arise after a longer period.
Few RCTs will be big enough to detect rare adverse events,
but small trials will not even be able to detect common
adverse events. In order to detect adverse effects reliably,
effective postmarketing surveillance in large numbers of
patients, or a case–control study, is required.
The assessment of adverse effects is particularly important
in equivalence trials. It is not enough to prove that two
treatments are equivalent in terms of efficacy. A new
treatment must be as safe as, or safer than, the old one
(and if it is not significantly safer than the old treatment then
it should be shown to be cheaper or more convenient).
Downloaded from jnnp.bmj.com on September 22, 2014 - Published by group.bmj.com
How to spot bias and other potential problems in RCTs
Generalisability and interpretation
The result of an RCT is only applicable to day to day practice if
the patients included in the trial were similar to those who
would be treated in practice. Thus if a treatment has only
been tested in men aged under 65, it is generally impossible
to know whether it will benefit a 95 year old woman. On
balance, trials with broad inclusion criteria are more
generalisable than those with strict criteria. By examining
the inclusion and exclusion criteria, and the baseline data,
clinicians should consider whether the trial sample is
reasonably representative of the people they wish to treat.40
However, more emphasis should be placed on the overall
outcome of the trial than on the results for one particular
subgroup within the trial.41
THE FUTURE
Although in the past the quality of trial reporting has been
poor, it does appear to be improving.16 42 The use of the
CONSORT guidelines1 by more journals will increase quality
further. In the future, let us hope we can be more able to
believe what we read.
CONCLUSIONS
Allocation should be concealed during randomisation.
Outcomes should be defined carefully. Outcome assessors
should be blind to treatment allocation. It should be clear
why missing data are missing. Analyses should be on the
basis of intention to treat. It is worth bearing in mind that
just because a trial says it is ‘‘intention to treat’’ and that
allocation is concealed, it does not mean that these
statements are true. It is important to read a trial report
carefully to make sure that the authors knew the precise
definitions of these terms.
One should be particularly cautious not to overinterpret the
results of subgroup analyses. We all want to find treatments
that work, and we can get very excited when we think we
have found something, but we need to remember that some
things are just too good to be true.
ACKNOWLEDGEMENTS
We would like to thank Jon Stone and Rustam Al Shahi for helpful
comments on an earlier draft.
.....................
Authors’ affiliations
S C Lewis, Neurosciences Trials Unit, Division of Clinical Neurosciences,
Western General Hospital, Edinburgh, UK
C P Warlow, Division of Clinical Neurosciences, University of Edinburgh
Competing interests: none declared
Website of interest: CONSORT: http://www.consort-statement.org/
REFERENCES
1 Moher D, Schulz KF, Altman D. The CONSORT statement: revised
recommendations for improving the quality of parallel-group randomized
trials. JAMA 2001;285:1987–91.
2 Pocock SJ. Clinical trials – a practical approach. Chichester: John Wiley,
1983.
3 Altman DG, Schulz KF. Concealing treatment allocation in randomised trials.
BMJ 2001;323:446–7.
4 Schulz KF, Grimes DA. Allocation concealment in randomised trials:
defending against deciphering. Lancet 2002;359:614–18.
5 National Institute of Neurological Disorders and Stroke rt-PA stroke study
group. Tissue plasminogen activator for acute ischemic stroke. N Engl J Med
1995;333:1581–7.
6 Mann J. Truths about the NINDS study: setting the record straight. West J Med
2002;176:192–4.
7 Roberts C, Torgerson D. Randomisation methods in controlled trials. BMJ
1998;317:1301.
187
8 Kernan WN, Viscoli CM, Makuch RW, et al. Stratified randomisation for
clinical trials. J Clin Epidemiol 1999;52:19–26.
9 Noseworthy JH, Ebers GC, Vandervoort MK, et al. The impact of blinding on
the results of a randomised, placebo-controlled multiple sclerosis clinical trial.
Neurology 1994;44:16–20.
10 Schulz KF, Chalmers I, Altman DG. The landscape and lexicon of blinding in
randomized trials. Ann Intern Med 2002;136:254–9.
11 Fergusson D, Aaron SD, Guyatt G, et al. Post-randomisation exclusions: the
intention to treat principle and excluding patients from analysis. BMJ
2002;325:652–4.
12 The FOOD trial collaboration. Performance of a statistical model to predict
stroke outcome in the context of a large, simple, randomized, controlled trial
of feeding. Stroke 2003;34:127–33.
13 Lubsen J, Kirwan BA. Combined endpoints: can we use them? Stat Med
2002;21:2959–70.
14 Bekelman JE, Li Y, Gross CP. Scope and impact of financial conflicts of interest
in biomedical research – a systematic review. JAMA 2003;289:454–65.
15 Lexchin J, Bero LA, Djulbegovic B, et al. Pharmaceutical industry sponsorship
and research outcome and quality: systematic review. BMJ
2003;326:1167–70.
16 Kidwell CS, Liebeskind DS, Starkman S, et al. Trends in acute ischaemic stroke
trials through the 20th century. Stroke 2001;32:1349–59.
17 Donnan GA, Davis SM, Kaste M, for the international trial subcommittee of the
international stroke liaison committee, American Stroke Association.
Recommendations for the relationship between sponsors and investigators in
the design and conduct of clinical stroke trials. Stroke 2003;34:1041–5.
18 Warlow C. Advanced issues in the design and conduct of randomized clinical
trials: the bigger the better? Stat Med 2002;21:2797–805.
19 Fleming TR, DeMets DL. Surrogate endpoints in clinical trials: are we being
misled? Ann Intern Med 1996;125:605–13.
20 Bucher HC, Guyatt GH, Cook DJ, et al. For the evidence-based medicine
working group. Users’ guides to the medical literature, XIX. Applying clinical
trial results. A. How to use an article measuring the effect of an intervention on
surrogate end points. JAMA 1999;282:771–8.
21 Goodman SN, Berlin JA. The use of predicted confidence intervals when
planning experiments and the misuse of power when interpreting results. Ann
Intern Med 1994;121:200–6.
22 Wheatley K, Clayton D. Be skeptical about unexpected large apparent
treatment effects: the case of an MRC AML12 randomization. Control Clin
Trials 2003;24:66–70.
23 Siegel JP. Equivalence and noninferiority trials. Am Heart J
2000;139:S160–70.
24 Ebbutt AF, Frith L. Practical issues in equivalence trials. Stat Med
1998;17:1691–701.
25 Jones B, Jarvis P, Lewis JA, et al. Trials to assess equivalence: the importance
of rigorous methods. BMJ 1996;313:36–9.
26 Altman DG, Dore´ CJ. Randomisation and baseline comparisons in clinical
trials. Lancet 1990;335:149–53.
27 Assmann SF, Pocock SJ, Enos LE, et al. Subgroup analysis and other (mis)uses
of baseline data in clinical trials. Lancet 2000;355:1064–9.
28 Pocock SJ, Assmann SE, Enos LE, et al. Subgroup analysis, covariate
adjustment and baseline comparisons in clinical trial reporting: current
practice and problems. Stat Med 2002;21:2917–30.
29 Brookes ST, Whitley E, Peters TJ, et al. Subgroup analyses in randomised
controlled trials: quantifying the risks of false-positives and false-negatives.
Health Technol Assess 2001;5:33.
30 The Canadian Cooperative Study Group. A randomized trial of aspirin and
sulfinpyrazone in threatened stroke. N Engl J Med 1978;299:53–9.
31 Lewis S, Clarke M. Forest plots: trying to see the wood and the trees. BMJ
2001;322:1479–80.
32 Matthews JNS, Altman DG. Statistics notes: Interaction 3: how to examine
heterogeneity. BMJ 1996;313:862.
33 Antiplatelet Trialists’ Collaboration. Collaborative overview of randomised
trials of antiplatelet therapy. I: Prevention of death, myocardial infarction, and
stroke by prolonged antiplatelet therapy in various categories of patients. BMJ
1994;308:81–106.
34 Clarke M, Halsey J. DICE 2: a further investigation of the effects of chance in
life, death and subgroup analyses. Int J Clin Pract 2001;55:240–2.
35 ISIS-2 collaborative group.. Randomised trial of intravenous streptokinase,
oral aspirin, both, or neither among 17187 cases of suspected acute
myocardial infarctio: ISIS-2. Lancet 1988;ii:349–60.
36 Matthews JNS, Altman DG, Campbell MJ, et al. Analysis of serial
measurements in medical research. BMJ 1990;300:230–5.
37 Kerry SM, Bland JM. Trials which randomize practices I: how should they be
analysed? Fam Pract 1998;15:80–3.
38 Glynn RJ, Buring JE. Ways of measuring rates of recurrent events. BMJ
1996;312:364–7.
39 Cuervo LG, Clarke M. Balancing benefits and harms in health care – we need
to get better evidence about harms. BMJ 2003;327:65–6.
40 Schulz KF, Grimes DA. Sample size slippages in randomised trials: exclusions
and the lost and wayward. Lancet 2002;359:781–5.
41 Collins R, MacMahon S. Reliable assessment of the effects of treatment on
mortality and major morbidity, I: clinical trials. Lancet 2001;357:373–80.
42 Bath F, Owen V, Bath P. Quality of full and final publications reporting acute
stroke trials. A systematic review. Stroke 1998;29:2203–10.
www.jnnp.com
Downloaded from jnnp.bmj.com on September 22, 2014 - Published by group.bmj.com
How to spot bias and other potential problems
in randomised controlled trials
S C Lewis and C P Warlow
J Neurol Neurosurg Psychiatry 2004 75: 181-187
doi: 10.1136/jnnp.2003.025833
Updated information and services can be found at:
http://jnnp.bmj.com/content/75/2/181.full.html
These include:
References
This article cites 39 articles, 16 of which can be accessed free at:
http://jnnp.bmj.com/content/75/2/181.full.html#ref-list-1
Article cited in:
http://jnnp.bmj.com/content/75/2/181.full.html#related-urls
Email alerting
service
Topic
Collections
Receive free email alerts when new articles cite this article. Sign up in the
box at the top right corner of the online article.
Articles on similar topics can be found in the following collections
Stroke (1325 articles)
Incontinence (51 articles)
Radiology (1601 articles)
Notes
To request permissions go to:
http://group.bmj.com/group/rights-licensing/permissions
To order reprints go to:
http://journals.bmj.com/cgi/reprintform
To subscribe to BMJ go to:
http://group.bmj.com/subscribe/


© Copyright 2026