
Document 214185
HOW TO
CALCULATE
TECHNICIAN-TO-VEHICLE RATIOS
To properly maintain and manage a public sector fleet operation, determining the necessary ratio
of technicians to vehicles is key to keeping vehicles on the road and operations running smoothly.
BY SAl BIBONA
C
alculating
technician-to-vehicle
ratios is important, not only in
analyzing staffing requirements,
but also when making benchmarking
comparisons on an inter- and intra-organizational basis. To begin learning how
to calculate technician-to-vehicle
ratios,
start with the fundamentals
and learn
from real-world examples.
Vehicle Type
Vehicle: Technician
Ratio
Transit bus
10:1
School bus
20 to 30:1
Fire departments
30:1
USING SIMPLE RATIOS
Small towns
35:1
The most simplistic approach stipulates that a specific number of technicians
is needed to support a fleet of a given size.
The following table summarizes typical
ratios used for different fleet types:
Counties & cities
55 to 60:1
Utilities
55 to 75:1
ATAGLANCE
When calculating vehicle-to-technician
ratios, fleet managers should consider:
• Percent of work performed in-house.
• Variations in technician utilization due to
non-fleet activities, ete.
• Vehicle age, utilization, and condition.
24
Government
Fleet
This is the most fundamental and rudimentary type of staffing ratio; it has the
advantage of being easy to use. When applied to a specific vehicle type, such as a
police car, fire truck, school bus, or trash
compactor, this approach can be used in
situations where quick and approximate
comparisons must be made. When applied to a "mixed" fleet, such as a local
government fleet operation, this approach
January/February 2011
can work if it can be assumed the mixed
fleet under review has a composition of
light-, medium-, and heavy-duty vehicles
and equipment,
somewhat similar to
those of peer fleets from which the ratio
was derived. Otherwise, the simple ratio
approach may not be fully satisfactory.
VEHiClE EQUIVALENCY RATIOS
A more precise approach takes into
account the size and composition of the
fleet by applying vehicle equivalents.
Most notable are Maintenance and Repair Unit (MRU) factors, which index
the maintenance
and repair requirements of a vehicle class relative to a base
vehicle class, typically a passenger car.
Thus, a heavy truck, which has greater
maintenance and repair needs than a basic passenger sedan, has a greater MRU
factor than a passenger sedan.
MRU factors by class are then multiplied by the number of vehicles in each
class to produce the number ofMRUs by
class. These factors are summed for the
entire fleet to result in the total MRUs,
or vehicle equivalents, of the fleet.
Through this process, a mixed fleet size
is converted to its vehicle equivalent
size, which in turn can be used to estimate technician as well as indirect staffing requirements for the fleet operation.
DERIVING MRU FACTORS
The weighting factors used in MRU
analysis can be derived in multiple ways.
One is to survey fleet managers to obtain
their best estimates of the annual total
technician hours needed to maintain a
particular vehicle class.
The median values of their responses are then calculated for each vehicle
class. Next, the passenger car is set as
the base unit by dividing its technician
hour requirement into the technician
hour requirements for each vehicle and
equipment class. This division yields the
respective weighting factors by vehicle
and equipment class. The passenger car
has a factor of unity (1.0).
Another approach is to study the
maintenance histories of specific vehicle
classes. Sometimes these studies will
take into account ofher factors, such as
vehicle utilization or age. Much depends
on the availability of data and the degree
of precision desired.
Sometimes, for convenience, 20 hours
per year can be used as the base MRU unit.
This facilitates making historical comparisons of benchmarking data from past years,
after the number of hours to maintain a
passenger car has typically declined. It provides an even number for division.
When using 20 hours as the base unit
per MRU, it is possible for the MRU factor of a passenger car to be less than or
greater than 1.0.
For example, a passenger car averaging 12.5 hours per year would have a
MRU factor of 0.62.
This is why it is important to know
what the base unit hours are when trying
to compare benchmarking results from
one year to the next or from one fleet to
the next.
ESTIMATING STAFFING NEEDS
MRUs represent a proxy for workload.
Once the number of MRUs has been de-
i" ~ ~-: a
o":~"
[,;; _ ~ ,~~ ~ -8"'
-""
~
~
co
~
.'~K_::~~[,:~
. . ~{'--_ -',_ ~~_
S~MPuE
L_
~
&_
:<", ~ '" ~-~~=<;~mR'7'~=:tt:i::"=4"~~~~;~::;~:f;t!~:<¥:'!f!0J~~::ij(',,[:~i;
~ --
~~"
'~"'
__
~
~
JTA~L~~~~~i~:~\~~p~~f;;~;~~;~~;i~~~l1~~;I~~mt:
MR.lm{$IDMPt.:J'f:A'f:IIDN°iE''''~·''·---jj'
'm-.W815~_'"
~c\S~
k ____
~~~ZB£j'"X~~fRHd~&B,b£&n~K'"ni£~~~::~'~:~~;
MRU Factor (a)
Vehicles
MRUs
Passenger cars (non-police)
1.0
26
26.0
Pickups, vans, and other light trucks
234
351.0
Sheriff patrol vehicles
1.5
1.5
178
267.0
Sheriff motor cycles
0.9
16
14.4
Non-pursuit vehicles
1.0
0
0.0
Ambulances
3.4
0
0.0
Antique fire truck
1.0
2
2.0
Fire trucks
7.6
66
501.6
Brush trucks
3.9
15
58.5
Dump trucks
4.0
18
72.0
Street sweepers
(14.0
5
70.0
Refuse compactors
7.3
0
0.0
Class
Farm type tractors
1.4
1
1.4
Transit buses
7.0
0
0.0
Other buses (specify type)
4.8
0
0.0
Sewer trucks
3;8
0
0.0
Backhoes, loaders, and trenchers
2.7
13
35.1
Dozers, scrappers, and pavers
22
83.6
Roller
3.8
3.5
12
42.0
Bucket trucks
3.2
0
0.0
Digger derricks
4.5
0
0.0
Other trucks
3.6
54
194.4
Forklifts
0.9
0
0.0
Mowers
1.0
4
4.0
Other motorized equipment (ATVs, chippers,
floor sweepers, etc.)
0.6
23
13.8
Trailers
0.6
Total
35
21.0
724
1,757.8
Note: (a) Based on 73.3 hours per MRU.
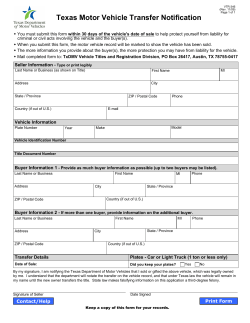
Table 2 presents a sample MRU computation recently developed for a county fleet. As indicated, the total fleet size of 724 has been converted to its MRU size of 1,757.8.
termined, the maintenance and repair
workload of the fleet is established. This
workload can be converted into staffing
requirements in two ways.
The first option is the direct ratio
approach, in which the number of fleet
MRUs per technician, with a basis of
20 hours per MRU Similarly, MRU
ratios are available for additional fleet
positions, such as supervisors, parts
persons, fleet managers, etc.
The second option is converting the
400 MRUsx 12.5 hours perMRU = 5,000 hours
MRUs is divided by an MRU technician
to vehicle ratio. Based on recent public
service benchmarking surveys, this ratio is typically to be about 78 in-house
MRUs into hourly equivalents by multiplying the fleet size expressed in MRUs
times the number of hours needed to
maintain the base unit. Thus, if the
Government Fleet
January/February 2011
25
MAINTENANCE
& STAFFING
MRU factors had a basis of 12.5 hours
per passenger car, a fleet of 400 MRUs
would require' 5,000 technician hours
for maintenance and repair.
By dividing these hours by the estimated number of hours a technician
has during the year for direct work, the
estimated number of needed technicians can be calculated. If technicians
average 1,350 direct hours per year, 3.7
technicians would be required for proper
maintenance.
PERCENT OF WORK DONE
IN-HOUSE
The two sample computations discussed assumed all work was done inhouse. However, a fleet operation outsourcing most of its maintenance and
repair work can be expected to require
fewer technicians than a fleet operation
of similar size where most maintenance
and repair work is performed in-house.
To account for such differences, the
number of MRUs shou1d be reduced in
proportion to the percentage of work
performed in-house, before any MRU
staffing ratios are applied. Similarly, if
MRUs were converted to hours, these
hours should also be reduced beforehand, dividing by the number of hours
per year a technician has available for
direct work.
One additional option is to assess the
proportion of work performed in-house
by vehicle class. In the author's consulting practice, work orders are analyzed
to provide the needed detail. However, if
time or resources do not permit such detail, then an approximation of the overall
maintenance percentage performed inhouse will need to be made. Typically,
this is done on a judgment basis.
VARIATIONS IN TECHNICIAN
UTILIZATION
The preceding example used 1,350
hours per year as a basis for estimating
technician requirements. This equates
to 65 percent of the 2,080 total on-theclock hours per year in technician utilization. Some fleets may achieve higher
rates, such as 70 percent, or 1,450 hours
per year, and others incur lower rates,
such as only 50 percent or 1,040 hours
per year. In any event, there may be val26
Government Fleet
TABLE 3
ESTIMATED WORKLOAQ AND
~..
... . TECHNICIAN.S ..NEEJ2~Pd '.~
~
~'0
-~",",-"),,
Total MRUs (from Table 2)
1,757.8
Total hours @ 13.3 hours per MRU
23,378.7
In-house hours @ 95 percent in-house
Estimated number of technicians
65-percent utilization)
22,209.8
needed @ 1.350 hours/tech.
(i.e.
16.5
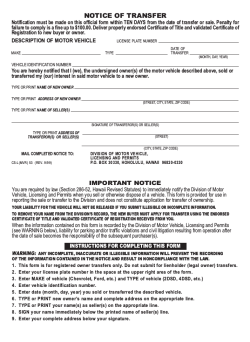
Table 3 then converts the MRUs into direct hours at the rate of 13.3 hours per MRU. Assuming
that 95 percent of the work is performed in-house and that each technician produces 1,350 direct hours per year (65-percent utilization rate), then the number of technicians is estimated to
be 16.5. The 16.5 technicians equate to a ratio of 101 in-house MRUs per technician (95 percent
x 1,757.8 divided by 16.5). Alternately, this can be expressed in the inverse as the ratio of 0.99
technicians per 100 in-house MRUs.
id reasons within a given fleet operation
for some variation in technician utilization by shop facility.
At some shops, technicians may be
supporting non-fleet activities, such as
maintaining compressor stations for
natural gas vehicles. Alternatively, they
may have a wider geographic area to
cover and must spend more time traveling to service outlying locations. In
any event, such variations in technician
utilization should be taken into account
when comparing staffing needs from
one garage to the next within the same
fleet organization. Of course, if lower
technician utilization rates are found
due to poor workforce management
techniques, these variations should be
used to identify where improvement is
needed.
Sometimes, technicians may be less
productive because of older or inadequate facilities. The differences can
be used to help justify improvement in
the lower-performing facility. In other
cases, it may simply be due to underreporting of direct hours. Thus, reasons
for utilization variations must be identified before jumping to conclusions.
ADDITIONAL
CONSIDER
FACTORS TO
Data permitting, staffing ratios can
be further refined to take into account
other such factors as vehicle age, utilization, and condition. This is best done for
a large fleet operating a wide range of vehicle ages, utilizations, and conditions.
In addition, it should be noted that
MRUs represent the amount of time or
January/February 2011
workload needed for normal maintenance and repair activity, not capital
work. Fleets that engage in significant
amounts of capital work, such as rebuilding, overhauling, andupfitting
must account for this activity when applying MRU ratios or estimating staffing
requirements.
The easiest way is to increase the
number of MRUs by the equivalent
amount of capital work performed.
Thus, if a fleet spends 2,000 hours in
capital work and is using 12.5 hours per
year as its base MRU factor, then 160
MRUs should be added to its fleet size
expressed in MRUs (2,000 hours divided
by 12.5 hours per MRU = 160 MRUs).
Accidents and vehicle damage are
not technically included in MRU factors. However, from a practical standpoint, they generally represent only a
small percentage of work order hours
by vehicle class. The major exceptions
are police fleet vehicles, where accidents
can account for a significant portion of
patrol vehicle repairs.
When properly applied, technicianto-vehicle ratios can be a .helpful management tool in estimating the staffing
needs of a fleet operation. However, it is
also important to understand the limitations and assumptions inherent in the
process to yield satisfactory and truly
useful results. 0
ABOUT
"~'1
THE AUTHOR
, Sal Bibona is president of Chatham
Consulting, Inc., a fleet management
consulting company. He can be
reached at (973) 966·9262 or
[email protected].
"""'j':
I


© Copyright 2026