
Genetic Adaptive Neural Network to Predict
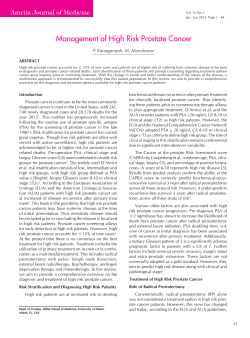
MOLECULAR UROLOGY
Volume 5, Number 4, 2001
Mary Ann Liebert, Inc.
Genetic Adaptive Neural Network to Predict
Biochemical Failure After Radical Prostatectomy:
A Multi-institutional Study
ASHUTOSH TEWARI, M.D.,1 MUTTA ISSA, 2 RIZK EL-GALLEY,2 HANS STRICKER,1
JAMES PEABODY, M.D.,1 JULIO POW-SANG, 3 ASIM SHUKLA, 3 ZEV WAJSMAN, 4 MARK RUBIN,5
JOHN WEI, M.D.,5 JAMES MONTIE,5 RAYMOND DEMERS,1 CHRISTINE C. JOHNSON, Ph.D.,1
LOIS LAMERATO, M.D.,1 GEORGE W. DIVINE, Ph.D.,1 E. DAVID CRAWFORD, M.D.,6
EDUARD J. GAMITO, B.S.,6 RIAD FARAH, 1 PERINCHERY NARAYAN, M.D.,4 GRANT CARLSON, M.A.,7
and MANI MENON, M.D.1
ABSTRACT
Background and Purpose: Despite many new procedures, radical prostatectomy remains one of the commonest methods of treating clinically localized prostate cancer. Both from the physician’s and the patient’s point
of view, it is important to have objective estimation of the likelihood of recurrence, which forms the foundation for treatment selection for an individual patient. Currently, it is difficult to predict the probability of biochemical recurrence (rising serum prostate specific antigen [PSA] concentration) in an individual patient, and
approximately 30% of the patients do experience recurrence. Tools predicting the recurrence will be of immense practical utility in the treatment selection and planning follow up. We have utilized preoperative parameters through a computer based genetic adaptive neural network model to predict recurrence in such
patients, which can help primary care physicians and urologists in making management recommendations.
Patients and Methods: Fourteen hundred patients who underwent radical prostatectomy at participating institutions form the subjects of this study. Demographic data such as age, race, preoperative PSA, systemic
biopsy based staging and Gleason scores were used to construct a neural network model. This model simulated the functioning of a trained human mind and learned from the database. Once trained, it was used to
predict the outcomes in new patients.
Results: The patients in this comprehensive database were representative of the average prostate cancer
patients as seen in USA. Their mean age was 68.4 years, the mean PSA concentration before surgery was 11.6
ng/mL, and 67% patients had a Gleason sum of 5 to 7. The mean length of follow-up was 41.5 months. Eighty
percent of the cancers were clinical stage T2 and 5% T3. In our series, 64% of patients had pathologically
organ-confined cancer, 33% positive margins, and 14% had seminal vesicle invasion. Lymph node positive
patients were not included in this series. Progression as judged by serum PSA was noted in 30.6%. With entry of a few routinely used parameters, the model could correctly predict recurrence in 76% of the patients
in the validation set. The area under the curve was 0.831. The sensitivity was 85%, the specificity 74%, the
positive predictive value 77%, and the negative predictive value of 83%.
Conclusion: It was possible to predict PSA recurrence with a high accuracy (76%). Physicians desiring objective treatment counseling can use this model, and significant cost savings are anticipated because of appropriate treatment selection and patient-specific follow-up protocols. This technology can be extended to
other treatments such as watchful waiting, external-beam radiation, and brachytherapy.
1Josephine
Ford Cancer Center and Department of Urology, Henry Ford Medical Center, Detroit, Michigan.
University, Atlanta, Georgia.
3University of South Florida, Tampa, Florida.
4Department of Urology, University of Florida, Gainesville, Florida.
5University of Michigan, Ann Arbor, Michigan.
6ANNs in CaP Project, Institute for Clinical Research, Denver, Colorado.
7Dianon Systems, Stratford, Connecticut.
2Emory
163
164
TEWARI ET AL.
INTRODUCTION
P
ROSTATE CANCER IS EXTREMELY COMMON , accounting for
approximately 29% of all cancers in men. This year 179,300
new diagnoses of prostate cancer are expected in the USA.1
Localized prostate cancer can be treated successfully in 70% to
90% of patients with either radical prostatectomy or radiation
therapy.2–5 Even though the ultimate success of treatment is
measured by crude and cancer-specific survival, an important
intermediate endpoint is the rise of serum prostate specific antigen (PSA) (biochemical recurrence). Biochemical recurrence
usually signifies reappearance of PSA-producing cells in the
body, and it sometimes portends future appearance of bony
metastasis. It will be useful to know beforehand that the patient’s disease is likely to recur. Different treatments or followup protocols may be selected on the basis of this information.
Both will result in more objective management, improved patient satisfaction (because of realistic expectations), and significant cost savings.
There have been few previous attempts to address this question. Timing and steepness of PSA recurrence following radical prostatectomy have been used to differentiate local disease
and systemic metastasis.5–12 Recurrence after radical prostatectomy can occur either in the local area from which the primary
cancer was removed (defined by biopsy-proven recurrence
within the prostatic fossa postoperatively) or elsewhere in body
(mainly bones) through systemic spread. Local recurrence is
amenable to focused radiotherapy, while systemic spread necessitates endocrine therapy.6,7,10,13,14 Biochemical failure (as
evidenced by rising PSA after surgery) occurs in as many as
20% to 30% of all patients by 10 years after treatment.6,7,10,13,14
Certain high-risk groups (positive surgical margins or extensive
extracapsular disease) may have higher rates of biochemical
failures (45%-75%) at 5 years postoperatively.2–5
Prediction of PSA recurrence therefore is a useful endpoint
in patients undergoing radical prostatectomy, as it may forecast
future bony metastasis and help in differentiating local from
systematic recurrence (time of failure after surgery is longer for
local recurrence). Such knowledge also may result is cost savings by virtue of the fact that it takes about 5 to 8 years for
metastasis to appear after biochemical recurrence. Thus, patients whose disease has not recurred at 5 and 8 years are unlikely to have recurrence at 10 and 15 years’ follow-up, respectively, and can thus be followed with less frequent office
visits and laboratory investigations. Moreover, early detection
can permit salvage of few local failures by timely radiotherapeutic interventions, and accurate prediction of early PSA recurrence will result in more realistic outcome expectations on
the part of patients undergoing surgery.15–22 Such predictions
are currently being done on the basis of PSA velocity, logistic
regression models, Cox regression analysis and histopathologic
features.10,15–22
Recently, artificial intelligence-basedneural networks (ANNs)
have become available for medical predictions.23–44 A neural
network predicts outcome on the basis of the integration of multiple input variables. It is constructed from a large data set with
known values of multiple input variables and outcome endpoints. The input variables are mathematically transformed into
a nonlinear equation that best classifies the data set into specific outcome groups. Computers are required to carry out such
intense mathematical calculations and can be used later to ap-
ply these models to future data sets. Neural networks start the
computation without any bias and tend to unmask the mathematical relations between various inputs and outcome, as discussed elsewhere in this issue. They do not require linearity of
data and sometimes bring out subtle and interesting relations
between various input variables, which in turn help investigators better understand the problem at hand. Traditionally, neural
networks perform better than standard statistical methods if data
are noisy (such as medical data).23–44
A further modification of neural network technology is called
genetic adaptive (GA) modeling,31,39,40,42,43 which is a novel
means of training ANNs. Network learning is based on genetic
mechanisms of evolution, which result in survival and genesis
of intelligent, self-organizing, self-repairing, self-motivating organisms that are the strongest among the pool of individuals
and genetic patterns. The Darwinian theory of evolution depicts
biological systems as the product of the ongoing process of natural selection. Likewise, genetic algorithms allow scientists to
use a computer to evolve solutions over time, instead of designing them at the outset without knowing the trend and final
outcome. These algorithms emulate the process of natural selection and survival of the fittest by searching high-dimensional
spaces for superior solutions. The algorithms are simple, robust, and general; no knowledge of the search space is assumed.
This technology has been used in the prediction of survival in
patients with lung cancer, where it outperformed logistic regression models. In genetic algorithms, selection operates on
strings of binary digits stored in the computer’s memory, and
over time, the functionality of these strings evolves in much the
same way that natural populations of individuals evolve. These
algorithms evolve individuals using principals of variation, selection, inheritance, crossover, and mutation.
This technology was recently tested by our group in a pilot
study for staging prostate cancer utilizing basic input variables
such as serum PSA, biopsy Gleason score, and laterality of cancer. It accurately identified the stage in more than 70% of patients.39–41 The preliminary results were promising and we hypothesized that similar models could be constructed for the
prediction of PSA recurrence. The aim of this study was to integrate the preoperative data into a unified model (ANN) to create
a tool to predict PSA progression in patients with clinically localized prostate cancer. Presented herein are the results of our
study involving 1400 patients who underwent radical prostatectomy at multiple institutions and were followed closely for a minimum of 3 years after surgery. Involvement of multiple institutions ensures that the model can recognize different types of
patients who differ significantly in age, stage, grade and technique
of radical prostatectomy. This technology is unique in the sense
that, although it requires that training be performed using a large
database, the model resulting from that training can be applied
easily during clinical management on an individual patient basis.
MATERIALS AND METHODS
Establishment of Database
The total database consisted of 1400 patients with complete
demographic, laboratory, clinical, systematic biopsy stage, and
postoperative follow-up and PSA progression information. All
patients underwent standard pelvic lymphadenectomy and rad-
165
GENETIC ADAPTIVE MODELS FOR PSA FAILURE
ical prostatectomy and were followed for a minimum of 1 year
after surgery. The patients were contributed from Henry Ford
Hospital, Detroit, MI; Emory University, Atlanta, GA; University of Florida, Gainesville, FL; Dianon Systems, Stratford, CT;
University of South Florida, Tampa, FL; and University of
Michigan, Ann Arbor, MI. Preoperatively, all patients underwent three or more biopsies from each lobe of the prostate under ultrasound guidance in addition to lesion-directed biopsy if
any suspicious areas were noted. Patients underwent serum PSA
estimation prior to biopsy using the TAndem-R, two-site radioimmunoassay (Hybritech, Inc., San Diego, CA). Patients
who had previous prostatic surgery such as transurethral resection or minimally invasive therapy were not included in the
study. Patients who had received preoperative hormonal therapy, radiation, or cryotherapy were also excluded. Patients with
positive lymph nodes and those who had less than 3 years’ follow-up were not included in the analysis.
The sample size was picked to fit the guideline suggested by
Harrell and associates that for each predictor variable, there
should be at least 10 observations in the smaller outcome category.45–47
Assessment of Clinical Extent of Cancer
According to the biopsy results, patients were classified as
having stage T2a-b (B1) disease if the biopsies showed one lobe
positive, T2c (B2) disease if the biopsies from both lobes were
positive, and T3 (C) disease if the seminal vesicle biopsy was
positive for prostate cancer. Biopsy findings were reported using the Gleason grading system. The highest biopsy score was
assigned to each patient if the field contained more than one
Gleason score.48
Frozen section analyses of lymph nodes were performed
based on the discretion of the operating surgeon when it was
felt that there were clinically suspect nodes intraoperatively. If
the lymph nodes were positive on frozen section biopsy, radical prostatectomy was abandoned. All lymph node samples
were subjected to permanent section. After removal, prostate
specimens were coated with India ink, weighed, and measured
in the anteroposterior, cephalocaudal, and transverse dimensions. Prostates were embedded in their entirety and fixed in
10% Formalin for 18 to 24 hours. After fixation, the distal and
proximal urethral margins were removed for histologic examination. The prostate and seminal vesicles were step sectioned
at 3- to 5-mm intervals perpendicular to the long axis of the
gland, and each section was examined histologically. Pathologic stage was reported as organ confined, extracapsular extension with or without positive surgical margins, and/or seminal vesicle involvement, and/or involvement of lymph nodes.
The Gleason score was assigned on the basis of the area of the
most aggressive cancer.
Postoperative Follow-up
There were some differences in the PSA measurement protocols at the different institutions, but mostly, the serum PSA
concentration was measured 6 six weeks after surgery and then
every 3 months for 12 months. After the first year, PSA was
measured every 4 to 8 months. Patients with undetectable PSA
(,0.2 ng/mL) were considered to be disease free, and PSA progression was documented if there was a change from an undetectable to a detectable concentration.
Statistical Methods
The data were collected in Excel® (Microsoft Corporation,
Redmond, WA) computer software for PC. A 400 MHz Pentium® II (Intel Corp., Santa Clara, CA) Gateway 2000 PC
(North Sioux City, SD) with 256 MB RAM and a 14 GB hard
drive was used for statistical analysis using a SPSS ® for PC
(Chicago) statistical software. The mean, median, range, standard deviation, frequency, and histogram analyses were performed for serum PSA, biopsy Gleason, clinical stage, pathologic stage, and time to biochemical failure. Analysis of
variance (ANOVA) and logistic regression models were then
applied to these preoperative and histopathologic variables to
test their association with biochemical failure.
TABLE 1. BASELINE VALUES
Age (years)
PSA (ng/mL)
Mos of FU
Mean
SD
SE
68.437
11.582
41.504
8.606
10.883
25.863
0.741
0.532
1.264
Gleason score (%)
2–4
5–7
8–10
0.392 (28)
0.938 (67)
0.70 (5)
T stage (%)
1c
2
3
0.210 (15)
1120 (80)
0.0.70 (5%)
Race (%)
White
African American
Other
1120 (80)
0..48 (12)
.112 (8)
Median
69
8.06
38
166
TEWARI ET AL.
TABLE 2. FREQUENCY DISTRIBUTION
a
OF PATHOLOGIC FINDINGS
No. (%)
Organ confined
Positive surgical margins
Seminal vesicle involvement
a Patients
896 (64)
462 (33)
196 (14)
with positive nodes were not included in this series.
Neural Network Methodology
The following general steps were involved in the neural network/evolutionary computational modeling:
1. Distribution of the entire database into training (N 5 1000)
and validation sets (N 5 400);
2. Preprocessing and normalization of the training set by taking log and square roots;
3. Selection of input variables;
4. Coding of variables as continuous, ordinal, or nominal;
5. Binary coding;
6. Choosing network topology;
7. Choosing a learning algorithm;
8. Weight assignment;
9. Selection of activation function;
10. Choice of transfer function;
11. Calculation of root mean square (RMS) error in training
and testing sets;
12. Avoidance of overtraining by real time monitoring of RMS
error;
13. Studying the interaction between various input variables
amongst themselves and on the outcome;
14. Selecting the network/method with best performance on the
test set;
15. Freezing the model’s weights;
16. Validation in a random sample of patients; and
17. Validation of the model.
These methods have been described.3,38–42,44,49–51
Genetic Programming
The coding of the model was done using Microsoft Visual Studio® software. Our approaches to parametric learning are based
on the family of hybrid evolutionary and gradient training algorithms developed by members of our group. These include evolutionary algorithms applied to multilayer neural networks, radial
basis function networks, neuro-fuzzy networks (resembling fuzzy
logic inference engine), and parametric knn classifiers. The combination of evolutionary and local gradient search that our algorithms utilizes yields benefits in both speed of learning and avoidance of local minima secondary to non-locality of evolutionary
exploration compared with backpropagationmethods. At the same
time, because of our new cooperative evolutionary network representation (CENR), we have overcome some restrictions naturally occurring in brute-force combinations of ANN and GA models. Some of these restrictions arise from the following facts:
1. Conventional evolutionary programming requires large
computational complexity while processing a population of
ANNs, as the number of network parameters reaches N ,
103–105 in real-world applications;
2. The GA recombination operators often have difficulty when
a neural network is directly encoded into binary strings. This
causes premature solution convergence;
3. The GA objective function is strongly dependent on the
problem domain. This dependence precludes a general recipe
for choosing optimal representations and operators used in
neural network training.
In our technique, evolution proceeds in a single network. A special objective function is defined for hidden neurons to allow
the selective update of internal network weights. Further details
are available elsewhere.3,38–42,44,49,50
Training, Testing, and Validation
We used 1000 patients for training and 400 for validation of
the model. This model was tested and revalidated for accuracy
and predictability. Diagnostic performance summary statistics
(sensitivity, specificity, sample-specific positive and negative
predictive values, and overall percent of patients correctly classified) was computed for the binary predictions along with onetailed lower 95% confidence bounds for sensitivity and specificity. The rank correlation was used to estimate the area under
the observed receiver operating characteristic (ROC) curve.
RESULTS
The demographic, laboratory, and biopsy information such
as age, preoperative PSA, Gleason and duration of follow-up
is summarized in Table 1. The mean age was 68.4 years, and
the mean PSA concentration before surgery was11.6 ng/mL.
Two thirds (67%) of the patients had Gleason scores of 5 to 7,
and the mean length of follow-up was 41.5 months. Eighty percent of the cancers were clinical stage T2 and 5% T3.
The pathologic stage of the disease is summarized in Table
2. In our series, 896 (64%) of the patients had organ-confined
cancer, 462 (33%) had positive margins, and 196 (14%) had
seminal vesicle invasion. Few patients had both positive margins and seminal vesicle involvement. Lymph node-positive patients were not included in this series.
Table 3 summarizes the data regarding patients who developed PSA progression. Such progression was noted in 30.6%
of the series.
Table 4 and Figure 1 summarize the accuracy of the ANN
in prediction of PSA recurrence. The preoperative data used as
input variables were age, serum PSA, systematic biopsy-based
stage, perineural infiltration, and Gleason score. Also used was
the duration of follow-up in months as input variable. In the
validation set, the overall accuracy of the model was 76%, and
the area under the curve was 0.831. The sensitivity was 85%,
TABLE 3. FREQUENCY DISTRIBUTION
OF PSA FAILURE
No. (%)
No failure
Failure
972 (69.451)
428 (30.549)
167
GENETIC ADAPTIVE MODELS FOR PSA FAILURE
TABLE 4. ACCURACY OF N EURAL NETWORK MODELING
IN 400 PATIENTS FROM VALIDATION SET
Sensitivity (%)
Specificity (%)
Positive predictive value (%)
Negative predictive value (%)
Accuracy (%)
AUC
85.00
74.00
77
83
76
0.831
the specificity 74%, the positive predictive value 77%, and the
negative predictive value 83%.
DISCUSSION
This study was conducted to identify those patients who are
at high risk for developing PSA recurrence after radical prostatectomy. We took a predictive modeling approach utilizing preoperative parameters integrated through a genetic ANN to
achieve above-mentioned goal. The main findings of our study
are as follows. First, it is possible to integrate several preoperative variables such as age, race, serum PSA, biopsy Gleason
score and systemic biopsy based staging in this type of model.
Second, the model can predict PSA recurrence within 5 years
with greater than 70% accuracy. The implications and shortcomings of our study are discussed below.
It is important to note that these models are not survival
curves as used in traditional statistics. There is no censoring of
patients, and the models cannot plot the survival curves. Instead, they are using clinically available variables and simply
providing probability estimates for recurrence at a specific follow-up time after treatment. They do so by nonlinear modeling
techniques as described in Materials and Methods.
There have been other efforts to predict biochemical recurrence such as PSA velocity, utilization of preoperative parameters and pathologic stage, and use of additional biomarkers
through biostatistical modeling.10,15–22 The most common
method is the survival curve for PSA recurrence using Kaplan
Meier’s product limit method, which generates graphs for a group
of patients. It can also be plotted to show differences in various
groups such as by grade of cancer, race and type of treatment.
Patients’ individual data can then be used to see the probability
of survival at a specific time and median follow-up can be calculated. However, simultaneous use of more than one grouping
variable is difficult to study in this technique. It does not take
into account the interplay between various input variables. One
such example is as follows. A high PSA concentration usually
signifies a biologically aggressive cancer. However with poorly
differentiated tumors, the PSA can be low and not reflect the true
aggressiveness of the disease. Also, patients can have a high PSA
value as a result of a concomitant benign process such as benign
prostatic enlargement and prostatitis. Such relations are difficult
to study in traditional Kaplan Meier survival curves.
In order to overcome these shortcomings, Cox proportional
hazard modeling is used, which allows study of several
parameters simultaneously and can then generate survival
curves.15–17,31,32 Cox proportional hazards regression models
are constructed in a stepwise fashion by considering previously
established pretreatment covariates alone, as well as by adding
the previously discussed new constructs. This technique also
sheds light on the interplay between various input variables.
However, even with Cox proportional hazard modeling, it is
difficult to apply the information to a future patient, who has a
unique combination of age, race, serum PSA, biopsy Gleason
grade, volume of cancer, and clinical stage. In recent years, several efforts have been made to create models and ultimately
provide a unified mathematical formula, which may allow calculation of risk in individual patients. Very rarely are such models validated in a prospective manner.51,52
A similar preoperative nomogram was constructed by Kattan
and associates.21 Using Cox proportional hazards regression
analysis, they modeled the clinical data and disease follow-up for
983 men with clinically localized prostate cancer undergoing radical prostatectomy. Clinical data included pretreatment serum
PSA levels, biopsy Gleason scores, and clinical stage. Treatment
failure was recorded when there was clinical evidence of disease
recurrence, a rising serum PSA (two measurements of 0.4 ng/mL
or greater and rising), or initiation of adjuvant therapy. Validation was performed on a separate sample of 168 men. Treatment
failure (i.e., cancer recurrence) was noted in 196 of the 983 men,
and the patients without failure had a median follow-up of 30
months (range 1–146 months). The 5-year probability of freedom from failure for the cohort was 73% (95% confidence interval 69%, 76%). The predictions from the nomogram had an
area under the ROC curve (AUC) (i.e., comparison of the predicted probability with the actual outcome) of 0.79 in the validation sample. The authors attempted to improve the results by
incorporating postoperative information into their model.22 The
accuracy in a validation sample improved to an AUC of 0.89.
Even though it was more accurate, this model cannot be used in
the decision-making process. Therefore, we feel that our preoperative model, with an AUC of 0.83, will be practically useful in
decision-making. However, it should be noted that it is difficult
to make direct comparisons between the AUCs of 0.79 (Cox proportional hazard model) and 0.831 (GA model), as they have
been generated from different data sets of diverse patient popu-
FIG. 1.
Receiver operator curve for performance of model.
168
TEWARI ET AL.
lations. In fact, the authors believe that there is no best modeling technique. All models have different strengths, and the key
is to find best model for a specific problem. The traditional models may be better suitable for non-noisy simple datasets, while
nonlinear models may be useful for other problems. With this
view in mind, the authors always try simpler models for every
problem and believe that the final goal should be to achieve the
model that generalizes best for a specific problem rather than getting into the controversy of which modeling technique is better.
There have been published comparisons of conventional statistical models and ANN technology. Ragde and associates53 compared ANN models with multivariate regression analysis in 152
consecutive patients with stage T1–T3, low to high Gleason grade,
prostate carcinoma who received brachytherapy at Northwest
Hospital in Seattle, Washington. Of these 152 patients, 98 (64%)
received an iodine125 implant alone (Group 1), and the remaining 54 patients (36%), who were judged to have a higher risk of
extraprostatic extension, also were treated with 45 Gy of external-beam radiation to the pelvis (Group 2). No patient underwent
lymph node sampling, and none received androgen ablation therapy. Clinical recurrence was defined as a positive biopsy, radiographic evidence of metastases, or both. The PSA values
recorded in these patients were those measured at the time the
clinical recurrence designation was made. Biochemical failure was
defined as PSA .0.5 ng/mL, a threshold adopted to facilitate outcome comparisons with patients treated by radical prostatectomy.
A turboprop-variant ANN training method was used. From the
database, 16% of patients were chosen randomly and withheld as
a validation set. The remaining 84% were used to train the ANN.
When training and architecture evolution (determination of the
optimum number of hidden neurons) was complete, the network
was presented with the validation set and asked to predict the success or failure of brachytherapy for each of these individuals. The
network results then were compared with actual outcomes, and a
set of statistics was generated. In addition, a multivariate regression analysis was developed for the training set and applied to the
validation set. Multivariate regression and Mann-Whitney rank
sum tests were used for conventional statistical analyses.
The authors noted that the ANN predicted the outcome more
accurately than did multivariate statistical models. The sensitivity was 55% for ANN and 15% for regression. The specificity
was 90% for the ANN and 94% for regression, the corresponding positive predictive values were 76% and 64% and the negative predictive values were 82% and 64%. The overall accuracy was 76% for the ANN and 66% for regression analysis.
There have been few other comparisons for other medical
applications and these models have provided satisfactory results.31 In cancer patients, a GA model Bayes’ theorem classified the outcome with a high degree of accuracy that was 20%
better than the value obtained with the logistic regression model.
These differences in accuracy could be attributable to differences in data set, length of follow-up, or a nonlinear methodological advantage of ANNs in noisy medical data. An exact
comparison can be made only with an identical dataset subjected to two diverse modeling techniques.
CONCLUSION
Our study suggests that genetic adaptive neural networks can
accurately predict biochemical recurrence in patients who are
contemplating choosing surgical treatment for their prostate
cancer. This ability could prove to be of immense practical
value by allowing individualized follow-up regimens, which
would significantly reduce the cost of follow-up.
REFERENCES
1. Landis SH, Murray T, Bolden S, Wingo PA. Cancer statistics, 1999.
CA Cancer J Clinicians 1999;49:8–31.
2. Walsh PC, Partin AW, Epstein JI. Cancer control and quality of
life following anatomical radical retropubic prostatectomy: Results
at 10 years. J Urol 1994;152:1831–1836.
3. Tewari A, McIntire L, Kruger A, et al. Recent advances in management of prostate cancer 2: Treatment issues. Hosp Physician
1999.
4. Paulson DF. Impact of radical prostatectomy in the management
of clinically localized disease. J Urol 1994;152:1826–1830.
5. Partin AW, Pound CR, Clemens JQ, Epstein JI, Walsh PC. Serum
PSA after anatomic radical prostatectomy: The Johns Hopkins experience after 10 years. Urol Clin North Am 1993;20:713–725.
6. Catalona WJ, Smith DS. Cancer recurrence and survival rates after anatomic radical retropubic prostatectomy for prostate cancer:
Intermediate-term results. J Urol 1998;160:2428–2434.
7. Connolly JA, Shinohara K, Presti JC Jr, Carroll PR. Local recurrence after radical prostatectomy: Characteristics in size, location,
and relationship to prostate-specific antigen and surgical margins.
Urology 1996;47:225–231.
8. Kupelian P, Katcher J, Levin H, Zippe C, Klein E. Correlation of
clinical and pathologic factors with rising prostate-specific antigen
profiles after radical prostatectomy alone for clinically localized
prostate cancer [see comments]. Urology 1996;48:249–260.
9. Oefelein MG, Smith N, Carter M, Dalton D, Schaeffer A. The incidence of prostate cancer progression with undetectable serum
prostate specific antigen in a series of 394 radical prostatectomies.
J Urol 1995;154:2128–2131.
10. Partin AW, Pearson JD, Landis PK, et al. Evaluation of serum
prostate-specific antigen velocity after radical prostatectomy to distinguish local recurrence from distant metastases. Urology 1994;43:
649–659.
11. Pound CR, Partin AW, Epstein JI, Walsh PC. Prostate-specific antigen after anatomic radical retropubic prostatectomy: Patterns of recurrence and cancer control. Urol Clin North Am 1997;24:395–
406.
12. Pound CR, Partin AW, Eisenberger MA, Chan DW, Pearson JD,
Walsh PC. Natural history of progression after PSA elevation following radical prostatectomy [see comments]. JAMA 1999;281:
1591–1597.
13. Trapasso JG, deKernion JB, Smith RB, Dorey F. The incidence
and significance of detectable levels of serum prostate specific antigen after radical prostatectomy [see comments]. J Urol 1994;152:
1821–1825.
14. Patel A, Dorey F, Franklin J, deKernion JB. Recurrence patterns
after radical retropubic prostatectomy: Clinical usefulness of
prostate specific antigen doubling times and log slope prostate specific antigen [see comments]. J Urol 1997;158:1441–1445.
15. Bauer JJ, Connelly RR, Sesterhenn IA, et al. Biostatistical modeling using traditional variables and genetic biomarkers for predicting the risk of prostate carcinoma recurrence after radical prostatectomy. Cancer 1997;79:952–962.
16. Bauer JJ, Connelly RR, Seterhenn IA, Srivastava S, McLeod DG,
Moul JW. Statistical modeling using preoperative prognostic variables in predicting extracapsular extension and progression after
radical prostatectomy for prostate cancer. Mil Med 1998;163:615–
619.
17. Bauer JJ, Connelly RR, Seterhenn IA, et al. Biostatistical modeling using traditional preoperative and pathological prognostic vari-
169
GENETIC ADAPTIVE MODELS FOR PSA FAILURE
18.
19.
20.
21.
22.
23.
24.
25.
26.
27.
28.
29.
30.
31.
32.
33.
34.
35.
36.
37.
ables in the selection of men at high risk for disease recurrence after radical prostatectomy for prostate cancer [see comments]. J Urol
1998;159:929–933.
Cohen RJ, Chan WC, Edgar SG, et al. Prediction of pathological
stage and clinical outcome in prostate cancer: An improved preoperative model incorporating biopsy-determined intraductal carcinoma. Br J Urol 1998;81:413–418.
D’Amico AV, Whittington R, Malkowicz SB, et al. Pretreatment
nomogram for prostate-specific antigen recurrence after radical
prostatectomy or external-beam radiation therapy for clinically localized prostate cancer [in process citation]. J Clin Oncol 1999;17:
168–172.
Dillioglugil O, Leibman BD, Kattan MW, Seale-Hawkins C,
Wheeler TM, Scardino PT. Hazard rates for progression after radical prostatectomy for clinically localized prostate cancer. Urology
1997;50:93–99.
Kattan MW, Eastham JA, Stapleton AM, Wheeler TM, Scardino
PT. A preoperative nomogram for disease recurrence following radical prostatectomy for prostate cancer. J Natl Cancer Inst 1998;90:
766–771.
Kattan MW, Wheeler TM, Scardino PT. Postoperative nomogram
for disease recurrence after radical prostatectomy for prostate cancer. J Clin Oncol 1999;17:1499–1507.
Bellotti M, Elsner B, Paez De Lima A, Esteva H, Marchevsky AM.
Neural networks as a prognostic tool for patients with non-small
cell carcinoma of the lung. Mod Pathol 1997;10:1221–1227.
Bryce TJ, Dewhirst MW, Floyd CE Jr, Hars V, Brizel DM. Artificial neural network model of survival in patients treated with irradiation with and without concurrent chemotherapy for advanced
carcinoma of the head and neck. Int J Radiat Oncol Biol Phys
1998;41:339–345.
Burke HB. Artificial neural networks for cancer research: Outcome
prediction. Semin Surg Oncol 1994;10:73–79.
Burke HB, Goodman PH, Rosen DB, et al. Artificial neural networks improve the accuracy of cancer survival prediction. Cancer
1997;79:857–862.
De Laurentiis M, Ravdin PM. Survival analysis of censored data:
Neural network analysis detection of complex interactions between
variables. Breast Cancer Res Treat 1994;32:113–118.
De Laurentiis M, Ravdin PM. A technique for using neural network analysis to perform survival analysis of censored data. Cancer Lett 1994;77:127–138.
Faraggi D, Simon R. A neural network model for survival data.
Stat Med 1995;14:73–82.
Gustafson P. Flexible Bayesian modelling for survival data. Lifetime Data Anal 1998;4:281–299.
Jefferson MF, Pendleton N, Lucas SB, Horan MA. Comparison of
a genetic algorithm neural network with logistic regression for predicting outcome after surgery for patients with nonsmall cell lung
carcinoma. Cancer 1997;79:1338–1342.
Kattan MW, Hess KR, Beck JR. Experiments to determine whether
recursive partitioning (CART) or an artificial neural network overcomes theoretical limitations of Cox proportional hazards regression. Comput Biomed Res 1998;31:363–373.
Liestol K, Andersen PK, Andersen U. Survival analysis and neural
nets. Stat Med 1994;13:1189–1200.
Lundin J. Artificial neural networks in outcome prediction. Ann
Chir Gynaecol 1998;87:128–130.
Ohno Machado L. A comparison of Cox proportional hazards and
artificial neural network models for medical prognosis. Comput
Biol Med 1997;27:55–65.
Ravdin PM, Clark GM, Hilsenbeck SG, et al. A demonstration that
breast cancer recurrence can be predicted by neural network analysis. Breast Cancer Res Treat 1992;21:47–53.
Snow PB, Smith DS, Catalona WJ. Artificial neural networks in
38.
39.
40.
41.
42.
43.
44.
45.
46.
47.
48.
49.
50.
51.
52.
53.
the diagnosis and prognosis of prostate cancer: A pilot study [see
comments]. J Urol 1994;152:1923–1926.
Tewari A. Artificial intelligence and neural networks: Concept, applications and future in urology. Br J Urol 1997;80(suppl 3):53–58.
Tewari A, Mager J, Kamerer A, Shukla A, Narayan P. Genetic
adaptive probabilistic neural network models in prediction of
pathological stage in management of localized prostate cancer: A
pilot study [abstract]. J Urol 1997;157:A293.
Tewari A, Calvanese C, Carlson G, et al. An artificial intelligence
based genetic adaptive neural network model in management of
prostate cancer. Presented at the American Association for Cancer
Research. Palm Springs, December 1998.
Tewari A, Narayan P. Novel staging tool for localized prostate cancer: A pilot study using genetic adaptive neural networks. J Urol
1998;160:430–436.
Tewari A, G C, C C, et al. Genetic adaptive neural network models to predict outcome of needle biopsy in 3773 patients with elevated PSA [abstract]. J Urol 1999;161:1256A.
Tewari A, Sonke G, Verbeek A, et al. Genetic adaptive neural network models to predict urodynamic obstruction in 1900 men with
BPH: A multi institutional study. Presented at the Society of Female Urology and Urodynamics. Dallas, May 1999.
Wei J, Tewari A. Artificial neural networks: The new paradigm for
modeling in urology [editorial]. Urology 1999.
Harrell FE Jr, Lee KL, Matchar DB, Reichert TA. Regression models for prognostic prediction: advantages, problems, and suggested
solutions. Cancer Treat Rep 1985;69:1071–1077.
Harrell FE Jr, Lee KL, Pollock BG. Regression models in clinical
studies: determining relationships between predictors and response.
J Natl Cancer Inst 1988;80:1198–1202.
Harrell FE Jr, Lee KL, Mark DB. Multivariable prognostic models:
Issues in developing models, evaluating assumptions and adequacy,
and measuring and reducing errors. Stat Med 1996;15:361–387.
Narayan P, Tewari A. Systematic biopsy-based staging of prostate
cancer: Scientific background, individual variables, combination of
parameters, and current integrative models. Semin Urol Oncol
1998;16:172–181.
Tewari A, Ghosh M. Comparative study of Baysiean and traditional
modeling in the management of prostate cancer. (unpublished).
Tewari A, Kruger A, McIntire L, et al. Recent advances in management of prostate cancer 1: Screening and staging. Hosp Physician 1999.
Vollmer RT, Keetch DW, Humphrey PA. Predicting the pathology
results of radical prostatectomy from preoperative information: A
validation study. Cancer 1998;83:1567–1580.
Kattan MW, Stapleton AM, Wheeler TM, Scardino PT. Evaluation
of a nomogram used to predict the pathologic stage of clinically
localized prostate carcinoma. Cancer 1997;79:528–537.
Ragde H, Elgamal AA, Snow PB, et al. Ten-year disease free survival after transperineal sonography-guided iodine-125 brachytherapy with or without 45–gray external beam irradiation in the treatment of patients with clinically localized, low to high Gleason grade
prostate carcinoma. Cancer 1998;83:989–1001.
Address reprint requests to:
Ashutosh Tewari, MD
Department of Urology and Josephine Ford Cancer Center
Henry Ford Health System
5 C, 1 Ford Place
Detroit, MI 48202
E-mail: [email protected]
This article has been cited by:
1. Shahrokh F. Shariat, Pierre I. Karakiewicz, Claus G. Roehrborn, Michael W. Kattan. 2009. An updated
catalog of prostate cancer predictive tools. Cancer 113:11, 3075-3099. [CrossRef]
2. Shahrokh F Shariat, Pierre I Karakiewicz, Vitaly Margulis, Michael W Kattan. 2008. Inventory of prostate
cancer predictive tools. Current Opinion in Urology 18:3, 279-296. [CrossRef]
3. Vincent L. Freeman, Robert C. Flanigan, Mohsen Meydani. 2007. Prostatic fatty acids and cancer
recurrence after radical prostatectomy for early-stage prostate cancer. Cancer Causes & Control 18:2,
211-218. [CrossRef]
4. D PENSON. 2005. LAPAROSCOPIC UROLOGICAL ONCOLOGY: HERE COME THE
OUTCOMES!. Journal of Urology, The 174:4, 1174-1174. [CrossRef]
5. M MENG, E ELKIN, D LATINI, J DUCHANE, P CARROLL. 2005. TREATMENT OF PATIENTS
WITH HIGH RISK LOCALIZED PROSTATE CANCER: RESULTS FROM CANCER OF THE
PROSTATE STRATEGIC UROLOGICAL RESEARCH ENDEAVOR (CaPSURE). The Journal of
Urology 173:5, 1557-1561. [CrossRef]
6. Eduard J. Gamito, E. David Crawford. 2004. Artificial neural networks for predictive modeling in prostate
cancer. Current Oncology Reports 6:3, 216-221. [CrossRef]


© Copyright 2026