
PLAN BUDGET PROPOSALS Social Sciences Division Indian Statistical Institute
PLAN BUDGET PROPOSALS FOR THE YEAR 2014-2015 Revised on 31st July 2013 Social Sciences Division Indian Statistical Institute 203, Barrackpore Trunk Road Kolkata 700 108 2 Social Sciences Division, ISI Prepared By: S. Malakar, Social Sciences Division’s Office Plan Budget Proposals 2014-15, SSD 3 SUMMARY CONTENTS Plan New Projects Srl Unit Project Leader(s) Project No. and Name of the Project Page New, Noth East Project 1 2 LRU SOSU 2.1 6.1 3 SOSU 6.2 4 PSU 3.1 5 PRU 4.1 6 7 PRU SOSU 4.2 6.3 … … Probal Dasgupta Diganta Mukherjee … … 11 13 … Prasanta Pathak and others … 16 Developmental Challenges in Children and Associated Socioeconomic Factors: A Study in the Purulia District of West Bengal. (2014-16) National Conference on “Adolescence Development: Issues and Challenges”. (2014-15) … Partha De … 18 … … 25 Summer / Winter School on Data Mining in Psychological Research (2014-15) Finding out the Direct and the Indirect Roles of Various Socio-economic and Demographic Factors, Health and Family Welfare and Other Developmental Programmes in the Growth of Population: A Case Study on Giridih (2014-15) … … Anjali Ghosh and others Debdulal Dutta Roy Prasanta Pathak … … 28 31 The Biaxial Syntax of Inflected Clauses in Assamese and Bangla (2014-17) Life-style correlates & economic burden of Cancer: A study in Meghalaya in North East (Northeast, New) (2014-17) Workshop on Official Statistics in the North-East India (Northeast, New) (2014-19) New, General Project Plan 0n-Going Projects Srl Unit Project No. and Name of the Project 1 PRU 4.3 Project Leader(s) Page On-Going, Noth East Project Cognitive Processing Through PASS Model and its Role in Determining Academic Performance of School Students of North- Eastern India. (2012-15) … Anjali Ghosh … 40 On-Going, General Project 2 LRU 2.2 Biaxial Study of Bangla Lexicosyntax (2013-16) … Probal Dasgupta … 36 3 LRU 2.3 Bengali Pronunciation Dictionary in Electronic and Printed Form (2012-15) … Niladri Sekhar Dash … 38 4 5 6 PRU PRU SRU 4.4 4.5 5.1 Differential validity of Computer programming abilities (2012-15) Parenting styles and academic achievement of the school students.(2013-15) Data Gap in Gender Statistics: Women in Mining Industry (2012-15) … … … Debdulal Dutta Roy Rumki Gupta Molly Chattopadhyay … … … 43 46 50 7 SRU 5.2 … Rabindranath Jana … 52 8 SRU 5.3 … Susmita Bharati … 57 9 SRU 5.4 Migration, social network and their impact on the rural households of Jharkhand. (2013-15) A micro level study of television (TV) watching and childhood obesity in Kolkata city of West Bengal, India. (2013-15) Gender Issues and Empowerment of Women in rural West Bengal (2013-15) … Bhola Nath Ghosh … 60 10 EAU 8.1 Evaluating Official Statistics on Land and Livestock holdings (2012-15) … V.K. Ramachandran … 66 New Plan Projects start from page no. On-Going Plan Projects start from page no. Plan Non-Projects (2014-15) start from page no. Publication (2008-13) starts from page no. Interim Reports (2012-13) start from page no. Divisional Plan Budget Proposal for Projects (2014-15) [summary Sheet] Divisional Plan Budget Proposal for Non-Projects (2014-15) [summary Sheet] Prepared By: S. Malakar, Social Sciences Division’s Office 9 35 69 83 109 149 150 4 Social Sciences Division, ISI Prepared By: S. Malakar, Social Sciences Division’s Office Plan Budget Proposals 2014-15, SSD 5 Contents (By unit) Name of the Project Members of the Technical Advisory Committee, Social Sciences Division for the year 2012-2014 1 Page … … 7 … … … … 70 84 11 36 38 71 92 110 111 Economic Research Unit Non-project plan proposals for the year 2014-15 List of Publications of DCSW Members: 2008 – 2013, ERU 2 Linguistic Research Unit 2.1 2.2 2.3 The Biaxial Syntax of Inflected Clauses in Assamese and Bangla (Northeast, New) Biaxial Study of Bangla Lexicosyntax (General, On-Going) Bengali Pronunciation Dictionary in Electronic and Printed Form (General, On-Going) Non-project plan proposals for the year 2014-15 List of Publications of DCSW Members: 2008 – 2013, LRU Interim Report LRU (2012-13) Interim Report LRU (2012-13) 3 Population Studies Unit 3.1 Developmental Challenges in Children and Associated Socioeconomic Factors: A Study in the Purulia District of West Bengal. (General, New) Non-project plan proposals for the year 2014-15 List of Publications of DCSW Members: 2008 – 2013, PSU 4 Psychology Research Unit 4.1 4.2 4.3 National Conference on “Adolescence Development: Issues and Challenges”. (General, New) Summer / Winter School on Data Mining in Psychological Research (General, New) Cognitive Processing Through PASS Model and its Rrole in Determining Academic Performance of School Students of North- Eastern India. (Northeast, On-Going) Differential validity of Computer programming abilities. (General, On-Going) Parenting styles and academic achievement of the school students. (General, On-Going) 4.4 4.5 Project Leader(s) Non-project plan proposals for the year 2014-15 List of Publications of DCSW Members: 2008 – 2013, PRU Interim Report PRU (2012-13) Interim Report PRU (2012-13) … … … … … … … Probal Dasgupta Probal Dasgupta Niladri Sekhar Dash Probal Dasgupta Niladri Sekhar Dash … … … … … … … … Partha De … 18 … … 73 94 … … … … … Anjali Ghosh and others Debdulal Dutta Roy Anjali Ghosh … … … 25 28 40 … … … … … … Debdulal.Dutta Roy Rumki Gupta Anjali Ghosh Debdulal Dutta Roy … … … … … … 43 46 74 95 113 117 5 Sociological Research Unit 5.1 5.2 5.3 Data Gap in Gender Statistics: Women in Mining Industry. (General, On-going) Migration, social network and their impact on the rural households of Jharkhand. (General, On-going) A micro level study of television (TV) watching and childhood obesity in Kolkata city of West Bengal, India. (General, On-going) Gender Issues and Empowerment of Women in rural West Bengal. (General, On-going) … … … Molly Chattopadhyay Rabindranath Jana Susmita Bharati … … … 50 52 57 … Bhola Nath Ghosh … 60 Non-project plan proposals for the year 2014-15 … … … Molly Chattopadhyay … … … 76 97 142 5.4 List of Publications of DCSW Members: 2008 – 2013, SRU Interim Report SRU (2012-13) Prepared By: S. Malakar, Social Sciences Division’s Office 6 Social Sciences Division, ISI 6 Sampliing & Official Statistics Unit 6.1 Life-style correlates & economic burden of Cancer: A study in Meghalaya in North East (Northeast, New) (2014-17) Workshop on Official Statistics in the North-East India (Northeast, New) (2014-19) Finding out the Direct and the Indirect Roles of Various Socio-economic and Demographic Factors, Health and Family Welfare and Other Developmental Programmes in the Growth of Population : A Case Study on Giridih (General, New) … Prasanta Pathak … 13 … … Diganta Mukherjee Prasanta Pathak … … 16 31 Non-project plan proposals for the year 2014-15 … … … Tridip Ray … … … 77 100 146 … … 78 104 … … … … 66 80 108 148 … … … 81 149 150 6.2 6.3 List of Publications of DCSW Members: 2008 – 2013, SOSU Interim Report PU (2012-13) 7 Economics & Planning Unit, Delhi Centre 7.1 Non-project plan proposals for the year 2014-15 List of Publications of DCSW Members: 2008 – 2013, EPU, Delhi Centre 8 Economic Analysis Unit, Bangalore Centre 8.1 Evaluating Official Statistics on Land and Livestock holdings (General, On-going) Non-project plan proposals for the year 2014-15 List of Publications of DCSW Members: 2008 – 2013, EAU, Bangalore Centre Interim Report EAU (2012-13) 9 … … … … … … V.K. Ramachandran V.K. Ramachandran Social Sciences Division Office Non-project plan proposals for the year 2014-15 Divisional Plan Budget Proposal for Projects (2014-15) Divisional Plan Budget for Non-Projects (2014-15) Prepared By: S. Malakar, Social Sciences Division’s Office … … … Plan Budget Proposals 2014-15, SSD Members of the Technical Advisory Committee Social Sciences Division for the year 2012-2014 1. Professor Bimal Kr. Roy Director (Chairman) Indian Statistical Institute, Kolkata 700 108 2. Professor Mihir Rakshit Director, Monetary Research Policy, ICRA Limited. FMC FORTUNA, A-B, 3rd floor 234/3A A.J.C. Bose Road, Kolkata 700 020 3. Professor Amrit Srinivasan Indian Institute of Technology Delhi Hauz Khas, New Delhi-110016 4. Professor Amitabh Kumdu Centre for the Study of Regional Development School of Social Sciences, Jawaharlal Nehru University, India 5. Professor Sarmila Banerjee Calcutta University. Rajiv Gandhi Chair Professor, Eco-systems and Sustainable Development, 56A, B.T. Road, Kolkata 700 050 6. Professor T.J. Kamalanabhan Dept. of Humanities and Social Sciences, Indian Institute of Technology, Madras, Chennai 600 036. 7. Professor Tista Bagchi Department of Linguistics, University of Delhi Arts Faculty Extension Building, Delhi 110 007 8. Professor Prabal Roy Chowdhury Professor-in-Charge (Convener), Social Sciences Division, Indian Statistical Institute, Kolkata 700 108 Prepared By: S. Malakar, Social Sciences Division’s Office 7 8 Social Sciences Division, ISI Prepared By: S. Malakar, Social Sciences Division’s Office Plan Budget Proposals 2014-15, SSD 9 New Projects NEW Sr l Unit Project Leader(s) Project No. and Name of the Project Page New, Noth East Project 1 LRU 2.1 The Biaxial Syntax of Inflected Clauses in Assamese and Bangla (201417) … Probal Dasgupta … 11 2 SOSU 6.1 … Diganta Mukherjee … 13 3 SOSU 6.2 Life-style correlates & economic burden of Cancer: A study in Meghalaya in North East (Northeast, New) (2014-17) Workshop on Official Statistics in the North-East India (Northeast, New) (2014-19) … Prasanta Pathak and others … 16 4 PSU 3.1 … Partha De … 18 5 PRU … … 25 6 PRU … Anjali Ghosh and others Debdulal Dutta Roy … 28 7 SOSU … Prasanta Pathak … 31 New, General Project Developmental Challenges in Children and Associated Socioeconomic Factors: A Study in the Purulia District of West Bengal. (2014-16) 4.1 National Conference on “Adolescence Development: Issues and Challenges”. (2014-15) 4.2 Summer / Winter School on Data Mining in Psychological Research (2014-15) 6.1 Finding out the Direct and the Indirect Roles of Various Socio-economic and Demographic Factors, Health and Family Welfare and Other Developmental Programmes iin the Growth of Population: A Case Study on Giridih (2014-15) Prepared By: S. Malakar, Social Sciences Division’s Office 10 Social Sciences Division, ISI Prepared By: S. Malakar, Social Sciences Division’s Office Plan Budget Proposals 2014-15, SSD 11 LRU (Northeast, New) Project No. 2.1 1. Title of the project: The Biaxial Syntax of Inflected Clauses in Assamese and Bangla 2. Brief objective and justification (2 or 3 sentences): Biaxial syntax, the syntactic wing of substantivist generative grammar, focuses on incidence differentials and other effects that involve both the syntagmatic axis and the paradigmatic axis. The project proposed here will study the greater incidence of gerundial complement clauses in Assamese relative to Bangla, whose complement clause default is finite, on the basis of corpus data. 3. Date of Commencement: April 2014 4. Name of the Proposing Scientist/Principal Investigator: Probal Dasgupta, LRU, ISI 5. Name of other associated Scientists with their affiliation: Jyoti P. Tamuli, Gauhati Univ, Guwahati, Assam 6. A brief write up on the scope and justification of the project and the proposed work (not more than half a page): Nominally inflected clauses in Bangla have been under intensive investigation since the seventies and are relatively well understood (Dasgupta 1979, 1980, Bhattacharya 2000). Their Assamese counterparts were found by Ghosh (2001 personal communication) to occur over a wider paradigmatic range than in Bangla. In certain contexts where finite complement clauses are mandatory in Bangla and many other well studied languages, Assamese uses nominally inflected clauses instead. The agenda of biaxial syntax (Dasgupta 2011) – unlike the formalistic paradigm – focuses on such incidence differentials to highlight effects that involve both syntagmatic phenomena and the paradigmatic axis. Thus, we propose to describe initially in synchronic terms the incidence contrast between Assamese and Bangla with regard to nominally inflected clauses, sometimes called gerundial constructions. We shall begin by considering data available in CIIL’s Assamese and Bangla corpora and expand our empirical coverage by gather fresh texts. We propose to focus on written texts and on speaker intuitions, which have been argued (Dasgupta 2011) to be consubstantial with the written mode. 7. Item wise break up of the budget proposed (Capital & Revenue) and justification for the same (not more than 1/4 page): Items Heads Capital Revenue Salary of 1 Project Linked Person (20,000 X 36 months = 7,20,000) Stores and stationeries Computer consumables Maintenance Total: 2014-2015 NIL 2015-2016 NIL 2016-2017 NIL Total NIL 2,40,000 2,40,000 2,40,000 7,20,000 15,000 10,000 10,000 2,75,000 15,000 10,000 10,000 2,75,000 15,000 10,000 10,000 2,75,000 45,000 30,000 30,000 8,25,000 8. Brief particulars of Assets, proposed to be acquired from Capital Budget, should be mentioned. In case of replacement, particulars of the asset to be condemned (e.g., Year of Purchase, Cost): Nil. 9. List of all ongoing projects undertaken by the Proposing Scientist in the last 5 years and for each, give (i) Status (ii) Money budgeted, (iii) Money spent, (iv) Publications (if any): No. of on-going projects : 1 (One) Title : Interlexical study of Asamiya in a substantivist framework Status : To be Completed in March 2014 Money Budgeted in 2012-13 : Rs. 1,80,000/10. Expected date of Completion: March 2017 Prepared By: S. Malakar, Social Sciences Division’s Office Social Sciences Division, ISI 12 11. Quarterly projection of Expenditure during 2014-2015 25% 25% 25% 25% Total Cap. Rev. Total Total Cap. Rev. Total 4th Cap. Rev. Total 3rd Cap. Rev. Total 2nd Cap. Rev. 1st 100% References Bhattacharya, Tanmoy. 2000. Gerundial aspect and NP movement. Rajendra Singh (ed.) The Yearbook of South Asian Languages and Linguistics 2000. 123-146. Dasgupta, Probal. 1979. The Bangla –Wa/ –no form as participle and gerund. Indian Linguistics 40:3.185-197. Dasgupta, Probal. 1980. Questions and relative and complement clauses in a Bangla grammar. New York University doctoral dissertation. Ann Arbor: University Microfilms. Dasgupta, Probal. 2011. Inhabiting human languages: the substantivist visualization. New Delhi: Samskriti, for the Indian Council of Philosophical Research. Prepared By: S. Malakar, Social Sciences Division’s Office Plan Budget Proposals 2014-15, SSD 13 Remark for SOSU (North-East, New) Projects, 6.1 and 6.2: The following two projects, 6.1 and 6.2, were initially supposed to start in 2013. However, because of unavoidable budgetary considerations, SOSU requested that these two projects be postponed to the next year. It was therefore decided that in case budgetary considerations permit, these two projects may be started later in 2013. Otherwise, they will be postponed to the next year. The current budgetary allocations assume that these two projects will, in fact, be postponed to next year. As of now, the project proposals have however been kept in their original format. In case the proposals are postponed, the budgets will need obvious alterations. SOSU (North-East, New) Project No. 6.1 1. Title of the Project: Life-style correlates & economic burden of Cancer: A study in Meghalaya in North East 2. Brief objective and justification: In this study, we focus on two issues with important policy implications. First we seek to investigate the correlation of food and life style habits with incidence of cancer. This seeks to fill the void in this area as there are very few combined epidemiological studies that look at the traditional food and lifestyles habits and relate it to the etiology of cancer. Second, we investigate the total economic effect of cancer on patients and their families. Our study has implications for issues that relate to prevention as well as successful treatment. Our population of study is patients and their families in the state of Meghalaya. Very little is known about cancer and its economic burden for these states. The choice of this population is also dictated by the differences in food and life style habits of the tribal and non-tribals residing in these states. The strand of our investigation that focuses on economic effects of cancer also redresses the lack of studies relating to coping strategies in the face of health shocks for people living in the North East. 3. Date of Commencement: April 1, 2013 4. Name of the proposing scientist: Diganta Mukherjee, SOSU 5. Name of other associated scientists with their affiliation: a. Abhiroop Mukhopadhyay, EPU b. Saurabh Ghosh, HGU c. Srimoyee Ghosh, Associate Professor, Dept. of Zoology, North Eastern Hill University, Shillong, Meghalaya d. Dr. Judita Syiemlieh, Radiation Oncologist, Civil Hospital, Shillong-793001 e. Dr. R. Nongbet, E.N.T. Specialist, Civil Hospital, Shillong-793001 6. A brief write up on the scope & justification of the project and proposed work (not more than half a page): The global cancer burden has shown a distinct shift in last two decades, with low and mediumresource countries registering more than half of incident cases. In the 1960s cancer was widely considered to be a disease of the developed countries, whereas in year 2000 out of estimated more than 10 million new cancer cases, 6 million were seen in developing countries (Doll et al., 1966; Ferlay et al., 2004; Lopez et al., 2006). Currently, approximately 1 million new cancer cases per year are diagnosed in India, accounting for 10% of global cancer burden. Cancer could become a major impediment to socioeconomic development in low income and economically emerging nations like India. In view of such shifting scenario, International Agency for Research on Cancer has admitted India as a participating state in May 2006, to give it a voice in determining the priorities and research strategies (Boyle, 2006) In this study, we focus on two issues with important policy implications. First we seek to investigate the correlation of food and life style habits with incidence of cancer. This seeks to fill the void in this area as there are very few combined epidemiological studies that look at the traditional food and lifestyles habits and relate it to the etiology of cancer. We will study this using the longitudinal data created from the proposed survey. Second, we investigate the total economic effect of cancer on patients and their families. Our study has implications for issues that relate to prevention as well as successful treatment. Our population of study is patients and their families in the state of Meghalaya. Very little is known about cancer and its economic burden for these states. The choice of this population is also dictated by the differences in food Prepared By: S. Malakar, Social Sciences Division’s Office Social Sciences Division, ISI 14 and life style habits of the tribal and non-tribals residing in these states. The strand of our investigation that focuses on economic effects of cancer also redresses the lack of studies relating to coping strategies in the face of health shocks for people living in the North East. Site of Study: Two major types of Cancer (Oral and Esophageal) patients who come to the OPD of the major Govt. Hospitals in Meghalaya within a four month period will be covered and followed up subsequently (the treatment group). In Meghalaya, these two types of cancer are the predominant ones, according to the Cancer Atlas of India. The control group will be chosen to match the relevant socio economic characteristics of the patients. Target sample size for both the Treatment and Control group is 200 – 250 individuals. 7. Itemwise breakup of the budget proposed (Capital & Revenue) and justification for the same (not more than ¼ page): For 2013 – 2014 (a) Revenue Expenditure: Project-linked personnel (2 X 6 X 16000) Books, Computer consumable, reprography Local Travel and Subsistence (TA+DA) for PLPs Travel and Subsistence for PIs (4 trips) Contingency Overhead Total Rs.1,92,000.00 Rs.10,000.00 Rs. 10,000.00 Rs. 50,000.00 Rs.20,000.00 Rs. 18,000.00 Rs.300,000.00 (b) Capital Expenditure: Laptop computer, software and accessories Overhead Rs.80,000.00 Rs. 10,000.00 Total Rs. 90,000.00 For 2014- 2015 (a) Capital: Nil (b) Revenue: Project linked personnel (2): (@ 16,000.00 pm) 3.84 lakhs 1. Local Travel and Subsistence (TA+DA) for PLPs 0.50 lakhs 2. Travel and Subsistence for PIs (6 trips) 0.75 lakhs 3. Contingency & other expenses 0.20 lakhs Total (B): 5.29 lakhs (c) Overheads (approx @10%): 0.51 lakhs Grand Total (A+B+C): Rs. 5.80 lakhs For 2015- 2016 A. Capital: Nil B. Revenue: 1. Project linked personnel (1): (@ 16,000.00 pm) 1.92 lakhs 2. Travel and Subsistence for PIs (3 trips) 0.37 lakhs 3. Contingency & other expenses 0.10 lakhs 4. Dissemination Workshop 1.00 lakhs Total (B): 3.39 lakhs C. Overheads (approx @10%): 0.31 lakhs Grand Total (A+B+C): Rs. 3.70 lakhs 8. Brief particulars of assets proposed to be acquired. In case of replacement, particulars of the assets to be condemned: Please see the section 7 of the project proposals. No item will be condemned. 9. List all ongoing projects undertaken by the Proposing Scientist: 10. Expected date of Completion: March 31, 2016 Prepared By: S. Malakar, Social Sciences Division’s Office Plan Budget Proposals 2014-15, SSD 15 11. Quarterly projection of Expenditure during 2013-14 1st 2nd Rev 10,000 4th Rev 1,40,000 12. 13. 14. 15. Cap Nil Cap Nil Total 10,000 Total 1,40,000 Rev 10,000 3rd Cap Nil Total Rev 3,00,000 Total 10,000 Cap 90,000 Rev Cap 1,40,000 90,000 Total 230, 000 Total 3,90,000 For general projects only (ongoing): N/A For general projects only (New): N/A For North-East Projects only (Ongoing): N/A For North-East Projects (New): Action Plan/target in terms of percentage (%) 2013-14 2014-15 2015-16 20% 40% 40% Prepared By: S. Malakar, Social Sciences Division’s Office Financial target in terms of percentage (%) 2013-14 2014-15 2015-16 20% 50% 30% 16 Social Sciences Division, ISI SOSU (North-East, New) Project No. 6.2 1. Title of the Project: Workshop on Official Statistics in the North-East India 2. Brief Objective and Justification: (2-3 sentences): The objective of the project is to provide a meaningful platform for interaction between the generators and the users of official statistics, including the researchers, so that official statistics get analysed much more extensively and the gaps or the deficiencies in official statistics get reduced through improvement in the system of collection of official statistics. The extent to which official statistics is used for analysis and decision making is much less than the effort put in collection of it. Wide varieties of official statistics remain unused to a great extent due to various gaps and/or deficiencies in it. Many even have quite less knowledge about the varieties of heads under which official statistics are available. The workshops, planned in the North-East, will attempt at bringing into light the reasons behind inadequate use of official statistics, bridging the gap between the generators and the users and finding out means of improving use of official statistics in in-depth analysis and decision making. The generators will also benefit from the workshops as the users’ feedback will help in improving the system of generation of official statistics. It is planned to have an annual workshop in almost every state in the North-East India. The specific themes of the workshop would depend on the demand of each state and the host organisation. 3. Date of commencement: After April ,2013 4. Name of the proposing Scientist or principal investigator: Prasanta Pathak 5. Name(s) of other associated scientist(s): Sandip Mitra,ISI and D.C Nath,Gauhati University 6. Scope and justification of the project and the proposed work: The research on official statistics has not been adequately undertaken in the North-East States of India. There is an increasing need to provide a platform for a meaningful dialogue between the researchers and the data collecting agencies (like CSO, NSSO, Statistical Bureaus of the respective state Governments). The demand for such workshops has been regularly received by us from different departments of North-Eastern universities. An Official Statistics net work for the N.E states may be a good idea under the aegis of Sampling and Official Statistics Unit of ISI. Annual workshops are proposed for the next five years, which are to be conducted in almost every state in the North East in collaboration with a local university/organisation and data collecting central and/or state agencies. It is expected that such workshops would inspire researchers to do more extensive empirical and policy oriented studies in the areas of Economics, Statistics and related disciplines. Users’ feedback will also help data collecting agencies/organisations to play more meaningful role in improving the system of official statistics so as to match the users’ needs and expectations. The first workshop will be in Guwahati in collaboration with the Department of Statistics in Gauhati University. The proposing scientists have adequate experience in holding such workshops in the North-East and elsewhere. 7. Item wise breakup of the proposed budget (Capital and Revenue): No capital item is proposed. Revenue budget proposed for the year 2013-14 is the following: No. of Participants =30 (Local=15 + Outside Guwahati =15) Air tickets for 4 resource persons (@ Rs.10, 000/-) = Rs. 40, 000.00 Board & Lodging for Resource Persons = Rs. 50,000.00 Honorarium for 5 external resource persons = Rs. 10,000.00 TA for 15 outside participants (Bus /Rail ACIII) = Rs. 25,000.00 Board & Lodging for Participants = Rs.1,20,000.00 Food (BF+Lunch+Tea) =Rs. 90,000.00 Workshop Special Dinner (One) =Rs. 50,000.00 Registration Kit = Rs. 20.000.00 Local Transport (Car renting etc) = Rs. 25,000.00 Supporting Staff Remuneration =Rs. 10,000.00 Xerox + Stationery +Banner & Misc. = Rs. 30,000.00 Generator +Hall Charges = Rs. 10,000.00 Miscellaneous = Rs. 20,000.00 ---------------------------------------------------------------------------------------------------------Total = Rs.5,00,000.00 Prepared By: S. Malakar, Social Sciences Division’s Office Plan Budget Proposals 2014-15, SSD 8. 9. 10. 11. 17 Brief particulars of Assets, proposed to be acquired: Not applicable List of all on-going projects undertaken by the proposing scientist in last 5 years: Not applicable. Expected date of completion : March, 2018 Quarterly projection of expenditure during 2013-2014 : 1st Quarter Rev. Cap. 2nd Quarter Rev. Cap. 3rd Quarter 4th Quarter Total Total Rev. Cap. Total Rev. Cap. 0.50 0.50 4.50 lakh lakh lakh All the workshops are likely to take place in the last quarter. 10% expenditure in 3rd quarter 90% expenditure in 4th quarter 12. For North-East projects only (New) : Total expected budget Proposed budget for Action Plan/Target in (till end of this 5-year 2014-15* terms of percentage(%)* project)* (B) (A) Rev. Cap. Total Rev. Cap. Total 2014- 2015- 201615 16 17 37.21 37.21 6.00 6.00 16.12 19.35 23.22 *Based on the assumption that prices will escalate 20% every year. 16. Rank : Prepared By: S. Malakar, Social Sciences Division’s Office Total 4.50 lakh Total Rev. Cap. 5.00 lakh Total 5.00 lakh Financial target in terms of percentage (%)* 201415 6.00 201516 7.20 201617 8.64 Social Sciences Division, ISI 18 PSU (General, New) Project No. 3.1 1. Title of the Project: Developmental Challenges in Children and Associated Socioeconomic Factors: A Study in the Purulia District of West Bengal. 2. Brief objective and justification: The prime objectives of the study are: to prepare a data base of the children aged (0 – 6) years having any kind of developmental challenge in a backward district like Purulia of West Bengal, (ii) to investigate about the maternal, demographic and socioeconomic determinants of developmental challenges among the above said children in the district, (iii) First, to study the impact of developmental delay in children, the general child (i) population 0-6 years will be screened by the specialist using scientific methodology, thereby identifying children with developmental delay. Thus there will be two distinct groups, one with developmental delay, the other who are developmentally normal. A comparative study will be done between the two groups. Second, within the identified developmentally delayed children, two groups will be further formed. One group will include those children who are under early intervention and treatment. Another group consists of the children who are not under intervention and not received any treatment. Now a study may be done to see the impact of Early Intervention Program by comparing the level of progress in the study/treatment group (i.e., children with developmental delay who receive early intervention) with the control group (i.e., children having developmental delay but receive no such intervention). Thus, the study aims to identify the demographic and socio-economic explanatory variables influencing the developmental delay among vulnerable children. A hospital records study followed by field surveys will be conducted in the selected blocks of Purulia district in West Bengal. 3. Date of Commencement: April 2014. 4. Name of the Proposing Scientist (Principal Investigator): Dr. Partha De, Population Studies Unit. 5. Name of the associated Scientists with affiliation: (i) Dr. Nandita Chatterjee (Developmental Pediatrician), Professor, Vivekananda Institute of Medical Sciences, Ramakrishna Mission Seva Pratishthan, Kolkata. 6. Name of the associated academic advisors with affiliation (i) Prof. Debasis Sengupta, Professor, Applied Statistics Unit (ASU), ISI, Kolkata. (ii) Prof. Anjali Ghosh, Professor, Psychology Research Unit (PRU), ISI, Kolkata. (iii) Prof. Samir Guha Roy, Professor (Retd.), Population Studies Unit, ISI, Kolkata. 7. A brief write up on the scope and justification of the project and proposed work: The World Health Organization (WHO) uses the term “disability” to refer to a loss of health, where health means having full functional capacity in such domains as mobility, cognition, hearing and vision (UN, 2010). Again it emphasizes that, Persons with disabilities include those who have long term physical, mental, intellectual or sensory impairments which in interaction with various barriers may hinder their full and effective participation in society on an equal basis with others. In most parts of the World people with disabilities are subject to multiple deprivations with limited access to basic services, including medical, education, employment, rehabilitation facilities etc. Widespread social stigma plays a major role in hindering their normal social and economic life. Childhood disability is mostly a consequence of developmental delay & challenge, in various domains, viz., motor, cognitive, visual, auditory and social development. Developmental delay leads to specific problems turning to disabilities among the children like, (i) Motor disabilities (inability to execute distinctive activities associated with moving both himself and objects resulting from affliction of musculoskeletal and/ or nervous system, e.g., cerebral palsy a condition of loss of control over the movement of body due to brain damage); (ii) cognitive delays : Mental retardation & Global developmental Delay (Problems in thinking skills including Prepared By: S. Malakar, Social Sciences Division’s Office Plan Budget Proposals 2014-15, SSD 19 learning, understanding, problem solving, reasoning and remembering); (iii) Visual Impairment/disability (a child with low vision or no vision or poor eyesight and continues to have the problem even after going through medically approved corrective measures);(iv) Hearing impairment (cannot hear at all or hard of hearing any sound) & Speech delay (problem in speaking using body language and gestures, communicating, and understanding what other say); (v) Behavioural problems ( experience problems in communicating and interacting with adults or other children, e.g., autism); (vi) Learning disabilities (this disorder affects development in the basic psychological processes of understanding or using written or spoken language). Much of the disability burden can be reduced if the developmental delays are detected early and Early Intervention is initiated, thereby averting a permanent disability. Unfortunately, till lately, little emphasis had been laid on the medico-social aspects of underlying aetiology of these conditions, of which very scanty data is available. If we could identify the major contributing factors to developmental delays and curb them, the burden of developmental challenges and ultimate disability could be largely reduced. According to UN Enable (UN Website particularly developed for disability) around 10% of the world's populations, 650 million people, live with disabilities. Women and children with disabilities are particularly at a greater risk of abuse. About 90% of children with disabilities worldwide do not attend school. Children with disabilities are at a 1.7 times greater risk of being subjected to some form of violence (UN enable, 2008). According to Child Rights Information Network (CRIN) over 150 million children worldwide have a disability. 90% of the children with disabilities will not survive pass twenty years of age (CRIN, 2008). The British Department for International Development (DFID) has recognized that, ‘disability is a major cause of social exclusion and it is both the cause and consequence of poverty’ (DFID, 2000). In India 1.67% of the 0-19 population has a disability. 35.29% of all people living with disabilities are children (Census of India, 2001). Other estimates say that India has 12 million children living with disabilities (CIF, 2008). Only 1% of children with disabilities have access to school and one third of most disabilities are preventable (CIF, 2008). Under-nutrition is a severe problem with children who suffer from cerebral palsy (Hung et. al., 2003). In India 80% of children with disabilities will not survive past age forty (Kataria, 2002). Disability in India is still functioning in the sphere of social welfare instead of a rights perspective. As there is no direct mortality associated with the various types of disabilities, they remain at the bottom of the government’s priority list. There is no mention of disability either in the Constitution or the Millennium Development Goals (MDG), thus the treatment and prevention of disability does not demand much attention. Teachers are not trained and schools don't have the infrastructure to deal with children with disabilities. Neither are paediatric wards of hospitals equipped to deal with them. There is not enough data in the grass root level on the number of children living with disabilities to allow the government to provide the necessary services. Disability data is essential for monitoring the quality and outcomes of policies for persons with disabilities. The Persons with Disabilities (Equal Opportunities, Protection of Rights and Full Participation) Act (PWD), 1995 and National Policy for Persons with Disabilities released in 2006 are two of the initiatives which emphasized the importance given to this particular issue by the Government of India (NSSO, 2002). The PWD Act imposes specific obligation on the government to undertake surveys, investigation and research concerning causes of disability. In India, the major sources of official statistics on disability are the decadal Population Censuses and the regular large scale sample surveys on disability conducted by National Sample Survey Office (NSSO). Indian Census has been providing data on mainly five types of disabilities like, visual, locomotor, hearing, speech and mental. It provides the disability prevalence rates in different states of India within different age groups, gender and place of residence. Similarly, NSSO data provides important insights into the causes of disability and age specific prevalence rates for different types of disabilities. Other sources include different voluntary organizations (NGOs) who are providing comprehensive services to the persons with disabilities at the grass root level and also generating representative community-based data which will help to plan and execute appropriate measures to address the problems of persons living with disability. These official data may be utilized in the present study by considering the prevalence rates of different types of disabilities and their socio-economic backgrounds within the children, so that a comparative view can be generated at the state and national level. Thus the findings of the grass Prepared By: S. Malakar, Social Sciences Division’s Office 20 Social Sciences Division, ISI root level may help us for further cross checking in terms of the quality and completeness of reporting at macro level. But the two (Census and NSSO) differ substantially especially in respect of overall estimates of persons with various types of disability and their age distribution, mainly due to differences in the concepts and definitions as also the data collection methodologies (CSO, 2012). Since the data are collected by the non-medical investigators, it is imperative to define disability in a very careful and guarded way to minimize the bias of the investigators and respondents. The concepts and definitions spelt out in the act were found to be difficult to canvass in the absence of expert investigator specifically trained for the purpose. Against the above said backdrop, there is a need of systematic and organized community based survey to identify and take care of children with developmental delays or disability, wherein they can be managed and treated. It becomes important to develop the guidelines to provide services for the effective diagnosis, care, understanding the cause, management, treatment and prevention of various types of developmental challenges among children. There is hardly any study available on developmental delays or disability by background socio-demographic characteristics particularly on children in the backward district of Purulia, West Bengal. The objective of the present project is not only to find out the socio-demographic determinants of developmental challenges among young children (0 -6) years, but also to identify their problems with the help of skilled medical experts so that they can get immediate proper treatment and rehabilitation in course of time. Certainly this will add a small but positive step towards this great problem in our society. In this context a study can be mentioned on Mentally Challenged Children in Sholapur District, Maharashtra by CHILDLINE India Foundation in 2008 (CIF, 2008). Key findings of the study were that in 24% of the mentally challenged children, one of the parents was mentally retarded. 11% of mothers of mentally challenged children were below eighteen years. 36% of mothers reported complications during pregnancy while 41.2% reported stress. Only 8% of mentally challenged children attended normal schools. 33% of parent didn't allow their children to interact with other children due to fear of them being teased, accidents, aggressive behaviour, etc (CIF, 2008). Data and Methodology Purulia is a backward district in the state of West Bengal. In 2006 the Ministry of Panchayati Raj named Purulia as one out of the country’s 250 most backward districts. About 43.65% families in the rural areas of the district belong to BPL category. A high proportion of the populations (88.93%) in the district are in the rural areas. Overall literacy level in the district during 2011 Census is 65.38% and for female it is alarmingly low (37.15%) (Census of India, 2011). Thus with high impoverishment and low literacy it is likely that more children will be available those who have problems with developmental delays. That is why the district has considered finding out the gravity of the existence of children’s developmental delays and their correlates via household survey. First a survey based on available hospital’s record will be conducted considering the data of high risk babies of the district hospital namely, Deben Mahato (Sadar) Hospital of Purulia. A special sick newborn care unit (SNCU) was set up at this hospital, in August 2003 with an aim to provide special intensified care and treatment to the high risk sick newborns so that Neonatal Mortality Rate (NMR) can be reduced to some extent. High risk new born are those sick neonates, particularly premature babies, low birth weight babies, babies with perinatal hypoxia, convulsions, severe jaundice etc. These babies are most vulnerable to poor developmental outcome, which evolves with age and needs to be picked up as early as possible to render timely or early intervention (Nair et al., 2005). This calls in for a high risk follow-up by a specialized team. This is essential to detect and prevent developmental challenges in the vulnerable children (Spittle et. al, 2007). A specialized team has already been setup with the support of the district health department and local social welfare organisations (NGOs) who are working in this aspect in the district of Purulia. Their objective is to identify developmental delays in high risk babies at the grass root level and also to provide early intervention facilities by their expert specialized team (comprises of Developmental Pediatrician, Ophthalmologist, Developmental Psychologist, Occupational Prepared By: S. Malakar, Social Sciences Division’s Office Plan Budget Proposals 2014-15, SSD 21 Therapist, Physiotherapist, Speech Therapist, and Special Educator). They also offer training to parents and health workers for home based early intervention therapy. Screening for developmental delay of the high risk babies are conducted in the district hospital of Purulia in 2 steps. First, the records of high risk babies discharged from Deben Mahato Sadar Hospital SNCU are tracked and categorized according to their home address, block wise by the trained block level health workers and NGO workers. Then, the parents of the high risk babies are motivated & mobilised to attend a screening camp organized in the district hospital, where an expert team of developmental pediatricians and therapists performed screening & assessments to arrive at a definite diagnosis and also simultaneously initiated early intervention therapy. Training has also provided to parents or family members of the child on home based management. This team has already identified a large number of children (out of 717 babies discharged over the study period of 2010 – 2012), with some developmental delays or challenges of different nature like, locomotor, hearing, speech, cognitive or social. Now a portion of these children, hailing from identified blocks has been regularly followed up for the next 8 months, whereas the rest will not be stringently followed due to dearth of trained staff. Thus, the task of the present project is to conduct a household survey among the above said total high risk children of SNCU to understand contextual factors, particularly on the socioeconomic factors representing the background of a child’s life and living along with parental characteristics (age, gender, ethnic, education, household wealth, health, etc.). The idea here is to use the collected data to explore associations between existing developmental delays in children’s activities and participation in life situations, and their contextual factors. Along with the above survey a questionnaire of parental attitude and awareness will be canvassed to observe their social attitude and behavioural patterns towards children with developmental delays or disabilities. Now, within the identified developmentally delayed children, two groups will be further formed. One group will include those children who are under early intervention and treatment. Another group consists of the children who are suffering from developmental delay but not under any intervention and treatment. Based on this feature, the two groups (one with continuous follow-up & intervention and the other with no follow up & intervention) may be compared to observe their differences in improvement, as well as change in parental attitude to the problem. Thus, an interesting result may come out from this control group of study. Final field survey will be conducted in the few selected blocks of the district. A suitable sampling method will be adopted for the conduct of the survey based on the concentration and prevalence of the problem in different areas of the district. The ultimate survey will be executed at the household level. A total of 1000 households will be approximate total sample size. A group of trained personnel like block level health workers and local NGO workers (training will be provided by the above said team) will identify children at risk of developmental delay from community and simultaneously household survey will be conducted by them at the grass root level. Allied questionnaires will also be canvassed among the parents to find out the socio cultural aspects of developmental delays or disabilities and their attitude towards the problem. Children with developmental delay from the community, hitherto undetected, will thus be identified by the trained block level workers and referred to the specialised clinics or to a special developmental delay detection camp in the hospital. The expert team of developmental pediatricians and therapists will be available to identify finally the problems of the child. The expert team will also suggest and provide early intervention and therapy to those who screened positive. Finally training will be provided to parents or family members of the child about home based management. Statistical Analysis First, exploratory analysis will be done for the maternal, demographic, health and socioeconomic characteristics on developmental delays in children. Linear and logistic multiple regression will be performed to observe the relationship of childhood developmental delay with family and household demographic, social and economic circumstances. To observe the effects of Early Intervention, Cox Proportional Hazard Model will be used to the children with developmental delay (who received early intervention) with the control group of children having received no such intervention. Demographic parameters will be adjusted as and when necessary. The logistic Prepared By: S. Malakar, Social Sciences Division’s Office 22 Social Sciences Division, ISI regression model will be utilized in assessing the effects of various socioeconomic variables on perception and attitudes of parents toward developmentally challenged children. Plan of work In first year, the following works (i) literature review; (ii) collection of relevant official data from district hospital and other sources; (iii) preparation of questionnaire schedule with training of investigators; (iv) canvassing of questionnaire schedule (based on hospital records) in the identified household of the child having developmental delay and in the second year, (i) relevant block & village level information; (ii) village selection; (iii) listing of households of each selected village with basic information; (iv) data collection on main final questionnaire schedule and organising delay detection camp and training to parents on home based management; (ii) scrutiny of data and data computerisation; and (iii) analysis and report writing will be completed. References: Durkin M.S. (2001), “Measurement of Childhood Disabilities in Population Studies.”, Paper presented at the United Nations Seminar on Measurement of Disability, 4–6 June, New York. Durkin M.S. et al. (1995), “Evaluating a Ten Questions screen for childhood disability: reliability and internal structure in different culture”, Journal of Clinical Epidemiology, 48 (5): 657-66. Edilberto Loaiza, Claudia Cappa. 2005. Measuring Children’s Disability via Household Surveys: The MICS Experience. Paper presented at the Population Association of America (PAA) meeting. March 30 - April 2, 2005. Philadelphia, PA. WHO (2001), International Classification of Impairments, Disabilities, and Handicaps, ISBN 92 4 1545 42 9, WHO, Geneva. United Nations. 2010. World Population Monitoring – Focus on Health, Morbidity, Mortality and Development – A Concise Report. National Sample Survey Organization. 2002. Disabled Persons in India: NSS 58th Round. Report No. 485. New Delhi: Ministry of Statistics and Program Implementation, Government of India. Census of India. 2001. Disabled population by type of disability, age, sex and type. New Delhi: Registrar General Office. DFID. Disability, poverty and development. 2000. Available at http://handicapinternational.fr/bibliographiehandicap/4PolitiqueHandicap/ hand_pauvrete/ DFID_disability.pdf. Ganesh KS, Das A, Shashi JS. 2008. Epidemiology of disability in a rural community of Karnataka, Indian Journal of Public Health; 52: 125-129. Indian Council of Medical Research. 2007. Prevention of Disability in Children. ICMR Bulletin; 37: 9-16. Joshi K, Kumar R, Avasthi A. Morbidity profile and its relationship with disability and Psychological distress among elderly people in Northern India. International Journal of Epidemiology, 2003; 32: 978-987. Kandamuthan M and Kandamuthan S. 2004. The Economic Burden of Disabled Children on Families in Kerala in South India. Centre for Development Studies Discussion Paper No. 91. Available at http://papers.ssrn.com/sol3/papers.cfm?abstract_id=995114. Kumar A. Draft of National Policy for Persons with Disability. 2005. New Delhi: Ministry of Social Justice and Empowerment. Available at http://www.disabilityindia.org /draftpolicy.cfm. Kumar SG, Das A, Bhandary PV, Soans SJ, Kumar HNH, Kotian MS. 2008. Prevalence and pattern of mental disability using Indian disability evaluation assessment scale in a rural community of Karnataka. Indian Journal of Psychiatry; 50: 21–23. Patel S. An Empirical Study of Causes of Disability in India. Internet Journal of Epidemiology, 2009; Volume 6 Number 2. Singh A. 2008. Burden of disability in a Chandigarh village. Indian Journal of Community Medicine; 33: 113-115. Nair MKC, Jana AK, Niswade AK. 2005. Editorial. Neonatal survival & Beyond. Indian Pediatr; 42: 985-8. Spittle AJ, Orton AJ, Doyle LW, Boyd R. 2007. Early Developmental Intervention Programs post hospital discharge to prevent motor and cognitive impairments in preterm infants. Cochrane database Syst. Rev.; 2: CD005495. 8. Item wise breakup of the budget proposed (only Revenue): Financial requirement: Grand Total Outlay : Rs. 9.35 Lakhs Prepared By: S. Malakar, Social Sciences Division’s Office Plan Budget Proposals 2014-15, SSD 23 (For two financial years: 2014-15, 2015-16) a) Proposed budget for 2014-2015 : Total outlay Revenue Item : Rs. 3.90 lakhs Expenditure* (Rupees in Lakhs) 2.40 Field Work and Secondary data collection from hospital and other sources (TA, DA, Transport, Field guide etc.) Two days Training of field investigators by the expert team 0.90 Data Scrutiny and Entry 0.20 Contingency (stationary, printing, Xerox, computer consumables, books, 0.40 journals etc.) Total 3.90 Capital expenditure (2014-15): Nil b) Proposed budget for: 2015-2016: Total outlay : Rs. 5.45 Lakhs Revenue Item Expenditure* (Rupees in Lakhs) Field Work (TA, DA, Transport, Field guide etc.) 2.80 Two days Developmental Delay Detection Camp by the expert team 1.00 One day Awareness Camp for the parents of disabled children by the 1.00 expert team Data Scrutiny and Entry 0.25 Contingency (stationary, printing, Xerox, computer consumables, books, 0.40 journals etc.) Total 5.45 Capital expenditure (2015-16) : Nil Grand Total : Rs. 9.35 Lakhs [* Out of the total budget, the maximum is incurred in connection with field works due to the following reasons (i) remoteness of the selected villages; (ii) poor communication system and transportation problems; and (iii) existence of political disturbance (though comparatively less).] Assets: None 9. Projects in last five years: A Workshop on Techniques of Analysis of Demographic and Health Statistics and Application of Computer Software, Prasanta Pathak, Subhas Burman and Partha De ,PSU, ISI, 2012-13. 10. Expected date of completion: 31 March, 2016 11. Quaterly projection of expenditure during 2014-2015: 1st 2nd 3rd 4th Year Rev. Total Rev. Total Rev. Total Rev. Total Rev. Total 90000/- 90000/ 100000/- 100000/ 100000/- 100000/ 110000/- 110000/ 390000/- 390000/12. For general projects only (on-going): Not applicable 13. For general projects only (New): Total expected budget (A) Rev. Total Proposed budget for 2014-15 (B) Rev. Total 9,35,000/- 9,35,000/- 3,90,000/- 3,90,000/- Action Plan/Target in terms of percentage (%) 201420152015 2016 100.00 100.00 % % 14. For North-East project only (on-going): Not applicable Prepared By: S. Malakar, Social Sciences Division’s Office Financial target in terms of percentage (%) 20142015 100.00 % 20152016 100.0 % Social Sciences Division, ISI 24 15. For North-East project only (New): Not applicable Recent Publications: De, Partha, Dhar, Arpita, Bhattacharya, B.N. (2012) Efficiency of Health Care System in India: An Inter-State Analysis using DEA Approach; Social Work in Public Health, Vol. 27, Issue 5, pp. 482-506, Taylor & Francis, Routledge. De, Partha, Dhar, Arpita (2013) Inequality in Child Mortality across different States of India: A Comparative Study; Journal of Child Health Care, Sage Publications, London, United Kingdom (Online First publication). DOI: 10.1177/1367493512468359, http:// chc.sagepub.com/ content/early/recent. Pandey, Arvind, Bhattacharya,B.N, Sahu, D., De, Partha, Gulati,B.K., Shukla, A.K. , Mitra, R.G., Mohan, Pavitra. (2012) Infant and Child Mortality in India: Levels, Trends and Determinants, National Institute of Medical Statistics (NIMS), Indian Council of Medical Research (ICMR), and UNICEF India Country Office, New Delhi, India. (UNICEF publication: www.unicef.org/india/Report.pdf). Prepared By: S. Malakar, Social Sciences Division’s Office Plan Budget Proposals 2014-15, SSD 25 PRU (General, New) Project No. 4.1 1. Title of the Project: National Conference on “Adolescence Development: Issues and Challenges” 2. Brief objective and justification: The objective is to conduct a National level Conference on “Adolescence Development: Issues and Challenges” 3. Date of commencement: April, 2014 4. Name of the Proposing Scientists: Anjali Ghosh, Rumki Gupta & DebDulal Dutta Roy. 5. Name of other Associated Scientists with their affiliation: Professor Amita Mazumder, Economic Research Unit, I.S.I 6. A brief write up on the scope and justification of the project and the proposed work: Adolescence represents a psychosocial revolution in the whole life cycle of an individual. Adolescence is viewed as a transitional period between childhood and adulthood, whose purpose is to prepare the child for adult roles. In this period the focus on adolescence highlights the identity issues which have long been regarded as central to adolescent development. According to the report of UNICEF (2011) around 20% of India’s population is adolescents. In the era of globalization, adolescents have a pivotal role to play. Adolescents in this globalization era want to know new and unusual things, and they have to cope up with different stressful situations. Keeping these things in mind this conference will be conducted for two days. Probable presenters in the conference will be faculties and research fellows working in the area of adolescent development in the different universities of India for example, Department of Human development &Family Studies-M.S. University of Baroda, Department of Psychology: University of Calcutta, IITKanpur, Amity University, Pondicherry University, Centre for advanced Studies in PsychologyAllahabad University, Delhi University and others. Professors T.S.Saraswati, Lilavati Krishnan, Shagufa Kapadia, Nilanjana Sanyal, Sibnath Deb and others will be invited to give lectures on the topics viz. Psychosocial development of adolescence, Cognitive development of adolescence, Moral development in adolescent, Adolescence and peer pressure, Social and emotional development of adolescence, adolescence development and social networking etc. Research scholars, faculties and scientific workers working in this area will also participate in this conference. Registration fee of Rs.1000/- will be taken from each participant. The Conference will help us to know important issues of adolescent development and find out ways to tackle these challenges. 7. Item wise break-up of the budget proposed (2014-15) : Sr. No Item 1 2 3 Airfare for 4/5 invited speakers Transport charges Printing (brochure, banner, invitation card) photocopying etc Lunch, tea/coffee etc. (approx. for 100 persons) Telephone, postage etc. Conference bag, folder, pen, pad etc. Accommodation(Guest House + Hostel charges) Miscellaneous 4 5 6 8 9 Total Amount (Rs.) 1,50,000.00 35,000.00 55,000.00 1,50,000.00 10,000.00 90,000.00 1,10,000.00 15,000.00 6,15,000.00 8. Brief particulars of Assets, proposed to be acquire from Capital Budget, should be mentioned. In case of replacement, particulars of the asset to be condemned (e.g., Year of Purchase, Cost) : N.A. Prepared By: S. Malakar, Social Sciences Division’s Office Social Sciences Division, ISI 26 9. List of all projects undertaken by the proposing scientist in the last five years : Project / research Undertaken Ego-identity status during Adolescence and Early adulthood. (2006-08) P.I. Sl. No 1 Status Money budgeted Money spent Publications Report submitted. One paper published in a journal & one paper published in Conference Proceeding. Report submitted. Completed 2,39,000/- 2,03,000/- Improvement upon Management Entrance Test using Item Response Theory (IRT). (2006) P.I. With Prof. A. Chowdhari, Dr. R. Gupta &Mr. S.K. Mitra. Of ASRC Emotional Display Rules & Personality Pattern Across Different Groups of Individuals. (2008-11) P.I. Completed (Externally funded) 2,00,000/- 1,67,000/(approx.) Completed 4,81,000/- 4,35,000/(approx.) 4 External Evaluation of Special Adult Literacy Programme of Tripura (2010-11) – P.I. Completed 5 Recruitment of Accounts Assistant in KMDA (2012-13) P.I. Completed All the expenditure incurred by the Government of Tripura 3,56,200/- Report submitted. Two papers presented in International Conferences and one paper published in an International journal. Report Submitted 1,57,350/(approx). Report Submited 2 3 Publications from various projects during 2008 - 2012 Karmakar, R. & Ghosh, A. – Moral Development of Female Students of North-Eastern Region of India. In Gassah, L.S.(Ed.) Women Empowerment Movement In North-East India. Omsons Publications, New Delhi, 2008, 228-244. Basak, R. & Ghosh, A. – Ego-Identity Status and Its relationship with self-esteem in a Group of Late Adolescents, Journal of The Indian Academy of Applied Psychology, 2008, 34, 2, 337-344. Ghosh,A. – Transactive Memory, Self-Construal and Subjective Well-Being in a Group of Indian Couples,Interpersona,2008 ,2 (2) 173-192. Karmakar,R.; Ghosh, A. & Dewanji, A.- On Some Determinants For distributive Justice in Children : A Study Based on Three States of India, Calcutta Statistical Association Bulletin,2008,60 (239240),255-275. Basak, R. & Ghosh, A. – Relation of Parental Education and Occupation with Mathematics Selfefficacy and Achievement of Students, Journal of Education and Psychological Studies, 2010, 4(1), 1-7. Ghosh, A. – Expressive Differences for Emotions In Visually Challenged and Normal Individuals, International Journal of Arts and Sciences, 2010, 3(15), 255-265. Ghosh, A- Ego- identity Status in Different Groups of Late adolescents. In P. Singh, P. Bain, ChanHoong. Leong, G. Misra,& Y. Ohtsubo (Eds.) Identity, Multiculturalism & Changing Societies, Progress in Asian Social Psychology Series,2011, Vol.8, 95-108, Mac Milan Publishers. Ghosh, Anjali.: Individualist-Collectivist Orientations and Achievement value in college students. Journal of Transpersonel Research, 4(1), 39 - 46, 2012. 10. Expected date of completion : March, 2015 11. Quarterly projection of Expenditure during 2014-2015: 1st Rev. Cap. Total 10% 10% 2nd Rev. Cap. 25% 3rd 4th Total Total Rev. Cap. Total Rev. Cap. Total Rev. Cap. Total 25% 45% 45% 20% 20% 100% 100% Prepared By: S. Malakar, Social Sciences Division’s Office Plan Budget Proposals 2014-15, SSD 27 12. For General Projects only (On-going): Not Applicable 13. For General Projects only (New) Total expected budget Proposed budget for Action plan/Target in Financial target (A) (in lakhs) in terms of 2014-15 (B) (in lakhs) terms of percentage (%) percentage (%) Rev. Cap. Total Rev. Cap. Total 2014-15 2014-15 6,15,000 6,15,000 6,15,000 6,15,000 Prepared By: S. Malakar, Social Sciences Division’s Office 100% 100% Social Sciences Division, ISI 28 PRU (General, New) Project No. 4.2 1. Title of the Project: Summer / Winter School on Data Mining in Psychological Research 1.1 Short term: DM 2. Brief Objective and Justification (2 or 3 sentences): Usual parametric statistical tools require specific assumptions of data collection and data distribution. It is applicable when data collection process is hypothesis driven. Therefore, these tools are not applicable when data are extracted from large data reservoir where in data are randomly generated without any specific hypothesis. These data are complex in nature, some data are digitized and some are not. Both may be of text and non-text data. Data mining provides specific knowledge about how to extract data with computer algorithms, how to clean the data and how to develop pattern of grouping the data in order to develop theory in Psychological Research. Aim of this project is to disseminate knowledge about purposes, assumptions and computations of different data mining techniques and statistical tools used in Psychological Research. This will help the trainees to extract digitized and non-digitized psychological response data scattered around for development of theory in Psychology. 3. Date of Commencement: April 2014. 4. Name of the Principal Investigator/ Proposing Scientist with their affiliations : Dr. D. Dutta Roy, Psychology Research Unit (PRU), Indian Statistical Institute, Kolkata. 5. Name of other Scientist(s) with their affiliations : Prof. Ayanendranath Basu, Bayesian and Interdisciplinary Research Unit (BIRU), Indian Statistical Institute, Kolkata. H. Krishnamurthy, Chief Research Scientist, Supercomputer Education and Research Centre, Indian Institute of Science. 6. A brief write-up on the scope and justification of the project and the proposed work (not more than half a page): In psychological research data mining is almost untouched area due to inadequate knowledge and over emphasis on traditional research. Data mining is data driven, data adaptive research. It is flexible approach in making sense out of randomly generated data. Aim of this school is to disseminate knowledge about computer algorithms for data mining and set of statistical tools that do not require parametric assumptions. Some tools are hierarchical and non-hierarchical cluster analysis for pattern recognition, Correspondence analysis for plotting relation among several multivariate data, box-whisker plot analysis for data cleaning. Besides, knowledge about some uncommon tools and their applications will be disseminated. These are tree- structured regression and classification, neural networks and smoothing methods. Proposed work: Duration: The school will be held for 3-days in summer or winter depending on accommodation in the guest house. Applicants: Faculties, Researchers (including registered Research Scholars) and practitioners in India can apply. Participants should have good knowledge of psychometrics and statistics and experience in computer based psychological data analysis. Hospitality: Outstation participants will be provided local hospitality (board and lodging) at the ISI guest house, Kolkata. Working lunch and snacks will be provided to all participants (including local participants) free of cost on all three days. Outstation participants will be reimbursed for return fare by train (AC 3-tier)/bus by the shortest route, subject to submission of ticket or money receipt. No payments shall be made without proper supporting documents. Course: The course includes (a) Introduction to data mining (b) Basic concept of statistical tools for data mining in Psychological Research (c) Computations. One volume will be prepared based on lectures. One research committee will be formed to design the course. Prepared By: S. Malakar, Social Sciences Division’s Office Plan Budget Proposals 2014-15, SSD 29 Pedagogy: It includes lecture and hands-on-experience. Some real data will be presented for computations. The real data are Ranked work values. 14 path and 14 goal oriented Rabindrik work values were ranked. Trainees will be administered only ranks. Sample data are given below: Ethical issue: The original data or extracted output will not be used to harm any individual or individuals. Certificates of attendance will be provided only to candidates who attend at all sessions. 7. Project outlay & expenditure Sl.No. Item Revenue 1. Train (AC 3 Tier)/Airfare for 20 outstation participants (@ Rs.4,000) Rs.80,000 2. Airfare for two outstation resource persons (@ Rs.15,000) Rs.30,000 3. Rs.24,000 5. Board and lodging for 20 outstation participants for four days (@ Rs.600 per day per person) Lunch for 50 participants, resource persons and organizing staffs for 3 days (@ Rs.250 per day per person) Tea and snacks for 50 persons for 3 days (@ Rs.50 per day per person) 6. Honorarium and conveyance for 6 invited resource persons (@ Rs.2,000) Rs.12,000 7. Reading materials for 50 persons (@ Rs.500) Rs.25,000 8. Training kits including bags, pads, pens etc. for 50 persons (@ Rs.400) Rs.20,000 9. Local Transport for 3 days (Rs.15,000) Rs.15,000 10. Preparatory activities including advertisements, communication, travel, preparation of materials etc. Food and accommodation charges for additional days Rs.5,000 Miscellaneous expenses including postal expenses, generator, banner, flower, photography, secretarial assistance, contingencies etc. Total Rs.25,000 4. 11. 12. Prepared By: S. Malakar, Social Sciences Division’s Office Rs.37,500 Rs.7,500 Rs.23,000 Rs.3,04,000 Social Sciences Division, ISI 30 8. Brief particulars of Assets, proposed to be acquire from Capital Budget, should be mentioned. In case of replacement, particulars of the asset to be condemned (e.g., Year of Purchase, Cost) : NA 9. List of all ongoing projects undertaken by the Proposing Scientist in the last 5 years and for each, give (i) Status (ii) Money budgeted, (iii) Money spent, (iv) Publications 10. (if any). : Title Status Money spent Publications Ongoing Money budgeted 1,20,000 Differential Validity of Computer Programming Abilities (2012-2015) Workshop on Application of Reliability statistics in Psychological Research (2011-2012) Self-efficacy of Agricultural farmers (2009-12) Orientation training on questionnaire design for psychological and educational researches (2008-09) Attitude towards school infrastructure in rural areas (2007-08) 1,11,148 0 Completed 80,000 61,675 2 Completed Completed 5,97,000 2,15,000 4,06,086.10 35063 1 1 Completed 1,17,000 84446.22 1 11. Expected date of Completion: March, 2015 12. Quarterly projection of Expenditure during 2014-2015: 1st Rev. 25% Cap. Total 25% 2nd Rev. 25% Cap. Total 25% 3rd Rev. 25% Cap. Total 25% 4th Rev. 25% Cap. Total 25% Total Rev. Cap. 100% Total 100% 13. For General Projects only (On-going): Not Applicable 14. For General Projects only (New) Total expected budget (A) Proposed budget for 2014- Action plan/Target in terms Financial target in terms of 15 (B) of percentage (%) percentage (%) Rev. Rev. Cap. Total 3,04,000 3,04,000 3,04,000 Cap. Total 2014-15 3,04,000 100% 2014-15 100% 15. For North-East Projects only (On-going) : Not applicable For North-East Projects only (New): Not applicable List of all scientific papers published in journal over the last 5 years (2008-12) Dutta Roy, D., Ghosh,S. and Rahman, F.H. (2012).Perceived Environmental Uncertainty in Crop cultivation in West Bengal: Agro Psychological Counselling Perspective. Indian Journal of Psychology. Special issue, January, 111-120. Dutta Roy,D.(2011).Construct validity of Reading motivation. Journal of the Indian Academy of Applied Psychology, vol.37,No.1, 106-113. Roy,A. and Dutta Roy,D.(2010). Predicting cash flow of Sarva Shiksha Abhiyan in West Bengal : An exploratory study of public finance. Journal of Management research in Emerging economics. Vol.1.1. 60-69. Dutta Roy,D.(2010).Cluster Analysis for Test-Retest Reliability. International Journal of Psychological Research , 3,1,132-140. (published from USA) Dutta Roy, D. (2009) - Construct validity of writing motivation questionnaire. International Journal of Psychological Research , 3,2,6-11 (published from USA) Dutta Roy,D.(2009). Self-efficacy of Agricultural farmers:A case study. Journal of the Indian Academy of Applied Psychology, 35,2, 323-328. Dutta Roy, D. (2008). Assessing Validity of Web-Based Computer Adaptive Training Modules, Journal Of The Indian Academy of Applied Psychology, Vol. 34, No.1, January, 127-136. Prepared By: S. Malakar, Social Sciences Division’s Office Plan Budget Proposals 2014-15, SSD Prepared By: S. Malakar, Social Sciences Division’s Office 31 Social Sciences Division, ISI 32 SOSU (General, New) Project No. 6.3 1. Title of the Project: Finding out the Direct and the Indirect Roles of Various Socio-economic and Demographic Factors, Health and Family Welfare and Other Developmental Programmes in the Growth of Population : A Case Study on Giridih Name of Principal Investigator: Prasanta Pathak 2. Name of Associated Scientist: Anil Chowdhury, ISI, Giridih 3. Year of Inception: April, 2014 4. Year of Completion: March, 2015 5. Scope of the Project: There are number of studies that have attempted to explain population growth by using various socio-economic and demographic variables (see Valavanis-vail (1955), Weintraub (1962), Klein (1963), Adelman (1963), Krishnamurty (1966)). Per capita real income and its growth over time, ratio of population in farming, infant mortality rate, age specific fertility rates, age specific mortality rates, health indicator like number of physicians per 1000 population, percentage of labour force employed outside agriculture, education, population density, urbanization, time trend, etc. have been used as explanatory variables. The role of the programmatic factors, meaning implementation of various developmental programmes including Heath and Family Welfare programme, however, have not so far been taken into account explicitly. Analytical studies using micro level data have also not been seen so far. The empirical study by Banerji and Saha (2010) attempts to some extent at filling the gap. There is, thus, a need for an in-depth study which can relate development dynamics with population growth. Development dynamics may be understood in terms various income generating programmes of the state and the central governments and its beneficiaries in different states in India. Income generating activities associated with the programmes include construction of roads, houses, canals, etc., development of farming at advanced level and establishment of small & medium scale industries and so on. Population growth, on the other hand, is an outcome of fertility, mortality and migration. Infant mortality being the main constituent of mortality, it needs to be studied in particular. In fact, the reproductive and child health programme of the government aims at reducing both the fertility and the child mortality. With increasing income generating capability of people, it is expected that they would seek health care for women and children more. While, reproductive and child health programme is supposed to have a big role in controlling the growth of a population the success of the programme depends on the economic status of people, which again depends on economic development. Migration is the third component that influences growth of a population. While in an underdeveloped state of an area, people (predominantly the adult males) tend to move out of the area for better livelihood, the out-migration is likely to fall with area development. In higher development phase, the area might even become a destination for the in-migrants. Thus, the growth of population is again expected to be dependent on the level of development. Present study chooses a district in an under-developed state in India, where population growth rate is high. It attempts at explaining the population growth in the perspective of local development dynamics. The chosen state is Jharkhand, which was formed more than a decade back to satisfy aspirations of the people in the tribal districts of Bihar. The state is rich in valuable minerals and coal and has extensive forest areas. The people of the state, however, are generally poor (about 52% households fall in the lowest wealth quintile as per National Family Health Survey (NFHS-3 findings) and backward due to insufficient developmental activities in the primary, the secondary and the tertiary sectors. The problem of backwardness has got further aggravated by high population growth rate (23.36% during 1991-2001 as per Census estimate and TFR of 3.3 as per NFHS-3 estimate) and low education and health status (literacy rate 53.6%, with 67.3% for males and 38.9% for females and IMR equaling 69 per 1000 live births as per NFHS-3 estimates). Backwardness of remote areas has given birth to Maoist problem in Jharkhand as well. In the Prepared By: S. Malakar, Social Sciences Division’s Office Plan Budget Proposals 2014-15, SSD 33 absence of sufficient developmental activities, controlling the growth of population is essential for improving the economic status of the people. While Family Welfare Programme and/or Reproductive and Child Health Programme directly attempt at controlling the growth of population, the success of it depends not only on effective and efficient implementation of these programmes but also on successful implementation of number of other programmes focusing on education, income generation, expansion of infrastructure, etc. It is thus worth investigating the direct and indirect roles of not only various socio-economic and demographic factors but also various developmental programmes in controlling the growth of population. The project within its limited scope does not focus on the whole state. It takes Giridih district as a case and attempts to make an in-depth study on the raised research question. Choice of the district is led by the existence of a centre of ISI in the district head quarter and some studies, done earlier by ISI scientists on the district. The population growth rate in Giridih during 19912001 was 27.09%, higher than the state growth rate. The literacy rate for the district was lower than the state literacy rate (44.5% to be precise, with 62.1% for males and 26.6% for females). The birth rate and the IMR for the district in 2001 were 35.8 and 67.0 respectively, both considered to be high. 6. (A) General Objective: Finding out the direct and indirect roles of various socio-economic and demographic factors, and different developmental programmes in controlling the growth of population. (B) Specific Objectives: (1) Identify on the basis of extensive literature search, the socio-economic and the demographic factors and also the developmental programmes that are directly or indirectly associated with population growth. (2) Get details of the developmental programmes and associated activities, implemented in Giridih since 1980 inclusive of incurred expenditures, geographical coverage, achievements and targeted beneficiaries. (3) Get details of changing level of well being of local people, measured in terms of absorption in gainful economic activities, earning, consumption, formation of assets and properties, occupation, education, living arrangement, social and cultural norms, reproductive and child health status and other demographic features, crimes and social unrest, etc. (4) Find out association of various socio-economic and demographic factors and developmental programmes with growth of population, inclusive of the role of migration. (5) Find out precisely the changes that are required for controlling effectively the growth of population. 7. Methodology: Secondary sources of information inclusive of published and unpublished research papers, reports and records will be used to achieve the first two objectives. This also might necessitate collecting information from government and non-government officials and agencies through interviews and interactions. The programmes which will be particularly focused during collection of information are of two types. The programmes that generate employment will be focused on one hand to understand the development dynamics. The first three in the following list are such programmes. The reproductive and child health program, on the other hand, will be considered to take into account the fertility and the mortality components of population growth. Information on migration will be collected through appropriate questions in the survey schedule. 1) Swarnajayanti Grama Swarojgar Yojana (SGSY) 2) Prime Minister’s Employment Generation Programme (PMEGP) 3) Employment Assurance Scheme (EAS) 4) Reproductive and Child Health Programme (RCHP) The secondary sources of information like different census publications, National Sample Survey reports, National Family Health Survey reports, District Level Health Survey Reports, Facility Survey Reports, State Annual Reports, Statistical Abstracts, reports on implementation of National Rural Employment Guarantee Act (NREGA) and other available reports will be used to serve the third objective. The study needs in-depth probing at household level. Therefore, a household survey will be conducted after stratifying 12 blocks of Giridih into three groups by their level of literacy, a proxy variable for level of development. As per 2001 Census, there are three blocks with literacy percentages below 40, six blocks with literacy percentages between 40 and 45 and three blocks with literacy percentages 45 and above. Two blocks from each of the first and the last strata and three blocks from the middle stratum will be chosen for the study, Prepared By: S. Malakar, Social Sciences Division’s Office Social Sciences Division, ISI 34 8. 9. 10. 11. 12. 13. keeping in mind the distribution of the literacy percentages over the blocks. For each selected block, the villages in it will be stratified by its population sizes as small, medium and large. Following Rao, Hartley and Cochran (RHC) (1962), appropriate number of villages will be selected from the three strata, making it representative of the village size distribution. The total number of selected villages is expected to be below 90. In addition to the selected villages, two townships will be selected for the survey by RHC. Urban Frame Survey Blocks (UFSB), defined in National Sample Survey, will be made use of to choose the urban blocks. Eight blocks from each township will be selected by SRSWOR (Simple Random Sampling without Replacement). For each selected village/block, a house listing will be prepared with the purpose of classifying the households by their economic and social status. Monthly household consumption expense, type of housing, ownership of house and land, caste and religion are to be considered while classifying the households as vulnerable, normal and well-to-do. For villages/blocks with more than 1,200 population, each village/block will be divided into two or more hamlet-groups or sub-blocks, having more or less equal population sizes. Two hamlet-groups or sub-blocks will be chosen at random for each such large village/block. Attempt will be made to choose by SRSWOR 6 households from each class. From each household, members who have ever married will be interviewed. Semi-structured questionnaire will be used for interviewing each respondent. The purpose of interviewing ever married members of different ages is to find out the change in perception of the required number of children with changing state of well being over generations. For each selected village and UFSB, separate instruments will be used to collect information from panchayat pradhan, local municipal representative or councilor, local recognized NGO, local schools and colleges, local sun-centre and primary health centre, etc. about available facilities and services in the area, its capacities, time of inception, status of functioning, etc. Achievements in relevant development programmes will be measured by appropriate input, process and output indicators, defined based on available data. The questionnaires will be processed in computer after necessary editing and coding. Based on the collected data and associated statistical tables, graphs, application of various techniques of association analysis and appropriate input-output analysis, the remaining objectives of the study will be achieved. Results of analyses on the project findings will be shared with a carefully chosen segment of officials from the Government of Jharkhand. A seminar might be organized for this purpose. The project report will be prepared after incorporating feedback of the officials on the project findings. Achievement: Not applicable. Constraints: The survey needs covering remote villages. The success of the project depends on extent of availability secondary data from government and other sources and cooperation from Jharkhand government and local administration. Project Outlay and Expenditure: (given at the end) Amount Spent till March, 2014: Not applicable. Project Beneficiaries and Expected/Accrued Benefits: Jharkhand Government is the direct beneficiary of this project. The Institute will also be able to prove the utility of its centre to Jharkhand Government. Collaboration: None. References: Adelman, Irma. 1963. An Econometric Analysis of Population Growth, American Economic Review, June, p.314-339. Klein, L.R.1961. A Model of Japanese Economic Growth, 1837 – 1937, Econometrica, July, p.277 - 292. Klein, L.R. and Shinkai, Y. 1963. An Econometric Model of Japan, 1930 – 1959, International Economic Review, January, p.1 – 28. Krishnamurty, K.1966. Economic Development and Population Growth in Low Income Countries: An Empirical Study for India, Economic Development and Cultural Change, Vol.15, No.1, p.70 – 75. Valvanis-vail, Stefan. 1955. An Econometric Model of USA 1869 – 1953, American Economic Review Papers and Proceedings, XLV, p. 208 – 221. Prepared By: S. Malakar, Social Sciences Division’s Office Plan Budget Proposals 2014-15, SSD 35 Weintraub, Robert.1962. The Birth Rate and Economic Development: An Empirical Study, Econometrica, October, p.812 – 817. New Project Project Outlay and Expenditure Sl. No. Item No. Rate 1 Rs. 15,000 per mth. for 10 mths. Rs. 50 per schedule for 6500 schedules Rs. 400 per day for 45 days Amount (Rs.) 1,50,000.00 1 Project-linked person 2 Field Investigators 3 Field Supervisors 8 4 Field Data Editor 1 5 Vehicle for field visits 4 6 Field visits by project team (3 members) 10 visits 7 DA during field visit by project team(3 members) 50 days 8 Visit to Delhi for information collection 3 visits 9 DA during field visits 12 days 10 Schedule printing, photo copying, etc. 11 12 Training of field investigators and 45 persons supervisors Computer entry & data processing & programming 13 Sharing Workshop 30,000.00 14 Miscellaneous 70,000.00 TOTAL Prepared By: S. Malakar, Social Sciences Division’s Office 6,500 sets Rs.10,000 per mth for 2.5 months Rs. 2000 per vehicle per day for 45 days Rs. 2,000 for to-and fro trips for each team member Rs. 300 per day per person with free accomodation at Giridih Guest house Rs. 20,000 for to-and-fro trips by air Rs. 1,500 per day inclusive of boarding and lodging 3,25,000.00 1,44,000.00 25,000.00 3,60,000.00 60,000.00 45,000.00 60,000.00 18,000.00 Rs. 15 per set 97,500.00 Rs. 200 per person 9,000.00 75,000.00 14,68,500.00 Social Sciences Division, ISI 36 Ongoing Projects ON-Going Sr Unit Project Leader(s) Project No. and Name of the Project Page On-Going, Noth East Project 1 PRU 4.3 Cognitive Processing Through PASS Model and its Role in Determining Academic Performance of School Students of North- Eastern India. (2012-15) … Anjali Ghosh … 40 On-Going, General Project 2 LRU 2.2 Biaxial Study of Bangla Lexicosyntax (2013-16) … Probal Dasgupta … 36 3 LRU 2.3 Bengali Pronunciation Dictionary in Electronic and Printed Form (2012-15) … Niladri Sekhar Dash … 38 4 PRU 4.4 Differential validity of Computer programming abilities (2012-15) … Debdulal Dutta Roy … 43 5 PRU 4.5 Parenting styles and academic achievement of the school students. (2013-15) … Rumki Gupta … 46 6 SRU 5.1 Data Gap in Gender Statistics: Women in Mining Industry (2012-15) … Molly Chattopadhyay … 50 7 SRU 5.2 Migration, social network and their impact on the rural households of Jharkhand. (2013-15) … Rabindranath Jana … 52 8 SRU 5.3 A micro level study of television (TV) watching and childhood obesity in Kolkata city of West Bengal, India. (2013-15) … Susmita Bharati … 57 9 SRU 5.4 Gender Issues and Empowerment of Women in rural West Bengal (2013-15) … Bhola Nath Ghosh … 60 10 EAU 8.1 Evaluating Official Statistics on Land and Livestock holdings (2012-15) … V.K. Ramachandran … 66 Prepared By: S. Malakar, Social Sciences Division’s Office Plan Budget Proposals 2014-15, SSD 37 LRU (General, On-Going) Project No. 2.2 1. Title of the project: Biaxial Study of Bangla Lexicosyntax. 2. Brief objective and justification (2 or 3 sentences): The purpose of this project is to apply the biaxial apparatus to the problem of delineating cranberry-compatible environments in Bangla. Current work suggests that an idiom containing a bound word cannot cross a predicate boundary; we need to sharpen our knowledge of predicate boundaries. The results of this project are not only of computational and psycholinguistic interest but also overlap with the socio-cultural study of common sense as it is encoded in idiomatic structures. 3. Date of Commencement: April 2013 4. Name of the Proposing Scientist/Principal Investigator: Probal Dasgupta, LRU, ISI 5. Name of other associated Scientists with their affiliation: Niladri Sk. Dash (LRU, ISI) 6. A brief write up on the scope and justification of the project and the proposed work (not more than half a page): The purpose of this project is to apply the biaxial apparatus to the problem of distinguishing cranberry-compatible from cranberry-incompatible syntactic environments in Bangla. Current work by the P.I. suggests that an idiom containing a bound word (usually called a cranberry word) cannot cross a predicate boundary; we need to sharpen our knowledge of predicate boundaries. In particular, the older proposals that the subject-predicate boundary within the body of the clause is the relevant line of demarcation are incompatible with data highlighted by Manaster-Ramer and Wasow; the P.I. is exploring the possibility that the topiccomment boundary is the maximal outer boundary but that prototypical idioms are confined to the narrow verb phrase. The results of this project are not only of computational and psycholinguistic interest but also overlap with the socio-cultural study of common sense as it is encoded in the metaphoric structure of idiomatic expressions. Idiom descriptions underwritten by the biaxial approach have begun to, and are expected to continue to, illuminate the complex predicate domain of South Asian lexical systems that need to be better understood for computational purposes. The contrastive study of ethnic languages vis-a-vis the idiom-free and opacity-minimizing Archimedean language Esperanto has yielded results reported in the P.I.’s (2011) book Inhabiting Human Languages cited below; these results will underpin the proposed study. 7. Item wise break up of the budget proposed (Capital & Revenue) and justification for the same (not more than 1/4 page): Items Heads Capital Revenue Salary of 1 Project Assistant (20,000 X 36 = 7,20,000) Stores and stationeries Computer consumables Maintenance Total: 2013-2014 NIL 2014-2015 NIL 2015-2016 NIL Total NIL 2,40,000 2,40,000 2,40,000 7,20,000 15,000 15,000 10,000 2,80,000 15,000 15,000 10,000 2,80,000 20,000 20,000 10,000 2,90,000 50,000 50,000 30,000 8,50,000 8. Brief particulars of Assets, proposed to be acquired from Capital Budget, should be mentioned. In case of replacement, particulars of the asset to be condemned (e.g., Year of Purchase, Cost): Computer, photocopier, and antivirus software are to be procured. 9. List of all ongoing projects undertaken by the Proposing Scientist in the last 5 years and for each, give (i) Status (ii) Money budgeted, (iii) Money spent, (iv) Publications: No. of on-going projects Project No 6 Title : 1 (One) : (Ongoing, Northeastern) : Interlexical study of Asamiya in a substantivist framework Prepared By: S. Malakar, Social Sciences Division’s Office Social Sciences Division, ISI 38 Status : On-going Money budgeted in 2012-2013: Rs. 2.20,000/10. Expected date of Completion: March 2016 11. Quarterly projection of Expenditure during 2013-2014: Total Cap. Rev. 100% Cap. NIL Total Rev. Total 25% Cap. NIL Prepared By: S. Malakar, Social Sciences Division’s Office Total Rev. 4th 25% Cap. NIL Total Rev. 3rd 25% Cap. 100% Total Rev. 2nd 25% 1st Plan Budget Proposals 2014-15, SSD 39 LRU (General, Ongoing) Project No. 2.3 1. Title of the project: Bengali Pronunciation Dictionary in Electronic and Printed Form 2. Brief objective and justification (2 or 3 sentences): The objective of this project is to develop a Bengali pronunciation dictionary in electronic and printed form with lexical database obtained from a corpus of modern Bengali texts. It will become a resource for research and application in applied linguistics, speech technology, language technology, and language processing. 3. Date of Commencement and Completion: April 2012 – March 2015 4. Name of the Proposing Scientist/Principal Investigator: Niladri Sk. Dash, LRU, ISI 5. Name of associated scientists with affiliation: Probal Dasgupta (LRU, ISI) 6. A brief write up on the scope and justification of the project and the proposed work (not more than half a page): The purpose of the project is to develop a pronunciation dictionary in printed and electronic form in Bengali. Total number of twenty thousand entry words will be selected from a large lexical database of frequently used lexical items collected from modern Bengali corpus. Entry words (including tatsama, tadbhava, native, local and foreign words of different part-of-speech) will be used in dictionary in their lemmatized and alphabetically sorted form. Spelling of entry words will be fixed with the proposal of Bangla Akademi, Kolkata to avoid disputes. Entry word will be transliterated in Indic Roman tagged with diacritics for end users. Accepted pronunciation of Standard Colloquial Bengali (SCB) will be adopted for entry words, and this will be presented in standard Bengali script (for those people who know Bengali script but do not know IPA) and in IPA (for those people who know IPA but do not know Bengali script). Meaning for entry word will be provided for sense disambiguation. It will be particularly useful for those homographic and homophonus homonyms (words having similar orthographic forms or pronunciation but different meanings). The speech output of pronunciation of entry words will be available both in sentence-free and sentence-bound contexts. This dictionary will be the first of its kind in Bengali. It will be corpus-based and computer-assisted with a multimedia interface. It will be useful for language learning, text-to-speech conversion, on-line language teaching, language recognition, word recognition, machine learning, machine translation, E-Governance, Bengali-English parallel sentence generation, computational lexicography, and word-sense disambiguation. It can also be useful for linguistically impaired people to train them in Bengali speech production. The beneficiaries of the resource are Bengali learners, foreign learners, language teachers, MT system developers, TTS system developers, lexicographers, language planners, speech pathologists, and cognitive linguists. 7. Item wise break up of the budget proposed (Capital & Revenue) and justification for the same (not more than 1/4 page): Items Heads Capital 2 Personal Computers 2 software for dictionary design Revenue Salary of 2 Project Assistants (15,000 X 2 X 36 = 10,80,000) Stores and stationeries Computer consumables Maintenance Total: 2012-2013 2013-2014 2014-2015 Total 100,000 20,000 - - 1,00,000 20,000 3,60,000 3,60,000 3,60,000 10,80,000 15,000 15,000 10,000 5,20,000 15,000 15,000 10,000 4,00,000 20,000 20,000 10,000 4,10,00 50,000 50,000 30,000 13,30,000 Justifications: Two (2) computers are required for executing the project and two (2) Project Assistants are required for carrying out the project work Publications Dash, Niladri Sekhar (2010) “Digital dictionary: a physical realization of virtual reality”. Proceedings of the National Conference on Emerging Trends in Educational Informatics (ETEI Prepared By: S. Malakar, Social Sciences Division’s Office 40 Social Sciences Division, ISI 2010), 23-24 December 2010, National Institute of Technical Teacher’s Training and Research (NITTTR), Kolkata, pp. 91-95. Dash, Niladri Sekhar (2010) “Utilization of language corpora in compilation of digital dictionaries for Indic languages”. Presented in the International Seminar on Tamil Computing, 24th-26th February, 2010, Linguistic Studies Unit, Dept. of Tamil Language, Madras University, Chennai, India. Dash, Niladri Sekhar (2011) “Some physical advantages of an electronic dictionary”. Indian Linguistics. Vol. 71. No. 1-4. Pp. 93-102. Dash, Niladri Sekhar (2011) A Descriptive Study of the Modern Bengali Script. Saarbrucken, Germany, Lambert Academic Publishing [ISBN: 978-3-8383-4448-5]. Dash, Niladri Sekhar (2012) “Baidyutin Bangla Abhdhan tairi karar kichu samasya”. Alochana Chakra. Vol. 32. Pp. 166-178, Baimela Sankhya, 2012. Dash, Niladri Sekhar and Pronomita Basu (2012) “Developing Scientific and Technical Terminology Database from Electronic Language Corpora”. Language Forum. Vol. 38. No. 1. Pp. 5-21. January-June 2012. Dash, Niladri Sekhar, Payel Dutta Chowdhury and Abhisek Sarkar (2011) “Digital Pronunciation Dictionary for Bengali: A Tool of the Time”. In, Sharma, Dipti Misra, Rajeev Sangal and Sobha L. (Eds.) Proceedings of the 9th International Conference on Natural Language Processing (ICON-2011), Pp. 117-124, Anna University, Chennai, India, 16th – 19th December 2011. Prepared By: S. Malakar, Social Sciences Division’s Office Plan Budget Proposals 2014-15, SSD 41 PRU (Northeast, Ongoing) Project No. 4.3 1. Title of the Project: Cognitive Processing Through PASS Model and its Role in Determining Academic Performance of School Students of North- Eastern India. 2. Brief objective and justification: The objective of the project is to find out the role of planning, attention, simultaneous and successive (PASS) processes of cognitive functioning in determining academic performance of different groups of school students of North-Eastern India. The study will help us to know strengths and weaknesses of students in particular area of PASS and its relation with academic achievement, and on that basis intervention programme like cognitive enhancement programme (Das, 2004) and / or PASS remedial programme (Das, 1999) can be introduced to improve performance of students. 3. Date of commencemen: April, 2012 4. Name of the Proposing Scientist: Anjali Ghosh, PRU, ISI. 5. Name of other Associated Scientists with their affiliation: 6. A brief write up on the scope and justification of the project and the proposed work (Not more than half a page): Planning, attention, simultaneous and successive ( PASS) processes are the essential elements of cognitive functioning. Through this cognitive assessment system of PASS, it is possible to know an individual’s cognitive strengths and weaknesses in each of the four processes of PASS. This emphasis on processes rather than abilities makes it useful for differential diagnosis like learning difficulties and attention deficit disorder and accordingly, intervention programme can be introduced to improve performance. Cognitive process based training such as PASS remedial programme (PREP) and cognitive enhancement training programme (COGENT) contain several training tasks which are aimed at improving the information processing strategies and research studies have indicated the effectiveness of the programme (Das, Mishra & Pool, 1995; Carlson & Das, 1997; Naglieri & Gottling, 1997; Naglieri & Johnson, 2000). The study is being conducted in two North-eastern states of India. Two schools (boys & girls) from one district of each of these selected states were contacted and data were collected on achievement tests and PASS processes. The second phase of the study will be conducted now. In the second phase of the study, based on the performance of the students on achievement tests, nearly 20 low achievers will be identified from each school, and this groups of students will be divided into two groups : experimental and control. On experimental group the intervention programme of PREP (Das, 1999) and COGENT (Das, 2004) will be introduced for several sessions, but the control group will not receive any training. Then after a time gap of 4/5 months both the groups will be tested again on achievement tests and PASS to find out the effectiveness of the intervention programme. Data will be analysed by using correlation, regression, ANOVA and other statistical techniques. The study will help us to know how PASS cognitive processes are related with academic performance of the students and how intervention programme help low achievers to improve their academic performance. Beneficiaries: Students, parents, teachers, counselors and educational planners. 7. .Item wise break-up of the justification for the same : budget ( 2014-15) proposed (Capital and Revenue) and Total outlay of the budget for three years: Rs. 9,50,000/-.(2012-13, 2013-14 & 2014-15) Prepared By: S. Malakar, Social Sciences Division’s Office Social Sciences Division, ISI 42 Budget for 2014- 2015 : Sr. No 1 2 3 4 5 6 7. 8. 9. 10. Item Amount (Rs.) Salary for one Project Linked Personnel - (one year) @ Rs.14,000/- per month Wages to field investigators Justification To assist in the project work 1,68,000/10,000/- Professional services / data entry /workshop Travel (airfare to N.E.States) Transport (Car hire charges) Boarding /Lodging / Field Trip Printing, Xerox, Publication Stores & Stationaries Telephone, postage, courier etc. Miscellaneous Total : 30,000/70,000/15,000/60,000/10,000/2,000/2,000/- To help while collecting data from the field For expert opinion / ideas For data collection from the field For printing questionnaires / tests / reports / papers etc. To communicate institutions with schools / 3,000/3,70,000 - 8. Brief particulars of Assets, proposed to be acquired from capital budget, should be mentioned. In case of replacement, particulars of the asset to be condemned : N A 9. 9.List of all projects undertaken by the proposing scientist in the last five years : Sl. No 1 2 3 4 Project / research Undertaken Ego-identity status during Adolescence and Early adulthood. (2006-08) P.I. Status Money budgeted Money spent Completed 2,39,000/- 2,03,000/- Improvement upon Management Entrance Test using Item Response Theory (IRT). (2006) P.I. With Prof. A. Chowdhari, Dr. R. Gupta &Mr. S.K. Mitra. Of ASRC Emotional Display Rules & Personality Pattern Across Different Groups of Individuals. (2008-11) P.I. Completed (Externally funded) 2,00,000/- 1,67,000/(approx.) Completed 4,81,000/- 4,35,000/(approx.) External Evaluation of Special Adult Literacy Programme of Tripura (2010-11) – P.I. Completed All the expenditure incurred by the Government of Tripura Publications Report submitted. One paper published in a journal & one paper published in Conference Proceeding. Report submitted. Report submitted. Two papers presented in International Conferences and one paper published in an International journal. Report Submitted Publications from various projects during 2008 - 2012 Ghosh, A. - Academic Self-Efficacy and Achievement in a Group of siblings of Primary Schools. Psychological Studies, 2007, Vol.52, No.4, 364-371. Karmakar, R. & Ghosh, A. – Moral Development of Female Students of North-Eastern Region of India. In Gassah, L.S.(Ed.) Women Empowerment Movement In North-East India. Omsons Publications, New Delhi, 2008, 228-244. Basak, R. & Ghosh, A. – Ego-Identity Status and Its relationship with self-esteem in a Group of Late Adolescents, Journal of The Indian Academy of Applied Psychology, 2008, 34, 2, 337-344. Ghosh,A. – Transactive Memory, Self-Construal and Subjective Well-Being in a Group of Indian Couples, Interpersona, 2008 ,2 (2) 173-192. Prepared By: S. Malakar, Social Sciences Division’s Office Plan Budget Proposals 2014-15, SSD 43 Karmakar,R.; Ghosh, A. & Dewanji, A.- On Some Determinants For distributive Justice in Children : A Study Based on Three States of India, Calcutta Statistical Association Bulletin,2008,60 (239-240),255-275. Basak, R. & Ghosh, A. – Relation of Parental Education and Occupation with Mathematics Selfefficacy and Achievement of Students, Journal of Education and Psychological Studies, 2010, 4(1), 1-7. Ghosh, A. – Expressive Differences for Emotions In Visually Challenged and Normal Individuals, International Journal of Arts and Sciences, 2010, 3(15), 255-265. Ghosh, A- Ego- identity Status in Different Groups of Late adolescents. In P.Singh, P. Bain, Chan-Hoong. Leong, G. Misra,& Y. Ohtsubo (Eds.) Identity, Multiculturalism & Changing Societies, Progress in Asian Social Psychology Series,2011, Vol.8, 95-108, Mac Milan Publishers. 12. Expected date of completion: March, 2015 13. Quarterly projection of Expenditure during 2013-14 Rev. 40,000 1st C Total a p 40,000 2nd C Total a p 80,000 80,000 Rev. Rev. 3rd C a p 1,10,000 Total Rev. 1,10,000 1,10,000 4th C a p Total 1,10,000 Total C Total a p 3,40,000 3,40,000 Rev. 14. For General Projects only (ongoing) : N.A. 15. For General Projects only (New) : N.A. 16. For North- East Projects only (ongoing): Proposed budget for Total budget Amount Total outlay Physical progress in 2013-2014 ( in Lakhs) allocation till spent till (proposed) for terms of percentage 31.03.2012 31.03.2012 Twelfth Plan (2012- (%) as on 31.03.2012 2017) Financial progress in terms of percentage (%) as on 31.03.20012 Revenue Capital Total 3.40 3.40 N.A. N.A. 17. For North- East Projects only ( New ): N.A Prepared By: S. Malakar, Social Sciences Division’s Office 9.50 N.A. N.A. 44 Social Sciences Division, ISI PRU (General, Ongoing) Project No. 4.4 1. Title of the Project: Differential validity of Computer programming abilities. 1.1 Short term: DVC 2. Brief objective and justification (2 or 3 sentences): Objective of the study is to examine differential validity of computer programming abilities. Findings will help to (a) validate existing ability test battery, and to (b) provide knowledge about differential pattern of computer programming abilities and validity coefficients across demographic variables (sex, region, socioeconomic status). The findings will be used for career counselling and guidance for the students aspiring computer programming profession. 3. Date of Commencement and end: April, 2012-2015 4. Name of the Proposing Scientist or Principal Investigator : Debdulal Dutta Roy, Psychology Research Unit, ISI, Kolkata. 5. Name of other associated Scientists with & their affiliation: Professor Manjula Mukerjee, Director, Indian Institute of Psychometry. Professor Manas Mondal, Director, Defence Institute of Personnel Research, Delhi. Dr. Gurpreet Kaur, Scientist, Defence Institute of Personnel Research, Delhi. 6. A brief write up on the scope and justification of the project and the proposed work (not more than half a page): The most critical question in test validation is test invariance across different demographic groups (race, ethnicity, sex, socio-economic status). This topic of research is commonly called differential validity. Differential validity has gained greater prominence now–a-days as the validity coefficients or the magnitude of correlation coefficients between test score and the criteria vary with different demographic groups. Current study aims at examining differential validity of reasoning related computer programming abilities where in the criteria will be academic achievement as well as programming achievement scores. Programming abilities will be assessed by modification of some items through existing computer programming aptitude test battery. In 2012-2013, items for measuring five computer programming related reasoning abilities (similarities, anagram, syllogistic reasoning, data sufficiency and coding) were constructed and psychometric properties of the tests were evaluated. Each subtest is suitable for the students of grade 8-10. Results show moderate level of item difficulty for lower order reasoning and high level of item difficulty for higher order reasoning tests. Each subtest has good internal consistency and the test scores are significantly related with academic achievements. Test invariance across different demographic conditions was noted. In 2013-2014, Differential validity of five subtests will be examined through multi stage stratified random sampling procedure. 7. Method: Participants: Multi stage stratified random sampling will be followed in sample selection. Data will be collected from 400 students in computer programming (50 students X 2 achievers (high and low achievers) X 2 genders (male and female) X 2 regions (urban and semi-urban)). Measures: (a) Introductory schedule: It will be used to understand age, sex, educational qualification, locations, years of experience in computer programming, socio-economic conditions etc. (b) Computer programming ability test battery: It assesses relatively most important computer programming abilities. (c) Standardized ability tests for correlating the ability subtest scores. Prepared By: S. Malakar, Social Sciences Division’s Office Plan Budget Proposals 2014-15, SSD 45 (d) Standard computer programming achievement test: This will be developed to control extraneous factors on achievement test performance. Statistical Analysis: Relevant multivariate statistics (Principal component analysis, Correspondence analysis, MANOVA, Multiple regression) will be used to (a) assess latent structure of programming abilities if the abilities are correlated; (b) determine main and interaction effect of region, gender and socio economic status on programming abilities and programming achievement and to (c) determine magnitude of differences in correlation coefficients between test scores and criteria. Project Beneficiaries: School Education School Psychologists Computer training institutes Career counsellors Psychology counsellors 8. Item wise breakup of the budget proposed (Capital & Revenue) and justification for the same (not more than 1/4 page): Item Rs. 1. Remuneration to Project linked personnel @ Rs. 12000 X 12 1,44,000 months. 2. Costs for car hire including local journey for investigators. 50,000 3. Costs for boarding/lodging. 20,000 4. Data scrutiny and entry 20,000 5. Computer consumables, Stationary, Xerox, printing, postal 20,000 charge, telephone charge etc. 6. Project report typing, binding 15,000 7. Miscellaneous 10,000 Total: Two lakhs seventy nine thousand only. 2,79,000 Justification Assisting in overall activities. School sampling. Field work, library visit. Data collection from remote places It will be entered through computer. To print questionnaire and communication. Reporting. Emergency condition in field work. 9. Brief particulars of Assets, proposed to be acquire from Capital Budget, should be mentioned. In case of replacement, particulars of the asset to be condemned (e.g., Year of Purchase, Cost) : NA 10. List of all ongoing projects undertaken by the Proposing Scientist in the last 5 years and for each, give (i) Status Money budgeted, (iii) Money spent, (iv) Publications (if any). : Title Differential Validity of Computer Programming Abilities (2012-2015) Status Ongoing Money budgeted 1,20,000 Money spent 1,11,148 Publications 0 Workshop on Application of Reliability statistics in Psychological Research (2011-2012) Self-efficacy of Agricultural farmers (2009-12) Orientation training on questionnaire design for psychological and educational researches (2008-09) Attitude towards school infrastructure in rural areas (2007-08) Completed 80,000 61,675 2 Completed 5,97,000 4,06,086.10 1 Completed 2,15,000 35063 1 Completed 1,17,000 84446.22 1 Prepared By: S. Malakar, Social Sciences Division’s Office Social Sciences Division, ISI 46 11. Expected date of Completion : March, 2015 12. Quarterly projection of Expenditure during 2014-2015: 1st 2nd Rev. Cap. 25% Total Rev. 25% 25% 3rd Cap. Total Rev. 25% 25% 4th Cap. Total Total Rev. Cap. 25% 25% Total Rev. 25% 100% Cap. Total 100% 13. For General Projects only (On-going): Proposed budget for 2014- Total budget Amount Total outlay 15 allocation till spent till (proposed) for 31.03.2013 31.03.2013 Twelfth Plan (2012– 2017) Rev. Cap. 2,79,000 Physical progress in terms of percentage (%) as on 31.03.2013 Financial progress in terms of percentage (%) as on 31.03.2013 25% 92.62% Total 2,79,000 1,20,000 1,11,148 6,70,000 14. For General Projects only (New) : Not Applicable 15. For North-East Projects only (On-going) : Not applicable 16. For North-East Projects only (New) : Not applicable List of all scientific papers published in journal over the last 5 years (2008-12) Dutta Roy, D., Ghosh,S. and Rahman, F.H. (2012).Perceived Environmental Uncertainty in Crop cultivation in West Bengal: Agro Psychological Counselling Perspective. Indian Journal of Psychology. Special issue, January, 111-120. Dutta Roy,D.(2011).Construct validity of Reading motivation. Journal of the Indian Academy of Applied Psychology, vol.37,No.1, 106-113. Roy,A. and Dutta Roy,D.(2010). Predicting cash flow of Sarva Shiksha Abhiyan in West Bengal : An exploratory study of public finance. Journal of Management research in Emerging economics. Vol.1.1. 60-69. Dutta Roy,D.(2010).Cluster Analysis for Test-Retest Reliability. International Journal of Psychological Research , 3,1,132-140. (published from USA) Dutta Roy, D. (2009) - Construct validity of writing motivation questionnaire. International Journal of Psychological Research , 3,2,6-11 (published from USA) Dutta Roy,D.(2009). Self-efficacy of Agricultural farmers:A case study. Journal of the Indian Academy of Applied Psychology, 35, 2, 323-328. Dutta Roy, D. (2008). Assessing Validity of Web-Based Computer Adaptive Training Modules, Journal Of The Indian Academy of Applied Psychology, Vol. 34, No.1, January, 127-136. Prepared By: S. Malakar, Social Sciences Division’s Office Plan Budget Proposals 2014-15, SSD 47 PRU (General, Ongoing) Project No. 4.5 1. Title of the Project: Parenting styles and academic achievement of the school students. 2. Brief objective and justification: Academic achievement of school students depends on a host of factors including students’ parenting styles. Available questionnaires on parenting styles are mostly developed in western countries. Need is felt to develop a parenting style questionnaire to suit the local context. The objective of the study is to ● develop a parenting style questionnaire in the 1st year considering local situation. To find relationship between parenting style and academic achievement (last annual examination marks) in the 2nd year. The study will help to inform the teachers and parents in promoting a better understanding parenting style differences in their students and how do teachers or parents help students to earn a high/good grade in school. 3. Date of commencement: April, 2013. 4. Name of the proposing scientist: Rumki Gupta, Psychology Research Unit, ISI. 5. Name of other associated scientist with their affiliation: Prof. S. N. Chakrabartty, Ex - Director (R&D), Indian Maritime University, Kolkata Campus and Professor of Galgotia University, Noida, Delhi. 6. A brief write up on the scope and justification of the project and the proposed work: Parents have the main responsibility for socializing their children and thus parents cannot avoid having an impact on their children's personality and character. This study will discuss the conceptualization of parenting in a new fashion. Till date we are concerned with the four different parenting styles defined by Baumrind (1960) and Maccoby and Martin (1983) and the effects of different parenting styles on children's behavioral adjustment and academic achievement. Studies regarding above mentioned parenting style were conducted with a sample from the western countries. On the other hand, very rare studies have been done which showed the relationship between parenting styles and academic achievement in our country rather in our state also. Therefore, it is not clear whether such relations would be consistent in our state. So the current study is being undertaken. In this connection works will be done in the 1st year: ---- Literature review (Sociological, Anthropological and Psychological aspects) of parenting style. ---- Exploratory research will be undertaken through open ended questions to be administered among the parents primarily to identify relevant factors of parenting style. ---- to explore the possibility of variation of such factors in terms of number and intensity, the questionnaire for exploratory research will be different for male child and female child. It is proposed to administer the questionnaire to both the parents. Separate questionnaire will also be prepared for administration to the children to elicit children’s view about relevant factors like parental authority, disciplinary practices, permissiveness, authoritative /flexible etc. Three questionnaires(two parents and one for children) will be administered/interviewed to a small sample of parents and children in one rural area and in one urban area. ---- Content analysis will be undertaken to identify the factors of parenting style and their relative importance considering both point of views of parents and children. Based on the above, a parenting style questionnaire will be developed with Likert type items to suit the local condition. ----- The items chosen (approximately 30 items) will be distributed to a group of experts requesting them to ● indicate their preference for each pair of items (total nc2 no. of pairs in case of n items). ● suggest changes in wording of items, if any ----- based on the responses from the experts paired comparison test will be used to find scale value of each finally selected items. These scale values will be used subsequently for scoring parenting style questionnaire. Prepared By: S. Malakar, Social Sciences Division’s Office Social Sciences Division, ISI 48 ----- Reliability of Parenting style questionnaire will be measured through split half reliability or Chronbach α ----- Validity through suitable method In the 2nd year impact of parenting style on academic achievement will be observed. The objective of the study in the 2nd year is to see the impact of students parenting style on academic achievement. The study will help to inform the teachers and parents in promoting a better understanding personal and learning style differences in their students (Horton and Oakland, 1996) and how do teachers or parents help students to earn a high/good grade in school. Sample: In the 1st year exploratory research will be done covering about 30 families. Around 25 experts will be selected to whom items will be given for their opinion. In the 2 nd year the study will be conducted on about 320 class VIII students selected from two districts in West Bengal. Multistage simple random sampling scheme without replacement (SRSWOR) method will be followed in this study. In the first stage out of 19 districts, 2 districts will be chosen. In the next stage, two regions i. e., rural and urban will be selected from each of the chosen districts. In the next stage, four schools (2 boys and 2 girls) from each of the selected regions will be chosen by SRSWOR. Finally, 20 students (chosen by SRSWOR) studying in class VIII from each of the selected schools will be selected for this study. Instruments: Few scales and inventories to be reviewed to find suitable instruments to measure Parenting style questionnaire (through suitable questionnaire which will be developed in the 1st year of the project duration) Academic Achievement – Annual examination marks obtained by the students in Bengali, English, Mathematics and Science). Biographical questionnaire After collecting data appropriate analysis will be undertaken. Beneficiaries: Students, teachers and parents References: Baumrind, D. (1966). Effects of authoritative parental control on child behavior. Child Development. 37. 887-907. Dishion, T. J. (1990). The family ecology of boys' peer relations in middle childhood. Child Development. 61. 874-892. Maccoby, E. E., & Martin, J. A. (1983). Sociahzation in the context of the family: Parent child interaction. In P. H. Mussen (Series Ed.) & E. M. Hetherington (Vol. Ed.), Handbook of child psvcholo^- Vol. 4. Socialization, personality, and social development (pp. 1-101). New York: Wiley. 7. Item wise break-up of the budget proposed (2014-15) and justification for the same : Total outlay for the project for two years: Rs. 6.15 lakhs (2014-15) Budget for 2014-15 Sr. No 1 2 3 Item Amount (Rs.) Justification Salary for one Project Linked Person for 12 months @ Rs.14.000/-per month Professional Services/Workshop Travel in & around Kolkata, different districts of West Bengal and Noida, Delhi 1,68,000.00 To perform various types of works of the project, one project Assistant is required 20,000.00 For opinion from the specialized person 40,000.00 In and around Kolkata, Different districts in West Bengal and visit to Galgotia University, Noida, Delhi, to discuss the project with Prof. S.N.Chakrabartty,Associated Scientist Prepared By: S. Malakar, Social Sciences Division’s Office Plan Budget Proposals 2014-15, SSD 49 4 Transport 24,000.00 5 20,000.00 30,000.00 Required for project work. 7 Boarding / Lodging / Field Trip Procurement of Psychological Test/Scale Printing, Xerox, publication Charges for Car hire, bus, auto, rickshaw etc. in Kolkata and outside Kolkata For outside Kolkata 15,000.00 8 Stores and Stationary 1,000.00 For Printing of schedules, papers , reports etc. For handling and keeping the records. 9 Telephone and postage 1,000.00 10 Miscellaneous 1,000.00 6 Total : 3,20,000.00 For communication with school authorities, school education board etc. Unforeseen This amount will be increased due to 20% increment towards price escalation 8. Brief particulars of Assets, proposed to be acquired from capital budget, should be mentioned. In case of replacement, particulars of the asset to be condemned : Nil 9. List of all ongoing projects undertaken by the proposing scientist in the last 5 years: Sr No 1 2 3 Name of the project Self assessment and its relationship with academic achievement and achievement motivation among Secondary level School Students(2007-09) Bullying in school and its effect on the behavioural aspects of the school students (2009-11) Personality profile, stress and job satisfaction of Indian sea farers (2011-13) Status Money budgeted (Rs.) Money spent (Rs.) Completed 2,25,000/- 1,73,000/(approx.) Completed 2,92,000/- 2,80,000/(approx.) Completed 4,10,000/- 3,09,890/(approx.) publications Project report submitted. One paper has been published as a book chapter and two papers have been published in Journal. One paper sent for publication. One lecture delivered in Budapest, Hungary Project Report submitted. Two papers presented in National conference and one paper published in conference proceeding. One paper sent for publication in journal. Publications from various projects during 2008-12 Gupta Rumki and Panja Sanghamitra (2008-2009) - Gender and Religion Bias on the Academic Achievement of the students of Class X Level, Journal of Education and Psychology, 65, 1- 4, 17 29. Gupta Rumki (2010) - Empowerment and Gender Difference in Education Status. Delhi Business Review, 11, 1, 55 - 60. Gupta Rumki (2010) - Opinion Survey on Curriculum, Performance in Madhyamik Vis-à-vis Higher Secondary Level. Gorakhpur Social Scientist, 1, 2, 20 - 28. Gupta Rumki and Dhara Jayeta (2010) - Dimensions of Self-Concept: A Factor Analytic Study. Indian Journal of Social Science Researches, 7, 2, 92-99. Gupta Rumki and Dhara Jayeta (2011) – Nature of Involvement of Self-concept, Academic Achievement and Achievement Motivation of Girls in Comparison to Boys in Urban West Bengal. Gender Deprivation and Empowerment of Women an Indian Perspective: Concepts, Issues and Challenges, Utpal Kumar De and Bhola Nath Ghosh (Eds.). LAP LAMBERT Academic Publishing GmbH & Co. KG, Saarbrucken, Deutschland, Germany. Prepared By: S. Malakar, Social Sciences Division’s Office Social Sciences Division, ISI 50 Gupta Rumki (2012) - Gender Disparity in Madhyamik Examination Result. Gender Issues and Empowerment of Women, Manoranjan Pal, Prasanta Pathak, Premananda Bharati, Bholanath Ghosh and Amita Majumder (Eds.). Nova Science Publishers, Inc. New York 246 - 256. Gupta Rumki and Dhara Jayeta (2012) - Fluctuation of Reliability with change of Response Categories in A Questionnaire, Proceedings of the National Conference on Psychological Measurement: Strategies For The New Millennium, Suhas Shetgovekar (Ed.), Discipline of Psychology, School of Social Science, IGNOU, New Delhi, 126 - 132. 10. Expected date of completion: March, 2015 11. Quarterly projection of expenditure during 2014-15: 1st Rev. C 75,000 2nd Total Rev. C 3rd Total Rev. 4th C Total Rev. C Total Total Rev. C a a a a a p p p p p - 75,000 85,000 - 85,000 1,000,00 - 1,000,00 60,000 - 60,000 3,20,000 - Total 3,20,000 12. For General Projects Only (Ongoing) Proposed budget for 2014-15 Rev. 3.20 13 – 15. Cap. - Total 3.20 Total budget allocation till 31.03.13 Amount spent till 31.03.13 Total outlay (proposed) for Twelfth Plan (2012-17) Physical progress in terms of percentage (%) as on 31.03.13 Financial progress in terms of percentage (%) as on 31.03.13 NA NA 6.15 - - N.A Prepared By: S. Malakar, Social Sciences Division’s Office Plan Budget Proposals 2014-15, SSD 51 SRU (General, On-going) Project No. 5.1 1. Title of the Project: Data Gap in Gender Statistics: Women in Mining Industry 2. Brief objective and justification: Data on number of miners in India is collected by Annual Survey of Industries, Director General of Mines Safety, and Indian Bureau of Mines based on returns submitted by the mining companies (both public and private). On the other hand, based on household data number of miners is also available from population censuses and National Sample Survey Organisation’s (NSSO) employment-unemployment surveys. Amongst these agencies, Indian Bureau of Mines does not provide male female distribution of miners. The purpose of this project is to evaluate gender gap in official statistics relating to the number of miners and their wages in India. 3. Date of commencement: April 2012. 4. Name of the proposing scientist or principal investigator: Molly Chattopadhyay 5. Name of other associated scientists with their affiliation. Prof. Madhura Swaminathan, EAU, ISI, Bangalore; Sonali Chakraborty, Associate Scientist ‘A’, SRU, ISI, Kolkata 6. A brief write up on the scope and justification of the project and the proposed work: Mineral wealth and its exploitation have substantially contributed to the growth of Indian national economy. Mineral production has increased from 42 million ton in 1951 to 1078.19 million ton in 2008 (DGMS, 2010). Despite the increase in mineral production, there are discrepancies in the number of mines and employment data. While Indian Bureau of Mines report number of operating mines as 2928 in 2010-11, DGMS reports it as 2557 and Mininstry of Mines reports it as 2628 for the same period. Ministry of Labour portrays the number of miners as 82 thousand (2009-10), DGMS shows 575 thousand, and Indian Bureau of Mines shows the number of miners as 521 thousand. Whereas as per Census, number of miners in India is 1711 thousands in 2011, an increase by 50% from 1137 thousands in 1991. But NSSO shows that there is increase by 26% in the number of miners from 1999-2000 to 2009-10. However, there is not much recorded involvement of women’s participation in the formal mining industry in India. As per Director General of Mines Safety (2010), male workers comprise 95% of total workers as against 5% of female workers. On the contrary, census of India (2011) reveals that there are 81% male workers and 19% female workers in mining and quarrying sector. While DGMS, ASI, NSSO provide male-female distribution of workers, IBM does not provide the break-up. The proposed project seeks to address the degree of differences in the data collected by different agencies. Secondly, the project tries to find out gender gap in baseline statistics in the mining sector. Lastly, the project intends to make gender statistics related to an approximation of employment size and wage pattern in the mining sector. 7. Item wise break-up of the budget proposed (2012-15) and justification for the same: Sr. no. 1 2 Item Amount Capital 1.Two field investigators @ Rs.400/-per day one year 0.00 2,40,000 3 One project personnel @ Rs.5000/- for 6 months Purchase of data and reports Travel 30,000 For data entry 50,000 Procurement of official statistics 1,1 5,000 Collection of data from different parts of India including field visits and attending seminars, conference related to the project Printing, photocopying & publications Contingency Total 25,000 4 5 6 7 8 30,000 4,90,000 Prepared By: S. Malakar, Social Sciences Division’s Office Justification 1.To collect official statistics from different Mining Offices Social Sciences Division, ISI 52 8. Brief Particular of Assets, proposed to be acquired from capital budget, should be mentioned in case of replacement, particulars of asset to be condemned: N.A. 9. List of all ongoing projects undertaken by the proposing scientist in the last 5 years: N.A. 10. Expected date of completion: March, 2015 11. Quarterly projection of expenditure during 2014-15: 1st 2nd Rev. Cap. Total 40,000 Rev. 3rd Cap. 50,000 Total Rev. 4th Cap. 60,000 Total Rev. Total Cap. 1,00,000 Total Rev. Cap. Total 2,50,000 12. For General Projects Only (ongoing) Proposed Budget For 2014-15 Rev. Cap. 2,50,000 13. 14. 15. 16. Total Budget allocation till 31.3.13 Amount spent till 31.3.13 Total outlay proposed for twelfth plan 2012-17 Physical progress in terms of % as on 31.3.13 Financial progress in terms of % as on 31.3.13 Total For general projects only (new) For North-east projects only (on-going) For North-east projects only (new) Ranks to be given by the division List of important Scientific Papers published in Journal over the last Five years Publications (20082013) Chattopadhyay, Molly, Sonali Chakraborty and Richard Anker. “Sex Segregation in India’s Formal Manufacturing Sector”, International Labour Review. Vol. 152/1, March 2013, Pp: 4358. Chattopadhyay, Molly: “Women Workers in the Mica Industry: A case study”, Indian Journal of Gender Studies, October 2011, 18:311-340 (Sage publications). Chattopadhyay, Molly & Sonali Chakraborty: “Liberalization and Segregation: Changes in the Pattern of Segregation in the Factory Sector from 1989-90 to 2000-01”, Crossing the Borders, Vol.2, 2009, Pp. 91-98. Chattopadhyay, Molly: Women Workers in Mica-Manufacturing Industry of Giridih, Jharkhand. In Artisanal and Small-Scale Mining in Asia-Pacific Case Study Series, Case study No. 2. edited by Joel Katz. 2007. Website http://www.asmasiapacific.org/ asm_case.php Chattopadhyay, Molly: “Sub-Contracting System and Women Workers: A Study of Mica Manufacturing Industry of Jharkhand”, Sociological Bulletin. Vol.56, No. 2, May-August 2007, Pp. 289-307. Conference: Chattopadhyay, Molly: paper presented on “Women Miners of India: Gender Wage Gap” in the session ‘Women, Poverty and the Struggle for Survival’, RC32 Research Committee Women in Society, Second Forum of Sociology, International Sociological Association held in Buenos Aires, Argentina 1st to 4th August 2012. Prepared By: S. Malakar, Social Sciences Division’s Office Plan Budget Proposals 2014-15, SSD 53 SRU (General, On-going) Project No. 5.2 1. Title of the project: Migration, social network and their impact on the rural households of Jharkhand. 2. Brief objective and justification: It has been observed in various studies that migration has brought both positive and negative impacts on the socio-economic conditions in the village scenario. In one hand, migration helps (i) to increase the standard of living of the migrants, (ii) to generate the possibility of investments and savings, and (iii) to slacken the power grasped by the upper-caste land-owners (Choudhuri, Bandyopadhyay and Jana, 2006). On the other hand, (i) the income from migration may not be sufficient to balance the excessive expenditure in market products newly adopted through migration, like introducing of catering and decoration in festivals, use of luxurious goods, etc. (Choudhuri, Bandyopadhyay and Jana, 2006); (ii) at peak period of cultivation, there is a shortage of labour due to out-migration and, as a result, it creates negative labour impact on production (Taylor and Dyer, 2006); and (iii) migration contributes to increase in the incidence and spread of different contagious diseases. There are broadly two kinds of migration, like permanent and temporal. The present study will cover seasonal and other temporal out-migration from the rural Jharkhand. A social network is defined as an articulation of ties of a social relationship among social units, like persons, households, organizations etc. which are called actors and the ties are links between the actors. Different types of social relations identify different social networks, even when imposed on the same set of social units. It may be cited examples on social networks like friendship network, kinship network, marriage network, etc, (Moreno 1934, 1956; Barry Wellman 1997; Rao 1995). In a society, there exists, no doubt, involuntary ties of relationship as for example, relationship by kinship, caste and religious or community affiliation. But ties are also established voluntarily, and they may be identified empirically, such as, ties of friendship or individuals spending leisure time together, making social visits, attending invitations on the occasion of a family ceremony or household festival, extending help and support to a household at the time of an urgent need, etc. (Bandyopadhyay, Rao and Sinha, 2010). The present study will be opened to cover the both types of ties among the households in a village so that it can be studied which type of ties facilitate what type of migration and vice-versa. Caste-based relations help in migration of migrants (De Hann, 2003) and flow of migration is occurred through household level networks (Palloni et al., 2001). Rao and Bandyopadhyay (1987) have studied the impact of migration on reciprocity of a village social network. Besides migration through the networks of kinship, community affiliation and friendship, migration may occur through other intermediaries having self-sustaining structures largely created by migration processes themselves. These are travel agents, lawyers, bankers, labour recruiters, brokers, interpreters, housing agents as well as human smugglers and traffickers (Castles 2004). All these agents have an interest in continuing migration, and for many facilitating aspects migration is a major business (Salt and Stein 1997). In the context of seasonal and other temporal out migration in rural Jharkhand, the proposed research project attempts (i) to investigate how the migratory channel is opened, and how social network and migration are affected by each other and (ii) to study the positive and negative impacts of migration on the households and the pattern of relational ties among them. 3. Date of commencement: 1April, 2013 4. Name of the Principal Investigator: Dr. Rabindranath Jana, SRU, Kolkata 5. Name of other associated Scientists: Prof. Debapriya Sengupta (ASU), Dr. Anil Kumar Chaudhuri (SRU, Giridih), Dr. Tirthankar Ghosh (SRU), Shri Dipankar Sen (SRU), Shri Kamalaksha Das (SRU). In addition, Dr. Prabir Ghosh Dostidar (Scientist / Director, Ministry of Earth Sciences, Govt. of India, New Delhi) and Dr. R. Maruthakutti (Associate Professor, Department of Sociology, Manonmaniam Sundaranar University, Tirunelveli, Prepared By: S. Malakar, Social Sciences Division’s Office 54 Social Sciences Division, ISI Tamil Nadu) have kindly agreed to give their expertise in the project context as and when required. 6. Scope, justification and proposed work: Scope and Justification: There are several studies on migration in the literature. Caste identity plays an important role in the personal ties that mediate the migration of the migrants (De Haan, 2003). Family ties and networks have a positive impact on the flows of migration (Palloni et al., 2001; Ma, 2002; Poros, 2001). Social and cultural changes of the migrant families are observed in anthropological studies on migration (Watkins, 2003; Choudhuri, 1992, 2002; Rogaly, 2003 on West Bengal; Kabki and Appiah, 2003 on rural families of Holland-based migrants in Ashanti Region of ghara). Migration can play innovative roles in introducing new method of cultivation, such as double cropping (De Haan, 2001). The migration outcomes help to improve education and health care (de Haan, 2000; Skeldon, 1997; Rogaly, 2003). De Neve (2003) and De Haan(2003) have observed that migration may help to change the occupation of the migrants. There are several studies on negative impact of migration on households with respect to different dimensions like incurring excessive expenditure to household budget (Choudhuri, Bandyopadhyay and Jana, 2006); facing labour shortage at peak period of cultivation (Taylor and Dyer, 2006); increasing incidence and spread of different contagious diseases; and so on. Here, in case of rural Jharkhand, the present study will lead to investigate (i) how social network and migration facilitate each other; (ii) how groups are formed among the migrants and whether there is any link between the groups; (iii) to what extent migration has created extra income and how it is invested in agriculture, health care of the family members and education for the children; and (iv) how new social/cultural ideas are adopted through migration and whether they are diffused through social network to some extent (Jana, 2011). From the above study, it would be known how social networks contribute to generate migration in rural Jharkhand. Also, it would be focused how and to what extent the migration helps to change the village scenario with respect to socio-cultural as well as agro-economic aspects. As a result, the present conditions of rural Jharkhand will be reflected to some extent. Besides, the study has an interdisciplinary relevance in the sense that it comprises the disciplines statistics, mathematics and sociology and across these disciplines, the study may also explore possible areas for further research. Methodology: It has been observed earlier that the district of Giridih in Jharkhand suffers from economic deterioration. Also, in 1960, Indian statistical Institute undertook an in-depth study on social transformation in the villages within 20 mile radial distance around the town of Giridih as the nodal centre, which may help in our proposed study (Bandyopadhyay et al. 1997). Because of these backdrops, the district of Giridih has been chosen for our study. In this district, the blocks Giridih and Bengabad are mainly based on agriculture and are less politically disturbed compared to the other blocks. In addition, during the earlier study by Choudhuri, Bandyopadhyay and Jana (2006), some extent of rapport has already been built up in the two blocks. That is why, Giridih and Bengabad blocks are selected for our study. Two villages from each selected block will be selected on the basis of the following features: (i) size of each village would be around 250 households of multi-castes having agriculture as principal source of livelihood; and (ii) there will have larger number of migrant households to be collected from the local resources. Since, in addition to relevant composite variables, social network data are also needed for the present study, a complete enumeration method will be adopted here for household level study from each selected village. There will have two phases of data collection. In the first phase, household listing with basic information and collection of relevant village level information (like migration history, transport communication, etc.) from knowledgeable persons will be made for each selected village. In the second phase, main data through questionnaire schedule will be collected from all households of each selected village and the respondent will be the most knowledgeable person/s of the household (Bandyopadhyay, Rao and Sinha, 2010; NSSO Report64th Round; Hutman 2007; Carleto and Brauw 2009). The schedule consists of the following information: (i). Demographic aspects of the family; (ii) Occupation pattern of the family; (iii) Level of literacy; (iv) Landholding pattern; (v) Prepared By: S. Malakar, Social Sciences Division’s Office Plan Budget Proposals 2014-15, SSD 55 Agricultural practice and irrigation system; (vi) Total man-days of work done in the villages; (vii) why, when, how, and where the member of the family has migrated out from the village during the last year ?; (viii) what is the nature of his work, the duration of work, the amount of earnings etc.; (ix) remittances received during the last year and nature of its uses; (x) (for measuring impact of migration as per households’ perception) ‘before and after migration’ information on poverty (and financial assets), housing, health, education, etc. to be collected by recall method (Hutman 2007; Casale and Posel 2006); (xi) who approaches whom for getting help at any crisis during last 5 yrs.? (Rao and Bandyopadhyay, 1987), how many times in which year ?, what relation to whom?, what purposes served?, etc. and so on. It is mentioned that few information items will not be applicable to the non-migrant households. We would also gather relevant information through group discussion. First of all, both the qualitative and quantitative data, thus collected, will be converted into electronic version. Then both qualitative and quantitative (statistical and graph theoretic techniques) approaches will be undertaken to analyse the collected data for understanding the impact of migration on the different socio-economic and cultural aspects (e.g., poverty, health, education etc.) on the basis of relevant collected information before and after migration as per households’ perception; relation between the patterns of migration and social network characteristics (e.g., reciprocity, reachability, fragmentation, hierarchiness, assortativity) by using the correlation and regression analysis techniques; and so on. Plan of work: In first year, the following works (i) literature review; (ii) collection of relevant official data from local sources; (iii) relevant village level information; (iv) village selection; (v) listing of households of each selected village with basic information; and (vi) preparation of main questionnaire schedule and its testing will be done and in second year, (i) data collection on main questionnaire schedule and group discussion; (ii) scrutiny of data and data computerisation; and (iii) analysis and report writing will be completed. 7. Item wise break up of the budget proposed (only Revenue): Financial requirement: Grand Total Outlay : Rs. 4,20,000.00 b) Proposed budget for 2013-2014 : Total outlay : Rs. 1,85,000.00 Revenue expenditure: i) TA, DA & local hired transport : Rs. 90,000.00* for field visits and different offic ii) Local field Investigators : Rs. 40,000.00* (4 persons x 2 months x Rs. 5000.00 = Rs.40,000.00) iii) Data entry : Rs. 15,000.00 iv) Contingency (Stationary, printing, : Rs. 40,000.00 Xerox, computer consumables, books, journals, etc) Total : Rs.1,85,000.00 Capital expenditure : Nil b) Proposed budget for: 2014-2015: Total outlay : Rs. 2,25,000.00 Revenue expenditure: i) TA, DA & local hired transport : Rs.1,00,000.00* for field visits and different offices ii) Local field Investigators : Rs. 60,000.00* (4 persons x 3 months x Rs. 5000.00 = Rs.60,000.00) iii) Data entry : Rs. 25,000.00 iv) Contingency (Stationary, printing, : Rs. 50,000.00 Xerox, computer consumables, books, journals, etc) Total : Rs.2,35,000.00 Capital expenditure : Nil Grand Total : Rs. 4,20,000.00 Revenue expenditure for 2013-2014 : Rs. 1,85,000.00 Revenue expenditure for 2014-2015 : Rs. 2,35,000.00 Prepared By: S. Malakar, Social Sciences Division’s Office Social Sciences Division, ISI 56 [* Out of the total budget, the maximum is incurred in connection with field works due to the following reasons (i) remoteness of the selected villages; (ii) poor communication system and transportation problems; and (iii) existence of political disturbance (though comparatively less).] 8. Assets: None 9. Projects in last five years: Not applicable 10. Expected date of completion: 31 March, 2015 11. Quarterly projection of expenditure during 2014-2015: 1st 2nd 3rd 4th Year Rev. Total Rev. Total Rev. Total Rev. Total Rev. Total 50000/- 50000/- 80000/- 80000/- 60000/- 60000/- 45000/- 45000/- 235000/- 235000/12. For general projects only (on-going): 13. For general projects only (New): Not applicable 14. For North-East project only (on-going): Not applicable 15. For North-East project only (New): Not applicable Research contributions of Dr. R. Jana in the field Published /Accepted/Submitted R. JANA (2012). Lecture Note On Social Networks: formation, data and few analytic techniques. In the ‘Workshop on Social Networks’, jointly organized by Institute of Mathematical Sciences, Chennai and Indian Institute of Technology, Madras, during 20-24 February, 2012. website DOI: http://www.imsc.res.in/~sitabhra/meetings/socialnetwork0212/talks/Rabindranath_Jana.pdf R. JANA (2011). Importance of weighted social networks in diffusion of agricultural innovations: An empirical study. Sociology in the 21st century: The first decade. A book on Proceedings of the UGC Sponsored National Level Conference held on December 2010. Published by Barrackpore Rastraguru Surendranath College and Sociological Association of West Bengal, Barrackpore 2011, pp. 93-101, ISBN: 978-81-921808-1-6. R. JANA. (2011). Means and variances of some statistics in simple social network with given out-degrees. Calcutta Statistical Association Bulletin, Vol.63 (Special 7-th Triennial Proceedings Volume), 2011(December), Nos. 249-252, pp. 359-369. R. JANA, Suraj Bandyopadhyay and Anil Choudhuri. Reciprocity among farmers in farming system research: Application of social network analysis, Journal of Human Ecology, 41(1): 4551 (January, 2013). R. JANA and Anil Choudhuri. Studying various aspects of social networks with socio-economic changes in a rural area: A case study from West Bengal, Guru Nanak Journal of Sociology, Accepted for publication in 2013 issue of the Journal. R. JANA and S.B. Bagchi. Distributional aspects of some statistics in weighted social networks. Proposed budget for 2014-15 Revenue 235000/- Capital - Total 235000/- Total budget allocation till 31.03.2013 Not applicable Amount spent till 31.03.2013 Not applicable Total outlay (proposed) for Twelfth Plan (2012 -2017) 420000/- Physical progress in terms of percentage (%) as on 31.03.2013 Not applicable Financial progress in terms of percentage (%) as on 31.03.2013 Not applicable Submitted to a reputed journal in December 2012. A.R. Rao, R. JANA and Suraj Bandyopadhyay (1996). A Markov chain Monte Carlo Method for generating random (0-1) matrices with given marginals. Sankhy a , 1996, Vol. 58, Series A, Pt. 2, pp. 225-242. Paper presented in Conference / Seminar and Technical Report Prepared By: S. Malakar, Social Sciences Division’s Office Plan Budget Proposals 2014-15, SSD 57 R. JANA, and Anil K. Choudhuri (2012). “Statistical and graph-theoretic approach to use social networks for studying social transformation: An attempt”, presented in ‘National Conference on Applications of Statistics in Industry and Planning’, organized by Department of Statistics of Visva-Bharati in collaboration with Calcutta Statistical Association during 25-27 February, 2012. R. JANA, Suraj Bandyopadhyay and S.B. Bagchi (2009). “Distributional aspects of some statistics in weighted social networks”, presented in International Conference on Social Network Analysis, organized by NISTADS, New Delhi, 28-29 January, 2009. Anil Kumar Choudhuri, Suraj Bandyopadhyay and R. JANA (2006). Caste, Class and Social Support: A Social Network Analysis on six villages of Jharkhand − Rarh region. A technical report on projects (i) Pattern of Social Relations: An Exploratory Social Network Analysis in two villages in Jharkhand, and (ii) Study of Social Network in some villages in Giridih area in Jharkhand and Md. Bazar area of West Bengal. Submitted to SRU, ISI, 2006. A.R. Rao, Suraj Bandyopadhyay, Bikas K. Sinha, Aditya Bagchi, R. JANA, D. Sen and A.K. Choudhuri (1998). “Changing social relations : social network approach”, presented in SURDAC Seminar, organized by Indian Statistical Institute, 1998. R. JANA, A. R. Rao and Suraj Bandyopadhyay (1994). Switching pairs and determining arcs in a network with given out-degrees and in-degrees. A technical report No. 14/94, dated 31.3.94, Statistics-Mathematics Unit, ISI, Calcutta. Lectures delivered in the workshop R. JANA. Delivered two invited lectures (i) Introduction to Social Network Analysis, and (ii) SNA Approach to Empirical Data, in the Workshop on Recent Advancements in Social Science Research Methodology, organized by Dept. of Sociology, M S University, Tamil Nadu, in collaboration with CDC of the University during Feb. 26-28, 2013. Prepared By: S. Malakar, Social Sciences Division’s Office 58 Social Sciences Division, ISI SRU (General, On-going) Project No. 5.3 1. Title of the Project: A micro level study of television (TV) watching and childhood obesity in Kolkata city of West Bengal, India 2. Brief objective and justification: The main objectives of the study (i) to estimate the prevalence of overweight and obesity among children aged 6-10 years, (ii) to see the relationship of obesity with socio-demographic variables and finally, (iv) to understand, how far TV watching associated with childhood obesity after controlling other confounding factors like food habit of children. In America, this type of study is very common but it is very emerging problem in urban Indian children and study is very few. Therefore, it is noteworthy to study television (TV) watching and childhood obesity in an urban centre like Kolkata. 3. Date of commencement: April, 2013 4. Name of the proposing scientist or: Dr. Susmita Bharati, Principal investigator 5. Name of other associated scientists with their affiliation: Professor Manoranjan Pal, 6. Professor Premananda Bharati and Suparna Shome. 7. A brief write up on the scope and justification of the project and the proposed work: The term ‘overweight’ and ‘obese’ has a great importance in public health community. It is debatable whether obesity is a condition or a disease. It is an etiology i.e. an imbalance between energy intake and expenditure and is responsible for many diseases like Type-2 diabetes, hypertension, respiratory ailments, orthopedic problem, trouble in sleeping and depression (Styne, 2001). In recent years, this obesity is dramatically increasing throughout the world both in developed and developing countries. Among children, 22 million under-five aged children are obese (WHO, 2005). It is estimated that overweight and obesity for school-aged children in the year 2010 is, 1 in 5 urban china, 46 % in the Americas, 41 % in the Eastern Mediterranean region, 38 % in the European region, 27 % in western pacific region and 22 % in South-East Asia (Wang et al. 2006). In India, the prevalence of obesity has increased 54 % among 6-11 years old children (Suresh et al. 2011). This current epidemiocity of obesity among children is largely resulting of rapid changes due to socio-economic and nutrition transition due to globalization. Like any other influence on children obesity, it is seen that childhood obesity has increased dramatically, when there occurs a great explosion of media like Television and Video watching, Video games, computer activities and internet web sites because TV has emerged as the primary vehicles for delivering commercial messages to children. Relationship between children’s media consumption with their obesity has been first evidenced by William et al. during 1985. They studied on 13,000 children through National Health Examination Survey (NHES) and found significant association between the amount of time children spent watching TV and the prevalence of obesity and shows that among 12-17 years old children, the prevalence of obesity increased by 2% by increasing of an addition hour of TV view. It is also studied that 29% of the cases of obesity could be prevented by reducing TV viewing from 0 to 1 hours per week (William et al. 1993). Another national level study on 700 kids of 10-15 years shows that overweight is 4.6 times more among those children who are watching TV more than 5 hours per day compared with those watching for 0-1 hours (Gortmaker et al. 1996). Similar findings have seen through another NHANES findings among 8-16 years old (Anderson et al. 1998). There is also gender biased co-relation with TV watching studied by Crespo et al. 2001 as they found that TV watching is positively associated with obesity among girls though not found any correlation with boys. One of the causes of increased obesity among TV addicted children may be changing food habit due to influence of TV Advertisement (Ad). It is estimated that typical child sees about 40,000 Ads per year on TV alone. It is also seen that those children who watch TV more have more tendency to eat more snacks and also other unhealthy food like candy, soda instead of homemade food while sitting for watching TV. It is also evident that middle school children who watched TV more are more tended to drink soft drinks (Giammattei et al. 2003). It is evidenced by WHO (2003) that each glass of sugar –sweetened beverage consumption increases the risk of obesity in Prepared By: S. Malakar, Social Sciences Division’s Office Plan Budget Proposals 2014-15, SSD 59 children by 60 %. It is also found that there is a negative relationship between having of more fruits and vegetables with TV watching. Very recently, the Ad is promoting thin body types as the ideal, possibly encouraging to teen girls to engage in unhealthy dieting or eating disorders. The physiological process of increasing obesity due to more TV watching is that during TV watching, it reduced children’s metabolic rate which contribute to weight gain because it was studied that TV watching decreased metabolic rate even more than resting or sleeping. But it is fact that most of the studies have failed to find a substantial relationship between the time children spend for watching TV and the time they spend in physical activity may suggest that the nature of TV watching i.e. how children watch and what they watch may be also more important than the number of hours they watch. In this context, the relationship between TV watching and childhood obesity are very sensitive issue in very recent period. As TV watching is more prevalent in urban setting therefore the study is necessary to estimate the overall prevalence of overweight and obesity among urban 6-10 years children like in Kolkata (West Bengal) to see the difference of impact of socio-economy and TV watching on childhood obesity and how far the food habit is changing with TV advertisement. Methodology Study Design and Sample Size This will be a micro level cross-sectional study using multistage stratified cluster sampling procedure. Two types of school (government or semi-government and private) will be selected for the socio-economic differences. It will be assumed that government or semi-government schools cater to lower to middle sections of the population, whereas children from upper middle and high income groups attend private schools. The subjects will be the children aged 6 to 10 years, who are generally studying in class I to IV at the Kolkata city of West Bengal. The household socioeconomic and demographic data such as community, literacy status, and occupation of father and mother will be collected from the students, and the same was confirmed with school records and also their respective parents. The date of birth of each pupil will be taken from the school records and cross checked from their respective parents or guardian. Information on the whole day activities of the last three days will be collected as well as food habit of three days will be collected from the student or from their respective parent by re-call methods. Information also will be collected about distance of school from the residence and the mode of transport used to go to school. Besides this, height and weight of the children as well their mother will be taken to see the heriditary of obesity through anthropometric rod and weighing mechine. Duration of TV watching will be collected indirectly from whole day activity and nature of TV watching also will be collected as an accessaories of TV watching. Statistical Analysis Descriptive analysis will be done for the health, nutrition, duration of TV watching and socioeconomic parameters. Contingency χ2 test will be used to understand association between health and nutritional parameters and socio-economic variables with duration of TV watching. Linear and logistic multiple regressions will be performed to identify the significant factors associated with overweight and obesity. Age will be adjusted as and when necessary. Reference: 1. Styne, DM. 2001. Childhood and adolescent obesity: Prevalence and significance. Pediatric clinics of North America. 48: 823-854. 2. World Health Organization (WHO). 2005. Preventing chronic diseases: A vital investment. WHO Global Report, Geneva: http:// w.w.w. who.int/chap/chronic-disease-report/en/ Wang, Y and Lobstein, T. 2006. Worldwide trends in childhood overweight and obesity. Int. J.. Pediatr obese. 1: 11-25. 4. Suresh, V; Rupnath, K; amesh, V; Rajarani, M; Ramadevi, T and Sambasivarao, KRS. 2011. Television watching and sleep promotes obesity inurban and semi-urban children in India. Journal of Toxicology and environmental health sciences. 31: 001-007. Dietz, W and Gortmaker, S. 1985. Do we fatten our children at the TV set? Obesity and television viewing in children and adolescents: Pediatrics. 75 : 807-812. Dietz, W and Gortmaker, S. 1993. TV or not TV: Fat is the question. Pediatrics. 91: 499-500. Gortmaker, S; Must, A; Sobal, A; Peterson, K; Colditz, S and Dietz, W. 1996. Television viewing as a cause of increasing obesity among children in United States, 1986-1990. Archives of pediatrics and adolescent medicine. 150: 356-362. Prepared By: S. Malakar, Social Sciences Division’s Office Social Sciences Division, ISI 60 Crespo, C; Smit, E; Troiano, R; Bartlett, S; Macera, C and Anderson, R. 2001. Television watching, energy intake and obesity in US children. Archives of Pediatrics & Adolescent Medicine. 155: 360-365. Giammattei, J; Blix, G; Marshak, HH; Wollitzer, AO and Pettitt, DJ. 2003. Television watching and soft drink consumption: Association with obesity in 11-13 year old school children. Archives of pediatrics and adolescent medicine. 157: 882-886. 8. Item wise break up of the budget proposed (Capital & Revenue) and justification for the same: Item-wise break up of the budget proposal for 2013-2014 Rupees in lakhs (a) Revenue Fieldwork (TA, DA, Transport, field guide etc.) One Project Assistant @12000 per month x 12 months Data analysis, Report writing Miscellaneous TOTAL (Revenue) (b) Capital (Anthropometric set, Skinfold Caliper and Weighing machines) GRAND TOTAL 2.00 1.44 0.50 3.94 2.00 5.94 Rupees in lakhs 1.80 1.44 0.50 0.20 3.94 0.00 (a) Revenue Fieldwork (TA, DA, Transport, field guide etc.) One Project Assistant @12000 per month x 12 months Data analysis, Report writing Miscellaneous TOTAL (Revenue) (b) Capital (Anthropometric set, Skinfold Caliper and Weighing machines) GRAND TOTAL 3.94 Item-wise break up of the budget proposal for 2014-2015 9. Brief Particulars of Assets, proposed to be acquired from Capital Budget, should be mentioned. In case of replacement, Particulars of the asset to be condemned (e.g. Year of Purchase, Cost). 10. Capital: Nil 11. List of all ongoing projects undertaken by the proposing scientist in the last 5 years: NIL 12. Expected date of completion: 31 March 2015. 13. Quarterly projection of expenditures (in lakhs) during 2014-2015 1st 2nd 3rd 4th Total Rev Cap Tot Rev Cap Tot Rev Cap Tot Rev Cap Tot Rev Cap Tot 0.86 0.0 0.86 1.11 0.0 1.11 1.11 0.0 1.11 .86 0.0 0.86 3.94 0.0 3.94 13. For General Projects only (in lakhs) (Ongoing): Proposed budget for 2014-15 Revenue Capital Total 3.94 0.00 3.94 Total budget allocation till 31.03.2013 Amount spent till 31.03.2013 Not Not applicable applicable Total outlay (proposed) for Twelfth Plan (2012-2017) 9.88 14. For General Projects (in lakhs) only (New) : Not applicable 15. For North-East Projects only (On-going): Not applicable 16. For North-East Projects only (New): Not applicable Prepared By: S. Malakar, Social Sciences Division’s Office Physical progress in terms of percentage (%) as on 31.03.2013 Financial progress in terms of percentage (%) as on 31.03.2013 Not applicable Not applicable Plan Budget Proposals 2014-15, SSD 61 SRU (General, On-going) Project No. 5.4 1. Title of the Project: Gender Issues and Empowerment of Women in rural West Bengal 2. Brief objective and justification (2 & 3 sentences): Thus the objectives of the study are as follows: 1. To find the status of empowerment in the context of economic, social, education and health in some districts of West Bengal (See Appendix 2 for a list of indicators of empowerment). 2. To assess the benefit accrued to women through the different developmental programmes taken by the Government India towards empowerment of women (see Appendix 1 for a list of some of the major development programmes for women and for gender equality) 3. Date of Commencement: April 2013 4. Name of the proposing Scientist or Principal Investigator: Bhola Nath Ghosh 5. Name of other associated Scientists with their affiliation: Prof. Manoranjan Pal (Indian Statistical Institute) Partha Nath Mukherji (Professor Emeritus, Institute of Social Sciences, New Delhi & Former Director, Tata Institute of Social Sciences), and Dr. Ramanuj Ganguly (Head, Department of Sociology, West Bengal State University). 6. A brief write up on the scope and justification of the project and the proposed work The empowerment of women is one of the biggest challenging issues towards sustainable and inclusive development. Empowerment of women through decision-making power and control over the resources in the day to day life are the main two factors in this respect. Development means improvement in all directions. Human Development Index (HDI) is one such measure. However, HDI is unable to capture the uniformity of development among male and female populations. New measures like Gender Related Development Index (GDI) and Gender Empowerment Measure (GEM) were thus introduced. Women should be brought into the mainstream by including them in all activities. The Ninth Five- year Plan (1997- 2002) identified the empowerment of women as a key strategy for development (‘Engendering Poverty Policy in India’ by Bina Fernandez1). Empowerment of women is a process by which women acquire the power or capacity to regulate their day-today lives in the social, political and economic spheres. An empowered woman should be free to move, choose among alternatives, and participate in the social and political events, and so on. In Indian constitution, Women have the equal constitutional right in social and political arena. But, do they actually enjoy these rights? Our project aims at finding it. It is encouraging to note that the attitudes towards women have changed over time. The national committee on the status of women was set up in 1971. This committee submitted their report “Towards Equality” as early as in 1974. The Ninth Five-year plan (1997-2002) identified the empowerment of women as a key strategy for development. A parliamentary committee on empowerment of women was established in 1997, and the Prime Minister’s office had directed that a review be made of the impact of gender mainstreaming in ministries and departments. The year 2001 was declared as the “International Women’s Empowerment Year” by the United Nations. Simultaneously the Government of India had also recognized the same year as “Women’s Empowerment” year. Here it should be noted that in the Millennium Development Goals (MDGs) there are eight international development goals that 192 United Nations member states and at least 23 international organizations have agreed to achieve by the year 2015. There are eight goals with 21 targets and 60 measurable indicators. The third goal deals with the promotion of gender equality and empowerment of women. It has one target, i.e., the elimination of gender disparity in primary 1 Bina Farnadez ,(2009),‘(En) gendering Poverty Policy in India’ in Gender & Discrimination, (eds),M.Pal, P. Bharati, B.N.Ghosh & T.S. Vasulu, Oxford University Press, 2009. Prepared By: S. Malakar, Social Sciences Division’s Office 62 Social Sciences Division, ISI and secondary education preferably by 2005 and at all levels by 2015, and three indicators as follows: i. Ratios of girls to boys in primary, secondary and tertiary education ii. Share of women in wage employment in the non-agricultural sector iii. Proportion of seats held by women in national parliament However, for a district the relevant data may not be available. Instead we may think of other indicators which follow. We may be interested only in some aspects of gender inequality and seeing how much we have achieved towards equality of men and women on these aspects. One such aspect is the women’s rights to properties. Since it is mainly the women who are affected, gender inequality is usually seen through how women get the benefit of development and how they are involved in developmental projects. Since the aim is to achieve gender equality, one has to see the factors which lead to gender equality. Methodology: It is found that there are 19 districts in West Bengal. We would like to select four districts depending on the level of development and other special features which are likely to influence the level of development of the districts. The level of development may be judged by the level of infra-structural facilities, which are easily identifiable. The special features of the districts may be taken as high percentages of tribal and/or SC, ST, OBC, Muslim populations etc. The four districts will be selected as follows: We shall make two groups of districts as follows: Developed and relatively less developed according to the infrastructural facilities. Each group will be further subdivided into two groups: With relatively high percentage of at least one caste groups as mentioned above and the rest of the districts in the group. We shall select one district randomly from each of the four groups. From each of the selected districts we shall ultimately select villages in a similar manner step by step by selecting subdivisions, blocks and then villages. A complete list of households of the selected villages will be prepared taking names of the head of the household, per-capita monthly expenditure, occupation, caste, religion, age-sex combination of the household etc. Then, a stratified random sample of the households would be drawn on the basis of monthly per-capita expenditure for identifying the respondent women and a few men from the same set of households. A questionnaire will be prepared on the basis of which data will be collected. On the basis of the data so collected we shall submit the interim report at the end of first year (2013 - 14). In the second year of the project (2014 - 15), the task would be follows: 1. Preparation of relevant tables and charts to find the status of empowerment in the context of economic, social, education and health in some districts of West Bengal. 2. Assessment of the benefit accrued to women through the different developmental programmes taken by the Government India. For this some statistical analysis like correlation and regression will be done. 3. Report writing will be done during the period. Review of Literature: According to Gurumoorthy (2000), empowering of women contributes to social development. The concept of empowerment has been in existence since the 1990s, and several scholars and development agencies have strived to map women’s socio-economic and political situations (Mizan 1994; Bisnath and Elson 1999; Kabeer 1999, Deshmukh- Ranadive 2005; Heyzer 2005; Malhotra and Schuler 2005). Studies on empowerment generally highlight such dimensions such as access to resources, control over resources, or the impacts of access and control over resources (kishor and Neitzel 1996; Elson and Cagaty 2000). Professor Amartya Sen (1999), in his article on ‘Many faces of gender inequality’ illustrated with examples seven different kinds of inequality between men and women that exist in most parts of the world. These are (i) Mortality Inequality, (ii) Natality Inequality, (iii) Basic Facility Inequality, (iv) Special Opportunity Inequality, (v) Professional Inequality, (vi) Ownership Inequality and (vii) Household Inequality. One can devise measures of gender bias for each kind. Amartya Sen’s Capability Approach can also be used for this purpose. The empowerment of women is one of the major driving forces towards attainment of sustainable development of the community and economy at large. Amartya Sen has pointed out that, ‘Education may enhance a young woman’s decision making power in the family in many Prepared By: S. Malakar, Social Sciences Division’s Office Plan Budget Proposals 2014-15, SSD 63 ways. Ownership of land and assets for ensuring economic security may also be viewed as one aspect of empowerment of women. The main ingredients determining empowerment are economic independence, education, social mobility (freedom of movement) and equal participation in political process. The combined effect of these factors enable women to get involved in decision-making processes both at the household and village levels, so that equal benefits are bestowed upon both the sexes. 7. Item wise breakup of the budget proposed (Capital & Revenue) and justification for the same (not more than ¼ page) : Project Outlay: Expected budget allocation for 2014-2015 Sr. No. Item Budget for 2014 -2015 (1) (2) (4) 1 Remuneration of the project Assistant @ Rs. 12000/ per month 2 Field work: Cost of travel for investigators and Collaborating Scientists 28,000/ 3 Accommodation Charges 23,000/ 4 Costs for foods 23,000/ 5 Payment to be made to local investigators and field guides 42,000/ 6 Car hiring charge and other local transport 23,000/ 7 Data entry and Scrutiny 10,000/ 8 Stationary, Xerox, printing of the schedule, Postal, telephone charge etc. 22,000/ 9 Project report 5,000/ 10 Miscellaneous 10,000/ 11 Total 144,000/ ** 330,000/ ** for 12 months 7. Brief particulars of assets, proposed to be acquired from capital budgets, should be mentioned. In case of replacement, particulars of the asset to be condemned(year of purchase, cost) : No capital budget is required 8. Projects in last five years: (A) Year 2007-2009: Process of empowerment of women in rural areas: A case study in Jharkhand, (i) Status: Completed, (ii) Money budgeted: 1.44 lakh (2007 -2008), 2.52 lakh (2008 -2009), (iii) Money Spent: 1.44 Lakh (approx.) (2007-2008), 2.52 Lakh (approx.) (2008-2009), (iv) Publications 2010: “Gender Empowerment, Deprivation and Poverty in Rural Jharkhand: A Case Study”, (with N.Sen,& U.K.De), in International Journal of Current Research, Vol. II, Page 107-116, December, ISSN: 0975-833X, available online at http:// www.journalcra.com. 2011: “Helpless Women: In the context of the present Fundamentalism & Globalization”, in Jadavpur University Journal of Sociology, Jadavpur University, Vol. 4, number 4, June 2011, ISSN 0976-5212, Page, 86-97. (B) Year 2009 - 2010: Inter-state Comparison of Empowerment of women in rural areas (I) Status: Completed, (II) Money Budget: 1.31 Lakh, (III) Spent: 1.28 Lakh (approx.), (IV) Publications: 2009: "Empowerment of Khasi women in Meghalaya: A Case study", (with Jyoita Roy Choudhury), in Journal of Empirical Research in Social Sciences (JERSS), Vol. 4, No. 1-2, March- September, Page 68-81. Gawahati, Assam. 2010: “Status and role of women in the rural Khasi Society of Meghalaya”, with Utpal Kumar De, in, North- East India Council for Social Science Research (NEICSSR), in the Volume No. 34, No. 2, Page. 1 -17, October, Shillong, Meghalaya. 2010: “Empowerment of Women: A study in Tripura & Meghalaya”, in, South Asian Anthropologist, volume 10, Number 1, page 11-28, March, Serial Publications, New Delhi. Prepared By: S. Malakar, Social Sciences Division’s Office Social Sciences Division, ISI 64 2011: “Empowerment of Rural Women in Backward Region of India: A comparative study of Jharkhand, Tripura and Meghalaya” with U.K.De in the edited volume on Gender Deprivation and Empowerment of women: An Indian perspective, edited by U. K. De & B. N. Ghosh, Page 111146, Lap Lambert Academic Publishing GmbH & Co. KG, Dudweiler Landstr, 99, 66123, Saarbrucken, ISBN:978-3-8433-9497-0,(www.lap-publishing.com), Germany. 2012: “Gender Budgeting, Resource Control & Empowerment of Women: A Study in Meghalaya” in the edited volume on “Gender Budgeting: State towards Justice (Conceptual and empirical issues)”(ed.) by Abdul Motin, Page 27-37, January, 2012, Dasgupta & Company Publication House, Kolkata. 9. Expected date of Completion: 31 March 2015 10. Quarterly projection of expenditure during 2014 -15 Type Quarter 1 Quarter 2 Quarter 3 Quarter 4 Revenue 75,000 Capital Nil 75,000 Nil 80,000 1,00000 Nil Nil 11. For General Ongoing Projects: Proposed budget for 20142015 Total budget allocation till Amount spent till 31.03.13 31.03.13 Rev Cap Total 3.30 lakhs nil 3.30 lakh 2.5 lakh Total outlay for Twelfth plan (20122017) Physical progress in terms of percentage (%) as on 31.03.2013 Financial progress in terms of percentage (%) as on 31.03.2013 Nil 12. For General Projects Only (New): Nil 13. For North-East Projects Only (on-going): Nil 14. For North-East Projects only (new): Nil 15. Rank (to be given by the Division): Does not arise Publications (2008-20012) of Bhola Nath Ghosh (Addendum) Articles published in Journals: 2009: “Decentralisation or Democratic Devolution”,(with Partha N. Mukherji), in Panchayati Raj Update, page 6-7, January, Vol. XVI, No.1, edited by Raj Kishore Das for Institute of Social sciences, 8, Nelson Mandela Road, New Delhi. 2009: “ Milk-co-operatives and Rural Development in West Bengal: A few issues”, (with Ranjit Karmakar), in South Asian Anthropologist, Volume 9, Number 2, page 167-176, Serial Publications, New Delhi. 2010: “Democratic Centralism, Party Hegemony and Decentralization in West Bengal”, (with Partha N. Mukherji), Sociological Bulletin, 59 (2), May- August, page 1-17. 2010: “ Manab Nirapattya, Manbadhikar Abang Unnayan”, (with Ranjit karmakar),.in, Samaj Tattya, June, Vol. 16, Issue-1, Pp. 39-41, ISSN 0975-9980, A Bi-lingual Half-yearly Journal of Sociology, Kolkata. 2010: “Creation in Rural Areas”, in Samaj-Tattya, Vol.16, Issue -2, December 2010, Page 6067,ISSN 0975-9980, A Bi-lingual Half-yearly Journal of Sociology, Kolkata. 2011: “Women in Information Communication Technology” (with Asmita Bhattacharyya), in, Asian Journal of Science and Technology, Vol. 2, Issue 3, Page 006- 014, March 2011, ISSN: 0976-3376, Website: www. Journalajst.com. 2011: “ Problems of Education of Scheduled Tribes and Scheduled Castes: A case study in Kolkata and surroundings and Medinipur and surrounding areas”, in Journal US-China Education Review, David Publishing, USA, June 2011, Volume 8, No.6, ISSN 1548-6613. 2011: “Singur: A case study for industrialization”, in South Asian Anthropologist, 2011 (2): 115-120 Serial publications, New Delhi. 2012: “Women in Indian Information Technology (IT) Sector: A Sociological Analysis”, in International Organisation of Scientific Research. (IOSR) Journal of Humanities And Prepared By: S. Malakar, Social Sciences Division’s Office Plan Budget Proposals 2014-15, SSD 65 Social Science (JHSS), Volume 3, Issue 6 (November-December, 2012), PP 45-52, ISSN: 22790837, ISBN: 2279-0845, www.Oosrjournals.org, DOI (Digital Object Identifier) number is 10.9790/0837-0364552,check it through www.doi.org 2012: “Gender differences specially in health: A Case study in Meghalaya and Tripura”, in IOSR Journal of Humanities and Social Science (JHSS), Pp. 18-25, ISSN: 2279-0837, ISBN: 2279-0845, 0461825,check it through www.doi.org 2012: “Co-operatives: A few words”, in Asian Journal of Science and Technology, Vol.4, Issue, 11. PP. 050-053, ISSN: 0976- 3376, Website: www. Journalajst.com. 2012: “Concept and Implications of Empowerment of Women in North-East India: A Case Study”, in, Society Today: An Interdisciplinary of Social Sciences, Vol.2, PP. 1-19, December 2012, Editor, Anirban Banerji, ISSN 2319-3328, available online at http// www.society today. 2013: “Ethnicity: A Continuum on Education”,(with Sujata Chakraborty), in, Asian Journal of Science and Technology, Vol. 3, Issue 02, p. 128 -147, 2013, ISSN: 2161-6248 website:www.journalajst.com Articles Published in Book: 2008: “Process of Empowerment of Women : A Comparative study of Tripura and Meghalaya” with De Utpal , in edited volume on Women Emancipation: Focus North-East, edited by Asok Kumar Roy and Basudev Datta Roy, p. 243-256, OM publications, New Delhi. 2008: “Women in Decision making: experiences from two states in Northeast India”, With M.Pal &P.Bharati, in edited volume on Women empowerments in North-east India, edited by L.S.Gassah, p.198 -215, Omsons Publications, New Delhi. 2008: “Problems of Tribal Identity in North-eastern Region”, with R.Karmakar, in edited volume on Contemporary social problems in India, vol. -1,edited by Ruby Sain, p. 125-132, Readers Service, Kolkata. 2008: “Some aspects of Gender Differences in two states of Northeast India”, with M.Pal & P. Bharati, in edited volume on Women speak, edited by B.N.Ghosh & Subhabrata Dutta, p.99-114, Mittal Publications, New Delhi. 2010: “Nagarik Samaj Andolon”, in edited volume on Bharater Samajik Andolon, edited by KrishnaDas Chattopadhya & Aniruddha Chowdhury, p.238 -243, Levant Book, Kolkata. 2011: “Women in Information Communications Technology (ICT): Opportunity and Constraint” with Asmita Bhattacharya in the edited volume on Gender Deprivation and Empowerment of women: An Indian perspective, edited by U. K. De & B. N. Ghosh, Page 277- 289, Lap Lambert Academic Publishing GmbH & Co. KG, Dudweiler Landstr, 99, 66123, Saarbrucken, ISBN: 978-3-8433-9497-0, (www.lap- publishing.com), Germany. Articles Published in Conference Proceedings: 2009: “Party Hegemony and Decentralization: Panchayati Raj in West Bengal’, with Partha Nath Mukherji in the proceeding of International Conference on “ Three Decades of Rural Decentralization in West Bengal: Lessons and future options’, Edited by Buddhadev Ghosh, December, pp. 69 -75, Institute of Social Sciences, Kolkata. 2010: ‘Tribal Women & Empowerment: A study in West Bengal’, with R. Karmakar, in the Proceeding of National Seminar on ‘Dynamics of Tribal development with special reference to Women’ in the Department of Anthropology, Andhra University, Visakhapatnam, January. 2010: ‘Industrialization efforts in Singur and its consequences’ in National Seminar on Management of Natural Resources and Environment in India, pp. 639-645, October. Book: 2008: Women Governance in Tripura, Concept Publishing Company, New Delhi. P.208+ XII, ISBN -13:978-81-8069-519-3, ISBN- 10:81-8069-519-0. Edited Books: 2008: Women’s Speak, edited jointly with Subhabrata Dutta, Mittal Publications, New Delhi, 267 + XVI, ISBN 81-8324-263-4. 2009: Gender and Discrimination, Health Nutritional Status, and Role of Women in India, edited with Manoranjan pal, Premananda Bharati and T.S.Vasulu, Oxford University Press, New Delhi, ISBN-13: 978-019-806029-1, ISBN-10: 019-806029-7. 2011: Gender Deprivation and Empowerment of women: An Indian perspective, edited by U. K. De & B. N. Ghosh, Lap Lambert Academic Publishing GmbH & Co. KG, Dudweiler Landstr, Prepared By: S. Malakar, Social Sciences Division’s Office 66 Social Sciences Division, ISI 99, 66123, Saarbrucken, ISBN: 978-3-8433-9497-0, Total page 310, Price 79 EURO, ( www.lappublishing.com), Germany. ISBN: 978-3-8433-9497-0. 2012: Gender Issues & Empowerment of Women, edited byManoranjan Pal, Prasanta Pathak, Premananda Bharati & Amita Majumdar, Nova Science Publishers, Inc., New York, Total page xxii + 323, Price USD 69, (www.novapublishers.com) ISBN 978-1-62100-407-3(hbk). Appendix 1 Whether the respondent woman and her counterpart are aware of the following government of India Schemes/Acts and were benefitted out of these schemes. 1. Mahatma Gandhi National Rural Employment Guarantee Scheme 2. The Right of Children to Free and Compulsory Education Act or Right to Education Act (RTE) 3. Integated Child Development Services Scheme (including Apni Beti Apna Dhan, Balika Smariddhi Yojana and National Maternity Benefit Scheme) 4. The Maternity Benefit Act (1961) and its amendment in 2007. 5. Child Care Leave for two years 6. National Old Age Pension Scheme 7. Babu Jagjiban Ram Chhatrawas Yojona –Scheme of hostel for SC girls and boys 8. Central Scheme of Hostels for OBC boys and girls 9. Post Matric Scholarship to OBC Students 10. Post Matric Scholarship to Scheduled Caste Students 11. Pre Matric Scholarship to Other Backward Classes Students 12. Adivasi Shiksha Rrinn Yojana (ASRY) 13. Scheme for Leadership Development of Minority Women 14. Maternity leave for 180 days up to two children. 15. Integrated Child Development Services Scheme. 16. Apna Beti Apna Dhan (Rs. 500/ to the mother within 15 days) for SC/BC categories Except Gazetted Officer) 17. Balika Smariddhi Yojana (General Caste category living below poverty line). 18. National Maternity Benefit Scheme (below poverty line provided the new baby to born is Second child in the family Rs. 500 to the mother during 6th to 8th month of pregnancy. 19. Janani Suraksha Yojana (JSY) (Rs.1000/- (Rs.700/- under JSY (GOI) + Rs.300/- under Sukhibhava (State) scheme) is being paid to rural BPL woman. Appendix 2 The Dimensions of Empowerment of Women and the specific measures: Dimension-1: Participation in Political Arenas and in Decision-Making by Women: Indicators: (a) Whether the women cast their Vote in Gram panchayat, Panchayat samity, Zilla Parisad, state assembly and Lok sabha election. (b) Whether member of a political party. (c) Whether attended in the political party meeting Dimension-2: Economic Participation: Indicator: (a) Whether an earning member (employed in an organized or unorganised sector, self employed etc.). Dimension-3: Social Participation: Indicators: (a) Whether attended childs’ school function, (b) Whether attended any cultural programme in the village (c) Whether visited relatives house outside the village without being accompanied by a male member. (d) Whether visited any temples or religious places which is situated outside of village without being accompanied by a male member. (e) Level of education of women. Dimension-4: Decision-Making Power of Women (a) Decision making power of spending money (b) Decision making over child’s admitting to school etc. (c) Decision making power about the marriage of children. Prepared By: S. Malakar, Social Sciences Division’s Office Plan Budget Proposals 2014-15, SSD 67 EAU (General, On-Going) Project No. 8.1 1. Project Title: Evaluating Official Statistics on Land and Livestock holdings 2. Brief Objective: In this Project, we propose to use our extensive experience with village data to comment on and improve the scope and method of official data collection and the quality of official data across a range of parameters associated with agriculture and rural development in India. In the first instance, we wish to examine official data on land and livestock holdings of rural households. 3. Date of Commencement: APRIL 1, 2012 4. Proposing Scientist: V. K. RAMACHANDRAN 5. Other Associated Scientists: Madhura Swaminathan (SRU), Niladri Sekhar Dhar (SRF), Shamsher Singh (SRF), Kaustav Sarkar (JRF), Biplab Sarkar (JRF) External: Professor Abhijit Sen (JNU and Planning Commission), Dr. Vikas Rawal (JNU), Dr. V. Surjit (CIP), Dr. R. Ramakumar (TISS), Pallavi Chavan (RBI) 6. Scope and Objectives: Land is the primary prerequisite for production in agriculture. The distribution of land between households is an important indicator of their position in the system of agrarian production. Understanding changes in the distribution of land and changes in inequality among rural households in the ownership and operation of this fundamental asset is of central importance to an understanding of the rural economy. Nevertheless, the economic size of a farm cannot be measured by its extent alone. First, a single size category of land holding may conceal considerable variations in the physical characteristics of land, such as in irrigation and drainage facilities available, type of soil and its fertility (Ramachandran, 1980). Secondly, a single size category of land holding may group together households that differ in respect of several essential characteristics (ibid.). Households with the same extent of land may differ in terms of techniques of cultivation, in the possession of machinery, and thus in the scale of production. Households with the same extent of cultivated land may also differ with regard to the terms of possession (for example, with respect to tenurial status). Given these variations in features of land holding of the same acreage, it is important to be careful in the collection and processing of data on land holdings. Animal resources maintained by a large proportion of households are an important source of livelihood for these households. Animals are used for draught power, and for animal products like milk, eggs, meat, wool and honey, and make an important contribution to incomes of a large proportion of rural households. Animals are also an important component of the asset base of rural households. Despite the importance of reliable large-scale data bases on land holdings in India, the available data on land holdings cannot be used to understand some important aspects of land relations. Data on livestock holdings do not provide any information on lease and rental markets of animals, on sale and purchase of animals, on how animals are maintained, or on what use they are put to. There are gaps in terms of data collected in the large-scale surveys on land and livestock holdings, there are definitional problems, and there are problems in terms of loss of information and accuracy due to aggregation at the time of tabulation. In addition, there are problems of comparability of data across surveys, regions, and time-periods. This project proposes to prepare a revised survey schedule for collection of data on land and livestock holdings, to test that schedule with data from selected villages, and to assess the quality of data generated through the village surveys. On the basis of this study, the project aims to propose a revised schedule to be used in the NSSO’s Survey on Land and Livestock Holdings, which is the most important current source of information on household ownership and operational holdings of land in India Specifically, this project proposes to (d) evaluate the extent, nature and sources of discrepancies in available NSSO data on land and livestock holdings, and (e) design and test questionnaire blocks that will help improve the quality of data collection in NSSO's surveys on land and livestock holdings, through primary surveys in selected Prepared By: S. Malakar, Social Sciences Division’s Office Social Sciences Division, ISI 68 villages. In relation to (a) the project will analyse existing NSS data from land and livestock surveys to (a) identify important variables on which information is not available from these surveys, and (b) evaluate the quality and consistency of information from the variables on which data are available. For evaluation of quality and consistency, NSSO data will be compared with other sources of official statistics as well as data from primary surveys. To undertake (b), it is noted that, the principal investigators and associated scientists have been engaged in village surveys for several years. One of the objectives of these surveys was to analyse village-level production, production systems and livelihoods and to characterise the socio-economic features of different strata of the rural population. For this purpose, a census-type survey that covers every household and individual has been conducted in selected villages. These surveys used a revised prototype of a schedule for a survey on land holdings. From this data base of village surveys, the module for data collection on land holdings and associated variables will be cleaned and processed. This will allow us to verify the quality of data collected, identify the new items of data and their uses, and present some findings on the uses of such data. On the basis of these village surveys, the study will propose a modified survey schedule for the NSSO Land and Livestock Survey. 7. Budget: PROPOSED BUDGET: Rs Nine lakhs Forty thousand in 2013-14 and Rs Five lakhs Seventy thousand in 2014-15 ITEM 2013-14 2014-15 REVENUE Travel and Fieldwork (investigators) 2,00,000 2,00,000 JRF or Project linked personnel or data 2,90,000 2,90,000 processing charges Stationary, printing, communication 20,000 30,000 Purchase of data and books, computer 20,000 30,000 consumables Workshop/Seminar 4,00,000 Miscellaneous 10,000 20,000 GRAND TOTAL 9,40,000 5,70,000 8. Assets: NIL 9. Projects in Last Five Years: 1. YEAR 2007-09: Agrarian Relations in India Status: Completed 2007-08 Money Budgeted: 3,06,000 Money Spent: 2,78,733. 2008-09 Money Budgeted: 2,25,000 Money Spent: 2,24,059 2. YEAR 2010-2011 Seminar on Dalit Households in Village Economies Status: Completed: Seminar held on January 7-8, 2011, and book in press. Money Budgeted: 1,28000 Money Spent: 1,28000 Relevant Publications (in last five years) Books Prepared By: S. Malakar, Social Sciences Division’s Office Plan Budget Proposals 2014-15, SSD 69 Agrarian Studies 2: Financial Liberalisation and Rural Credit, edited by V. K. Ramachandran and Madhura Swaminathan, was published in 2005. Agrarian Studies 3: Dalits Households in Village Economies, edited by V. K. Ramachandran and Madhura Swaminathan, is in press (due in summer 2011). Socio-Economic Surveys of Three Villages in Andhra Pradesh: A Study of Agrarian Relations (eds V. K. Ramachandran, Vikas Rawal and Madhura Swaminathan), New Delhi: Tulika Books, 2010. Selected Research Papers of Principal Investigator and Associated Scientists See Ramachandran, V. K., Yoshifumi, Usami, and Sarkar, Biplab (2010), “Lessons from BPL Censuses”, The Hindu, April 20, 2010 and Yoshifumi, Usami, Sarkar, Biplab, and Ramachandran, V. K. (2010), "Are the Results of BPL Census 2002 Reliable?" (available at www.fas.org.in). Madhura Swaminathan “Agriculture and Livelihoods: A Village Report Card”, Proceedings of the International Conference on Eliminating Hunger and Poverty, M. S. Swaminathan Research Foundation, August 7-9, 2010 (forthcoming). Vikas Rawal, Madhura Swaminathan and Niladri S Dhar, “On Diversification of Rural Incomes: A View from Three Villages”, Indian Journal of Labour Economics, Vol 51, No. 2, April-June, 2008, pp 237-256. Ramachandran, V. K., and Rawal, Vikas (2010), “The Impact of Liberalisation and Globalisation on India’s Agrarian Economy”, in Harriss, John and Bowles, Paul (eds.), Globalization and Labour in China and India: Impacts and Responses, Palgrave Macmillan. Rawal, Vikas (2010), “Tenancy Relations in Ananthavaram, 1974-2005-06”, paper presented at the Second International Conference on Environment, Agriculture and Socio-economic Change in India", Daegu (South Korea), March 29-30. Ramakumar and K Raut “Agricultural Employment in a Vidarbha village: Results from a Resurvey” Review of Agrarian Studies, 1 (2), June-December, 2011 (forthcoming). Ramakumar and Pallavi Chavan, “Changes in the Number of Rural Bank Branches in India, 1991 to 2008” Review of Agrarian Studies, 1 (1), January-June, 2011. R. Ramakumar “India’s Agricultural Economy”, Chapter 5 in Contemporary Issues in Indian Economy, Text Book Manuscript for undergraduates prepared by J. Mohan Rao, Jayan Jose Thomas and R. Ramakumar, Instituto de Altos Estudios Universitarios, Spain, 2008. Rawal, Vikas (2008a), “Estimates of Rural Household Incomes in India: Selected Methodological Issues.”, paper presented at the Colloquium “Studying Village Economies in India: A Colloquium On Methodology,” Chalsa. (http://www.agrarianstudies.org/UserFiles/File/S5_Rawal_Estimation_of_Rural_Household_Inc omes_in_India.pdf) Rawal, Vikas (2008b), “Ownership Holdings of Land in Rural India: Putting the Record Straight”, Economic and Political Weekly, March 8. Rawal, Vikas (2008c), “Making Sense of Statistics on School Education in India”, presented at the National Seminar on School Education Statistics, National University of Educational Planning and Administration, New Delhi, March 3-4. http://agrarianresearch.org/blog/wp-content/uploads/2010/07/vikas-nuepa.pdf Rawal, Vikas (2006a), “Landlessness in Rural West Bengal”, a report submitted to the Ddevelopment and Planning Department, Government of West Bengal, Kolkata. Rawal, Vikas (2006b), “Indebtedness in Rural West Bengal”, a report submitted to the Development and Planning Department, Government of West Bengal, Kolkata. 10. Expected Date of Completion: MARCH 31, 2015 11. Quarterly Projection of Expenditure during 2013-14: REVENUE EXPENDITURE Quarter 1 Quarter 2 Quarter 3 Quarter 4 Total 1,30,000 1,30,000 550,000 130,000 9,40,000 Prepared By: S. Malakar, Social Sciences Division’s Office Social Sciences Division, ISI 70 Non Project Plan Proposals Srl No. Unit Page No. 1 Economic Research Unit ……………………….. 70 2 Linguistic Research Unit ……………………….. 71 3 Population Studies Unit ……………………….. 73 4 Psychology Research Unit ……………………….. 74 5 Sociological Research Unit ……………………….. 76 6 Sampliing & Official Statistics Unit ……………………….. 77 7 Economics & Planning Unit, Delhi Centre ……………………….. 78 8 Economic Analysis Unit, Bangalore Centre ……………………….. 80 9 Social Sciences Division Office ……………………….. 81 Prepared By: S. Malakar, Social Sciences Division’s Office Plan Budget Proposals 2014-15, SSD 71 Economic Research Unit Budget Proposals for the Year 2014 – 2015 Sl. No. 1. 2. 3. 4. 5. 6. 7. 8. Items Visiting Scientists: Seminar: Internal travel: Submission fee for publication in Journals: Computer Consumables: Repair and Maintenance: Office Expenditures: Capital Expenditure: TOTAL Prepared By: S. Malakar, Social Sciences Division’s Office Amount (in lakh) 10.00 5.00 1.00 0.50 2.70 2.50 0.80 10.00 32.50 Social Sciences Division, ISI 72 Linguistic Research Unit NON-PROJECT PLAN PROPOSALS FOR 2014-15 Items Heads Capital Computer, Photocopier, Software, Scanner, Printer, Cupboard, Internet Hub, Furniture, Wi-Fi, etc. Revenue Fellowship for 1 (one) New JRF/SRF (2014-2015) Visiting Scientists Seminars (departmental, on regular basis) Internal Travel Computer Consumables Maintenance Office Expenditures (Stores and Stationeries) Total Amount for the year Remark 2014-2015 5,00,000 Essential 5,00,000 3,00,000 50,000 50,000 70,000 80,000 80,000 80,000 7,10,000 12,10,000 Justification for LRU Unit’s Plan Budget Proposal: 2014 -2015 (a) (b) (c) (d) (e) Capital Items: With regard to capital items and resources LRU is poorly furnished. It suffers from lack of a laboratory furnished with advanced systems and tools necessary for successful execution of research and development works in the area of Natural Language Processing, language technology, applied linguistics, & cognitive linguistics. It needs some good computers, printers, and photo-copiers to carry out academic and research activities. Also, due to lack of computer facilities, visitors and summer trainees who come to work at LRU face severe problems. It is imperative that we should provide the basic infrastructural facilities to the scholars as well as scholars who visit LRU. At present, there are 15 computers in LRU. At least 5 or more computers are urgently required for carrying out research works and for Ph.D. scholars. We also need laser printers, scanners, and photo copiers, chairs, tables, computer tables, cupboards, UPS, AC, etc. for proper functioning and seamless execution of research and administrative works of the unit. Therefore, LRU needs an amount of Rs. 5,00,000/- to meet such expenses. Visiting Scientists: During last few years at least ten scientists from home and abroad have visited LRU – either in short or long term period. For providing honorarium and local hospitality to visiting scientists LRU needs an amount of Rs. 50,000/-. Seminar/workshop: LRU organizes seminars on regular basis. During last one year some scholars have presented their research works at LRU seminars. This gives us an opportunity to have academic interactions with different researchers. We propose to pay an amount of Rs. 2000/- to each non-ISI presenter as TA and honorarium. Also, we invite well-known scientists from different parts of the country to give special lectures on specified topics. To meet TA and local hospitality, etc. LRU needs an amount of Rs. 50,000/-. Internal Travel: Scientists of LRU attend conferences/seminars at various universities and institutes within India. Also interactions become necessary with experts from outside (within India) for research. This provides scope for better interaction with other scholars. To meet TA and DA for attending and presenting papers in conferences and seminars by scientific workers LRU needs an amount of Rs. 70,000/-. Computer Consumables: Over the years our dependence on computers and related devices has increased. This results in more utilization of computer consumables like Cartridges, Toners, Floppies, CDs, computer papers, transparency sheets, etc. To meet such need LRU requires an amount of Rs. 80,000/- for the Unit. Prepared By: S. Malakar, Social Sciences Division’s Office Plan Budget Proposals 2014-15, SSD (f) (g) 73 Maintenance: Fund is also required for maintaining computers, UPS, aqua guards, anti-virus software, etc. Maintenance also includes internal repair and patch works, internal painting of doors and windows, of the Unit etc. LRU requires an amount of Rs. 80,000/- for this purpose. Office Expenditures: Quite often Central Store fails to meet requirement of office stationery goods and items urgently needed in LRU. We need to have provision for procuring items like pad, note sheets, pencils, ribbon, gems clips, envelopes, staplers, gum, cups, cover files, flat files, pens, etc. Also we need to have provision for procuring some electrical equipment. LRU needs an amount of Rs. 80,000/- for this. Prepared By: S. Malakar, Social Sciences Division’s Office Social Sciences Division, ISI 74 Population Studies Unit NON-PROJECT PLAN PROPOSALS FOR 2014-15 Sl. No. 1. 2. 3. 4. 5. 6. 7. 8. 9. Items Visiting Scientists Research Fellows / Statistical Trainees etc. Seminars by invited Experts Submission Fee for Publication in Journals Internal Travel Computer Consumables Office Expenditure Repair and Maintenance etc. Capital Expenditure Sub-total Grand Total Total Amount (in Lac of Rs.) Revenue Capital 2.40 0.00 2.00 0.00 1.00 0.00 0.50 0.00 0.50 0.00 0.75 0.00 0.60 0.00 2.75 0.00 0.00 3.50 10.50 3.50 14.00 Justifications: 1. Two external scientists will be invited to work at PSU for three months. So for local hospitality and honorarium to the visiting scientists the unit requires an amount of Rs. 2.40 Lakhs. 2. JRF (1) / Statistical Trainees (2) will be absorbed for the financial year. 3. It will be used to invite well-known population scientists from different parts of the country to deliver lectures on different topics. 4. At present most of the National/International journal needs submission fee for referring and processing. The amount will be used for that purpose. 5. The researchers of PSU often present papers in different conferences / seminars organized by reputed universities and institutions within India. To meet TA and DA (according to the rules of ISI) for attending and presenting papers, the unit proposes that amount. 6. To meet regular requirements of computer consumables various items will be purchased. 7. It will be utilized for purchasing stationeries, meeting expenses on conveyance and refreshments etc. 8. It is required for solving the chronic problem of water leakage from the roof and outside wall, and for internal repair and patch work with painting of inside walls of the unit. 9. It will be used partly for the purchase of a new Computer Projector. The present projector purchased 8 yrs ago now not in working condition. Besides these, three very old and badly functioning AC machines in the computer rooms need replacement by power saving new models of AC machines. The unit has to purchase virus software in each year and a small amount of money will be required for that. At least three (3) computers are urgently required for Associate scientists, who are at present working with very old computers running under back dated operating system and not supporting most of the scientific software. Prepared By: S. Malakar, Social Sciences Division’s Office Plan Budget Proposals 2014-15, SSD 75 Psychology Research Unit Non-Project Expenditure Statement 2014-2015 Sr. No. Name of the Project Rs. in lakhs Rs. in lakhs Rs. in lakhs Revenue Capital Total 1.50 1.50 3.10 3.10 1.30 1.30 1.20 1.20 1 2 3 4 Computer Consumables Research Fellow Maintenance for Computer & Equipment Seminar / Workshop / Training programme 5 Software 1.50 - 1.50 6 Office Expenditure 0.90 - 0.90 7 Visiting Scientist / Research Collaborator 1.20 - 1.20 8 9 10 Internal Travel Submission fee for publication in journal Capital Expenditure (Psychological Instrument, PC, Laptop, LCD Projector, Printer, Computer Table and Chair, Refrigerator, Xerox Machine, etc.) 1.00 0.50 5.00 1.00 0.50 5.00 5.00 17.20 Total 12.20 The details of the Non- Project Budget Proposals for the year 2014- 15 . 1. Computer Consumables: This expenditure has increased tremendously . As a result, the use of consumables like Cartridge, Toner, CD-R & W, DVD, Papers, Pen drive, Transparency Sheets etc., are increasing day by day. This requires at least an amount of Rs. 1.50 lakhs. 2. Research Fellow: Rs.3.10 lakhs. (Self-explanatory) 3. Maintenance: It will be required for maintaining the PCs, UPS, Aquaguard, Laptop Battery Anti-Virus software, Printers, Scanners, Cleaning of PC and accessories etc. So we propose an estimate of Rs. 1.30 lakhs 4. Seminar/Workshop/Training Programme: The unit is organizing different academic seminars, workshops and training programmes to disseminate research output from time to time. Several inside and outside speakers are also invited to disseminate the ideas related to specific theme. This enables unit to make several academic exchange with the speakers as well as the participants. The research scholars of the unit are benefited through this programme. This requires a total amount of Rs. 1.20 lakhs . 5. Software: Different statistical software are regularly used in analysis of different multivariate research data. In considering the regular up-date of software, we need to purchase most up-date software. This requires a total amount of Rs.1.50 lakhs. 6. Office Expenditure: Office stationary items are not available in time from the Central Stores. These include writing pads, note sheets, pencils, pens, ribbon, gem clips, envelops, staplers, gum, etc. and some other equipment. We propose an estimate of Rs.0.90 lakhs. 7. Visiting Scientist: The Unit is involved in different collaborative researches with Indian and Foreign Universities and Research Organizations. In this connection, an estimate of honorarium, hospitality (food and accommodation), train/air fares and local transport will be required. This requires a total amount of Rs.1.20 lakhs. Prepared By: S. Malakar, Social Sciences Division’s Office 76 Social Sciences Division, ISI 8. Internal travel : To attend local seminar/conference/workshop or to visit experts for paper presentation or for upgrading knowledge. An estimate of Rs. 1.00 lakh will be required. 9. Submission fee for publication in journal: Many Indian and foreign journals require submission fee for reviewing the paper from the authors. Expert comment is important for upgrading research. 10. An estimate of Rs.0.50 lakh will be required for this purpose. Capital Expenditure: 1. Psychological instrument: Different psychological instruments are part and parcel of our research. Currently, scientists and research fellows are in difficulty to collect them. It is planned that we will keep them in our Psychology lab where our research fellows and scientists can do experimental research. So we want psychological instruments / scales for our psychology lab. 2. PC, Printer, LCD Projector, Xerox machine: Currently, we have 2 old PC. Spare parts are not available. They are useless to analyze vast data structure. Current configuration is inadequate to handle them. Therefore, we want to buy at least 1 PC with most upto date configuration. Our printer has similar problem. Current printers are not adequate to satisfy work load. Therefore, we want one printer. Unit is organizing seminar/workshop and training programs regularly. For this reason, one LCD Projector will be required. There is no Xerox machine in our unit. It will be required for Xeroxing official documents and project related materials. 3. Furniture, Microwave: Few computer tables and chairs in the computer lab. are broken and not repairable. Some new computer tables and chairs, Book shelves etc. are also required for the Lab. 4. An estimate of Rs. 5.00 lakhs will be required to purchase all the above mentioned Capital items. Prepared By: S. Malakar, Social Sciences Division’s Office Plan Budget Proposals 2014-15, SSD 77 Sociological Research Unit Non-Project Expenditure Statement 2014-2015 Non-plan Budget Proposal (2014-15) Budget (in lakhs) Item Revenue Capital 1. Visiting Scientist 3.00 2. Seminar 1.00 3. Internal Travel 1.00 4. Research Fellow (Three ) 7.50 5. Computer Consumable 1.00 6. Maintenance & Office expenditure 1.00 7. Softwares 2.00 8. Capital Equipments (upgrading furniture, AC 5.00 in computer rooms and other equipments) 9. Processing fees for publication 0.60 Total 17.10 5.00 Prepared By: S. Malakar, Social Sciences Division’s Office Total 3.00 1.00 1.00 7.50 1.00 1.00 2.00 5.00 0.60 22.10 Social Sciences Division, ISI 78 Sampling & Official Statistics Unit Non-Project Expenditure Statement 2014-2015 Sl. No. Name of the Unit Revenue Capital Total in (Lakhs) Non-Plan Budget 1. Computer Consumables (4 Cartridge for HP3015DN, 12 Cartridge for HP1020+ , 4 set cartridge HP Projet8060, Paper for (Xerox + Laserjet), 20 Boxes 2. External Hard Disk for Storage of Office, Material and project data 3. Software Procurement (SPSS, MS-Office) 4. Office Furniture 5. Desktop/Printer, 5 New Computer, Laptop , 10 New HP1020+ Laserjet Printer 6. UPS for SOSU (5 KVA) 7. Statistical Trainee 8. Visiting Scientist (4) 9. Honorary Visiting Scientist (2) 10. Office expenses 11. Repair and Maintenance Total 2.00 2.00 0.50 0.50 6.00 18.00 1.00 1.00 1.00 61.33 0.50 2.00 5.00 0.50 2.00 5.00 4.00 4.00 6.00 18.00 1.00 1.00 1.00 72.83 11.50 1. These are required as the Unit conducts training programmes, workshops, etc. frequently and also runs number of projects. 2. These are required for same reason as mentioned above. 3. These are required for data analysis and report preparation in legal way. 4. The office has very few furniture. Number of new furniture are to be bought. White board is to be provided in each faculty room. 5. Existing computers and printers are not adequate for tackling no. of projects. 6. Currently, no computer has UPS. So, a heavy duty UPS is required to serve all computers. 7. Statistical trainees are often useful in different projects. They learn while participating in the projects. 8. Visiting scientists are playing important role in increasing SOSU activities. They are also useful in networking with different institutions. Well performing visiting scientists can be considered for absorption in the unit. 9. Honorary visiting scientists are established scientists. They will be invited for short periods. Their advice will be useful for expansion of SOSU activities. Prepared By: S. Malakar, Social Sciences Division’s Office Plan Budget Proposals 2014-15, SSD 79 Economics & Planning Unit, Delhi Centre Budget Proposals for the Year 2014-15 1. Plan Revenue (non-project): Rs. 32.15 lakhs Project No.Name of the Project Revenue Rs. In lakhs 1.1Visiting Scientists 27.00 1.2 Post-doctoral fellows- cum-Lecturers 0.00 1.3Travel of Scientists 0.55 1.4Seminars 1.00 1.5PC, Xerox, Stationery, Consumables 1.50 1.6Misc. Including communications & fax 1.00 1.7Journal Submission & professional memberships 0.55 1.8Maintenance 0.55 Plan Revenue (projects): Rs. 3.50 lakhs Project No. Name of the Project 1.9 Annual Conference Revenue Rs. In lakhs 3.50 2. Plan Capital (non-projects): Rs. 9.0 lakhs Project No. Name of the Project Capital Rs. In lakhs 2.1 Upgrading Computers, 9.0 manuals, software, Furniture, fittings, equipment TOTAL (Revenue non-project + projects + Capital non-projects + projects) : Rs. 44.65 lakhs. The details of the Budget Proposals 2014-15 1.1 Visiting Scientists: We have on an average twenty visitors (from home and foreign universities/institutes) every year visiting our department. Out of them 5-6 are usually longterm visitors (some of whom stay for 6 months or more), who not only contribute through collaborative research with our faculty, but also take part in teaching in the MSQE program. 1.3 Travel of scientists: The scientists of the unit often present papers in conferences / seminars organized by reputed universities, institutes within India, and even Delhi. Further, they travel within India for discussions with colleagues interested in similar research issues. This provides scope for better interaction without much involvement of time. If travel, and conference registration fee is provided for the said activity, it would encourage scientific activity of the unit. We propose an estimate of Rs. 55,000/-. 1.4 Seminar: Economics and Planning Unit (EPU) organizes academic seminars on a weekly basis. Approximately, 35 non-ISI scientific persons present their research works in a year at PU. We propose to spend an amount of Rs. 2000/- on each non-ISI seminar, that is to be spent on honorarium to the speaker, as well as refreshments. Moreover, we sometimes Prepared By: S. Malakar, Social Sciences Division’s Office 80 Social Sciences Division, ISI invite well-known scientists from different parts of the country to deliver special lectures, as well as organize one-day workshops on important topics. For all these items we propose an estimate of Rs. 1,00,000/-. 1.5 PC, Xerox, Stationery, Consumables: Over the years our dependence on computers/photocopiers has tremendously increased. This has resulted in an increase of the use of computer consumables like Cartridge, Toner, Pen Drives, CD, papers, transparency sheets etc. This is in addition to usual stationery items likes pens, pads, white-board pens and dusters, staplers, gum, clips, envelopes, chalks, etc. This requires at least an amount of Rs. 1.5 lakh. 1.6 Miscellaneous including communications and fax: In this globalized world quick communication is of the essence. Even with e-mails, we often need to fax documents, or send original documents through reliable couriers. STD/ISD phone-calls are also required. The amount marked for these items are: Rs. 1.0 lakhs. 1.7 Submission fee for publication in journal and professional memberships: In a number of topranked international journals authors have to pay rather high submission fees. If a fee of maximum $100 per paper is provided to the author(s) (subject to peer review of the paper before submission), good quality papers may get chance to be published in top-ranked journals. Some journals waive the admission fee for members of the respective societies, so society memberships serve the same purpose. We propose an estimate of Rs. 55,000/- for this purpose. 1.8 Maintenance: This amount is meant for repairing work on some older cup-boards, as well as painting and repairing of doors etc: Rs. 55,000/-lakhs. 1.9 Annual Conference (project): The annual conference of the Planning Unit on Growth and Development has become one of the well-known international conferences in the field of economic development and attracts a number of distinguished researchers from all over the world. The most recent 8th annual conference held in December 2002 had 128 accepted papers and 5 plenary speakers with a total of 250 participants from 14 countries. 2.1 Economics & Planning Unit finds the following items (capital goods) necessary to carry out its academic programs. 1) Computers and Laptop: We need to replace a number of computers because they have become very old and slow. The proposed budget on this head is: Rs. 5.0 lakhs. 2) Chairs, Tables, Almirah: Many of the existing chairs, tables (including computer tables), Almirahs have become very old and some of them have been damaged, repairing of which are not economical and sometimes are not possible. These are needed to be replaced. The estimated budget for these is Rs. 2.0 lakh. 3) Electronic Software, pen-drives, printers, etc.: For research work we urgently need the use of newly developed multi-use electronic statistical software, word processing, and reference software. We also budget for a possible replacement of a PU printer, if required. The estimated budget for these is Rs. 2.0 lakh. Therefore, total estimated cost on Project 2.1 is Rs. 9.0 lakh. Prepared By: S. Malakar, Social Sciences Division’s Office Plan Budget Proposals 2014-15, SSD Economic Analysis Unit, Bangalore Centre EAU Budget 2013-14 Item in lakhs Visiting Scientist 20 PC+Printer Capital 2.5 Computer Consumable 0.5 Repair and Maintenance 0.6 Furniture 0.5 Travel grant 1 Software 0.6 Total 25.7 Prepared By: S. Malakar, Social Sciences Division’s Office 81 82 Social Sciences Division, ISI Social Sciences Division Office Non-project Plan proposal for the year 2014-15 Social Sciences Division Office Item Visiting Scientists Computer Consumables Office Expenditure Travel for Academic Purpose Maintenance Capital Expenditure Revenew 20.000 1.000 2.000 4.000 1.000 Total: Prepared By: S. Malakar, Social Sciences Division’s Office 28.000 Capital 5.000 5.000 Total 20.000 1.000 2.000 4.000 1.000 5.000 33.000 Plan Budget Proposals 2014-15, SSD Prepared By: S. Malakar, Social Sciences Division’s Office 83 Social Sciences Division, ISI 84 List of Publications of DCSW Members: 2008 – 2013 Scientific Papers published in journals over the last five years Srl No. 1 Unit Economic Research Unit ……………………….. Page No. 84 2 Linguistic Research Unit ……………………….. 92 3 Population Studies Unit ……………………….. 94 4 Psychology Research Unit ……………………….. 95 5 Sociological Research Unit ……………………….. 97 6 Sampliing & Official Statistics Unit ……………………….. 100 7 Economics & Planning Unit, Delhi Centre ……………………….. 104 8 Economic Analysis Unit, Bangalore Centre ……………………….. 108 Prepared By: S. Malakar, Social Sciences Division’s Office Plan Budget Proposals 2014-15, SSD 85 Economic Research Unit Name of the Scientist(s) Priyadarshi Banerjee Priyadarshi Banerjee Priyadarshi Banerjee Priyadarshi Banerjee Brati Sankar, Chakraborty Brati Sankar, Chakraborty Title of the Scientific Paper Conflict and Consensus: A Theory of Control in Organisations Delegating Authority to a Dishonest Agent Name of the Journal B.E.J. Topics in Theoretical Economics Contemporary Issues and Ideas in Social Sciences Team Incentive Contracts Contemporary Issues with Interim Private and Ideas in Social Information Sciences Hidden Action Principal-Agent Contemporary Issues Problems with Endogenous and Ideas in Social Signal Precision Sciences Year, Vol., Issue No., Page Nos. of Publication 2008, Vol. 8, No. 1, Article 4 Capital Inflow under Voluntary Export Restraint Protection and Real Rewards: Some Antinomies 2008, Vol. 59, No. 4, Pp. 633-655 2009, Vol. 14, No. 1, Pp. 56-70 Satya R. Chakravarty, On the Watts Jacques Silber and Multidimensional Poverty Joseph Deutsch Index and its Decomposition Millennium Development Satya R. Chakravarty Goals: Measuring Progress and Amita Majumder Metroeconomica Pacific Economic Review World Development Journal of Human Development 2008, Vol. 4, No. 2, 2008, Vol. 4, No. 3, 2009, Vol. 5, No. 2, 2008, Vol.36, Pp.1067-1077 2008, Vol. 9, No. 1, Pp. 109-129. towards Their Achievements Rana Barua, Satya R. Minimal-Axiom Chakravarty and Palash Characterization of the Sarkar Coleman and Banzhaf Indices of Voting Power Satya R. Chakravarty Equity and Efficiency as Components of a Social Welfare Function’ Rana Barua, Satya R. A Note on the CarrerasChakravarty and Sonali Coleman Decisiveness Roy Index Satya R. Chakravarty Deprivation, Inequality and Welfare Satya R. Chakravarty Subgroup Decomposable and Swami Intermediate Indices of Tayagarupananda Inequality Satya R. Chakravarty and Polarization Ordering of Conchita D’Ambrosio Income Distributions Satya R. Chakravarty A Reconsideration of the Tradeoffs in the New Human Development Index Satya R. Chakravarty On Tradeoffs in the Human Development Indices Satya R. Chakravarty Measuring Ethnic and Bhargav Maharaj Polarization Satya R. Chakravarty Subgroup Prepared By: S. Malakar, Social Sciences Division’s Office Mathematical Social Sciences 2009, Vol.58, Pp. 367-375 2009, Vol.5, Pp.181-199 International Journal of Economic Theory International Game 2009, Vol. 11, Pp 237-245 Theory Review Japanese Economic Review Spanish Economic Review 2009, Vol. 60, Pp.172-190. 2009. Vol. 11, Pp. 83-97 Review of Income and Wealth Journal of Economic Inequality 2010, Vol.56, Pp.47-64 2011, Vol.9, Pp.471-474 Indian Journal of Human Development 2011, Vol.5, Pp.517-525 2011,Vol.37, Pp.431-452 Social Choice and Welfare Social Sciences Division, ISI 86 and Bhargav Maharaj Decomposable Inequality Indices and Reduced-Form Indices of Polarization Satya R. Chakravarty Stochastic Dominance and C. Zoli Relations for Integer Variables R. Barua, Measuring P-Power of Satya R. Chakravarty Voting and P.Sarkar Satya R. Chakravarty, Poverty and Time W. Bossert and C. D’Ambrosio Satya R. Chakravarty Ethnic Polarization and Bhargav Maharaj Orderings and Indices Keio Economic Studies 2011,Vol. 47, Pp.57-83 Journal of Economic Theory 2012, Vol.147, Pp.1331-1341 Journal of Economic Theory and Social Development 2012, Vol.1, Pp.81-91 Journal of Economic Inequality 2012, Vol. 10, Pp.145-162. Journal of Economic Interaction and Coordination 2012, Vol.7, Pp. 99-123 Satya R. Chakravarty, W. Bossert and C. D’Ambrosio Multidimensional Poverty and Material Deprivation with Discrete Data Review of Income and Wealth 2013, Vol.59, Pp.29-43 Indraneel Dasgupta Supply Theory sans Profit Maximization 2009, Vol. 9, No. 1, Article 26 Indraneel Dasgupta Living Wage, Class Conflict and Ethnic Strife The B.E. Journal of Theoretical Economics: Contributions Journal of Economic Behavior and Organization The B.E. Journal of Theoretical Economics: Contributions Journal of Economic Inequality Indraneel Dasgupta and Revealed Preference with P.K. Pattanaik Stochastic Demand Correspondence Indraneel Dasgupta and R. Kanbur Indraneel Dasgupta, S. Bougheas and O. Morrissey Does Philanthropy Reduce Inequality? Repayment vs. Investment Conditions and Exclusivity in Lending Contracts Indraneel Dasgupta Mother or Child? Intrahousehold redistribution under gender asymmetric altruism Indraneel Dasgupta Contraction Consistent Stochastic Choice Correspondence” Samarjit Das and J. Breitung Samarjit Das and K. Bhattacharya Testing for Unit Roots in Panels with a Factor Structure Saswati Das Income Distribution and Social Welfare: A Temporal Analysis of the Rural Indian Experience Saswati Das Human Well Being: A Social Indicators Decile Group Analysis on Research Indian Household Data Role of Parental Education in Social Indicators Schooling and Child Labour Research Saswati Das and Diganta Mukherjee Price Convergence across Regions in India Decision: Urban India in the Last Decade Prepared By: S. Malakar, Social Sciences Division’s Office Journal of Institutional and Theoretical Economics Journal of Globalization and Development Social Choice and Welfare 2009, Vol. 72, No. 2, Pp. 750-765. 2010, Vol. 10, No. 1, Article 35. 2011, Vol. 9, No. 1, Pp. 1-21 2011, Vol. 167, No. 2, Pp. 247-265 2011, Vol. 2, No. 1, Article 2 2011, Vol.37, No.4, Pp. 643-658. Econometric Theory Empirical Economics 2008, Vol. 24, Pp. 88-108 2008, Vol. 34, Pp. 299-313 Social Development Issues 2008, Vol. 30, No. 2, Pp. 90-101. 2008, Vol. 87, No. 3, Pp. 461-472. 2008, Vol. 89, No. 2, Pp. 305-322. Plan Budget Proposals 2014-15, SSD Saswati Das & Diganta Mukherjee Measuring Deprivation due to Child Work and Child Labour: A study for Indian Children Saswati Das Incidence of Child Labour and Child Schooling in India: Pattern and Determinants 87 Child Indicators Research 2011, Vol. 4, No. 3, Pp. 453-466. International Scholarly Research Network Economics Child Labour and Child work: Indian Journal of Pattern, Deprivation and Labour Economics 2012, Vol. 2012, Buddhadeb Ghosh and P. De Reassessing Transaction Costs of Trade at the IndiaBangladesh Border Economic & Political Weekly 2008, Vol. XLIII, No. 29, Pp. 69-79. Chandana Das and Ambar Ghosh Skill Acquisition in LDCs India Macroeconomics Annual 2008, Pp. 107 – 117. Chandana Das and Ambar Ghosh Technological Progress, Ability and Skill Acquisition in LDCs Modern Theories of Growth: A Critique Contemporary Issues and Ideas in Social Sciences The India Economy Review 2009, Pp. 1 – 20. Manash Ranjan Gupta Innovation, Imitation and and Debasis Mondal Multinationalisation in a North-South model: A Theoretical note Manash Ranjan Gupta Intellectual Property Rights and Debasis Mondal Protection and Unemployment in a NorthSouth Model: A Theoretical Analysis Manash Ranjan Gupta Innovation, Imitation and and Debasis Mondal Intellectual Property Rights: Introducing Migration into Helpman’s Model Manash Ranjan Gupta Endogenous Imitation and and Debasis Mondal Endogenous Growth In a North-South Model: A Theoretical Analysis Manash Ranjan Gupta Human capital, inequality, growth and and Bidisha endogenous education subsidy, A Chakraborty Journal of Economics 2008, Vol. 94, No. 1, Pp. 31-62. Economic Modelling 2008, Vol. 25, No. 3, Pp. 463-484. Japan and the World Economy 2008, Vol. 20, No. 3, Pp. 369-394. Journal of Macroeconomics 2009. Vol. 31, No. 4, Pp. 668 – 684. Research in Economics 2009, Vol. 63, No. 2, Pp. 77 – 90. Manash Ranjan Gupta and Trishita Ray Barman Manash Ranjan Gupta and Trishita Ray Barman Manash Ranjan Gupta and P.B. Dutta Fiscal policies, environmental pollution and economic growth Public expenditure, environment, and economic growth Economic Modelling 2009, Vol. 26, No. 5, Pp. 1018 – 1028. Journal of Public Economic Theory 2010, Vol. 12, No. 6, Pp. 1109 – 1134. Manash Ranjan Gupta and P.B. Dutta Skilled-unskilled wage inequality: A general equilibrium analysis Saswati Das doi:10.5402/2012/429506. 2012, Vol.55, No. 2, Pp. 307-333 Determinants Chandana Das and Ambar Ghosh theoretical analysis Skilled-unskilled wage inequality, nontraded good and endogenous supply of skilled labour: A theoretical analysis Prepared By: S. Malakar, Social Sciences Division’s Office Economic Modelling Research in Economics 2009, Vol. 7, Pp. 101 – 111. 2010, Vol. 27, Pp. 923 – 934. 2010, Vol. 64, Pp. 247 – 263. Social Sciences Division, ISI 88 Manash Ranjan Gupta and P.B. Dutta Skilled-unskilled wage inequality and unemployment: a general equilibrium analysis Manash Ranjan Gupta and P.B. Dutta Skilled-unskilled wage inequality, product variety, public input and increasing returns: a static general equilibrium analysis Tarun Kabiraj and P. Roy Chowdhury Adoption of New Technology and Joint Venture Instability Foreign-owned New Subsidiary and Existing Joint Venture: Competition Policy and National Welfare Preemptive merger in a composite good framework Optimal Patent Length in a north-south framework: A comment Technology transfer in a duopoly with horizontal and vertical product differentiation Licensing contracts in Hotelling Structure Tariff induced fee licensing and consumers’ welfare Research in International Business and Finance 2008, Vol. 22, No.2, Pp. 108-123 India Macroeconomics Annual 2008, Pp.119-143 Indian Growth and Development Review 2009, Vol. 2, No. 2, Pp. 141-154 2011, Vol. 56, No. 1, Pp. 51-59 Stochastic Modeling of Buying Behaviour of Indian Customers Existence of the BLUE for Finite Population Mean under Multiple Imputation Calcutta Statistical Association Bulletin Pulakesh Maiti and T.P. Tripathi A Note on Optimum Inclusion Probabilities in WORSampling Scheme Based on Super-Population Model Pakistan Journal of Statistics 2009, Vol. XX(X), Pp.17 Pulakesh Maiti and T.P. Tripathi Some Improved Variance Estimators from a Bivariate Non-normal Population Estimation of non sampling variance components under the linear model approach, Pakistan Journal of Statistics 2009, Vol. XX(X), Pp. 130 Statistics in Transition-New Series Journal of Polish Statistical Association 2010, Vol. 10, Pp. 193 – 222. Amita Majumder and Satya R. Chakravarty Millennium Development Goals: Measuring Progress towards their Achievements Journal of Human Development 2008, Vol. 9, No.1, Pp.109-129. Amita Majumder, Dipankor Coondoo, Alternative Approaches to Measuring Temporal Contemporary Issues and Ideas in 2008, Vol.4, No.1, April. Tarun Kabiraj and S. Marjit Tarun Kabiraj and M. Chaudhuri Tarun Kabiraj and S. Banerjee Tarun Kabiraj and C.C. Lee Tarun Kabiraj and Ching Chyi Lee Tarun Kabiraj Pulakesh Maiti Pulakesh Maiti Pulakesh Maiti Prepared By: S. Malakar, Social Sciences Division’s Office Economic Modelling Economic Modelling Singapore Economic Review 2011, Vol. 28, Pp. 1977 – 1983. 2012, Vol. 29, Pp. 502 – 513. Trade and Development Review 2011, Vol. 4, No. 1, Pp. 19 – 40. Theoretical Economics Letters 2011, Vol. 1, No. 3, Pp. 57 – 62. 2013, Vol. 6, No. 1, Forthcoming. Journal of International Business and Finance Statistics in Transition New Series, Journal of Polish Statistical Assoc. 2008, Vol. 60, No.237 -238, Pp. 111-122 2008, Vol. 9, Pp. 233 – 258. Plan Budget Proposals 2014-15, SSD Geoffrey Lancaster and Ranjan Ray Amita Majumder, Nachiketa Chattopadhyay and Dipankor Coondoo Amita Majumder, Snigdha Chakrabarti and Subhendu Chakrabarti Amita Majumder Amita Majumder, Somnath Chattopadhyay and Dipankor Coondoo Amita Majumder, Somnath Chattopadhyay and Dipankor Coondoo Amita Majumder Ranjan Ray and Kompal Sinha Amita Majumder, Somnath Chattopadhyay and Hasanur Jaman Amita Majumder Ranjan Ray and Kompal Sinha Amita Majumder Manipushpak Mitra and Axel Gautier Manipushpak Mitra, Anirban Kar and Suresh Mutuswami Manipushpak Mitra, Anindya Sundar Chakrabarti, Bikas K. Chakrabarti and Arnab Chatterjee Changes in Poverty with Application to India Demand Threshold, Zero Expenditure and Hierarchical Model of Consumer Demand Public -Community Participation in Household Waste Management in India: An Operational Approach A Characterization of the Composite Price Variable to Approximate a Price Aggregator Function in the Quadratic Almost Ideal Demand System Estimating Spatial Consumer Price Indices Through Engel Curve Analysis District-Level Poverty Estimation: A Proposed Method The Calculation of Rural Urban Food Price Differentials from Unit Values in Household Expenditure Surveys: a new procedure and comparison with existing Methods Decomposition of Inter regional Poverty Gap in India: A Spatial Approach Temporal Comparisons of Prices, Expenditure and Growth in India: A Statewise Analysis 89 Social Sciences, [Web Journal] Metroeconomica Habitat International Economics Bulletin 2009, Vol. 60, No.1, Pp. 91-118. 2009, Vol. 33, No.1 Pp. 125-130. 2009, Vol. 29, No.3, Pp. 2051-2055 Review of Income and Wealth 2011, Vo. 57, No. 1, Pp. 138 – 155. Journal of Applied Statistics 2011, Vol. 38, No. 10, Pp. 2327 – 2343. American Journal of Agricultural Economics 2012, Vol. 94, No. 5, Pp. 1218 – 1235. Empirical Economics 2013, (DOI 10.1007/s00181-0130683-8) Indian Growth and Development Review Forthcoming Sarvekshana Forthcoming Regulation of an open access essential facility Economica On the coincidence of the prenucleolus and the Shapley Value The Kolkata Paise Restaurant Problem and Resource Utilization Mathematical Social Sciences 2008, Vol. 75, No. 300, Pp. 662-682. 2009, Vol. 57, No. 1, pp. 16-25 Physica A 2009, Vol. 388, Pp. 2420-2426. Methodology for Compilation of Spatial Price Iindices to Depict the Differentials across Different States/UTs and Major Cities’ Prepared By: S. Malakar, Social Sciences Division’s Office Social Sciences Division, ISI 90 Manipushpak Mitra, Asim Ghosh, Bikas K. Chakrabarti and Arnab Chatterjee Statistics of the Kolkata Paise Restaurant Problem. Manipushpak Mitra and Arunava Sen Efficient Allocation of Heterogenous Commodities with Balanced Transfers. Comparing Bertrand and Cournot in Mixed Markets. Group Strategyproofness in Queueing Models. Manipushpak Mitra and Arghya Ghosh New Journal of Physics 2010, Vol. 12 (075033) 2010, Vol. 35, Pp.29-48. Social Choice and Welfare Economic Letters Games and Economic Behavior 2010, Vol. 109, Pp. 72-74. 2011, Vol. 72, Pp.242254. P. Bharati, S. Bharati, Chronic Energy Deficiency Manoranjan Pal, S. Among Indian Women by Chakraborty and R. Gupta Residential Status Ecology of Food and Nutrition 2008, Vol. 47, Pp. 170–187. S. Chakrabarty, Manoranjan Pal, S. Bharati and P. Bharati Body form and Nutritional Status among Adult Males of Different Social Groups in Orissa and Bihar States in India HOMO, —Journal of Comparative Human Biology 2008, Vol. 59, Pp. 235–251. P. Bharati, Suparna Som, Suman Chakrabarty Susmita Bharati and Manoranjan Pal Premananda Bharati Manoranjan Pal and Susmita Bharati Prevalence of Anemia and Its Determinants Among Non-pregnant and Pregnant Women in India Asia-Pacific Journal of Public Health 2008, Vol. 20, No. 4, Pp. 347-359. How Parents’ Education and Working Status Affect the nutrition and Immunization Status of Preschool Children in India Determinants of Nutritional Status of Pre-School Children In India Asian Pac. J. of Trop. Med. 2008, Vol. 1, No. 4, Pp. 49-60. J. Biosoc. Sci 2008, Vol. 40, Pp. 801–814. Growth and nutritional status of pre-school children in India: rural-urban and gender differences Collegium Anthropologicum 2009, Vol.33, No. 1, Pp. 7 – 21. Manipushpak Mitraand Suresh Mutuswami Susmita Bharati Manoranjan Pal and Premananda Bharati Premananda Bharati Susmita Bharati Manoranjan Pal Suman Chakrabarty Suparna Som and Ranjan Gupta Premananda Bharati Suparna Som Suman Chakrabarty Susmita Bharati and Manoranjan Pal S. Bharati S. Chakrabarty S. Som, M. Pal and P. Bharati M. Bandyopadhyay A. Bhakta S. Chakrabarty M. Pal and P. Bharati Manoranjan Pal, Bharati, S. Som, and S. Chakrabarty Burden of anemia and its Food and Nutrition socioeconomic Bulletin of the determinants among United Nations adolescent girls in India University 2009, Vol. 30, No. 3, Pp. 217 – 226. Socio-economic Determinants of Underweight Children in West Bengal, India Clinical and bacteriological correlates of whole blood interferon gamma (IFN-γ) in newly detected cases of pulmonary TB Asian Pacific Journal of Tropical Medicine 2010, Pp. 322 - 327. Asian Pacific Journal of Tropical Medicine 2010, Pp. 224 – 231. Singapore Med. J. 2010, Vol. 51, No. 5, Pp. 406 – 412. P. Socioeconomic impact on child immunisation in the districts of West Bengal, India Prepared By: S. Malakar, Social Sciences Division’s Office Plan Budget Proposals 2014-15, SSD S. Bharati, M. Pal and P. Bharati 91 Height and weight of preschool children: A comparison between two National Family Health Surveys in India, 5(1-2), pp. 15-27, March-Sept., 2010. Do Socio-economic Development and Improvement of Health Go Together? A Comparison among Indian States 40(4), pp. 525-543, Dec. 2010 Influence of Ethnicity, Geography and Climate on the Variation of Stature among Indian Populations 2010, Vol. 5, No. 1-2, Journal of Empirical Research Pp. 15 – 27. in Social Science Coll. Anthropol. 2010, Vol. 34, No. 4, Pp. 1207 – 1213. Utpal Kumar De and Manoranjan Pal Dimensions of Globalization and their Effects on Economic Growth and Human Development Asian Economic and Financial Review 2011, Vol.1, No.1, Pp. 1-13 S. Bharati, M. Pal, S. Chakrabarty and P. Bharati Trends in Socio-Economic Asia Pacific and Journal of Public Nutritional Status of Under Health Six Children in India Vol. 23(3), pp. 324–340, 2011. 2011, Vol. 23, No. 3, Pp. 324 – 340. Jadab Kumar Pal, Manoranjan Pal Hare Ram Tiwari and Premananda Bharati Manoranjan Pal, Jadab Kumar Pal, Hare Ram Tiwari and Premananda Bharati Susmita Bharati, Suparna Shome, Manoranjan Pal, Prabir Chaudhury and Premananda Bharati Pronab Sen, Susmita Bharati, Suparna Som, Manoranjan Pal and Premananda Bharati Utpal Kumar De and Manoranjan Pal Risk Factors Associated Journal of Life with Morbidity Pattern of Science Working Children 2011, Vol. 3, No. 2, Pp. 147-156. What Makes Child Labour Go to School? International Labour Review 2011, Vol. 150, No. 3–4, Pp. 375-386. Is Son Preference Pervasive in India? Journal of Gender Studies 2011, Vol. 20(3), Pp. 291-298. Growth and Nutritional Status of Pre-school Children in India: A Comparison of Two Recent Time Periods Food and Nutrition Bulletin 2011, Vol. 32(2), Pp. 84-93. Suparna Som, Manoranjan Pal and Premananda Bharati Susmita Bharati, Dipak Mukherji, Manoranjan Pal, Suparna Som, Dipak Kumar Adak, TS. Vasulu and Premananda Bharati Dipak Kumar Adak, Manoranjan Pal and Premananda Bharati Premananda Bharati, Manoranjan Pal and Susmita Bharati Social Change Willingness to Pay for Domestic Water Use: A Study of Hilly Urban Area in North-East India Asian-African Journal of Economics and Econometrics Anthropological Demography The Anthropology and its Historical Development in India Can Mother’s Education and Family Welfare Reduce Under-nutrition of Pre-school Children in India? Prepared By: S. Malakar, Social Sciences Division’s Office Human Biology Review 2010, Vol. 40, No. 4, Pp. 525 – 543. 2011, Vol. 11, No. 2, Pp. 333-350. 2012, Vol. 2, No. 2, Pp. 40-55. 2012, Vol. 1, No. 2, Pp 207-221. Social Sciences Division, ISI 92 Abhirup Sarkar Redistribution and Trade in Agriculture: Are They Complementary? Political Stability, Local Democracy and Clientelism in Rural West Bengal On the Political economy of a backward region Understanding FDI in Retail: What can Economic Principles Teach Us Metroeconomica 2008, Vol. 59, No. 2, Pp. 212-237 Economic and Political Weekly 2009, Vol. XLIV, No. 9, 28, Pp.46-58. Indian Growth and Development Review 2010, Vol. 3, No. 1, Pp. 122 – 137. 2013, Vol. 18, No. 1 Is the Relative Risk Aversion Parameter Constant Over Time: A Multi-Country Study? Long-Run Predictability in the Indian Stock Market Empirical Economics 2010, Vol. 38, Pp. 605 – 607. Finance India 2011, Vol. 25, No. 3 Pp. 817 – 834 Nityananda Sarkar and Debabrata Mukhopadhyay Stock Returns under Alternative Volatility and Distributions Assumptions: The Case for India International Econometric Review 2013, Vol. 5, No. 1, Pp. 1 – 19. Chaiti Sharma Biswas Can employment empower women more at the household level in India? 2008, Vol. 3, No. 7, Pp. 43-51 Snigdha Chakrabarti and Chaiti Sharma Biswas An Exploratory Analysis of Women’s Empowerment in India: A Structural Equation Modelling Approach The International Journal of Interdisciplinary Social Sciences Journal of Development Studies Abhirup Sarkar, P. Bardhan, D. Mookherjee and S. Mitra Abhirup Sarkar Abhirup Sarkar Nityananda Sarkar and Samarjit Das Nityananda Sarkar and Debabrata Mukhopadhyay Prepared By: S. Malakar, Social Sciences Division’s Office Economic and Political Weekly 2012, Vol. 48.No.1, Pp.164-180 Plan Budget Proposals 2014-15, SSD 93 Linguistic Research Unit Probal Dasgupta 2008. Dasgupta, Probal. Transparency and arbitrariness in natural language: some empirical issues. Rajendra Singh (ed.) Annual Review of South Asian Languages and Linguistics 2008. Berlin: Mouton de Gruyter. 3-19. 2008. Dasgupta, Probal. Names, writing and perspective. Journal of Humanities and Social Sciences 5. 126-34. 2009. Dasgupta, Probal. Bangla vector verbs and their selectivities. Interdisciplinary Journal of Linguistics [U. of Kashmir, Srinagar] 2.41-68. 2010. Dasgupta, Probal. Compositionality, the prose default and poetry: a cognitive approach. International Journal of Mind, Brain and Cognition 1:2.55-76. 2011. Dasgupta, Probal. Imperatives, interrogatives and wide scope in Bangla. Indian Linguistics 72:103-112. 2012. Dasgupta, Probal. Co-representation of linguistic structures. Indian Linguistics 73:1-4.4759. 2012. Dasgupta, Probal. La politique linguistique et les langues indiennes moins répandues. Droit et Cultures 63:143-160. Niladri Sekhar Dash Dash, Niladri Sekhar “Toward Lemmatization of Bengali Words for Building Language Technology Resources”. South Asian Language Review. 2008. Vol. 17. No. 2. Pp. 1-15. Dash, Niladri Sekhar “Context and Contextual Word Meaning”. SKASE Journal of Theoretical Linguistics. 2008. Vol. 5. No. 2. Pp. 21-31. Dash, Niladri Sekhar “Corpus Linguistics: An Empirical Approach for Studying a Natural Language”. Language Forum. 2008. Vol. 34. No. 2. Pp. 1-21. Dash, Niladri Sekhar “Linguistic works in Bengali (2001-2007): a brief review”. Annual Review of South Asian Languages and Linguistics. 2008. Vol. 15. No. 1. Pp. 217-235. Dash, Niladri Sekhar, Payel Dutta Chowdhury and Abhisek Sarkar. “Naturalization of English words in modern Bengali: a corpus-based empirical study”. Language Forum. 2009. Vol. 35. No. 2. Pp. 127-142. Dash, Niladri Sekhar and Payel Dutta Chowdhury “Bengali matrimonial classifieds: some sociolinguistic cues to marital orientation”, Language Forum. 2009. Vol. 35. No. 2. Pp. 34 -52. Dash, Niladri Sekhar “Corpus linguistics: a time-tested strategy for studying a natural language”. Language Forum. 2009. Vol. 35. No. 2. July-Dec. Pp. 5-18. Dash, Niladri Sekhar “Relevance of electronically developed dialect corpora in dialectology”. Indian Linguistics. 2009. Vol. 70. No, 1-4. Pp. 91-101. Dash, Niladri Sekhar “Linguistic tasks on translation corpora for developing resources for manual and machine translation”, SKASE Journal of Theoretical Linguistics, 2010. Vol. 7. No. 2. Pp. 2-18. Dash, Niladri Sekhar “Translation Corpora and Machine Aided Translation”, Translation Today, 2010. Vol. 6. No. 1-2. Pp. 134-153. Dash, Niladri Sekhar “Use of English corpora as a primary resource to teach English to the Bengali learners”. Indian Journal of Applied Linguistics. 2011. Vol. 37. No. 1. Pp. 7-18. Dash, Niladri Sekhar “The Bengali Script and the Unicode”. Print Out. Vol. 2. No. 8. Pp. 1-16. Dash, Niladri Sekhar “Some physical advantages of an electronic dictionary”. Indian Linguistics. 2011. Vol. 71. No. 1-4. Pp. 93-102. Dash, Niladri Sekhar “Baidyutin Bangla Abhdhan tairi karar kichu samasya”. Alochana Chakra. 2012. Vol. 32. Pp. 166-178. Dash, Niladri Sekhar “Lexical Generativity of Bengali Prefixes: A Corpus Based Investigation”. Sino-US English Teaching. 2012. Vol. 9. No. 5. Pp. 1171-1180. Dash, Niladri Sekhar “Language Specific Synsets in Bengali: Some Empirical Explorations”. Journal of Advanced Linguistic Studies. 2012. Vol. 1. No. 1-2. Pp. 189-207. Prepared By: S. Malakar, Social Sciences Division’s Office 94 Social Sciences Division, ISI Dash, Niladri Sekhar and Pronomita Basu “Developing Scientific and Technical Terminology Database from Electronic Language Corpora”. Language Forum. 2012. Vol. 38. No. 1. Pp. 5-21. Dash, Niladri Sekhar “From KCIE to LDC-IL: Some Milestones in NLP Journey in Indian Multilingual Panorama”. Indian Linguistics. 2012. Vol. 73. No. 1-4. Pp. 129-146. Dash, Niladri Sekhar “Linguistic Divergences in English to Bengali Translation”. International Journal of English Linguistics. 2013. Vol. 3. No. 1. Pp. 31-40. Dash, Niladri Sekhar “English Language Corpora as a Secondary ELT Resource for Indian Learners”. Sino-US English Teaching. 2013. Vol. 10. No. 1. Pp. 10-22. Dash, Niladri Sekhar “Part-of-Speech (POS) Tagging in Bengali Written Text Corpus”. Journal of Linguistics and Technology. 2013. Vol. 1. No. 1. Pp. 53-96. Dash, Niladri Sekhar (2013) Bangla Bhasay Pranibachak Shabda Byabaharer Samaj Manstattvik Ruparekha. Alochana Chakra. Vol. 34. No. 1. Pp. 169-199. Prepared By: S. Malakar, Social Sciences Division’s Office Plan Budget Proposals 2014-15, SSD 95 Population Studies Unit Research Publications in the Population Studies Unit (2008 – 2013) Barman, Subhash (2013). Socio-economic and demographic differentials of contraceptive usage in Indian states: A study based on NFHS data, Journal of Human Ecology, 42(1), 53-68. Barman, Subhash (2013). Socio-economic and demographic determinants of unmet need for family planning in India and its consequences, Research on Humanities and Social Sciences, 3(3), 62-75. Barman, Subhash (2011). Socio-economic and demographic impact on child labour in India, Journal of Alternative Perspectives in the Social Sciences, 3(2), 376-403. Barman, Subhash (2010). Parental education, parental death, poverty and socio-economic impact on school attendance status of children in India, Academic Leadership, 8(4). Barman, Subhash (2009). Role of the elected panchayat samity members in national health and family welfare programs- A Case Study, The Qualitative Report, 14(1), 20-41. Barman, Subhash (2009). Socio-economic status of the scheduled castes, scheduled tribes and other backward classes in India, Voice of Dalit, 2(1), 99-126. Barman, Subhash (2008). Role of gram panchayat members in improving child immunisation and maternal-child health programmes, Bharatiya Samajik Bichintan, 7(1), 63-72. Datta Pranati (2011 ). Female Trafficking and Illegal Migration from Bangladesh to India, Pakistan Journal of Women Studies, 18(1), 47-62. Datta Pranati (2011). Trafficking and Illegal Female Nepali Migration in India, International Journal of Afro Asian Studies, 2(1), 34-44. Datta, Pranati. (2011). Immigration from Bangladesh to India : Causes,Consequences and Policy, International Journal of Mainstream Social Sciences, 1(2), 11-22. Datta Pranati (2010). Urbanisation and Environment, Geography and You, 10(60), 6-10. Datta Pranati (2010). Evaluation of Indian Census Data, International Journal of Human Development and Information System, 3(1&2), 27-36. Datta Pranati (2009). Tribal Fertility by Parity Progression Ratio in India and Madhya Pradesh , The Oriental Anthropologist, A Bi-Annual International Journal of the Science of Man, 9(1), 23-36. De, Partha, Dhar, Arpita (2013) Inequality in Child Mortality across different States of India: A Comparative Study; Journal of Child Health Care, Sage Publications, London, United Kingdom (Online First publication). DOI: 10.1177/1367493512468359, http://chc.sagepub.com/ content/early/recent. De, Partha, Dhar, Arpita, Bhattacharya, B.N. (2012) Efficiency of Health Care System in India: An Inter-State Analysis using DEA Approach; Social Work in Public Health, Vol. 27, Issue 5, pp. 482-506, Taylor & Francis, Routledge. Datta Pranati, Sadhu Swati, Bhattacharya B.N., Majumdar P.K., (2008, Oct-Dec) Demographic Effects of Forced Illegal Migration from Bangladesh to West Bengal : A Quantitative Study. Dialogue, A Journal of Astha Bharati, Vol 10, No. 2, New Delhi, India. Pp 144-156. Pasupuleti, Samba Siva Rao and Pathak Prasanta [2010] “Special form of Gompertz model and its application”, Genus, Vol. LXVI, No.2, p. 95-125. Pasupuleti, Samba Siva Rao and Pathak, Prasanta [2010] “Spatial and Temporal Changes in Fertility Behavior of Indian Women Cohorts”, Genus, Vol. LXVI, No.3, p. 69-92. Pathak, Prasanta and Chakraborty, Sonali [2009] “Statistical Models for Finding out Determinants of Potentiality to Get Absorbed in Jobs for Different Categories of Labour in Three North Indian States” , Indian Journal of Regional Science, Vol. XXXXI, No.1, p.91-102. Kumar, Santosh, Pathak, Prasanta and Gupta, S.D. 2008. Assessment of Sustainable Health Care Quality: A Study of State Owned Tertiary Care Hospital, Journal of Cooperation among University, Research and Industrial Enterprises, Vol.1, No.3, BITS, Pilani, India. Prepared By: S. Malakar, Social Sciences Division’s Office 96 Social Sciences Division, ISI Psychology Research Unit D. Dutta Roy (Assistant Professor) Dutta Roy,D.(2009) - Construct validity of writing motivation questionnaire. International Journal of Psychological Research , (published from USA) 3,2,(in print) Dutta Roy, D. and Basu, K. (2010). Autistic behaviour analysis: Pre-post and repeated measure design. PSYBER NEWS: International Psychology Research Publication, 1, 4, 39-46. Roy, A. and Dutta Roy,D.(2010). Predicting cash flow of Sarva Shiksha Abhiyan in West Bengal: An exploratory study of public finance. Journal of Management research in Emerging economics. Vol.1.1. 60-69. Dutta Roy, D.(2010).Cluster Analysis for Test-Retest Reliability. International Journal of Psychological Research ,(published from USA). 3,1,132-140. Dutta Roy, D.(2011).Construct validity of Reading motivation. Journal of the Indian Academy of Applied Psychology, vol.37,No. 1, 106-113. Dutta Roy, D. and Mondal,A. (2010). Information organization errors in backward digit span task. PSYBER NEWS: International Psychology Research Publication,1, 3, 43-49. Ganguly, A. and Dutta Roy,D. (2010). Web Content analysis to study researches on entrepreneurial psychology. PSYBER NEWS: International Psychology Research Publication,1, 2, 27-31. Dutta Roy, D. (2009). Self-efficacy of Agricultural farmers: A case study. Journal of the Indian Academy of Applied Psychology, 35, 2, 323-328. Dutta Roy, D. (2008). Assessing Validity of Web-Based Computer Adaptive Training Modules, Journal Of The Indian Academy of Applied Psychology, Vol. 34, No.1, January, 127-136. Dutta Roy, D.(2006). Clusturing academic profiles of tribal and non-tribal school students of Manipur. Journal of Psychometry, 20,2, 1-12. Dutta Roy, D. (2006). Managing Incentive for Innovation, Effective Executive, 8, 11, 87-90. Dutta Roy, D.(2006). Managing school infrastructure for indigenous people in hills of Manipur, The Vision, Journal of Management and Allied Sciences, 2,1, 27-32. Dutta Roy, D. (2006).Psychological distress and body weight in Antarctic expedition, Indian Journal of Applied Psychology, 43, April, 63-69. Dutta Roy, D. (2006). Development of picture drawing test to assess consciousness layers of tribal children of Tripura, Journal of the Indian Academy of Applied Psychology,Vol. 32, No. 1, 20-25 Anjali Ghosh (Professor) Ghosh, A. - Academic Self-Efficacy and Achievement in a Group of siblings of Primary Schools. Psychological Studies, 2007, Vol.52, No.4, 364-371. Basak, R. & Ghosh, A. – Ego-Identity Status and Its relationship with self-esteem in a Group of Late Adolescents, Journal of The Indian Academy of Applied Psychology, 2008, 34, 2, 337-344. Ghosh, A. (with Shaikh F.A) – Perceived Social Support and Recovery from Substance Abuse: A Qualitative Enquiry, Indian Journal of Community Psychology, 2008, 4, 2, 131-143. Ghosh, A. (with Matsumoto, D. et al.) – Mapping Expressive Differences Around the World: The Relationship Between Emotional Display Rules and Individualism Versus Collectivism, Journal of Cross-Cultural Psychology, Sage USA, 2008, 39, 55-74. Ghosh, A. – Transactive Memory self-construal and subjective well-being in a group of Indian couples. Interpersona, 2008, 2 (2), 173-192. Basak, R. & Ghosh, A. – Relation of Parental Education and Occupation with Mathematics Selfefficacy and Achievement of Students, Journal of Education and Psychological Studies, 2010, 4(1), 1-7. Ghosh, A. – Expressive Differences for Emotions In Visually Challenged and Normal Individuals, International Journal of Arts and Sciences, 2010, 3(15), 255-265. Ghosh, A. – (with Sinha, J.B.P. and others) – An Exploration of the Indian Mindset, Psychological Studies, 2010, 55(1), 3-17. Prepared By: S. Malakar, Social Sciences Division’s Office Plan Budget Proposals 2014-15, SSD 97 Shaikh, F.A. & Ghosh, A. – Exploring Life Meaningfulness and Its Psychosocial Correlates Among Recovering Substance Users – An Indian Perspective. World Academy of Science, Engineering and Technology, 2010, 66, 1012-1017. Basak, R. & Ghosh, A. – Self-efficacy, Locus of Control and Job Satisfaction of School Teachers. Indian Journal of Health & Well-being, 2010, 1, 1-2, 34-35. Shaikh, F.A., Ghosh, A. & Azam, A.A.S. – Determinants of Perceived Social Support among Recovering Substance Users in Kolkata. Journal of Health & Well-being, 2010, 1, 1-2, 65-69. Basak,R. & Ghosh, A.-Do Personality Traits have Influence on Self-Efficacy Belief of School Teachers ? Indian Journal of Positive Psychology, 2010, 2 (1), 43-45. Shaikh, F.A., & Ghosh, A.- Measuring Meaning Beyond Substance Use : Emperical Understanding of the Concept among Kolkata Substance Absuers. IndianJournal of Positive Psychology, 2010, 2(1), 39-42. Basak, R. & Ghosh, A.- School Environment and Locus of Control in Relation to Job Satisfaction Among School Teachers – A study from Indian Perspective, Procedia-Social & Behavioural Sciences, Elsevier Ltd, 2011, 29,1199-1208. Shaikh, F.A., & Ghosh, A. -Effect of Social Support and Self-efficacy on Depression among recovering Substance Users. Journal of Psychosocial Research, 2011, 6(2),211-219. Ghosh, Anjali: Individualist-Collectivist Orientations and Achievement value in college students. Journal of Transpersonel Research, 2012, 4(1), 39 - 46, Rumki Gupta (Associate Scientist ‘C’) Gupta Rumki and Panja Sanghamitra (2008-2009) - Gender and Religion Bias on the Academic Achievement of the students of Class X Level, Journal of Education and Psychology, 65, 1- 4, 17 - 29. Gupta Rumki (2010) - Empowerment and Gender Difference in Education Status. Delhi Business Review, 11, 1, 55 - 60. Gupta Rumki (2010) - Opinion Survey on Curriculum, Performance in Madhyamik Vis-à-vis Higher Secondary Level. Gorakhpur Social Scientist, 1, 2, 20 - 28. Gupta Rumki and Dhara Jayeta (2010) - Dimensions of Self-Concept: A Factor Analytic Study. Indian Journal of Social Science Researches, 7, 2, 92-99. Prepared By: S. Malakar, Social Sciences Division’s Office Social Sciences Division, ISI 98 Sociological Research Unit (SRU) Bhola Nath Ghosh Papers published in journals: 2009: “Milk-Co-operatives and Rural Development in West Bengal: A few issues”, (with Ranjit Karmakar), in South Asian Anthropologist, Volume 9, Number 2, page 167-176, Serial Publications, New Delhi. 2009: "Empowerment of Khasi Women in Meghalaya: A Case study", (with Jyoita Roy Choudhury), in Journal of Empirical Research in Social Sciences, Vol. 4, No. 1-2, MarchSeptember, Page 68-81, Assam. 2010: “Democratic Centralism., Party Hegemony and Decentralization in West Bengal”, (with Partha N. Mukherji), Sociological Bulletin, 59 (2), May- August, page 1-17, ISSN; 00380229, New Delhi. 2010: “Empowerment of Women: A study inTripura & Meghalaya”, in, South Asian Anthropologist, Volume 10, Number 1, page 11-28, March, Serial Publications, New Delhi. 2010: “Manab Nirapattya, Manbadhikar Abang Unnayan”, (with Ranjit karmakar),.in, Samaj Tattya, June, Vol. 16, Issue-1, Pp. 39-41, ISSN 0975-9980, A Bi-lingual Half-yearly Journal of Sociology, Kolkata. 2010: “Gender Empowerment, Deprivation and Poverty in Rural Jharkhand: A Case Study”, (with N.Sen,& U.K.De), in International Journal of Current Research, Vol. II, Page 107-116, December, ISSN: 0975-833X, available online at http:// www.journalcra.com. 2010: “Creation in Rural Areas”, in Samaj-Tattya, Vol.16, Issue -2, December 2010, Page 60-67, ISSN 0975-9980, A Bi-lingual Half-yearly Journal of Sociology, Kolkata. 2010: “Status and Role of Women in the Rural Khasi Society of Meghalaya”, with Utpal Kumar De, in, North- East India Council for Social Science Research (NEICSSR), in the Volume No. 34, No. 2, Page. 1 -17, October, Shillong, Meghalaya, ISBN: 0970-7913. 2011: “Women in Information Communication Technology” (with Asmita Bhattacharyya), in, Asian Journal of Science and Technology, Vol. 2, Issue 3, Page 006- 014, March 2011, ISSN: 0976- 3376, Website: www. Journalajst.com. 2011: “Problems of Education of Scheduled Tribes and Scheduled Castes: A case study in Kolkata and Surroundings and Medinipur and Surrounding areas”, in Journal US-China Education Review, David Publishing, USA, June 2011, Volume 8, No.6, ISSN 1548-6613. 2011: “Helpless Women: In the Context of the Present Fundamentalism & Globalization”, in Jadavpur University Journal of Sociology, Jadavpur University, Vol. 4, number 4, June 2011, ISSN 0976- 5212, Page, 86-97. 2011: “Singur: A Case Study for Industrialization”, in South Asian Anthropologist, 2011 (2): 115-120 Serial Publications, New Delhi. 2012: “Women in Indian Information Technology (IT) Sector: A Sociological Analysis”, in International Organisation of Scientific Research. (IOSR) Journal of Humanities And Social Science (JHSS), Volume 3, Issue 6 (November-December, 2012), PP 45-52, ISSN: 22790837, ISBN: 2279-0845, www.Oosrjournals.org, DOI (Digital Object Identifier) number is 10.9790/0837-0364552,check it through www.doi.org 2012: “Gender differences specially in health: A Case study in Meghalaya and Tripura”, in IOSR Journal of Humanities and Social Science (JHSS), Pp. 18-25, ISSN: 2279-0837, ISBN: 2279-0845, 0461825,check it through www.doi.org 2012: “Co-operatives: A few words”, in Asian Journal of Science and Technology, Vol.4, Issue, 11. PP. 050-053, ISSN: 0976- 3376, Website: www. Journalajst.com. 2012: “Concept and Implications of Empowerment of Women in North-East India: A Case Study”, in, Society Today: An Interdisciplinary of Social Sciences, Vol.2, PP. 1-19, December 2012, Editor, Anirban Banerji, ISSN 2319-3328, available online at http// www.society today. Prepared By: S. Malakar, Social Sciences Division’s Office Plan Budget Proposals 2014-15, SSD 99 2013: “Ethnicity: A Continuum on Education”,(with Sujata Chakraborty), in US-China Education Review, B Education Theory, Vol. 3, Number -2, PP. 128- 147, ISSN 2161-6248, David Publishing Company, www.davidpublishing.com, February 2013 (Serial Number 21). Molly Chattopadhyay and Other Scientific Staff 2008-2009 Chattopadhyay, Molly: Women Workers in Mica-Manufacturing Industry of Giridih, Jharkhand. Retrieved January 20, 2008, from Artisanal and Small-Scale Mining in Asia-Pacific Case Study Series edited by Joel Katz. Website http://www.asmasiapacific.org/ asm_case.php Chattopadhyay, Molly and David Seddon. “Life histories and long-term change: Rural Livelihoods and Gender Relations in a West Bengal Village”, Economic and Political weekly, Vol. XXXVII, No.49, December 7, 2002, Pp. 4935-4940 reproduced in Towards Empowering Indian Women: Mapping Specifics of Tasks in Crucial Sectors, edited by R.B.S. Verma, H.S. Verma and Nadeem Hasnain. New Delhi, Serials Pub., 2008, pp.362-374. Bharati, P., Som, S., Chakrabarty, S., Bharati, S and Pal, M. Prevalence of Anaemia and Its Determinants among Non-Pregnant and Pregnant Women in India. Asia Pacific Journal of Public Health. 20: 347-359. Bharati, P., Bharati, S., Pal, M., Chakroborty, S and Gupta, R. Chronic energy deficiency among the Indian women by residential status, Ecology Food and Nutrition. 47: 170-187. Bharati, S., Pal, M and Bharati, P. Determinants of growth and nutritional status of pre-school children in India. Journal of Biosocial Science. 40: 801-814. Chakrabarty, S., Pal, M., Bharati, S and Bharati, P. Body Mass Index and Nutritional Status of Adult Males of Orissa and Bihar States in India. Homo-Journal of Comparative Biology. 59: 235-251. 2009-2010 Chattopadhyay, Molly & Sonali Chakraborty: “Liberalization and Segregation: Changes in the Pattern of Segregation in the Factory Sector from 1989-90 to 2000-01”, Crossing the Borders, Vol.2, 2009, Pp. 91-98. C.R.Pathak, Chakraborty Sonali, 2009, ‘Statistical models for job Potentiality in different caregories of Labour in three north Indian States’ Indian Journal of Regional Science, vol xxxxi,p.p 91-102. Bharati, P., Bharati, S., Pal, M., Chakrabarty, S., Som, S and Gupta, R. Growth and Nutritional Status of Pre-School Children in India: Rural Urban and Gender Differences. Collegium Antropologicum 33: 7–21. Bharati, P., Shome, S., Chakrabarty, S., Bharati, S and Pal, M. Burden of anemia and its socioeconomic determinants among adolescent girls in India. Food and Nutrition Bulletin. 30: 217-226. 2010-2011 Bharati, S., Chakrabarty, S., Som, S., Pal, M and Bharati, P. Socio economic determinants of underweight children in West Bengal, India: A district-wise analysis. Asia Pacific Journal of Tropical Medicine. 3:322-327. Bharati, S., Adak, DK., Som, S., Mukherji, D., Pal, M., Vasulu, TS and Bharati, P. Variation of Stature in Indian Populations: Influence of Ethnicity, Geography and Climate. Collegium anthrpopologicum. 34:159-165. Som Suparna, Pal Manoranjan and Bharati Premananda. Do Socioeconomic development and improvement of health go together? A comparison among Indian states. Social Change, 40 (4): 525-543. Som S, Pal M , Chakrabarty S, Bharati P. Socio-Economic Impact on Child Immunization in the Districts of West Bengal, India. Singapore Medical Journal.51(5): 406-412. Bharati, S., Pal, M and Bharati, P. Height and weight of pre-school children: A comparison between two National Family Health Surveys in India. Journal of Empirical Research in Social Science. 5: 15-27. Prepared By: S. Malakar, Social Sciences Division’s Office 100 Social Sciences Division, ISI 2011-2012 Chattopadhyay, Molly: “Women workers in the mica industry: A case study”, Indian Journal of Gender Studies, October 2011, 18:311-340 (Sage publications). Sen Pronab, Bharati Susmita, Som Suparna, Pal Manoranjan and Bharati Premananda. Growth and nutritional status of pre-school children in india: a study of two recent time periods. Food and nutrition bulletin, 32 (2): 84 – 93. Bharati, S., Shome, S., Pal, M., Chaudhury, P and Bharati, P. Is Son Preference Pervasive in India? Journal of Gender Studies , 20 (3) : 291-298. Bharati, S., Pal, M., Chakrabarty, S and Bharati, P. Trends in Socio-Economic and Nutritional Status of Children younger than 6 years in India, Asia Pacific Journal of Public Health, 23.(3) : 324-340. Bharati, S,. Pal, M., Bandyopadhyay,M., Bhakta,A., Chakrabarty,S and Bharati, P. Prevalence and causes of low birth weight in India, Malaysian Journal of Nutrition,17, 301- 313, 2011. Jana, Rabindranath: Means and variances of some statistics in simple social network with given out-degrees, Calcutta Statistical Association Bulletin, Vol.63 (Special 7-th Triennial Proceedings Volume), 2011(December), Nos. 249-252, pp. 359-369. 2012-2013 Chattopadhyay, Molly, Sonali Chakraborty and Richard Anker. “Sex Segregation in India’s Formal Manufacturing Sector”, International Labour Review. Vol. 152/1, March 2013, Pp: 43-58. Som Suparna; Ulijaszek, Stanley; Pal, Manoranjan; Bharati, Susmita and Bharati, Premananda. Variation in height and BMI of adult Indians. Journal of Biosocial Science (in Press). Bharati, S., Golam Hossain, M and Bharati, P.: Variability of Human Head Form in India. LAP Lambert Academic Publishing, Saarbrucken, Germany, pages 168. Malnutrition: Twin Burdens of Undernutrition and Overnutrition, Nova Science Publishers, Inc. Hauppauge, New.York., pp. 165-176. Jana, Rabindranath. On Social Networks: formation, data and few analytic techniques. As invited speaker in the ‘Workshop on Social Networks’, jointly organized by Institute of Mathematical Sciences, Chennai and Indian Institute of Technology, Madras, during 20-24 February, 2012. website DOI: http://www.imsc.res.in/~sitabhra/meetings/ socialnetwork0212/talks/Rabindranath_Jana.pdf Jana, Rabindranath, Bandyopadhyay, Suraj and Choudhuri, Anil: Reciprocity among farmers in farming system research: Application of social network analysis, Journal of Human Ecology, 41(1): 45-51. Jana, Rabindranath and Choudhuri, Anil: Studying various aspects of social networks with socioeconomic changes in a rural area: A case study from West Bengal, Guru Nanak Journal of Sociology, Accepted for publication in 2013 issue of the Journal. Prepared By: S. Malakar, Social Sciences Division’s Office Plan Budget Proposals 2014-15, SSD 101 Sampling & Official Statistics Unit Significant Research Publications during 2008 – 2013: Prasanta Pathak A) List of Published Papers in Journals Kumar, Santosh, Pathak, Prasanta and Gupta, S.D. 2008. Assessment of Sustainable Health Care Quality: A Study of State Owned Tertiary Care Hospital ,Journal of Cooperation among University, Research and Industrial Enterprises, Vol.1, No.3, BITS, Pilani, India. Pathak, Prasanta and Chakraborty, Sonali [2009] “Statistical Models for Finding out Determinants of Potentiality to Get Absorbed in Jobs for Different Categories of Labour in Three North Indian States” , Indian Journal of Regional Science, Vol. XXXXI, No.1, p.91-102. Pasupuleti, Samba Siva Rao and Pathak Prasanta [2010] “Special form of Gompertz model and its application”, Genus, Vol. LXVI, No.2, p. 95-125. Pasupuleti, Samba Siva Rao and Pathak, Prasanta [2010] “Spatial and Temporal Changes in Fertility Behavior of Indian Women Cohorts”, Genus, Vol. LXVI, No.3, p. 69-92. Diganta Mukherjee A. Research Papers Published in Journals `Poverty Measures Incorporating Variable Returns to Population Growth', Social Choice and Welfare, 2008, 31, 97 - 107. ‘Role of Parental Education in Schooling and Child Labour Decision: Urban India in the Last Decade’ Social Indicators Research, 2008, 89, 305 – 22 (with Saswati Das). ‘Parental Education Influencing Schooling and Child Labour Decision: Urban India in the New Millennium’ Arthaniti, 2009 (with Saswati Das). ‘Price Exploration and Financial Market Efficiency’ ICFAI Journal of Financial Risk Management, 2009 (with Jyotiska Bhattacharjee and Suraj Dey). ‘Equlibrium and Stability of a Stock Market Game with Big Traders’ Differential Equations and Dynamical Systems, 17 (3), 283-299, 2009 (with Gopal K. Basak and Mrinal Ghosh). ‘Attitude to Schooling, Wage Premium and Child Labour' Indian Growth and Development Review, 2 (2), 2009 (with Uday Bhanu Sinha). ‘Pareto Honouring Poverty Reduction’, Bulletin of Economic Research, DOI: 10.1111/j.14678586.2010.00379.x, 2011. ‘Influence of Big Traders on the Stock Market: Theory and Simulation’ Dynamic Games and Applications: 1(2), pp. 220 – 52, 2011 (with Gopal K. Basak and Mrinal K. Ghosh). ‘Are women self help group members economically more empowered in Left-run municipalities?’ Development in Practice, 2012, DOI: 10.1080/09614524.2013.750644 (with Zakir Husain and Mausumi Dutta). Sandip Mitra A. Research Papers Published in Journals 1. ‘Local Democracy and Clientelism: Implications for Political Stability in west Bengal’, Economic Political Weekly, February, 2009 (with Pranab Bardhan, Dilip Mookherjee, Abhirup Sarkar). Kajal Dihidar A) Research Papers Published in Journals Bose, M., Chaudhuri, A., Dihidar, K. and Das, S. (2011). Model-cum-design based estimation of the prevalence rate of a disease in a locality using spatial smoothing, Statistics, 45, 293-305. Mukhopadhyay, S., Bhattacharya, S. and Dihidar, K. (2011). On Bayesian ‘Central Clustering’: Application To Landscape Classification of Western Ghats, The Annals of Applied Statistics 5(3), 1948-1977. Chaudhuri, A., Bose, M. and Dihidar, K. (2011). Estimating sensitive proportions by Warner’s randomized response technique using multiple randomized responses from distinct persons sampled, Statistical Papers, 52, 111-124. Prepared By: S. Malakar, Social Sciences Division’s Office 102 Social Sciences Division, ISI Chaudhuri, A., Bose, M. and Dihidar, K. (2011). Estimation of a sensitive proportion by Warner’s randomized response data through inverse sampling, Statistical Papers 52, 343-354. Dihidar, K.(2011). Modifying classical randomized response techniques with provision for true response, Calcutta Statistical Association Bulletin, 63, (Special 7th Triennial Proceedings Volume), 223-240. Dihidar, K. (2009). On shrinkage estimation procedure combining direct and randomized responses in unrelated question model, Journal of the Indian Society of Agricultural Statistics, 63, 283-296. Chaudhuri, A. and Dihidar, K. (2009). Estimating means of stigmatizing qualitative and quantitative variables from discretionary responses randomized or direct. Sankhya, Series B, 71, 123-136. Chaudhuri, A., Bose, M. and Dihidar, K. (2009). Rao-Hartley-Cochran sampling with competitive estimators, Calcutta Statistical Association Bulletin, 61, 227-242. Ghosh, J.K., Dihidar, K. and Samanta, T. (2008). On different clustering of the same data set, Advances in Statistics, B.K. Kale Felicitation Volume, 112-119. Amitava Sarkar (Visiting Scientist) A. Research Papers Published in Journals 1. “Long Memory in Stock Returns: Insights from the Indian Market”, International Journal of Applied Economics & Finance, 2011 (with others). 2. "Evidence of chaos: A Tale of Two Exchange Rates", Empirical Economics Letters, Volume 10, No. 8, 2011 (with others). 3. “Dynamics of Emerging India’s Banking Sector Assets: A Simple Model”, Journal of Asset Management, April 2010 (with others). 4. “Indian Stock Market Volatility in Recent Years: Transmission from Global and Regional Contagion and Traditional Domestic Sectors”, Journal of Asset Management, Volume 10, No.1, April, 2009 (with others). Sunil Kumar (Visiting Scientist) A. Research Papers Published in Journals ‘A regression approach to the estimation of finite population mean in presence of non-response’, Australian and New Zealand Journal of Statistics, 2008, 50(4), 395-408 (with H. P. Singh) ‘A general family of estimators of finite Population ratio, product and mean using two phase sampling scheme in the presence of non-response’, Journal of Statistical Theory and Practice, 2008, Vol. 2, No. 4, 677-692 (with H. P. Singh). ‘Effect of non-response in sampling over two successive occasions using auxiliary information’, Statistics in Transition, 2008, Vol. 9, No. 2, 273-296 (with H. P. Singh). ‘A general class of estimators of the population mean in survey sampling using auxiliary information with sub sampling the non-respondents’, The Korean Journal of Applied Statistics, 2009, Vol. 22, No. 2, 387-402 (with H. P. Singh). ‘A general procedure of estimating the population mean in the presence of non-response under double sampling using auxiliary information’. SORT, 2009, 33, 1, 71-84. ‘An alternative family of estimators for population mean in presence of non-response when the population mean of auxiliary character is not known’, Journal of Applied Statistical Science, 2009, Vol. 17, No. 2, 199-218 (with H. P. Singh). ‘A general class of DSS estimators of population ratio, product and mean in the presence of nonresponse based on the sub-sampling of the non-respondents’, Pakistan Journal of Statistics, Vol. 26, No. 1, 203–238, 2009, (with H. P. Singh). ‘Estimation of multivariate indirect methods in presence of non-response in successive sampling’, METRON, Vol. LXVII, No. 2, 153-175, 2009, (with H. P. Singh). ‘Estimation of mean in presence of non-response using two phase sampling scheme’, Statistical Papers, 50(3), 559-582, 2010, (with H. P. Singh). ‘Estimation of population product in presence of non-response in successive sampling’, Statistical Papers, 51(4), 975-996, 2010, (with H. P. Singh). ‘Improved estimation of finite Population mean when sub-sampling is employed to deal with non-response’, Communication in Statistics - Theory and Methods, 39, 5, 791-802, 2010, (with H. P. Singh and M. Kozak). Prepared By: S. Malakar, Social Sciences Division’s Office Plan Budget Proposals 2014-15, SSD 103 ‘Improved estimation of population mean under two phase sampling with sub sampling the nonrespondents’, Journal of Statistical Planning and Inference, 140, 9, 2536-2550 (with H. P. Singh). ‘Estimation of mean using multi auxiliary information in presence of non-response’, Communications of the Korean Statistical Society, Vol. 17, No. 3, 391-411, 2010, (with H. P. Singh). ‘Improved class of estimators using multi-auxiliary information in successive sampling’, Pakistan Journal of Statistics and Operational Research, Vol. VI, No. 2, 117-124, 2010, (with H. P. Singh and J.P.S. Joorel). ‘A general class of chain– type estimators in presence of non-response under double sampling scheme’, Journal of Modern Applied Statistical Methods, Vol. 9, No. 2, 512-519, 2010, (with H. P. Singh and S. Bhougal). ‘Combination of ratio and regression estimators in presence of non-response. Brazilian Journal of Probability and Statistics, Vol. 25, No. 2, 205-217, 2011, (with H. P. Singh). ‘Sub sampling the non-respondents in cluster sampling on sampling on two successive occasions’, Statistics in Transition, Vol. 12, No. 1, 9 – 24, 2011, (with H. P. Singh). ‘Under double sampling a general ratio – type estimator in presence of non-response’, Hacetteppe Journal of Mathematics and Statistics, 40(4), 589-599, 2011, (with H. P. Singh). ‘Effect of non response on a class of estimators of population mean on current occasion in successive sampling on two occasions’, Journal of Probability and Statistical Science, Vol. 9, No. 1, 69-89, 2011, (with H. P. Singh). ‘Estimation of the population mean in successive sampling by sub-sampling the nonrespondents’, Journal of Modern Applied Statistical Methods, Vol. 10, No. 1, 51-60, 2011, (with H. P. Singh). ‘Multivariate ratio estimation in presence of non-response in successive sampling. Journal of Statistical Theory and Practice, Vol. 5, No. 4, 591-611, 2011, (with H. P. Singh). ‘Estimation of the population mean in presence of non response’, Communications of the Korean Statistical Society, Vol. 18, No. 4, 537-548, 2011, (with H. P. Singh). ‘Utilization of some known population parameters for estimating population mean in presence of non-response’, Pakistan Journal of Statistics and Operational Research, Vol. VIII, No. 2, 233244, 2012. ‘Ratio cum regression estimator for estimating population mean with sub sampling of non respondents’, Communications of the Korean Statistical Society, 19, 5, 663-672, 2012. ‘Estimation of population ratio in presence of non response in successive sampling. Journal of Statistical Theory and Applications, 11, 3, 293-310, 2012. ‘Estimation Of Population Mean Using Ranked Set Sampling. International Journal of Research in Commerce’, IT & Management, Vol. 2, Issue 9, 139-141, 2012, (with S. Bhougal and R. Gupta). ‘An Accelerated Sequential Class to Minimize Combined Risk for Simultaneous Estimation of Parameters of Several’, Pakistan Journal of Statistics and Operational Research, Vol. 8, No. 4, 737-748, 2012, (with R. Gupta and Y. Raj). ‘Generalized estimators for estimating population mean in the presence of non response’, IFRSA’s International Journal of Computing (IIJC), 2, 3, 672-686, 2012 (with S. Bhougal and R. Gupta). Zakir Husain A) Research Papers Published in Journals ‘Gender disparities in completing school education in India: Explaining geographical variations’, Journal of Population Research, Vol. 28(4), 2011: 325-352. DOI: 10.1007/s12546011-9070-5. ‘Asymmetric Dividend Policy of Indian Firms: An Econometric Analysis’, The International Journal of Applied Economics and Finance, 5(3), 2011: 200-212. DOI: 10.3923/ijaef.2011.200.212 (with others). ‘Balancing the present and future: A study of contraceptive use in Calcutta’s slums’, World Health and Population, 12(3), 2011: 23-32 (with others). Prepared By: S. Malakar, Social Sciences Division’s Office 104 Social Sciences Division, ISI ‘Is Health Status of Elderly Worsening in India? A Comparison of Successive Rounds of National Sample Survey Data’, Journal of Biosocial Science, Vol 43(2), March 2011: 211-231. DOI: 10.1017/S0021932010000623 IF: 0.98 (with co-others). ‘Health of the National Rural Health Mission: A Stock Taking’, Economic and Political Weekly, Vol. XLVI(4), 22 January 2011: 53-60. ‘Gender Disparity in Completing School Education over Regions”, Journal of Research in Educational Sciences, 1(2), Winter 2010: 75-94. ‘Commons and Commoners: Re-examining Community in Common Pool Resources’, Sustainable Development, Vol. 17(2), 2009: 142-154. DOI: 10.1002/sd.371. IF: 1.043. ‘An Application of MCDM to Built Heritage: The Case of Calcutta’, Journal of Cultural Heritage, 2009, Vol. X(2): 237-243. DOI:10.1016/j.culher.2008.09.007. IF: 1.079 (with others). ‘Top Heavy Systems and Quality of Health Care: A Survey of Select Departments in RG Kar Medical College and Hospital, India’, Social Medicine, Vol 4(2), 2009: 90-97. ‘Wizards, Muggles and Economic Exploitation: Dependency Relations in the World of Harry Potter’, Journal of Creative Communications, 4(3), 2009:163-175. ‘Enrolment and Drop-outs of Muslims in West Bengal: Evidence from NSS 61st Round’, Journal of Educational Planning and Administration, 2009, Vol. XXII(4): 347-367. ‘Variations in PCR among Socio-Religious Communities: An Exploratory Analysis’, Economic & Political Weekly, XLIV (15), April 11-17, 2009: 59-67 (with others). ‘Do Working Women Satisfice? Women Workers in the IT Sector’, Indian Journal of Labour Economics, Vol. 51(4), October-December, 2008: 731-746 (with others). Prepared By: S. Malakar, Social Sciences Division’s Office Plan Budget Proposals 2014-15, SSD 105 Economics & Planning Unit, Delhi Centre Financial Year 2008-2009 Papers publised in Journals: Roy Chowdhury, Prabal: Bertrand – Edgeworth Equilibrium with a Large Number of Firm, International Journal of Industrial Organization, 26, 746-761, 2008. Prabal Roy Chowdhury: Adoption of New Technology and Joint Venture Instability (Tarun Kabiraj), Research in International Business and Finance,22, 108-123, 2008. Prabal Roy Chowdhury: Controlling Collusion in Auctions: The Role of Ceilings and Reserve prices, Economic Letters, 98, 420-426, 2008. Bharat Ramaswami: Product Proliferation in India’s Cotton Seed Market: Are There Too Many Varieties?, (With M. Murugkar and M. Shelar), Journal of Agricultural & Food Industrial Organization, Vol. 7:Iss 1, 2, 1-15, 2009. Bharat Ramaswami: Sectoral Labour Flows and Agricultural Wages in India, 1983-2004: Has Growth Trickled Down?, (with M. Eswaran, A. Kotwal and W. Wadhwa), Economic and Political Weekly, 44(3), 46-55, 2009. Chetan Ghate: Understanding Divergence in India:. A Political Economy Approach, Journal of Economic Policy Reform, Vol. 11, Iss. 1, 1-9, 2008. Chetan Ghate: Caliberating RBC Models: A Simple Example Illustrating the Method of Successive Aproximations, Indian Growth and Development Review, Vol 1, Iss. 1, 119-124, 2008. Chetan Ghate: The Time Inconsistency Problem, “The Princeton Encyclopedia of the World Economy, Princeton University Press, 2009. Debasis Mishra: An Introduction to Mechanism Design Theory (a brief survey on the major work of Maskin and Myerson), Indian Economic Journal, Vol. 56, 2, 137-165, 2008. Satya P. Das: Game of Organizing International Cricket: Co-Existence of Country-Line and Club-Line Games, Economics: The open-Access, Open-Assessment E-Journal, 2, 8-32, 2008. Satya P. Das Co-authored with Rudrani Bhattacharya: Advent of Industrial Mass Production: Three Stages of Economic Development, The B.E. Journal of Macroeconomics, Vol. 8, Issue 1, 24, 2008. Bhaskar Dutta: (with W. Arulampalam, S. Dasgupta and A. Dhillon), A Theoretical Model and Empirical Evidence from India, Journal of Development Economics, 2009. E. Somanathan (with R. Prabhakar and B.S. Mehta): Decentralization for cost-effective conservation, Proceedings of the National Academy of Sciences of the USA, published online before print March 2, 2009. E. Somanathan (with Jyotsna Jalan and Saraswata Chaudhuri): Awareness and the Demand for Environmental Quality: Survey Evidence on Drinking Water in Urban India, Environment and Development Economics, published online before print March 6, 2009. E. Somanathan (with Sujoy Chakravarty): Discrimination in an Elite Labour Market? Job Placements at the Indian Institute of Management - Ahmedabad, the Economic and Political Weekly, 43(44): 45-50, November 1, 2008. E. Somanathan (with Jyotsna Jalan): The Importance of Being Informed: Experimental Evidence on Demand for Environmental Quality Journal of Development Economics, 87(1): 1428, August 2008. Financial Year 2009-10 Papers publised in Journals: M. Murugkar, Bharat Ramaswami and M.Shelar, Product Proliferation in India’s Cotton Seed Market: Are There Too Many Varieties?, Journal of Agricultural & Food Industrial Organization: Vol . 7: Iss1, Article 2, 1-15, 2009. Bharat Ramaswami, P.S. Birthal and P.K.Joshi, Grower Heterogeneity and the Gains from Contract Farming: The Case Indian Poultry, Indian Growth and Development Review, 2 (1), 5674, 2009. Prepared By: S. Malakar, Social Sciences Division’s Office 106 Social Sciences Division, ISI E. Somanathan with Rohini Somanathan, Challenges facing India’s poor, Economic and Political Weekly, 44(31): 51-58, August 01, 2009. Priyodorshi Banerjee, Hidden Action Principal-Agent Problem with Endogenous Signal Precision, Contemporary Issues and Ideas in Social Sciences, Vol. 5(1), June 2009. Financial Year 2010-11 Papers publised in Journals: Mitra, M. and Sen, Arunava: Efficient Allocation of heterogenous Commodities with Balanced Transfers, in Social Choice and welfare, Vol. 35, June 2010, pp 29-48. Chatterjee, S. and Sen, Arunava: Tops_only Domains in Economic Theory, Vol 46, February 2011, pp 255-282. Chandrasekhar, S. and Abhiroop Mukhopadhyay: Poverty and Well being in Indian Cities during the Reforms Era?, Berkley Electronic Press: Poverty and Public Policy, Volume 1, Issue2, April 2010. Afridi, Farzana, Women’s Empowement and the Goal of Parity Between the Sexes in Schooling in India, Population Studies, 64(2): 131-145, July 2010. Afridi, Farzana, Child Welfare Programs and Child Nutrition: Evidence from a Mandated School Meal Program, Journal of Development Economics, 2010, 92(2): 152-165. Roy Chowdhury, Prabal, Firm Size and Pricing Policy, Bulletin of Economic Research, 62 181195, 2010. Roy Chowdhury, Prabal, Porter Hypothesis and hyperbolic discounting, Economic Bulleting 31, 167-176, 2011. Roy Chowdhury, Prabal, Edgewworth Market Games: Price-taking and Efficiency, Encyclopedia of Operations Research and Management Science, (ed) Marc Kilgour, John Wiley & Sons, Ltd., 2011. Mishra, Debasis and Talman, Dolf, A Characterization of the Average Tree Solution for Tree Games, International Journal of Game Theory, Vol. 39, pp 105-111, 2010. Somanathan, E., Effects of Information on Environmental Quality in Developing Countries, in Review of Environmental Economics and Policy, 4(2): 275-292, Summer 2010. Bansal, Sangeeta and Ramaswami, Bharat, Labels for GM Foods: What Can They Do?, Economic and Political Weekly: Review of Agriculture, XLV (26/27), 167-173, 2010. Financial Year 2011-12 Papers publised in Journals: Afridi Farzana, The Impact of School Meals on School Participation in Rural India.” Journal of Development Studies (Special Section on Impact Evaluation), 47(11): 1636-1656, November 2011. Chowdhury Prabal Roy, Transparency, complementarity and holdout (with Kunal Sengupta), forthcoming, Games and Economic Behaviour. Chowdhury Prabal Roy, Porter hypothesis and hyperbolic discounting, Economics Bulletin, 31, 167-176, 2011. Das Satya.P, International Trade and Polarization in the Labor Market," Economics: The OpenAccess, Open-Assessment E-Journal, Vol. 6, 2012-6 http://dx.doi.org/ 10.5018/ economicsejournal.ja.2012-6 Ghate Chetan, "The "V Factor": Distribution, Timing, and Correlates of the Great Indian Growth Turnaround." With Stephen Wright (Birkbeck College). Forthcoming, Journal of Development Economics, 2012 Mishra Debasis, Roberts’ Theorem with Neutrality: A Social Welfare Ordering Approach. Debasis Mishra and Arunava Sen.Games and Economic Behavior, Volume 75, 2012, pp 283298. Mishra Debasis, Bhaskar Dutta , Minimum Cost Arborescences. Games and Economic Behavior,Volume 74, 2012, pp 120-143. Mukhopadhyay Abhiroop, Rural Housing Quality as an Indicator of Consumption Sustainability” (with Indira Rajaraman), Economic and Political Weekly, Vol. 47(13), March 31st, 2012, pp. 112-117 Mukhopadhyay Abhiroop, The Economic Burden of Cancer” (with B. K. Mohanti, S. Das, K. Sharma & S. Dash): Economic and Political Weekly, Vol. 43(46), October 22, 2011, pp. 112-117 Prepared By: S. Malakar, Social Sciences Division’s Office Plan Budget Proposals 2014-15, SSD 107 Rajaraman Indira, (2012) “Fiscal Impact of Trade Tariff Reform: Long-Series Historical Evidence for the US and Canada” Global Policy 3:3 (October) Rajaraman Indira, (2011) “Response to Rakshit on the Finance Commission” Economic and Political Weekly, XLVI: 13 (26 March); 137-139. Ramaswami Bharat, Carl E. Pray and N. Lalitha, The Spread of Illegal Transgenic Cotton Varieties in India: Biosafety Regulation, Monopoly and Enforcement, World Development, 40: 1, 177-188. Ramaswami Bharat, Ashok Kotwal, and Wilima Wadhwa, Economic Liberalization and Indian Economic Growth: What's the Evidence? Journal of Economic Literature, 49: 4, 11521199, 2011 Ramaswami Bharat, Ashok Kotwal, Milind Murugkar, PDS Forever? Economic and Political Weekly, XLVI (21), 72-76, 2011. Ray Tridip, Gurnani, Haresh, Gumus, Mehmet, & Ray, Saibal: Optimal Procurement Strategy Under Supply Risk, Asia-Pacific Journal of Operational Research, 29(1), 1240006-1 - 124000631, February 2012. Sen Arunava, “The Gibbard random dictatorship theorem: a generalization and a new proof”, SERIEs, Journal of the Spanish Economic Association, Vol 2, No 4, December 2011, 515-527. Sen Arunava, “Nash Implementation with Partially Honest Players” (with Bhaskar Dutta), Games and Economic Behavior, Vol 74, No 1, January 2012, 154-169. Sen Arunava, “Robertsʼ Theorem with neutrality: A social welfare ordering approach” (with Debasis Mishra), Games and Economic Behavior, Vol 75, No 1, May 2012, 283-298. Somanathan, E., with Arka Ray Chaudhuri, “Impact of Biometric Identification-base transfers.” Economic and Political Weekly, 46(21): 77-80, May 21, 2011. Financial Year 2012-13 Papers publised in Journals: Chowdhury Prabal Roy, Land Acquisition: Political Intervention, Fragmentation and Voice, Journal of Economic Behaviour and Organization, 85, 63-78, 2013. Chowdhury Prabal Roy and Arijit Mukherjee, Innovation and social desirability of merger, Economics Bulletin, 33, 248-260, 2013. Chowdhury Prabal Roy and Das Satya P, Deterrence, Preemption and Panic: A Common-Enemy Problem of Terrorism forthcoming, Economics Enquiry. Chowdhury Prabal Roy and Sengupta Kunal, Transparency, Complementarity and Holdout Games and Economic Behaviour,75, 598-612, 2012. Ghate Chetan, The V-Factor: Distribution, Timing, and Correlates of the Great Indian Growth Turnaround. With Stephen Wright (Birkbeck College), Journal of Development Economics, September 2012, Volume 99 (1), pages 58-67. Ghate Chetan, Has India Emerged? Business Cycle Stylized Facts from a Transitioning Economy. With Radhika Pandey (NIPFP) and Ila Patnaik (NIPFP). Structural Change and Economic Dynamics, Volume 24, Issue 1, March 2013, pages 157-172. Ghate Chetan, Why were some Indian states so slow to participate in the Turnaround? With Stephen Wright (Birkbeck College). Economic and Political Weekly, March 30, 2013, Vol. XLVIII No. 13 (Special Article) Mishra Debasis and Souvik Roy, Implementation in Multidimensional Dichotomous Domains, Theoretical Economics, Volume 8, 2013, pp 1 -30. Mishra Debasis and Souvik Roy, Strategy-proof Partitioning, Games and Economic Behavior, Volume 76, 2012, pp 285-300. Mishra Debasis and Arunava Sen, Roberts’ Theorem with Neutrality: A Social Welfare Ordering Approach, Games and Economic Behavior, Volume 75, 2012, pp 283-298. Mishra Debasis and Bhaskar Dutta, Minimum Cost Arborescences, Games and Economic Behavior, Volume 74, 2012, pp 120-143, Accepted: May 2011. Mishra Debasis, Dinko Dimitrov and Thierry Marchant, Separability and Aggregation of Equivalence Relations, Economic Theory, Volume 51, 2012. Ramaswami Bharat, M. Eswaran and W. Wadhwa, Status, Caste and the Time Allocation of Women in Rural India, Economic Development and Cultural Change, 2013, 61(2): 313-333. Ramaswami Bharat and S. Jha, The Percolation of Public Expenditure: Food Subsidies and the Poor in India and the Philippines, India Policy Forum, 2011/12,8: 95-138. Prepared By: S. Malakar, Social Sciences Division’s Office 108 Social Sciences Division, ISI 16. Sen Arunava, Gravel, Nicolas, Thierry Marchant, (October 2012) “Uniform Expected Utility Criteria for Decision Making under Ignorance or Objective Ambiguity,” Journal of Mathematical Psychology 56, 297–315. Sen Arunava, Shurojit Chatterji & Souvik Roy, The structure of strategy-proof random social choice functions over product domains and lexicographically separable preferences http://www.sciencedirect.com/science/article/pii/S0304406812000547 Journal of Mathematical Economics, Volume 48, Issue 6, December 2012, Pages 353-366. Sen Arunava & Debasis Mishra, Robertsʼ Theorem with neutrality: A social welfare ordering approach http://www.sciencedirect.com/science/article/pii/S0899825611001837 Games and Economic Behavior*, *Volume 75, Issue 1*, *May 2012*, *Pages 283-298. Sen Arunava & Jérémy Picot, An extreme point characterization of random strategy-proof social choice functions: The two alternative case http://www.sciencedirect.com/ science/article/pii/S0165176511004599 Economics Letters, Volume 115, Issue 1, 1April 2012, Pages 49-52 Prepared By: S. Malakar, Social Sciences Division’s Office Plan Budget Proposals 2014-15, SSD 109 Economic Analysis Unit, Bangalore Centre N.S.S.Narayana: Ancient Hindu Principles of Social and Economic Management – Are they against globalization? Published in Journal of Social and Economic Development, pages: 1- 44, Vol.12, No.2, December 2010. N.S.S.Narayana: Who is Not a Statistician! ISI Karnataka Branch Lecture. Paper presented at Mount Carmel College, Bangalore, 13 January 2010. N.S.S.Narayana: A Book-review article on “Capacity Building in Economics Education and Research” edited by Francois Bourguignon, Yehuda Elkana and Boris Pleskovic, published by The World Bank, Washington, D.C., 2007; published in Journal of Educational Planning and Administration, NIEPA, New Delhi, Vol. XXIII, No.2, April 2009, pages: 205-207. N.S.S.Narayana, Majumdar Rumki and Ghosh Probal: Growth Effects of Public Expenditure in India; in the journal Finance India (Indian Institute of Finance), December 2008 (Vol. XXII No. 4), pgs: 1249-79. N.S.S.Narayana: A Book Review article on ““International Handbook on Privatization” edited by David Parker and David Saal published by Edward Elgar, Cheltenham, UK and Northampton, MA, USA; in Journal of Social and Economic Development, Vol.10, No.2, July-December 2008, pgs:302-308 N.S.S.Narayana: A Book-review article on “Imbibing Value Education – Various Perspectives”, edited by Rameshwari Pandya and Anuradha Mathu, published by Kalpaz Publications, Delhi, published in Journal of Educational Planning and Administration, NIEPA, New Delhi, pages: 243-245, Vol. XXII, No.2, April 2008. N.S.S.Narayana: A Book Review article on “Ethics in Education: The role of teacher codes Canada and South Asia” authored by Shirley van Nuland and B.P.Khandelwal, published by International Institute for Educational Planning, Paris, 2006, published in Journal of Educational Planning and Administration, NIEPA, New Delhi, pages: 389-92, Vol. XXI, No.4, October 2007. N.S.S.Narayana: “Individuals, Values, Inequality and Governance - Brickbats and Bouquets for Developments in Mainstream Economics”. Invited Paper for the Conference / Workshop on “Human Values in Economics and Related Disciplines” Department of Economics, Sri Sathya Sai Institute of Higher Learning, Prasanthi Nilayam, Andhra Pradesh, February 2007; published in Journal of Social and Economic Development, Vol.9, No.2, pages: 121-147; July– December 2007. Papers in Journals Swaminathan, Madhura, 2012, “Who Has Access to Formal Credit in Rural India,” Review of Agrarian Studies, 2, 1, Jan-June 2012, pp 182-195. V. K. Ramachandran, “P. Sundarayya and the Agrarian Question in India”, The Marxist, 2012, pp V. K. Ramachandran, “Classes and Class Differentiation in India”s Countryside” World Review of Political Economy, 2, 4, April 2012, pp 646 Bandopadhyay, R., T.V. Prathamesh and P.Guha (2012). Zoning Crossroads: A Critique. Seminar, No. 636, August 2012. Prepared By: S. Malakar, Social Sciences Division’s Office Social Sciences Division, ISI 110 Interim Report Srl Unit Project Leader(s) Name of the Project Page Noth East Project 1 LRU Interlexical study of Asamiya in a substantivist framework (2011-14) … Probal Dasgupta … 110 2 PRU Cognitive Processing through PASS model and its role in determining Academic Performance of School students of North- Eastern India. (2012-15) … Anjali Ghosh, … 113 General Project 1 LRU Bengali Pronunciation Dictionary in Electronic and Printed Form (2012-15) … Niladri Sekhar Dash … 111 2 PRU Differential validity of Computer programming abilities (2012-15) … Debdulal.Dutta Roy … 117 3 SRU Data Gap in Gender Statistics: Women in Mining Industry (2012-15) … Molly Chattopadhyay … 142 4 EPU Report on the 8th Annual Conference on Economic Growth and Development (2012) … Tridip Ray … 146 5 EAU Evaluating Official Statistics on Land and Livestock holdings (2012-15) … V.K. Ramachandran … 148 Prepared By: S. Malakar, Social Sciences Division’s Office Plan Budget Proposals 2014-15, SSD 111 LRU (Northeast) 1. Title of the project: Interlexical study of Asamiya in a substantivist framework 2. Date of Commencement: April 2011 3. Name of the Proposing Scientist/Principal Investigator: Probal Dasgupta, LRU, ISI 4. Amount spent: 70% 5. Target achieved: 70% 6. Expected date of Completion: March 2014 7. Interim Report for Interlexical study of Asamiya in a substantivist framework (2011-2014) This project is still running at the moment of writing this interim brief report. It is appropriate at this stage to highlight the role of the core presentation concept in the descriptive methods that this project has been focusing on, and to note that the coverage of empirical material in Asamiya has been augmented in this project (see especially the Dasgupta and Mitra LRU Technical Report 2013/02). The results of this project were reported in: Dasgupta, Probal. Scarlet and Green: Phi-Inert Indo-Aryan Nominals in a Co-Representation Analysis. Kolkata: LRU Technical Report 2011/01 Dasgupta, Probal. Jabaan-jominer aabaad. Kolkata: LRU Technical Report 2013/01 Dasgupta, Probal; Mitra, Nivedita. Certain derivationally used WFSs in Asamiya. Kolkata: LRU Technical Report 2013/02 Dasgupta, Probal (2012) Co-representation of linguistic structures. Indian Linguistics 73:1-4.4759. Dasgupta, Probal (2013) La rugho kaj la verdo: fi-trajto-inertaj sanskritidaj substantivoj en kunreprezenta analizo/ Shamaantor protikriti-bisleshoner cokhe Bhaarotiyo Aarjo bhaashaar phaai-nishkriyo bisheshsho. Vĕra Barandovská-Frank (ed.) Littera Scripta Manent: Serta in Honorem Helmar Frank. Paderborn/ Prague: Akademia Libroservo. 182-192. Prepared By: S. Malakar, Social Sciences Division’s Office Social Sciences Division, ISI 112 LRU (General) 1. Title of the project: Bengali Pronunciation Dictionary in Electronic and Printed Form 2. Date of Commencement and Completion: April 2012 – March 2015 3. Name of the Proposing Scientist/Principal Investigator: Niladri Sk. Dash, LRU, ISI 4. Amount spent: 30% 5. Target achieved: 30% 6. 1st Interim Report for Bengali Pronunciation Dictionary in Electronic and Printed Form (20122013) Till the end of March 2013, we have successfully collected a large list of Bengali words from (a) TDIL corpus of 5 million words, (b) a newspaper corpus of 1 million words, (c) lexical database of Bangla Akademi, Kolkata, (d) and from various other digital and printed sources. At present the lexical database, which we have been able to compile, contains nearly hundred thousand Bengali words in their lemmatized forms. It contains words from various linguistic antiquities covering Tatsama, Tadbhava, Deshi and foreign words including mostly English, Arabic and Persian vocabulary. The spelling of the words of our lexical database is mostly adopted from the suggestions made in the spelling dictionary of the Pashchim Banga Bangla Akademi, Kolkata (2005). However, at certain situations, we have also consulted dictionaries produced by other agencies, such as, Shabda Sanket (Jamil Chaudhuri 2009), Samsad Bangla Abhidhan (2012), Saral Bangla Abhidhan (Subal Chandra Mitra 2009) etc. Since the target of the project is to develop a pronunciation dictionary of 20,000 words (as proposed in the proposal of the project) it was necessary to select the words from the list of hundred thousand words included in the lexical database. However, since selection of a particular word over the other is a debatable issue (as it asks for proper justification for selection of a word in the list), we decided to go alphabetically and thus we selected all the words starting with vowel graphemes only. Interestingly, the total number of lemmatized words starting with vowel graphemes did not exceed the number of entries we decided for the project. That means, the present lexical database which we are now planning to use in the proposed dictionary includes only words starting with vowel graphemes. The justification behind the selection of all vowel-initiated words lies in our attempt for covering all vowel-initiated words rather than being sporadic in selection of a few words both from vowel-initiated as well as consonant-initiated words for the dictionary. We have made a plan for extending this project in subsequent phases where we intend to deal with all consonant-initiated (as well as cluster-initiated) words of the language to give a complete shape of the dictionary. This part may be started once the present phase is executed and completed successfully. At the initial stage we adopted the following criteria for selection of lexical items for the dictionary from the main lexical database. (a) (b) (c) (d) (e) Single word units which show grapheme to phoneme disparities are selected as automatic candidates as entry words. Multiword units like compounds and reduplications, which exhibit grapheme-to-phoneme disparities. Special importance is given to those English words which are nativised in Bengali with naturalized pronunciation. The prefix ‘-a’ is not ignored as there are different pronunciations of the same alphabet as a negative prefix as well as a initial character of a word. No idiomatic or phrasal expressions are considered for inclusion in the database. However, we realized that the proposed scheme of lexical selection has some limitations. It is noted that a large majority of words in Bengali show grapheme-to-phoneme disparities as there is hardly 1:1 mapping relationship between a phoneme and a grapheme. These words, by virtue of their pronunciation uniqueness, are entitled to be included in the pronunciation dictionary. Moreover, the words which exhibit grapheme-phoneme similarities also need to be included in the dictionary so that their pronunciation, usage, part-of-speech, and other lexicographical information become available to the end users, who want to know the lexicographical information of these words. Therefore, we decided to include not only the words with grapheme-phoneme disparities but also those words that exhibit grapheme-phoneme similarities. Prepared By: S. Malakar, Social Sciences Division’s Office Plan Budget Proposals 2014-15, SSD 113 The same argument stands valid for compound words and reduplicated forms. This policy was adopted because if we have taken those multiword units, which show grapheme phoneme disparities, then a large number of compounds and reduplications would have been removed from the database as a result of which a number of multiword units that constitute a major part of the Bengali vocabulary would have been eliminated from the dictionary. Since we did not want to lose such a huge amount of lexical stock of the language, we have kept multiword units of both types (i.e., grapheme-phoneme disparities and grapheme-phoneme similarities) in the database. At present the lexical database of the dictionary is nearly 20,000 words and it consists of words that begin with vowel graphemes only. The words in the database are normalized, and their spellings are corrected. Moreover, some highly sanskritized complex words, which are not usually present in standard Bengali dictionaries are removed. At present each lexical item in the dictionary is furnished with the following information (a) Word, (b) Part-of-speech (c) Word in Roman script with diacritics (d) Pronunciation of the word in Bengali orthography, (e) Pronunciation of the word in IPA, (f) Digital Audio output of the Word, (g) Meaning of the word in Bengali, (h) Meaning of the word in English, (i) Usage of the word in a Bengali sentence, (j) Translation of the Bengali sentence into English. All these information for some Bengali words is available in a demo version of the tool at the LRU homepage: http://www.isical.ac.in/~lru/bengdict/index.php Publications Dash, Niladri Sekhar (2010) “Digital dictionary: a physical realization of virtual reality”. Proceedings of the National Conference on Emerging Trends in Educational Informatics (ETEI 2010), 23-24 December 2010, National Institute of Technical Teacher’s Training and Research (NITTTR), Kolkata, pp. 91-95. Dash, Niladri Sekhar (2010) “Utilization of language corpora in compilation of digital dictionaries for Indic languages”. Presented in the International Seminar on Tamil Computing, 24th-26th February, 2010, Linguistic Studies Unit, Dept. of Tamil Language, Madras University, Chennai, India. Dash, Niladri Sekhar (2011) “Some physical advantages of an electronic dictionary”. Indian Linguistics. Vol. 71. No. 1-4. Pp. 93-102. Dash, Niladri Sekhar (2011) A Descriptive Study of the Modern Bengali Script. Saarbrucken, Germany, Lambert Academic Publishing [ISBN: 978-3-8383-4448-5]. Dash, Niladri Sekhar (2012) “Baidyutin Bangla Abhdhan tairi karar kichu samasya”. Alochana Chakra. Vol. 32. Pp. 166-178, Baimela Sankhya, 2012. Dash, Niladri Sekhar and Pronomita Basu (2012) “Developing Scientific and Technical Terminology Database from Electronic Language Corpora”. Language Forum. Vol. 38. No. 1. Pp. 5-21. January-June 2012. Dash, Niladri Sekhar, Payel Dutta Chowdhury and Abhisek Sarkar (2011) “Digital Pronunciation Dictionary for Bengali: A Tool of the Time”. In, Sharma, Dipti Misra, Rajeev Sangal and Sobha L. (Eds.) Proceedings of the 9th International Conference on Natural Language Processing (ICON2011), Pp. 117-124, Anna University, Chennai, India, 16th – 19th December 2011. Prepared By: S. Malakar, Social Sciences Division’s Office 114 Social Sciences Division, ISI COGNITIVE P ROCESSING THROUGH PASS MODEL AND ITS ROLE IN DETERMINING ACADEMIC PERFORMANCE OF SCHOOL STUDENTS OF N ORTH -EAST INDIA INTERIM REPORT , 2013 Anjali Ghosh (Principal Investigator) Manjusha Adak (Project Linked Person) Psychology Research Unit, Indian Statistical Institute, Kolkata COGNITIVE PROCESSING THROUGH PASS MODEL AND ITS ROLE IN DETERMINING ACADEMIC PERFORMANCE OF SCHOOL STUDENTS OF NORTH-EAST I NDIA Cognitive processes are the higher mental processes that involve knowledge and how people use their knowledge. They include matters such as attention, memory, producing and understanding language, solving problems and making decisions. All these are very important for human behavior. PASS model has been developed by J.P. Das, Jack Naglieri, and Kirby (1994). According to this model, intellectual activity involves the interdependent functioning of three neurological systems, called the functional units of brain. Das describes a multidimensional view of cognitive processes based on Luria’s theory (Luria, 1966, 1980) as consisting of four functions including: planning, arousal–attention, simultaneous, and successive syntheses. In this model, planning is required when for instance an individual makes decisions about how to solve a problem, carry out a novel activity, or compose a narrative. Attention–arousal is the process that allows a person to selectively attend to some stimuli while ignoring others, resist distractions, and maintain vigilance. Simultaneous processing integrates percepts into groups and as a result stimuli are conceptualized as a whole, with each piece being related to the others. Finally successive processing involves integrating stimuli into a specific serial order and is exemplified in processing words in order to determine their function as in syntactic comprehension. The theory links the four processes with particular regions of the brain. Planning is associated with the frontal lobes, attention–arousal with the reticular activating system, and its associated brainstem catecholaminergic projections throughout the cortex. The two coding units simultaneous and successive are associated with occipito-temporoparietal junction and frontotemporal and perisylvian opercular regions, respectively. This PASS model is directly based on Luria’s model of higher cortical functions in man. The PASS model is an elaboration of Das, Kirby, and Jarman’s (1975) early psychometric and cross-cultural work demonstrating two coding units as well as with subsequent studies incorporating planning and attention in Luria’s complete model of higher cortical functions (Das, Naglieri, Kirby, Ashman; 1996). Cognitive Assessment System (CAS) test is an individually administered test of cognitive functioning for children and adolescents ranging from 5 through 17 years of age that was designed to assess the Planning, Attention, Simultaneous and Successive cognitive processes as described in the PASS Theory of Intelligence (Das, Naglieri, 1997). The CAS is structured on three levels: the Full Scale; the cognitive processing (PASS) scales; and the subtests. The Full Scale (FS) is an overall indicator of the child's cognitive functioning with a mean of 100 and a standard deviation of 15. The average internal consistency reliability for the Standard Battery is .96 (Naglieri & Das, 1997). The subtests provide information on a child’s cognitive functioning, which includes: (1) Planning processes to provide cognitive control, and utilization of processes and knowledge, intentionality, and self-regulation to achieve a desired goal; (2) Attention processes to provide focused, selective cognitive activity over time; and two forms of operating on information, (3) Simultaneous processes by which the individual integrates separate stimuli into a single whole or group; and (4) Successive processes by which the individual integrates stimuli into a specific serial order that forms a chain-like progression (Naglieri & Das, 1997). The PASS theory was used as the basis of the CAS to provide an individually administered instrument of assessing cognitive functioning. The PASS scales represent the individual's functioning on subtests designed to predominantly involve one of the four cognitive processes and contribute equally to the FS score. These scales have high reliability and are most closely tied to the theoretical basis of the CAS. At the most basic level, the individual subtests make up the PASS scales with a mean of 10 and a standard deviation of 3. Although each subtest has distinctive content they were not intended to measure unique constructs (Naglieri, 1999). These subtest scores can be combined to create a Basic Battery with eight subtests or a Standard Battery with 12 subtests (Ashman, Das; 1980). Prepared By: S. Malakar, Social Sciences Division’s Office Plan Budget Proposals 2014-15, SSD 115 The bulk of the PASS theory is developed to the 3 main processing units. According to PASS theory, cognitive functioning can be affected by input deficiencies such as auditory or visual processing and output may similarly impact on individual’s measured cognitive ability (Das et.al., 1994). Based on the PASS Theory of Intelligence, Das and his colleagues developed a program for intervention called “PASS Reading Enhancement Programme” (PREP). The PREP was designed to improve simultaneous and successive processing that underlie reading, while at the same time avoiding the direct teaching of word reading skills (Cruz, 2005; Das, 1999, 2000; Fonseca & Cruz, 2001; Naglieri & Das, 2002) The development of tests to measure the PASS processes began with an examination (Das, 1975) of the differences between persons with and without mental retardation. That study involved only simultaneous and successive cognitive processes which suggest that two processes be included as a model for cognitive abilities (Das, Kirby, & Jarman, 1975). Ashman and Das (1980) first reported the addition of planning measures to Simultaneous and Successive experimental tasks. Attention and Planning tasks were developed and tested several years later. Ashman (1978) found that planned composition was correlated with other planning tasks. Flanagan (1992) found that planning tasks were the best predictor of punctuation, capitalization and written composition achievement in elementary youths referred for learning problems. Naglieri and Rojahn (2004) examined correlations between the CAS and academic achievement utilizing the CAS standardization sample. They found moderate correlations between the Woodcock-Johnson Tests of Achievement and revised writing subtests of Dictation (.50), Proofing (.44), as well as the Basic Writing Skills composite (.51) and the CAS. Objective: The objective of the project is to find out the role of planning, attention, simultaneous and successive (PASS) processes of cognitive functioning in determining the academic performance of different group of school students of North-East India Method: The present study has been conducted on three states of North-East India. Multistage stratified random sampling method was followed in this study. In first stage, two states (Tripura and Mizoram) out of seven North-East states of India have been chosen and then another state (Assam) of North-East India was incorporated to fulfill the total sample size of the project. In the second stage one district from each of the three states was selected: West district from Tripura, Aizwal from Mizoram and Sonitpur from Assam. In the next stage, eight schools from West district of Tripura were selected and out of them six schools (1 boy, 2 girls and 3 co-education schools including OBC & ST) were selected for the present study. In Mizoram (Aizwal) one co-education school and in Assam (Sonitepur) three co-education schools were selected. Sample: Table I: State wise distribution of schools and sample groups of students T Serial no 1 2 Mizoram Assam Boys 26 08 Girls 00 09 Total no 26 17 00 04 10 28 04 03 28 08 13 6 7 School Boy’s School -1 100% OBC students Coeducation school-2 Girls School-3 Girls School-4 Co- education School-5 (100% ST students) Co- education School-6 Co- education School-7 05 41 07 19 12 60 8 9 10 Co- education School-8 Co- education School-9 Co- education School-10 05 05 04 06 16 13 11 21 17 3 4 5 Boys- 53 Girls- 51 Total-104 Boys-14 Girls- 35 Total-49 Tools: The following measurement tools were administered: 1. Achievement Test (Bengali and English version) was prepared on the basis of the syllabus of the state board of class-IV standard. Six arithmetic questions (addition, subtraction, multiplication and division) were given in the first part and in the second part one passage for comprehension along with six questions were, out of this three questions were given in multiple choice formats. After reading the passage the student had to answer the questions. Prepared By: S. Malakar, Social Sciences Division’s Office Social Sciences Division, ISI 116 2. Cognitive Assessment System (CAS) of J.P. Das and Jack Naglieri (1997) was administered which assess Planning, Attention, Simultaneous and Successive Processes through several verbal and nonverbal tests. 3. School Performance Record: Annual Examination marks obtained by the students in language and arithmetic were taken. Procedure: i. Achievement Test was administered on the students of the selected schools in group situation. ii. PASS scale(basic battery) under the Cognitive Assessment System (CAS) was administered which contains several subtests(Matching Numbers, Planned codes, Nonverbal Matrices, Verbal Spatial Relations, Expressive Attention, Number Detections, Word Series, Sentence Repetitions). This was done individually by the investigators. iii. School performance record i.e., last annual examination marks of language and arithmetic of the students were collected. iv. An orientation program was conducted in Agartala on a small group of teachers (two teachers for each of the selected schools) to conduct the intervention program of PREP (Das, 2005) for low achiever groups of students. Results: The statistical treatments (Mean, SD and t-test) were applied only on 54 samples (26 boys and 28 girls) out of 176 samples (71 boys and 105 girls). The results are presented in Table: II. Table II: Distribution of Mean, Standard Deviation (SD), and t-test Scale scores of two sample groups of two primary school students (N=54). scale P A Name of the subtests Achievement Test Planning S S S Simultaneous C Attention A L E Successive Matching Numbers Planned codes Nonverbal Matrices Verbal Spatial Relations Expressive Attention Number Detections Word Series Sentence Repetitions Boys (n=26) Mean SD 8.21 1.55 6.43 3.54 Girls (n=28) Mean SD 8.65 1.81 8.73 3.23 t value 51.68 4.43 25.35 2.69 71.42 4.27 39.10 2.65 2.22* 0.22 4.04 1.79 5.08 3.11 1.52 49.58 1.36 29.16 1.37 0.12 23.89 14.52 29.19 11.05 1.50 10.50 7.29 3.79 2.97 11.00 7.85 2.70 2.43 0.55 0.76 0.96 2.49* *Significant at 0.05 level In the Achievement Test both boys and girls students in this sample reported more or less equal Mean (8.21 and 8.65 respectively) and SD (1.55 and 1.81 respectively). In PASS scale on some dimension boys scored higher whereas on some dimensions girls scored higher but the differences were not significant except in the planning processes i.e., matching numbers and planned codes. Under this process girls scored higher Mean (8.73) and SD (3.23) than boys (Mean= 6.43, SD= 3.54) for Matching Numbers. In Planned Codes, girls scored (Mean=71.42, SD=39.10) higher than boys (Mean=51.68, SD=25.35). Under Simultaneous Processing in Verbal Spatial Relations, girls scored (Mean= 5.08, SD=3.11) slightly higher than boys (Mean=4.04, SD=1.79). In Number Detections under the Attention processes the girls also scored (Mean=29.19, SD=11.05) higher than boys (Mean=23.89, SD=14.52). To see whether any significant differences exist between boy and girl students, t-test were conducted on these variables. No significant differences has been found in Simultaneous Processing, Attention and Successive Processing except Planning on Matching Numbers (t [52]= 2.49, p<0.05) and on Planned Codes (t [52]= 2.49, p<0.05). This indicates that girls do planning better than boys. Future Work: In the next phase data will be analyzed by using correlation, regression, ANOVA & other statistical techniques. Prepared By: S. Malakar, Social Sciences Division’s Office Plan Budget Proposals 2014-15, SSD 117 Based on the performance of the students Achievement Test and PASS scale (basic battery) under the Cognitive Assessment System (CAS), the low achiever students will be identified from each school. These groups of students will be divided into two groups: experimental group and control group. On experimental group the intervention program of PREP (Das, 2005) will be introduced for several sessions but the control group will not receive any training. Then after a time gap of 4/5 months both the groups will be tested again on Achievement Test and PASS scale (basic battery) to find out the effectiveness of the intervention program. References: Ashman, A. (1978). The relationship between planning and simultaneous and successive synthesis. Unpublished doctoral dissertation, University of Alberta, Edmonton. Ashman, A., & Das, J. P. (1980). Relation between planning and simultaneous-successive processing. Perceptual and Motor Skills, 51, 371-382. Cruz, V. (2005). Uma abordagem cognitiva às dificuldades na leitura: Avaliação e intervenção. Dissertação de doutoramento não publicada, Faculdade de Motricidade Humana, Universidade Técnica de Lisboa. Das, J. P., Kirby, J. R., & Jarman, R. F. (1975). Simultaneous and successive synthesis: An alternative model. Psychological Bulletin, 82, 87-103. Das JP, Naglieri JA, Kirby JR. Assessment of cognitive processes. Boston, MA: Allyn and Bacon; 1994. Das JP, Kar BC, Parrila RK. Cognitive planning: The psychological basis of intelligent behaviour. Thousand Oaks, CA: Sage Publications; 1996. Das, J.P. (1999). PASS Reading Enhancement Program. Deal, N.J.: Sarka Educational resources. Das, J. P. (2000). PREP: A Cognitive Remediation Program in Theory and Practice. Developmental Disabilities Bulletin, 28 (2), 83-96. Flanagan, D. P. (1992). The planning, attention, simultaneous, and successive (PASS) model of cognitive processing and its relationship to academic achievement. Unpublished doctoral dissertation, Ohio State University, Columbus, Ohio. Fonseca, V. & Cruz, V. (2001). Programa de reeducação cognitiva PASS. Avaliação dos seus efeitos em crianças com dificuldades de aprendizagem. Lisboa: FMH. Grigorenko (Eds.), The general factor of intelligence. How general is it? (pp. 55-84). New Jersey: Lawrence Erlbaum Associates Luria AR. Higher cortical functions in man. New York, NY: Basic Books; 1966. Luria AR. Higher cortical functions in man. 2nd ed. New York, NY: Basic Books; 1980. Naglieri, J. A., & Das, J. P. (1997). Cognitive Assessment System. Administration and scoring manual. Interpretive handbook. Itasca, IL: Riverside. Naglieri, J. A., & Das, J. P. (1997). Das-Naglieri Cognitive Assessment System Interpretive Handbook. Itasca, IL: Riverside Publishing. Naglieri, J. A. (1999). How valid is the PASS theory and CAS? School Psychology Review, 28 (1), 145-162. Naglieri, J. A.; Das, J. P. (2002). Practical implications of general Intelligence and Pass cognitive processes. In R. Sternberg; E. Naglieri, J. A., & Rojahn, J. (2004). Construct validity of the PASS theory and CAS: Correlations with achievement. Journal of Educational Psychology, 96(1), 174-181. Puhan,G.,Das,J.P.& Naglieri,J.A. (2005). Separating planning and attention: evidential and consequential validity. Canadian Journal of School Psychology, 20, 75-84. Prepared By: S. Malakar, Social Sciences Division’s Office Social Sciences Division, ISI 118 DIFFERENTIAL VALIDITY OF COMPUTER PROGRAMMING ABILITIES PROVISIONAL PROJECT REPORT (2012-13) By Debdulal Dutta Roy Psychology Research Unit INDIAN STATISTICAL INSTITUTE 203, B. T. ROAD KOLKATA-700108 31.3.2013 Contents 1. 2. 3. 4. 5. 6. 7. 8. Acknowledgement Executive summary Chapter 1: Introduction Chapter 2: Literature Review Objectives of the Project Chapter 3: Method Chapter 4: Results Section A Section B Summary Prepared By: S. Malakar, Social Sciences Division’s Office 5-6 7 8-13 14-25 26 27-33 34 35-49 50-60 61 Plan Budget Proposals 2014-15, SSD 119 Tables Table 3.1: Table 3.2: Table 4.1.1: Table 4.1.2: Table 4.2.1: Table 4.2.2: Table.4.3.1: Table.4.3.2: Table.4.3.3: Table.4.3.4: Table.4.3.5: Table.4.4: Table.4.5: Table.4.6: Table 4.6.1: Table 4.6.2: Table 4.6.3: Table.4.7: Table.4.8: Table.4.9: Table.4.10: Table.4.11: Table.4.12: Table.4.13: Table 4.14: Table 4.15: Table 4.16: Table 4.17: Table 4.18: Fig. 3.1: Fig 4.1: Fig.4.2: Description of Schools Frequency and percentage distribution of participants Descriptive statistics of participants Descriptive statistics of individual schools School wise average Difficulty Indices of tests Item Wise Difficulty Indices Sub Test 1: Similarities Sub Test 2: Anagram Sub Test 3: Syllogistic Reasoning Sub Test 4: Data Sufficiency Sub Test 5: Data Coding Inter Correlation among subtests Kuder-Richardson reliability coefficients of the five subtests Validity measure of the five subtests Grade Equivalent Norm Sex Equivalent Norm Age Equivalent Norm Percentile norm for each of the five subtests Grade wise Analysis of Variance Age wise Analysis of Variance Sex wise Analysis of Variance Caste wise Analysis of Variance Religion wise Analysis of Variance Medium wise Analysis of Variance Relative contribution of demographic variables in subtest similarities Relative contribution of demographic variables in subtest anagram Relative contribution of demographic variables in subtest syllogistic reasoning Relative contribution of demographic variables in subtest data sufficiency Relative contribution of demographic variables in subtest coding, Figures Pie charts showing the distribution of participants according to gender, age, grade, religion, caste and medium of instruction Sub test wise difficulty indices compared to the mean difficulty index of the test Subtest wise item-total correlation coefficients Prepared By: S. Malakar, Social Sciences Division’s Office 27 29 35 35 37 38 40 41 41 41 42 44 45 45 46 47 48 49 50 51 53 54 55 56 57 58 59 59 60 2930 38 43 Social Sciences Division, ISI 120 Acknowledgement Prof. Bimal Roy Prof. Prabal Ray Chaudhuri, Prof. Anjali Ghosh, Indian Statistical Institute Ms. Sumona Datta Mrs. Sravanti Adhikari Mrs. Anurupa Kundu Mr. Biplab De Sarkar Mr. Ardhendu Bhattacharya Mr. Swarup Ghara Dr. Rama Manna All the staffs and office bearers of the All the staffs and office bearers Director, Indian Statistical Institute Head, Psychology Research Unit Research Fellow, Psychology Research Unit Psychology Research Unit Psychology Research Unit School Education Commissioner of School Education, West Bengal Dr. Subrata Biswas Faculty of SCERT Professor-in-charge, Social Sciences Division Project Linked Person Research Fellow, Psychology Research Unit Indian Institute of Psychometry 117, B.T. Road, Kolkata-700108 Social Sciences Division and Office of the Director Dr. Chanda Ray Director of the SCERT Dr. K.A. Sadat The Secretary, DIET, Hooghly, West Bengal Dr. Swapna Ghosh The Secretary, DIET, Banipur, North 24 pgs, West Bengal Participating schools Kalyani Central Model School, Kalyani Fatellapur High School, Belgharia Kalyani University Experimental High School Kalyani, Sarat Kumari Girls’ High School, Shantipur Salimia High School, Kamarhati NGO and Local support PRISM, Gobardanga Udaypur Haradayal Nag Adarsha Vidyalaya Belgharia Mahesh Sri Ramkrishna Ashram Vidyalaya Mahesh Rishra Anjuman High School, Rishra, Shantipur Boys’ high school, Shantipur Dhandageria, Debra, Balichak Executive Summary Differential Validity indicates differential pattern of predictor criterion relation across sub-populations. Current study examined differential validity of computer programming related reasoning abilities. Items of five subtests were constructed earlier to assess five verbal abilities as similarities, anagram, syllogistic reasoning, data sufficiency and coding. In the 2012-13 session aims are to examine (a) psychometric properties of each subtest and to examine (b) differential pattern of reasoning across cross sections of students by sex, age, grade, community, religion, medium of learning. Data were collected from 622 boys and 372 girls of grades 8th to 10th of different communities by religion and caste. Test battery includes 60- items with four or five options. Test items for lower order reasoning possessed moderate level of difficulty indices ranged from 46.86 to 64.42. And tests for higher order reasoning possessed high difficulty level. Almost 70% of total students performed poor. Itemtotal correlation coefficients for lower order reasoning tests ranged from 0.70 to 0.90. On the other side, tests for higher order reasoning coefficients ranged from 0.30 to 0.45. Each sub-test has good reliability coefficient. It ranged from 0.47 to 0.90. One percentile norm was prepared for assessing individual differences in reasoning abilities. Correlation coefficient between each sub-test score and subject wise examination results for only one school differentially related. One way ANOVA shows significant mean differences in reasoning abilities by caste, religion, medium of learning, age, grade and gender. Chapter 1: INTRODUCTION The validity of a test concerns what the test measures and how well it does so. Fundamentally, all procedures for determining test validity are concerned with the relationships between performance on the test and other independently observable facts about the behavior characteristics under consideration. Prepared By: S. Malakar, Social Sciences Division’s Office Plan Budget Proposals 2014-15, SSD 121 However, as the applications of tests developed and expanded concepts of validity altered accordingly (Anastasi, 1986a). Differential Validity: Differential Validity refers to the case in which the magnitude of the validity coefficient (i.e. the correlation coefficient) between a predictor and a criterion differs depending on whether the predictorcriterion relationship is measured in one sub-group versus another (e.g. Linn, 1978). The above definition refers to Differential Validity at the most general and abstract level. There have been a number of definitions of Differential Validity adopted, either explicitly or implicitly, by researcher throughout years that only partially reflect Differential Validity at its most general level. For instance, Boehm (1972) provided the first formal definition for Differential Validity stating that Differential Validity exists when: (a) There is a significant difference between the correlation coefficient of a selection device and a criterion obtained for one ethnic group and the correlation of the same device with the same criterion obtained for the other group; (b) The validity coefficients are significantly different from zero for one or both groups.” Clearly, this is a definition of Differential Validity that is focused on making inferences about populations from sample data. Despite problems with Boehm’s definition’s heavy reliance on statistical significance testing and the associated statistical power issues this entails, Boehm’s definition overlaps with and is ultimately subsumed by the more general definition of Differential Validity (Berry, 2007). Another form of a definition for Differential Validity has focused on a distinction between Differential Validity and single-group validity. Single-group validity refers to the case in which the predictorcriterion correlation is zero in one population and zero in another subgroup. The original formal operational definition for the concept of single-group validity was proposed by Boehm (1972) and adopted by later researches that focused on single-group validity research. Boehm stated that singlegroup validity existed when “a given predictor exhibits validity significantly different from zero for one group only, and there is no significant difference between the two validity coefficients.” The reliance on statistical significance testing is obviously cumbersome, but at a more general level, the distinction between single group and Differential Validity is not needed. As Hunter and Schmidt (1978) and Linn (1978) pointed out, single-group validity is simply a special case of Differential Validity. It is of interest if validity coefficients differ for subgroups whether the validity for either subgroup is zero or not, and a separate definition for a special case of Differential Validity is not needed (Berry, 2007). Aim of the study is to examine differential validity of reasoning test battery. The battery includes five sub-tests namely, similarity, anagram, syllogistic, data sufficiency and coding. Five reasoning abilities are important for success in computer programming (Dutta Roy, 2002). Computer programming is the craft of writing useful, maintainable, and extensible source code which can be interpreted or compiled by a computing system to perform a meaningful task. Reasoning Ability: Reasoning is concerned with inferences that are drawn from a theory, a principle, a rule, a heuristic, or a model, so as to the individual either infers new conclusions or evaluates proposed conclusion from what is already known (Johnson-Laird and Byrne, 1993). Reasoning ability is central construct in numerous theories of logical related behavior. It is indispensable in problem tasks where in experienced operations and algorithms for problem solutions are required. Sternberg (1977) says - "we reason analogically whenever we make a decision about something new in our experience by drawing a parallel to some thing old....” Kamphaus (2001) defined reasoning as "that which follows a reasonable inference or natural consequence; deducible or defensible on the grounds of consistency; reasonably believed or done". Thus, reasoning is not only drawing an inference, but also drawing an inference which is consistent and reasonably carried out. There are different modes of reasoning as deductive, inductive and quantitative (inductive and deductive mathematical reasoning) reasoning (Carrol, 1989). Deductive reasoning means inferring or deducing specific statements from premises that have general character. Inductive reasoning is the procedure of inferring from the particular to generality. Reasoning ability usually starts from the formal operational stage by developing the capacity for abstract and scientific thinking. At this stage, adolescence can operate on operations and become capable of hypothetico-deductive reasoning. When faced with a problem the adolescent starts with a general theory of all possible factors that might affect an outcome and deduce from it specific hypotheses (or predictions) about what might happen. Then they test these hypotheses in an orderly fashion to see which one works in the real world. Prepared By: S. Malakar, Social Sciences Division’s Office 122 Social Sciences Division, ISI Reasoning assessment is of two types: Verbal Reasoning and Non-verbal reasoning. Verbal reasoning refers to understanding and reasoning using concepts framed in words. It aims at evaluating ability to think constructively, rather than at simple fluency or vocabulary recognition. Non-verbal reasoning involves drawing conclusions based on a set of facts either fictional or non fictional. Exercises include activities like describing the similarities and differences between two pictures, finding the shape that does not belong in a sequence of shapes, predicting what shape should next appear in the sequence, and so on. The Psychology of Reasoning also covers deductive and inductive reasoning. When people carry out deductive reasoning they usually determine what conclusion, if any, necessarily follows when certain statements or premises are assumed to be true. In Inductive reasoning, people make a generalized conclusion from premises that describe particular instances. Inductive reasoning corresponds to probabilistic, uncertain, approximate reasoning and as such, it corresponds to everyday reasoning. Inductive reasoning is a multifaceted cognitive activity that is, it involves skills of varying complexity. Again, induction is related to, and it could be argued is central to, a number of other cognitive activities, including categorization, similarity judgment, probability judgment and decision making (Feeney and Heit, 2007). Considering Deductive Reasoning, Johnson-Laird and Byrne (1991) pointed out that deductive reasoning is a central intellectual ability, which is necessary: in order to formulate plans; to evaluate alternative actions; to determine the consequences of assumptions and hypotheses; to interpret and formulate instructions, rules and general principles; to pursue arguments and negotiations; to weigh evidence and to assess data; to decide between competing theories; and to solve problems. A world without deduction would be a world without science, technology, laws, social conventions and culture. Deductive Reasoning research makes central use of logical systems- especially the propositional calculus- to characterize the abstract structure of reasoning problems. Reasoning has two levels –lower and higher order thinking. Finding out similarities, creating anagrams and coding are the lower order and syllogistic reasoning and data sufficiency are the higher order. Both orders of thinking were examined in this study. References: 1. Anastasi, A. (1986a). Evolving concepts of test validation. Annual Review of Psychology, Vol. 37, pp-1-15. 2. Berry, CM. (2007). Toward an understanding of Evidence of Differential Validity of Cognitive Ability test for racial/ethnic subgroups. A dissertation submitted to the Faculty of the Graduate School of the University of Minnesota. 3. Boehm, VR. (1977). Differential prediction: A methodological artifact? Journal of Applied Psychology, Vol. 62; pp: 146-154. 4. Carroll, JB. (1989). Factor Analysis since Spearman: Where do we stand? What do we know? Abilities, Motivation, and Methodology. Edited by Kanfer, R, Ackerman, P.L. and Cudeck, R. (1989): Routledge; pp. 43-67. 5. Dutta Roy,D. (2002). Computer programming job analysis, Management and Labour Studies, 27,4, 255-262. 6. Feeney, A. & Heit, E. (2007). Inductive Reasoning: Experimental, developmental and computational Approaches. Cambridge University Press. 7. Hunter, JE. & Schmidt, FL. (1978). Differential and single group validity of employment tests by race: A critical analysis of three recent studies. Journal of Applied Psychology, Vol. 63 (1); pp: 1-11. 8. Johnson-Laird, PN. & Byrne, RMJ. (1991). Deduction. Hove, UK: Psychology Press. 9. Johnson-Laird, PN. & Byrne, RMJ. (1993). Précis of Deduction. The Behavioral and Brain Sciences, Vol. 16 (2); pp: 323-333. 10. Kamphaus, RW. (2001). Clinical Assessment of child and adolescent intelligence (2nd Ed.) Boston: Allyn and Bacon. 11. Linn, RL. (1978). Single-group validity, differential validity, and differential prediction. Journal of Applied Psychology, Vol. 63; pp: 507-512. Prepared By: S. Malakar, Social Sciences Division’s Office Plan Budget Proposals 2014-15, SSD 123 12. Sternberg, R.J. (1977). Component processes in analogical reasoning. Psychological Review. Vol. 84 (4); pp.:353:378. 13. Summit, S. (1995, 1996). Skills needed in Programming; www.eskimo.com/`scs/ eclass/ progintro/ sx1.html. Visited on March, 18, 2013. Chapter 2: Literature Review Differential Validity: Over the years, several researches in different fields have been conducted on differential validity. A large number of researches have been carried out in the field of Educational Psychology. Also it has found its place in other fields like Clinical Psychology and Personnel Psychology. A brief review of the literature will therefore help reveal the extent of applicability of differential validity. Educational Psychology: Young and Kobrin (2001) reviewed 49 published research works on differential validity spanning over 25 years and across gender and ethnicity. A number of studies have been conducted specifically on the differential validity of admission tests like SAT and GRE. Breland (1979) used SAT scores and high school rank as predictor and freshman grades as criterion and found that the median values for women were generally equal or higher than that for men. However, he could not find discernable pattern of the validity coefficients across the different ethnic groups. Several other researches on the same reported that minority students, especially blacks, tend to earn lower grades than were predicted from their test scores (e.g. Clearly, 1968; Ramist, 1984; Young, 1991, 1994; cited in Kyei-Blankson, 2005). Reynolds et al. (1979) studied differential validity of WISC-R with the reading, spelling and arithmetic achievement for boys and girls referred for Psychological Services and found no significant differences across sex in the magnitudes of WISC-R and achievement correlations. Huysamen (2000) studied the differential validity of Matriculation and University performance as predictors of post first-year performance and reported “the point-biserial correlation between mean percentage mark and academically advantaged or non-disadvantaged group membership decreased for the same intake of students from their first to their third year of study. Moreover, for both groups first-year percentage marks were better predictors of subsequent performance than were matriculation marks and the difference in the predictive correlations of the percentage marks of these groups was smaller for secondyear performance than for first-year performance”. Clinical Psychology: Lett and Kamphaus (1997) evaluated the differential validity of the BASC Teacher Rating Scale (TRS) and the BASIC Student Observation System (SOS) in the differentiation of nondisabled children from children with ADHD diagnosis, and children with only an ADHD diagnosis from children with ADHD diagnosis and a comorbid diagnosis. Results indicated that the TRS and SOS exhibited good differential validity. Boone (1995) assessed the differential validity of the MMPI-2 subtle and obvious scales with psychiatric inpatients and found that use of Obvious items resulted in more accurate prediction of assessed suicide risk, while inclusion of the Subtle items did not add any useful information in the prediction of assessed suicide risk or psychiatric diagnosis. He further recommended that future research that uses the MMPI-2 basic clinical scales should examine the differential validity of the Subtle and Obvious scales. Fee et al. (1993) studied the differential validity of hyperactivity/attention deficits and conduct problems among mentally retarded children and found that conduct problems are less strongly associated with hyperactivity and attention deficits among mentally retarded children compared to children of normal intelligence. He also found that attention problems and conduct problems may be associated with mental retardation in general. Heun, Muller and Papassotiropoulos (1998) in a study on differential validity of informant based diagnosis of dementia and depression in index subjects and in their first degree relatives concluded that observations in selected samples, i.e. subjects treated, hospitalized and/or autopsied, cannot be generalized to first-degree relatives in family studies. Suslow (1998) in his study on the differential validity of the Gothschalk- Gleser Anxiety Scales across gender reported that “gender might have a differential effect on the validity of the Gothschalk- Gleser Anxiety Scales”. Personnel Psychology: Differential validity research has been carried out extensively in the Personnel Psychology (e.g. Lefkowitz, 1972; Toole, 1972). Schmidt, Pearlman and Hunter (1980) tested the validity and fairness of Employment and Educational tests for Hispanic Americans and found that the tests are neither differentially valid for, nor unfair to, Hispanics. Rothstein and McDaniel (1992) studied the differential validity by sex in employment settings and found that general cognitive ability may be slightly more predictive of rated job performance for women than for men and also that in single sexdominated occupations, tests of general cognitive ability and perceptual ability are more valid for members of the dominant sex, and these differences are more apparent at low-complexity levels. Maler Prepared By: S. Malakar, Social Sciences Division’s Office 124 Social Sciences Division, ISI and Fuchs (1978) in their study on differential validity of the Army Aptitude Areas for Predicting Army Job Training performance of blacks and whites found that aptitude area scores correlated highly with training scores for both blacks and whites. Hausdorf (1997) checked the differential validity of employment interview decision and concluded that “structuring the interview can minimize the potentially negative effects of interviewer biases on the reliability and validity of interview decisions”. Nugent (1993) studied the differential validity in social work measurement and concluded that the scores produced by different measurement instruments used in social work practice may have differential validity characteristics. Computer Programming Ability: Considering the association between computer programming ability and cognition, the review of literature reveals a both way relationship between the two. Computer programming ability indeed requires higher cognitive functioning, but it also affects the cognition in several ways. Therefore, in this review, computer programming ability is viewed both as an independent variable as also a dependent variable. Also a number of researches revealing the association of computer programming ability with other significant cognitive factors are discussed. As Independent Variable: Clements and Gullo (1984) in a study assessed the effects of learning computer programming on children's cognitive style, metacognitive ability, cognitive development, and ability to describe directions. They found that programming may influence reflectivity, divergent thinking, metacognitive ability and ability to describe directions. Liao and Bright (1991) also found that students who learned computer programming scored higher in different cognitive tasks than those who did not learn computer programming. However, Kurland, Roy, Clement and Mawby (1986) found that even after extensive computer programming training for two years, it fails to affect the domain of mathematical and reasoning abilities although both includes the same formal properties. As Dependent Variable: Cafolla (1987-88) studied the relationship between computer programming ability and the level of cognitive development, verbal ability, and mathematics reasoning. He found that mathematics reasoning and verbal ability were each significant predictors of success in computer programming. Level of cognitive development, as defined by Piaget, also predicts success in computer programming ability. Regression analysis showed that level of cognitive development, when combined with verbal reasoning, is linearly predictive of programming ability. Webb (1985) also compared achievement of students learning programming in pairs and individually and examined relationships between cognitive abilities, style, and demographics. Though no difference could be found in programming outcomes, but mathematics and verbal ability best predicted individual setting outcomes, while nonverbal reasoning, spatial ability, and age best predicted learning in groups. Byrne and Lyons (2001) examined the relationship between student results in a first year programming course and predisposition factors of gender, prior computing experience, learning style and academic performance to date and found that none of the variables significantly affect the computer programming abilities of the students. White and Sivitanides (2002) studied the effect of two human cognitive characteristics namely, i) Piaget’s cognitive development and ii) McCarthy’s cognitive hemispheric style and the learning of specific computer programming languages. They concluded that different programming languages are more suited for different cognitive characteristics. If the cognitive requirements for a programming language are beyond the cognitive characteristics of a programming student, the student may burn out. If the cognitive requirements are below the student’s cognitive characteristics the student may be bored. If they are similar to them, the student is able to meet the challenges. Motivation, interest, self-esteem and success may thus be optimized. Association with other variables: Springler and Schaefer (1984) observed the programming ability of thirty one children (3-4 years) found a slight relationship between the computer programming ability of the children and their prediction ability and significant improvement was observed with time. Fletcher (1984) tested the association between the computer programming ability of college students and their cognitive abilities with regard to spatial ability, field dependence/independence, general reasoning or non-verbal intellect, analytic versus holistic processing, and math skills and found high positive correlation between the computer programming ability and several cognitive abilities. However, Bennedsen and Caspersen (2006) found that there is no correlation between stage of cognitive development (abstraction ability) and final grade of CS1 (programming ability). Foreman (1988) examined the association of cognitive style and ability to the initial acquisition of computer programming competence of 46 college students Prepared By: S. Malakar, Social Sciences Division’s Office Plan Budget Proposals 2014-15, SSD 125 enrolled in a computer literacy course. He selected the field-independence cognitive style and three cognitive abilities namely, logical reasoning, spatial ability, and direction following and these were correlated to five programming component skills: (1) knowledge of BASIC syntax; (2) ability to predict program outcome; (3) ability to design and write programs; (4) ability to debug programs; and (5) ability to modify programs in BASIC. It was found that field-independence, logical reasoning, and direction following were strongly related to most programming skills, while spatial ability was related only to debugging and modification. Dutta Roy and Mallik (2000) estimated the relative importance of nine general aptitudes for success in computer programming. They found that aptitudes concerned with reasoning faculties are of greater importance in computer programming than aptitudes concerned with skills. On another study, they examined the perceived importance of computer programming aptitudes and found that comprehending aptitude, creative aptitudes like associational fluency, inference, anagram, expressional fluency, absurdities and word fluency as also memory for spatial position appeared to be more useful in computer programming job (Dutta Roy, 1999). Reasoning ability: A huge chunk of the research in the field of cognitive psychology covers the various aspects of human reasoning ability. The current review has focused on a number of researches on the different types of reasoning abilities and their association with other relevant variables. Abstract Reasoning Ability: Torrens (1999) studied individual differences and the belief bias effect and concluded that abstract reasoning does predict the ability to generate alternatives and the understanding of logical necessities. Minshew, Meyer and Goldstein (2002) studied the abstract reasoning ability of autism and found significant difference between individuals with autism and individuals from a matched control group on almost all abstract reasoning tasks. Cronin-Golomb, Rho, Corkin and Growden (1987) tested the abstract reasoning ability among Alzheimer’s disease and found that relational abilities may remain intact well into the disease, whereas generational abilities may be among the cognitive skills that are impaired early in the course of the disease. Emery, Hale and Myerson (2008) studied the age difference in abstract reasoning and working memory under the condition of proactive interference (PI) and reported that young adults' reasoning ability was best predicted by working memory performance under high-PI conditions while older adults' reasoning ability was best predicted by their working memory performance under low-PI conditions. Mathematical Reasoning Ability: Benbow and Stanley (1983) conducted research on the mathematical reasoning ability of pre –adolescent students and found that by age 13 years, a large sex difference exists in mathematical reasoning ability. Further, in a 20-year follow up study, Benbow, Lubinski, Shea and Eftekhari-Sanjani (2000) reported that such difference in mathematical reasoning ability does predict differential educational and occupational outcomes. Gustin and Corazza (1994) studied the predictive ability of mathematical and verbal reasoning ability and found that they together, are the best predictors of science achievement. Scientific reasoning ability: Gerber, Cavallo and Marek (2001) studied the relationships among informal learning environments, teaching procedures and scientific reasoning ability of students and found that students with enriched informal learning environment and inquiry-based science classrooms have better science reasoning ability than those with impoverished informal learning environment and non-inquiry based science classrooms. Cavallo (1996) studied the interrelationship between meaningful learning, reasoning ability and students’ understanding and solving of genetics problems and found that reasoning ability did predict the achievement in solving genetics problems. Kwon and Lawson (2000) linked brain activities with the development of scientific reasoning ability and conceptual change during adolescence and found that pre –frontal activities correlated highly with scientific reasoning ability and these in turn predicted concept gain. Formal Reasoning Ability: Lawson and Thompson (1988) hypothesized that following instructions, formal operational students will reason significantly better than their concrete operational counterparts and tested 131 students. They findings did support their hypothesis. Tobin and Capie (1982) studied the relationships between formal reasoning ability and integrated process skill achievement and reported that formal reasoning ability is the best predictor of process skill achievement and retention as also it correlated highly with rates of generalizing and comprehending. Zeitoun (1989) tested the relationship abstract concept achievement Prepared By: S. Malakar, Social Sciences Division’s Office 126 Social Sciences Division, ISI and prior knowledge, formal reasoning ability and gender and reported that prior knowledge and formal reasoning ability play a major role in students’ achievement of abstract concepts. References: 1. Benbow, CP. & Stanley, JC. (1983). Sex differences in mathematical reasoning ability: more facts. Science 2, Vol. 222 (4627); pp: 1029-1031. 2. Benbow, CP., Lubinski, D., Shea, DL. & Eftekhari-Sanjani, H. (2000). Sex differences in mathematical reasoning ability at age 13. Their status 20 years later. Psychological Science, Vol. 11 (6); pp: 474-480. 3. Bennedsen, J. & Caspersen, ME. (2006). Abstraction ability as an indicator of success for learning object-oriented programming? S1GCSE-Newletter: ACMS1GCSE Bulletin, Vol. 38 (2); pp: 39-43. 4. Boone, D. (1995). Differential validity of the MMPI-2 Subtle and Obvious scales with psychiatric inpatients: Scale 2. Journal of Clinical Psychology, Vol. 51 (4); pp: 526-531. 5. Breland, HM. (1979). Population validity and college entrance measures. Research Monograph No. 8. New York: College Board. 6. Byrne, P. & Lyons, G. (2001). The effect of student attributes on success in programming. Proceedings of the 6th Annual Conference on Innovation and Technology in Computer Science Education, pp: 49-52; ACM S1GCSE Bulletin, Vol. 33 (3), Sept. 2001; pp: 49-52. 7. Cafolla, R. (1987-88). Piagetian formal operations and other cognitive correlates of achievement in computer programming. Journal of Educational Technology Systems, Vol. 16 (1); pp: 45-55. 8. Cavallo, AML. (1996). Meaningful learning, reasoning ability, and students understanding and problem solving of topics in genetics. Journal of Research in Science Teaching, Vol. 33 (6); pp: 625-656. 9. Clearly, TA. (1978). Test bias: Prediction of grades of Negro and White students in integrated colleges. Journal of Educational Measurement, Vol. 5; pp: 115-124. 10. Clements, DH. & Gullo, DF. (1984). Effects of computer programming on young children’s cognition. Journal of Educational Psychology, Vol. 76 (6); pp: 1051-1058. 11. Dutta Roy, D. & Mallik, R. (2000). Ranking general aptitudes for success in computer programming. Journal of the Indian Academy of Applied Psychology, Vol. 26 (1-2); pp: 135-139. 12. Dutta Roy, D. (1999). Perceived importance of computer programming aptitudes. Indian Journal of Applied Psychology, Vol. 36; pp: 6-9. 13. Emery, L., Hale, S. & Myerson, J. (2008). Age differences in proactive interference, Working Memory and Abstract reasoning. Psychol. Aging, Vol. 23 (3); pp: 634-645. 14. Fee, VE. , Matson, JL., Moore, LA & Benavidez, DA. (1993). The differential validity of hyperactivity/ attention deficits and conduct problems among mentally retarded children. Journal of Abnormal Child Psychology, Vol. 21 (1); pp: 1-11. 15. Flatcher, SH. (1984). Cognitive abilities and computer programming. Education Resources Information Center. Record details- ED259700. 16. Foreman, KH. (1988). Cognitive style, cognitive ability and the acquisition of initial computer programming competence. Education Resources Information Center, Record details- ED295638. 17. Gerber, BL., Cavallo, AML. & Marek, EA. (2001). Relationships among informal learning environmentys, teaching procedures and scientific reasoning ability. International Journal of Science Education, Vol. 23 (5); pp: 535-549. 18. Gonin-Golomb, A., Rho, WA., Corkin, S. & Growdon, JH. (1987). Abstract reasoning in agerelated neurological disease. J Neural Transm Suppl., Vol. 24; pp: 79-83. 19. Gustin, WC. & Corazza, L. (1994). Mathematical and Verbal reasoning as predictors of science achievement. Roeper Review, Vol. 16 (3); pp: 160-162. 20. Hausdorf, PA. (1997). Understanding the impact of pre-interview information on the reliability, validity, accuracy and differential validity of employment interview decisions: Comparisons across interview question type, rating scale and scoring protocols. Open Access Dissertations and Theses. Paper 3347. http://digitalcommons.mcmaster.ca/opendissertations/3347. 21. Heun, R., Muller, H. & Papassotiropoulos, A. (1998). Differential validity of informant based diagnosis of dementia and depression in index subjects and in their first degree relatives. Social Psychiatry and Psychiatric Epidemiology, Vol. 33 (10); pp: 510-513. 22. Huysamen, GK. (2000). The differential validity of Matriculation and University performance as predictors of post first year performance. South African Journal of Higher Education, Vol. 14 (1); pp: 146-151. Prepared By: S. Malakar, Social Sciences Division’s Office Plan Budget Proposals 2014-15, SSD 127 23. Kurland, DM., Roy, DP., Clement, C. & Mawby, R. (1986). A study of the development of programming ability and thinking skills in High School students. Journal of Educational Computing Research. Vol. 2 (4); pp: 429-458. 24. Kwon, Y. & Lawson, AE. (2000). Linking brain growth with the development of Scientific Reasoning Ability and Conceptual change during adolescence. Journal of Research in Science Teaching, Vol. 37 (1); pp: 44-62. 25. Kyei-Blankson, LS. (2005). Predictive validity, Differential validity and Differential Prediction of the subtests of the Medical College Admission Test. A Dissertation presented to the faculty of College of Education of Ohio University. 26. Lawson, AE. & Thompson, LD. (1988). Formal reasoning ability and misconceptions concerning genetics and natural selection. Journal of Research in Science Teaching, Vol. 25 (9); pp: 733746. 27. Lefkowitz, J. (1972). Differential validity: Ethnic group as a moderator in predicting Tenure. Personnel Psychology, Vol. 25 (2); pp: 223-240. 28. Lett, NJ. & Kamphaus, RW. (1997). Differential validity of the BASIC Student Observation System and the BASC Teacher Rating Scale. Canadian Journal of School Psychology: Vol. 13 (1); pp: 1-14. 29. Liaw, YC. & Bright, GW. (1991). Effects of computer programming on cognitive outcomes: A Meta analysis. Journal of Educational Computing Research, Vol. 7 (3); pp: 251-266. 30. Malar, MH. & Fuchs, EF. (1978). Differential validity of the Army Aptitude areas for predicting Army Job Training performance of Blacks and Whites. Army Research Institute for the Behavioral and Social Sciences, Alexandria VA. Accession no. ADA061575. DTIC: Information for the Defense Community. 31. Minshew, NJ., Meyer, J. & Goldstein, G. (2002). Abstract reasoning in Autism: dissociation between concept formation and concept identification. Neuro-psychology, Vol. 16 (3); pp: 327334. 32. Nugent, WR. (1993). Differential validity in Social Work Measurement. Social Service Review, Vol. 67 (4); pp: 631-650. 33. Ramist, L. (1984). Predictive validity of ATP Tests. In T.F. Donlon (Ed.), College Board Technical Handbook for the Scholastic Aptitude and Achievement Tests (pp: 141-170). New York: College Entrance Examination Board. 34. Reynolds, CR, Gutkin, TB, Dappen, L & Wright, D. (1979). Differential validity of the WISC-R for boys and girls referred for psychological services. Perceptual and Motor Skills, Vol. 48; pp: 868-870. 35. Rothstein, HR. & McDaniel, MA. (1992). Differential validity by sex in employment settings. Journal of Business and Psychology. Vol. 7 (1); pp: 45-62. 36. Schmidt, FL., Pearlman, K. & Hunter, JE. (1980). The validity and fairness of employment and educational tests for Hispanic Americans: A review and analysis. Personnel Psychology, Vol. 33 (4); pp: 705-724. 37. Springle, JE. & Schaefer, L. (1984). Age, gender and spatial knowledge influences on preschooler’s computer programming ability. Early Child Development and Care, Vol. 14 (3-4); pp: 243-250. 38. Suslow, T. (1998). Differential validity of the Gothschalk- Gleser Anxiety Scales: Is gender a moderator variable? Scandinavian Journal of Psychology. Vol. 39 (1); pp: 9-13. 39. Tobin, KG. & Capie, W. (1982). Relationships between formal reasoning ability, locus of control, academic engagement and integrated process of skill achievement. Journal of Research in Science Teaching, Vol. 19 (2); pp: 113-121. 40. Toole, DL. , Gavin, JF. , Murdy, LB. & Sells, SB. (1972). The differential validity of Personality, Personal history and Aptitude data for minority and non minority employees. Personnel Psychology. Vol. 25 (4); pp: 661-673. 41. Torrens, D. (1999). Individual differences and the belief bias effect: Mental models, logical necessity and abstract reasoning. Thinking and Reasoning, Vol. 5 (1); pp: 1-28. 42. Webb, NW. (1985). Cognitive requirements of learning computer programming in group and individual settings. AEDS Journal, Vol. 18 (3); pp: 183-194. 43. White, GL. & Sivitanidas, MP. (2002). A theory of the relationship between cognitive requirements of computer programming languages and programmer’s cognitive characteristics. Journal of Information Systems Education, Vol. 13 (1); pp: 59-66. Prepared By: S. Malakar, Social Sciences Division’s Office Social Sciences Division, ISI 128 44. Young, JW. & Kobrin, JL. (2001). Differential validity, Differential prediction and College Admission Testing: A comprehensive review and analysis. College Entrance Examination Board, New York, 2001. 45. Young, JW. (1991). Improving the prediction of college performance of ethnic minorities using IRT- based GPA. Applied Measurement in Education, Vol. 4; pp: 229-239. 46. Zeitoun, HH. (1989). The relationship between abstract concept achievement and prior knowledge, formal reasoning ability and gender. International Journal of Science Education, Vol. 11 (2); pp: 227-234. OBJECTIVES 1. To estimate item difficulty and item-total associations of five subtests of computer programming abilities. 2. To estimate reliability of the five subtests. 3. To examine inter subtest correlation among the five subtests. 4. To relate scores of five subtests with academic achievement scores of the students. 5. To determine norms for five subtests. 6. To examine the main and interaction effect of the demographic variables on the scores of five subtests. Chapter 3: Method 1: Schools participated: 1.1: Selection of Schools: Schools were selected from different rural and sub-urban areas of West Bengal. Almost all schools were under Govt. of West Bengal. A written permission was obtained from the Ministry of Secondary Schools of West Bengal. Schools were then directly or indirectly contacted for data collection. 1.2: Description of the Schools: Total seven different schools participated in the study. Total number of students was 994 (Table 3.1). Table 3.1: Description of Schools. Sl. No. School Names Location No. of students who participated Medium of Instruction 1 Kalyani Central Model School Kalyani 167 English 2 Udaypur Haradayal Nag Adarsha Vidyalaya Belgharia 114 Bengali 3 Fatellapur High School Nimta 66 Bengali 4 Mahesh Sri Ramkrishna Ashram Vidyalaya Mahesh, Rishra 153 Bengali 5 Kalyani University Experimental High School Kalyani 196 English 6 Rishra Anjuman High School Rishra 108 Urdu 7 Sarat Kumari Girls’ High School Shantipur 190 Bengali Total number of students 994 2: Participants: 2.1: Description of Participants: School wise distribution of participants is shown considering four parameters namely, Sex, Age, Grade, Religion, Caste and Medium of Instructions (Table 3.2). It is seen that 63 % of the total number of participants are boys while 37 % are girls. 42.60 % of the participants were below age 13 years and 57.40 % were above age 13 years during the collection of data. Again, 43.40 % of the participants were studying in class VIII, 46.10 % were studying in class IX and 10.60 % of the participants were studying in class X during the collection of data. 78.20 % of the participants are Hindu while 21.80 % are of other religions like Islam, Christianity and Buddhism. Among the participants, 47.80 % belong to general caste and 44.20 % belong to other castes (S.C, S.T, O.B.C and Muslim). 8 % of the participants did not specify their caste. Again, 36.50 % of the participants are studying in English medium, 52.60 % of the participants are studying in Bengali medium, and 10.90 % are studying in Urdu medium (Fig. 3.1). Prepared By: S. Malakar, Social Sciences Division’s Office Plan Budget Proposals 2014-15, SSD 129 Table 3.2: Frequency and percentage distribution of participants (n=994). Demographic Variable Sex Age Grade Religion Caste Medium of instruction Levels Frequency Percentage Grand Total Boys Girls Below 13 years Above 13 years VIII IX X Hindu Non-Hindu General Non-General Unspecified English Bengali Urdu 622 372 422 571 431 458 105 777 217 475 439 080 363 523 108 63.00 37.00 42.60 57.40 43.40 46.10 10.60 78.20 21.80 47.80 44.20 08.00 36.50 52.60 10.90 994 994 994 994 994 994 Fig. 3.1: Pie charts showing the distribution of participants according to gender, age, grade, religion, caste and medium of instruction. 2.2. Inclusion Criteria: 1. Participants should be a student of grade- VIII to X. 2. Participant should have at least basic knowledge of English language. 2.3. Exclusion Criteria: 1. Participants should be free from any kind of mental disability. Prepared By: S. Malakar, Social Sciences Division’s Office 130 Social Sciences Division, ISI 2. Participants should not be suffering from any kind of eyesight problem. 3. Test Development: One 60- items test battery was developed to assess five reasoning abilities - similarities, anagram, syllogistic reasoning, data sufficiency and coding. Each subtest has 12 items with four or five options. 3.1: Description of the subtests: Subtest 1- Similarities: It is the ability to group a set of objects on the basis of some similar properties or to identify an item that is dissimilar. For example, among the four items, 27, 24, 36 and 12, all are multiples of 3 but 24, 36 and 12 are even numbers. So they form a group while 27 being an odd number, is dissimilar to others. Subtest 2- Anagrams: It is the ability to arrange jumbled up letters in order to form a meaningful word. For example, arranging the letters like, L W R F O E in proper sequence gives the word ‘FLOWER'. Subtest 3- Syllogistic reasoning: It is the ability to deduce inference regarding the relationship between objects or events, based on two or more premises. For example, Premises: i) All pencils are bricks ii) Al bricks are bottles Conclusions: a) All pencils are bottles. b) All bricks are pencils. Here conclusion a follows based on the reasoning that, since all pencils are bricks and all bricks are bottles, all pencils must be bottles. But all bricks may or may not be pencils. Subtest 4- Data Sufficiency: It is the ability to justify the answer to a question based on the data provided in the answer. For example, How many students in a school eat in the canteen? a) Half of the girls in the school eat in the canteen. b) The canteen sells 650 meals on a daily basis. Here the fact provided in the second statement answers the question. So the correct answer is option (b). Subtest 5- Coding: It is the ability to code numerical and alphabets on the basis of some assumed relationship among them. For example, If 1=C 4=E 6=K 9=A Then which among these is the right combination? i) 46 ii) 19 iii) 61 iv) 94 a) AE b) EC c) AK d) CA Options: A) iB & iiC B) iiD & ivA C) iiiC & ivB D) iiD & iiiA Answer: B) iiD & ivA. 3.2: Procedure of Test Administration: Sub test wise instructions are given in the questionnaire. The participants were asked to read them initially before starting off each of the subtests. The instructions were also explained in lucid language, sometimes in the local dialect so that the participants could understand the task properly before doing it. In some cases, the solutions of problems were demonstrated pictorially with the help of blackboard and chalk. Adequate time was provided to the participants. On an average, the participants took around 90 minutes to finish the entire test battery. 4. Statistical Analyses: Statistical analyses included the following analysis: Section A: Determining Psychometric properties of the test battery: i) Average Difficulty Indices of each subtest ii) Item wise Difficulty Indices iii) Item- Total Correlation iv) Inter-subtest correlation v) Reliability vi) Validity vii) Norm Section B: Analysis of Variance: i) Age wise ii) Grade wise iii) Gender wise iv) Religion wise Prepared By: S. Malakar, Social Sciences Division’s Office Plan Budget Proposals 2014-15, SSD 131 v) Medium of Instruction wise vi) Caste wise Chapter 4: Results SECTION A 1. Item Characteristics 1.1: Descriptive Statistics: Descriptive statistics of participants: Table 4.1.1: Descriptive statistics of participants (n=994). Name of the Subtest Mean SD 1. Similarities 5.53 2.75 2. Anagram 7.88 3.82 3. Syllogistic Reasoning 1.36 1.63 4. Data sufficiency 1.70 1.53 5. Coding 5.36 3.91 6. Total 21.83 9.67 Descriptive statistics of performance of individual schools on five subtests: Table 4.1.2: Descriptive statistics of individual schools (n=994). Name of the Schools Kalyani Central Model School (n=167) Udaypur Haradayal Nag Adarsha Vidyalaya (n=114) Fatellapur High School (n=66) Mahesh Sri Ramkrishna Ashram Vidyalaya (n=153) Kalyani University Experimental High School (n=196) Rishra Anjuman High School (n=108) Sarat Kumari Girls’ High School (n=190) Total (n=994) Similarities Anagram Data Sufficiency 1.56 Coding Total 9.99 Syllogistic Reasoning 0.91 Mean 5.88 6.13 24.47 SD Mean 2.32 4.46 2.08 5.07 0.86 0.74 1.18 1.32 4.11 2.84 6.66 14.43 SD Mean 2.19 2.94 2.82 2.20 0.86 1.97 0.88 2.24 1.80 4.00 4.77 13.35 SD Mean 1.72 7.19 1.68 10.41 1.81 4.12 1.63 3.60 3.43 7.62 5.95 32.95 SD Mean 2.46 4.39 2.69 6.07 1.71 0.70 1.83 1.27 4.40 5.38 8.55 17.81 SD Mean 2.65 7.57 3.26 10.68 0.76 0.77 1.17 1.29 3.59 6.74 7.10 27.04 SD Mean 2.36 3.99 2.52 5.78 0.90 0.69 1.23 0.98 4.13 3.41 7.72 14.86 SD Mean SD 1.96 5.53 2.75 3.04 7.88 3.82 0.72 1.36 1.63 0.87 1.70 1.53 2.01 5.36 3.91 5.19 21.83 9.67 1.2: Difficulty Index: Item wise difficulty was assessed using the Difficulty Index (DI). The formula of DI is given below: DI= No. of correct responses/No. of total responses × 100 Out of the five subtests, item difficulty was higher in data sufficiency (M=29.10; SD=8.96) and syllogistic reasoning (M=30.30; SD=8.04). For other subtests, DI is moderate. Respondents felt relatively less difficulty in the problems of anagram (M=64.35; SD=9.32) and data coding (M=51.58; SD=6.04) than similarities (M=46.86; SD=14.14) (Table 4.2.2; Fig. 4.1). Table 4.2.1: School wise average Difficulty Indices of tests. Name of the School Kalyani Central Model School Fatellapur High School Udaypur Haradayal Nag Adarsha Vidyalaya Mahesh Sri Ramkrishna Ashram Vidyalaya Kalyani University Experimental High School Rishra Anjuman High School Sarat Kumari Girls’ High School Similarities 51.02 32.14 40.02 65.42 66.62 38.19 34.58 Prepared By: S. Malakar, Social Sciences Division’s Office Anagrams 85.20 27.79 49.48 90.96 91.44 54.87 50.69 Reasoning Ability Test Syllogistic Reasoning 33.04 29.73 29.71 36.64 33.95 23.42 25.65 Data Sufficiency 32.17 24.14 29.61 36.10 33.79 25.17 22.74 Coding 64.15 43.99 28.58 78.89 66.04 48.52 30.89 Social Sciences Division, ISI 132 Fig 4.1: Sub test wise difficulty indices compared to the mean difficulty index of the test Table 4.2.2: Item Wise Difficulty Indices (N=994). Items Average Di Of Each Item Similarities Q1 57.19 Q2 57.33 Q3 55.87 Q4 31.44 Q5 26.62 Q6 35.75 Q7 34.26 Q8 61.95 Q9 67.92 Q 10 40.17 Q 11 58.21 Q 12 35.56 Average DI 46.86 Anagrams Q 13 86.18 Q 14 68.82 Q 15 70.79 Q 16 50.63 Q 17 67.30 Q 18 71.01 Q 19 57.40 Q 20 59.59 Q 21 63.24 Q 22 56.84 Q 23 57.53 Q 24 63.69 Average DI 64.35 Syllogistic Reasoning Q 25 24.14 Q 26 41.18 Q 27 28.85 Q 28 26.46 Q 29 20.60 Q 30 24.50 Q 31 21.44 Q 32 32.00 Prepared By: S. Malakar, Social Sciences Division’s Office Plan Budget Proposals 2014-15, SSD 133 Q 33 25.04 Q 34 39.41 Q 35 43.88 Q 36 36.16 Average DI 30.31 Data Sufficiency Q 37 17.42 Q 38 14.83 Q 39 37.89 Q 40 38.18 Q 41 30.93 Q 42 38.28 Q 43 26.78 Q 44 23.26 Q 45 28.72 Q 46 19.31 Q 47 32.29 Q 48 41.33 Average DI 29.10 Data Coding Q 49 53.73 Q 50 63.92 Q 51 57.30 Q 52 53.77 Q 53 56.05 Q 54 50.78 Q 55 46.53 Q 56 52.93 Q 57 48.60 Q 58 46.68 Q 59 41.06 Q 60 47.59 Average DI 51.58 1.3: Item-Total Correlation: Item-total score correlation coefficients indicate the content validity of the test. Out of the five subtests, item-total correlation coefficients are higher in coding (Mdn=0.90), anagram (Mdn=0.90) and similarities (Mdn=0.76) than data sufficiency (Mdn=0.48) and syllogistic reasoning (Mdn=0.28). Poor item-total correlation in syllogistic reasoning and data sufficiency subtests indicate incongruity in item responses (Table.4.3.1-4.3.5; Fig. 4.2). Table.4.3.1: Sub Test 1: Similarities Items Phi-Coefficient Chi-Square p-level 1 0.76 1.93 0.00 2 0.83 2.31 0.00 3 0.75 1.87 0.00 4 0.41 55.78 0.00 5 0.57 1.11 0.00 6 0.48 76.24 0.00 7 0.62 1.27 0.00 8 0.77 1.97 0.00 9 0.78 2.03 0.00 10 0.80 2.11 0.00 11 0.80 2.11 0.00 Prepared By: S. Malakar, Social Sciences Division’s Office Social Sciences Division, ISI 134 12 Median 1.60 0.00 Table.4.3.2: Sub Test 2: Anagram Items Phi-Coefficient 1 0.56 2 0.77 3 0.86 4 0.89 5 0.91 6 0.89 7 0.95 8 0.93 9 0.90 10 0.92 11 0.92 12 0.86 Median 0.90 Chi-Square 1.31 2.48 3.10 3.36 3.46 3.33 3.79 3.68 3.39 3.57 3.60 3.10 p-level 0.00 0.00 0.00 0.00 0.00 0.00 0.00 0.00 0.00 0.00 0.00 0.00 Table.4.3.3: Sub Test 3: Syllogistic Reasoning Items Phi-Coefficient 1 0.23 2 0.39 3 0.53 4 0.38 5 .035 6 0.00 7 0.20 8 0.05 9 0.31 10 0.35 11 0.67 12 0.24 Median 0.28 Chi-Square 33.65 94.50 1.77 92.23 75.82 0.00 24.88 1.87 62.33 78.57 2.76 35.58 p-level 0.00 0.00 0.00 0.00 0.00 0.97 0.00 0.17 0.00 0.00 0.00 0.00 Table.4.3.4: Sub Test 4: Data Sufficiency Items Phi-Coefficient 1 0.64 2 0.25 3 0.34 4 0.51 5 0.66 6 0.46 7 0.59 8 0.17 9 0.49 10 0.13 11 0.37 12 0.58 Median 0.48 Chi-Square 1.90 29.68 53.34 1.23 1.56 0.58 1.61 13.31 1.11 8.10 66.06 1.56 p-level 0.00 0.00 0.00 0.00 0.00 0.00 0.00 0.00 0.00 0.00 0.00 0.00 Table.4.3.5: Sub Test 5: Data Coding Phi-Coefficient Chi-Square 0.83 2.65 0.91 3.20 0.90 3.09 p-level 0.00 0.00 0.00 Items 1 2 3 0.70 0.76 Prepared By: S. Malakar, Social Sciences Division’s Office Plan Budget Proposals 2014-15, SSD 4 5 6 7 8 9 10 11 12 Median 0.80 0.89 0.94 0.93 0.86 0.92 0.89 0.90 0.91 0.90 135 2.43 3.06 3.40 3.32 2.83 3.25 3.05 3.08 3.16 0.00 0.00 0.00 0.00 0.00 0.00 0.00 0.00 0.00 Fig.4.2: Subtest wise item-total correlation coefficients (N=994). 1.4: Inter-correlation among subtests: For test development, associations among the sub constructs are important to understand. Inter-subtest correlation and subtest-total correlation coefficients are the indicators of content validity of overall test. This is possible when all the subtests are measuring the common construct. Current study examined computer programming related reasoning abilities. Results shows that inter subtest correlation and subtest total correlations were highly positive and significant. Similarities, anagram and coding are more correlated with each other as also with the total score in a significant manner. On the other hand, syllogistic reasoning and data sufficiency are more correlated with each other and less with the total score in comparison with others (Table.4.4). Table.4.4: Inter Correlation among subtests (N=994). Mean SD 1 2 3 4 5 6 1. Similarities 5.53 2.75 1.00 2. Anagram 7.88 3.82 0.56** 1.00 3. Syllogistic Reasoning 1.36 1.63 0.25** 0.21** 1.00 ** ** 4. Data sufficiency 1.70 1.53 0.27 0.15 0.55** 1.00 5. Coding 5.36 3.91 0.42** 0.40** 0.27** 0.27** 1.00 6. Total 21.83 9.67 0.76** 0.77** 0.52** 0.50** 0.77** 1.00 ** Correlation is significant at the 0.01 level (2-tailed). 1.5: Reliability Measure: Reliability of the subtests is assessed by Kuder-Richardson Formula 20. The formula is follows: Where, K is the number of test items (i.e. the length of the test), p is the proportion of correct responses to the test item, q is the proportion of incorrect responses to the test item (so that p + q = 1), and the variance for the denominator is Where, n is the total sample size. The reliability coefficients are found to be very high for anagrams (r=0.90) and coding (r=0.88), followed by similarities (n=0.70) and syllogistic reasoning (r=0.65). Reliability coefficient of data sufficiency is found to be relatively lower (r=0.47). This indicates high internal consistency of the test (Table.4.5). Table.4.5: Kuder-Richardson reliability coefficients of the five subtests (N=994). Prepared By: S. Malakar, Social Sciences Division’s Office Social Sciences Division, ISI 136 Name of the subtest Kuder- Richardson Reliability Coefficient Similarities 0.70 Anagrams 0.90 Syllogistic Reasoning 0.65 Data Sufficiency 0.47 Coding 0.88 1.6: Validity Measure: Validity measure of the test has been obtained by correlating the sub test scores with the academic achievement scores of 153 male students (Table 4.6). All the subtests are found to be positively and significantly correlated with the academic achievement total score (except anagram and syllogistic reasoning) as also with the different subjects. Table.4.6: Validity measure of the five subtests (N=153). Similarities Anagram Syllogistic Data Data Total Test Reasoning Sufficiency Coding Score Academic 0.23** 0.11 0.15 0.20** 0.32** 0.34** Achievement Total Score Bengali 0.27** 0.19* 0.15 0.19* 0.25** 0.34** English 0.16* 0.11 0.17* 0.17* 0.32** 0.32** Sanskrit 0.16* 0.04 0.16* 0.15 0.28** 0.27** Physical 0.17* 0.08 0.16* 0.21** 0.26** 0.29** Science Life Science 0.14 0.03 0.12 0.14 0.28** 0.25** Math 0.22** 0.09 0.18* 0.18* 0.32** 0.33** History 0.22* 0.16* 0.21** 0.19* 0.23** 0.32** Geography 0.16* 0.05 0.11 0.19* 0.26** 0.26** W.E & P.E 0.01 -0.05 -0.09 0.07 0.14 0.06 Computer 0.22** 0.12 0.00 0.20** 0.27** 0.28** ENVS 0.41** 0.28** 0.09 0.17* 0.35** 0.44** ** Correlation is significant at the 0.01 level (2-tailed). 1.7: Norm: 4.6.1: Grade Equivalent Norm (n=994): Name of the subtests Grade Mean SD 5.20 2.56 Similarities VIII 5.90 2.88 IX 5.33 2.74 X 7.65 3.84 Anagram VIII 8.11 3.80 IX 7.80 3.78 X 1.30 1.75 Syllogistic Reasoning VIII 1.51 1.63 IX 0.93 0.91 X 1.64 1.55 Data Sufficiency VIII 1.80 1.57 IX 1.50 1.17 X 4.87 3.70 Coding VIII 5.65 3.94 IX 6.06 4.34 X 4.6.2: Sex Equivalent Norm (n=994): Name of the subtests Sex Mean SD 5.96 2.78 Similarities Boys 4.80 2.54 Girls Anagram Boys Girls Prepared By: S. Malakar, Social Sciences Division’s Office 8.24 7.26 3.76 3.83 Plan Budget Proposals 2014-15, SSD 137 Syllogistic Reasoning Boys Girls 1.63 0.90 1.85 1.04 Data Sufficiency Boys Girls 1.92 1.31 1.65 1.20 Boys Girls 4.6.3: Age Equivalent Norm (n=994): Name of the subtests Age Similarities Below 13 years Above 13 years 5.68 4.81 4.13 3.44 Mean 5.15 5.81 SD 2.56 2.86 Anagram Below 13 years Above 13 years 7.37 8.25 3.77 3.81 Syllogistic Reasoning Below 13 years Above 13 years 1.15 1.51 1.53 1.69 Data Sufficiency Below 13 years Above 13 years 1.49 1.84 1.49 1.54 Coding Below 13 years Above 13 years 4.61 5.90 3.54 4.08 Coding 1.8: Percentile Norm: Percentile norm has been established for each of the subtests (Table 4.7). Using this norm, a new score can be interpreted based on this norm. When comparing individuals in a particular subtest, their scores can be plotted against the percentile norm for that particular subtest. Such a norm will facilitate the direct comparison among subjects on a particular subtest. Table.4.7: Percentile norm for each of the five subtests (n=994). P10 P20 P30 P40 P50 P60 P70 P80 P90 Similarities 2.45 3.80 4.44 5.08 5.73 6.37 7.29 Anagram 2.98 4.43 5.61 7.01 9.08 9.99 10.62 Syllogistic Reasoning 0.86 1.23 1.59 1.96 2.32 2.68 3.05 Data Sufficiency 0.89 1.28 1.67 2.06 2.45 2.84 3.23 Data Coding 1.52 2.55 3.56 4.42 5.28 6.14 7.77 8.28 11.25 3.41 3.94 9.79 9.26 11.87 4.87 5.30 11.14 SECTION B Analysis of Variance: 1. Demography wise Analysis of Variance: 1.1: Grade wise Analysis of Variance: Students of three grades, VIII (n=431), IX (n=458) and X (n=105) differed in their levels of reasoning in similarities F (1,992) =7.63, p<0.00, coding F (1,992) =6.55, p<0.00 and in syllogistic F (1,992) =5.85, p<0.00. Participants of grade IX performed better than the others in similarities (M=5.90; SD=2.88), anagram (M=8.11; SD=3.80), syllogistic reasoning (M=1.51; SD=1.63) and data sufficiency ((M=1.80; SD=1.57) while the participants of grade X performed the best in subtest coding (M=6.06; SD=4.34) (Table 4.8). Table.4.8: Grade wise Analysis of Variance (n=994): Name of the subtest Grade Mean SD F value p-value df Prepared By: S. Malakar, Social Sciences Division’s Office Social Sciences Division, ISI 138 1. Similarities VIII (n=431) 5.20 2.56 7.63** 0.00 1,992 IX (n=458) 5.90 2.88 X (n=105) 5.33 2.74 Grand Mean (n=994) 5.53 2.75 2. Anagram VIII (n=431) 7.65 3.84 1.70 0.18 993 IX (n=458) 8.11 3.80 X (n=105) 7.80 3.78 Grand Mean (n=994) 7.88 3.82 3. Syllogistic Reasoning VIII (n=431) 1.30 1.75 5.85** 0.00 993 IX (n=458) 1.51 1.63 X (n=105) 0.93 0.91 Grand Mean (n=994) 1.36 1.63 4. Data Sufficiency VIII (n=431) 1.64 1.55 2.20 0.11 993 IX (n=458) 1.80 1.57 X (n=105) 1.50 1.17 Grand mean(n=994) 1.70 1.53 5. Coding VIII (n=431) 4.87 3.70 6.55** 0.00 993 IX (n=458) 5.65 3.94 X (n=105) 6.06 4.34 Grand Mean (n=994) 5.36 3.91 ** p value<0.01 *p value<0.05 1.2: Age wise Analysis of Variance: The participants are classified into two age groups, below 13 years (n=423) and above 13 years (n=571). Analysis of variance reveals that the two age groups differed significantly in all the subtests, namely, coding F (1,992) =27.07, p<0.00, similarities F (1,992) =14.71, p<0.00, data sufficiency F (1,992) =13.44, p<0.00, anagram F (1,992) =12.98, p<0.00 and syllogistic reasoning F (1,992) =11.95, p<0.00. It is seen that the participants of age group above 13 years performed better than the younger group in subtests on similarities (M=5.81; SD=2.86), anagram (M=8.25; SD=3.81), syllogistic reasoning (M=1.51; SD=1.69), data sufficiency (M=1.84; SD=1.54) and coding (M=5.90; SD=4.08) (Table.4.9). Table.4.9: Age wise Analysis of Variance (n=994): Name of the subtest Age Mean SD F value p-value df 1. Similarities Below 13 (n=423) 5.15 2.56 14.71** 0.00 993 Above 13 (n=571) 5.81 2.86 Grand Mean (n=994) 5.53 2.75 2. Anagram Below 13 (n=423) 7.37 3.77 12.98** 0.00 993 Above 13 (n=571) 8.25 3.81 Grand Mean (n=994) 7.88 3.82 3. Syllogistic Reasoning Below 13 (n=423) 1.15 1.53 11.95** 0.00 993 Above 13 (n=571) 1.51 1.69 Grand Mean (n=994) 1.36 1.63 4. Data Sufficiency Below 13 (n=423) 1.49 1.49 13.44** 0.00 993 Above 13 (n=571) 1.84 1.54 Grand mean(n=994) 1.70 1.53 5. Coding Below 13 (n=423) 4.61 3.54 27.07** 0.00 993 Above 13 (n=571) 5.90 4.08 Grand Mean (n=994) 5.36 3.91 ** p value<0.01 *p value<0.05 1.3: Sex wise Analysis of Variance: Analysis of variance reveals that both boys and girls (Boys=622; Girls=372) differed significantly in all the five subtests namely, syllogistic reasoning F (1,992) =48.75, p<0.00, similarities F (1,992) =42.81, p<0.00, data sufficiency F (1,992) =38.01, p<0.00, anagram F (1,992) =15.71, p<0.00, and coding F (1,992) =11.79, p<0.00. It is seen that the boys performed better than the girls in subtests similarities (M=5.96; SD=2.78), anagram (M=8.24; SD=3.76), syllogistic reasoning (M=1.63; SD=1.85), data sufficiency (M=1.92; SD=1.65) and coding (M=5.68; SD=4.13) (Table.4.10). Table.4.10: Sex wise Analysis of Variance (n=994): Prepared By: S. Malakar, Social Sciences Division’s Office Plan Budget Proposals 2014-15, SSD Sex Mean SD F value p-value df Boys (n=622) 5.96 2.78 42.81** 0.00 993 Girls (n=372) 4.80 2.54 Grand Mean (n=994) 5.53 2.75 2. Anagram Boys (n=622) 8.24 3.76 15.71** 0.00 993 Girls (n=372) 7.26 3.83 Grand Mean (n=994) 7.88 3.82 Syllogistic Reasoning 3. Boys (n=622) 1.63 1.85 48.75** 0.00 993 Girls (n=372) 0.90 1.04 Grand Mean (n=994) 1.36 1.63 4. Data Sufficiency Boys (n=622) 1.92 1.65 38.01** 0.00 993 Girls (n=372) 1.31 1.20 Grand mean(n=994) 1.70 1.53 5. Coding Boys (n=622) 5.68 4.13 11.79** 0.00 993 Girls (n=372) 4.81 3.44 Grand Mean (n=994) 5.36 3.91 ** p value<0.01 *p value<0.05 1.4: Caste wise Analysis of Variance: Among the participants, 475 are of General category, 439 belong to others (S.C, S.T, O.B.C. and Muslim) and 80 participants did not respond. ANOVA results show that the students significantly differ among themselves in all the five subtests namely, similarities F (1,992) =34.79, p<0.00, anagram F (1,992) =34.76, p<0.00, data sufficiency F (1,992) =11.88, p<0.00, coding F (1,992) =9.48, p<0.00 and syllogistic reasoning F (1,992) =9.30, p<0.00. The general students performed better than the others in the subtests similarities (M=6.18; SD=2.67), anagram (M=8.75, SD=3.48) and Coding (M=5.57; SD=4.06). However, the non-general students outperformed the general students in the subtests syllogistic reasoning (M=1.37; SD=1.65) and data sufficiency (M=1.71; SD=1.55) (Table 4.11). Table.4.11: Caste wise Analysis of Variance (n=994): Name of the subtest Caste Mean SD F value p-value df 1. Similarities General (n=475) 6.18 2.67 34.79** 0.00 993 Non-General (n=439) 5.14 2.76 Unspecified (n=80) 3.85 1.94 Grand Mean (n=994) 5.53 2.75 2. Anagram General (n=475) 8.75 3.48 34.76** 0.00 993 Non-General (n=439) 7.37 3.99 Unspecified (n=80) 5.45 3.21 Grand Mean (n=994) 7.88 3.82 3. Syllogistic Reasoning General (n=475) 1.37 1.65 9.30** 0.00 993 Non-General (n=439) 1.48 1.70 Unspecified (n=80) 0.63 0.64 Grand Mean (n=994) 1.36 1.63 4. Data Sufficiency General (n=475) 1.71 1.55 11.88** 0.00 993 Non-General (n=439) 1.82 1.56 Unspecified (n=80) 0.92 0.85 Grand mean(n=994) 1.70 1.53 5. Coding General (n=475) 5.57 4.06 9.48** 0.00 993 Non-General (n=439) 5.44 3.92 Unspecified (n=80) 3.56 2.04 Grand Mean (n=994) 5.36 3.91 ** p value<0.01 *p value<0.05 1.5: Religion wise Analysis of Variance: Among the participants, 777 are Hindu and 217 are Non-Hindu (Islam, Christianity and Buddhism). ANOVA results show that the two religious groups differed significantly in their performance on anagram F (1,992) =105.80, p<0.00, similarities F (1,992) =83.34, p<0.00, and syllogistic reasoning F (1,992) =5.28, p<0.02 subtests. The Hindu students outperformed the Non-Hindu students in subtests similarities (M=5.93; SD=2.69), anagram (M=8.50; SD=3.58), syllogistic reasoning (M=1.42; SD=1.69), data sufficiency (M=1.72; SD=1.56) and coding (M=5.47; SD=3.97) (Table 4.12). 1. Name of the subtest Similarities 139 Prepared By: S. Malakar, Social Sciences Division’s Office 140 Social Sciences Division, ISI Table.4.12: Religion wise Analysis of Variance (n=994): Name of the subtest Religion Mean SD F value p-value df 1. Similarities Hindu (n=777) 5.93 2.69 83.34** 0.00 993 Non-Hindu (n=217) 4.08 2.45 Grand Mean (n=994) 5.53 2.75 2. Anagram Hindu (n=777) 8.50 3.58 105.80** 0.00 993 Non-Hindu (n=217) 5.63 3.79 Grand Mean (n=994) 7.88 3.82 3. Syllogistic Reasoning Hindu (n=777) 1.42 1.69 5.28* 0.02 993 Non-Hindu (n=217) 1.13 1.38 Grand Mean (n=994) 1.36 1.63 4. Data Sufficiency Hindu (n=777) 1.72 1.56 1.48 0.22 993 Non-Hindu (n=217) 1.58 1.38 Grand mean(n=994) 1.70 1.53 5. Coding Hindu (n=777) 5.47 3.97 3.06 0.08 993 Non-Hindu (n=217) 4.94 3.65 Grand Mean (n=994) 5.36 3.91 ** p value<0.01 *p value<0.05 1.6: Medium wise Analysis of Variance: Participants are from three different medium of instructions, English (n=363), Bengali (n=523) and Urdu (n=108). Analysis of Variance show that the three groups differed significantly among themselves in all the five subtests namely, anagram F (1,992) =160.21, p<0.00, similarities F (1,992) =69.54, p<0.00, syllogistic reasoning F (1,992) =59.08, p<0.00, coding F (1,992) =25.73, p<0.00 and data sufficiency F (1,992) =20.36, p<0.00. The participants studying in English medium outperformed others in the subtests similarities (M=6.79; SD=2.48), Anagram (M=10.36; SD=2.35) and Coding (M=6.46; SD=4.12) while participants studying in Bengali medium performed the best in syllogistic reasoning (M=1.86; SD=1.97) and data sufficiency (M=1.98; SD=1.72) (Table 4.13). Table.4.13: Medium wise Analysis of Variance (n=994): Name of the subtest Medium of Instruction Mean SD F value p-value df 1. Similarities English (n=363) 6.79 2.48 69.54** 0.00 993 Bengali (n=523) 4.89 2.63 Urdu (n=108) 4.38 2.65 Grand Mean (n=994) 5.53 2.75 2. Anagram English (n=516) 10.36 2.35 160.21* 0.00 993 * Bengali (n=370) 6.52 2.87 Urdu (n=108) 6.07 3.25 Grand Mean (n=994) 7.88 3.82 3. Syllogistic Reasoning English (n=516) 0.83 0.88 59.08** 0.00 993 Bengali (n=370) 1.86 1.97 Urdu (n=108) 0.70 0.76 Grand Mean (n=994) 1.36 1.63 4. Data Sufficiency English (n=516) 1.41 1.21 20.36** 0.00 993 Bengali (n=370) 1.98 1.72 Urdu (n=108) 1.26 1.17 Grand mean(n=994) 1.70 1.53 5. Coding English (n=516) 6.46 4.12 25.73** 0.00 993 Bengali (n=370) 4.59 3.62 Urdu (n=108) 5.37 3.58 Grand Mean (n=994) 5.36 3.91 ** p value<0.01 *p value<0.05 2. Relative contribution of the different demographic variables in the five subtests: 2.1. Similarities Subtest: Students differed in reasoning of similarities more by religion F (1,992) =83.34, p<0.00, medium of instruction F (1,992) =69.54, p<0.00, sex F (1,992) =42.81, p<0.00 and caste F (1,992) =34.79, p<0.00 than age F (1,992) =14.71, p<0.00 and grade F (1,992) =7.63, p<0.00 (Table 4.14). Prepared By: S. Malakar, Social Sciences Division’s Office Plan Budget Proposals 2014-15, SSD 141 Table 4.14: Relative contribution of demographic variables in subtest similarities (n=994). Variable F Ratio p value df Grade 7.63** 0.00 1, 992 Age 14.71** 0.00 1, 992 Sex 42.81** 0.00 1, 992 Caste 34.79** 0.00 1, 992 Religion 83.34** 0.00 1, 992 Medium of Instruction 69.54** 0.00 1, 992 ** p value<0.01 *p value<0.05 2.2. Anagram Subtest: Students differed in reasoning of anagrams more by medium of instruction F (1,992) =160.21, p<0.00, religion F (1,992) =105.80, p<0.00, caste F (1,992) =34.76, p<0.00 and sex F (1,992) =15.71, p<0.00 than age F (1,992) =12.98, p<0.00. The students did not differ by grade F (1,992) =1.70, p<0.18 (Table 4.15). Table 4.15: Relative contribution of demographic variables in subtest anagram (n=994). Variable F Ratio p value df Grade 1.70 0.18 1, 992 Age 12.98** 0.00 1, 992 Sex 15.71** 0.00 1, 992 Caste 34.76** 0.00 1, 992 Religion 105.80** 0.00 1, 992 Medium of Instruction 160.21** 0.00 1, 992 ** p value<0.01 *p value<0.05 2.3. Syllogistic Reasoning Subtest: Students differed in subtest syllogistic reasoning more by medium of instruction F (1,992) =59.08, p<0.00, sex F (1,992) =48.75, p<0.00, age F (1,992) =11.95, p<0.00 and caste F (1,992) =9.30, p<0.00 than grade F (1,992) =5.85, p<0.00 and religion F (1,992) =5.28, p<0.00 (Table 4.16). Table 4.16: Relative contribution of demographic variables in subtest syllogistic reasoning (n=994). Variable F Ratio p value df Grade 5.85** 0.00 1, 992 Age 11.95** 0.00 1, 992 Sex 48.75** 0.00 1, 992 Caste 9.30** 0.00 1, 992 Religion 5.28* 0.02 1, 992 Medium of Instruction 59.08** 0.00 1, 992 ** p value<0.01 *p value<0.05 2.4. Data Sufficiency Subtest: Students differed in subtest data sufficiency more by sex F (1,992) =38.01, p<0.00, medium of instruction F (1,992) =20.36, p<0.00, age F (1,992) =13.44, p<0.00 and caste F (1,992) =11.88, p<0.00. However, they did not differ by Grade F (1,992) =2.20, p<0.11 and religion F (1,992) =1.48, p<0.22 (Table 4.17). Table 4.17: Relative contribution of demographic variables in subtest data sufficiency (n=994). Variable F Ratio p value df Grade 2.20 0.11 1, 992 Age 13.44** 0.00 1, 992 Sex 38.01** 0.00 1, 992 Caste 11.88** 0.00 1, 992 Religion 1.48 0.22 1, 992 Medium of Instruction 20.36** 0.00 1, 992 ** p value<0.01 *p value<0.05 2.4. Coding Subtest: Students differed in subtest coding more by age F (1,992) =27.07, p<0.00 and medium of instruction F (1,992) =25.73, p<0.00 than sex F (1,992) =11.79, p<0.00, caste F (1,992) =9.48, p<0.00 and grade F (1,992) =6.55, p<0.00. However, they did not differ by religion F (1,992) =3.06, p<0.08 (Table 4.18). Table 4.18: Relative contribution of demographic variables in subtest coding (n=994). Prepared By: S. Malakar, Social Sciences Division’s Office Social Sciences Division, ISI 142 Variable Grade Age Sex Caste Religion Medium of Instruction ** p value<0.01 *p value<0.05 F Ratio 6.55** 27.07** 11.79** 9.48** 3.06 25.73** p value 0.00 0.00 0.00 0.00 0.08 0.00 df 1, 992 1, 992 1, 992 1, 992 1, 992 1, 992 SUMMARY 1. Computer programming related reasoning ability test battery is reliable and valid instrument to assess both lower and higher order reasoning abilities. 2. Test battery includes five sub-tests – similarities, anagram, syllogistic reasoning, data sufficiency and coding. Out of the five, difficulty index is low in syllogistic and data sufficiency. 3. All the sub-tests are positively related to each other. Similarities, anagram and coding formed one group. Syllogistic and reasoning of data sufficiency formed another group. 4. Kuder-Richardson reliability is also high suggesting good internal consistency among the items of each sub-test. Median co-efficient is 0.70. 5. All five sub-tests are correlated with academic achievement in a positive manner. 6. Five reasoning abilities varied with grade, age, sex, caste, religion and medium of instruction. 7. Future research will examine (a) test-retest reliability; (b) differential validity of each subtest. Prepared By: S. Malakar, Social Sciences Division’s Office Plan Budget Proposals 2014-15, SSD 143 Data Gap in Gender Statistics: Women in Mining Industry Molly Chattopadhyay and Sonali Chakraborty Interim Report for the year 2012-2013 Plan project (2012-2015) I Introduction The purpose of this project is to identify data gap in gender statistics in Indian mining sector. There are different agencies that are collecting and disseminating data on mining sector, particularly in respect of male-female distribution of labour. As per Director General of Mines Safety (2010), male workers comprise 95% of total workers as against 5% of female workers. On the contrary, Census of India (2011) reveals that there are 81% male workers and 19% female workers in mining and quarrying sector. The scope of the project is to evaluate official statistics on mining covering all over India from 1991 to 2011. This interim report presents the work done between March 2012 to April 2013. The report looks into different sources of official data, their limitations and mineral picture of West Bengal. II Sources of data on mining industry To know the data gap in mining industry, the sources of data in mining industry and different rules and regulations framed by governments need to be investigated. Following organizations regularly collect and disseminate data on mining activities of India: 1. Director General of Mines Safety (DGMS) 2. The Ministry of Mines 3. Geological Survey of India (GSI) 4. Indian Bureau of Mines (IBM) III Data gap in number of operating mines and miners It is observed from Table 1 that there is discrepancy in the number of mines between three agencies i.e. DGMS, IBM, and Ministry of Mines. There is considerable similarity in the data between IBM and Ministry of Mines. In case of coal mines, number of operating mines as reported by DGMS is higher than IBM and Ministry of Mines. But the number of total operating mines is considerably less as reported by DGMS than IBM and Ministry of Mines. Table 1. Number of operating mines in India 2007-08 2008-09 2009-10 DGMS Coal 569 583 590 Non-coal 1971 1972 2002 Total 2540 2555 2592 IBM Coal 570 574 573 Metallic 691 719 701 Non-metallic 1762 1857 1782 Total 3023 3150 3056 Ministry of Mines Coal (including lignite) 570 574 560 Metallic 691 719 701 Non-metallic 1681 1857 1779 Total 2942 3150 3040 Source: Annual Reports, DGMS, IBM and Ministry of Mines 2010-2011 2011-12 590 1967 2557 NA NA NA 573 687 1668 2928 NA NA NA NA 573 687 1668 2928 573 553 1523 2649 With the increase in production, employment in mines has also increased in the beginning but started declining from 1991 (Table 2). The decline in the number of miners between 1991 and 2010 is by 29%. There is discrepancy in the number of miners also between DGMS and IBM (Table 3). Also, there is difference in the data collected by NSSO and Census. As per employment-unemployment surveys of Prepared By: S. Malakar, Social Sciences Division’s Office 144 Social Sciences Division, ISI NSSO, the number of miners has increased by 26% between 1999-00 and 2009-10 while Census shows is almost double that is increase by 50% between 1991 and 2011 (Table 4). Table 2. Average employment in mines from 1951 to 2010 (in million) Year Average employment Total Coal Non-coal 1951 351.9 197.1 549.0 1961 411.2 259.7 670.9 1971 382.3 234.9 617.2 1981 513.4 221.9 735.3 1991 554.1 200.2 754.3 2011 368.9 165.6 534.5 Source: DGMS. Table 3. Employment in Mines 2007-08 2008-09 DGMS Coal 369414 374000 Non-coal 179661 188664 Total 549075 562644 IBM Total 537327 519835 Source: Annual Reports, DGMS and IBM 2009-10 2010-2011 390000 185022 575022 NA NA NA 521425 518419 Table 4. Male-female distribution of employment in mines as per NSSO and Census of India NSSO increase by 26% from 1999-00 to 2009-10 1999-2000 2004-05 2009-10 No. of miners 2.3 million 2.6 million 2.9 million Share in employment 0.6% 0.6% 0.6% Census increase by 50 % from 1991 to 2011 Year Male Female Total 1991 996856 140383 1137239 2001 1714294 320378 2034672 2011 1386882 324452 1711334 Source: Employment-unemployment Report, NSSO, 1999-2000 and 2009-10, Census of India 1991, 2001, 2011. Let us explore the reasons behind anomalous data on number of mines and miners. In India, we have two major Central Govt. organisations controlling the mining sector namely the Directorate General of Mines Safety (DGMS) and the Indian Bureau of Mines (IBM). DGMS implements the provisions of the Mines Act (1952) exclusively in the field of safety and labour welfare, restricting the sphere of activities of the DGMS (Mines Inspectors) in this specific category of tiny mines because chances of fatal and serious accidents in such tiny mines are minimal. In the case of IBM also such tiny Small Mines are exempt from their control because these mines are really “Minor Minerals” mines, which are specifically exempt from the jurisdiction of IBM according to The Mines and Minerals Regulation and Development Act, 1957 (MMRD). Therefore, both the Mines Act’52 and the MMRD Act’57 have no scope of defining SmallScale Mining. Moreover, DGMS statistics are on calendar year basis and IBM records are on the basis of financial year – April to March. Thus, the statistical records of these two organizations are somewhat different. V Mineral Resources of West Bengal West Bengal stands third in the country in terms of mineral production. The state contributes about onefifth to the total production of minerals in the country. Coal constitutes 99% of the minerals extracted in West Bengal. The state has rich deposits of coal, rock phosphate, granite, manganese, silica, fire clay, road metal, quartz, apatite, dolomite, feldspar, limestone and others. Table 6 presents mineral picture of Prepared By: S. Malakar, Social Sciences Division’s Office Plan Budget Proposals 2014-15, SSD 145 West Bengal as reported by DGMS. Excepting coal mines, presence of female miners is negligible in other mines as shown in Table 5. Table 5. Number of Mines and Miners in West Bengal in 2010 Mineral No. of Mines No. of Workers Total Men Women Coal 105 55859 2979 58838 Apatite 1 166 3 169 China Clay 6 511 511 Dolomite 1 31 31 Felspar 1 Fireclay 1 18 18 Stone 15 789 28 817 Source: DGMS Number of coal mines in West Bengal has slightly decreased in a span of almost 20 year and number of workers has declined on a regular basis. Stone mines, sand mines and brickfields are considered as minor minerals that lie within the jurisdiction of respective state governments. The exact figures for brickfields are nearly impossible to get because in Hooghly district alone, there are 311 unauthorised brickfields, only 40 brickfields are authorised (DLRO, Hooghly). There are approximately 100 sand mines in West Bengal (data supplied by District Land and Land Reform Officer, Hooghly, and Midnapore). Employees are recruited on contract basis, therefore correct figure of employees are not available. In Hooghly district, there are 37 sand mines located in Arambagh, Goghat I, and Purshura. On an average 700 workers per day is employed in Sand mines; none of these sand mines employ female workers. Regarding Stone-mines, there are 268 stone mines in Birbhum district alone. Each mine recruits 18 workers (16 male + 2 females). Approximately, there are 4824 workers (4288 males and 536 female) (Assistant Labour Commissioner, Birbhum). Wages Average weekly earnings have increased as recommended by Minimum Wage Board. Since most of the coal mines belong to the public sector, there is apparently no sex discrimination in wage payment (Table 7). Wage rate of private sector coal mines are not available from official statistics. In the next year, selected private coal mines will be taken up to examine gender discrimination, if any, in payment of daily wages. Table7. Number of mines, workers and average weekly earnings (In Rs.) in coal mines, West Bengal Year No. of units No. of workers Average weekly earnings 1990 119 108272 553 2000 105 82158 1690 2003 100 72887 2352 2004 100 70617 2672 2005 101 69476 2853 2006 100 64525 3109 2007 99 63000 4186 2008 100 64000 4345 2009 105 62000 4949 Source: Statistical Abstract, 2009, Govt. of West Bengal Stone mines are liable to recruit Mines mate who hold at least diploma certificate in Mining engineering as per Mines Act and they have to be paid a salary of Rs. 30000 (approx.). All the mines owners are not following the rule per se; they recruit experienced persons who can do the job of Mines mate and they are paid Rs. 8000-10000/- per month. The job of Mines mate in stone mining is to locate stone mines and carrying explosions. After explosion, boulders are loaded into a truck and these are unloaded at the crushing sites. Normal or smaller size stones are carried to the crushing site by tractor or small trucks. Loading into the truck is done by both male and female workers. The bigger size stones are sized up by female workers. Irresolution prevails in the industry regarding daily wage. In Birbhum, labourers comprise of both Muslim and Santal labourers. Regarding male-female differentiation in wage, though it is told that there is no gender discrimination in wage, it is observed that Muslim labourers are willing to work for lower wages but not Santals. Muslim labourers receive daily wage rate is Rs. 170-180/- per day. Very few Prepared By: S. Malakar, Social Sciences Division’s Office 146 Social Sciences Division, ISI Muslim women participate as daily labour. In case of Santals, both men and women take part and demand higher wages that is minimum wage. This is one of the root causes of recent tensions in the stone crushing units. In stone crushing units, after crushing of stones, the end product (stone chips) is loaded into the truck by both male and female labourers; more by Santal female labourers. The rate is on contract basis. One truck contains near about 20-22 tons of stone chips; ten wheeler trucks can accommodate more than 25 tons. The rate is Rs. 25 per ton. It is found that on an average, one can earn Rs. 300 per day. But the problem is loading is not done every day and the contractor takes commission from the labourers that is around 10% of daily wage from each worker. In Burdwan district, male workers are getting Rs. 120 per day while female workers are receiving Rs. 110 per day. In stone mines and stone crushing units wage payment on contract basis is prevalent. For carrying from the site of stone crushing units to the truck the rate is Rs. 130/- per day per trip. The distance is normally within 2 KM. In a day 3-4 trips are possible. On an average a male loader earns Rs. 300 per day on contract basis. Though female workers are receiving less than the male workers, both of them are receiving much less than the prescribed minimum wage by the Govt. Table 8 shows that the gap is more than Rs. 100 between minimum wage as prescribed by the Govt. and actual wage that is received by the workers in stone breaking and stone crushing units. Table 8. Minimum Wage (Stone breaking & Stone crushing) Categories Monthly Minimum Rates of Wages Zone A Zone Zone A Zone B B Daily Wage Weekly Wage Daily Wage Weekly Wage Unskilled 5793 5395 222.8077 1336.846 207.5 1245 Semi-skilled 6313 5933 242.8077 1456.846 228.1923 1369.154 Skilled 6944 6527 267.0769 1602.462 251.0385 1506.231 Source: Office of the Labour Commissioners, Govt. of West Bengal, Circular No. 02/Stat/2RW/60/94/LCS/JLC, dt. 1.1.13 Females are mostly used as drier in china clay factories; these are situated in the district of Birbhum. There are 250 permanent male workers and 50 female daily wage workers in china clay factories. All the china clay factories use automated machines, these are operated by males. Unskilled job, that is drying is done by female workers. In sand mines also payment on contract basis is prevalent. The payment is based on the trip of boats containing sand from river to the bank. Rs. 700/- is paid per trip and each trip needs 6-7 workers for loading of sand from the middle course of river and unloading it in the bank. In a day 3-4 trips are possible. On an average each worker gets Rs.350 to Rs. 400 per day. Conclusion This report presents data on mining based on official statistics and preliminary visits made to stone mines and sand mines of West Bengal taken up in the year 2012-13. The project is supposed to be completed in 2015. Anomalies in the official statistics and the magnitude of invisibility of women miners can be revealed only after completion of the project. References: Director General of Mines Safety: Statistics of Mines in India, Vol I & Vol II (Coal and NonCoal), 2008, 2009, 2010. Government of India. Ministry of Mines, Annual Report, 2011-12 Government of India. THE MINES ACT, 1952 Government of India. THE MINES AND MINERALS (REGULATION AND DEVELOPMENT) ACT, 1957 Government of West Bengal. Office of the Labour Commissioners, Circular No. 02/Stat/2RW/60/94/LCS/JLC, dt. 1.1.13 Government of West Bengal. Statistical Abstract West Bengal 2008 Government of West Bengal. Mineral Resources of West Bengal. Retrieved on 26.4.13. Website. http://www.gits4u.com/wb/wb14.htm Indian Bureau of Mines: Indian Minerals Yearbook, 2007 & 2010. IBM Press, Nagpur. Prepared By: S. Malakar, Social Sciences Division’s Office Plan Budget Proposals 2014-15, SSD 147 EPU, Delhi Centre Interim Report Report on the 8th Annual Conference on Economic Growth and Development December 17-19, 2012 Indian Statistical Institute, New Delhi Academic Sessions: Kaushik Basu (Cornell University and Sr. Vice President & Chief Economist, The World Bank) addressed the inaugural session. Plenary Sessions: There were 3 plenary sessions addressed by Avinash Dixit (Princeton University), M. Scott Taylor (University of Calgary), Vijay Krishna (Pennsylvania State University), Raghuram Rajan (University of Chicago and Chief Economic Adviser, Ministry of Finance, Government of India) and JeanCharles Rochet (University of Zurich and President, The Econometric Society). Panel Discussion: 5 eminent academic economists, policy advisers and bankers – Abheek Barua (HDFC Bank), M. Govinda Rao (NIPFP and Economic Advisory Council to the Prime Minister), Partha Sen (South Asian University), Alok Sheel (Economic Advisory Council to the Prime Minister) and Chetan Ghate (ISI, Delhi) – debated their views and visions in the panel discussion on Obstacles to High Growth in India. Parallel Sessions: The main body of the conference consisted of 7 parallel sessions with 6 sessions running parallel to each other at the same time. Each session included presentation of 3 research papers. Thus a total of 126 research papers were presented in 42 sessions. The research topics covered were: food and agriculture, infrastructure, environment, India’s growth experience, human capital: education and skill, institutions, NREGA, prices inequality and deprivation, empirical issues in macroeconomics, topics in microeconomics, gender, corruption, political economy, open economy macroeconomics, fiscal policy, international trade, education, behavioural issues, process of development, inequality and mobility, contracts and information, Indian manufacturing, discrimination, monetary economics, empirical and data issues, health, networks, labour market, topics in macroeconomics, growth theory, industrial organization, poverty, political economy and corruption, microfinance and debt, emerging economies, topics in applied microeconomics, and game theory. Participants: An average of about 220 researchers and students participated on each day of the conference. As per their university affiliations, the participants came from 20 different countries: Australia, Canada, Chile, Denmark, France, Germany, Hong Kong, India, Israel, Italy, Japan, New Zealand, Norway, Singapore, Spain, South Africa, Sweden, Switzerland, UK, and USA. 33 of the conference participants were foreign nationals. Of the 126 participants who had presented their research papers in different parallel sessions, 85 had foreign university affiliations while 41 were from Indian universities or research institutes. Within India the conference participants represented most of the well-known research institutes and universities all over India: Asian Development Bank (New Delhi), Azim Premji University (Bangalore), Centre de Sciences Humaines (New Delhi), Prepared By: S. Malakar, Social Sciences Division’s Office Social Sciences Division, ISI 148 Centre for Studies in Social Sciences (Kolkata), Delhi School of Economics, Institute of Economic Growth (Delhi), IFMR (Chennai), Indira Gandhi Institute of Development Research (Mumbai), IIM (Bangalore), IIM (Kolkata), IIM (Kozhikode), IIM (Udaipur), IIT (Kanpur), Indian School of Business (Hyderabad), ISI (Delhi), ISI (Kolkata), International Water Management Institute (New Delhi), JNU, National Council of Applied Economic Research (New Delhi), National Institute of Public Finance and Policy (New Delhi), Presidency University (Kolkata), and St. Xavier's College (Kolkata). Conference Website: Theconference website, http://www.isid.ac.in/~pu/dec_12_conf.html, provides the conference details. Tridip Ray Chairperson, Organizing Committee 8th Annual Conference on Economic Growth and Development http://www.isid.ac.in/~pu/dec_12_conf.html Prepared By: S. Malakar, Social Sciences Division’s Office Plan Budget Proposals 2014-15, SSD 149 EAU, Bangalore Centre Interim Report REPORT ON WORK COMPLETED IN 2012-13 FOR ONGOING PROJECT (NON-NORTHEAST) PROJECT TITLE: Evaluating Official Statistics on Land and Livestock holdings 1. A new schedule for collection of data on land and livestock holdings was prepared. 2. The revised schedule was tested in two villages. Census surveys were conducted in May-June 2012 in two villages of Bihar. 3. A format for collection of data in Access software was prepared. 4. Data entry from the Bihar surveys was completed. 5. A small meeting of collaborating scientists was held on January 3-4 in ISI Bangalore to discuss the plan of work. At this meeting, the major official data sources on land holdings and livestock holdings and incomes were critically discussed. The way forward in terms of analyzing the village survey data and then proposing changes in the NSS schedules was also discussed. EXPENDITURE STATEMENT 2012-13 (A/C 5487) ITEM (REVENUE) Budgeted Actual expenditure Travel and Fieldwork (investigators) 300,000 2,60,322 Workshop 75,000 74,490 Data processing 25000 0 Purchase of data and computer consumables 20,000 9,580 Printing, stationery, communication 20,000 739 Miscellaneous 9000 0 GRAND TOTAL 449,000 3,45,131 Prepared By: S. Malakar, Social Sciences Division’s Office Social Sciences Division, ISI 150 Divisional Plan Budget Proposal for Projects (2014-15) Social Sciences Division Units Rupees in lakhs Revenue Capital Name of the Project Total New Project 2 LRU 6 SOSU North East 2.1 The Biaxial Syntax of Inflected Clauses in Assamese and Bangla 6.1 Life style correlates & economic burden of Cancer: A study in Meghalaya in North East 6.2 North East Official Statistics Workshop Sub-total: 3 PSU 4 PRU 6 SOSU General 3.1 Developmental Challenges in Children and Associated Socioeconomic Factors: A Study in the Purulia District of West Bengal. 4.1 National Conference on “Adolescence Development: Issues and Challenges. 4.2 Summer / Winter School on Data Mining in Psychological Research 6.3 Finding out the Direct and the Indirect Roles of Various Socio-economic and Demographic Factors, Health and Family Welfare and Other Developmental Programmes in the Growth of Population : A Case Study on Giridih Sub-total: 2.750 3.000 5.000 10.750 2.750 0.900 3.900 0.900 5.000 11.650 3.900 3.900 6.150 3.040 6.150 3.040 14.685 14.685 27.775 0.000 27.775 On-Going Project 4 PRU North East 4.3 Cognitive Processing through PASS model and its role in determining Academic Performance of School students of North- Eastern India. Sub-total: 2 LRU 4 5 8 PRU SRU EAU General 2.2 Biaxial Study of Bangla Lexicosyntax 2.3 Bengali Pronunciation Dictionary in Electronic and Printed Form 4.4 Differential validity of Computer programming abilities. 4.5 Parenting styles and academic achievement of the school students. 5.1 Data Gap in Gender Statistics: Women in Mining Industry. 5.2 Migration, social network and their impact on the rural households of Jharkhand. 5.3 A micro level study of television (TV) watching and childhood obesity in Kolkata city of West Bengal, India 5.4 Gender Issues and Empowerment of Women in rural West Bengal. 8.1 Evaluating Official Statistics on Land and Livestock holdings. Sub-total: Grand Total : Prepared By: S. Malakar, Social Sciences Division’s Office 3.700 3.700 3.700 0.000 3.700 2.800 4.100 2.790 3.200 2.500 2.800 4.100 2.790 3.200 2.500 2.350 2.350 3.940 3.940 3.300 5.700 30.680 72.905 3.300 5.700 30.680 73.805 0.000 0.900 Plan Budget Proposals 2014-15, SSD 151 Divisional Plan Budget Proposal for Non-Projects (2014-15) Social Sciences Division Sl. No. Revenue Rupees in lakhs Capital Total Name of the Project Economic Research Unit 1 2 3 4 5 6 7 8 Visiting Scientists Seminar Internal travel Submission fee for publication in Journals Computer Consumables Repair and Maintenance Office Expenditures Capital Expenditure 10.000 2.000 1.000 0.500 2.700 2.000 0.800 Sub-total: 19.000 5.000 5.000 10.000 2.000 1.000 0.500 2.700 2.000 0.800 5.000 24.000 Linguistic Research Unit 1 2 3 4 5 6 7 8 Visiting Scientists Seminars (deparmental, on regular basis) Internal travel Computer Consumables Maintenance for Computer & Equipment Office Expenditures Capital (Computer, Software, Scanner, Printer etc.) Fellowship for (one) New JRF/SRF (2014-15) Sub-total: 1.000 0.500 0.700 0.800 0.800 0.800 3.000 3.000 7.600 3.000 1.000 0.500 0.700 0.800 0.800 0.800 3.000 3.000 10.600 Population Studies Unit 1 Visiting Scientists 2.000 2.000 2 Computer Consumables 0.850 0.850 3 Seminars by invited external experts 0.500 0.500 4 Office expenses 0.800 0.800 5 Repair, Maintenance, etc. 0.800 0.800 6 Capital Expenditure Sub-total: 4.950 1.500 1.500 1.500 6.450 2.000 2.000 1.200 1.500 2.000 1.300 0.500 1.500 0.900 1.000 0.500 2.000 12.400 Psychology Research Unit 1 2 3 4 5 6 7 8 9 10 Visiting Scientists/Research Collaborator Computer Consumables Research Fellow Maintenance for computer & equipment Seminar/Workshop/Training programme Software Office Expenditure Internal travel Submission fee for publication in Journals Capital Expenditure 1.200 1.500 2.000 1.300 0.500 1.500 0.900 1.000 0.500 Sub-total: 10.400 Sociological Research Unit 1 2 3 Visiting Scientists Seminar Internal travel Prepared By: S. Malakar, Social Sciences Division’s Office 2.000 1.000 1.000 2.000 1.000 1.000 Social Sciences Division, ISI 152 4 5 6 7 8 Research Fellow Computer Consumables Maintenance / Office expenditure Software Processing fees for publication Capital Equipment: Upgrading furniture/computers A/C and other equipment Sub-total: 9 Sampling & Official Statistics Unit Computer Consumables External Hard Disk for Storage of Office Material and project data Software Procurement (SPSS, MS-Office) Printer UPS for SOSU (5 KVA) Statistical Trainee Visiting Scientist (4) Office expenses Repair and Maintenance Sub-total: 1 2 3 4 5 6 7 8 9 2.000 1.000 1.000 2.000 0.600 10.600 2.000 1.000 1.000 2.000 0.600 3.000 3.000 2.000 2.000 0.500 0.500 3.000 3.000 6.000 10.000 1.000 1.000 20.500 3.000 13.600 6.500 0.500 0.500 3.000 3.000 6.000 10.000 1.000 1.000 27.000 Economics & Planning Unit (Delhi) 1 2 3 4 5 6 7 8 9 10 1 2 3 4 5 6 1 2 3 4 5 6 Visiting Scientists Post-doctoral fellows-cum-Lecturers Travel of Scientists Seminar Series PC, Xerox, Stationery, Consumables Misc. Including Communications & fax Annual Conference Journal Submission & professional memberships Maintenance Upgrading of Computers manuals software, fittings, equipment etc. Sub-total: Economic Analysis Unit (Bangalore) Visiting Scientists Printers Computer Consumables Software Repair & Maintenance Travel Grants Sub-total: 25.000 0.000 0.550 1.000 1.500 1.000 4.000 0.550 0.550 34.150 25.000 0.000 0.550 1.000 1.500 1.000 4.000 0.550 0.550 7.000 7.000 2.600 5.000 2.000 0.500 0.600 0.600 1.000 9.700 2.000 16.000 2.000 130.300 32.600 Plan Projects= Total Budget of Social Sciences Division (Plan Projects + Plan Non-Projects) = 10.000 1.000 2.000 2.000 1.000 2.000 18.000 162.900 73.805 236.705 Social Sciences Division Office Visiting Scientists Computer Consumables Office Expenditure Travel for Academic Purpose Maintenance Capital Expenditure Sub-total: Grand Total (Plan Non-Projects): Prepared By: S. Malakar, Social Sciences Division’s Office 5.000 7.000 41.150 2.000 0.500 0.600 0.600 1.000 7.100 10.000 1.000 2.000 2.000 1.000


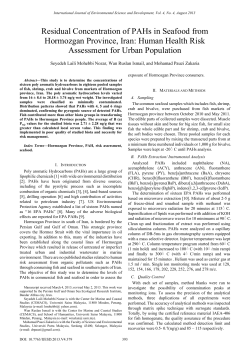


© Copyright 2026