
How To Analyze Investments Like The Pros Learn The
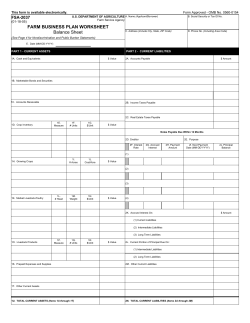
How To Analyze
Investments
Like The Pros
N
Learn The
Fundamentals Of
Major League
Investing
N
Roger Conrad’s
UTILITY FORECASTER
How To Analyze
Investments Like The Pros
Learn The Fundamentals Of Major
League Investing
Inside:
Introduction
1
Collecting Data
1
The Ratios
6
Chapter One
Chapter Two
Chapter Three
Technical Indicators
Appendix
16
19
KCI Communications, Inc., 7600A Leesburg Pike, West Building, Suite 300, Falls Church, VA 22043. Subscription and customer
services: P.O. Box 3808, McLean, VA 22103-9823, 800-832-2330. It is a violation of the United States copyright laws for any
person or entity to reproduce, copy or use this document, in part or in whole, without the express permission of the publisher. All
rights are expressly reserved. ©2007 KCI Communications, Inc. Printed in the United States of America. UAI0607-TG. The information contained in this report has been carefully compiled from sources believed to be reliable, but its accuracy is not guaranteed.
Introduction
Without financial facts and figures, professional analysts
couldn’t make informed decisions. Financial analysis demonstrates how past conditions and events came to pass; more
important, numbers exhibit what could happen in the future.
The real purpose of this analysis is to identify probable outcomes if certain actions are undertaken. For example, if past
sales growth averaged 10 percent annually during a 10-year
period, and if the management team remains intact, we might
logically expect the trend to continue.
What numbers do the pros use? Most analysts use the raw information presented by accountants concerning sales, margins,
expenses, profits and taxes. Unfortunately, the numbers themselves
tell only part of the story. The trick is to know what the numbers
mean and to relate them to each other and to industry norms.
Financial analysis is designed to determine a company’s relative strengths and weaknesses—whether the firm is financially
sound and profitable relative to other firms in its industry and
whether its position is improving or deteriorating over time.
Analysts need this information to estimate the riskiness of the
endeavor under consideration and to determine if the firm is worthy of an investment.
Of course, the numbers aren’t the whole story. There are psychological factors that affect the stock market. Some analysts say
the stock market is 15 percent numbers and 85 percent psychology, following the postulate that all investment issues are human
related. That’s why savvy analysts use intuition and psychology to
supplement the numbers.
But without a solid grasp of how the pros use numbers, you’ll
never be in the major leagues of investing. The techniques contained herein will help you become a confident investor.
Chapter One
Collecting Data
The first concern of the analyst is finding reliable information.
Where do you look? The most commonly employed information,
and the most dependable, is historical. Of the various reports corporations issue, the annual report is by far the most important.
How To Analyze Investments Like The Pros 1
The Annual Report Financial Statements
Principally, the annual report provides two types of information: a description of the firm’s operating results during the past
year and a discussion of new developments that will affect future
operations. The report includes four basic financial statements:
the income statement, the balance sheet, the funds flow
statement and the statement of changes in owners’ equity.
Taken together, these statements depict the firm’s operations and
financial position.
In order to evaluate the merits of an investment, investors look
for information that tracks the business and try to understand the
flow of funds into and out of the firm. This process involves
reviewing a great deal of formal or informal data relevant to the
specific purpose of the analysis. Almost all of the data needed is
found in the following financial statements.
1. Balance Sheet
The balance sheet describes the categories and amounts of
assets utilized by the business and the offsetting liabilities
incurred by lenders and owners.
Sometimes called the statement of
Balance Sheet
financial condition, or statement of
Assets = Liabilities + Owner Equity
financial position, it must always “balance.” Why? Because the total assets
Assets
Liabilities
invested in the business at any point in
Current assets
$50
Current liabilities $26
time, by definition, are matched preFixed assets
125
Long-term liabilities 97
cisely by the liabilities and owners’
Other assets
2
Owners’ equity
54
equity position.
Total assets $177
Total liabilities $177
The balance sheet is sometimes
and net worth
reduced to a simple accounting equation: assets = liabilities + owner equity.
(See the “Balance Sheet” box.) Ultimately, all transactions appear
within this basic equation.
The balance sheet assigns values to equipment and other
assets describes amounts owed on both short- and long-term horizons, lists funds available for continued operation of the business
and determines the value of the stockholders’ equity.
Keep in mind that balance sheets can become obsolete very
quickly. Like your monthly bank statement, they reflect conditions
on the compilation date.
The major categories of assets are: current assets (items that
turn over in a short period of time, such as cash, marketable securities, accounts receivable and inventories); fixed assets (buildings, land, mineral resources, heavy machinery, vehicles, etc., all
of which are used over the long haul); and other assets (deposits
and intangibles such as copyrights and patents).
Major liabilities include: current liabilities (obligations to distributors, tax authorities, employees and lenders due within one
2
www.utilityforecaster.com
year); long-term disabilities (an assortment of debt instruments
like mortgages and bonds); and owners’ equity (funds contributed by various classes of owners of the business as well as
accumulated earnings retained in the business).
2. Income Statement
The income statement describes the dollar
value of goods and services sold; gross profit;
funds expended to make profits happen, including writeoffs and taxes; and how much net profit
or loss resulted. The income statement is sometimes referred to as the operating statement,
earnings statement or profit-and-loss statement.
Where the balance sheet reflects the financial
condition on a specific date, income statements
tell what happened over a period of time, usually
one year. The net profit earned by a business
enterprise is found by deducting expenses from
revenues, or in equation form: revenues - expenses = profits. (See the “Income Statement” box.)
Income Statement
Revenues - Expense = Profits
Sales
Costs and expenses
Writeoffs
Depreciation
$4,000
2,400
100
100
Earnings before interest
and taxes
Interest expense
Earnings before taxes
Taxes
$1,400
25
1,375
475
3. Funds Flow Statement
Net Income
$900
The funds flow statement, or the statement of
changes in financial position, provides the basis
for an aggressive analysis that focuses on the changes in financial
condition resulting from management decisions made during a
given time period. It’s derived from data appearing in other statements and answers the following questions: Where did the company get its funds during the year? What did the firm do with
these funds? Is the firm’s financial position stronger or weaker, as
measured by changes in net working capital (current assets
minus current liabilities)?
This statement is prepared by comFunds Flow Statement
paring ending and beginning balance
Changes in
sheets and is combined with informaBalance Sheets 12-31-06 12-31-05 + or tion from income statements.
Current assets
$50
$55
–5
As noted, from this greatly simplified example (see the “Funds Flow
Fixed assets
125
110
+15
Statement” box), the company’s curOther assets
2
0
+2
rent assets declined during the year.
Total assets
$177
$165
+12
You can also see that the firm used
available funds to finance long-term
Current liabilities
$26
$16
+10
liabilities, because fixed assets were
Long-term
liabilities
97
59
+38
up from $110 to $125, with a correOwners’ equity
54
90
–36
sponding jump in long-term debt. It’s
just this sort of snooping, combined
Total liabilities $177
$165
+12
and net worth
with a vigilant reading of all text, that
Sources of funds are designated by a "+" and uses by a “-.”
puts the spotlight on patterns.
How To Analyze Investments Like The Pros
3
Is the firm’s financial position stronger or weaker, as measured
by changes in net working capital? It’s weaker. Working capital
declined by $15. (Current assets were down by $5, and current
liabilities were up by $10.)
4. Statement Of Changes In Owners’ Equity
The statement of changes in owners’ equity or financial position gives more details concerning the change in ownership
accounts, or net worth, as recorded by the beginning and ending
balance sheets. Getting a closer look at the funds flow statement
allows you to make a more-detailed analysis. For example, you
can determine whether debt or a new equity issue financed company growth.
From Data Collection To Ratio Analysis
The statements discussed provide much useful information.
However, the collection of data is just a starting point. Once reliable information is assembled, an investor can conduct ratio
analysis on the firm and then compare the information to data of
firms within the industry.
Ratio usefulness lies in the ability to turn a series of numbers
into a powerful display highlighting the elements that affect operating performance. Although there are many ways to compare
numbers, ratio analysis is accomplished simply by dividing one
number into the other.
Ratios
Financial ratios are designed to exhibit relationships among
financial statement accounts, putting numbers into perspective.
Unfortunately, it’s not always clear whether higher or lower values for any given ratio are desirable. When unsure, look at the
trends for the industry. The more enlightened you are, the more
success you will have as an investor.
Ratios have a number of advantages:
• Ratios clarify the relationship between numbers that are difficult to see and comprehend by themselves.
• Ratios focus on trends that may be impossible to spot in a column of numbers.
• Ratios make numerical reporting easier to follow and more
interesting, especially when comparing firms within an
industry.
4
www.utilityforecaster.com
Here are some of the ways investment analysts put ratios
to work:
• Monitoring growth of a company
• Assessing profitability and understanding trends
• Appraising return on investment
• Watching expense-related items
• Determining breakeven levels
• Comparing and contrasting operating periods
• Comparing and contrasting planning with actual results
• Comparing and contrasting current expenses to historical costs
• Observing collections and receivables trends
• Comparing and contrasting a firm with competitors
• Comparing and contrasting entire industries
• Comparing and contrasting executive performance
• Monitoring performance under different interest-rate scenarios
• Observing employee productivity
• Monitoring employee turnover
• Measuring management’s efficiency
• Measuring the average size of orders
• Clarifying financial statements
• Evaluating returns to shareholders
Before undertaking an analysis, you need to know:
• What is the exact nature of the analysis? What are you
attempting to accomplish?
• Which specific factors and trends are likely to be helpful in
analyzing the stock? What is the order of importance?
• Where will your data come from? How old is the data?
• How reliable is the data? What confirmation do you have?
Never accept data from brokers or company officials at face
value. Question everything.
• How precise do the answers need to be? Will additional
research be worth the effort?
• How important are qualitative judgments in the context of the
problem? How much of a role does psychology play?
How To Analyze Investments Like The Pros
5
Limitations Of Ratio Analysis
As with any investigation, there are drawbacks to ratios:
• Today, conglomerates operate businesses in many industries, which makes it difficult to obtain meaningful statistics.
For example, General Motors operates numerous businesses, from automobiles to finance to insurance to locomotive
construction.
• Inflation badly misrepresents balance sheets because financial statements are based on historical costs. Profits are
affected because inventory values rise with inflation.
• Some firms employ “smoke and mirrors” to make financial
statements look better. Cash accounts can be skewed by including money from long-term debt with cash, improving year-end
“quick” and “current” ratios. After analysis is endorsed by
accountants and results printed, debt can be paid off.
• Different accounting practices can mislead. Firms within similar industries may use contrasting depreciation schedules.
• Ratios consider past activity. History is worth recognizing,
but the future is always uncertain. Never assume that obsolete printed material has any application in today’s world,
even if it’s only a few months old.
Regardless of their limitations, ratios allow investors to focus
on problems. More important, they provide the tools to determine
if company managers recognize transformations in their industry,
adapt to changes, and if they’re controlling finances properly.
The Ratios
Chapter Two
Ratios are the foundation of what analysts call “fundamental
analysis.” In traditional ratio analysis, very few additional information sources beyond the balance sheet and income statement are
used. However, don’t confine your digging to these two statements. There are many advantages to looking beyond the two traditional financial statements for useful input numbers.
Which Ratios To Monitor
Ratio compilation and analysis is a clerical process. It requires
determination in the collection of data, accuracy in calculation and
6
www.utilityforecaster.com
perseverance in comparison with industry averages. There’s no
relationship between the size of a firm and the number of ratios
requiring review. It depends entirely on your style and the comfort level you need to feel safe with your investment.
Beware of pseudo ratios that can’t logically be compared. For
example, the ratio of stockholders’ equity to sales probably expresses no useful relationship. Unique or custom ratios may or may not
provide significant information. Problems arise when attempting to
compare unusual ratios to industry norms that don’t exist.
Ratios may be categorized into these groups: asset management ratios, profitability ratios, liquidity ratios and market
value ratios. When making comparisons, keep in mind that numbers must be consistent from one period to another. Extraordinary
items should be removed from current and past data. Remember
that new information could make previous data invalid.
Asset Management Ratios
Sales Growth Ratio
Without grease for the wheels, a company won’t run for long.
Sales provide the grease; nothing happens until somebody sells
something. This ratio measures just how well the company is
doing with its sales.
Over time you can determine if insufficient growth originates
from within the company (lack of attention to marketing or customer preferences) or from without (competitors, technological
change or a recession). Whatever the cause, failure to grow sows
the seeds for future difficulties.
This ratio is calculated by examining current year sales with
revenues from the previous year. The ratio equation is:
Sales Growth = Net Sales - Net Sales Last Year
Net Sales Last Year
On the income statement on p. 6, we note net sales of $1.29
million. This equation requires you to examine the previous
year’s income statement (not shown), including net sales from
the period monitored.
Net sales were up 29 percent during the previous year, indicating rapid growth. The analyst must compare this figure with
industry averages and chart the growth over several years to look
for erratic patterns.
Sales Per Employee
When companies originate, employees wear many hats. As
firms grow, they hire specialists to fill positions, supposedly to
How To Analyze Investments Like The Pros
7
Sample Balance Sheet XYZ Company
Statement of Financial Position,
Dec. 31, 2006
ASSETS
Current Assets
Cash and marketable securities . . . . . . . . . . . . .$2,500
Accounts receivable . . . . . . . . . . . . . . . . . . . . .125,000
Inventory . . . . . . . . . . . . . . . . . . . . . . . . . . . .300,000
Prepaid expenses . . . . . . . . . . . . . . . . . . . . . . . . . .500
Other current assets . . . . . . . . . . . . . . . . . . . . . . . .—
Total Current Assets . . . . . . . . . . . . . . . . . . . .$428,000
Fixed Assets
Land . . . . . . . . . . . . . . . . . . . . . . . . . . . . . . . .$10,000
Buildings, less depreciation . . . . . . . . . . . . . . . .30,000
Machinery/equipment, minus depreciation . . . .10,000
Total Fixed Assets . . . . . . . . . . . . . . . . . . . . . .$50,000
Other Assets
Intangibles (goodwill, patents, trademarks) . . .$28,000
Tangible other assets . . . . . . . . . . . . . . . . . . . . . .4,000
Total Other Assets . . . . . . . . . . . . . . . . . . . . . .$32,000
Total Assets . . . . . . . . . . . . . . . . . . . . . . . . . .$510,000
LIABILITIES AND STOCKHOLDERS' EQUITY
Current Liabilities
Accounts payable . . . . . . . . . . . . . . . . . . . . .$120,000
Notes payable . . . . . . . . . . . . . . . . . . . . . . . . .20,000
Current portion long-term liabilities . . . . . . . . . . .2,000
Accrued expenses . . . . . . . . . . . . . . . . . . . . . . . .5,500
Other current liabilities . . . . . . . . . . . . . . . . . . . . . .—
Total Current Liabilities . . . . . . . . . . . . . . . . .$147,500
improve efficiency. In reality, labor
costs sometimes increase faster than
revenues as companies transfer former part-time jobs to full-time specialists earning salary and benefits. The
risk of expanding too fast is real for all
companies, not just small and midsize
firms.
You should watch this ratio closely,
especially in fast-growing, high-tech
industries. An increase in this ratio is
usually a sign of improving efficiency,
while a decrease may mean that the
firm is experiencing diminishing
returns or anticipated sales have not
materialized.
Another comparison is between
employees and production. For example, contrasting General Motors and
Ford employees needed per unit of
automobiles produced.
For this equation, we must dig to
determine the number of employees.
After reading the annual report, we discover that the firm has only 30 employees (not displayed).
Sales Per Employee: $1,290,000/30 = $43,000
The $43,000 means nothing until we
compare it with other firms within the
industry and track the figure over several years.
Long-Term Liabilities
Notes and mortgages . . . . . . . . . . . . . . . . . . . .$1,000
Lease obligations . . . . . . . . . . . . . . . . . . . . . . . .1,500
Total Long-Term Liabilities . . . . . . . . . . . . . . . . . .2,500
Total Expense Ratio
This ratio indicates managerial success in controlling expenses. The lower
the number, the better.
Total Liabilities . . . . . . . . . . . . . . . . . . . . . . .$150,000
Total Expense Ratio = Total Operating Expenses/Net Sales
Stockholders' Equity
Capital stock, par value . . . . . . . . . . . . . . . . . . . ..0.01
Authorized shares . . . . . . . . . . . . . . . . . .100,000,000
Issued and outstanding . . . . . . . . . . . . . . .22,000,000
Additional paid-in capital . . . . . . . . . . . . . . . . .30,000
Retained earnings . . . . . . . . . . . . . . . . . . . . . .110,000
Total Stockholders' Equity . . . . . . . . . . . . . . .$360,000
Total Liabilities and Stockholders' Equity . . . .$510,000
8
www.utilityforecaster.com
Interest Expense Ratio
Some companies depend on borrowed money to finance long-term
growth, even daily operations. Still
others rely on equity capital and cash
flow from profits. This ratio studies
the interest cost relative to the sales
of the company.
You should give this ratio close scrutiny, watching closely
when borrowing is significant and comparing with similar firms.
Interest Expense Ratio = Interest Expense/Net Sales
Turnover Of Assets
Sometimes called the investment turnover ratio, asset turnover
ratios measure how many times the company’s assets are
employed in the year to create sales. This is a compelling indicator of management efficiency and performance.
Turnover Of Assets = Net Sales/Total Assets
Lower ratios indicate insufficient sales or the need to eliminate
unproductive assets. High ratios point to an ability to create and
process sales at low cost. Follow this ratio with a trendline chart;
downward trends signal declining
efficiency.
XYZ Company Income Statement
Inventor y Turnover
This ratio assesses how well
management controls inventory.
An increasing inventory may show
management commitment to
increase sales or accumulation of
goods languishing on shelves.
When comparing businesses, net
sales may be the better yardstick
because cost of goods sold varies
considerably between firms.
The average inventory is determined by adding opening and closing figures and dividing by two.
We’ve simplified our example so
that both figures are $300,000.
Inventory Turnover = Cost Of Goods
Sold/Average Inventory
Profitability Ratios
Profits are very important.
Unless the company has unlimited resources, operating unprofitably over a period of time will
deplete capital to the point that
nothing is left to pay employees
or buy raw materials.
Year Ended Dec. 31, 2006
Revenues
Gross sales . . . . . . . . . . . . . . . . . . . . . . . . . . .$1,300,000
Less returns and allowances . . . . . . . . . . . . . . . . . .10,000
Net Sales . . . . . . . . . . . . . . . . . . . . .$1,290,000
Cost of Goods Sold
Beginning inventory . . . . . . . . . . . . . . . . . . . . . .$300,000
Purchases . . . . . . . . . . . . . . . . . . . . . . . . . . . . . . .800,000
Cost of goods available for sale . . . . . . . . . . . .$1,100,000
Less ending inventory . . . . . . . . . . . . . . . . . . . . . .300,000
Cost of goods sold . . . . . . . . . . . . . . . . . . . . . . . .800,000
Gross Profit . . . . . . . . . . . . . . . . . . . . .$490,000
Operating Expenses
Wages . . . . . . . . . . . . . . . . . . . . . . . . . . . . . . . .$160,000
Marketing expenses . . . . . . . . . . . . . . . . . . . . . . . .75,000
Rent expense . . . . . . . . . . . . . . . . . . . . . . . . . . . . .35,000
Interest expense . . . . . . . . . . . . . . . . . . . . . . . . . . . .5,000
Insurance expense . . . . . . . . . . . . . . . . . . . . . . . . .12,000
Depreciation expense . . . . . . . . . . . . . . . . . . . . . .10,500
Bad-debts expense . . . . . . . . . . . . . . . . . . . . . . . . .20,000
Utilities expense . . . . . . . . . . . . . . . . . . . . . . . . . . .14,000
Shipping . . . . . . . . . . . . . . . . . . . . . . . . . . . . . . . . .25,000
Additional expenses . . . . . . . . . . . . . . . . . . . . . . . .50,000
Total Operating Expenses . . . . . . . . . . .$406,000
Income From Operations . . . . . . . . . . . . . . . . . . . .$84,000
Net Profit Before Taxes . . . . . . . . . . . . . . . . . . . . . .84,000
Taxes . . . . . . . . . . . . . . . . . . . . . . . . . . . . . . . . . . .12,000
Net Profit After Taxes . . . . . . . . . . . . . .$72,000
How To Analyze Investments Like The Pros
9
Continuous breakeven operations provide no cushion for contingencies. What’s worse, without profits, rational investors will
not invest, nor will lenders supply, the funds needed for growth
and expansion.
Gross Margin
Low margin means that too much is being paid for merchandise or selling prices are too low, or both. A value of zero means
that the goods are sold for the same price paid for them.
Negative values are possible if selling prices are below cost
overall. Such evidence would indicate extreme competition.
Margin is closely related to pricing. Remember that margin
is lower where the customer can pick and choose among many
suppliers and higher where choices are limited. A high margin
would probably indicate this firm has few competitors.
Determine this ratio by dividing gross profit by net sales.
Gross Margin = Gross Profit/Net Sales
Breakeven Margin
This is simply the total operating expenses divided by net
sales, a number that even the most inexperienced investor should
monitor. Management attempts to increase profits by increasing
margins, though price increases may fail because customers
could seek substitutes or forgo the product entirely. Margins are
also affected by purchasing raw materials. Increasing raw material order quantities from suppliers could lower prices and operating expenses.
Breakeven Margin = Total Operating Expenses/Net Sales
Operating Margin
Operating margin is considered a better indicator of management skill and operating efficiency than net profit margin. This
ratio is important to investors interested in the underlying profitability of the business. Even firms with excessive debt expense
can be proven competitive using this ratio.
Operating Margin = (Net Profit Before Taxes + Interest + Depreciation)/Net Sales
Profit Growth
This ratio measures success in transferring revenue growth to
bottom-line profit growth. The ratio is the difference between this
year’s and last year’s after-tax net profit, divided by last year’s
after-taxes net profit.
It’s best to plot this data for several preceding years on a trendline to see if profits fluctuate significantly from year to year. This
10
www.utilityforecaster.com
ratio requires us to examine the previous year’s income statement
(not displayed).
Profit Growth = (This Year’s After-Taxes Net Profit - Last Year’s After-Taxes Net Profit ) /Last
Year’s After-Taxes Net Profit
Return On Sales
This is a key profitability ratio, also known as net profit margin.
This ratio measures the difference between what a company
takes in and what it spends in conducting its business.
Lower returns are predictable when many rival companies flirt
with the same customers. Conversely, high returns are common
for firms offering proprietary products.
Yearly trends are significant because they demonstrate how
well a company’s overall business strategy is working. It’s best
that you diagram returns for several years on a trendline chart to
evaluate patterns.
Return On Sales = After-Taxes Net Profit/Net Sales
Return On Gross Profit
This ratio compares net profit to gross profit instead of to
sales. It’s useful to investors, lenders and anyone who may need
to compare the efficiency of two firms in similar or totally different businesses. You want to know how successful a company is at
converting gross profits into net profits.
Firms with high returns on gross profit display at least two
common characteristics: They’re in good lines of business, and
competitors are scarce.
Return On Gross Profit = After-Taxes Net Profit/Gross Profit
Return On Assets
This ratio indicates how successful management is in utilizing
assets to make profits. It really measures the firm’s earning
power of its asset investments. Averages for this ratio vary greatly
by line of business. Obviously, steel manufacturers require more
assets than a sales-oriented business.
Some analysts remove intangible assets from the equation
and average beginning and ending asset totals. To simplify
our analysis, we’ll use ending total assets taken from the
balance sheet.
Return On Assets = After-Taxes Net Profit/Total Assets
How To Analyze Investments Like The Pros
11
Return On Net Worth
Sometimes called return on equity, this is the best known of
the return-on-investment ratios. Pay particular attention to this
ratio because it reports how much the company is earning from
dollars invested.
The national averages for this ratio vary from 5 percent to
more than 20 percent depending on the business. Lower returns
may limit investment, restrict growth and ultimately the dividendpaying ability. Many variations for this ratio exist, with the resulting numbers differing significantly.
Return On Net Worth = After-Taxes Net Profit/Stockholders’ Equity
Some firms obtain money entirely from equity investors, or
from profits resulting from business. Money obtained this way
doesn’t have to be repaid, and there’s no interest cost. Other
firms obtain needed cash by borrowing from banks or by issuing debt instruments such as bonds. Company survival may
hinge on its ability to meet such obligations. Business success
results from maximizing the use of other people’s money.
Liquidity Ratios
Current Ratio
This ratio is computed by dividing current assets by current liabilities. Sometimes called the liquidity ratio, this ratio is perhaps the
best-known measure of financial strength on a specific date.
When companies get into financial difficulty, they pay debts
slowly. When tough times appear, the current ratio will fall and
could spell trouble for the firm. Industry averages aren’t etched
in stone, but a popular rule of thumb for this ratio is 2 percent
or better. Many consider this number the minimum necessary
for reliable cash flow, though some lines of business operate at
lower figures.
Current Ratio = Current Assets/Current Liabilities
Quick Ratio
Quick assets are current assets less inventory, divided by current liabilities. Sometimes called the acid test, this ratio is perhaps the best measure of liquidity on a specific date. Why?
Because it considers only those assets that can be converted to
cash quickly. Typically, inventories are the least liquid asset.
Quick Ratio = (Current Assets - Inventory)/Current Liabilities
12
www.utilityforecaster.com
Current Debt To Stockholders’ Equity
This measure of financial strength compares what’s currently
owed to what’s owned. Because current liabilities are due now,
this ratio is another important indicator of company solvency.
Current Debt To Equity = Current Liabilities/Stockholders’ Equity
Debt To Stockholders’ Equity
This ratio is total liabilities divided by the stockholders’ equity.
It compares the total of what’s owed to what’s owned. When the
ratio exceeds 100 percent, it indicates that the investment capital
provided by lenders exceeds that provided by the stockholders.
Debt To Equity = Total Liabilities/Stockholders’ Equity
Debt To Assets
Also called the debt ratio, this ratio compares what’s owed to
the value of assets employed by the business. The total liabilities
are divided by total assets.
Although debt varies greatly from firm to firm, this ratio monitors success in using debt to build the business. If the ratio
climbs over time, a likely interpretation is that borrowing is
financing losses.
Debt To Assets = Total Liabilities/Total Assets
Equity Ratio
This ratio portrays how much of the company’s capitalization is
provided by its shareholders. The value of preferred stock, if any,
is usually eliminated because holders don’t have a voice in the
affairs of the corporation. The equity ratio is considered a good
indicator of long-term solvency.
Equity Ratio = Stockholders’ Equity/(Total Assets - Current Liabilities)
Inventor y To Current Assets
Ratios involving inventory are measures of managerial efficiency. This ratio is a good indicator of asset allocation and liquidity because it makes the comparison to other assets instead
of sales. There’s no correct value for this ratio, but if it moves
out of its known range, it should be viewed as a red flag.
Inventory To Current Assets = Inventory/Current Assets
How To Analyze Investments Like The Pros
13
Judgment Day Ratio
The judgment day is when all possible circumstances sour. This
is the most critical of the solvency ratios and assumes that inventory, accounts receivable, prepaid expenses and other current assets
are illiquid. Only cash is available to meet obligations. Examine this
ratio closely to determine if a firm is operating too close to the
abyss. Develop a trendline, and follow this ratio over time.
Judgment Day Ratio = Cash/Current Liabilities
Cash To Total Liabilities
Cash is the ultimate asset; in fact, it’s the only asset that others
will pay you to hold. Unfortunately, comparative information on levels of cash held by corporations isn’t easily obtained. Sometimes
you can make many permutations to uncover actual cash amounts.
Cash To Total Liabilities = Cash/Total Liabilities
Market Value Ratios
Investment analysis means looking at anything about a firm
that could impact its ability to meet financial obligations and
provide a growing stream of earnings and dividends. After all, if
you’re nearing retirement and counting on dividend income to
supplement Social Security, you don’t want any surprises.
Market value ratios, sometimes called investment ratios,
examine a company’s progress from a bottom-line position.
When market values flounder, investors bail out quickly,
forcing down the price of the security.
Book Value Per Share
The stockholders’ equity is divided by the number of shares of
stock outstanding. When new stock is sold from time to time, this
ratio tracks the dilative effects of such sales.
Book Value Per Share = Stockholders’ Equity/Shares Outstanding
Dividend Rate
Dividend rates are important but provide limited information
for evaluating holdings. They communicate only one fact—the
amount of the payout. These numbers are frequently located on
the balance sheet, in the stockholders’ equity section.
Dividend Rate = Dividend Dollar Totals Disbursed/Shares Outstanding
For this simplified example, no dividends are included. If
they were, the total amount of the dividend would be divided by
22 million shares, the number of shares of stock outstanding.
14
www.utilityforecaster.com
Dividend Yield
The dividend yield relates dividend payout to the stock price.
High yields are characteristic of mature industries, like utilities.
Low-yielding stocks indicate growth companies.
Dividend Yield = Dividend Dollar Amount/Current Stock Price
In this simplified example, dividend amount isn’t included.
Suppose the stock price is $45 and the yearly dividends add to
$3.15. The yield would be 7 percent.
Price-To-Earnings
Price-to-earnings (P/E) ratios are oft-quoted by analysts and
represent the per-share market price of a company’s stock divided by after-taxes net profit per share.
When investors are optimistic, as they were for most of the latter 1990s, they’re willing to pay more for anticipated future earnings. When a company’s future is viewed pessimistically, or the
industry is boring, the ratio is likely to be low.
P/Es change with stock price movement, so to arrive at the
current P/E, divide the stock’s current price by earnings for the
most-recent four quarters for a trailing P/E. Or, if you’re forecasting the future, divide the current price by the company’s
estimated earnings for the next four quarters. One way to foretell growth is to examine historical patterns.
Many analysts maintain that low P/E stocks are positive (bullish indicators), while high P/E stocks are signs of an impending
correction. It’s a good habit to develop trendline charts of the
P/Es for stocks that interest you.
P/E = Stock Price/Net Profit After Taxes Per Share
Price-To-Earnings To Growth
The P/E-to-growth ratio, otherwise known as the PEG ratio, is
a way to measure a stock’s value relative to its growth rate. The
PEG ratio is calculated by dividing a company’s P/E ratio by its
five-year expected earnings growth rate. A PEG ratio under 1 suggests a company is undervalued relative to its growth rate, while
a number above 1 suggests it’s overvalued.
Like other ratios, the PEG ratio shouldn’t be used in a vacuum.
Consequently, you should compare PEG ratios that appear especially high or low to other competitors in the industry as well as
the market as a whole to get a sense if the stock is truly under- or
overvalued relative to its peers and the entire stock market.
PEG = Price-to-Earnings (P/E) Ratio/Five-Year Earnings Growth Estimates
How To Analyze Investments Like The Pros
15
Price-To-Book
Price-to-book is the per-share market price of a company’s
stock divided by stockholders’ equity per share. This ratio is a
fairly good indicator of how investors view the future. The higher
the ratio, the more optimistic buyers are.
Note that book value doesn’t accurately report the market
value of assets because values are derived from historical costs.
Price-To-Book = Stock Price/Stockholders’ Equity Per Share
Price-To-Sales
Here’s another way to evaluate the company’s market price,
this time relating it to sales. The idea is to put a price on a business that correlates to annual sales.
Price-To-Sales = Stock Price/Net Sales Per Share
Chapter Three
Technical Indicators
The preceding chapters were primarily concerned with fundamental analysis or the firm foundation theory. The fundamental
investor matches value to price. Fundamentalists believe that
investment prices reflect all available information relevant to determining value. Any new information is quickly digested by the
investing public and accurately reflected by posted prices.
Technical analysis is the castle-in-the-air theory. That is, technicians don’t concentrate on a stock’s value but on investors’
moods. Technicians pay little attention to what the company does,
concentrating on how the stock price performs. Technicians
employ indicators, charts and computer programs to track trends
in stocks and bonds and the general market. They use these indicators to predict price movements.
Fundamental analysis focuses on the intrinsic value of specific firms. Analysts crunch numbers, conduct ratio analysis and
probe factors like sales trends, profits, product analysis, potential
markets and managers. By examining the foundation of the firm,
future prices can be forecasted.
Technicians focus on the company’s stock price and volume
traded as pictured on daily, weekly and monthly charts. By looking at a stock’s pricing activity, future prices can be forecasted.
16
www.utilityforecaster.com
Other Technical Indicators
Dow Theor y is the oldest and most widely used of the technical theories. As with other technical procedures, it’s based on
trends indicated by price movements. Named after Charles Dow,
this theory contends that the stock market is made up of two
types of “waves.” These waves are primary—a bull or bear market cycle of several years’ duration and a secondary wave lasting
from weeks to months.
Dow believed his theory applied to the general market and
that individual stock selections would rise or fall with the averages much of the time.
Speculative influence is reflected in the ratio of activity
between Nasdaq and American Stock Exchange (AMEX) stocks
to New York Stock Exchange (NYSE) volume. The theory is that
when activity and prices of Nasdaq and AMEX stocks begin to
move more rapidly than the
blue chip issues, speculation is
multiplying. That’s the time for
The Moving Average
conservative, rational investors
A solitary number is meaningless unless it’s compared to
to move to the sidelines.
something else. Analysis depends on comparison. For examThe Odd-Lot Index reveals
ple, unless you know the average of stock prices for the past
how smaller investors view the
six months, you won't know whether trends are increasing
market. The smaller investor is
or decreasing. And that's usually what you need to know.
presumably less informed and
The best way to focus on trends over time is with the
tends to follow established and
moving average. Moving averages allow you to examine
predictable patterns. Concenthe direction of a stock or mutual fund by comparing its
trating on trades of fewer than
price to movements over time. A moving average is updated
100 shares, the index alerts its
periodically by dropping the first number and adding the
followers when fry investors
most-recent number.
deviate from regular actions.
For example, a 52-week moving average is determined by
Moving averages (see box p.
adding the stock or mutual fund’s closing price for the current
week to the closing prices of the previous 51 weeks and then
12) compare current stock or
dividing by 52. Over time, this moving average indicates the
mutual fund prices to averages
trend of prices.
tracked over a period of time. As
In most cases, analysts compare individual investment
a new price is added to the list,
moving averages with a regular market average like the
the oldest price falls off. All
S&P 500. For example, as long as the S&P 500 is above its
prices are “averaged” by dividmoving average, the outlook is bullish. Conversely, when the
ing the sum total by the number
S&P 500 falls below its moving average for three or four
of days or weeks monitored.
weeks, the outlook is bearish.
Investors invest in the market as
long as the moving average is
above the S&P 500 average, the
Wilshire 5000 average or whatever index is monitored.
A most-active stock list is published in many daily newspapers, giving highs, lows, last prices and changes in the volume
leaders on the NYSE and Nasdaq exchanges. Many investors
watch these lists closely and either buy the issues after they’ve
appeared on the list for three consecutive days or short them.
How To Analyze Investments Like The Pros
17
Similar to the most-active list is the daily list of new highs or
lows. These are the stocks that hit new highs or lows for the year
during the previous day’s trading session. Technicians believe
that when more stocks are making new highs than lows, bullish
times will result.
Advances versus declines is a simple measure of the number of stocks that have advanced in price and the number that
have declined. Widely followed and quoted, this is thought to
illustrate the general direction of the market.
Volume, the number of shares traded daily, is an important
indication of where the market is headed. Buyer enthusiasm to
climb aboard rising markets frequently pushes prices higher.
Momentum measures the velocity of an index, comparing current numbers to an index or a moving average.
How To Evaluate A Mutual Fund
Interested in mutual fund investing? Before you invest in a
mutual fund, obtain answers to these questions:
• What was the annual return of the fund for the past 10
years? Did the fund outperform the S&P 500 during that
time frame?
• Was growth apparent each year? How did the fund perform
in the bear markets of ‘87, ‘90, ‘94, the fall of ‘98 and about all
of 2000-02?
• Did the fund outperform other funds with similar objectives?
• Is the current portfolio manager the person who built the
fund? If not, how long has the present manager directed the
fund? There’s no substitute for experience (especially when
your money is in jeopardy).
• Does the fund have a load? Do your best to stay away from
loaded funds, especially when there are so many good noload funds. Is the expense ratio—the sum of all administrative and management fees divided by the net asset value—
below 1.5 percent? Avoid funds with ratios above that.
18
www.utilityforecaster.com
Appendix
Selected List Of Company And Industr y Information
Your local library should have some or all of the following publications investment experts use to evaluate stocks and industries.
Key Industry Overviews
• Standard & Poor’s Industry Surveys—New York: Standard &
Poor’s Corp. Quarterly updates.
• Value Line Investment Survey—New York: Value Line.
Looseleaf with weekly updates.
• Morningstar Mutual Funds—Monthly updates. A rundown
and rating of mutual funds.
Corporate Profiles And Summary Information
10-Ks and annual reports to shareholders are key tools. All of
these public filings can be found on the Edgar database provided
by the Securities and Exchange Commission. The Internet
address is http://www.sec.gov.
• Hoover’s Handbook—Profiles of more than 500 major corporations.
• Moody’s Manuals—Bank & Finance. Industrial. International.
OTC Industrial. Public Utility. Transportation. New York:
Moody’s Investors Service.
• Standard & Poor’s Bond Guide—New York: Standard &
Poor’s Corp. Monthly.
• Standard & Poor’s Stock Guide—New York: Standard &
Poor’s Corp. Monthly.
• Standard & Poor’s Stock Reports—New York: Standard &
Poor’s Corp. Weekly updates.
Internet
A great Web site that provides everything from 15-minute
delayed stock quotes to price charts to financial ratios is Yahoo
Finance. The Web site is http://finance.yahoo.com. Investors get
analysts’ upgrades and downgrades, earnings estimates and
industry comparisons for financial ratios.
How To Analyze Investments Like The Pros
19
Market Indexes
Tracking the market is a complicated undertaking. For example, if you asked your broker how the market is doing on a particular day, chances are you’d receive information on the Dow
Jones Industrial Average. But with only 30 stocks, it’s a very narrow representation of how the broad-based market is doing.
Other, more broadly based, widely followed and quoted market
measures are:
• The S&P 500 includes the best stocks in industry, technology, transportation and utilities listed on the NYSE, AMEX
and the Nasdaq.
• The Wilshire 5000 consists of all US equities, real estate
investment trusts and limited partnerships—more than
5,800 securities.
• The NYSE Composite includes about 2,500 common
stocks listed on the NYSE.
• The Value Line Composite is an average of all 1,700 stocks
followed by Value Line.
• The Nasdaq Composite measures all domestic stocks traded on the Nasdaq, about 4,600 issues.
• The Russell 3000 contains 3,000 large US companies or
more than 90 percent of the US equity market.
• The Russell 2000 features the 2,000 smallest stocks in the
Russell 3000.
Disclaimer: The information contained in this premium is current as of 05/14/07. For the most up-todate advice and pricing, go to www.utilityforecaster.com or check your latest Utility Forcaster issue.
20
www.utilityforecaster.com
UAI0607


© Copyright 2026