
HOW TO USE THE CAN SLIM APPROACH AAII has been testing
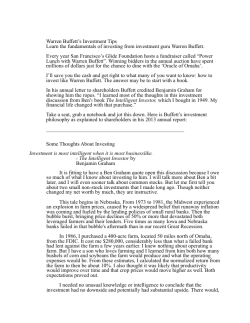
STOCK SCREENING
HOW TO USE THE CAN SLIM APPROACH
TO SCREEN FOR GROWTH STOCKS
By John Bajkowski
AAII has been testing
the performance of a
wide range of
screening systems for
over five years, and
our interpretation of
the CAN SLIM
approach has been
one of the most
consistent and
strongest-performing
screens during both
bull and bear markets.
Take an attention-grabbing book title, toss in an easy-to-remember acronym, and top it off with a daily business newspaper that supplies information
required for preliminary analysis: You’ve got the recipe for a popular investment strategy. The CAN SLIM approach is presented by William O’Neil,
publisher of Investor’s Business Daily, in his book titled “How to Make
Money in Stocks: A Winning System in Good Times or Bad.”
The second edition of “How to Make Money in Stocks” presented a stock
selection approach developed by studying 500 of the biggest stock market
winners from 1953 to 1993. The CAN SLIM approach presented in the book
was based upon the characteristics that these winning stocks possessed prior
to their big price run-ups. Recently, O’Neil extended his analysis of past
market winners to 600 companies that performed strongly from 1953 to 2001
and revised a number of CAN SLIM criteria. The third edition of “How to
Make Money in Stocks” was published last year and presents the revised
CAN SLIM rules (see Table 1). This article presents the CAN SLIM approach
with an eye toward the recent changes and its application using AAII’s stock
screening system—Stock Investor Pro. Additionally, the March/April 2003
issue of Computerized Investing presents how to apply the CAN SLIM stock
screen using Internet stock screening systems.
CAN SLIM OVERVIEW
“The American Association
of Individual Investors
is an independent
not-for-profit corporation
formed in 1978 for the
purpose of assisting
individuals in becoming
effective managers of
their own assets through
programs of education,
information, and research.”
AAII
625 N. Michigan Ave.
Chicago, IL 60611
800-428-2244
www.aaii.com
The CAN SLIM approach seeks companies with a proven record of quarterly and annual earnings and sales growth showing strong relative price
strength and support from leading institutions. O’Neil does not mind paying
rich premiums for stocks with good prospects. He feels that most strategies
seeking stocks with low price-earnings are flawed because they ignore the
price trend determining the price-earnings ratio, as well as the quality of the
underlying earnings within the ratio. O’Neil believes that stocks generally
sell for what they are worth and most stocks with low price-earnings ratios
are probably priced correctly by the market. O’Neil also asserts that it is
important to follow the market closely and try to lighten up your stock
exposure when going into a bear market.
C = CURRENT QUARTERLY EARNINGS
The CAN SLIM approach focuses on companies with proven records of
earnings growth that are still in a stage of earnings acceleration. O’Neil’s
study of winning stocks revealed that these securities generally had strong
quarterly earnings per share performance prior to their significant price run
ups.
O’Neil recommends looking for stocks with a minimum increase in quarterly earnings of 18% to 20% over the same quarterly period one year ago.
When screening for quarterly earnings increases, it is important to compare a
quarter to the equivalent quarter last year—in other words, this year’s second
quarter compared to last year’s second quarter. Many firms have seasonal
John Bajkowski is AAII’s financial analysis vice president and editor of Computerized
Investing.
12
AAII Journal/April 2003
Reprinted by Investor's Business Daily with Permission (c)AAII 2003
STOCK SCREENING
patterns to their
earnings, and comparing similar quarters
helps to take this into
account.
Another item to
watch for when screening for percentage
changes is a meaningless figure created by
having a very small
base number. For
example, an increase
from one penny to 10
cents translates into a
900% earnings increase. It is always
advisable to look at the
raw numbers of the
company passing the
screen. This allows you
to gauge the overall
trend and stability in
earnings and other
items such as sales and
cash flow.
Whenever you are
working with earnings,
the issue of how to
handle extraordinary
earnings comes into
play. One-time events
can distort the actual
trend in earnings and
make the company
performance look better
or worse than a
comparison against a
firm without special
charges. O’Neil
recommends excluding
these non-recurring
items from the analysis.
The first two screens
require quarterly
earnings growth greater
than or equal to 20%
and positive earnings
per share from continuing operations for the
current quarter. We
used Stock Investor
Pro, with data as of
March 14, 2003, for
the screen. Only 2,343
stocks out of an initial
universe of 8,428 met
TABLE 1. REVISED CAN SLIM RULES
Third Edition
C = Current Quarterly Earnings Per Share: The Higher, the Better
Should show a major percentage increase (18% or 20%
Primary
minimum) in the current quarterly EPS when compared to the
Factors
prior year's same quarter.
Omit a company's one-time extraordinary gains.
Look for accelerating quarterly earnings growth.
Secondary Look for quarterly sales growth of 25% or at least an
acceleration in rate of sales percentage improvements over
Factors
the last three quarters.
Find at least one other stock in the same group showing
strong quarterly earnings growth.
A = Annual Earnings Increases: Look for Significant Growth
The annual compounded growth rate for EPS should be at
Primary
least 25%.
Factors
Significant growth in EPS for each of the last three years.
Comparison to Second Edition
Same as in Second Edition
Same as in Second Edition
Same as in Second Edition
New to Third Edition
Same as in Second Edition
The EPS annual compounded growth rate should be at least
25% over the last four or five years.
Each year's annual EPS for the last five years should show an
increase over the prior year's earnings.
Same as in Second Edition
Secondary The consensus earnings estimate for the next year should be
higher than the current year.
Factors
Return on equity of 17% or more.
New to Third Edition
Look for annual cash flow per share greater than actual
New to Third Edition
earnings per share by at least 20%.
Earnings should be stable and consistent from year to year
Earnings should be stable and consistent from year to year
over the last three years.
over the last five years.
N = New Products, New Management, New Highs: Buying at the Right Time
Look for companies with a major new product or service, new Same as in Second Edition
Primary
management, or a positive change for the industry.
Factors
Same as in Second Edition
Secondary Look for stocks close to or making new highs in price after a
period of consolidation.
Factors
Strong volume on price move up.
S = Supply and Demand: Shares Outstanding Plus Big Volume Demand
Any size stock can be purchased under the CAN SLIM system. Stocks with a small or reasonable number of shares
Primary
The market will shift its emphasis between small- and largeoutstanding will, other things being equal, usually outperform
Factors
cap stocks over time.
older, large-capitalization stocks.
When choosing between two stocks, the stock with the lower Greater emphasis on stocks with limited float in Second
number of shares should perform better to the upside, but can Edition.
come down just as fast.
Same as in Second Edition
Secondary Stocks with a large percentage of ownership by top
management are generally good prospects.
Factors
Look for companies buying their own stock in the open market. Same as in Second Edition
Look for companies with a lower debt-to-equity ratio and
Same as in Second Edition
companies reducing their debt-to-equity ratios over the last few
years.
L = Leader or Laggard: Which Is Your Stock?
Buy among the top two or three stocks in a strong industry
Same as in Second Edition
Primary
group.
Factors
Use relative price strength to separate the leaders from the
Same as in Second Edition
laggards—a stock with a relative strength rank below 70% is
lagging and should be avoided.
Same as in Second Edition, but greater emphasis on limiting
Secondary Look for companies with a relative strength rank of 80% or
higher that are in a chart base pattern.
buys to stocks with a relative strength rank of 80% or greater
Factors
in Third Edition.
Don't buy stocks with weaker than average performance
Same as in Second Edition
during a market correction.
I = Institutional Sponsorship: Follow the Leaders
Look for a stock to have several institutional owners. 10 might Same as in Second Edition
Primary
be a reasonable minimum.
Factors
Look at quality of owners—seek out stocks held by at least
Same as in Second Edition
one or two savvy portfolio managers.
Look for stocks with an increasing, not decreasing, number of Same as in Second Edition
sponsors.
Same as in Second Edition
Secondary Avoid stocks that are over-owned—excessive institutional
ownership.
Factors
M = Market Direction
It is difficult to fight the trend, so try to determine if you are in a Same as in Second Edition
Primary
bull or bear market.
Factors
Follow and understand what the general market averages are Same as in Second Edition
doing every day.
Try to go 25% into cash when the market peaks and begins a Same as in Second Edition
major reversal.
Heavy volume without significant price progress may signal a Same as in Second Edition
top, but initial market decline may be on lower volume.
Follow market leaders for clues on strength of market.
Same as in Second Edition
Same as in Second Edition
Secondary Look for divergence of key averages and indexes at major
turns—divergence points to weaker and narrow market
Factors
movement.
Sentiment indicators may help highlight extreme psychological Same as in Second Edition
reversal points.
The change in the discount rate is a valuable indicator to
Same as in Second Edition
watch as a confirmation of market moves.
Reprinted by Investor's Business Daily with Permission. (c)AAII 2003
AAII Journal/April 2003
13
STOCK SCREENING
these two criteria.
Beyond looking for strong quarterly growth, O’Neil likes to see an
increasing rate of growth. An
increasing rate of growth in quarterly earnings per share is so
important in the CAN SLIM system
that O’Neil warns shareholders to
consider selling holdings of companies that show a slowing rate of
growth for two quarters in row. The
next screen specified that the earnings growth rate from the quarter
one year ago compared to the latest
quarter be higher than a similar
quarter one year earlier. This
reduced the number of passing
companies to 1,556.
As a confirmation of the quarterly
earnings screen, O’Neil likes to see
same-quarter growth in sales greater
than 25% or at least accelerating
over the last three quarters. This
new screening requirement was
added to the third edition of
O’Neil’s book and seeks to help
confirm the quality of a firm’s
earnings. Independently, 3,647
stocks have a current quarterly sales
growth greater than or equal to
25%, but combined with the other
filters the number of passing companies was reduced to 393.
The CAN SLIM system is not
purely mechanical and O’Neil also
likes to find at least one other stock
in the same industry group that
shows strong quarterly earnings
growth as confirmation that the
industry is strong.
A = ANNUAL EARNINGS
INCREASES
Winning stocks in O’Neil’s study
had a steady and significant record
of annual earnings in addition to a
strong record of current earnings.
O’Neil’s primary screen for annual
earning increases requires that
earnings per share show an increase
in each of the last three years. This
filter has been loosened slightly from
the prior edition, which required
earnings increases over each of the
last five years.
In applying this screen in Stock
14
AAII Journal/April 2003
Investor Pro, we specified that
earnings per share from continuing
operations be higher for each year
when compared against the previous
year. To help guard against any
recent reversal in trend, a criterion
was included requiring that earnings
over the last 12 months be greater
than or equal to earnings from the
latest fiscal year. When screened by
itself, 795 companies passed this
filter compared to the 469 companies that passed the second edition’s
tighter filter. Adding the filter
requiring a year-by-year earnings
increase for each of the last three
years to the current growth filters
reduced the passing number of
companies to just 60 stocks. This is
not surprising given the economic
environment over the last few years.
O’Neil also recommends screening
for companies showing a strong
annual growth rate of 25% over the
last three years. This filter only cut
an additional six stocks, which is to
be expected given the strict consistent year-by-year growth requirement.
Optimally, the consensus earnings
estimate for the next year should be
higher than the latest reported year.
Adding this filter reduced the
number of passing companies to 39.
When working with consensus
earnings estimates it is important to
remember that only the larger and
more active firms will have analysts
tracking them and providing estimates. About half of the stocks in
Stock Investor Pro have consensus
earnings estimates, so this filter will
also tend to screen out micro-cap
stocks.
Another potential addition to the
CAN SLIM screen is a requirement
for high return on equity (ROE: net
income divided by shareholder’s
equity). O’Neil’s studies showed that
the greatest winning stocks had
ROEs of at least 17%. O’Neil uses
this measure to separate wellmanaged companies from poorly
managed ones. Adding this filter
would have reduced the number of
passing companies to 19 from 39.
Our testing over the last five years
revealed that this requirement often
led to a very small number of
passing stocks and hurt performance
since 2001. The revised screen does
not make use of the return on equity
filter.
N = NEW PRODUCTS, NEW
MANAGEMENT, NEW HIGHS
O’Neil feels that a stock needs a
catalyst to start a strong price
advance. In his study of winning
stocks, he found that 95% of the
winning stocks had some sort of
fundamental spark to push the
company ahead of the pack. This
catalyst can be a new product or
service, a new management team
employed after a period of lackluster
performance, or even a structural
change in a company’s industry—
such as a new technology.
These are very qualitative factors
that do not lend themselves easily to
screening. A second consideration
that O’Neil emphasizes is that
investors should pursue stocks
showing strong upward price
movement. O’Neil says that stocks
that seem too high-priced and risky
most often go even higher, while
stocks that seem cheap often go even
lower. Stocks that are making the
new high list while accompanied by
a big increase in volume might be
prospects worth checking. A stock
making a new high after undergoing
a period of price correction and
consolidation is especially interesting.
O’Neil’s newspaper, Investor’s
Business Daily, highlights stocks
within 10% of their 52-week high
and this was the criterion established
for the screen. One would expect
many companies to pass during a
strong market expansion, while a
smaller number of companies would
pass during a declining market.
Given the weak market during the
first few months of 2003, it is not
surprising that adding this filter
reduced the number of passing
companies from 39 to four. As of
March 14, 2003, a total of 1,037
stocks out of a universe of 8,428
Reprinted by Investor's Business Daily with Permission. (c)AAII 2003
STOCK SCREENING
were trading within 10% of their
52-week high.
S = SUPPLY AND DEMAND
O’Neil emphasized smallercapitalization stocks more strongly
in his earlier editions. The third
edition states that any size stock can
be purchased using the CAN SLIM
approach, but smaller companies
will be more volatile with greater
pop to the upside and downside.
Companies buying back their stock
on the open market are preferred, as
well as companies with management
stock ownership. No definitive
screens now come out of the S
element of the CAN SLIM system,
but Table 1 identifies a number of
factors to consider when analyzing
passing companies.
L = LEADER OR LAGGARD
O’Neil is not a patient value
investor looking for out-of-favor
companies and willing to wait for
the market to come around to his
viewpoint. Rather, he prefers to
identify rapidly growing companies
that are market leaders in rapidly
expanding industries. O’Neil advocates buying among the best two or
three stocks in a group. He feels
that you will be compensated for
any premium you pay for these
leaders with significantly higher
rates of return.
O’Neil suggests using relative
strength to identify market leaders.
Relative strength compares the
performance of a stock relative to
the market as a whole. Relative
strength is reported in many ways
and you must be careful to understand how the relative strength
figure is used in a given screening
system.
Companies are often ranked by
their price performance for a given
period of time and their percentage
ranking among all stocks is calculated to show the relative position
against other stocks. Investor’s
Business Daily presents the percentage ranking of stocks and O’Neil
recommends avoiding any stock
with relative strength rank below
70% and only seeking out stocks
with a percentage rank of 80% or
better—stocks that have performed
better than 80% of all stocks. While
only about 1,680 firms (8,428 ×
20%) have a 52-week relative
strength rank of 80% or greater, this
filter did not further reduce the
number of passing companies. In the
market environment at the time of
the screen, the price as a percent of
52-week high proved to be a more
stringent price strength screen.
I = INSTITUTIONAL
SPONSORSHIP
O’Neil feels that a stock needs a
few institutional sponsors for it to
show above-market performance.
Ten institutional owners is suggested
as a reasonable minimum number.
This number refers to actual institutional owners of the common stock,
not institutional analysts tracking
and providing earnings estimates on
stocks.
Beyond looking for a minimum
number of institutional owners,
O’Neil suggests that investors study
the recent record of the institutions.
The analysis of the holdings of
successful mutual funds represents a
good resource for the individual
investor because of the widely
distributed information on mutual
funds. Web sites such as
Morningstar.com
(www.morningstar.com) and CNBC
on MSN Money
(moneycentral.msn.com/investor)
disclose the top mutual funds that
own a given stock.
The next filter required a minimum of 10 institutional shareholders. About 5,500 stocks pass this
TABLE 2. STOCKS THAT PASSED THE CAN SLIM SCREEN
Company (Exchange: Ticker)
Third Edition CAN SLIM Screen
EPS
EPS
Sales Annual
Grth
Grth
EPS
Grth
Last
Prior
Last
Grth
Qtr Vs Qtr Vs Qtr Vs Rate
Yr Ago Yr Ago Yr Ago (3-Yr)
(%)
(%)
(%)
(%)
Long- Price
T e r m as %
EPS
of
Grth 5 2 - W k
E s t High
(%)
(%)
52-Wk
Net
Rel
Inst’l
Inst’l
S t r g t h Share- S h a r e s
R a n k holders Purch
(%)
(No.) ( 1 , 0 0 0 s ) Description
Apollo Group, Inc (M: APOL)
72.2
FTI Consulting, Inc (N: FCN)
192.3
International Game Tech (N: IGT)
42.3
Teva Pharmaceutical Indus (M: TEVA)
73.3
Second Edition CAN SLIM Screen
50.0
53.3
10.8
20.0
35.4
91.4
76.4
35.8
37.8
36.7
70.5
49.9
24.3
21.0
17.3
23.8
99
95
97
95
93
94
88
91
1,142
384
980
942
6,126
2,005
2,102
11,210
Commercial Bankshares (M: CLBK)
Oshkosh Truck Corporation (N: OSK)
28.2
–3.8
–3.2
17.9
16.0
13.1
8.0
15.9
96
90
94
76
27
383
21
–121
30.0
28.8
Statistics are based on figures as of March 14, 2003.
Data Source: AAII’s Stock Investor Pro/Market Guide, Inc. and I/B/E/S.
Reprinted by Investor's Business Daily with Permission. (c)AAII 2003
Exchange Key:
adult higher ed
consulting firm
casino gaming prods
major theraputic drugs
bank holding co
specialty trucks
N = New York Stock Exchange
M = Nasdaq National or Small-Cap Markets
AAII Journal/April 2003
15
STOCK SCREENING
FIGURE 1. CAN SLIM PERFORMANCE
Source: AAII’s Stock Investor Pro.
filter independently. Adding it to the
CAN SLIM filter in Stock Investor
Pro did not cut any additional
stocks.
O’Neil also likes to see the
number of institutional shareholders
increasing for a given stock in the
most recent quarters. Stock Investor
Pro does not report the number of
institutional shareholders over time,
but it does report on number of
shares sold and purchased by
institutions over the last quarter.
Our last filter specified that the
number of shares purchased should
be greater than or equal to the
number of shares sold by institutions
over the last quarter. This filter did
not further reduce the number of
passing stocks, which are shown in
Table 2.
M = MARKET DIRECTION
The final aspect of the CAN SLIM
system looks at the overall market
direction. While it does not impact
the selection of specific stocks, the
trend of the overall market will
have a tremendous impact on the
performance of your portfolio.
O’Neil tends to focus on technical
measures when determining the
overall direction of the marketplace.
Any good technical program or Web
site, or even Investor’s Business
Daily, should provide you with the
necessary tools to study market
movement.
O’Neil finds it difficult to fight the
trend, so it is important to determine
if you are in a bull or bear market.
Table 1 summarizes the type of
factors that O’Neil considers when
trying to gauge market strength.
SCREENING RESULTS
Table 2 displays the companies
passing the CAN SLIM screen based
upon our interpretation of the rules
presented in both the third and the
second editions of O’Neil’s book.
Four stocks passed the third
edition screen compared to the two
passing the second edition screen.
This is actually a reversal of the
normal pattern. We have backtested
the revised third edition screen and
have found that, on average, five
stocks passed this screen every
month compared to 12 stocks
passing the second edition screen on
a monthly basis from December
1997 through March 2003. As many
as 32 stocks have passed the second
edition screen, while the greatest
number of stocks passing the third
edition screen was 15 over this time
period. On three occasions, no
stocks passed the third edition
screen, while as little as one stock
has passed the second edition screen.
Although it is difficult to draw
conclusions with such a small
sample, the stocks passing the third
edition screen tend to be larger
companies held by more institutional
owners, with stronger quarterly
earnings and sales growth as well as
stronger historical and expected
annual earnings growth.
We have been testing the performance of a wide range of screening
systems for over five years now and
our interpretation of the CAN SLIM
approach has proven to be one of
the most consistent and strongestperforming screens during both bull
and bear markets. Figure 1 provides
a quick view of the initial testing of
the revised CAN SLIM approach.
The revised approach has proven to
be a bit more volatile—rising higher
and faster in the bull market of the
late 1990s but then giving up its
lead in the recent bear market. Both
strategies will be tracked and
reported on the in the Stock Screens
area of AAII.com as well as the
semiannual review of strategies in
the AAII Journal.
CONCLUSION
The CAN SLIM system has great
appeal to the active investor looking
for growth stocks. While the approach is specific, it also stresses the
art of investing when interpreting
the direction of the market. Here we
have touched upon CAN SLIM rules
helpful in identifying promising
stocks. It is important to keep in
mind that ideas from a computer
screen merely represent a starting
point that requires further analysis
before action. ✦
Reprinted by Investor's Business Daily with Permission. (c)AAII 2003
16
AAII Journal/April 2003


© Copyright 2026