
T A J M
THE AMERICAN JOURNAL of MEDICINE ® The Green Journal EDITORIAL 287 Peer Review: The Best of the Blemished? Joseph S. Alpert CONTENTS April 2007 Volume 120/Number 4 UPDATE IN OFFICE MANAGEMENT 306 Office Management of Chronic Pain in the Elderly Debra K. Weiner REVIEWS 289 Judicious Antibiotic Use and Intranasal Corticosteroids in Acute Rhinosinusitis Catherine Butkus Small, Claus Bachert, Valerie J. Lund, Augustine Moscatello, Anjuli S. Nayak, and William E. Berger Even though many cases are secondary to viral infections, acute rhinosinusitis is often treated with antibiotics. Recent studies have documented that inhaled corticosteroids in combination with antibiotics or as monotherapy provide significant symptom relief and resolution of acute rhinosinusitis. 295 Guideline for Low-Cost Antimicrobial Use in the Outpatient Setting Lizbeth A. Hansen, Lee C. Vermeulen, Sarah Bland, and Tosha B. Wetterneck The authors have created a guideline for the use of less expensive but efficacious antibiotics in the management of common infections. 303 Contemporary Empyema Necessitatis Scott A. Kono and Trenton D. Nauser Empyema infection may extend beyond the pleural space and into the chest wall. Early diagnosis, combined with effective antimicrobial therapy as well as early surgical drainage can result in marked improvement in prognosis for these patients. A6 DIAGNOSTIC DILEMMAS 316 Too Much of a Good Thing Lisa Call Pastel and Jonathan M. Ross 319 A Case for Vaccination Aima Ahonkai and Noah Lechtzin IMAGES IN DERMATOLOGY 322 Mystery of the Silk Road John Patrick Welsh, Christopher B. Skvarka, Christine Ko, and Carrie Ann Cusack ECG IMAGE OF THE MONTH 325 A Racing Heart Julia H. Indik IMAGES IN RADIOLOGY 328 A Complication of Forceful Nose-Blowing Amy Fix and Valerie J. Lang CLINICAL RESEARCH STUDIES 330 Vitamin and Micronutrient Intake and the Risk of Community-Acquired Pneumonia in US Women Mark I. Neuman, Walter C. Willett, and Gary C. Curhan 364 Outbreak of Pertussis on a College Campus Allen S. Craig, Seth W. Wright, Kathryn M. Edwards, John W. Greene, MaryLou Haynes, Anthony D. Dake, and William Schaffner Pertussis is not merely an infection of young children. The authors report a substantial outbreak of pertussis infections on a university campus. Guidelines for diagnosis and therapy are suggested. In a large population of healthy women, higher intake of vitamins from diet or supplements did not decrease the risk of pneumonia. Among smoking women, higher intake of foods rich in vitamin E did reduce risk of community-acquired pneumonia. 337 Grip Strength Predicts Cause-Specific Mortality in Middle-Aged and Elderly Persons Hideo Sasaki, Fumiyoshi Kasagi, Michiko Yamada, and Shoichiro Fujita Maximum grip strength is an accurate and consistent predictor of all causes of mortality in middle-aged and elderly individuals. This presumably reflects their level of frailty. 343 Thyroid Hormone Use, Hyperthyroidism and Mortality in Older Women Douglas C. Bauer, Nicolas Rodondi, Katie L. Stone, and Teresa A. Hillier AJM ONLINE CLINICAL RESEARCH STUDIES 369 Prognostic Stratification of Patients with LeftSided Endocarditis Determined at Admission José Alberto San Román, Javier López, Isidre Vilacosta, Marı́a Luaces, Cristina Sarriá, Ana Revilla, Ricardo Ronderos, Walter Stoermann, Itziar Gómez, and Francisco Fernández-Avilés The prognosis for patients with left-sided endocarditis can be predicted from easily obtained clinical variables including the presence of heart failure and myocardial abscess at the time of presentation. The use of thyroid hormone replacement in older women carries no prognostic significance. However, previous history of hyperthyroidism may be associated with a small increase in all-cause and cardiovascular mortality. 350 TB in a Low-Incidence Country: Differences Between New Immigrants, Foreign-Born Residents and Native Residents Gerd Laifer, Andreas F. Widmer, Mathew Simcock, Stefano Bassetti, Andrej Trampuz, Reno Frei, Michael Tamm, Manuel Battegay, and Ursula Fluckiger 369 Does Statin Therapy Decrease the Risk for Bleeding in Patients Who Are Receiving Warfarin? James D. Douketis, Magda Melo, Chaim M. Bell, and Muhammad M. Mamdani Long-term statin therapy was associated with a reduced risk of bleeding in patients who were receiving warfarin for atrial fibrillation. New immigrants may harbor active but clinically quiescent tuberculosis infections. Rapid diagnostic tests may be negative, and drug resistance is more common in these patients than in nativeborn individuals. The following articles are available only in the online version of the Journal. 357 Coronary Ischemic Events after First Atrial Fibrillation: Risk and Survival Yoko Miyasaka, Marion E. Barnes, Bernard J. Gersh, Stephen S. Cha, Kent R. Bailey, James B. Seward, Toshiji Iwasaka, and Teresa S. M. Tsang New onset of atrial fibrillation is a marker for the presence of coronary artery disease. In women, new atrial fibrillation in the presence of ischemic heart disease augurs a worsened prognosis. CLINICAL COMMUNICATION TO THE EDITOR e1 An Unusual Case of Dysphagia and Chest Pain in a Non–HIV Patient: Esophageal Tuberculosis Bobbak Vahid, Nazmul Huda, and Ali Esmaili A9 ERRATA e3 Errata e17 Porcelain Gallbladder and Cancer: Ethnicity Explains a Discrepant Literature? Steven C. Cunningham and H. Richard Alexander LETTERS e5 Dosing Frequency of Aspirin and Prevention of Heart Attacks and Strokes John K. Amory and David W. Amory e7 The Reply James E. Dalen e9 Enteric Coated Aspirin Charles M. Grossman BRIEF OBSERVATION 370 Late Diagnosis of HIV Infection: The Role of Age and Sex Michael J. Mugavero, Chelsea Castellano, David Edelman, and Charles Hicks Delayed diagnosis of HIV infection is more common in the elderly and in women. It is important to recognize this population at risk in order to make an earlier diagnosis of HIV infection. e11 Prehypertension and Elevated Risk of Cardiovascular Disease: Physiopathologic Mechanisms Flora Affuso, Antonio Ruvolo, and Serafino Fazio e13 The Safety of Levofloxacin in Patients on Warfarin Jeffrey J. Glasheen and Allan V. Prochazka e15 The Reply Chaim M. Bell, Lynfa F. Stroud, Alex Kopp, and Muhammad M. Mamdami A10 APM PERSPECTIVES 374 The Lost Art of Clinical Skills Christopher A. Feddock CLASSIFIED ADS B1 Positions available The American Journal of Medicine (2007) 120, 287-288 EDITORIAL Peer Review: The Best of the Blemished? One of Winston Churchill’s most memorable quotations comes from a speech to the House of Commons in which he remarked that, “Democracy is the worst form of government except for all the other forms that have been tried.” In my opinion, the same sentiment applies to the peer review process employed by biomedical academic journals. As is the case for Churchill’s democracy, there can be little doubt that peer review, as currently practiced, has flaws. Its dual purpose is to assess the quality of manuscripts and to help authors improve those manuscripts. Most editors of medical journals believe that employing a wide array of specialty reviewers is of considerable value in appraising submissions. In addition, many authors— but not all—are grateful for constructive criticisms that result in improvements to their published work. In recent years, both editors and scientists have begun to examine the peer review process to elucidate bias and error in the system.1-7 As might be expected, 2 reviewers examining the same manuscript might express diametrically opposed views. Indeed, it is not uncommon for me to see one reviewer suggest acceptance while another counsels against it. Studies of the reproducibility of peer review based on critiques of the same manuscript by different reviewers have demonstrated considerable disparities between reviewers’ responses.5 Another failing, aside from inconsistency, is delayed decision-making. Although computerization of the review process has shortened the time between author submission and an editorial decision, significant slow-downs continue to exist. Other commonly cited defects in the peer review system include reviewer bias, conflict of interest, expense, and even occasional instances of reviewer dishonesty or abuse of the author. Bias exists in all human thinking, and a number of studies have documented bias in the peer review process. Such bias may be based on the gender or national origin of the author, or it may relate to previously held prejudices concerning the type of work described or the methodology employed in the study. Today, potential conflicts of interest are generally an issue in biomedical research as well. Conflicts may be financial or may relate to other factors, such as concerns about career advancement or jealousy.8 Scientific misconduct also has been documented in the peer review process. There have been a number of well0002-9343/$ -see front matter © 2007 Elsevier Inc. All rights reserved. doi:10.1016/j.amjmed.2007.02.013 publicized examples of plagiarism of ideas and of components of a peer-reviewed manuscript. Finally, the peer review system often fails to uncover examples of scientific fraud on the part of a paper’s authors until 1 or more manuscripts already have been published and subsequently shown to be false. The recent Korean stem-cell scandal received front-page coverage in almost every major newspaper in the world. Some have argued that the falsified publications of Dr. Hwang Woo-Suk in Science during 2004 and 2005 demonstrated the weakness of the present peer review mechanism. However, the opposite argument also has been advanced. In the end, peer review triumphed when Dr. Hwang Woo-Suk’s work was shown to contain falsified data. Can the process be improved? Given the many potential problems and abuses attributed to peer review, it is surprising that the system, though deemed to be faulty, has generally functioned well.1,2 It remains the “standard of care” for most biomedical journals published today. A number of editors and academicians have suggested reforms aimed at improving the identified shortcomings of peer review. Double-blinding of the review process; open reviews published on the Internet alongside the author’s response; and focused reviewer training have been suggested and evaluated in a handful of small trials.3,9 Few existing studies have assessed the efficacy and accuracy of the peer review process.5 Moreover, the results of these small trials often have produced conflicting conclusions. No suggested improvement has emerged as the answer to previously enumerated deficiencies. So what is an editor to do? In the final analysis, I have come to believe that like the democratic system, peer review is an imperfect arrangement, but it is better than anything else that has been previously tried. Reviewers are rarely remunerated for their work, and to my knowledge, there is no current movement to change the situation. If they were paid, the annual expense would be enormous, and the readership would likely be required to contribute. At The American Journal of Medicine, we remain indebted to colleagues who serve as reviewers. We also owe a debt of gratitude to readers who share their comments on manuscripts that we have published—this is another form of peer review. As I noted in an earlier editorial, the editors of the Green Journal strive to bring you a 288 The American Journal of Medicine, Vol 120, No 4, April 2007 quality product. Their decisions are based on multiple factors, including, but not limited to, reviewers’ comments. We attempt to anticipate your interest in specific topics, and we also try to publish material that will be of broad interest to the internal medicine community. Overall, the peer review process warrants our confidence; we should trust the reviewers’ and editors’ efforts at objectivity.1,2,10,11 Those of us who participate in the peer review process pledge our honesty. If we fail, it stains our reputations. Similarly, editors and their editorial boards are committed to the highest ideals of academic honesty and scholarship. Undoubtedly, The American Journal of Medicine will continue to rely on the peer-review system when making decisions until a different or modified technique is conclusively proven to be better. Joseph S. Alpert, MD Robert S. and Irene P. Flinn Professor of Medicine Special Assistant to the Dean University of Arizona College of Medicine Tucson [email protected] References 1. Smith R. Peer review: a flawed process at the heart of science and journals. J R Soc Med. 2006;99:178-182. 2. Hojat M, Gonnella JS, Caelleigh AS. Impartial judgment by the “gatekeepers” of science: fallibility and accountability in the peer review process. Adv Health Sci Educ Theory Pract. 2003;8:75-96. 3. Jefferson T, Alderson P, Wager E, Davidoff F. Effects of editorial peer review: a systematic review. JAMA. 2002;287:2784-2786. 4. Kearney MH, Freda MC. Nurse editors’ views on the peer review process. Res Nurs Health. 2005;28:444-452. 5. Kumar PD. How do peer reviewers of journal articles perform? Evaluating the reviewers with a sham paper. J Assoc Physicians India. 1999;47:198-200. 6. Burnham JC. The evolution of editorial peer review. JAMA. 1990;263: 1323-1329. 7. Olson CM. Peer review of the biomedical literature. Am J Emerg Med. 1990;8:356-358. 8. Alpert JS, Furman S, Smaha L. Conflicts of interest: science, money, and health. Arch Intern Med. 2002;162:635-637. 9. Godlee F. Making reviewers visible: openness, accountability, and credit. JAMA. 2002;287:2762-2765. 10. Alpert, JS. Dear editor. Am J Med. 2006;119;193. 11. Freshwater D. Editors and publishing: integrity, trust, and faith. J Psychiatr Ment Health Nurs. 2006;13:1-2. The American Journal of Medicine (2007) 120, 289-294 REVIEW Judicious Antibiotic Use and Intranasal Corticosteroids in Acute Rhinosinusitis Catherine Butkus Small, MD,a Claus Bachert, MD, PhD,b Valerie J. Lund, MS, FRCS, FRCSEd,c Augustine Moscatello, MD,d Anjuli S. Nayak, MD,e William E. Berger, MD, MBAf a Division of Infectious Diseases, Department of Medicine, New York Medical College, Westchester Medical Center, Valhalla; University of Ghent, Ghent, Belgium; cRoyal National Throat, Nose & Ear Hospital, London, England; dDepartment of Otolaryngology/Head and Neck Surgery, New York Medical College, Westchester Medical Center, Valhalla; eDepartment of Pediatrics, University of Illinois College of Medicine, Peoria; fDepartment of Pediatrics, Division of Allergy and Immunology, University of California, Irvine College of Medicine, Irvine. b ABSTRACT Most patients with symptoms of acute rhinosinusitis are treated with antibiotics. However, many cases of rhinosinusitis are secondary to viral infections and unlikely to benefit from antibiotic therapy. Inappropriate use of antibiotics in patients with acute nonbacterial rhinosinusitis contributes to the increase in bacterial antibiotic resistance. Consequently, safe and effective alternatives to antibiotics are needed in the treatment of acute rhinosinusitis caused by viral infections. Recent results from controlled trials have shown that intranasal corticosteroids, used in combination with antibiotics or as monotherapy in selected cases, provide significant symptom relief and resolution of acute rhinosinusitis. The use of intranasal corticosteroids in acute rhinosinusitis therefore might reduce the inappropriate use of antimicrobial therapy in acute rhinosinusitis. © 2007 Elsevier Inc. All rights reserved. KEYWORDS: Bacterial; Infection; Intranasal corticosteroids; Resistance; Rhinosinusitis; Viral Acute rhinosinusitis is a common upper respiratory tract infection seen in ambulatory practice in the United States.1 Annual crude adult rhinosinusitis prevalence rates range from 14% to 16%.2-4 Total costs related to sinusitis as a primary or secondary diagnosis approached $5.8 billion in one study.5,6 Rhinosinusitis is currently the preferred term because sinusitis is invariably accompanied by nasal airway inflammation and often preceded by rhinitis.2,5,7-9 Rhinosinusitis is classified as acute (symptoms ⬍4 weeks), subacute (symptoms 4-12 weeks), and chronic (symptoms ⬎12 weeks),7,10,11 with some patients experiencing recurrent attacks (ⱖ4 episodes yearly ⱖ 7 days).7 Definitive prevalence rates are lacking because of inconsistencies in definitions and because not all patients seek professional care.5 Rhinosinusitis may be viral, bacterial, or allergic.8 Frequently, Requests for reprints should be addressed to Catherine Butkus Small, MD, Division of Infectious Diseases, Munger Pavilion 245, Westchester Medical Center, Valhalla, NY 10595. E-mail address: [email protected]. 0002-9343/$ -see front matter © 2007 Elsevier Inc. All rights reserved. doi:10.1016/j.amjmed.2006.08.035 acute rhinosinusitis is caused by a viral infection,8,12 which may be complicated by a secondary bacterial infection5,12-15; representing approximately 20 million cases of acute bacterial rhinosinusitis annually.13,16,17 However, only approximately 38% of adults presenting with symptoms of rhinosinusitis actually may have acute bacterial rhinosinusitis.18 Guidelines for the diagnosis and treatment of acute rhinosinusitis provide algorithms to improve treatment outcomes and decrease costs.16,17,19 Despite this, approaches used by physicians to diagnose and treat acute rhinosinusitis vary. One survey indicated substantial differences in physicians’ use of diagnostic tools, prescription of antibiotics, and referrals to specialists.20 Antibiotics are frequently prescribed for acute rhinosinusitis, even though the cause may be viral. As a result, empiric antibiotic therapy has increased, contributing to the current increase in drug resistance among respiratory pathogens.12,21 Increasing bacterial resistance, coupled with the decrease in development of new antibiotics, signals a need for interventions to control the increase in 290 morbidity resulting from ineffective antimicrobial therapy for acute rhinosinusitis.22 This article reviews the pathophysiology, cause, clinical characteristics, differential diagnosis, and treatment of acute rhinosinusitis. It also discusses alternative approaches to its management, focusing on intranasal corticosteroids as both adjunctive treatment and monotherapy. The American Journal of Medicine, Vol 120, No 4, April 2007 Guidelines for Diagnosis of Acute Rhinosinusitis Parameters for the diagnosis and management of acute rhinosinusitis were updated recently by the American Academy of Allergy, Asthma, and Immunology; the American College of Allergy, Asthma, and Immunology; and the Joint Council of Allergy, Asthma, and ImmunolCLINICAL SIGNIFICANCE ogy.16 The European Academy of ● Most cases of acute rhinosinusitis are Allergology and Clinical ImmunolPATHOPHYSIOLOGY OF viral and therefore do not respond to ogy developed similar guidelines.9 ACUTE RHINOSINUSITIS The main clinical characterisantibiotics. Acute rhinosinusitis is charactertics of acute rhinosinusitis include ized by inflammation of the para● Inappropriate treatment of acute rhinonasal congestion, facial pain nasal sinuses, most commonly the sinusitis with antibiotics contributes to and/or pressure, rhinorrhea, postmaxillary and ethmoid sinuses antibiotic resistance. nasal drainage, headache, and 7,10,23 (Figure 1). Factors contribcough. Symptoms in children are ● Intranasal corticosteroids are an effecuting to the development of rhinosimilar but include prolonged sinusitis include viral, bacterial, tive and safe treatment for acute rhinocoughing, irritability, and gagging and, infrequently, fungal infecsinusitis in combination with antibiotics on mucus, leading to vomittions; allergic and immunologic or, in selected cases, as monotherapy. 16,26 ing. A position paper enreactions; and noninfectious facdorsed by the Centers for Disease ● The use of intranasal corticosteroids in tors, including gastroesophageal Control and Prevention, the Amer8 the treatment of acute rhinosinusitis reflux disease. Perennial allergic ican Academy of Family Physimight help reduce the incidence of anrhinitis also may be a predisposing cians-American Society of Interfactor because allergic rhinitis tibiotic resistance. nal Medicine, and the Infectious may contribute to rhinosinusitis in Diseases Society of America reup to 30% of patients with acute ported 4 signs and symptoms most maxillary rhinosinusitis and up to 8,24,25 predictive of acute bacterial rhinosinusitis, including puru80% of patients with chronic rhinosinusitis. lent nasal discharge, maxillary tooth or facial pain (espeDifferentiating viral rhinosinusitis from bacterial rhinocially unilateral), unilateral maxillary sinus tenderness, and sinusitis is a diagnostic challenge because of their similar worsening symptoms after initial improvement.27 The presentations and the insufficient specificity and sensitivity 17 symptoms of chronic rhinosinusitis are more subtle.16 Raof current diagnostic imaging. The overlap among sympdiographic imaging confirms acute rhinosinusitis in patients toms of acute viral upper respiratory tract infections, seawhose symptoms are vague or persist after therapy, or who sonal and perennial allergic rhinitis, vasomotor rhinitis, and have ambiguous physical findings. Computed tomography rhinitis medicamentosa with symptoms of acute bacterial is currently the preferred radiographic modality.16 rhinosinusitis also makes an accurate diagnosis problematic. Figure 1 Anatomy of the paranasal sinuses. (Reproduced with permission from: Nose and paranasal sinus. In: The Merck Manual of Diagnosis and Therapy. Available at: http://www.merck.com/mrkshared/mmanual/figures/86fig1.jsp. Accessed March 6, 2006.) Small et al Management of Acute Rhinosinusitis 291 Figure 2 Algorithm for differentiating bacterial and viral rhinosinusitis and for the primary care management of rhinosinusitis. (Reproduced with permission from: Sande MA, Gwaltney JM. Acute community-acquired bacterial sinusitis: continuing challenges and current management. Clin Infect Dis. 2004;39(suppl 3):S151-S158.) CT ⫽ computed tomography; ENT ⫽ ear, nose, and throat. Differentiating viral from bacterial rhinosinusitis is complicated because viral infection often precedes bacterial infection.8 Sinus puncture and culture is the gold standard for microbial identification, but its routine use is not recommended.12,17 Microbiologic assessment of direct cultures by nasopharyngeal swabs and endoscopic sampling of the middle meatus is less invasive but may not provide a definitive diagnosis. Thus, the most common diagnostic course in the office setting involves medical history and clinical signs and symptoms.12 Duration of symptoms is the most common way physicians differentiate between acute viral and bacterial rhinosinusitis. Symptoms associated with acute bacterial rhinosinusitis worsen after 5 to 7 days or persist for more than 10 days but less than 12 weeks.2 Other studies suggest that a 7- to 10-day duration of acute rhinosi- nusitis may provide a “natural breakpoint,” with acute bacterial rhinosinusitis more likely when symptoms do not improve or worsen after this time interval (Figure 2).5,10,12,16 MANAGEMENT OF PATIENTS WITH ACUTE RHINOSINUSITIS Symptoms resolve without antibiotics in most patients with acute rhinosinusitis.10,27 However, acute rhinosinusitis also is associated with significant physical symptoms, deteriorating quality of life, and impairment of daily functioning, inducing patients to seek treatment.8 It is unclear which cases will resolve spontaneously.5 Of treated cases of acute rhinosinusitis, 85% to 98% of those managed in the primary care setting are given antibiotics.17 Given that 292 most infections are viral, the high percentage of reported antibiotic prescriptions suggests that antibiotics are overused.12,28,29 Antibiotic Therapy The goals of treating acute bacterial rhinosinusitis include diminishing tissue edema, reversing sinus ostial obstruction, and controlling infection.30 Antimicrobial therapy is often empiric. The European Academy of Allergology and Clinical Immunology recommends that adults with mild symptoms receive symptomatic relief and that patients with moderate-to-severe symptoms receive intranasal corticosteroids.9 If symptoms worsen after 5 to 7 days or persist after more than 10 days and are moderate or severe, antibiotic therapy should be initiated.9 Although current American treatment guidelines are similar,12,16 exceptions include patients with specific physical findings or serious complications. In these cases, antibiotics should be started immediately. Infection with resistant pathogens should be considered if symptoms do not improve after 3 to 5 days of antibiotics.12 Although unnecessary antibiotics contribute to antimicrobial resistance,27 antibiotics are appropriate in certain patients, including those with acute bacterial infection, meningeal or orbital complications, and immunocompromised or hospitalized patients.12,31 Antibiotics should be active against Streptococcus pneumoniae, Haemophilus influenzae, and Moraxella catarrhalis.5,12 However, there is increasing bacterial resistance, especially in S. pneumoniae, to amoxicillin and other -lactams, trimethoprim/sulfamethoxazole, and macrolides.32 Therefore, the narrowest spectrum antibiotic effective against these pathogens should be used. Amoxicillin, amoxicillin/clavulanate, cefpodoxime proxetil, cefdinir, and cefuroxime axetil are currently recommended as first-line antibiotics in acute bacterial rhinosinusitis.8,17 Other treatments are also recommended for acute rhinosinusitis. Guidelines recommend that patients with uncomplicated acute rhinosinusitis be managed symptomatically, including antihistamines or decongestants, although antihistamines are recommended only for suspected allergy.16 Mucolytics, saline lavage, expectorants, and homeopathic or herbal medications are not efficacious.9,33 Decongestants reduce turbinate swelling and improve nasal patency.9,33 However, prolonged use (⬎3 days) may result in rebound congestion.34 In acute bacterial rhinosinusitis, a shorter duration of antibiotic treatment is possible, thereby decreasing resistance and costs.12,35 One study compared trimethoprim/ sulfamethoxazole given for 3 days versus 10 days in acute bacterial rhinosinusitis with similar success rates.36 Long-term antibiotics often lead to decreased patient compliance, antibiotic resistance, and increased costs.12 These data support a conservative approach to antibiotics in acute rhinosinusitis. The American Journal of Medicine, Vol 120, No 4, April 2007 The Role of Intranasal Corticosteroids The rationale for intranasal corticosteroids in acute rhinosinusitis resides in their anti-inflammatory properties. Intranasal corticosteroids are a first-line treatment for allergic rhinitis, which may be a predisposing factor for acute rhinosinusitis.24 Inflammation and edema of the mucous membranes of the nasal turbinates and sinus ostia block drainage routes and impair mucociliary clearance mechanisms. By reducing inflammation, intranasal corticosteroids foster drainage and increased aeration.37,38 Many recent studies support the benefits of intranasal corticosteroids as adjuncts to antimicrobial therapy in acute bacterial rhinosinusitis.37-39 In a study of children with acute rhinosinusitis, treatment with amoxicillin/clavulanate for 3 weeks and twice-daily budesonide nasal spray led to significant improvements in cough and nasal discharge compared with amoxicillin/clavulanate alone (P ⬍.05).37 In another study, patients aged 12 years or more with acute bacterial rhinosinusitis confirmed by sinus computed tomography scan were treated with amoxicillin/ clavulanate plus placebo or mometasone furoate nasal spray (MFNS) twice daily. Symptom scores revealed that MFNS treatment decreased the total symptom score and individual scores for headache, congestion, and facial pain versus placebo (P ⬍.05).39 Similar results were obtained in outpatients with moderate-to-severe rhinosinusitis treated with MFNS plus amoxicillin/clavulanate for 3 weeks.40 Thus, adding intranasal corticosteroids to antibiotics produces a significant benefit. Monotherapy with Intranasal Corticosteroids Because intranasal corticosteroids are an effective adjunctive therapy for acute bacterial rhinosinusitis, they may have potential as monotherapy for acute rhinosinusitis. One recent trial concluded that MFNS was an effective monotherapy in patients with acute uncomplicated rhinosinusitis.41 The efficacy of MFNS as monotherapy versus amoxicillin and placebo was evaluated in 981 subjects aged 12 years or more with acute rhinosinusitis for 7 or more but 28 or less days. Patients with acute bacterial rhinosinusitis were excluded. MFNS 200 g twice daily was superior to placebo alone and amoxicillin alone in improving symptom scores (P ⬍.001 and P ⫽ .002, respectively) (Figure 3). The greatest symptom improvement was for night waking, a significant finding given the prevalence of sleep impairment in these patients. Safety Studies show that intranasal corticosteroids are safe and well tolerated in patients with acute rhinosinusitis. The incidence of adverse events was similar to placebo.41 Common adverse events were headache and epistaxis. A recent study of intranasal corticosteroids and nasal polyps also supports their safety.42 Intranasal corticosteroids in pediatric patients do not change baseline cortisol levels or blunt the response to Small et al Management of Acute Rhinosinusitis 293 Figure 3 Efficacy of MFNS as monotherapy in patients with acute rhinosinusitis. (Reproduced with permission from: Meltzer EO, Bachert C, Staudinger H. Treating acute rhinosinusitis: comparing efficacy and safety of MFNS, amoxicillin, and placebo. J Allergy Clin Immunol. 2005;116:1289-1295.) MFNS ⫽ mometasone furoate nasal spray. cosyntropin stimulation, and have little systemic absorption or suppression of the hypothalamic-pituitary-adrenal axis.43,44 Examination of nasal biopsy specimens after 1 year of therapy with MFNS in 1 study revealed a decrease in focal metaplasia, no change in epithelial thickness, and no atrophy.45 CONCLUSIONS Although many patients with acute rhinosinusitis do not seek medical care, millions consult physicians each year requesting treatment and are inappropriately given antibiotics.46 Patients with a cold or flu-like illness for less than 7 days are unlikely to have a bacterial infection and should not receive antibiotics.12 The inappropriate use of antibiotics can be reduced by better differentiation of acute bacterial and viral rhinosinusitis.47 In patients who require antibiotics, selection of an appropriate agent and a shorter duration of therapy is important in preventing resistance.48 Studies reveal that the administration of intranasal corticosteroids with antibiotics provides significant symptom relief in patients with acute bacterial rhinosinusitis. Because most cases of acute rhinosinusitis are viral and do not respond to antibiotics, much of the benefit associated with this combination may be related to intranasal corticosteroids alone. This suggestion is supported by a recent study showing that monotherapy with intranasal corticosteroids was superior to antibiotics alone as empiric treatment. The efficacy of intranasal corticosteroids as monotherapy for acute rhinosinusitis and their well-documented safety in adult and pediatric patients suggest that intranasal corticosteroids may be a useful alternative to antimicrobial therapy in the treatment of acute rhinosinusitis, and may contribute to a decrease in the inappropriate prescribing of antibiotics and to the development of resistance in this common disease. References 1. Schappert SM. Ambulatory care visits to physician offices, hospital outpatient departments, and emergency departments: United States, 1996. Vital Health Stat 13. 1998;134:1-37. 2. Kaliner MA, Osguthorpe JD, Fireman P, et al. Sinusitis: bench to bedside. Current findings, future directions. J Allergy Clin Immunol. 1997;99:S829-S848. 3. National Center for Health Statistics. Health, United States, 2005. With chartbook on trends in the health of Americans. Available at: http://www.cdc.gov/nchs/data/hus/hus05.pdf. Accessed March 6, 2006. 4. Lethbridge-Çejku M, Rose D. Summary health statistics for U.S. adults: National Health Interview Survey, 2004 [provisional data]. Available at: http://www.cdc.gov/nchs/data/series/sr_10/sr10_228.pdf. Accessed March 6, 2006. 5. Poole MD. Acute bacterial rhinosinusitis: clinical impact of resistance and susceptibility. Am J Med. 2004;117(suppl):29S-38S. 6. Ray NF, Baraniuk JN, Thamer M, et al. Healthcare expenditures for sinusitis in 1996: contributions of asthma, rhinitis, and other airway disorders. J Allergy Clin Immunol. 1999;103:408-414. 7. Lanza DC, Kennedy DW. Adult rhinosinusitis defined. Otolaryngol Head Neck Surg. 1997;117:S1-S7. 8. Meltzer EO, Hamilos DL, Hadley JA, et al. Rhinosinusitis: establishing definitions for clinical research and patient care. J Allergy Clin Immunol. 2004;114(suppl):S155-S212. 9. Fokkens W, Lund V, Bachert C, et al. EAACI position paper on rhinosinusitis and nasal polyps executive summary. Allergy. 2005;60: 583-601. 10. Hickner JM, Bartlett JG, Besser RE, et al. Principles of appropriate antibiotic use for acute rhinosinusitis in adults: background. Ann Intern Med. 2001;134:498-505. 11. International Rhinosinusitis Advisory Board. Infectious rhinosinusitis in adults: classification, etiology and management. Ear Nose Throat J. 1997;76(suppl 12):1-22. 12. Sande MA, Gwaltney JM. Acute community-acquired bacterial sinusitis: continuing challenges and current management. Clin Infect Dis. 2004;39(suppl 3):S151-S158. 13. Sinus and Health Partnership. Antimicrobial treatment guidelines for acute bacterial rhinosinusitis. Otolaryngol Head Neck Surg. 2000;123: 1-32. 14. Gwaltney JM Jr. Acute community-acquired sinusitis. Clin Infect Dis. 1996;23:1209-1223. 15. Berg O, Carenfelt C, Rystedt G, et al. Occurrence of asymptomatic sinusitis in common cold and other acute ENT-infections. Rhinology. 1986;24:223-225. 16. Slavin RG, Spector SL, Bernstein IL, et al. The diagnosis and management of sinusitis: a practice parameter update. J Allergy Clin Immunol. 2005;116(suppl 6):S13-S47. 294 17. Sinus and Allergy Health Partnership. Antimicrobial treatment guidelines for acute bacterial rhinosinusitis. Otolaryngol Head Neck Surg. 2004;130(suppl 1):1-45. 18. Lau J, Zucker D, Engels EA, et al. Diagnosis and treatment of acute bacterial rhinosinusitis. Evid Rep Technol Assess (Summ). 1999:1-3. 19. McCracken GH Jr. Clinical practice guidelines for the diagnosis and treatment of respiratory tract infections. Am J Manag Care. 2001; 7(suppl 6):S183-S191. 20. Trinh N, Ngo HH. Practice variations in the management of sinusitis. J Otolaryngol. 2000;29:211-217. 21. Karchmer AW. Increased antibiotic resistance in respiratory tract pathogens: PROTEKT US—an update. Clin Infect Dis. 2004;39(suppl 3):S142-S150. 22. Weber JT. Appropriate use of antimicrobial drugs: a better prescription is needed. JAMA. 2005;294:2354-2356. 23. Nose and paranasal sinus. In: The Merck Manual of Diagnosis and Therapy. Available at: http://www.merck.com/mrkshared/mmanual/ figures/86fig1.jsp. Accessed March 6, 2006. 24. Meltzer EO, Szwarcberg J, Pill MW. Allergic rhinitis, asthma, and rhinosinusitis: diseases of the integrated airway. J Manag Care Pharm. 2004;10:310-317. 25. Spector SL. Overview of comorbid associations of allergic rhinitis. J Allergy Clin Immunol. 1997;99:S773-S780. 26. American Academy of Pediatrics. Subcommittee on Management of Sinusitis and Committee on Quality Improvement. Clinical practice guideline: management of sinusitis. Pediatrics. 2001;108:798-808. 27. Gonzales R, Bartlett JG, Besser RE, et al. Principles of appropriate antibiotic use for treatment of acute respiratory tract infections in adults: background, specific aims and methods. Ann Intern Med. 2001; 134:479-486. 28. Stalman W, van Essen GA, van der Graaf Y, de Melker RA. The end of antibiotic treatment in adults with acute sinusitis-like complaints in general practice? A placebo-controlled double-blind randomized doxycycline trial. Br J Gen Pract. 1997;47:794-799. 29. van Buchem FL, Knottnerus JA, Schrijnemaekers VJJ, Peeters MF. Primary-care-based randomised placebo-controlled trial of antibiotic treatment in acute maxillary sinusitis. Lancet. 1997;349:683-687. 30. Osguthorpe JD. Adult rhinosinusitis: diagnosis and management. Am Fam Physician. 2001;63:69-76. 31. Bachert C, Hörmann K, Mösges R, et al. An update on the diagnosis and treatment of sinusitis and nasal polyposis. Allergy. 2003;58:176191. 32. Felmingham D, Reinert RR, Hirakata Y, et al. Increasing prevalence of antimicrobial resistance among isolates of Streptococcus pneumoniae from the PROTEKT surveillance study, and comparative in vitro activity of the ketolide, telithromycin. J Antimicrob Chemother. 2002; 50(suppl S1):25-37. 33. University of Michigan Health System Guidelines for Clinical Care. Acute rhinosinusitis in adults. Available at: http://www.mcare.org/ media/pdf_autogen/cpg_rhinosinusitis.pdf. Accessed May 1, 2006. The American Journal of Medicine, Vol 120, No 4, April 2007 34. Spector SL, Bernstein IL, Li JT, et al. Parameters for the diagnosis and management of sinusitis. J Allergy Clin Immunol. 1998;102:S107S144. 35. Pichicero M. Short courses of antibiotic in acute otitis media and sinusitis infections. J Int Med Res. 2000;28(suppl 1):25A-36A. 36. Williams JW Jr, Holleman DR Jr, Samsa GP, et al. Randomized controlled trial of 3 vs 10 days of trimethoprim/sulfamethoxazole for acute maxillary sinusitis. JAMA. 1995;273:1015-1021. 37. Barlan IB, Erkan E, Bakir M, et al. Intranasal budesonide spray as an adjunct to oral antibiotic therapy for acute sinusitis in children. Ann Allergy Asthma Immunol. 1997;78:598-601. 38. Meltzer EO, Orgel HA, Backhaus JW, et al. Intranasal flunisolide spray as an adjunct to oral antibiotic therapy for sinusitis. J Allergy Clin Immunol. 1993;92:812-823. 39. Meltzer EO, Charous BL, Busse WW, et al, and the Nasonex Sinusitis Group. Added relief in the treatment of acute recurrent sinusitis with adjunctive mometasone furoate nasal spray. J Allergy Clin Immunol. 2000;106:630-637. 40. Nayak AS, Settipane GA, Pedinoff A, et al, for the Nasonex Sinusitis Group. Effective dose range of mometasone furoate nasal spray in the treatment of acute rhinosinusitis. Ann Allergy Asthma Immunol. 2002; 89:271-278. 41. Meltzer EO, Bachert C, Staudinger H. Treating acute rhinosinusitis: comparing efficacy and safety of mometasone furoate nasal spray, amoxicillin, and placebo. J Allergy Clin Immunol. 2005;116:12891295. 42. Small CB, Hernandez J, Reyes A, et al. Efficacy and safety of mometasone furoate nasal spray in nasal polyposis. J Allergy Clin Immunol. 2005;116:1275-1281. 43. Brannan MD, Herron JM, Affrime MB. Safety and tolerability of once-daily mometasone furoate aqueous nasal spray in children. Clin Ther. 1997;19:1330-1339. 44. Daley-Yates PT, Kunka RL, Yin Y, et al. Bioavailability of fluticasone propionate and mometasone furoate aqueous nasal sprays. Eur J Clin Pharmacol. 2004;60:265-268. 45. Minshall E, Ghaffar O, Cameron L, et al. Assessment by nasal biopsy of long-term use of mometasone furoate aqueous nasal spray (Nasonex) in the treatment of perennial rhinitis. Otolaryngol Head Neck Surg. 1998;118:658-664. 46. Butler CC, Kinnersley P, Prout H, et al. Antibiotics and shared decision-making in primary care. J Antimicrob Chemother. 2001;48:435440. 47. Turnidge J. Responsible prescribing for upper respiratory tract infections. Drugs. 2001;61:2065-2077. 48. Brook I, Gooch WM 3rd, Jenkins SG, et al. Medical management of acute bacterial sinusitis. Recommendations of a clinical advisory committee on pediatric and adult sinusitis. Ann Otol Rhinol Laryngol. 2000;109:2-20. The American Journal of Medicine (2007) 120, 295-302 REVIEW Guideline for Low-Cost Antimicrobial Use in the Outpatient Setting Lizbeth A. Hansen, PharmD,a,b Lee C. Vermeulen, MS, RPh,a,b Sarah Bland, RPh,a Tosha B. Wetterneck, MDc a c Department of Pharmacy, University of Wisconsin Hospital and Clinics; bSchool of Pharmacy, University of Wisconsin-Madison; Department of Medicine, University of Wisconsin School of Medicine and Public Health, Madison. ABSTRACT In an effort to increase appropriate prescribing of low-cost antimicrobials in the outpatient setting, an evidence-based guideline was created to identify situations when low-cost medications can be used. A literature search identified relevant clinical trials describing the efficacy of antimicrobials used in the outpatient setting. These were analyzed to identify low-cost medications defined as $15 or less. The information was put into guideline format that includes the level of evidence for recommending the drug and information about cost. Sixteen common infections and their treatments were included in the guideline. The efficacy data were similar for the low-cost and higher-cost antimicrobials for all infections included. We created a low-cost antimicrobial guideline for common infections treated in the outpatient setting. The treatment options have similar efficacy to higher cost medications. This guideline will serve as an information source for providers to help them rapidly determine the low-cost treatments for common infections. In addition, it can serve as a template for the development of similar guidelines in other therapeutic classes. These guidelines should be customized before implementation at other health care organizations, with consideration of local resistance patterns, drug availability and patient factors. The effect of guideline implementation on future prescribing habits and providers’ opinions about availability of cost information and subsequent conversations with patients and prescribers of medications deserves further study. © 2007 Elsevier Inc. All rights reserved. KEYWORDS: Low-cost antimicrobials; Clinical practice guideline; Outpatient infections The financial impact on patients of purchasing medications is a problem of increasing significance. The prevalence of uninsured and underinsured patients in our healthcare system has been well documented. One of every 3 Americans under the age of 65 years was uninsured at some time in 2002-2003.1 Even those fortunate enough to receive health insurance as a benefit of employment have experienced increasing out-of-pocket expense for the care they receive as employers reduce coverage to manage ongoing premium increases.2 These issues not only cause patients economic distress, but also have the ability to negatively impact clinLee Vermeulen is a member of speaker’s bureaus and/or receives research funding from Pfizer Labs and Amgen. Requests for reprints should be addressed to Tosha Wetterneck, MD, University of Wisconsin Hospital and Clinics, 600 Highland Avenue, J5/222b CSC, MC 2454, Madison, WI 53792. E-mail address: [email protected] 0002-9343/$ -see front matter © 2007 Elsevier Inc. All rights reserved. doi:10.1016/j.amjmed.2006.06.012 ical outcomes.3 A recent study showed that 1 in 5 adults (22%) did not fill at least 1 prescription in the previous year because of cost.4 Moreover, conversations about the cost of medications and patients’ out-of-pocket costs occur infrequently despite patients’ interest in discussing this information and physicians’ feelings that this information is important in clinical decision-making.5 Patients most often reported the reason for not initiating these conversations as a feeling of discomfort, believing that the discussion may not lead to a viable alternative or that an alternative might affect the quality of care provided.6 To pay for expensive medications, patients reported borrowing money from friends and family, increasing credit card debt, choosing medications over food or other essentials, as well as decreased overall adherence to all prescribed medications.7-9 Physicians are also hesitant to initiate these important conversations about medication cost. In a survey of outpa- 296 The American Journal of Medicine, Vol 120, No 4, April 2007 tient physicians, the providers stated that they had very little lowest-cost antimicrobials for the treatment of common requisite knowledge or cost-related resources needed to infections while maintaining the highest clinical treatment facilitate cost-effective prescribing.10 However, most phyefficacy. We describe the development of a health system sicians felt that cost information was important and were guideline for primary care providers, house staff, and pharwilling to sacrifice some degree of clinical efficacy to make macist use in the outpatient setting and emergency therapy more affordable for padepartment. tients. It also was reported that physicians learned about cost CLINICAL SIGNIFICANCE METHODS from patients as often as they did The creation of a low-cost antimifrom pharmacists (45% vs 41%, ● Prescribers are often unaware of lowcrobial prescribing guideline was respectively). Other sources of cost treatments. charged by the hospital’s multidiscost information used by physiciplinary Pharmacy and Therapeu● Many common outpatient infections have cians were The Medical Letter on tics Committee. The hospital orgaequally efficacious low-cost therapies. Drugs and Therapeutics, other nization was the sole sponsor of physicians, drug company repre● Low-cost prescribing guidelines can be the guideline. “Low-cost” was desentatives, advertisements, and fined as a total patient payment of created to inform providers and provide 10 journals. Medication cost inforunder $15 per prescription, chosen options for patients. mation is available online or on to be consistent with the general software for personal digital assiscost of generic medications or 11 tants ; however, studies evaluatother co-payments within a multiing clinical use of these medication databases (eg, ePocrates ple-tier formulary, as well as a cost that many patients could Rx Pro) have not found cost information to be a common reasonably afford on an acute basis. An initial search was reason for use.12 Other reasons for physicians not discussing performed for existing literature on similar guidelines. Findcost are: insufficient time during the visit and lack of inforing none, the 2004 Sanford Guide to Antimicrobial Therapy mation regarding alternative low-cost medication to offer.6 was used as an initial resource in order to determine comIn fact, providing medication cost information to internal mon infections that could be managed on an outpatient medicine physicians along with education about insurance basis.19 The guide also details the drug therapy considered coverage and the impact on cost to the patient has been first and second line and includes references of supporting shown to improve physician knowledge of medication costs literature. A literature search was then performed using the and willingness to consider cost when prescribing.13 TherePubMed database to assess the evidence available to support fore, educating providers about the cost of medications and these drug therapy recommendations and to find additional making information about low-cost alternatives easily acevidence on low-cost alternatives that would also be concessible may be an important means to encourage approprisidered effective. Using keywords specific to the individual ate prescribing of inexpensive medications. infection, the search was first limited to practice guidelines. Antimicrobials are an important medication class for the If well-established practice guidelines were not found, the treatment of acute illness. Therefore, the health effects and limits were adjusted for review articles. If review articles health care utilization effects of patients not filling prescripwere not found, a primary literature search was performed. tion medications can be significant, resulting in repeat emerThe search utilized available data through July 2005. Studgency department visits, primary care visits, and readmisies were examined for evidence of antimicrobial efficacy for sion to the hospital.14-17 Often, a less expensive medication medications currently available in the US that fell below the is available that has similar efficacy to the higher cost chosen $15 ceiling. Cost information was based on the medication prescribed.18 Generic medications routinely cost maximum allowable cost for the Wisconsin Medicaid Sysless than brand equivalents with similar potency. Furthertem, a system commonly used to establish reimbursement more, many medication formularies now have tiered paylevels for generic medications filled for Medicaid patients in ment systems where patients benefit from lower co-paythe State of Wisconsin.20 Pharmacies pay widely ranging ments for generic medications or organization-preferred wholesale prices for generic drugs, and maximum allowable medications. cost pricing tables are established by payers to set the Choosing a low-cost medication directly benefits the maximum rate of reimbursement for those agents. We chose patient and serves to lower health care costs in general. We the Wisconsin maximum allowable cost price list as optherefore undertook a systematic process to identify lowposed to average wholesale price for a consistent and accost antimicrobials that have demonstrated clinical effeccessible standard for evaluation of drug prices. tiveness similar to other, higher cost alternatives for treatStrength of recommendation was assigned based on a ment of common infections. The main objective of this scale that rates evidence based on the letters A-D for the guideline was to serve as a reliable resource for low-cost grade, and a number and letter (1a-1c, 2a-2c, 3a-3b, 4 and 5) antimicrobial prescribing information for physicians pracfor the level of evidence.21 An A grade was paired with Level 1 evidence and the letters indicate: systematic review ticing in the outpatient setting. The goal was to identify the Hansen et al Low-Cost Antimicrobial Guideline of randomized controlled trials; individual randomized controlled trials; and all or none studies. The B grade was paired with level 2 and level 3 evidence, with 2a and 3a indicating systematic reviews of cohort studies and casecontrol studies, respectively; 2b and 3b indicating individual cohort studies (including low-quality randomized controlled trials) and case-control studies, respectively; and 2c indicating outcomes research. The C grade was paired with level 4 evidence indicating case series and poor-quality case-control and cohort studies, and the D grade was paired with level 5 evidence indicating expert opinion or based on bench research (Table). Available evidence was reviewed by 1 physician and 2 pharmacists, who then came to a consensus on the assigned strength of recommendation. The Antimicrobial Use Subcommittee of the Pharmacy and Therapeutics Committee, a committee with physician and pharmacist members specializing in infectious diseases, reviewed the guideline and feedback was incorporated into the document. The guideline was then presented to the hospital Pharmacy and Therapeutics Committee for approval. As part of the Committee’s routine guideline implementation approach, print copies of the guideline were distributed to all prescribers (eg, faculty physicians, house staff, and nurse practitioners) and it was posted on the health system intranet website, which is accessible broadly to all staff. Outpatient and emergency department pharmacists were informed as well to allow for suggestions to the prescriber if the patient could not afford a medication at the time of dispensing. The guideline is also being used as an interdisciplinary educational tool for efforts focusing on maximizing the cost effectiveness of anti-infective prescribing. RESULTS The guideline is displayed in table format with suggested low-cost antimicrobial selections organized by body system, followed by common infections within the system that are treated in the outpatient setting (Table). The majority of the recommended medications were accessible to cash-paying patients for under $15 per course (including an appropriate dispensing fee). In certain situations, an inexpensive or generic drug was not an appropriate therapeutic choice, and the medication was noted with a dollar sign ($) to indicate that the cost exceeds the $15. For all noted infections, the strength of recommendations assigned to the low-cost treatments was similar to the strength of recommendations for the more expensive treatment, demonstrating equivalent evidence for both types of recommendations. Therefore, the low-cost antimicrobial guideline goals for creation were achieved. A comments field was also included for information relevant to medication prescription such as length of therapy comments and how resistance patterns may change recommendations. The resultant guideline adhered to the Conference on Guideline Standardization recommendations for guideline reporting in the literature.63 297 DISCUSSION A low-cost antimicrobial guideline was created as a reference for primary care providers and emergency department physicians to provide information about low-cost treatment strategies for common infections that maintain high clinical efficacy. Although generic drug use is increasing, it is apparent that the health care system underutilizes generic substitution as a means of cost saving.18 Analysis of stateby-state Medicaid prescription drug spending in 2000 identified potential savings of $229 million that could have been realized from greater use of generic prescription medication.64 Broad generic substitution of outpatient prescription drugs has been found to save approximately $8.8 billion, or approximately 11% of drug expenditures for adults.18 The translation of generic and low-cost prescribing into clinical practice has been slow, possibly due to the lack of cost information available to physicians and other providers. The driving force behind low-cost prescribing has been the development of drug formularies with tiered co-payments and preferred medications.65 Brand-name medications are heavily promoted via physician detailing and direct-to-consumer advertising while generic medications are no longer advertised. Controversy has begun to surface regarding the benefits of branded medications and whether the newer drugs are really worth their cost.64,66 While it is unlikely that these questions will be definitively answered in the near future, guidelines such as these help to promote the use of generic medications through an evidence-based, multidisciplinary approach to clinical practice. The legal implication of a guideline offering 2 standards of care according to socioeconomic status is an important consideration when creating a “low-cost” guideline. The Center for Medicare and Medicaid does not allow separate standards for treatment of diseases that may discriminate based on patient socioeconomic status. However, low-cost alternatives may be offered if the guideline identifies when high-cost options are preferred due to a difference in clinical efficacy between the low-cost and higher-cost medication, and as long as applicability to broad patient populations is maintained in the guideline. It should be emphasized that, in general, guidelines are designed as educational tools to be used as a reference, but are not legally binding. In addition, it is advantageous to control costs for all patients, not only patients with less ability to pay for health care costs. There are limitations to the generalization of this guideline to other health care organizations. The applicability of medical recommendations in this guideline may depend on local antimicrobial resistance patterns and drug availability. Also, the recommendations in this guideline apply only to immunocompetent, nonpregnant, and nonallergic patients, although we acknowledge that the same treatments may be used in immunocompromised patients. Lastly, although maximum allowable cost was used in this analysis to determine retail drug pricing, US drug prices are proprietary and vary widely by region, so medications may not be as inexpensive as we have outlined in this guideline. 298 Table Low-Cost Antimicrobial Recommendations for Outpatient Infections* Infection Gastroenteritis/GI 1a. Traveler’s Diarrhea – Mild (1-2 stools/ 24 h with minor symptoms)22-24 1b. Traveler’s Diarrhea – Moderate (more than 2 stools within 24 h)22,23 1c. Traveler’s Diarrhea – Severe (fever, bloody stools, more than six stools within 24 h)22,23 Urogenital System 2. Acute (uncomplicated) lower urinary tract infection in women25,26 4. Chlamydial Infection28-30 5. Gonococcal Infection28,31,32 6. Genital Herpes – first episode or episodic antiviral treatment28,33,34 7. Bacterial Vaginosis28,35,36 8. Vulvovaginal Candidiasis28,37,38 9. Trichomonas vaginalis28,39-41 10. Acute or Chronic Bacterial Prostatitis42,43 Comments Fluids only or loperamide hydrochloride 4 mg PO initially, then 2 mg PO after each loose stool to a maximum of 8 mg per day or bismuth subsalicylate 4 tablets PO every half hour, maximum 8 doses (A2a) If no distressing symptoms: Fluids and loperamide or bismuth subsalicylate -if worsening consider single dose ciprofloxacin 500 mg PO If distressing symptoms or critical trip: Oral fluid, ciprofloxacin 500 mg PO BID for 72 h with or without loperamide (A1a) Increase oral fluids, ciprofloxacin 500 mg PO BID for 1-3 days; avoid loperamide (A1a for treatment; D5 for classification of “severe”) ● Do not use loperamide if diarrhea is associated with fever or blood in stool Trimethoprim-sulfamethoxazole (TMP-SMX) 160/800 mg PO BID for 3 days (A1a) ● If TMP-SMX resistance is greater than 20% for community acquired UTI Ciprofloxacin 250 mg PO twice daily for 3 days25 Ciprofloxacin 500 mg PO BID for 10 days (preferred) or trimethoprim-sulfamethoxazole 160/80 mg PO for 14 days (A2a) Doxycycline 100 mg PO BID for 7 days (A1b) Ciprofloxacin 500 mg single dose -if treated or acquired in Hawaii, Asia or Pacific use cefixime 400 mg PO single dose (A1a) Acyclovir 200 mg PO 5 times daily for 5 days (A1b) Metronidazole 500 mg PO BID for 5-7 days or metronidazole 2g PO once (A1a) Clotrimazole 1% cream 5 g intravaginally for 7-14 days ($) or clotrimazole 100 mg 1 vaginal tablet for 7 days or 2 vaginal tablets for 3 days ($) or fluconazole 150 mg oral tablet single dose (A1b) Metronidazole 2 g PO single dose (A1a) or metronidazole 500 mg PO BID for 5-7 days (A1b) Ciprofloxacin 500 mg PO BID for 28 days for acute or 6-12 weeks for chronic (B2b) ● Resistance to fluoroquinolones in Campylobacter is increasingly common ● Fluoroquinolones may not be used for longer than 3 weeks ● If compliance is an issue single-dose azithromycin 1 g ($) may be more costeffective choice (A1b) ● Chlamydial infection accompanies 10-30% of gonococcal infections so routine dual therapy with doxycycline may be cost-effective ● For acute bacterial prostatitis, TMP/SMX 160/ 800 mg PO twice daily may be used as well based on local resistance patterns (B2b) The American Journal of Medicine, Vol 120, No 4, April 2007 3. Uncomplicated acute pyelonephritis in women25-27 Treatment Continued Infection Respiratory Infections 11. Bronchitis44,45 13. Community-Acquired Pneumonia48-57 Routine antibiotic treatment not justified unless pertussis infection is suspected or in the situation of acute exacerbation of chronic bronchitis. (A1a) Penicillin V 250-500 mg PO 3-4 times daily for 10 days (B2b) ● Limit antibiotic prescribing to patients who are most likely to have pharyngitis due to infections with Group A beta-hemolytic streptococcus as evidenced by diagnostic testing and/or 2 or more of the following symptoms: history of fever, tonsillar exudates, no cough, and tender anterior cervical lymphoadenopathy47 ● Group A streptococcal pharyngitis is usually self-limited with symptoms disappearing spontaneously within 3-4 days on onset, even without antibiotics45 ● Antibiotic therapy can safely be postponed for up to 9 days after onset of symptoms and still prevent occurrence of the major nonsuppurative sequela, acute rheumatic fever45 ● Respiratory quinolones are levofloxacin 750 mg PO daily for 5 days or moxifloxacin 400 mg PO daily for 10 days ● Advanced macrolides are azithromycin 500 mg PO on day one then 250 mg PO daily on days 2-5 or clarithromycin 500 mg PO BID for 10-14 days ● Beta-lactams are amoxicillin 1 g PO TID for 10 days amoxicillin/clavulanate extended-release (Augmentin XR) 2 tablets PO BID for 10 days (equals 2 g amoxicillin plus 125 mg clavulanate per dose) 299 ● Previously healthy patient given no recent antibiotic therapy: doxycycline 100 mg PO BID for 10-14 days (A1b) or erythromycin 500 mg PO BID for 10-14 days (A1b) ● Previously healthy patient given recent antibiotic therapy: respiratory quinolone (A1b) ($) or advanced macrolide (A1b) and beta-lactam (A1b) ($) or telithromycin 800 mg PO daily for 7-10 days (A1a) ($) ● Patient with comorbidities (COPD, diabetes, renal or congestive heart failure, or malignancy) given no recent antibiotic therapy: respiratory quinolone (A1b) ($) or advanced macrolide (A1b) ($) or telithromycin 800 mg PO daily for 7-10 days (A1a) ($) ● Patient with comorbidities given recent antibiotic therapy: respiratory quinolone (A1b) ($) or advanced macrolide (A1b) and beta-lactam (A1b) ($) or telithromycin 800 mg PO daily for 7-10 days (A1a) ($) ● Suspected aspiration with infection: clindamycin 300 mg PO four times daily for 10 days (B2a) ($) or amoxicillin/ clavulanate 875/125 mg PO BID for 10 days (A1b) ($) ● Influenza with bacterial superinfection: amoxillicin 1 g PO TID for 10 days or amoxicillin/clavulanate extendedrelease 2 tablets PO BID for 10 days ($) Comments Low-Cost Antimicrobial Guideline 12. Pharyngitis (due to group A streptococci)46,47 Treatment Hansen et al Table 300 Table Continued Infection 58,59 14. Acute Bacterial Sinusitis Skin Infections 15a. Mild to Moderate Inflammatory Acne60 15c. Severe Papulonodular Acne60 16. Early Lyme Disease61,62 Comments Amoxicillin 500 mg PO TID for 10 days (A1a) ● Antibiotic therapy should be reserved for patients with moderately severe symptoms lasting at least 7-10 days who have maxillary pain or tenderness in face or teeth (symptomatic treatment preferred for patients with mild symptoms) Topical benzoyl peroxide 5% plus erythromycin 2% solution applied BID for 8-12 weeks (A1a) ● Treatment continued until no new lesions develop and then should be slowly discontinued ● Use over-the-counter benzoyl peroxide and generic topical erythromycin preparation Oral tetracycline 500 mg BID for 6-8 weeks (preferred) or doxycycline 100 mg PO BID for 6-8 weeks (A1a) No anti-infective strategies suggested (A1a) Doxycycline 100 mg PO BID for 10 days (A1b) Mg ⫽ milligrams; kg ⫽ kilograms; PO ⫽ by mouth; BID ⫽ twice daily; TID ⫽ 3 times daily; $ ⫽ over $15 cost for course of therapy. *All treatments are for adults unless otherwise noted. ● Therapeutic choice is appropriate for the treatment of early localized or early disseminated Lyme disease associated with erythema migrans, in the absence of neurological involvement or third-degree atrioventricular heart block. The American Journal of Medicine, Vol 120, No 4, April 2007 15b. Moderate to Severe Inflammatory Acne60 Treatment Hansen et al Low-Cost Antimicrobial Guideline As with all guidelines, this guideline should be reviewed on an ongoing basis, ideally at least annually, to incorporate new treatment evidence, update medication cost information, and reflect the current health care payment status for medications. While it is unlikely that a medication listed as low cost will increase in price, new low-cost antimicrobials become available as brand-name medications lose their market rights and as new drugs are developed. In fact, during the development process of this guideline, a number of new generic antimicrobials came onto the market and will most likely continue to decrease in price. In addition, it is unknown what effect Medicare Part D, which started January 1, 2006, will have on the affordability of prescription medications for Medicare recipients. However, the overall issue of uninsured and underinsured patients will not be resolved easily and will likely worsen as prescription costs continue to soar and new expensive medications continue to be marketed. Lastly, future guideline revisions must also consider changing microbial resistance patterns that may necessitate removal of medications that become less effective over time. We describe an example of a multidisciplinary evidencebased guideline process that developed useful low-cost prescribing information for providers in our healthcare system. It is hoped that this process can be used to guide future low-cost guideline endeavors in other disease areas to more broadly benefit patients and providers. Future research should be focused on direct provider and patient interventions to improve the use of low-cost care guidelines and whether the availability of low-cost guidelines improves the occurrence and content of discussions about out-of-pocket medications costs and, ultimately, the patient’s filling of the prescription and adherence to the prescribed regimen. Further, future research measuring the impact of guideline implementation on clinical and economic outcomes should be conducted. References 1. One in Three: Non-Elderly Americans without Health Insurance, 2002-2003. Washington, DC: Families USA Foundation; 2004. 2. Regopoulos LE, Trude S. Employers shift rising health care costs to workers: no long-term solution in sight. Issue Brief Cent Stud Health Syst Change. 2004;83:1-4. 3. Heisler M, Langa KN, Eby EL, Fendrick AM, Kabeto MU, Piette JD. The health effects of restricting prescription medication use because of cost. Med Care. 2004;42:626-634. 4. Harris Interactive. The impact of tiered co-pays: a survey of patients and pharmacists. Research report. September 2003. Available at: http://www.harrisinteractive.com/news/newsletters/healthnews/HI_ HealthCareNews2001Vol1_iss32.pdf. Accessed March 18, 2005. 5. Alexander GC, Casalino LP, Meltzer DO. Patient-physician communication about out-of-pocket costs. JAMA. 2003;290:953-958. 6. Alexander GC, Casalino LP, Tseng C-W, McFadden D, Meltzer DO. Barriers to patient-physician communication about out-of-pocket costs. J Gen Intern Med. 2004;19:856-860. 7. Piette JD, Heisler M, Wagner TH. Problems paying out-of-pocket medication costs among older adults with diabetes. Diabetes Care. 2004;27:384-391. 301 8. Piette JD, Heisler M. Problems due to medication costs among VA and non-VA patients with chronic illnesses. Am J Manag Care. 2004;10: 861-868. 9. Heisler M, Wagner TH, Piette JD. Patient strategies to cope with high prescription medication costs: who is cutting back on necessities, increasing debt, or underusing medications. J Behav Med. 2005;28: 43-51. 10. Reichert S, Simon T, Halm EA. Physicians’ attitudes about prescribing and knowledge of the costs of common medications. Arch Intern Med. 2000;160:2799-2803. 11. Clauson KA, Seamon MJ, Clauson AS, Van TB. Evaluation of drug information databases for personal digital assistants. Am J Health Syst Pharm. 2004;61:1015-1024. 12. Rothschild JM, Lee TH, Bae T, Bates DW. Clinician use of a palmtop drug reference guide. J Am Med Inform Assoc. 2002;9:223-229. 13. Korn LM, Reichert S, Simon T, Halm EA. Improving physicians’ knowledge of the costs of common medication and willingness to consider costs when prescribing. J Gen Intern Med. 2003;18:31-37. 14. Depiero AD, Ochsenschlager DW, Chamberlain JM. Analysis of pediatric hospitalizations after emergency department release as a quality improvement tool. Ann Emerg Med. 2002;39:159-163. 15. Taira DA, Iwane KA, Chung RS. Prescription drugs: elderly enrollee reports of financial access, receipt of free samples, and discussion of generic equivalents to type of coverage. Am J Manag Care. 2003;9: 305-312. 16. Matsuli D, Joubert GI, Dykxhoorn S, Rieder MJ. Compliance with prescription filling in the pediatric emergency department. Arch Pediatr Adolesc Med. 2000;154:195-198. 17. Thomas EJ, Burstin HR, O’Neil AC, Orav EJ, Brennan TA. Patient noncompliance with medical advice after the emergency department visit. Ann Emerg Med. 1996;27:49-55. 18. Hass JA, Phillips KA, Gerstenberger EP, Seger AC. Potential savings from substituting generic drugs for brand-name drugs: medical expenditure panel survey, 1997-2000. Ann Intern Med. 2005;142:891-897. 19. Gilbert DN, Moellering RC, Eiopoulos GM, Sande MA. The Sanford Guide to Antimicrobial Therapy, 34th ed. Hyde Park, VT: Antimicrobial Therapy, Inc; 2004. 20. Wisconsin Medicaid. Wisconsin Department of Health and Family Services Website. Available at: http://dhfs.wisconsin.gov/medicaid4/ pharmacy/data_tables/legend_mac.asp. Accessed July 5, 2005. 21. Sackett DL, Strauss SE, Richardson WS, Rosenberg W, Haynes RB. Evidence-Based Medicine: How to Practice and Teach EBM, 2nd ed. Oxford, UK: Churchill Livingstone; 2000. 22. Cheng AC, Thielman NM. Update on traveler’s diarrhea. Curr Infect Dis Rep. 2002;4:70-77. 23. Adachi JA, Ostrosky-Zeichner L, DuPont HL, Ericsson CD. Empirical antimicrobial therapy for traveler’s diarrhea. Clin Infect Dis. 2000;31: 1079-1083. 24. Caeiro JP, DuPont HL, Albrecht H, Ericsson CD. Oral rehydration therapy plus loperamide versus loperamide alone in the treatment of traveler’s diarrhea. Clin Infect Dis. 1999;28:1286-1289. 25. Fihn SD. Acute uncomplicated urinary tract infections in women. N Engl J Med. 2003;349:259-266. 26. Warren JW, Abrutyn E, Hebel R, Johnson JR, Schaeffer AJ, Stamm WE. Guidelines for antimicrobial treatment of uncomplicated acute bacterial cystitis and acute pyelonephritis in women. Clin Infect Dis. 1999;29:745-758. 27. Gupta K, Hooton TM, Stamm WE. Increasing antimicrobial resistance and the management of uncomplicated community-acquired urinary tract infections. Ann Intern Med. 2001;135:41-50. 28. Centers for Disease Control and Prevention. Sexually transmitted disease guidelines 2002. MMWR Recomm Rep. 2002;51:1-78. 29. Horner PJ, Caul EO. National guidelines for the management of Chlamydia trachomatis genital tract infection. Sex Transm Infect. 1999;75:S4-S8. 30. Hillis SD, Coles FBD, Litchfield B, et al. Doxycycline and azithromycin for prevention of chlamydial persistence or recurrence one 302 31. 32. 33. 34. 35. 36. 37. 38. 39. 40. 41. 42. 43. 44. 45. 46. 47. 48. 49. month after treatment in women: a use-effectiveness study in public health settings. Sex Transm Dis. 1998;25:5-11. Bignell C. National guidelines for the management of gonorrhoea in adults. Sex Transm Infect. 1999;75:S13-S15. Echols RM, Heyd A, O’Keeffe BJ, Schacht P. Single-dose ciprofloxacin for the treatment of uncomplicated gonorrhea: a worldwide summary. Sex Transm Dis. 1996;23:165-167. Barton S, Brown D, Cowan F, et al. National guidelines for the management of genital herpes. Sex Transm Infect. 1999;75:S24-S28. Fife KH, Barbarash RA, Rudolph T, Degregorio B, Roth R. The valacyclovir international herpes simplex virus study group. Valacyclovir versus acyclovir in the treatment of first-episode genital herpes infection: results of an international, multicenter, double-blind, randomized clinical trial. Sex Transm Dis. 1997;24:481-486. Hay P. National guidelines for the management of bacterial vaginosis. Sex Transm Infect. 1999;75:S16-S18. Lugo-Miro VI, Green M, Mazur L. Comparison of different metronidazole therapeutic regimens for bacterial vaginosis. A meta-analysis. JAMA. 1992;268:92-95. Daniels D, Forster G. National guidelines for the management of vulvovaginal candidiasis. Sex Transm Infect. 1999;75:S19-S20. De Punzio C, Garutti P, Mollica G, Nappi C, Piccoli R, Genazzani AR. Fluconazole 150 mg single dose versus itraconazole 200 mg per day for 3 days in the treatment of acute vaginal candidiasis: a double-blind randomized study. Eur J Obstet Gynecol Reprod Biol. 2003;106:193-197. Sherrard J. National guidelines for the management of Trichomonas vaginalis. Sex Transm Infect. 1999;75:S21-S23. Gülmezoglu AM. Interventions for trichomoniasis in pregnancy. Cochrane Database Syst Rev. 2002;3. Hager WD, Brown ST, Kraus SJ, Kleris GS, Perkins GJ, Henderson M. Metronidazole for vaginal trichomoniasis. Seven-day vs singledose regimens. JAMA. 1980;12:1219-1220. Walker P, Wilson J. National guidelines for the management of prostatitis. Sex Transm Infect. 1999;75:S46-S50. Fowler JE. Antimicrobial therapy for bacterial and nonbacterial prostatitis. Urology. 2002;20(Suppl 6A):S24-S26. Smucny J, Fahey T, Becker L, Glazier R. Antibiotics for acute bronchitis. The Cochrane Database of Systematic Review [database online]. Cochrane Acute Respiratory Infections Group; 2000. Updated December 15, 2003. Gonzales R, Bartlett JG, Besser RE, et al. Principles of appropriate antibiotic use for the treatment of uncomplicated acute bronchitis: background. Ann Emerg Med. 2001;37:720-727. Bisno AL, Gerber MA, Gwaltney JM Jr, Kaplan EL, Schwartz RH. Practice guidelines for the diagnosis and management of group a streptococcal pharyngitis. Clin Infect Dis. 2002;35:113-125. Cooper RJ, Hoffman JR, Bartlett JG, et al. Principles of appropriate antibiotic use for acute pharyngitis in adults: background. Ann Emerg Med. 2001;37:711-719. Mandell LA, Bartlett JG, Dowell SF, File TM, Musher DM, Whitney C. Update of practice guideline for the management of communityacquired pneumonia in immunocompetent adults. Clin Infect Dis. 2003;37:1405-1433. Ailania RK, Agastya G, Ailani RK, Mukunda BN, Shekar R. Doxycycline is a cost-effective therapy for hospitalized patients with community-acquired pneumonia. Arch Intern Med. 1999;159:266-270. The American Journal of Medicine, Vol 120, No 4, April 2007 50. Gleason PP, Kapoor WN, Stone RA, et al. Medical outcomes and antimicrobial costs with the use of the American thoracic society guidelines for outpatients with community-acquired pneumonia. JAMA. 1997;278:32-39. 51. Dunbar LM, Wunderink RG, Habib MP, et al. High-dose, short-course levofloxacin for community-acquired pneumonia: a new treatment paradigm. Clin Infect Dis. 2003;37:752-760. 52. Dunbar LM, Khashab MM, Kahn JB, Zadeikis N, Ziang JX, Tennenberg AM. Efficacy of 750-mg, 5-day levofloxacin in the treatment of community-acquired pneumonia caused by atypical pathogens. Curr Med Res Opin. 2004:20:555-563. 53. Sánchez F, Mesna J, Martínez A, et al. Is azithromycin the first-choice macrolide for treatment of community-acquired pneumonia? Clin Infect Dis. 2003;36:1239-1245. 54. Kasbekar N, Acharya PS. Telithromycin: the first ketolide for the treatment of respiratory infections. Am J Health Syst Pharm. 2005;62: 905-916. 55. Levison ME, Manura CT, Lorber B, et al. Clindamycin compared with penicillin for the treatment of anaerobic lung abscess. Ann Intern Med. 1983;98:466-471. 56. Perlino CA. Metronidazole vs clindamycin treatment of anaerobic pulmonary infection. Failure of metronidazole therapy. Arch Intern Med. 1981;141:1424-1427. 57. Kapila R, Sen P, Salaki J, Louria DB. Evaluation of clindamycin and other antibiotics in the treatment of anaerobic bacterial infections of the lung. J Infect Dis. 1977;135(suppl):S58-S64. 58. Hickner JM, Barlett JG, Besser RE, Gonzales R, Hoffman JR, Sande M. Principles of appropriate antibiotic use for acute rhinosinusitis in adults: background. Ann Emerg Med. 2001;37:703-710. 59. Ip S, Fu L, Balk E, Chew P, DeVine D, Lau J. Update on Acute Bacterial Rhinosinusitis. Prepared for: Agency for Healthcare Research and Quality. U.S. Department of Health and Human Services. Rockville, MD; 2005. 60. Haider A, Shaw JC. Treatment of acne vulgaris. JAMA. 2004;292;726735. 61. Wormser GP, Nadelman RB, Dattwyler RJ, et al. Practice guidelines for the treatment of Lyme disease. Clin Infect Dis. 2000;31(suppl 1):S1-S14. 62. Wormser GP, Ramanathan R, Nowakoaski JM, et al. Duration of antibiotic therapy for early Lyme disease. Ann Intern Med. 2003;138: 697-704. 63. Shiffman RN, Shekelle P, Overhage M, Slutsky J, Grimshaw J, Deshpande AM. Standardized reporting of clinical practice guidelines: a proposal from the conference on guideline standardization. Ann Intern Med. 2003;139:493-498. 64. Fischer MA, Avorn J. Economic consequences of underuse of generic drugs: evidence from Medicaid and implications for prescription drug benefit plans. Health Serv Res. 2003;38:1051-1063. 65. Nutescu EA, Park HY, Walton SM, et al. Factors that influence prescribing within a therapeutic drug class. J Eval Clin Pract. 2005; 11:357-365. 66. Lichtenberg FR. Are the benefits of newer drugs worth their cost? Evidence from the 1996 MEPS. Health Aff. (Millwood) 2001;20:241251. The American Journal of Medicine (2007) 120, 303-305 REVIEW Contemporary Empyema Necessitatis Scott A. Kono, DO,a Trenton D. Nauser, MDb a Department of Internal Medicine, University of Kansas Medical Center, Kansas City, Kans; bDivision of Pulmonary and Critical Care Medicine, Department of Veterans Affairs Medical Center, Kansas City, Mo. ABSTRACT Empyema necessitatis is defined by the extension of an empyema through the parietal pleura, into surrounding tissue. Clinical manifestations are generally subacute, representing the indolent nature of the most commonly implicated pathogens (Mycobacterium tuberculosis and Actinomyces israelii). Treatment with antimicrobials and surgical debridement has drastically reduced mortality; however, with proper initial assessment and treatment of pulmonary infection, this rare complication can often be avoided. We describe a patient with empyema necessitatis to illustrate the importance of timely diagnosis and treatment of parapneumonic pleural effusion, and the need to consider this diagnosis in patients presenting with constitutional symptoms and a chest wall mass. © 2007 Elsevier Inc. All rights reserved. KEYWORDS: Empyema; Pulmonary infection; Chest wall mass; Pleural effusion A parapneumonic pleural effusion is a complication of bacterial pneumonia, lung abscess, or bronchiectasis. At least 40% of patients with pneumonia have an associated effusion.1 The evolution of a parapneumonic effusion is a continuum of stages. Dependent upon the stage, the fluid varies from a clear, straw-colored fluid to frank pus (empyema). In the first or exudative stage, a lower respiratory infection may increase pulmonary interstitial fluid, which crosses the visceral pleura. When the resorptive capacity of the pleural space is exceeded, pleural fluid accumulates. Pleural fluid pH and glucose are normal and the lactate dehydrogenase (LDH) usually less than 500 U/L. These effusions are uncomplicated, do not require drainage, and often resolve after appropriate antimicrobial therapy. The second stage is fibropurulent, in which bacteria from the contiguous pulmonary infection invade the pleura. The pleural fluid becomes increasingly turbid and viscous due to leukocytes, cellular debris, and fibrin. Diagnostically, the pleural effusion has a pH ⬍7.2, glucose ⬍40 mg/dL, and LDH ⬎1000 U/L. These complicated parapneumonic effusions and empyemas require antimicrobials and drainage for control of inflammation and pleural sepsis. Requests for reprints should be addressed to Scott A. Kono, DO, Department of Internal Medicine, University of Kansas Medical Center, 3901 Rainbow Blvd., Kansas City, KS 66160. E-mail address: [email protected] 0002-9343/$ -see front matter © 2007 Elsevier Inc. All rights reserved. doi:10.1016/j.amjmed.2006.09.019 A tendency exists toward forming limiting membranes, or loculations, which may need evacuation via thoracotomy rather than simple tube thoracostomy. In managing pleural effusions, thoracentesis should be done immediately to help direct therapy.2,3 If untreated, an empyema may rupture through the parietal pleura and dissect into the surrounding tissue with resultant abscess formation (empyema necessitatis). CASE REPORT A 52-year-old man with no medical history was admitted with new onset of painful left chest mass, and 2 weeks of cough, dyspnea, and fever. One week before admission, he completed a 5-day course of azithromycin for presumptive pneumonia. A chest radiograph was not performed. He regularly used cigarettes, ethanol and marijuana, and denied ill contacts. On admission, he appeared moderately distressed. Vital signs included temperature 38.7°C, respiratory rate 24 breaths per minute, pulse 85 beats per minute, blood pressure 154/83 mm Hg, and SpO2 95% on room air. His dentition was poor. A 7 ⫻ 8 cm nonerythematous, fluctuant, tender left anterior chest mass was noted. Left lung examination revealed absent tactile fremitus, percussion dullness, and diminished breath sounds. Extremity examination revealed no clubbing. 304 The American Journal of Medicine, Vol 120, No 4, April 2007 contribute to this disease.6-8 Extension occurs along the path Laboratory investigation revealed WBC 15,400/mm3 with 70% neutrophils and 8% bands. Alkaline phosphatase of least resistance. A painful anterior chest wall mass, typwas 165 IU/L. A large left pleural effusion was evident on ically between the second and sixth intercostal space, is the chest radiograph (Figure 1). Computed tomography conmost common presenting symptom.4,5 Alternative areas of firmed a large loculated effusion with direct anterior extenextension include the bronchi, esophagus, breast, diaphragm, sion into the chest wall and adjaretroperitoneum, and groin.4-6,9-19 Tuberculosis is the most comcent rib destruction (Figures 2, 3). monly reported etiology, followed Thoracentesis revealed a grossly CLINICAL SIGNIFICANCE by actinomycosis.5 The chronic purulent fluid with glucose 1 mg/ nature of these infections corredL, LDH 7019 IU/L, and WBC ● Pleural effusions require immediate and lates well with the typical slow 48,500/mm3 with 76% neutroaccurate diagnostic evaluation to miniphils. The pH was spuriously eleprogression of disease. Constitumize morbidity and mortality. vated due to air accumulation tional symptoms typically begin ● Empyema necessitatis, as described in within the syringe. Pleural fluid 1-2 months before development of Gram’s stain was negative. a tender chest wall mass, although this case, is a rare complication of an Piperacillin-tazobactam was inisymptoms up to 6 years prior have untreated or under-treated parapneumotiated and the patient taken for been reported. More acute presennic effusion. video-assisted thoracoscopic surtations are associated with pyo● Suspect empyema necessitatis in any pagery where extensive exudates and genic bacteria.4,5 tient presenting with a chest wall mass adhesions were removed from the Although anaerobic organisms and underlying pulmonary infection. chest wall and lung surface. Turbid are the predominant pathogens pleural fluid was drained and aderecovered from empyema in gen● Successful therapy for empyema necesquate lung expansion achieved. All eral,20 anaerobes other than Actisitatis is dependent upon prompt anticultures remained negative and the nomyces israelii are only rarely microbial and surgical intervention. patient recovered uneventfully after associated with empyema necessicompleting 6 weeks of broad spectatis. Often, no causative organism trum antibiotics. is identified, which may reflect difficulty in culturing anaerobic bacteria.4,12 Other causal organisms include Streptococcus pneumoniae, Staphylococcus DISCUSSION aureus, Streptococcus milleri, Pseudomonas cepacia, and MyEmpyema necessitatis is rare, with the majority of cases cobacterium avium-intracellulare.5,15,16 described in the preantibiotic era. In 1640 Guillan de BailTreatment of empyema necessitatis involves antimicrolon reported the first case, a syphilitic aneurysm with disbials combined with surgical drainage.4,5 Antibiotics should charge of pus through the chest wall.4 Sindel reported 115 be initiated to cover potential polymicrobial and anaerobic subjects in 1940,4 and a recent review cited only 26 cases pleuropulmonary infection, and tailored when sensitivities since 1966.5 become available. Empiric antitubercular medications should Increased pressure within the loculation, chronic inflambe considered. mation, and necrosis with erosion and fluid extension all Before antibiotics, mortality was 87% among those with tuberculosis as the causative agent and 28% in those with a Figure 1 Chest radiograph demonstrating a large left pleural effusion with contralateral shift of mediastinal structures. Figure 2 CT scan demonstrating anterolateral communication of empyema into subcutaneous tissue. Kono and Nauser Contemporary Empyema Necessitatis Figure 3 CT scan revealing anterior focal rib destruction secondary to empyema involvement. pyogenic organism.4 Since the advent of modern antimicrobial and surgical therapy, death has not been reported. Our patient represents a rare complication of parapneumonic pleural effusion, a common illness. Outpatient antibiotics may have treated his pneumonia, but left a parapneumonic pleural effusion inadequately treated. Negative pleural fluid culture may have resulted from sterilization by antibiotics before sampling or from a lack of laboratory sensitivity in detecting anaerobic organisms. Alternatively, complicated parapneumonic effusions can be sterile because bacteria are cleared rapidly from the pleural space.21 The ‘empyema of necessity’ should be considered in any patient presenting with chest mass and constitutional symptoms. However, timely pleural fluid analysis can prevent this complication. In 1893, Duckworth conveyed fittingly, “ . . . it is not common for empyema to open spontaneously, and it is a less common occurrence now than it used to be, for the reason that nowadays the hypodermic syringe makes the diagnosis certain and the pus is soon withdrawn.”22 References 1. Light RW, Girard WM, Jenkinson SG, et al. Parapneumonic effusions. Am J Med. 1980;69:507-512. 2. Sahn SA, Light RW. The sun should never set on a parapneumonic effusion. Chest. 1989;95:945-947. 305 3. Colice GL, Curtis A, Deslauriers J, et al. Medical and surgical treatment of parapneumonic effusions. An evidence-based guideline. Chest. 2000;18:1158-1171. 4. Sindel EA. Empyema necessitatis. Q Bull Seaview Hosp. 1940;6:1-49. 5. Freeman AF, Ben-Ami T, Shulman ST. Streptococcus pneumoniae empyema necessitatis. Pediatr Infect Dis J. 2004;23:177-179. 6. Marks MI, Eickhoff TC. Empyema necessitatis. Am Rev Respir Dis. 1970;101:759-761. 7. Bernstein A, White FZ. Unusual physical findings in pleural effusion: intrathoracic manometric studies. Ann Intern Med. 1952;37:733-738. 8. Haddad CJ, Sim WK. Empyema necessitatis. Am Fam Physician. 1989;40:149-152. 9. Bassiri AG, Girgis RE, Theodore J. Actinomyces odontolyticus thoracopulmonary infections. Two cases in lung and heart-lung transplant recipients and a review of the literature. Chest. 1996;109:1109-1111. 10. Davies AL, Messerschmidt W, Piland JH, Lally J. Thoracic actinomycosis presenting as empyema necessitatis. Del Med J. 1987;59:649657. 11. Dershaw DD. Actinomycosis of the chest wall: ultrasound findings in empyema necessitatis. Chest. 1984;86:779-780. 12. Hockensmith ML, Mellman DL, Aronsen EL. Fusobacterium nucleatum empyema necessitans. Clin Infect Dis. 1999;29:1596-1598. 13. Hoover EL, Hsu HK, Minnard E. Contained thoracic empyema presenting as an anterior chest wall abscess: empyema necessitatis revisited. J Natl Med Assoc. 1989;81:912-917. 14. Jover F, Andreu L, Cuadrado J, Montaagud J, Merino J. Tuberculous empyema necessitatis in a man infected with the human immunodeficiency virus. South Med J. 2002;95:751-752. 15. Marinella MA, Harrington GD, Standiford TJ. Empyema necessitans due to Streptococcus milleri. Clin Infect Dis. 1996;23:203-204. 16. Noyes BE, Michaels MG, Kurland G, Armitage JM, Orenstein DM. Pseudomonas cepacia empyema necessitatis after lung transplantation in two patients with cystic fibrosis. Chest. 1994;105:1888-1891. 17. Reyes CV, Thompson KS, Jensen J. Fine needle aspiration biopsy of mastitis secondary to empyema necessitatis. Acta Cytol. 1999;43:873876. 18. Sahn SA, Iseman MD. Tuberculous empyema. Semin Respir Infect. 1999;14:82-87. 19. Sakomoto T, Miyamoto Y, Nishio W, Matsuoka H, Tsubota N. Empyema necessitatis into the retroperitoneal space. Ann Thorac Surg. 2002;73:1954-1956. 20. Bartlett JG, Finegold SM. Anaerobic infections of the lung and pleural space. Am Rev Respir Dis. 1974;110:56-77. 21. Mavroudis C, Tomlinson JR, Wilson C, et al. Experimental aerobic anaerobic thoracic empyema in the guinea pig. Ann Thorac Surg. 1987;43:298. 22. Duckworth SP. Case of empyema which opened externally in the seventh right intercostal space. Int Clin Philadelphia. 1893;1:19-25. The American Journal of Medicine (2007) 120, 306-315 UPDATE IN OFFICE MANAGEMENT Office Management of Chronic Pain in the Elderly Debra K. Weiner, MD Division of Geriatric Medicine, Department of Medicine, Department of Psychiatry, and Department of Anesthesiology, University of Pittsburgh, Pittsburgh, Penn. ABSTRACT Chronic pain plagues older adults more than any other age group; thus, practitioners must be able to approach this problem with confidence and skill. This article reviews the assessment and treatment of the most common chronic nonmalignant pain conditions that affect older adults—myofascial pain, generalized osteoarthritis, chronic low back pain (CLBP), fibromyalgia syndrome, and peripheral neuropathy. Specific topics include essential components of the physical examination; how and when to use basic and advanced imaging in older adults with CLBP; a stepped care approach to treating older adults with generalized osteoarthritis and CLBP, including noninvasive and invasive management techniques; how to diagnose and treat myofascial pain; strategies to identify the older adult with fibromyalgia syndrome and avoid unnecessary “diagnostic” testing; pharmacological treatment for the older adult with peripheral neuropathy; identification and treatment of other factors such as dementia and depression that may significantly influence response to pain treatment; and when to refer the patient to a pain specialist. While common, chronic pain is not a normal part of aging, and it should be treated with an emphasis on improved physical function and quality of life. © 2007 Elsevier Inc. All rights reserved. KEYWORDS: Chronic pain; Elderly; Evaluation; Treatment; Low back pain; Fibromyalgia; Syndrome; Myofascial pain; Peripheral neuropathy; Generalized osteoarthritis Chronic pain is a treatable problem affecting an estimated 50% of community-dwelling older adults and over 75% of long-term care facility residents. Because of its numerous consequences, including impaired physical function, depression, anxiety, disrupted sleep and appetite, and excessive use of health care resources, chronic pain should be treated aggressively. Chronic pain may accompany both malignant and nonmalignant disorders. This article focuses on the evaluation and management of chronic nonmalignant pain. DEFINITION AND PATHOGENESIS OF CHRONIC NONMALIGNANT PAIN speaking there are 2 types of conditions that underlie its pathogenesis—nociceptive and neuropathic. The nervous system is responsible for the perception of pain. Nociceptive pain is associated with tissue damage and a normal nervous system (eg, pain associated with osteoarthritis), while neuropathic pain is associated with physiological nervous system dysfunction (eg, diabetic neuropathy, postherpetic neuralgia). Not infrequently, these 2 types of pain coexist. The discussion that follows focuses on the most common chronic nonmalignant pain disorders—myofascial pain, osteoarthritis, chronic low back pain, fibromyalgia syndrome, and peripheral neuropathy. Chronic pain is defined as pain that persists beyond the expected time of healing, or more than 3 to 6 months. While a number of disorders may cause chronic pain, generally GENERAL APPROACH TO ASSESSMENT AND TREATMENT Requests for reprints should be addressed to Debra K. Weiner, MD, UPMC Pain Medicine at Centre Commons, 5750 Centre Ave., Suite 400, Pittsburgh, PA 15206. E-mail address: [email protected] To afford an optimal response to therapy, the practitioner must keep 3 general principles in mind, and communicate them to their older patients in order to establish reasonable treatment expectations: 0002-9343/$ -see front matter © 2007 Elsevier Inc. All rights reserved. doi:10.1016/j.amjmed.2006.05.048 Weiner ● ● ● Chronic Pain in the Elderly Chronic pain is a syndrome with many potential contributors, all of which require treatment to afford an optimal clinical outcome. Chronic pain is treatable but not curable; improvement is the rule, not the exception. It is often possible to improve functional ability to a greater extent than the severity of pain is reduced. EVALUATION AND TREATMENT OF SPECIFIC CHRONIC PAIN DISORDERS Myofascial Pain Definition and Pathogenesis. Because myofascial pain (MP) occurs in the majority of patients with chronic pain disorders, learning how to recognize, diagnose, and treat this condition is essential. Broadly defined, myofascial pain is pain in physiologically abnormal muscles. The pathognomonic features of this disorder are taut bands and trigger points elicited by firm palpation.1 Patients may present with a range of pain symptoms such as aching, soreness, stabbing, or burning. The descriptors used by patients suffering from myofascial pain may be similar to those of neuropathic pain, and sometimes these disorders occur together; thus, hands-on assessment is critical to accurate diagnosis. Myofascial pain is commonly associated with degenerative changes of the axial skeleton and other factors (eg, spinal deformity, such as scoliosis or kyphosis) that may irritate nerves. As a result, the musculature supplied by these nerves does not receive adequate trophic factors and it, in turn, becomes irritable.2 Evaluation. Careful physical examination is required to diagnose myofascial pain. Historical clues include: relief of pain by exerting mild pressure over the area (eg, massaging the affected area), engaging in low level activity, or application of heat or vapocoolant spray; and worsening of pain with excessive activity. Physical examination performed by firmly palpating involved muscles may reveal both latent and active trigger points.1 Palpation of latent trigger points may cause tenderness, but may not reproduce the radiation of pain that occurs when active trigger points are palpated. Taut bands can be identified by firmly palpating the muscle along the same plane but in the axis that runs perpendicular to the direction of the muscle fibers. The examiner may need to apply pressure in this area for 10-15 seconds before the characteristic pain pattern is reproduced.3 Local twitch responses, due to sharp contractions of the taut band (not the entire muscle) initiated by an intense physical stimulus such as needle insertion or plucking of the band may also be noted.1 Sensory abnormalities include hypersensitivity and allodynia (ie, pain caused by a stimulus that does not normally provoke pain) of the trigger points. Autonomic phenomena, such as temperature change, piloerection, and sweating, may be present in the affected area but are not required for diagnosis. 307 Treatment. The first step in the treatment of MP is identification and modification of perpetuating factors, such as posture, sleeping position, and body mechanics during activity. Early involvement of a physical therapist skilled in the treatment of myofascial pain disorders is crucial. Physical therapy techniques commonly employed include gentle sustained stretching of involved muscles to reduce focal contractions and inactivate trigger points, sometimes in combination with a vapocoolant spray; exercise programs that include graded stretching and strengthening; and teaching of flare self-management techniques.4 In order to facilitate physical therapy-directed rehabilitation, trigger point deactivation may be useful. This can be accomplished with either “dry needling” (ie, deactivating the trigger point with a needle alone) or injection of the trigger point with an anesthetic or steroid. Either technique may be effective as long as a local twitch response (ie, transient contraction of a group of tense muscle fibers [taut band] that traverse a trigger point) is achieved.5 This author also has had success with a variety of acupuncture techniques. In refractory cases, referral to a multidisciplinary pain center may be helpful. Osteoarthritis and Chronic Low Back Pain Definition and Pathogenesis. Osteoarthritis (OA) is commonly referred to as degenerative arthritis, but this is somewhat of a misnomer. Accumulating evidence indicates that inflammation plays an important role in the pathogenesis of OA. While virtually all older adults have radiographic evidence of OA, most of these individuals are asymptomatic, and the severity of OA on radiograph correlates poorly with symptom severity. In the case of chronic low back pain (CLBP), degenerative disease of the discs and facets is only one factor that contributes to pain; thus, its evaluation and treatment should be approached comprehensively. Evaluation. Proper treatment of appendicular OA (eg, knees, hips) and CLBP requires a detailed evaluation. Several rheumatologic disorders can cause generalized pain and may be confused with OA. Table 1 summarizes clinical features of common rheumatologic conditions. The first step in evaluating low back pain is the identification of “red flags” (eg, fever, unintentional weight loss, sudden change in pain quality) indicative of a serious underlying disorder such as malignancy or spinal infection (Figure 1). These should be screened with a targeted history and physical examination. If a serious condition is suspected, diagnostic imaging should be pursued promptly. Conversely, in the absence of red flags, imaging is rarely indicated.6 Practitioners receive little training in musculoskeletal assessment, thus, basic and advanced imaging (ie, radiographs and magnetic resonance imaging [MRI]/computerized tomography [CT], respectively) is often relied upon as an initial diagnostic test. This approach, however, is likely to lead to incorrect management because degenerative abnormalities are a nonspecific finding in older adults with Differentiation of Osteoarthritis from other Common Rheumatologic Disorders: History, Physical Examination and Other Diagnostic Features History 308 Table 1 Physical Examination AM Stiffness Location of Pain Synovitis Extrasynovial Disease Osteoarthritis Generally short-lived, eg, ⬍30 minutes Absent or mild None related to arthritis itself Pseudogout Pseudo-rheumatoid pattern may be associated with prolonged AM stiffness Weight-bearing appendicular joints, cervical and lumbar spine, DIPs, PIPs and 1st CMC. MCP and wrist involvement go against OA. Knee and wrist are most common locations; disease is often symmetrical Acute flares are intensely inflammatory Gout Pseudo-rheumatoid pattern may be associated with prolonged AM stiffness Joints of the lower extremities are most often involved, especially 1st MTP; disease is typically asymmetrical Acute flares are intensely inflammatory Chondrocalcinosis on radiographs; eye deposits, bursitis, tendonitis, carpal and cubital tunnel syndromes may occur. Tophaceous soft tissue deposits uncommon. Tophi may deposit in soft tissues. Rheumatoid Arthritis Prolonged, eg, ⬎30 minutes. Duration of stiffness is used as one parameter of disease activity Any synovial joint. The lumbar spine is typically spared. Present. Systemic Lupus Erythematosus Not a prominent feature. Generally absent; arthralgias are more common than arthritis. Fibromyalgia Syndrome Generally short-lived, eg, ⬍30 minutes Depends upon tissues involved— may or may not be limited to joints. Comorbid fibromyalgia is not uncommon. Typically diffuse. Worst symptoms often involve the axial skeleton. Polymyalgia Rheumatica May be prolonged, lasting several hours Typically proximal—eg, shoulder girdle, hip girdle, neck. If headaches, jaw claudication, or prominent systemic symptoms (eg, fever), consider temporal arteritis. Absent. Joints themselves are not involved, although patients experience pain in joints and soft tissues. May occur, especially in small joints of hands. Not uncommon; rheumatoid nodules can develop in soft tissues. Many other possible manifestations including anemia, vasculitis (skin lesions, peripheral neuropathy, pericarditis, visceral arteritis, palpable purpura), pulmonary disease, etc. Common—eg, anemia, skin rash, pleuritis, peritonitis, pericarditis, nephritis, meningitis, etc. Many other disorders may coexist (Table 4) Occurs if comorbid temporal arteritis and relates to involvement of arteries (eg, Raynaud’s phenomenon, bruits, claudication). Other Diagnostic Features/Comments Because OA is ubiquitous in older adults, radiographs should be used to rule out other disorders, not to diagnose OA. Chondrocalcinosis may be asymptomatic. Identification of intracellular CPPD crystals offers a definitive diagnosis in acute flares. Acute and chronic forms occur. Hyperuricemia may be asymptomatic. Serum uric acid cannot diagnose gout. Identification of intracellular monosodium urate monohydrate crystals offers a definitive diagnosis in acute flares. Patients may be seronegative. If disease is suspected, patient should promptly be referred to a rheumatologist to retard disease progression. Anyone with suspected SLE should promptly be referred to a rheumatologist. Fibromyalgia syndrome is not a diagnosis of exclusion, but one based upon careful history and physical examination (see text). Because the erythrocyte sedimentation is very nonspecific, this test should be used to assist with confirmation of a suspected diagnosis. Note that cases of PMR and TA with a normal ESR have been reported. CMC ⫽ carpo-metacarpal joint; CPPD ⫽ calcium pyrophosphate dihydrate; DIP ⫽ distal interphalangeal joint; ESR ⫽ erythrocyte sedimentation rate; MCP ⫽ metacarpophalangeal joint; MTP ⫽ metatarsophalangeal joint; OA ⫽ osteoarthritis; PIP ⫽ proximal interphalangeal joint; PMR ⫽ polymyalgia rheumatica; SLE ⫽ systemic lupus erythematosus; TA ⫽ temporal arteritis. The American Journal of Medicine, Vol 120, No 4, April 2007 Disorder Weiner Chronic Pain in the Elderly 309 Comprehensive Patient History Evidence of Lumbar Spinal Stenosis? NO YES Red Flags? Symptoms Severe and/or associated with recent neurological deficits? NO Basic or Advanced Imaging; Treat per findings Comprehensive Physical Examination of the Low Back and Legs NO YES YES Fibromyalgia Physical Therapy + Analgesics Advanced Imaging + Surgical Referral Sacroiliac pain, Myofascial pain Rheumatology or Pain Clinic Prominent Hip Disease Orthopedist Physical Therapy Adjunctive Modalities and Medications Figure 1 Evaluation and treatment of the older adult with persistent low back pain. back pain. Indeed, virtually 100% of older adults have degenerative pathology, whether or not they have pain. When used as a screening tool, imaging should be thought of as a way to demonstrate the absence of disease (eg, Table 2 compression fractures, metastatic bone disease, disk space infection) rather than as a way to diagnose the cause of pain. Moderate to severe central spinal canal stenosis identified by MRI is also as common in older adults with pain as Essential Clinical History Questions for Older Adults with Chronic Low Back Pain Question Potential Diagnostic Clue(s) Obtained 1. Can you show me where your back hurts? If patient places hand to right or left of midline, over sacrum rather than lumbar spine, this suggests sacroiliac joint syndrome (look for associated scoliosis, hip or knee disease, leg length discrepancy), inflammatory disorder, or sacral insufficiency fracture. Improvement in fetal position suggests spinal stenosis. Worsening in fetal position suggests sacroiliac disease because of joint compression in this position. Buttocks involvement can be associated with hip disease, piriformis myofascial pain (often sharp or burning), or spinal stenosis and requires contextual evaluation. Groin pain can be associated with intrinsic hip disease, local myofascial pathology, sacroiliac joint syndrome, or an insufficiency fracture. Posterior radiation is consistent with sciatica (sharp) or spinal stenosis (dull). Lateral thigh radiation suggests tensor fascia lata/iliotibial band pain (not past the knee) or gluteus minimus (past the knee “pseudo-sciatica”) myofascial pain. Lateral leg pain with paresthesias or numbness suggests L5 radiculopathy. Anterior thigh pain suggests hip disease, meralgia paresthetica, quadriceps strain with knee osteoarthritis, or L2/3/4 radiculopathy. Worsening with walking suggests spinal stenosis or vasogenic claudication. Improvement with walking suggests myofascial pathology or neuropathic pain. Prolonged walking may worsen myofascial pain. Degenerative disease may be associated with initial pain/stiffness, then improvement and worsening with excessive use. Patients with fibromyalgia syndrome often have prominent axial pain, and may present with a chief complaint of severe low back pain, but in fact low back pain is just one of many sites of pain. 2. Does the pain get better or worse when you curl up in bed? 3. Does the pain go into your buttocks? If “yes”: Is the pain sharp or dull? 4. Do you have pain in your groin? 5. Does the pain shoot down your leg(s)? If “yes”: In what part of your leg do you feel the pain? Is the pain sharp or dull? 6. Is the pain made better or worse with walking? 7. Do you sometimes feel that you have pain all over? Reprinted from: Weiner DK, Cayea D. Low back pain and its contributors in older adults: a practical approach to evaluation and treatment. In: Pain in Older Persons, Progress in Pain Research and Management, Vol. 35. Seattle, Washington: IASP Press; 2005:332, with permission from Debra Weiner and IASP Press. 310 Table 3 The American Journal of Medicine, Vol 120, No 4, April 2007 Physical Examination Abnormalities in Older Adults with Low Back Pain Finding Operational Definition Examination Technique Fibromyalgia tender points Presence of pain when approximately 4 kg of force is applied to defined tender points. Functional leg length discrepancy Pelvic asymmetry Scoliosis (lateral/ rotational) Lateral/rotational curvature of thoracolumbar spine Sacroiliac joint pain Pain with direct palpation of sacroiliac joint or with Patrick’s test Myofascial pain, piriformis Presence of pain on deep palpation of piriformis. Myofascial pain, tensor fascia lata (TFL) ⫾ iliotibial (IT) band pain Kyphosis Presence of pain on deep palpation of TFL or IT band. Have patient sit comfortably on examination table, arms resting in lap. Tell patient that you are going to apply pressure at several points on the body, and that you want to know if pressure on any point causes pain. Examine the following points bilaterally, using enough pressure to blanch thumb nail: (1) Occiput at suboccipital muscle insertions (2) Low cervical at the anterior aspects of the intertransverse spaces at C5-C7 (3) Trapezius, midpoint of upper border (4) Supraspinatus at origins, above the scapular spine near the medial border (5) 2nd rib at the 2nd costochondral junction, just lateral to the junction on the upper surfaces (6) Lateral epicondyle 2 cm distal to the epicondyle (7) Medial fat pad of the knee, proximal to joint line (8) Greater trochanter, just posterior to the trochanteric prominence (9) Gluteal at upper outer quadrant of buttocks in anterior fold of muscle Have patient stand with both feet on floor, shoes removed. Ask him to stand with feet together, and as erect as possible. Kneel behind patient. With palms parallel to floor, and fingers extended, place lateral surface of index finger of both hands atop pelvic brim bilaterally. Eyes should be level with hands. Determine if right and left thumbs are at different heights. Have patient stand on floor with shoes removed. Stand behind patient. Run index finger along spinous processes (do not lift hand between vertebrae) a series of 3 times. If you do not detect scoliosis, then: Ask patient to bend forward. Determine if there is asymmetry in height of paraspinal musculature. Direct Palpation: Have patient stand on floor with shoes removed. Stand behind patient. Exert firm pressure over sacroiliac joint, first on one side, then the other. Palpate right joint with right thumb, standing to left side of patient; palpate left joint with left thumb, standing to right of patient. Patrick’s (FABER) Test—Have the patient lie supine on the examining table and place the foot of involved side on opposite knee. Then slowly lower the test leg in abduction toward the examining table. If patient reports pain in back (not groin, buttocks or leg), then test is positive. Have patient lay supine on examination table. Have patient flex right hip and knee, keeping sole of foot on table. Cross bent leg over opposite leg; again place sole on table and exert mild medially directed pressure on lateral aspect of knee to put piriformis in stretch. Exert firm pressure (4 kg) over middle extent of piriformis. Repeat examination on opposite side. Have patient lying supine on examination table. Using thumbs of both hands, exert firm pressure (4 kg) over full extent of TFL and IT band. Repeat examination on opposite side. Myofascial pain of paralumbar musculature Vertebral body pain Hip disease Deformity of thoracic spine creating forward flexed posture Presence of pain on deep palpation of paralumbar musculature. Presence of pain on firm palpation of lumbar spinous processes Pain and restricted motion of hip Have patient stand on floor with shoes removed. Ask him to stand fully erect. Inspect posture from the side. Have patient stand on floor with shoes removed. Stand behind and to left of patient and brace patient in front with left arm. Palpate full extent of right paravertebral musculature with right thumb. Exert approximately 4 kg force. Repeat, palpating the left paravertebral musculature. Position yourself behind patient, as for examination of paravertebral musculature above. Using dominant thumb, firmly palpate spinous processes L1-L5. Hip Internal Rotation—Have patient lie supine on examining table with hip and knee bent to 90°. Put the hip into maximum internal rotation (should be ⬎15°) and ask patient if he experiences pain. Patrick’s Test—As above, but pain may be in groin or leg. Modified and reprinted from: Weiner DK, Sakamoto S, Perera S, Breuer P. Chronic low back pain in older adults: prevalence, reliability, and validity of physical examination findings. J Am Geriatr Soc. 2006;54:11-20; with permission from Debra Weiner and Blackwell Publishing. Weiner Chronic Pain in the Elderly 311 Surgery Strong Opioids Other NSAIDs, Weak Opioids Non-acetylated salicylates Topical Preparations, Cognitive Behavioral Therapy, Interdisciplinary Pain Therapy, CAM Modalities Acetaminophen Injections Education, Exercise, Weight Loss, Assistive Devices Figure 2 Stepped care approach to the treatment of axial and appendicular osteoarthritis. in those without pain.7 In part for this reason, failed back surgery syndrome occurs in up to 40% of patients when treatment decisions are based on the results of advanced imaging alone. Factors that increase the risk of failed back surgery syndrome include scoliosis, hip disease, and osteoporotic compression fractures, all of which are common in older adults.8,9 Because these factors can alter gait or spinal biomechanics, their close relationship with low back pain is not surprising. Essential elements of the history and physical examination for the older adult with CLBP are shown in Tables 2 and 3. Because low back pain is a syndrome, typically more than one abnormality will be uncovered. Treatment. Treatment of appendicular OA and CLBP should be directed toward each of its individual contributors. In addition to treating the physical causes, careful attention should be paid to the many psychosocial factors that can impact pain and function, such as anxiety, depression, and fear. A stepped care approach to the treatment of appendicular OA and CLBP is shown in Figure 2. Note on the right side of Figure 2, “topical preparations, cognitivebehavioral therapy, interdisciplinary pain treatment, and complementary and alternative modalities (CAM).” These treatments should be considered alone or in combination with any of the individual step components described below. Discussion of CAM is beyond the scope of this article. Interested readers are referred to a recent review of CAM for chronic pain in older adults.10 Step 1 includes patient education, exercise,11 weight loss, and prescription of assistive devices (eg, canes, walkers). Step 2 focuses on injection therapies. Even though injections are invasive, the risk of these procedures when performed by experienced clinicians is less than that of systemic analgesics. Injections should be considered for the older adult with pain in 1 or 2 joints, eg, bilateral knee osteoarthritis. The value of corticosteroid injections for the patient with CLBP is less clear. The strongest evidence for effectiveness is in the setting of a herniated disk associated with radiculopathy. A critical review of minimally invasive procedures for the patient with low back pain is provided elsewhere.12 In general, injection therapies should be viewed as a tool to enhance compliance with rehabilitation efforts, which represent the mainstay of CLBP and generalized OA treatment. Steps 3 through 6 include a range of pharmacologic options. If regularly scheduled acetaminophen fails, nonacetylated salicylates (eg, salsalate, choline magnesium trisalicylate) should be considered because of their superior side-effect profile as compared with traditional nonsteroidal anti-inflammatory drugs (NSAIDs). Medications in Step 5 (other NSAIDs and weak opioids) include propoxyphene, codeine, hydrocodone, and tramadol. Propoxyphene is generally contraindicated in older adults because it is no more effective than placebo and retains many of the toxicities of more potent and effective opioids. Codeine is an effective antitussive but a weak analgesic. Before prescribing either weak or strong opioids, patients must be counseled about their potential side effects, and those that are preventable should be addressed. For example, opioids increase the risk of falls; therefore, physical therapy to enhance the patient’s mobility and stability is recommended before opioids are prescribed. In addition, a stimulant laxative (eg, senna) should be taken at the first sign of constipation. Detailed recommendations regarding dosing of nonopioid and opioid analgesics, precautions, and potential drug-drug interactions have been published by the American Geriatrics Society.13 Step 7 includes surgical procedures. In general, total joint replacement is considered after noninvasive or minimally invasive strategies have failed to control pain. Guidelines regarding when to pursue surgical treatment for refractory low back pain are less clear. Back surgery is elective in the vast majority of cases and rates of failed back surgery syndrome are substantial, with estimates ranging from 5% Table 4 Symptoms and Disorders that Commonly Coexist in Patients with Fibromyalgia Syndrome Postexertional pain Restless legs Sleep apnea Anxiety and depression Dysesthesias and paresthesias Impaired memory and concentration Vague auditory, vestibular, and ocular symptoms Intolerance or allergies to multiple medications Palpitations Dyspnea Regional pain syndromes ● Tension and migraine headaches ● Atypical chest pain ● Temporomandibular symptoms ● Myofascial pain ● Pelvic pain ● Dyspareunia Irritable bowel syndrome Cold intolerance Urinary frequency with interstitial cystitis Subjective joint swelling Fluid retention Unexplained bruising 312 Table 5 First-line Medications for Neuropathic Pain Key Drug-Disease Interactions Medication Pharmacokinetics Key Drug-Drug Interactions Tricyclic Antidepressants (TCAs) Nortriptyline Desipramine (Amitriptyline) Hepatic metabolism; higher levels of active metabolites in the elderly Antipsychotics, anticholinergics, selective serotonin reuptake inhibitors (SSRI), sedativehypnotics, antiarrhythmics, MAO inhibitors, clonidine, antiretrovirals Anticonvulsants Gabapentin Opioids Opioids and opioid-like drugs Oxycodone Morphine Tramadol Anticholinergics, sedativehypnotics, anxiolytics, CYP2D6 inhibitors, SSRIs, TCAs, muscle relaxants Ileus, chronic obstructive pulmonary disease, dementia, prostatic hypertrophy Topical anesthetics Topical lidocaine patch 5% Renal elimination; prolonged halflife with renal impairment Hepatic metabolism and renal elimination; plasma levels may be higher in the elderly Very little systemic absorption Myocardial infarction, QT prolongation, AV block, bundle branch block, ileus, prostatic hypertrophy, glaucoma, seizure disorder, dementia Dementia, ataxia Class I antiarrhythmics Important Adverse Effects Arrhythmia, cardiac conduction block, orthostatic hypotension, urinary retention, constipation, cognitive impairment; adverse withdrawal events after abrupt discontinuation; death if torsades de pointes Somnolence, dizziness, peripheral edema, increased appetite and weight gain, adverse withdrawal events after abrupt discontinuation Constipation, sedation, nausea/vomiting, respiratory depression, nervous system symptoms, pruritis, adverse withdrawal events after abrupt discontinuation Skin rash Reprinted from: Schmader KE, Dworkin RH. Clinical features and treatment of postherpetic neuralgia and peripheral neuropathy in older adults. In: Gibson SJ, Weiner DK, eds. Pain in Older Persons, Progress in Pain Research and Management, Vol. 35. Seattle, Washington: IASP Press; 2005:363, with permission from IASP Press. The American Journal of Medicine, Vol 120, No 4, April 2007 Medication Class Weiner Chronic Pain in the Elderly Table 6 313 Dosage of First-Line Medications for Neuropathic Pain* Duration of Adequate Trial Medication Beginning Dosage Titration Maximum Dosage Gabapentin 100-300 mg qhs Lidocaine patch 5% Maximum of 3 patches daily for a maximum of 12 hours 2.5-15 mg every 4 hours as needed Increase by 100-300 mg a day every 1-7 days as tolerated in divided doses up to tid None needed 3600 mg daily (1200 mg tid); reduce if creatinine clearance less than 60 mL/min Maximum of 3 patches daily for a maximum of 12 hours 3-8 weeks for titration plus 1-2 weeks at maximum tolerated dosage 2 weeks After 1-2 weeks, convert total daily dosage to long-acting opioid analgesic and continue short-acting medication as needed Increase by 25-50 mg daily in divided doses every 3-7 days as tolerated Increase by 10-25 mg daily every 3-7 days as tolerated No maximum with careful titration; consider evaluation by pain specialist at dosages exceeding 120-180 mg daily 400 mg daily (100 mg qid); in patients over 75 years of age, 300 mg daily in divided doses 75-150 mg daily; if blood level of active drug and its metabolite is below 100 ng/ml, continue titration with caution 4-6 weeks Opioid analgesics (dosages given are for morphine) Tramadol 25 mg once daily Tricyclic antidepressants, especially nortriptyline or desipramine 10-25 mg qhs 4 weeks 6-8 weeks with at least 1-2 weeks at maximum tolerated dosage Reprinted from: Schmader KE, Dworkin RH. Clinical features and treatment of postherpetic neuralgia and peripheral neuropathy in older adults. In: Gibson SJ, Weiner DK, eds. Pain in Older Persons, Progress in Pain Research and Management, Vol. 35. Seattle, Washington: IASP Press; 2005:365, with permission from IASP Press. Originally adapted with permission from: Dworkin RH, Allen RR, Argoff CR, Backonja M, et al. Arch Neurol. 2003;60:1524-1534. to 40%. Thus, back surgery should be considered for clearcut cases, such as deterioration of neurological function or a herniated disc with anatomical location correlating precisely with symptom location and failure to respond to nonsurgical management. Otherwise, back surgery should be considered cautiously. The value of minimally invasive surgical procedures for the treatment of low back pain is currently under investigation. Fibromyalgia Syndrome Definition and Pathogenesis. Fibromyalgia syndrome (FMS) affects 7% of women between the ages of 60 and 79 years.14 FMS is characterized by generalized pain and characteristic tender points on physical examination (Table 3). Most patients with FMS also suffer from morning stiffness, fatigue, and nonrestorative sleep. Once thought of as an illness based in psychopathology, it is now recognized that FMS is associated with dysregulation of the central nervous system. That is, the nervous system of the FMS patient does not process pain normally. Evaluation. A careful history and physical examination is the key to FMS diagnosis. It is not a diagnosis of exclusion. A number of other disorders may coexist in patients with FMS, such as migraine headaches, depression, and sleep apnea. Table 4 lists these disorders as well as other symptoms from which patients with FMS suffer. Often, patients report pain for decades, even during childhood (eg, “growing pains”). There is increasing evidence that FMS is a heritable disorder, thus practitioners should obtain a thorough family history in the older adult with suspected FMS. A combination of characteristic symptoms along with palpation-elicited tenderness supports a diagnosis of FMS. The presence of ⱖ11 of 18 characteristic tender points has been used for classification purposes (ie, distinguishing patients with FMS from those with other rheumatologic disorders), but this exact number is not required to make a diagnosis. Typically, patients with FMS have widespread tenderness (ie, pain elicited by palpation when the examiner uses enough pressure to blanch the thumbnail bed). Treatment. Aerobic exercise is an important component of treatment. The symptoms that most interfere with patients’ quality of life include pain, fatigue, limited activity tolerance, and sleep disturbance. A variety of medications, such as tricyclic antidepressants, selective serotonin reuptake inhibitors, and cyclobenzaprine, may be effective in targeting these symptoms. For detailed recommendations on the treatment of fibromyalgia, the reader is referred to guidelines recently published by the American Pain Society.15 Patients 314 with refractory symptoms should be referred for interdisciplinary treatment that may include cognitive-behavioral therapy, instruction in flare self-management techniques and how to pace engagement in aerobic exercise, and methods to enhance sleep hygiene. Recently pregabalin also has been approved. Peripheral Neuropathy Definition and Pathogenesis. Neuropathic pain is defined as pain “initiated or caused by a primary lesion or dysfunction in the nervous system.”16 The most common causes in older adults are diabetes mellitus and reactivation of herpes zoster (ie, postherpetic neuralgia). Axial arthritis (eg, cervical and lumbar spondylosis) associated with radiculopathy is also considered by many experts to be a form of neuropathic pain. Other causes of peripheral neuropathy in older adults include alcoholic polyneuropathy, chemotherapy-induced polyneuropathy, entrapment neuropathies, postmastectomy pain, post-thoracotomy pain, nerve compression or infiltration by tumor, phantom limb pain, postradiation plexopathy, and trigeminal neuralgia.17 Central poststroke pain may also present with symptoms that mimic peripheral neuropathy. Evaluation. Although several specialized tests are available for the assessment of neuropathic pain, such as quantitative sensory testing and electromyography/nerve conduction, the history and physical examination remain the cornerstone of the evaluation. Patients with peripheral neuropathy often complain of constant or intermittent pain (typically worse at night and with inactivity), stimulus evoked-pain such as Table 7 Guiding Principles for Caregivers of Older Adults with Chronic Pain and Comorbid Dementia ● Chronic nonmalignant pain is not in and of itself harmful, and should not preclude performing routine activities. ● Try to use distraction as much as possible to lessen patient’s focus on pain. ● If anxiety is a prominent component of pain behavior, use gentle touch (eg, rubbing the person’s back) in an effort to calm the patient. ● Ask the patient’s primary provider or physical therapist about available nonpharmacologic approaches to pain management (eg, gentle massage, balms and ointments, relaxation techniques). Systemic pharmacologic agents fraught with potential toxicities should be avoided as much as possible, although judicious and carefully monitored use of these agents should be considered on a case by case basis. ● The caregiver and patient should try performing relaxation exercises together to diminish stress of both parties. ● The caregiver should try to be supportive and reassuring when the patient voices pain complaints. These complaints should not be brushed off, but attended to in a positive way. The American Journal of Medicine, Vol 120, No 4, April 2007 Table 8 Treatment Outcome Parameters for the Older Adult with Chronic Pain Pain interference with performance of: ● Basic activities of daily living ● Instrumental activities of daily living ● Discretionary activities Mobility/activity level Energy level Appetite Sleep Mood – eg, irritability, depression Interpersonal interactions Attention and concentration Frequency of prn analgesic ingestion Pain severity allodynia or hyperalgesia, pruritis or tingling, and sensory loss. A comprehensive neurological examination should be performed on all older adults with neuropathic pain. When the cause is not obvious (eg, postmastectomy pain, postthoracotomy pain), a thorough general physical examination should be performed and any signs of malignancy should be pursued diagnostically. If no cause can be found, the following laboratory studies should be obtained: vitamin B12 and folate levels, fasting blood glucose, and serum/urine electrophoresis. If a cause still cannot be identified, the patient should be referred to a neurologist. Treatment. Neuropathic pain is typically more refractory to treatment efforts than nociceptive pain. A number of pharmacologic options are available. Tables 5 and 6 summarize medications and dosing guidelines for the treatment of neuropathic pain. THE ROLE OF DEPRESSION AND DEMENTIA IN PAIN MANAGEMENT In 1965, the Gate Control Theory of Pain was born, and its principles continue to guide pain management practice today. This theory emphasizes the central role of the brain in pain processing and accounts for the effectiveness of cognitive behavioral therapy in management of chronic pain. When the brain functions abnormally, as in the case of depression or dementia, pain control becomes more challenging. Thus, practitioners that care for older adults with chronic pain must be as aggressive about recognizing and treating these disorders as they are about the pain itself. While depression is eminently treatable, the presence of dementia in the older adult with chronic pain poses a considerable challenge. Often, those with dementia have exaggerated fear responses to pain which, in turn, can intensify the pain experience. The pharmacologic and nonpharmacologic modalities that have already been discussed should also be offered to the older adult with dementia. Education should be emphasized, especially education of caregivers. Components of care-giver education are provided in Table 7. Weiner Chronic Pain in the Elderly HOW TO DETERMINE WHETHER PAIN TREATMENT IS EFFECTIVE Pain intensity is only one of many parameters that may improve when chronic pain is managed successfully. Patients with chronic nonmalignant pain should anticipate, on average, no more than 30%-50% reduction in pain intensity. Physical function, mood, endurance, sleep, appetite, and interpersonal interactions may respond even more substantially to treatment, as may overall quality of life. As part of the initial assessment, therefore, the practitioner should clearly identify treatment goals in order to determine the effectiveness of therapy. Although treatment goals must be individualized, a list of potential outcome parameters is provided in Table 8. HOW AND WHEN TO REFER TO A PAIN SPECIALIST The decision regarding when and to whom to refer the older adult with refractory pain depends upon the patient’s goals. In general, referral to a pain specialist should be considered when the patient continues to experience disabling pain despite efforts to control symptoms with medications and other therapeutic modalities (eg, injections, physical therapy). Pain specialists also vary widely in their training and approach to treatment. Some specialists focus exclusively on injection procedures, while others work with an interdisciplinary team that utilizes a rehabilitative approach. Because of the multifactorial nature of chronic pain syndromes in older adults, the latter strategy is favored and appears to be most effective. References 1. Simons DG, Travell JG, Simons LS, eds. Travell & Simons’ Myofascial Pain and Dysfunction—The Trigger Point Manual, Volume I. Upper Half of Body, Volume II. Lower Half of Body. Second Ed. Baltimore: Williams & Wilkins; 1999. 2. Gunn CC. Neuropathic myofascial pain syndromes. In: Loeser JD, Butler SH, Chapman CR, et al. Bonica’s Management of Pain. Third Ed. Philadelphia: Lippincott Williams & Wilkins; 2001. 315 3. Gerwin RD. Classification, epidemiology, and natural history of myofascial pain syndrome. Curr Pain Headache Rep. 2001;5:412-20. 4. Borg-Stein J. Treatment of fibromyalgia, myofascial pain, and related disorders. Phys Med Rehab Clin North Am. 2006;17:491-510. 5. Hong CZ. Lidocaine injection versus dry needling to myofascial trigger point: the importance of the local twitch response. Am J Phys Med Rehab. 1994;73:256-63. 6. Jarvik JG, Deyo RA. Diagnostic evaluation of low back pain with emphasis on imaging. Ann Intern Med. 2002;137:586-97. 7. Jarvik JJ, Hollingworth W, Heagerty P, Haynor DR, Deyo RA. The longitudinal assessment of imaging and disability of the back (LAIDBack) study: baseline data. Spine. 2001;26:1158-66. 8. Airaksinen O, Herno A, Turunen V, Saari T, Suomlainen O. Surgical outcome of 438 patient treated surgically for lumbar spinal stenosis. Spine. 1997;22:2278-82. 9. Frazier DD, Lipson SJ, Fossel AH, Katz JN. Associations between spinal deformity and outcomes after decompression for spinal stenosis. Spine. 1997;22:2025-9. 10. Prestwood K. Complementary and alternative medicine approaches to pain in older persons. In: Gibson SJ, Weiner DK, eds. Pain in Older Persons, Progress in Pain Research and Management. Seattle: IASP Press; 2005. 11. American Geriatrics Society Panel on Exercise and Osteoarthritis. Exercise prescription for older adults with osteoarthritis pain: Consensus practice recommendations. J Am Geriatr Soc. 2001;49:808-23. 12. Bernstein CD, Lateef B, Fine PG. Interventional pain management procedures in older patients. In: Gibson SJ, Weiner DK, eds. Pain in Older Persons, Progress in Pain Research and Management. Seattle: IASP Press; 2005:263-83. 13. AGS Panel on Persistent Pain in Older Persons. The Management of Persistent Pain in Older Persons. American Geriatrics Society. J Am Geriatr Soc. 2002;50:S205-S224. 14. Wolfe F, Ross K, Anderson J, Russell IJ, Hebert L. The prevalence and characteristics of fibromyalgia in the general population. Arthritis Rheum. 1995;38:19-28. 15. Burckhardt C, Goldenberg DL, Crofford L, et al. Guideline for the Management of Fibromyalgia Syndrome Pain in Adults and Children—APS Clinical Practice Guidelines Series. Fourth Ed. Glenview, Illinois: American Pain Society; 2005. 16. Turk DC, Okifuji A. Pain terms and taxonomies of pain. In: Loeser JD, ed. Bonica’s Management of Pain. Third Ed. Philadelphia: Lippincott Williams & Wilkins; 2001:17-25. 17. Schmader KE, Dworkin RH. Clinical features and treatment of postherpetic neuralgia and peripheral neuropathy in older adults. In: Gibson SJ, Weiner DK, eds. Pain in Older Persons, Progress in Pain Research and Management. Seattle: IASP Press; 2005:355-75. The American Journal of Medicine (2007) 120, 316-318 DIAGNOSTIC DILEMMA Charles M. Wiener, MD, Section Editor Too Much of a Good Thing Lisa Call Pastel, MD, Jonathan M. Ross, MD, FACP Dartmouth-Hitchcock Medical Center, Lebanon, NH. PRESENTATION The increasing use of supplements in the US challenges physicians to understand the effects of and quantify the usage of these readily available medications. Unfortunately, all too often physicians don’t inquire about supplement usage, and patients don’t volunteer the information. Our patient was a 46-year-old man who presented with neutropenia and anemia following multiple surgical complications that began after a gastric bypass 4 years earlier (Figure 1). He developed an incisional hernia, a small bowel obstruction, and an abdominal abscess and had difficulties with wound healing. His most recent surgery— 6 months earlier—left him with an open abdominal wound that was allowed to heal by secondary intention. After his gastric bypass he had lost over 100 pounds with near resolution of diabetes, hypertension, and obstructive sleep apnea. He was wheelchair bound and on pain medications due to chronic back and knee pain. He was previously employed as a journalist until he became disabled from chronic pain. Despite his medical problems, he homeschooled his daughters full time. At presentation, he denied past or present infections, fevers, fatigue, or dyspnea. The patient was taking multiple, potentially conflicting medications and supplements. His medications included: methadone, hydrocodone, diazepam, methocarbamol, acetaminophen, cephalexin, aspirin, furosemide, hydrochlorothiazide, metoprolol, a daily multivitamin, vitamin B-12 supplementation, calcium citrate, vitamin A, zinc, and vitamin C. He had no known allergies. He was a past smoker, having quit 11 years ago, but he denied past or present alcohol use. The family history was notable for coronary artery disease. On examination the patient appeared well. He was afebrile with normal vital signs. He was anicteric and had no lymphadenopathy; cardiopulmonary exam was normal. His abdomen had an open midline abdominal wound without Requests for reprints should be addressed to Lisa Call Pastel, MD, Department of Internal Medicine, Dartmout-Hitchcock Medical Center, One Medical Center Drive, Lebanon, NH 03756. E-mail address: [email protected] 0002-9343/$ -see front matter © 2007 Elsevier Inc. All rights reserved. doi:10.1016/j.amjmed.2006.11.024 apparent infection. There was no palpable hepatosplenomegaly or peripheral edema. His laboratory tests were significant for a low white blood count of 1.9 ⫻ 103/L with an absolute neutrophil count of 500 and hemoglobin of 9.0 g/dL. His smear showed anisocytosis, poikilocytosis, occasional target cells, ovalocytes, and teardrop cells. Iron studies were consistent with anemia of chronic disease. Thyroid-stimulating hormone was slightly elevated; however, the remainder of the thyroid panel was normal. ANA, HIV, c-ANCA, p-ANCA, and hepatitis serologies were all normal (Table 1). ASSESSMENT The assessment was medication-related neutropenia. Hydrochlorothiazide, cephalexin, metoprolol, aspirin, and acetaminophen were discontinued without improvement in his neutropenia; iron therapy was initiated. Bone marrow biopsy demonstrated normocellular marrow with myeloid hypoplasia and adequate iron stores. In anticipation of further abdominal surgery, the patient was given granulocyte colony stimulating factor, which had a modest response. The workup outlined above continued over the next year. DIAGNOSIS Eight months later, the patient was subsequently admitted to the hospital for neutropenic fever. At this time, his medications were thoroughly reviewed again. The medical team discovered that for the past year the patient had been taking 50 mg of zinc 4 times a day to aid in wound healing. At his previous presentation, he did not tell his outpatient physician the dosage of zinc that he was taking. Serum copper and ceruloplasmin—the protein which carries copper— were found to be extremely low at ⬍0.1 ug/mL (0.75-1.45 ug/mL normal range) and 1.3 mg/dL (22.9-43.1 mg/dL normal range), respectively. These findings were consistent with zinc-induced copper deficiency. MANAGEMENT Within 1 month, discontinuation of zinc and supplementation with copper (3 mg copper sulfate 3 times a day) in- Pastel and Ross Zinc Toxicity Gastric bypass 317 Hernia/obstruction Abscess drained Wound left open Iron replacement Presentation Admit for neutropenic fever 2001 7/2003 1/2004 5/2004 1/2005 WBC Hct (%) 7.1 x 10³ 31.8 5.9 x 10³ 27.0 1.9 x 10 3 30.0 1.3 X 10³ 35.7 Figure 1 Timeline of presentation. This timeline demonstrates the patient’s development of neutropenia and anemia in the context of his complicated surgical issues. Over a period of 6 months he became significantly neutropenic and anemic. WBC ⫽ white blood count. Hct ⫽ Hematocrit. creased the patient’s white count to 4.1 ⫻ 103/L and hemoglobin to 12.4 g/dL. Supplementation with copper was planned for a total of 6 months. Copper and ceruloplasmin levels were not repeated after supplementation. Zinc toxicity causing copper deficiency, and resultant neutropenia and anemia is rare, reported in less than 30 cases since 1977.1 Zinc excess occurs when doses exceed 50-100 mg/day for prolonged periods, estimated at 6 weeks to several months.2 This has been observed in patients taking zinc for treatment of acne,3 the common cold,4 and wound healing.5 It also has occurred in psychiatric patients who have consumed pennies (after 1982).6 The US Department of Agriculture recommends 9-11 mg of zinc per day for adults, with an upper limit of 40 mg/day.4 Intake of zinc lozenges should be limited to less than 50 mg/day.1 At our institution, doses for wound healing are usually 50 mg 3 times a day for 2 weeks only.7 This patient had been taking slightly more than the recommended dose (200 mg/day) for wound healing and for far too long. There is limited evidence concerning zinc and wound healing; however, the research suggests that patients who are zinc deficient have the best response to supplementation.4 The mechanism by which zinc toxicity causes copper deficiency involves the metal-binding ligand metallothionein, which is found in enterocytes. It binds to both zinc and copper but prefers copper. Excess zinc induces this ligand, and bound copper is lost when enterocytes are shed.1 Figure 2 shows the structure of metallothionein, as determined by x-ray crystallography. Zinc and copper bind at available cysteines.8 It is unknown exactly how copper deficiency causes neutropenia; however, some research suggests that it interferes with maturation of neutrophils from the promyelocyte/ myelocyte stage to more mature forms.10 It also has been suggested that copper deficiency somehow marks the neutrophils as foreign, and they are subsequently destroyed.10 Anemia results when reduced levels of ceruloplasmin oxidize ferrous (2⫹) to ferric (3⫹) iron for subsequent binding to transferrin. Additionally, the copper-dependent enzyme cytochrome-c oxidase further reduces ferric iron to be used for heme synthesis. A disruption in these steps of heme synthesis can result in sideroblastic anemia, which has been reported in several cases of copper deficiency. In the setting of copper deficiency, it also has been observed that there are reduced levels of the enzyme superoxide dismutase that Table 1 Results of Laboratory Tests Normal Range At Presentation White cell count (⫻103/L) Hemoglobin (g/dL) Hematocrit (%) Mean corpuscular volume (FL) Red Cell Distribution Width (%) Peripheral Smear 4.0-10.0 14.0-17.0 40-54 78.2-95.8 16.0 1.9 9.0 30.0 85.0 11.5-15.0 Sodium (mEq/L) Potassium (mEq/L) Chloride (mEq/L) Carbon dioxide (mEq/L) Urea nitrogen (mg/dL) Creatinine (mg/dL) Glucose (mg/dL) Calcium (mg/dL) Magnesium (mEq/dL) Phosphorus (mg/dL) Total bilirubin (mg/dL) Direct bibirubin (mg/dL) Aspartate Aminotransferase (units/L) Alanine Aminotransferase (units/L) Alkaline Phosphatase (units/L) Albumin (g/dL) Erythrocyte Sedimentation rate (mm/h) Thyroid-stimulating hormone (mIU/L) Iron (ug/dL) Total Iron Binding Capacity (ug/dL) Transferrin Saturation (%) Ferritin (ng/mL) Erythropoietin (mU/mL) c-ANCA p-ANCA HIV Hepatitis A, B, and C Anti-nuclear Antibody 135-145 3.5-5.0 98-107 22-31 10-20 0.8-1.5 70-110 8.5-10.5 1.3-2.0 2.5-4.5 0.2-1.3 0.0-0.3 15-50 Anisocytosis, poikilocytosis, occasional target cells, occasional oval and teardrop cells 143 3.5 103 30 16 0.5 93 9.0 1.44 4.5 1.4 0.1 22 Variable 10-56 17 40-120 3.2-5.2 0-15 75 4.0 50 0.27-4.20 45-160 250-450 20-50 30-400 4-24 4.26 9 171 5 754 30 Negative Negative Negative Negative Negative 318 The American Journal of Medicine, Vol 120, No 4, April 2007 Figure 2 Structure of Metallothionein. Copper and zinc bind at the available cysteine molecules. There is a binding preference for copper. Szilayi and Z Fenselau C. Molecular Dynamics Simulation of Metallothionein-Drug Complexes. Drug Metabolism and Disposition.2000;28(2):174-179. maintains red blood cell membrane integrity. As a result increased red blood cell turnover is observed with copper deficiency.6 Treatment for copper deficiency consists of discontinuation of zinc therapy and supplementation with copper. This results in normalized hematologic indices within months.1 This patient’s hematologic problems emphasize the importance of a complete medication review including specific doses of supplementary medications. This is particularly important with increasing use of over-the-counter medications and supplements, typically not reported by patients and not quantified by physicians. References 1. Irving JA, Mattman A, Lockitch G, et al. Element of caution: a case of reversible cytopenias associated with excessive zinc supplementation. CMAJ. 2003;169(2):129-31. 2. Fosmire GJ. Zinc toxicity. Am J Clin Nutr. 1990;51(2):225-7. 3. Igic PG, Lee E, Harper W, et al. Toxic effects associated with Consumption of Zinc. Mayo Clin Proc. 2002;77(7):713-6. 4. National Institutes of Health [homepage on the Internet]. Health Info – Dietary Supplement Fact Sheets. Last updated Dec. 2002. Available from: http://ods.od.nih.gov/factsheets/cc/zinc.html#rda. 5. Todd LM, Godber IM, Gunn IR. Iatrogenic copper deficiency causing anaemia and neutropenia. Ann Clin Biochem. 2004;41(Pt 5):414-6. 6. Willis MS, Monaghan SA, Miller ML, et al. Zinc-induced copper deficiency: a report of three cases initially recognized on bone marrow examination. Am J Clin Pathol. 2005;123(1):125-31. 7. Nolette P. Dartmouth-Hitchcock Medical Center Wound Care Team. Oct 2005. 8. Szilayi Z and Fenselau C. Molecular Dynamics Simulation of Metallothionein-Drug Complexes. Drug Metabolism and Disposition. 2000; 28(2):174-179. 9. Brewer GJ, Hill GM, Prasad AS, et al. Oral zinc therapy for Wilson’s disease. Ann Intern Med. 1983;99(3):314-9. 10. Percival SS. Neutropenia caused by copper deficiency: possible mechanisms of action. Nutr Rev. 1995;053(3):59-66. The American Journal of Medicine (2007) 120, 319-321 DIAGNOSTIC DILEMMA: INFECTIOUS DISEASE Charles M. Wiener, MD, Section Editor A Case for Vaccination Aima Ahonkai, MD and Noah Lechtzin, MD, MHS Osler Medical Service, Johns Hopkins Hospital, Baltimore, MD PRESENTATION Patients occasionally question the wisdom of immunization, but the case of a 56-year-old woman offers sober testimony to the potential value of pneumococcal vaccination. She presented to the emergency department after 1 to 2 days of nausea, vomiting, confusion, and incontinence. Family members reported symptoms of a flu-like illness marked by fever, malaise, and myalgias in the preceding week. On admission, the patient had a fever of 103.1°F (39.5°) compounded by hypotension (95/54 mm Hg), tachycardia (160 beats per minute), hypoxia (oxygen saturation on room air was 93%), and altered mental status. She had a history of hypertension, and 25 years earlier, she had Hodgkin’s lymphoma, for which she had undergone splenectomy, chemotherapy, and radiation. The cancer was in remission, according to a post-staging laparotomy. Despite her history of Hodgkin’s lymphoma and splenectomy, the patient had never received pneumococcal vaccine. ASSESSMENT The patient was lethargic and confused but had no focal neurologic deficits or meningeal signs. She had pharyngeal erythema but no exudates. Her lungs were clear, and her abdomen was soft. Weak pulses and poor skin turgor with mottling of the skin was noted on both of her upper and lower extremities. Her initial Acute Physiology and Chronic Health Evaluation (APACHE) II score was 14, predicting a 49.7% risk of death. Laboratory testing was notable for a white blood cell count of 7.6 ⫻ 103/cells/mm3 with 28% bands and 58% polymorphonuclear leukocytes; acute renal failure (creatinine, 1.6 mg/dL); coagulopathy (international normalized ratio ⬎1.5); and mild lactic acidosis (serum lactate, 3.6 mmol/L). Her initial chest radiograph showed no infiltrates. In the medical intensive care unit, the patient was aggressively resuscitated with fluids. Nonetheless, her hypotension and acidosis worsened (peak serum lactate was 10.6 Requests for reprints should be addressed to Charles M. Wiener, MD. E-mail address: [email protected] 0002-9343/$ -see front matter © 2007 Elsevier Inc. All rights reserved. doi:10.1016/j.amjmed.2007.02.011 mmol/L), and acute respiratory failure required treatment with norepinephrine, endotracheal intubation, and mechanical ventilation. Stress-dose corticosteroids were administered, as was a 96-hour infusion of activated protein C. Vancomycin, ceftriaxone, and doxycycline also were administered as empirical treatment for sepsis and meningitis. Lumbar puncture was deferred, given the risk of bleeding while on activated protein C. Initial blood cultures grew penicillin-resistant Streptococcus pneumoniae in 2 of 2 cultures within 6 hours of presentation; doxycycline was discontinued. Sputum and urine cultures remained negative. Within 24 hours of admission, the patient developed purpuric skin lesions on her upper extremities, lower extremities, and nose, with patchy areas of ecchymoses and bullae. She suffered multi-organ-system dysfunction with acute renal failure (peak creatinine, 3.6 mg/dL), hepatitis (peak aspartate aminotransferase, 1015 IU/L; peak alanine aminotransferase, 594 IU/L), respiratory failure, and disseminated intravascular coagulopathy (D-dimer, 55 mg/L; lactate dehydrogenase, 1186 U/L; international normalized ratio, 2.1; activated partial thromboplastin time, 54 seconds; and fibrinogen, 163 mg/dL). Her skin lesions became increasingly necrotic, and she eventually developed dry gangrene of her digits and feet (Figures 1-3). DIAGNOSIS Purpura fulminans secondary to streptococcal sepsis was diagnosed. This syndrome, distinguished by disseminated intravascular coagulation and purpuric skin lesions, is a rare complication of overwhelming septic shock from severe bacterial infection. Or, it can arise in conjunction with inherited homozygous deficiencies of protein C or protein S— unusual conditions— or, on occasion, autoimmune disease, including antiphospholipid antibody syndrome. Warfarin-induced skin necrosis and cholestasis have infrequently been associated with purpura fulminans, as well. The striking skin lesions result from perivascular hemorrhage and necrosis triggered by dermal microvascular thromboses. Deep-tissue skin necrosis is often extensive, 320 The American Journal of Medicine, Vol 120, No 4, April 2007 Figure 1 The patient had extensive gangrene of the distal phalanges and plantar surface of the foot. causing gangrene of extremities. Amputation is a likely outcome.1 Even with advances in critical care medicine, mortality from infection-related purpura fulminans still approaches 50%.2 A 10-year retrospective chart review found that Neisseria meningitides was the most common etiologic agent in purpura fulminans in infants and adolescents, while Streptococcus pneumoniae was the most common etiologic agent among adults.3 Still, case reports and case series describing meningococcal purpura fulminans in pediatric populations appear much more commonly in the literature than do cases generated by S. pneumonia infection. Infants and children are likely more vulnerable because of congenital and acquired immunodeficiencies and coagulation defects. MANAGEMENT Several approaches have been proposed and studied for the treatment of sepsis-related purpura fulminans, including plasmapheresis, antiendotoxin therapy, anticytokine therapies, heparin, antithrombin III, thrombolysis, and fasciotomy, although none have been examined in a randomized fashion. Undoubtedly, the ideal management of the condition includes early antibiotic use, aggressive fluid resuscitation, ventilatory support, inotropic support, tight glucose control, and steroid replacement as necessary. Figure 2 digits. Hemorrhagic bullae progressed to gangrene in the Figure 3 Geographic cutaneous infarctions and bullae from microvascular thromboses are classic lesions in this condition. Activated protein C may also have a role in limiting morbidity. Protein C, which has anticoagulant, fibrinolytic, and anti-inflammatory properties, seems to play a central role in modulating the sepsis disease process, and it has been shown to reduce mortality in severely septic patients.4 Though it is not clear which patients with severe sepsis are at risk for developing purpura fulminans, the data support greater peril for those infected with meningococci or Streptococcus species. In patients with meningococcal sepsis, increased levels of plasminogen activator inhibitor-1 and decreased levels of protein C are linked with the development of purpuric skin lesions and poor prognosis. In fact, levels of protein C approximate those seen in homozygous protein C deficiency.5-7 Most of the literature describing protein C replacement in purpura fulminans applies to patients with meningococcal 321 sepsis. The data suggest that protein C replacement and anticoagulation improve mortality and morbidity with regard to the extent of skin necrosis and the need for limb amputation. One prospective study included 12 patients, aged 3 months to 27 years, who were admitted to an intensive care unit with severe meningococcemia, septic shock, purpura fulminans, disseminated intravascular coagulation, and protein C levels below 3%. In addition to conventional treatment, they each received continuous infusions of protein C concentrate and unfractionated heparin. Survival was 100%, and only 2 patients required amputations. One began protein C 48 hours after admission, and the other began treatment at 72 hours; the rest of the patients were given protein C by the 15th hour of admission.8 In an open-label prospective study, protein C concentrate was administered to 36 patients, aged 3 months to 72 years, with severe meningococcemia, purpura fulminans, and multiorgan failure.9 Survival was 98%, and the overall amputation rate was 12%, compared with a predicted amputation risk of 33%. The amputation rate among patients who were treated with protein C concentrate sooner—within 24 hours of admission—was 6.5%. Since 1970, there have been 10 case reports of purpura fulminans associated with S. pneumoniae. Most occurred in asplenic patients, and there is little data on the efficacy of activated protein C and anticoagulation on morbidity and mortality in this group.10-13 Our patient is one of very few people reported to receive prompt treatment with activated protein C for pneumococcal-related purpura fulminans. Despite aggressive management, including early treatment with protein C, our patient developed extensive gangrene requiring amputation of all digits on both hands and ultimately, bilateral foot amputations. It is possible that purpura fulminans in patients with streptococcal infection may be modulated by additional or unique factors that play more significant roles than activated protein C. Pneumococci do not contain endotoxin, which is central in the initiation of the coagulation cascade in purpura fulminans spurred by gram negative organisms. The cell wall does, nevertheless, stimulate production of proinflammatory cytokines and activate complement through the alternative pathway. It has been postulated that circulating complement-activating immune complexes incite immunemediated destruction in pneumococcal disease, though direct vascular damage cannot be ruled out.14 This case underscores the importance of preventing severe bacterial infections with a vaccination program in asplenic patients.15 It also suggests that activated protein C may not have the same role in meningococcal and pneumococcal purpura fulminans. Alternate treatments for purpura fulminans in pneumococcal sepsis deserve further evaluation. References 1. Smith OP, White B. Infectious purpura fulminans: diagnosis and treatment. Br J Haematol. 1999;104:202-207. 2. Giraud T, Dhainaut JF, Schremmer B, et al. Adult overwhelming meningococcal purpura. A study of 35 cases, 1977-1989. Arch Intern Med. 1991;151:310-316. 3. Warner PM, Kagan RJ, Yakuboff KP, et al. Current management of purpura fulminans: a multicenter study. J Burn Care Rehabil. 2003; 24:119-126. 4. Bernard GR, Vincent JL, Laterre PF, et al. Efficacy and safety of recombinant human activated protein C for severe sepsis. N Engl J Med. 2001;344:699-709. 5. Hermans PW, Hibberd ML, Booy R, et al. 4G/5G promoter polymorphism in the plasminogen-activator-inhibitor-1 gene and outcome of meningococcal disease. Meningococcal Research Group. Lancet. 1999;354:556-560. 6. Powars D, Larsen R, Johnson J, et al. Epidemic meningococcemia and purpura fulminans with induced protein C deficiency. Clin Infect Dis. 1993;17:254-261. 7. Fijnvandraat K, Derkx B, Bijlmer R, et al. Coagulation activation and tissue necrosis in meningococcal septic shock: severely reduced protein C levels predict a high mortality. Thromb Haemost. 1995;73:1520. 8. Smith OP, White B, Vaughan D, et al. Use of protein C concentrate, heparin, and hemodiafiltration in meningococcus-induced purpura fulminans. Lancet. 1997;350:1590-1593. 9. White B, Livingstone W, Murphy C, et al. An open label study of the role of adjuvant hemostatic support with protein C replacement therapy in purpura fulminans-associated meningococcemia. Blood. 2000; 96:3719-3724. 10. Noguera A, Fortuny C, Pons M, Cambra F, Palomeque A. Pneumococcal-associated purpura fulminans in a healthy infant. Pediatr Emerg Care. 2004;20:528-530. 11. Shperber Y, Geller E, Rudick V, Orda R. Purpura fulminans associated with overwhelming sepsis and disseminated intravascular coagulation following splenectomy. Isr J Med Sci.1989;25:657-659. 12. Murphy CB, Noeller K. Purpura fulminans secondary to pneumococcal sepsis in an asplenic patient. J Am Podiatr Med Assoc. 1993;83: 43-46. 13. Hautekeete ML, Berneman ZN, Bieger R, et al. Purpura fulminans in pneumococcal sepsis. Arch Intern Med. 1986;146:497-499. 14. Rintala E, Kauppila M, Seppala OP, et al. Protein C substitution in sepsis-associated purpura fulminans. Crit Care Med. 2000;28:23732378. 15. Prevention of pneumococcal disease: recommendations of the Advisory Committee on Immunization Practices (ACIP). MMWR Recomm Rep. 1997 Apr 4;46(RR-8):1-24. The American Journal of Medicine (2007) 120, 322-324 IMAGES IN DERMATOLOGY Parwathi “Uma” Paniker, MD, Section Editor Mystery of the Silk Road John Patrick Welsh, MD,a Christopher B. Skvarka, MD,a Christine Ko, MD,b Carrie Ann Cusack, MDa a Drexel University College of Medicine, Department of Dermatology, Philadelphia, Pa; bYale University School of Medicine, Department of Dermatology, New Haven, Conn. PRESENTATION Patients often present to the dermatologist’s office with skin conditions that may be indicative of multiple diseases. When there is no specific test for a particular disease, diagnosis may be difficult. Our patient was a 34-year-old white man with a medical history significant for recurrent aphthous stomatitis. He presented with fever (101.5°F); oral and genital ulcerations; arthralgias; and painful lower extremity rash for the past 2 weeks. He denied eye pain or vision changes, known drug allergies, or contact with others who had been ill. He also reported that his father demonstrated similar symptomatology for years without diagnosis. His recent medications included only acyclovir and levofloxacin dispensed by the emergency department for his worsening symptoms. ASSESSMENT On examination, the patient exhibited scattered 0.1- to 0.3-cm herpetiform ulcerations, each with a surrounding red border on the soft palate, labial/gingival mucosae, and penis (shaft, glans, and coronal sulcus) (Figures 1 and 2). He also manifested multiple tender, blanchable, red-pink, 2.0- to 4.0-cm noduloplaques on the extensor surface of his bilateral lower extremities (dorsal feet to dorsal thigh) and a few small follicular pustules on the back and chest (Figure 3). His bilateral ankle joints and right wrist joint exhibited noticeable edema and decreased active/passive range of motion. A punch biopsy from 1 of the tender leg nodules showed a primarily lobular panniculitis with associated deep mid-tolarge artery vasculitis. Gastroenterology survey showed multiple small ulcers at the antrum, ileocecal valve, and ascending/descending colon. Further test results were negative for the following serologic markers in the patient: human immunodeficiency virus, herpes simplex virus, hepatitis B and C, rapid plasmin reagin, antinuclear antibody, rheumatoid factor, double-stranded deoxyribonucleic acid, perinuclear antineutrophil cytoplasmic antibody, central antineutrophil cytoplasmic antibody, and human leukocyte antigen-B*51. After treatment with methylprednisolone and indomethacin, our patient’s symptoms dramatically improved. He was subsequently maintained on azathioprine. DIAGNOSIS Behçet’s disease was first diagnosed 2500 years ago by the Greek physician Hippocrates of Kos,1 but it did not receive its official clinical designation until 1937. Turkish dermatologist Hulusi Behçet identified the triad of orogenital aphthosis, iritis, and hypopyon as emblematic of a uniform condition.2 Although the disease is found globally, the majority of cases concentrate along the ancient Silk Road (eastern Asia to the Mediterranean Sea between latitudes 30 and 45 degrees North). Prevalence ranges from 80 to 370 cases per 100,000 in Turkey to 0.12 to 0.33 per 100,000 in the United States.3 Behçet’s disease often manifests itself in the third or fourth decade of life.4 There is a variable sexual difference with female predominance in Japan/Korea and male predominance in the Middle East.3 Familial clustering also has been documented.5 An incurable condition, Behçet’s disease can be difficult to diagnose because there is no specific test; often physicians may have to rule out several other conditions before settling on a diagnosis.1 Behçet’s disease is marked by both mucocutaneous and systemic involvement. In 1990, the International Study Group reached consensus regarding currently accepted diagnostic criteria, which include the following: ● Requests for reprints should be addressed to John Patrick Welsh, MD, Drexel University, College of Medicine, Department of Dermatology, 219 N. Broad Street, 4th Floor, Philadelphia, PA 19107. E-mail address: [email protected]. 0002-9343/$ -see front matter © 2007 Elsevier Inc. All rights reserved. doi:10.1016/j.amjmed.2006.11.007 ● Recurrent oral aphthae (minor, major, or herpetiform) with at least 3 flares in any 12-month period. Two of the following: recurrent genital aphthae/scarring, anterior/posterior uveitis, cutaneous lesions, or a positive pathergy test result.6 Welsh et al Behcet’s Disease Figure 1 323 Oral ulcers. Although oral/genital aphthae remain the seminal cutaneous facet of Behçet’s, other common manifestations include erythema nodosum-, Sweet’s-, and pyoderma gangrenosum-like lesions; pseudofolliculitis/acne; and palpable purpura. Often the condition may be complicated by a cutaneous vasculitis, predominantly venulitis or thrombophlebitis, with relative sparing of the arterial component.7 On occasion, a necrotizing panarteritis involving small- and medium-sized arteries at the dermal-subcutaneous junction simulating cutaneous polyarteritis nodosa may also be seen.8-10 Although the mucocutaneous component is paramount, Behçet’s also may present with ocular, articular, neurologic, and gastrointestinal involvement.3 Large-vessel vascular complications develop in approximately 35% of patients with Behçet’s disease. Involvement of arteries in vital organs portends a poorer prognosis frequently necessitating immunosuppressive therapy.9-11 The most serious ocular complication is posterior uveitis, which may result in blindness. In fact, Behçet’s disease is the leading cause of blindness in Japan.12 Other ocular complications include retinal vaso-occlusion, anterior uveitis, hypopyon (purulence in the dependent anterior chamber), and secondary changes such Figure 3 as cataracts/glaucoma.13 Articular manifestations occur in approximately half of all Behçet’s cases and include a nonerosive, asymmetric oligoarthritis involving the ankles, knees, and/or wrists. Neurologic complications, only present in one-quarter of cases, are not part of the International Study Group criteria but herald severe morbidity (meningitis/meningoencephalitis, cranial palsies, brain stem lesions, psychiatric disturbances).3 Gastrointestinal involvement is often marked by abdominal pain, nausea, diarrhea, and prominent ulcerations at the ileocecal region and ascending and descending colon.14 Perforation is the most worrisome complication of gastrointestinal extension of Behçet’s disease. Our case mirrors these findings with the patient developing an associated systemic vasculitis (gastrointestinal extension) requiring azathioprine treatment. When considering a diagnosis of Behçet’s disease, one also must entertain the following differential: ● ● Figure 2 Genital ulcers. Erythema nodosum-like lesions. Orogenital ulcers—aphthous stomatitis, herpes simplex virus, herpangina, hand-foot-and-mouth disease, varicellazoster virus, syphilitic chancre, deep fungal infection, lupus erythematosus, vasculitis, and carcinoma. Erythema nodosum-like lesions—acute sarcoidosis (Lofgren’s syndrome), drug eruption (especially sulfonamides or oral contraception), bacterial/fungal infection, inflammatory bowel disease, and lymphoma.4 Although the pathogenesis of Behçet’s has not been completely elucidated, recent research has revealed a number of hereditary and environmental risk factors. Early theorists proposed an infectious cause, and although serum herpes simplex virus antibodies are increased over healthy controls, any direct link is purely speculative.6 Patients with Behçet’s disease show increased hypersensitivity in cutaneous and plasma monocytes to Streptococcus sanguis antigens (which share homologies with heat shock proteins).15 324 The theory is that stressed oral mucosal cells, after bacterial challenge, express antigenic heat shock proteins leading to attack by antimucosal T lymphocytes.15 This molecular mimicry model is loosely proven by the fact that prophylactic penicillin has been shown to decrease the frequency and duration of mucocutaneous lesions.15 Despite 2 decades of genetic research, no single causative locus has been discovered. The most frequently recurring associated genetic region is human leukocyte antigenB*51 (yet it is present in only 13% of white patients and 60% of all Behçet’s cases).16 Other implicated immunologic modulators include tumor necrosis factor, MICA alleles in the major histocompatibility complex, induced endothelial cell adhesion molecule-1, soluble CD8, interleukins 1 and 2, and impaired T and B lymphocytes.16 The pathophysiology of Behçet’s disease is further marked by vasculitis and neutrophil hyperactivity (ie, increased oxidative burst and chemotaxis). The hallmark of this enhanced neutrophil activity is the pathergy test, whereby a sterile needle prick induces a cutaneous pustular vasculitis within 24 hours of the intradermal trauma. MANAGEMENT Treatment options are dependent on both the site and the severity of lesions. Mild disease generally responds to palliative and supportive case. Recurrent mucocutaneous lesions may be treated with a combination of nonsteroidal anti-inflammatory agents, topical steroids, and colchicine (ie, “first line”).17 Severe mucocutaneous and systemic Behçet’s disease has been controlled with systemic steroids, immunosuppressives (azathioprine/cyclophosphamide/cyclosporine), thalidomide, interferon-alpha, and anti-tumor necrosis factor monoclonal antibodies (ie, “second line”).17 In addition to pharmacotherapy, exercise also helps patients with Behçet’s disease by the maintenance of strong and flexible joints.1 The goal of all Behçet’s treatment is the decrease in frequency and intensity of flares, thus limiting morbidity and serious complications. The American Journal of Medicine, Vol 120, No 4, April 2007 References 1. National Institutes of Arthritis and Muscoloskeletal and Skin Diseases. Questions and answers about Behcet’s disease. Available at: http:// www.niams.nih.gov/hi/topics/behcets/behcets.htm. Accessed October 5, 2006. 2. Behçet H. Uber rezidiverende, apthose durch ein Virus verursachte Geschwure am Mund, am Auge und an der Genitalen. Dermatol Wochenschr. 1937;105:1152-1157. 3. Sakane T, Takeno M, Suzuki N, et al. Behçet’s disease. N Engl J Med. 1999;341:1284-1291. 4. Wolff K, Johnson RA, Suurmond D. Behcet’s syndrome. In: Ko C, ed. Fitzpatrick’s Color Atlas & Synopsis of Clinical Dermatology. 5th ed. New York: McGraw-Hill Medical Publishing; 2005:368-370. 5. Gul A, Inanc M, Ocal L, et al. Familial aggregation of Behcet’s disease in Turkey. Ann Rheum Dis. 2000;59:622-625. 6. International Study Group for Behçet’s Disease. Criteria for diagnosis of Behçet’s disease. Lancet. 1990;335:1078-1080. 7. Chen KR, Kawahara Y, Miyakawa S, et al. Cutaneous vasculitis in Behçet’s disease: a clinical and histopathological study of 20 patients. J Am Acad Dermatol. 1997;36:689-696. 8. Diaz-Perez JL, Winkelmann RK. Cutaneous periarteritis nodosa. Arch Dermatol. 1974;110:407-414. 9. Liao YH, Hsiao GH, Hsiao CH. Behçet’s disease with cutaneous changes resembling polyarteritis nodosa. Br J Dermatol. 1999;140: 368-369. 10. Agarwal V, Sachdev A, Singh R, et al. Behçet’s disease with relapsing cutaneous polyarteritis nodosa-like lesions, responsive to oral cyclosporine therapy. Dermatology Online Journal. Available at: http:// dermatology.cdlib.org. Accessed May 20, 2006. 11. Huong DLT, Wechsler B, Papo T, et al. Arterial lesions in Behçet’s disease: a study in 25 patients. Int J Dermatol. 1995;34:190-192. 12. Johns Hopkins Vasculitis Center. Types of vasculitis, Behçet’s disease. Available at: http://vasculitis.med.jhu.edu/typesof/behcets.html. Accessed October 5, 2006. 13. Verity D, Wallace G, Vaughn R, et al. Behçet’s disease: from Hippocrates to the third millennium. Br J Ophthamol. 2003;87:1175-1183. 14. Bayraktar Y, Ozaslan E, Van Thiel D. Gastrointestinal manifestations of Behçet’s disease. J Clin Gastroenterol. 2000;30:144-154. 15. Calguneri M, Ertenli I, Kiraz S, et al. Effect of prophylactic benzathine penicillin on mucocutaneous symptoms of Behçet’s disease. Dermatology. 1996;192:125-128. 16. Verity D, Vaughn R, Marr J, et al. Behçet’s disease, The Silk Road, and HLA-B51: historical and geographical perspectives. Tissue Antigens. 1999;54:213-220. 17. Goker B, Goker H. Current therapy for Behçet’s disease. Am J Ther. 2002;9:465-470. The American Journal of Medicine (2007) 120, 325-327 ECG IMAGE OF THE MONTH A Racing Heart Julia H. Indik, MD, PhD, Section Editor Sarver Heart Center, University of Arizona, Tucson PRESENTATION ASSESSMENT A straightforward maneuver served 2 important purposes for an 80-year-old man with a history of palpitations. He had been having symptoms of a racing heartbeat for the past year. Daily, he would feel his heart suddenly race, making him short of breath. The episode was usually provoked by a change in posture, such as bending over. One year earlier, he had been started on the beta-adrenergic blocker metoprolol for these symptoms, but it had not been effective. His past medical history included diabetes mellitus type 2 with peripheral neuropathy, ischemic heart disease, hypertension, and hyperlipidemia. Treatment for these conditions consisted of a diuretic, an ACE inhibitor, a statin medication, metformin, and insulin. Two years earlier, the patient underwent 4-vessel coronary artery bypass graft surgery. His blood pressure was 110/60 mm Hg with a heart rate of 120 beats per minute. The patient’s ECG showed a wide complex tachycardia at a rate of 120 beats per minute (Figure 1). However, the QRS complexes are wide due to right bundle branch block. A small deflection is seen in the early part of the T wave. To help determine diagnosis, carotid sinus massage was performed with the 12-lead ECG running (Figure 2). Tachycardia abruptly broke; the last 2 P waves became slightly slower and evidence of block was evident in the AV node (no QRS complex was present). Several seconds later, sinus rhythm was established at a rate of 90 beats per minute with a prolonged PR interval of 300 msec and right bundle branch block (Figure 3). Julia H. Indik, MD, PhD, Sarver Heart Center, University of Arizona, 1501 North Campbell Avenue, Tucson, AZ 85724. E-mail address: [email protected] DIAGNOSIS This patient had atrial tachycardia, a form of supraventricular tachycardia. The finding of 2 nonconducted P waves just as tachycardia terminated clinched the diagnosis, proving that the patient did not have AV reentrant tachycardia from a bypass tract. In that situation, tachycardia cannot continue without participation of both the atria and the ventricles. Also, the P waves, wide-based and upright in Figure 1 A wide complex tachycardia was seen in this ECG from a patient with daily symptoms of palpitations. Note the small deflection at the beginning of the T wave (arrows shown in lead V3). 0002-9343/$ -see front matter © 2007 Elsevier Inc. All rights reserved. doi:10.1016/j.amjmed.2007.02.017 326 The American Journal of Medicine, Vol 120, No 4, April 2007 Figure 2 Carotid sinus massage terminated the tachycardia, with the last 2 P waves not conducted through the AV node (arrows shown in leads II, AVF, and V2). Figure 3 Sinus rhythm at a rate of 90 beats per minute was restored after the tachycardia terminated. Indik A Racing Heart leads II and AVF, were very similar to the sinus P waves of Figure 3. If the patient did have AV nodal reentrant tachycardia, the P waves would be the result of conduction backwards from the AV node, and in that situation, they are very narrow. Therefore, we were left with the diagnosis of atrial tachycardia, which may have originated from an area near the sinus node or from the crista terminalis. The PR interval is relatively long, and this is probably due to a delay in conduction through the AV node, which could be caused by medications, such as beta-adrenergic blockers, or by aging. Most atrial tachycardias are due to automaticity, and they cannot be stopped by carotid sinus massage. However, some types of atrial tachycardia can be terminated with this maneuver. In particular, with triggered activity, there is an excess of intracellular calcium that can prompt extra beats, known as delayed afterdepolarizations.1 Usually atrial tachycardia due to triggered activity is related to catecholamine excess, which can be caused by agents used to treat asthma or by digoxin intoxication, but this patient was not taking these medications.1 Instead, the finding of P waves similar to the sinus P wave suggests the possibility that this patient’s atrial tachycardia is due to a reentry mechanism—a circuit—possibly near the sinus node or the crista terminalis; this type of atrial tachycardia can also be abruptly terminated by a vagal maneuver such as carotid sinus massage.1 MANAGEMENT Atrial tachycardia may respond to medical therapy, which can include beta-adrenergic blockers and calcium channel blockers. Antiarrhythmic therapy can also be effective. 327 However, it is often the case that these tachycardias become incessant or refractory to medical therapy, in which case, catheter ablation is indicated. It is important to remember useful techniques such as carotid sinus massage to identify the mechanism of a tachycardia, as well as to terminate it. Pressure over the carotid sinus activates baroreceptors, leading to a vagal reflex response from the autonomic nervous system. Gentle pressure for 5 seconds is applied over the area where the carotid pulse is strongest, which is just under the angle of the jaw.2 The right side should be tried first, as patients are more likely to be responsive to this side, but if there is no response, then the left carotid should be tried. Carotid sinus massage should be avoided in a patient with a carotid bruit, known carotid stenosis, or a prior history of stroke or transient ischemic attack. Nonetheless, the risk of inducing a stroke or transient ischemic attack, even in the elderly, is very low, at less than 0.2%.3 Rare instances of ventricular tachycardia and even ventricular fibrillation have also been reported in the literature.2,4 Overall, though, carotid sinus massage remains a very simple and useful technique for diagnosis and termination of tachycardia. References 1. Josephson ME. Clinical cardiac electrophysiology, Techniques and Interpretations. 3rd ed. Philadelphia, PA: Lippincott Williams & Wilkins; 250 –262. 2. Schweitzer P, Teichholz LE. Carotid sinus massage. Its diagnostic and therapeutic value in arrhythmias. Am J Med. 1985;78:645-654. 3. Walsh T, Clinch D, Costelloe A, et al. Carotid sinus massage— how safe is it? Age Ageing. 2006;35:518-520. 4. Deepak SM, Jenkins NP, Davidson NC, Bennett DH, Mushahwar SS. Ventricular fibrillation induced by carotid sinus massage without preceding bradycardia. Europace. 2005;7:638-640. The American Journal of Medicine (2007) 120, 328-329 IMAGES IN RADIOLOGY Michael A. Bettmann, MD A Complication of Forceful Nose-Blowing Amy Fix, MD, Valerie J. Lang, MD PRESENTATION Four days prior to presentation, our patient was feeling well when he forcefully blew his nose and felt a “pop.” Immediately following this incident, he began to experience pain above his left eye. Over the next 4 days, the intensity of his headache increased and worsened each time he blew his nose. Two days prior to presentation he developed a clear discharge from his right nostril which recurred when he leaned forward. On the day of admission to an outside hospital, the patient’s headache became severe, and he had an episode of vomiting. At the outside hospital, over the course of 3 hours, he became febrile to 38.2° C, and his mental status declined to the point of unresponsiveness. A head CT revealed diffuse su achnoid air. He was given a dose of ceftriaxone and transferred to the university hospital for further evaluation. The 73-year-old male patient had a history of type II diabetes and remote cutaneous melanoma. According to the family, he had no recent history of head or facial trauma and no recent viral illness. They reported tha he regularly blew his nose forcefully. with 4020 white blood cells and 240 red blood cells. White blood cell differential showed 86% neutrophils and 14% lymphocytes. Cerebrospinal fluid glucose was 89 (with serum glucose 245), and protein was 860. Dipstick of the clear nasal discharge was 3⫹ positive for glucose. Gram stain of a cytospin sample of the cerebrospinal fluid showed a few gram negative coccobacilli that could not be further characterized. DIAGNOSIS Pneumocephalus was originally described by Chiari in 1884 by autopsy. With the advent of radiography, Luckett (1913) ASSESSMENTS On presentation to the university hospital, his temperature was 37.8° C, heart rate 117, blood pressure 196/100, respiratory rate 16, and oxygen saturation 94% on 2 liters nasal cannula. He opened his eyes to voice and moved all of his extremities purposefully, but he did not follow commands or interact in any other way. His pupils were equal and reactive. His neck was stiff with forward flexion. He had no rash, raccoon eyes, or Battle sign. Further head, neck, cardiac, pulmonary, and abdominal exams were normal. White blood cell count was 13,700. Repeat head CT confirmed pneumocephalus (Figure 1). However, there was no mass or skull base defect noted on CT or on MRI done the following day. A lumbar puncture revealed cloudy cerebrospinal fluid Requests for reprints should be addressed to Valerie J. Lang, MD, University of Rochester School of Medicine & Dentistry, Department of Medicine, Hospital Medicine Division, 601 Elmwood Avenue, Box MEDHMD, Rochester, NY 14642. E-mail address: [email protected] 0002-9343/$ -see front matter © 2007 Elsevier Inc. All rights reserved. doi:10.1016/j.amjmed.2006.11.016 Figure 1 CT scan on hospital day 1 demonstrating diffuse noncompressive subarachnoid pneumocephalus. Fix and Lang Images in Radiology published a case of air in the ventricles of a living man who had been struck by a trolley car. Since that time, multiple case reports have described pneumocephalus, mainly related to trauma. Some of these cases also had coexistant cerebrospinal fluid rhinorrhea or otorrhea, and some developed meningitis as a result of the internal-external communication. In the absence of trauma, other identified causes of pneumocephalus have included neoplasm, surgery, nasogastric tube insertion, bag-valve mask ventilation, nasotracheal intubation, lumbar puncture, otitis media, post-radiation necrosis, and cerebrospinal fluid infection with gas-producing or unidentified organisms.1-5 Several reports also have described pneumocephalus related to barotrauma from air travel or diving. One report by Chan et al in 2000 identified an elderly patient presenting with confusion after blowing his nose during an airplane flight; pneumocephalus was identified on CT scan.6 Skull base dehiscences are common, and patients with such congenital defects could easily incur dural rupture at these sites with Valsalva-like actions such as forceful noseblowing.7 In 1991, Tolley and Schwartz described a case of chronic cerebral spinal fluid rhinorrhea in a patient with a habit of forceful nose-blowing,7 and Orrell et al. reported a case of septic cavernous sinus thrombosis and meningitis in a patient with history of forceful nose-blowing.8 In 2004, Richards et al. described pneumocephalus related to forceful nose-blowing in 2 patients who were found to have hyperpneumatized mastoid bones on CT scan.9 Pneumocephalus together with meningitis leads to a limited differential: infection with gas-producing organisms or a dural rupture, allowing both bacteria and air into the skull. Our patient’s forceful nose-blowing followed by a “pop” and frontal headache were consistent with dural rupture leading to his pneumocephalus. His clear nasal discharge was not tested for beta-2transferrin, which is a more accurate, but less widely available, test than glucose oxidase for identifying cerebrospinal fluid. However, the timing, character, positive glucose, and positional nature of the discharge were consistent with cerebrospinal fluid rhinorrhea. His persistence in forcefully blowing his nose after the initial “pop” and discharge likely forced intranasal colonizing bacteria through the skull base 329 defect, causing meningitis. It was felt that, based on the cytospin gram stain, the likely etiology of his meningitis was Haemophilus influenzae, a common gram negative colonizer of the nares and pharynx. MANAGEMENT Our patient was treated empirically with ceftriaxone, ampicillin, and vancomycin. Over the next 12 hours, he demonstrated dramatic clinical improvement, and his mental status returned to normal. His neck stiffness resolved by hospital day 2. With instructions to avoid nose blowing, the patient’s clear rhinorrhea resolved spontaneously on hospital day 4. On hospital day 7, he underwent a nuclear cisternogram, which did not reveal a cerebrospinal fluid leak, consistent with spontaneous resolution of a small defect. A follow-up CT on day 10 revealed complete resolution of the subarachnoid air. Final cerebrospinal fluid culture was negative, consistent with the administration of antibiotics several hours before the specimen was obtained. The patient completed a 14-day course of ceftriaxone. The other antibiotics were discontinued, and he had no recurrence of his symptoms. References 1. North JB. On the importance of intracranial air. Br J Surg. 1971;58(11): 826-9. 2. Goyal M, Sharma R, Berry M. Diffuse pneumocephalus due to meningitis: CT findings. Pediatr Radiol. 1996;26(4):278-9. 3. Maliwan N. Spontaneous pnemocephalus associated with mixed aerobic-anaerobic bacterial meningitis. J Infect Dis. 1985;152(4):847-8. 4. Turgut S, Ercan I, Alkan Z, Cakir B. A case of pneumocephalus and meningitis as a complication of silent otitis media. Ear Nose Throat J. 2004;83(1):50-2. 5. Chan YP, Yau CY, Lewis RP, Kinirons MT. Acute confusion secondary to pneumocephalus in an elderly patient. Age Ageing. 2000;29:365-7. 6. Jayaram S, Jadhav S, Rathod D, Tarvade S, Soman A. Meningitis: An unusual cause of pneumocephalus. J Assoc Physicians India. 2004;52: 67-8. 7. Tolley NS, Schwartz P. Nose-blowing and CSF rhinorrhea. Lancet. 1991;337(8736):302. 8. Orrell RW, Guthrie JA, Lamb JT. Nose-blowing and CSF rhinorrhea. Lancet. 1991;337(8744):804. 9. Richards SD, Saeed SR, Laitt R, Ramsden RT. Hypercellularity of the mastoid as a cause of spontaneous pneumocephalus. J Laryngol Otol. 2004;118:474-6. The American Journal of Medicine (2007) 120, 330-336 CLINICAL RESEARCH STUDY Vitamin and Micronutrient Intake and the Risk of Community-Acquired Pneumonia in US Women Mark I. Neuman, MD, MPH,a,b Walter C. Willett, MD, DrPH,b,c,d,e Gary C. Curhan, MD, ScDb,c,d a Division of Emergency Medicine, Children’s Hospital, Boston, Mass; bChanning Laboratory, cDepartment of Medicine, Brigham and Women’s Hospital/Harvard Medical School, Boston, Mass; dDepartments of Epidemiology and eNutrition, Harvard School of Public Health, Boston, Mass. ABSTRACT BACKGROUND: There are limited data regarding the role of dietary and supplemental vitamin intake and the risk of community-acquired pneumonia. METHODS: We prospectively examined, during a 10-year period, the association between dietary and supplemmin intake and the risk of community-acquired pneumonia among 83,165 women in Nurses’ Health Study II who were between the ages of 27 and 44 years in 1991. We excluded women who had pneumonia before 1991, those who did not provide complete dietary information, or those with a history of cancer, cardiovascular disease, or asthma. Self-administered food frequency questionnaires were used to assess dietary and supplemental vitamin intake. Cases of pneumonia required a diagnosis by a physician and confirmation with a chest radiograph. The independent associations between specific vitamins and pneumonia risk were evaluated. RESULTS: There were 925 new cases of community-acquired pneumonia during 650,377 person-years of follow up. After adjusting for age, cigarette smoking, body mass index, physical activity, total energy intake, and alcohol consumption, there were no associations between dietary or total intake of any individual vitamin and risk of community-acquired pneumonia. Specifically, women in the highest quintile of vitamin A intake did not have a significantly lower risk of pneumonia than women in the lowest quintile (multivariate relative risk [RR] ⫽ 0.88; 95% confidence interval [CI], 0.70-1.09, P for trend ⫽ .16). Similarly, vitamin C (RR ⫽ 0.94; 95% CI, 0.76-1.16, P for trend ⫽ .81) and E (RR ⫽ 0.95; 95% CI, 0.76-1.17, P for trend ⫽ .74) intake did not alter risk of pneumonia. CONCLUSIONS: Higher vitamin intake from diet and supplements is unlikely to reduce pneumonia risk in well nourished women. © 2007 Elsevier Inc. All rights reserved. KEYWORDS: Vitamin; Micronutrient; Diet; Pneumonia Community-acquired pneumonia is a common illness associated with significant morbidity and mortality.1-4 Many factors, particularly waning immune responses and the onset of age-associated organ dysfunction, account for an increase in susceptibility to respiratory tract infection in older adults.5-7 Nutritional factors play a major role in the This work was supported by Grant CA050385 from the National Institutes of Health. Requests for reprints should be addressed to Mark I. Neuman, MD, Division of Emergency Medicine, Children’s Hospital, 300 Longwood Ave, Boston, MA 02115. E-mail address: [email protected] 0002-9343/$ -see front matter © 2007 Elsevier Inc. All rights reserved. doi:10.1016/j.amjmed.2006.06.045 immune responses, and may affect the risk of development of respiratory infections, particularly community-acquired pneumonia.5,8,9 There is a lack of information regarding the risk factors for the development of pneumonia, particularly in well nourished individuals. Individuals with vitamin deficiencies have been shown to be at increased risk for respiratory infections,10 and vitamin supplementation, in particular vitamins such as C and E, have been shown to decrease the rate of respiratory infections in certain populations.11-16 Other studies have found no benefit with vitamin supplementation in reducing the rate of respiratory infections.6,17-20 Merchant and colleagues demonstrated that vitamin E intake from food sources, but Neuman et al Vitamin Intake and Pneumonia not total intake, was inversely associated with pneumonia risk in US men.15,17 We prospectively studied over 80,000 well nourished women to determine whether vitamin intake alters risk of community-acquired pneumonia. 331 in 1991. For each food, the participant indicated how often they consumed a specified portion of food (eg, 6 to 8 ounces of fish). The 9 potential response categories ranged from “never, or less than once per month” to “6 or more times per day.” Specific nutrient intakes were computed from the reported frequency of consumpMETHODS tion of each specified unit of food or beverage using published data Study Population CLINICAL SIGNIFICANCE on the nutrient content of the specDetails of the study design and ified portions.23 Because total en● In well nourished women, vitamin intake data collection used in the Nurses’ ergy intake for a given person Health Study II (NHS II) have did not reduce the risk of community21 tends to be fixed within a narrow been previously published. The acquired pneumonia. range, variations in nutrient intake NHS II study began in 1989 when ● Among smoking women, higher intake of are largely attributable to changes 116,671 U.S. female registered in diet composition, not total food foods rich in vitamin E reduced the risk nurses aged 25-42 years returned a consumption. Therefore, all comof community-acquired pneumonia. mailed questionnaire. At the time puted nutrient intakes were adof enrollment, participants projusted for total energy intake.24 vided a detailed medical history Energy adjustment also reduces including diagnosed diseases, variation introduced by questionnaire responses that undermedications, and information on lifestyle factors including report or over-report intake, thus improving the accuracy of smoking, physical activity, and alcohol use. Information on nutrient measurements. dietary and supplemental vitamin intake was first ascertained in 1991 and updated every 4 years using a semiThe validity of the self-reported data from the food quantitative food frequency questionnaire. Women were frequency questionnaire has been demonstrated in the excluded from the analysis if they had incomplete questionNurses’ Health Study I and Health Professionals Folnaires (12,360), had pneumonia before the baseline in 1991 low-Up Study cohorts.25-27 Compared with diet records, (14,156), died before 1991 (37), or if they had a history of the food frequency questionnaire was a good measure of conditions known to affect pneumonia risk (6953), includspecific vitamin intake (correlation coefficients range ing cancer, cardiovascular disease (myocardial infarction, from 0.52 to 0.85).23,28,29 We assessed the following stroke, or arterial surgery), or asthma diagnosed either benutrients: thiamine, riboflavin, niacin, pyridoxine, folate, fore or during the study period. vitamins B12, A, C, D, E, total carotenoids, alpha-carotene, beta-carotene, beta-cryptoxanthine, lycopene, lutein Identification of Cases of Pneumonia and zeaxanthin. We considered a case to be physician-diagnosed pneuTo account for wide ranges in supplemental vitamin monia if confirmed by chest radiography, and included intake, specific vitamins were further categorized; pyridoxonly the first documented event of community-acquired ine (⬍1.5 mg, 1.5-4 mg, 5-9 mg, 10-39 mg, 40-99 mg, pneumonia occurring between June 1, 1991 and May 31, 100⫹ mg/day), vitamin B12 (⬍2.6 mg, 2.6-7.9 mg, 8-10 2001. Women who reported pneumonia were sent a supmg, 11-13 mg, 14⫹ mg/day), vitamin A (⬍5000 IU, 5000plementary questionnaire asking whether the pneumonia 7499 IU, 7500-9999 IU, 10,000-14,999 IU, and 15,000⫹ diagnosis had been confirmed by radiograph. To examine IU/day), vitamin C (⬍90 mg, 90-249 mg, 250-499 mg, the validity of self-reported pneumonia during the first 2 500-999 mg, 1000-1499 mg, and 1500⫹ mg/day). years of follow-up, a study physician blinded to exposure status examined the medical records of 76 women who Assessment of Other Covariates had reported pneumonia. A radiology report of a pulmoCovariates considered in the multivariate model included nary infiltrate confirmed the presence of pneumonia in age, body mass index (BMI), cigarette smoking, physical 82% of the cases.22 After the first 2 years of follow-up, activity, and alcohol intake. BMI was calculated as weight medical records were obtained from all women who reported radiologically diagnosed pneumonia. We rein kilograms divided by height in meters squared using the viewed records from a sample of 99 confirmed cases and reported height of the women at the start of the study and found only one that was potentially hospital-acquired. updated weight. Cigarette smoking was assessed on the Therefore, we considered all the cases to have commubasis of whether the woman smoked and the amount nity-acquired pneumonia. smoked. Physical activity was assessed as the number of MET-hours per week, the time invested in an activity every Ascertainment of Vitamin Intake week multiplied by the energy expenditure required by the activity. Alcohol intake was classified by the amount the A semi-quantitative food frequency questionnaire was used to estimate vitamin and nutrient intake every 4 years starting participant consumed per day. 332 Data Analysis Person-time of follow-up was calculated as the time between the return of the 1991 questionnaire until the first report of community-acquired pneumonia, death, or the end of the study period (May 31, 2001). We first examined age-adjusted models for the association between vitamin intake and the risk of pneumonia. Cox proportional hazards multivariate models with updating of exposure variables were used to estimate multivariate relative risks (RR). The age-adjusted relative risk of pneumonia was calculated per quintile of specific vitamin intake, with the referent group being the first quintile. Additionally, due to wide variation in specific vitamin intake, we evaluated the association between pyridoxine, vitamins B12, A, and C and pneumonia risk by further categorizing these variables into wider contrasting groups. The multivariate model adjusted for age, BMI (⬍21 kg/m2, 21-22.9, 23-24.9, 25-29.9, 30⫹), alcohol intake (0 gm/day, 0.1-5 gm, 5-9.9 gm, 10-14.9 gm, 15-29.9 gm, 30⫹ gm), cigarette smoking (never, past, current smoker of 1-14 cigarettes per day, 15-24 per day, or 25⫹ per day), and physical activity (in quintiles of metabolic equivalents [METS] per day). Additionally, to assess for possible confounding, we further adjusted for multivitamin use (0, 1-2, 3-5, 6-9, ⱖ10 multivitamin tablets per week). We further analyzed the association between dietary vitamin intake (excluding supplements) and the risk of community-acquired pneumonia. We also studied the association between vitamin E intake (total intake, as well as diet alone) and risk of community-acquired pneumonia among smokers, as vitamin E intake has been shown to decrease the risk of pneumonia in laboratory animals exposed to smoke.30 This analysis was further adjusted for intake of vegetable fat (in quintiles), as vegetable fat may also be rich in vitamin E. Lastly, we studied the association between multivitamin use (0, 1-2, 3-5, 6-9, ⱖ10 multivitamin tablets per week) and the risk of community-acquired pneumonia. We used the Mantel extension test to calculate tests for trends across quintiles of intake using the respective median values.31 SAS statistical software (SAS Institute Inc., Cary, NC) was used for all analyses. Two-sided P-values ⬍.05 were considered significant. This study was approved by the Human Subjects Committee of the Harvard School of Public Health. RESULTS During 10 years of follow-up (650,377 person-years), there were 925 new cases of nonfatal community-acquired pneumonia. Women with higher vitamin intake were less likely to be current smokers and exercised more at baseline in 1991 than women with lower vitamin intake (Table 1). Forty-two percent of participants reported the use of supplemental multivitamins: 1-2 per week (7%), 3-5 (12%), 6-9 (21%), and 10⫹ per week (2%). After adjusting for age, women in the highest quintile of total vitamin A intake were less likely to develop pneumo- The American Journal of Medicine, Vol 120, No 4, April 2007 nia than women in the lowest quintile (RR ⫽ 0.79; 95% CI, 0.64-0.98; P for trend ⫽ .02) (Table 2). This association was no longer significant after further adjusting for smoking, BMI, alcohol use, and physical activity (RR 0.88; 95% CI, 0.70-1.09; P for trend ⫽ .16). After multivariate adjustment, there were no significant associations between vitamin C intake (P, trend ⫽ .81) or vitamin E intake (P, trend ⫽ .74) and risk of community-acquired pneumonia. There were also no significant associations between intake of other vitamins and micronutrients and community-acquired pneumonia risk. Inclusion of women with cancer, cardiovascular disease, and asthma did not materially change our results. There were no associations between vitamin intake from diet alone (excluding intake of supplements) and risk of community-acquired pneumonia (data not shown). Additionally, even after classification of specific vitamins into categories (eg, vitamin C ⬍90 mg vs 1500⫹ mg) there were no associations with risk of community-acquired pneumonia for pyridoxine (P value comparing extreme categories ⫽ .29), vitamin B12 (P ⫽ .34), vitamin A (P ⫽ .15), and vitamin C (P ⫽ .67). Among smokers, total vitamin E intake did not affect risk of community-acquired pneumonia (multivariate P for trend .40). Among smokers, after we excluded those who took vitamin E supplements, women in the top quintile of vitamin E intake from food sources had a lower risk of community-acquired pneumonia (multivariate RR 0.46; 95% CI, 0.23-0.90; P for trend ⫽ .04) (Table 3). There was no material change after further adjusting for vegetable fat (RR 0.45; 95% CI, 0.21-0.93; P for trend ⫽ .055). Multivitamin use did not lower the risk of communityacquired pneumonia. Compared with nonusers, the multivariate RR for women taking 10 or more multivitamin tablets per week was 0.75 (95% CI, 0.45-1.26; P for trend ⫽ .84) (Table 4). DISCUSSION We found that vitamin intake was not associated with community-acquired pneumonia in well-nourished, young and middle-aged adult US women. Additionally, dietary vitamin intake as well as multi-vitamin use did not appear to alter risk. Although many studies have found that intakes of specific vitamins reduce risk of pneumonia and respiratory infections, these studies have been primarily conducted in the elderly or poorly nourished individuals. Nutritional status is an important determinant of immune function.32,33 The beneficial effects of adequate nutrition appear to be mediated through mechanisms such as increasing the number of T-cell subsets and natural killer cells, improved lymphocyte proliferation response to mitogens, interleukin-2 production, and antibody response to natural killer cell activity.17,34 Individuals with vitamin deficiencies are at increased risk for respiratory infections,10 and vitamin supplementation has been shown to decrease the rate of respiratory infections in certain populations.11-16,18-20 Neuman et al Table 1 Vitamin Intake and Pneumonia 333 Age-Adjusted Characteristics of Women in the Top, Middle and Bottom Quintiles of Specific Vitamin Intake at Baseline (1991) Smoking: Current Smokers % Alcohol Intake† g/d Physical Activity† MET/wk BMI† kg/m2 1.3 1.8 5.1 18.8 8.7 10.6 4.0 2.7 2.8 18.4 20.8 23.8 24.7 24.3 24.1 1.4 2.3 6.0 17.6 10.1 10.6 3.6 2.8 2.8 17.7 20.8 23.8 24.5 24.5 24.2 19.2 27.8 55.9 14.3 11.4 11.4 2.9 3.3 3.1 18.4 20.3 24.7 24.3 24.6 24.2 1.7 2.5 8.8 17.0 9.9 10.6 3.0 3.2 3.0 16.5 22.0 24.0 24.5 24.4 24.3 4.0 7.0 17.0 13.1 11.8 12.0 3.4 3.1 2.7 20.1 19.9 22.9 24.1 24.7 24.4 5288 11095 21512 16.4 11.0 9.7 3.3 3.2 2.8 16.0 20.6 27.7 24.9 24.4 24.1 75 158 525 16.4 10.3 11.3 3.2 3.1 3.3 15.7 21.1 26.0 24.9 24.4 23.9 15.8 11.3 10.4 3.2 3.3 3.0 16.9 21.6 24.3 24.5 24.7 24.1 3130 7540 16456 15.5 11.3 9.8 3.1 3.2 3.0 16.0 20.1 27.9 24.9 24.4 24.1 160 577 1544 15.3 12.0 9.3 3.4 3.2 2.8 17.9 19.8 26.1 24.7 24.4 24.2 1554 3578 7432 15.2 11.0 10.6 2.9 3.2 3.1 15.6 20.1 28.4 24.8 24.3 24.1 16.5 11.0 9.6 3.5 3.2 2.6 18.0 20.8 24.9 24.6 24.4 24.2 3305 7227 15917 12.9 12.0 11.8 2.8 3.1 3.4 19.1 20.6 23.8 24.8 24.3 24.4 942 2566 5968 12.9 11.4 12.3 2.4 3.2 3.7 15.6 20.4 28.0 24.9 24.4 24.0 224 371 866 17.8 10.2 9.0 3.1 3.3 2.6 15.9 22.3 24.0 25.0 24.2 24.2 128 316 742 16.7 10.6 9.2 3.5 3.1 2.5 17.9 21.4 23.9 24.7 24.4 24.2 Median Intake* Thiamine (mg/day) Quintile 1 Quintile 3 Quintile 5 Riboflavin (mg/day) Quintile 1 Quintile 3 Quintile 5 Niacin (mg/day) Quintile 1 Quintile 3 Quintile 5 Pyridoxine (mg/day) Quintile 1 Quintile 3 Quintile 5 Vitamin B12 (g/day) Quintile 1 Quintile 3 Quintile 5 Vitamin A (IU/day) Quintile 1 Quintile 3 Quintile 5 Vitamin C (mg/day) Quintile 1 Quintile 3 Quintile 5 Vitamin E (mg/day) Quintile 1 Quintile 3 Quintile 5 Total Carotenoids (IU/day) Quintile 1 Quintile 3 Quintile 5 Alpha-carotene (g/day) Quintile 1 Quintile 3 Quintile 5 Beta-carotene (g/day) Quintile 1 Quintile 3 Quintile 5 Beta-cryptoxanthine (g/day) Quintile 1 Quintile 3 Quintile 5 Lycopene (g/day) Quintile 1 Quintile 3 Quintile 5 Lutein and Zeaxanthin (g/day) Quintile 1 Quintile 3 Quintile 5 Folate (g/day) Quintile 1 Quintile 3 Quintile 5 Vitamin D (IU/day) Quintile 1 Quintile 3 Quintile 5 4.9 8.1 45.9 6.4 35.5 103.9 *Based in intake from food and supplements in 1991. †Values are means. 334 Table 2 The American Journal of Medicine, Vol 120, No 4, April 2007 Relative Risks (RR) for Total Vitamin Intake and Community-Acquired Pneumonia Quintile of Intake from All Sources Thiamine No. of cases (n) Age adjusted RR Multivariate adjusted Riboflavin No. of cases (n) Age adjusted RR Multivariate adjusted Pyridoxine No. of cases (n) Age adjusted RR Multivariate adjusted Niacin No. of cases (n) Age adjusted RR Multivariate adjusted Vitamin B12 No. of cases (n) Age adjusted RR Multivariate adjusted Vitamin A No. of cases (n) Age adjusted RR Multivariate adjusted Vitamin C No. of cases (n) Age adjusted RR Multivariate adjusted Vitamin E No. of cases (n) Age adjusted RR Multivariate adjusted Total Carotenoids No. of cases (n) Age adjusted RR Multivariate adjusted Alpha-carotene No. of cases (n) Age adjusted RR Multivariate adjusted Beta-carotene No. of cases (n) Age adjusted RR Multivariate adjusted Beta-cryptoxanthine No. of cases (n) Age adjusted RR Multivariate adjusted Lycopene No. of cases (n) Age adjusted RR Multivariate adjusted Lutein ⫹ Zeaxanthine No. of cases (n) Age adjusted RR Multivariate adjusted Folate No. of cases (n) Age adjusted RR Multivariate adjusted Vitamin D No. of cases (n) Age adjusted RR Multivariate adjusted P-value, test for trend 1 2 3 4 5 RR* 181 Ref Ref 174 0.94 (.76-1.16) 0.96 (.78-1.20) 212 1.14 (.94-1.40) 1.22 (.99-1.50) 192 1.06 (.86-1.30) 1.14 (.92-1.41) 166 0.92 (.75-1.14) 0.98 (.79-1.22) .33 .60 RR* 176 Ref Ref 188 1.05 (.85-1.29) 1.07 (.86-1.32) 213 1.17 (.96-1.43) 1.21 (.98-1.49) 170 0.96 (.77-1.18) 1.03 (.83-1.29) 178 1.02 (.83-1.25) 1.07 (.86-1.33) .61 .99 RR* 176 Ref Ref 191 1.08 (.88-1.32) 1.10 (.89-1.36) 200 1.13 (.93-1.39) 1.17 (.95-1.44) 178 1.02 (.83-1.25) 1.08 (.87-1.34) 180 1.05 (.85-1.29) 1.11 (.89-1.37) .93 .72 RR* 182 Ref Ref 184 1.01 (.82-1.24) 0.98 (.79-1.21) 200 1.09 (.89-1.33) 1.05 (.86-1.30) 195 1.07 (.87-1.31) 1.08 (.88-1.33) 164 0.93 (.76-1.15) 0.94 (.75-1.17) .50 .69 RR* 198 Ref Ref 179 0.90 (.73-1.10) 0.89 (.72-1.10) 198 1.00 (.82-1.21) 0.98 (.80-1.20) 191 0.98 (.80-1.19) 0.96 (.78-1.18) 159 0.83 (.67-1.02) 0.85 (.69-1.06) .17 .30 RR* 201 Ref Ref 191 0.96 (.79-1.17) 1.01 (.83-1.24) 197 0.99 (.81-1.12) 1.08 (.88-1.32) 184 0.94 (.77-1.15) 1.02 (.82-1.25) 152 0.79 (.64-.98) 0.88 (.70-1.09) .02 .16 RR* 204 Ref Ref 178 0.87 (.71-1.06) 0.90 (.73-1.11) 189 0.92 (.76-1.12) 1.00 (.82-1.23) 184 0.93 (.76-1.13) 1.02 (.83-1.26) 170 0.88 (.72-1.08) 0.94 (.76-1.16) .56 .81 RR* 204 Ref Ref 171 0.85 (.69-1.04) 0.87 (.71-1.07) 182 0.89 (.73-1.09) 0.95 (.77-1.16) 194 0.96 (.79-1.17) 1.01 (.82-1.24) 170 0.88 (.72-1.08) 0.95 (.76-1.17) .51 .74 RR* 193 Ref Ref 203 1.04 (.86-1.27) 1.08 (.88-1.33) 191 1.00 (.81-1.22) 1.06 (.86-1.30) 174 0.92 (.75-1.13) 1.00 (.81-1.24) 164 0.88 (.71-1.08) 0.97 (.78-1.20) .06 .34 RR* 190 Ref Ref 203 1.17 (.96-1.42) 1.23 (1.00-1.51) 163 0.97 (.78-1.19) 1.01 (.81-1.25) 193 1.07 (.87-1.31) 1.16 (.94-1.43) 176 0.99 (.80-1.22) 1.05 (.85-1.31) .51 .94 RR* 196 Ref Ref 194 1.02 (.84-1.25) 1.08 (.88-1.32) 208 1.01 (.83-1.23) 1.07 (.87-1.32) 160 0.92 (.75-1.13) 1.01 (.82-1.22) 167 0.90 (.73-1.11) 0.98 (.79-1.22) .13 .45 RR* 198 Ref Ref 180 0.99 (.81-1.21) 1.04 (.84-1.28) 202 1.00 (.82-1.22) 1.03 (.84-1.27) 167 0.85 (.69-1.05) 0.91 (.73-1.13) 178 0.94 (.76-1.15) 1.03 (.83-1.27) .36 .99 RR* 178 Ref Ref 198 1.04 (.84-1.27) 1.08 (.88-1.34) 174 1.00 (.82-1.24) 1.04 (.84-1.29) 180 1.01 (.82-1.24) 1.07 (.86-1.32) 195 1.08 (.88-1.33) 1.12 (.91-1.39) .50 .35 RR* 183 Ref Ref 192 1.04 (.85-1.27) 1.08 (.88-1.33) 211 1.14 (.94-1.40) 1.22 (.99-1.50) 164 0.95 (.77-1.17) 1.04 (.83-1.29) 175 1.04 (.85-1.29) 1.17 (.94-1.45) .98 .31 RR* 182 Ref Ref 193 1.07 (.88-1.32) 1.13 (.92-1.40) 176 0.95 (.77-1.17) 1.03 (.83-1.28) 189 1.05 (.85-1.28) 1.15 (.93-1.42) 181 1.01 (.82-1.24) 1.13 (.91-1.40) .98 .36 RR* 197 Ref Ref 177 0.88 (.72-1.08) 0.91 (.74-1.12) 187 0.93 (.76-1.13) 0.97 (.79-1.20) 182 0.91 (.74-1.10) 0.96 (.78-1.18) 182 0.92 (.76-1.13) 1.02 (.83-1.26) 1.0 1.0 RR ⫽ relative risk (95% confidence interval [CI]). Dietary information for vitamin E and folate were missing for 4 participants from 1999 questionnaire preceding the development of pneumonia. *Multivariate model adjusted for age in months, smoking (never smokers, past smokers and current smokers who smoked 1-14, 15-24, or ⱖ25 cigarettes/d), BMI (⬍21, 21-22.9, 23-24.9, 25-29.9, and ⱖ30 kg/m2), alcohol use (never, 0.1-4.9, 5.0-14.9, 15.0-29.9, and ⱖ30 gm/d), and physical activity (quintiles of MET). Neuman et al Vitamin Intake and Pneumonia 335 Table 3 Relative Risks (RR) for Dietary Vitamin E Intake and Community-Acquired Pneumonia among Current Smokers (n ⫽ 12,003) Quintile of Vitamin E Intake from Diet Only Age-adjusted RR Multivariate adjusted RR* 1 2 3 4 5 P-value, test for trend Ref Ref 0.68 (.40-1.18) 0.62 (.35-1.11) 0.58 (.32-1.03) 0.57 (.31-1.05) 0.64 (.37-1.13) 0.72 (.41-1.28) 0.44 (.23-.84) 0.46 (.23-.90) .01 .04 *Multivariate model adjusted for age in months, BMI (⬍21, 21-22.9, 23-24.9, 25-29.9, and ⱖ30 kg/m2), alcohol use (never, 0.1-4.9, 5.0-14.9, 15.0-29.9, and ⱖ30 gm/d), and physical activity (quintiles of MET). Micronutrients can improve cell-mediated immunity and reduce oxidative stress.35 Vitamin E supplementation in healthy, well-nourished adults increased delayed hypersensitivity responses, response to hepatitis B vaccine, lymphocyte proliferation, and decreased formation of immunosuppressive prostaglandins.17,36 Vitamin C regenerates the antioxidant form of vitamin E and is critical for the killing of pathogens by neutrophils.17 Vitamin B6 (pyridoxine) supplementation enhanced lymphocyte proliferation and interleukin-2 levels in young women.37 Merchant and colleagues reported that vitamin E intake from food sources was inversely associated with pneumonia risk among U.S. men (multivariate relative risk comparing extreme quintiles ⫽ 0.58, 95% CI, 0.39-0.86, P-value for trend ⫽ .01), but no association was observed when vitamin E from supplements was included.17 In contrast, we found that dietary vitamin E intake was not associated with community-acquired pneumonia in healthy, well-nourished women. Both of these large prospective cohort studies found that intake of other vitamins (including dietary and supplemental intake) was not associated with risk of pneumonia. Additionally, both studies found that multivitamin use was not associated with pneumonia risk. Although certain factors, such as excessive weight gain and cigarette smoking, have been found to increase the risk of community-acquired pneumonia in both men and women, other factors such as sedentary lifestyle and obesity were associated with pneumonia risk only among women.22 There might be differences between males and females that may affect susceptibility to pneumonia, however, there is insufficient information available. Our results in women, along with Merchant’s study of pneumonia in older men, suggest Table 4 that higher vitamin intake is unlikely to reduce the risk of community-acquired pneumonia in well-nourished adults.17 Pacht et al found a deficiency of vitamin E in the alveolar fluid of cigarette smokers,30 and a recent laboratory-based study showed that vitamin E supplementation was protective against the development of pneumonia among rats exposed to cigarette smoke.38 We found that among smokers, dietary, but not total, intake of vitamin E was inversely associated with risk of community-acquired pneumonia. A possible reason for this observation is that foods containing vitamin E may have some other beneficial nutrient. Vitamin E-rich foods (ie, nuts) also contain fatty acids, which have been shown to modulate inflammation and immunity, and may alter risk of respiratory infections and pneumonia.39-42 Dietary information is unlikely to be influenced by recall bias because it was gathered prospectively. Misclassification of the diagnosis of community-acquired pneumonia is certainly possible, however, we included only participants with physician-diagnosed and radiographically confirmed pneumonia. We were unable to distinguish bacterial and viral pneumonia, but even in the best of circumstances, the microbiological etiology of pneumonia is difficult to establish.43-45 Additionally, because some of the nurses were working in a hospital setting, it is possible that more than 1% of the cases may have been “hospital-acquired pneumonia”. Lastly, our results are generalizable to healthy, young and middle-aged women. In conclusion, vitamin intake does not alter communityacquired pneumonia risk in healthy young and middle-aged women. Among smokers, higher intake of foods rich in vitamin E may reduce the risk of community-acquired pneumonia. Relative Risks (RR) for Multivitamin Intake and Community-Acquired Pneumonia Multivitamin Intake (# of Tablets) per Week Age adjusted RR Multivariate adjusted RR* 0 1-2 3-5 6-9 10⫹ P-value, test for trend Ref Ref 0.97 (.76-1.25) 0.97 (.75-1.26) 1.01 (.83-1.23) 0.99 (.80-1.21) 1.03 (.88-1.21) 1.05 (.90-1.24) 0.75 (.45-1.23) 0.75 (.45-1.26) 0.95 0.84 *Multivariate model adjusted for age in months, smoking (never smokers, past smokers and current smokers who smoked 1-14, 15-24, or ⱖ25 cigarettes/d), BMI (⬍21, 21-22.9, 23-24.9, 25-29.9, and ⱖ30 kg/m2), alcohol use (never, 0.1-4.9, 5.0-14.9, 15.0-29.9, and ⱖ30 gm/d), and physical activity (quintiles of MET). 336 References 1. National Center for Injury Prevention and Control. Activity Report 2001: CDC’s Unintentional Injury and Prevention Program. Atlanta, GA: Centers for Disease Control and Prevention; 2002. 2. American Lung Association. Pneumonia Fact Sheet. 2002. 3. File TM Jr, Tan JS. Pneumonia in older adults: reversing the trend. JAMA. 2005;294:2760-2763. 4. Fry AM, Shay DK, Holman RC, Curns AT, Anderson LJ. Trends in hospitalizations for pneumonia among persons aged 65 years or older in the United States, 1988-2002. JAMA. 2005;294:2712-2719. 5. Miller RA. The aging immune system: primer and prospectus. Science. 1996;273:70-74. 6. Graat JM, Schouten EG, Kok FJ. Effect of daily vitamin E and multivitamin-mineral supplementation on acute respiratory tract infections in elderly persons: a randomized controlled trial. JAMA. 2002; 288:715-721. 7. Meyer KC. Lung infections and aging. Ageing Res Rev. 2004;3:55-67. 8. Lesourd B, Mazari L. Nutrition and immunity in the elderly. Proc Nutr Soc. 1999;58:685-695. 9. Mazari L, Lesourd BM. Nutritional influences on immune response in healthy aged persons. Mech Ageing Dev. 1998;104:25-40. 10. Reyes H, Villalpando S, Perez-Cuevas R, et al. Frequency and determinants of vitamin A deficiency in children under 5 years of age with pneumonia. Arch Med Res. 2002;33:180-185. 11. Hemila H. Vitamin C supplementation and respiratory infections: a systematic review. Mil Med. 2004;169:920-925. 12. Hemila H, Douglas RM. Vitamin C and acute respiratory infections. Int J Tuberc Lung Dis. 1999;3:756-761. 13. Hemila H, Kaprio J. Vitamin E and respiratory tract infections in elderly persons. JAMA. 2004;292:2834; author reply 2834. 14. Hemila H, Virtamo J, Albanes D, Kaprio J. Vitamin E and betacarotene supplementation and hospital-treated pneumonia incidence in male smokers. Chest. 2004;125:557-565. 15. Meydani SN, Han SN, Hamer DH. Vitamin e and respiratory infection in the elderly. Ann N Y Acad Sci. 2004;1031:214-222. 16. Sempertegui F, Estrella B, Camaniero V, et al. The beneficial effects of weekly low-dose vitamin A supplementation on acute lower respiratory infections and diarrhea in Ecuadorian children. Pediatrics. 1999;104(1):e1. 17. Merchant AT, Curhan G, Bendich A, Singh VN, Willett WC, Fawzi WW. Vitamin intake is not associated with community-acquired pneumonia in U.S. men. J Nutr. 2004;134:439-444. 18. Fawzi WW, Mbise R, Spiegelman D, Fataki M, Hertzmark E, Ndossi G. Vitamin A supplements and diarrheal and respiratory tract infections among children in Dar es Salaam, Tanzania. J Pediatr. 2000; 137:660-667. 19. Fawzi WW, Mbise RL, Fataki MR, et al. Vitamin A supplementation and severity of pneumonia in children admitted to the hospital in Dar es Salaam, Tanzania. Am J Clin Nutr. 1998;68:187-192. 20. Kjolhede CL, Chew FJ, Gadomski AM, Marroquin DP. Clinical trial of vitamin A as adjuvant treatment for lower respiratory tract infections. J Pediatr. 1995;126:807-812. 21. Curhan GC, Chertow GM, Willett WC, et al. Birth weight and adult hypertension and obesity in women. Circulation. 1996;94:1310-1315. 22. Baik I, Curhan GC, Rimm EB, Bendich A, Willett WC, Fawzi WW. A prospective study of age and lifestyle factors in relation to community-acquired pneumonia in US men and women. Arch Intern Med. 2000;160:3082-3088. 23. Willett WC, Sampson L, Stampfer MJ, et al. Reproducibility and validity of a semiquantitative food frequency questionnaire. Am J Epidemiol. 1985;122:51-65. 24. Willett W, Stampfer MJ. Total energy intake: implications for epidemiologic analyses. Am J Epidemiol. 1986;124:17-27. 25. Salvini S, Hunter DJ, Sampson L, et al. Food-based validation of a dietary questionnaire: the effects of week-to-week variation in food consumption. Int J Epidemiol. 1989;18:858-867. The American Journal of Medicine, Vol 120, No 4, April 2007 26. Rimm EB, Giovannucci EL, Stampfer MJ, Colditz GA, Litin LB, Willett WC. Reproducibility and validity of an expanded self-administered semiquantitative food frequency questionnaire among male health professionals. Am J Epidemiol. 1992;135:1114-1126; discussion 1127-1136. 27. Feskanich D, Rimm EB, Giovannucci EL, et al. Reproducibility and validity of food intake measurements from a semiquantitative food frequency questionnaire. J Am Diet Assoc. 1993;93:790-796. 28. Stryker WS, Kaplan LA, Stein EA, Stampfer MJ, Sober A, Willett WC. The relation of diet, cigarette smoking, and alcohol consumption to plasma beta-carotene and alpha-tocopherol levels. Am J Epidemiol. 1988;127:283-296. 29. Jacques PF, Sulsky SI, Sadowski JA, Phillips JC, Rush D, Willett WC. Comparison of micronutrient intake measured by a dietary questionnaire and biochemical indicators of micronutrient status. Am J Clin Nutr. 1993;57:182-189. 30. Pacht ER, Kaseki H, Mohammed JR, Cornwell DG, Davis WB. Deficiency of vitamin E in the alveolar fluid of cigarette smokers. Influence on alveolar macrophage cytotoxicity. J Clin Invest. 1986;77:789796. 31. Mantel N. Chi-square tests with one degree of freedom: extensions of the Mantel-Haenszel procedure. J Am Stat Assoc. 1963;58:690-700. 32. Hamer DH, Meydani SN. Immune function in the elderly. Arch Intern Med. 2001;161:482-483. 33. Meydani SN, Leka LS, Fine BC, et al. Vitamin E and respiratory tract infections in elderly nursing home residents: a randomized controlled trial. JAMA. 2004;292:828-836. 34. Pike J, Chandra RK. Effect of vitamin and trace element supplementation on immune indices in healthy elderly. Int J Vitam Nutr Res. 1995;65:117-121. 35. Evans P, Halliwell B. Micronutrients: oxidant/antioxidant status. Br J Nutr. 2001;85(Suppl 2):S67-S74. 36. Meydani SN, Meydani M, Blumberg JB, et al. Vitamin E supplementation and in vivo immune response in healthy elderly subjects. A randomized controlled trial. JAMA. 1997;277:1380-1386. 37. Bendich A, Zilberboim R: Drug/nutrient interactions and immune function. In: Armente V, ed. Handbook of Drug-Nutrient Interactions, 5th ed. Totowa, NJ: Humana Press; 2004:468. 38. Ozlu T, Cay M, Akbulut A, Yekeler H, Naziroglu M, Aksakal M. The facilitating effect of cigarette smoke on the colonization of instilled bacteria into the tracheal lumen in rats and the improving influence of supplementary vitamin E on this process. Respirology. 1999;4:245248. 39. Baughman RP, Stein E, MacGee J, Rashkin M, Sahebjami H. Changes in fatty acids in phospholipids of the bronchoalveolar fluid in bacterial pneumonia and in adult respiratory distress syndrome. Clin Chem. 1984;30:521-523. 40. Calder PC, Davis J, Yaqoob P, Pala H, Thies F, Newsholme EA. Dietary fish oil suppresses human colon tumour growth in athymic mice. Clin Sci (Lond). 1998;94:303-311. 41. James MJ, Gibson RA, Cleland LG. Dietary polyunsaturated fatty acids and inflammatory mediator production. Am J Clin Nutr. 2000; 71(1 Suppl):343S-348S. 42. Venuta A, Spano C, Laudizi L, Bettelli F, Beverelli A, Turchetto E. Essential fatty acids: the effects of dietary supplementation among children with recurrent respiratory infections. J Int Med Res. 1996;24: 325-330. 43. Korppi M. Non-specific host response markers in the differentiation between pneumococcal and viral pneumonia: what is the most accurate combination? Pediatr Int. 2004;46:545-550. 44. Swingler GH. Radiologic differentiation between bacterial and viral lower respiratory infection in children: a systematic literature review. Clin Pediatr (Phila). 2000;39:627-633. 45. Bettenay FA, de Campo JF, McCrossin DB. Differentiating bacterial from viral pneumonias in children. Pediatr Radiol. 1988;18:453-454. The American Journal of Medicine (2007) 120, 337-342 CLINICAL RESEARCH STUDY Grip Strength Predicts Cause-Specific Mortality in Middle-Aged and Elderly Persons Hideo Sasaki, MD, PhD,a,b Fumiyoshi Kasagi, PhD,c Michiko Yamada, MD, PhD,a Shoichiro Fujita, PhDd a Department of Clinical Studies, Radiation Effects Research Foundation, Hiroshima, Japan; bHealth Management and Promotion Center, Hiroshima Atomic Bomb Casualty Council, Hiroshima, Japan; cDepartment of Epidemiology and dDepartment of Statistics, Radiation Effects Research Foundation, Hiroshima, Japan. ABSTRACT PURPOSE: Handgrip strength is a simple measurement used to estimate overall muscle strength but might also serve as a predictor of health-related prognosis. We investigated grip strength-mortality association in a longitudinal study. METHODS: A total of 4912 persons (1695 men and 3217 women), 35 to 74 years old at baseline, were the subjects of this study. Members of the Adult Health Study (AHS) cohort in Hiroshima, Japan, these individuals underwent a battery of physiological tests, including handgrip-strength testing, between July 1970 and June 1972. Mortality was followed until the end of 1999. Estimates of relative risk (RR) of mortality associated with grip strength were adjusted for potentially confounding factors by Cox proportional hazard analysis. RESULTS: Multivariate-adjusted RR of all causes of death, except for external causes, for the highest quintile of grip strength in men was 0.52 (95% confidence interval [CI], 0.33-0.80) for the age group 35-54 years, 0.72 (95% CI, 0.53-0.98) for the ages 55-64 years, and 0.67 (95% CI, 0.49-0.91) for the ages 65-74 years. These figures were significantly lower than the RR for the reference group (the third quintile). Similar trends were observed in women. Multivariate-adjusted RR of all causes of death except external causes for each 5-kg increment of grip strength was significantly low (RR: 0.89, 95% CI, 0.86-0.92 for men, RR: 0.87, 95% CI, 0.83-0.92 for women). Multivariate-adjusted RR for heart disease, stroke, and pneumonia in men was 0.85 (95% CI, 0.79-0.93), 0.90 (95% CI, 0.83-0.99), and 0.85 (95% CI, 0.75-0.98), respectively. RR for each 5-kg increment of grip strength remained 0.92 (95% CI, 0.87-0.96), even after more than 20 years of follow-up. CONCLUSION: Grip strength is an accurate and consistent predictor of all causes of mortality in middle-aged and elderly persons. © 2007 Elsevier Inc. All rights reserved. KEYWORDS: Grip strength; Mortality; Prognosis; Cohort study Grip-strength measurement is useful for assessing approximate overall muscle strength of middle-aged and elderly people, and longitudinal studies revealed that it also predicts health-related prognosis.1-13 The prognostic outcomes in these studies included functional limitation, functional decline,4,5 activities of daily living dependence,6,13 and mortality.1-3,8,9,11,12 The majority of the mortality studies utiRequests for reprints should be addressed to Hideo Sasaki, MD, PhD, Health Management and Promotion Center, Hiroshima A-Bomb Casualty Council, 3-8-6, Senda-machi, Naka-ku, Hiroshima 730-0052, Japan. E-mail address: [email protected] 0002-9343/$ -see front matter © 2007 Elsevier Inc. All rights reserved. doi:10.1016/j.amjmed.2006.04.018 lized total mortality, with only one analyzing association between grip strength and cause-specific mortality.1 The subjects in such studies, however, were restricted to hospitalized patients5,12 or elderly people.1,3,6 The number of studies on association between grip strength and prognosis conducted on middle-aged, relatively healthy subjects of both sexes is limited.2,11 Further, most of the studies’ follow-up periods were less than 10 years after baseline measurement of grip strength. Only 2 studies, one in Canada and the other in Hawaii, followed-up subjects for a longer duration, 13 and 30 years, respectively.2,9 338 The American Journal of Medicine, Vol 120, No 4, April 2007 The Adult Health Study (AHS) is a longitudinal cohort Other Measurements study conducted at the Radiation Effects Research FoundaClinical examinations included taking of medical history, tion (RERF) in Hiroshima and Nagasaki. Grip strength was general physical examinations, anthropometrical examinameasured with other physiological function tests during tions including height and body weight measurements, and 1970-1972 to assess the overall physiological condition of laboratory tests. Body mass index (BMI) was calculated as 4912 persons in Hiroshima.14 This body weight (kg) divided by the population-based study is characsquare of height (m). Physical exterized as one of the largest cohort aminations included blood presCLINICAL SIGNIFICANCE studies of middle-aged and elderly sure measurement taken by sphygpersons, with a long follow-up of momanometer at the right arm ● Grip strength is a strong and consistent more than 25 years. with the subject in a sitting posipredictor of all causes of mortality in The aforementioned studies of tion. General laboratory tests conmiddle-aged and elderly persons. grip strength-mortality association sisted of peripheral blood test and ● In accordance with the present findings, did not clarify whether such assodetermination of serum cholesciation is universal. The present regular exercise for improvement of terol and other biochemical items. study was conducted using the physical and musculoskeletal fitness is Information about smoking habits large cohort to clarify grip and alcohol intake was obtained eagerly recommended to improve strength-mortality association in from self-administrated questionprognosis. more detail: first, by investigating naires conducted during the period association in an age and sex-spe1965-1968. Categories for smokcific manner, second, by studying ing habits were “never,” “former,” cause-specific association, and third, by determining time and “current.” For current smokers, a question was included trends of this association after dividing the follow-up into about quantity of cigarettes smoked. Categories for alcohol intake were “never” and “former/current.” Individual radidifferent time periods. ation dose estimates were based on RERF’s 1986 Dosimetry System (DS86).16 METHODS Subjects were members of the AHS cohort of RERF. The AHS was begun in 1958 by RERF’s predecessor, the Atomic Bomb Casualty Commission (ABCC), as a clinical cohort study to investigate the long-term medical and biological effects of exposure to atomic-bomb radiation among the survivors and unexposed controls in Hiroshima and Nagasaki. Approximately 20,000 persons were invited to participate in biennial health examinations conducted by ABCC (and later, RERF) clinical physicians. A detailed description of the examinations, which included clinical evaluations and routine laboratory determinations, is available elsewhere.15 Mortality Follow-up Mortality was followed-up for the entire study sample from the time of grip-strength examination in 1970-1972 until the end of 1999. Deaths were routinely identified through Japan’s koseki (obligatory household registry) system, and ascertainment is essentially complete. Causes of death were obtained from death certificates. Underlying causes of death were classified into the following categories: cancer (140208 by International Classification of Diseases [ICD] 8th or 9th), heart disease (390-429 by ICD 8th or 9th), coronary heart disease (CHD, 410 by ICD 8th or 9th), stroke (430-438 by ICD 8th or 9th), cerebral infarction (CI, 433 and 434 by Handgrip Measurement Current study subjects were derived from 6129 persons in the AHS cohort who underwent a battery of noninvasive age-related physiological tests between July 1970 and June 1972 in Hiroshima.14 Handgrip strength was measured 2 times for both left and right hands with subjects in a standing position using a dynamometer in units of kilograms. Grip devices were calibrated with known weights. Subjects held the dynamometer at thigh level and were encouraged to exert the strongest possible force. The maximum grip strength among all measurements was used for the present analysis. Analysis was restricted to 4912 subjects (1695 men and 3217 women) in Hiroshima who were 35 to 74 years old at the time of examination and who had completed the grip-strength measurements, as well as provided other clinical information (Table 1). Table 1 Clinical Characteristics of the Study Subjects Number of subjects Age at examination (years) Systolic blood pressure (mm Hg) Diastolic blood pressure (mm Hg) Total cholesterol (mg/dL) Body mass index (kg/m2) Mean grip strength (kg) Current smoker (%) Cigarettes smoked (per day) Current alcohol drinker (%) Men Women 1689 55.5 ⫾ 11.1 130.9 ⫾ 23.6 3209 53.9 ⫾ 10.7 125.5 ⫾ 23.4 81.9 ⫾ 26.1 78.7 ⫾ 26.2 183.7 ⫾ 34.3 21.7 ⫾ 3.1 46.4 ⫾ 9.0 68.4 18.6 70.0 200.7 ⫾ 37.6 22.6 ⫾ 3.6 29.2 ⫾ 6.3 13.9 10.1 15.7 Each continuous variable is shown as mean value ⫾ SD. Sasaki et al Grip Strength and Mortality Prognosis 339 Analysis was carried out separately by sex. Deaths within the first 2 years after baseline were excluded from analysis. Secular trends of multivariate-adjusted RR of all causes of death, except external causes, were calculated by dividing the follow-up period from baseline examination (within 5 years, after 5 years, after 10 years, after 15 years, and after 20 years). RESULTS Figure 1 Average grip strength (kg) by age- and sex-specific categories. ICD 8th or 9th), cerebral hemorrhage (CH, 431 by ICD 8th or 9th), and pneumonia (480-487 by ICD 8th or 9th). Pneumonia was chosen because it is one of the major causes of death among elderly persons in Japan. Statistical Analysis Relative risk (RR) of mortality associated with grip strength was adjusted multivariately for potentially confounding factors by Cox proportional hazard models, both in men and women. The factors considered in the models were age at baseline, systolic blood pressure, BMI, smoking and drinking habits, serum cholesterol level, and radiation dose. Allowance for the effect of radiation dose was necessary because the study population included atomic bomb survivors exposed to radiation. When RR of all causes of mortality except external deaths was estimated according to the sex- and age-specific quintile of grip strength, the third quintile was established as a reference. For trend test, the mean value of grip strength in each quintile was assigned to the category. In the case of cause-specific mortalities, RR was calculated for each 5-kg increment of grip strength. Table 2 Average age at examination was 55.5 years in men and 53.9 years in women. Average grip strength was 46.4 kg in men and 29.2 kg in women. According to average grip strength by age- and sex-specific categories, a gradual decrease was apparent in both sexes. Decrease of grip strength from 35-44 years to 65-74 years was 11.1 kg in men and 8.8 kg in women (Figure 1). Other clinical characteristics are shown in Table 1. Men tend to have higher systolic and diastolic blood pressure, and are more likely than women to smoke and to drink alcohol. Over the 27 years of follow-up, 2483 deaths occurred besides those from external causes, which included trauma and suicide. Numbers of deaths from cancer, heart disease, stroke, and pneumonia were 784, 518, 435, and 191, respectively (Table 2). Multivariate-adjusted RR was compared among different grip-strength categories divided into quintiles for each age and sex group, using the third quintile group as reference. In all age and sex groups, a declining trend of mortality by increment of grip strength was observed. RR of mortality for the highest quintile in men was 0.52 (95% confidence interval [CI], 0.33-0.80) for the age group 35-54 years, 0.72 (95% CI, 0.53-0.98) for ages 55-64 years, and 0.67 (95% CI, 0.49-0.91) for ages 65-74 years, which was significantly lower than that of the reference group. RR of mortality for the lowest quintile in men aged 55-64 years (RR 1.38, 95% CI, 1.01-1.89) and aged 65-74 years (RR 1.38, 95% CI, 1.01-1.88) was significantly higher than that of the reference group (Figure 2). RR of mortality for the lowest quintile in women aged 35-54 years (RR 1.39, 95% CI, 1.02-1.90) and aged 65-74 Number of Deaths by Cause During Follow-up Period of 30 Years Number of subjects at baseline Mean (⫾ SD) age at baseline (years) All death except external causes Cancer Heart CHD Stroke CI CH Pneumonia Men Women Total 1689 55.5 ⫾ 11.1 1081 391 185 87 172 74 41 82 3209 53.9 ⫾ 10.7 1402 393 333 122 263 105 55 109 4898 54.4 ⫾ 10.9 2483 784 518 209 435 179 96 191 CHD ⫽ coronary heart disease; CI ⫽ cerebral infarction; CH ⫽ cerebral hemorrhage. 340 The American Journal of Medicine, Vol 120, No 4, April 2007 Table 3 Relative Risk (RR) of Death for Each 5-kg Increment of Grip in Men All death except external causes Cancer Heart CHD Stroke CI CH Pneumonia Age-adjusted RR Multivariateadjusted RR 0.89 (0.86-0.93) 0.89 (0.86-0.92) 0.95 0.86 0.85 0.92 0.90 0.86 0.83 (0.90-1.01) (0.79-0.94) (0.75-0.96) (0.84-1.00) (0.79-1.03) (0.73-1.03) (0.73-0.94) 0.94 0.85 0.83 0.90 0.90 0.85 0.85 (0.88-1.00) (0.79-0.93) (0.74-0.94) (0.83-0.99) (0.79-0.96) (0.72-1.01) (0.75-0.98) RR was adjusted for age, systolic blood pressure, body mass index, total cholesterol, smoking habits, alcohol consumption, and radiation dose. Figures in parentheses are 95% confidence intervals (CI). CHD ⫽ coronary heart disease; CI ⫽ cerebral infarction; CH ⫽ cerebral hemorrhage. Figure 2 Multivariate-adjusted relative risk (RR) among different grip strength categories divided into quintiles in each age and sex group, using the third quintile group as reference. years (RR 1.54, 95% CI, 1.20-1.98) was significantly higher than that of the reference group (Figure 2). Age-adjusted RR of all causes of death, except external causes, for each 5-kg increment of grip strength in men was significantly low (RR 0.89, 95% CI, 0.86-0.92). Age-adjusted RR for heart disease, CHD, and pneumonia was 0.86 (95% CI, 0.79-0.94), 0.85 (95% CI, 0.75-0.96), and 0.83 (95% CI, 0.73-0.94), respectively. Multivariate-adjusted RR of all causes of death, except external causes, was not changed in age-adjusted values, although RR of stroke (RR 0.90, 95% CI, 0.83-0.99) and cerebral infarction (RR 0.90, 95% CI, 0.79-0.96) became statistically significant (Table 3). Age-adjusted RR of all causes of death, except external causes, for each 5-kg increment of grip strength in women also was significantly low (RR 0.89, 95% CI, 0.84-93). Age-adjusted RR for heart disease, stroke, and cerebral infarction was 0.82 (95% CI, 0.75-0.91), 0.87 (95% CI, 0.78-0.97), and 0.81 (95% CI, 0.68-0.97), respectively. Age-adjusted RR for CHD was not significant (RR 0.90, 95% CI, 0.76-1.06). Multivariate-adjusted RR was not significantly different in age-adjusted values (Table 4). Multivariate-adjusted RR of all causes of death, except external causes, for each 5-kg increment of grip strength in women (RR 0.87, 95% CI, 0.83-0.92) was not very different from that observed in men. Secular trends of multivariate-adjusted RR of all causes of death, except external causes, were analyzed. RR tended to move to unity through the follow-up period, from 0.80 (95% CI, 0.74-0.87), during the initial 5 years after baseline examination, to 0.92 (95% CI, 0.87-0.96), at more than 20 years of follow-up. However, even after 20 years of followup, RR was significantly lower for every 5-kg increment of grip strength (Table 5). DISCUSSION Grip strength was a strong and consistent predictor of all causes of mortality in middle-aged and elderly persons in Table 4 Relative Risk (RR) of Death for Each 5-kg Increment of Grip in Women All death except external causes Cancer Heart CHD Stroke CI CH Pneumonia Age-adjusted RR Multivariateadjusted RR 0.89 (0.84-0.93) 0.87 (0.83-0.92) 1.00 0.82 0.90 0.87 0.81 0.83 0.86 (0.91-1.09) (0.75-0.91) (0.76-1.06) (0.78-0.97) (0.68-0.97) (0.66-1.05) (0.73-1.03) 0.99 0.80 0.88 0.85 0.80 0.80 0.87 (0.90-1.08) (0.72-0.88) (0.75-1.04) (0.76-0.95) (0.68-0.96) (0.63-1.02) (0.73-1.04) RR was adjusted for age, systolic blood pressure, body mass index, total cholesterol, smoking habits, alcohol consumption, and radiation dose. Figures in parentheses are 95% confidence intervals (CI). CHD ⫽ coronary heart disease; CI ⫽ cerebral infarction; CH ⫽ cerebral hemorrhage. Sasaki et al Grip Strength and Mortality Prognosis Table 5 Secular Trends of Multivariate-Adjusted Relative Risk (RR) of all Death Except External Causes Follow-up Period RR 95% CI ⱕ5 years since baseline ⬎5 years ⬎10 years ⬎15 years ⬎20 years 0.80 0.90 0.91 0.92 0.92 (0.74-0.87) (0.87-0.93) (0.88-0.95) (0.88-0.96) (0.87-0.96) RR was estimated for each 5-kg increment of grip strength. CI ⫽ confidence interval. Japan at more than 20 years of follow-up from baseline. This association was observed in all age categories from 35 to 74 years and in both sexes. It predicted not only all causes of mortality, but also heart disease and stroke mortality. Grip strength may be representative of overall muscular strength because it is highly correlated with other muscular strength measures, including elbow flexion, knee extension, trunk flexion, and trunk extension.17 Maintenance of muscle strength throughout life reduces the prevalence of functional limitations that might closely relate to early death, especially in the elderly.18-21 Muscular strength is related to skeletal muscle mass, which also is a significant site of glucose disposal and insulin action.22 Elevated insulin levels in persons with lower grip strength are thought to be the central feature of insulin-resistance syndrome.23 Muscle is also the greatest reserve of protein in the body and plays an important role in immunity and other functions. People with poor muscular strength, therefore, may be more prone to injurious accidents, and their recovery from acute disease or injury may be compromised.1 Thus, measures of muscular strength can be considered markers of the risk of metabolic disorders, which are ultimately related to risk of premature mortality, especially from cardiovascular diseases. Because muscle strength is closely related to regular physical activity, regular daily exercise to maintain muscle strength is recommended. Most early studies analyzed data from hospitalized patients or the elderly population.1,3,5,6,12 The present analysis concludes that the protective effects of higher grip strength were apparent both in men and women, and in a wide-range of age distribution. The results also show that such protective effects were observed even in nonhospitalized and middle-aged individuals, which demonstrates the importance of maintenance of muscle strength in the middle-age period for better health in later life. Differences in muscle strength and body composition are known to exist between men and women, and from early adulthood on, women have, on average, 30% to 40% less muscle strength than men.23 Several studies investigated the grip-mortality association in women, 2 of which studied elderly women aged 65 years or older, and found an inverse relationship.1-3 Katzmarzyk and Craig failed to show that grip strength was predictive of mortality in middle-aged 341 women, although there was a 49% increased risk of death in the lowest quartile of grip strength in men.2 To the best of our knowledge, our study is the first to show a significant grip-mortality association in middle-aged women. However, it is noteworthy that there was a difference in relationship between grip strength and mortality between the sexes. In men, both ends of grip strength distribution are associated with mortality; in women, however, low grip strength is a risk for premature death and high grip strength is not protective. These differences may be due to the lower and narrower distribution of grip strength in women compared with the distribution in men. Age-adjusted and multivariate-adjusted RR for each 5-kg increment of grip strength for CHD was significantly low in men, but not in women. This may be due to the relatively small number of female CHD cases, because hypertensive heart disease is more prevalent than CHD in Japan, especially in women. The impact of grip strength on mortality prognosis persisted for more than 20 years. Grip strength is shown to be a tracking phenomenon in which the measure remains consistent even if physical activity varies during the observation period.24 Therefore, the lower RR of premature death for people with higher grip strength is stable for long observational periods. The major limitation of the study is that many factors that might affect the observed relationship between grip strength and mortality, such as presence of diabetes, income, education, physical activity, and so on were not included in the analysis. Therefore, the present findings could be subject to residual confounding. Half of the subjects in this study were exposed to A-bomb radiation. However, average grip strength among radiationdose groups did not differ (data not shown), and association between grip strength and mortality was independent from radiation dose (P ⬎.05). Thus, the grip-mortality association can be generalized to other human populations. CONCLUSION Grip strength is a strong and consistent predictor of all causes of mortality in middle-aged and elderly persons, even at more than 20 years of follow-up from baseline. In accordance with the present findings, regular exercise for improvement of physical and musculoskeletal fitness is eagerly recommended to improve prognosis. ACKNOWLEDGMENT This publication is based on research performed at the Radiation Effects Research Foundation (RERF), Hiroshima and Nagasaki, Japan. RERF is a private nonprofit foundation funded equally by the Japanese Ministry of Health, Labour and Welfare (MHLW) and the US Department of Energy (DOE), the latter through the National Academy of Sciences. This publication was supported by RERF Research Protocol RP2-75. 342 References 1. Rantanen T, Volpato S, Ferrucci L, et al. Handgrip strength and cause-specific and total mortality in older disabled women: exploring the mechanism. J Am Geriatr Soc. 2003;51:636-641. 2. Katzmarzyk PT, Craig CL. Musculoskeletal fitness and risk of mortality. Med Sci Sports Exerc. 2002;34:740-744. 3. Snib SA, Markides KS, Ray L, et al. Handgrip strength and mortality in older Mexican Americans. J Am Geriatr Soc. 2002;50:1250-1256. 4. Rantanen T, Guralnik JM, Foley D, et al. Midlife handgrip strength as a predictor of old age disability. JAMA. 1999;281:558-560. 5. Humphreys J, de la Maza P, Hirsch S, et al. Muscle strength as a predictor of loss of functional status in hospitalized patients. Nutrition. 2002;18:616-620. 6. Rantanen T, Avlund K, Suominen H, et al. Muscle strength as a predictor of onset of ADL dependence in people aged 75 years. Aging Clin Exp Res. 2002;14(3 suppl):10-15. 7. Davis JW, Ross PD, Preston SD, et al. Strength, physical activity, and body mass index: relationship to performance-based measures and activities of daily living among older Japanese women in Hawaii. J Am Geriatr Soc. 1998;46:274-279. 8. Rantanen T. Muscle strength, disability and mortality. Scand J Med Sci Sports. 2003;13:3-8. 9. Rantanen T, Harris T, Leveille SG, et al. Muscle strength and body mass index as long-term predictors of mortality in initially healthy men. J Gerontol A Biol Sci Med Sci. 2000;55:M168-M173. 10. Fujita Y, Nakamura Y, Hiraoka J, et al. Physical-strength tests and mortality among visitors to health promotion centers in Japan. J Clin Epidemiol. 1995;48:1349-1359. 11. Phillips P. Grip strength, mental performance and nutritional status as indicators of mortality risk among female geriatric patients. Age Aging. 1986;15:53-56. 12. Bohannon RW. Dynamometer measurements of handgrip strength predict multiple outcomes. Percept Mot Skills. 2001;93:323-328. The American Journal of Medicine, Vol 120, No 4, April 2007 13. Rantanen T, Masaki K, Izmirlian G, et al. Grip strength changes over 27 yr in Japanese-American men. J Appl Physiol. 1998;85: 2047-2053. 14. Belsky JL, Moriyama IM, Fujita S, et al. Aging studies in atomic bomb survivors. RERF Technical Report. 11-78, 1978. 15. Sawada H, Kodama K, Shimizu Y, Kato H. Adult Health Study Report 6: Results of six examination cycles, 1968-80, Hiroshima and Nagasaki. RERF Technical Report. 3-86, 1986. 16. Roesch WC, Ed. Reassessment of Atomic Bomb Radiation Dosimetry in Hiroshima and Nagasaki. Final Report. Hiroshima, Japan: Radiation Effects Research Foundation, 1987. 17. Rantanen T, Era P, Kauppinen M, et al. Maximal isometric muscle strength and socio-economic status, health and physical activity in 75-year-old persons. J Aging Phys Act. 1994;2:206-220. 18. Metter EJ, Talbot LA, Schrager M, et al. Skeletal muscle strength as a predictor of all-cause mortality in healthy men. J Gerontol A Biol Sci Med Sci. 2002;57:B359-B365. 19. Morey MC, Pieper CF, Cornoni-Huntley J. Physical fitness and functional limitations in community-dwelling older adults. Med Sci Sports Exerc. 1998;30:715-723. 20. Huang Y, Macera CA, Blair SN, et al. Physical fitness, physical activity, and functional limitation in adults aged 40 and older. Med Sci Sports Exerc. 1998;30:1430-1435. 21. Brill PA, Macera CA, Davis DR, et al. Muscular strength and physical function. Med Sci Sports Exerc. 2000;32:412-416. 22. Lazarus R, Sparrow D, Weiss ST. Handgrip strength and insulin levels: cross-sectional and prospective associations in the Normative Aging Study. Metabolism. 1997;46:1266-1269. 23. Lindle RS, Metter EJ, Lynch NA, et al. Age and gender comparisons of muscle strength in 654 women and men aged 20-93 yr. J Appl Physiol. 1997;83:1581-1587. 24. Fortier MD, Katzmarzyk PT, Malina RM, et al. Seven-year stability of physical activity and musculoskeletal fitness in the Canadian population. Med Sci Sports Exerc. 2001;33:1905-1911. The American Journal of Medicine (2007) 120, 343-349 CLINICAL RESEARCH STUDY Thyroid Hormone Use, Hyperthyroidism and Mortality in Older Women Douglas C. Bauer, MD,a,b Nicolas Rodondi, MD, MAS,b,c Katie L. Stone, PhD,a Teresa A. Hillier, MD, MS,d for the Study of Osteoporotic Fractures Research Group: Universities of California (San Francisco), Pittsburgh, Minnesota (Minneapolis), and Kaiser Permanente Center for Health Research, Portland a Division of General Internal Medicine, University of California, San Francisco; bDepartment of Epidemiology and Biostatistics, University of California, San Francisco; cUniversity Outpatient Clinic, Department of Community Medicine and Public Health, University of Lausanne, Switzerland; dDepartment of Endocrinology, Center for Health Research Northwest/Hawaii, Kaiser Permanente Northwest, Portland, Ore. ABSTRACT PURPOSE: Thyroid dysfunction is common, particularly among older women. The safety of thyroid hormone use and long-term prognosis of hyperthyroidism remain controversial. We performed a prospective cohort study to examine the relationship among thyroid hormone use, previous hyperthyroidism, abnormal thyroid function, and mortality. METHODS: We studied 9449 community-dwelling white women aged ⱖ65 years followed for 12 years. For analyses of thyroid function, we performed a nested case-cohort in 487 women using a third-generation thyroidstimulating hormone assay. Causes of death were adjudicated based on death certificates and hospital records. RESULTS: Twelve percent of the 9449 women took thyroid hormone at baseline, and the mean duration of thyroid hormone use was 15.8 years; 9.4% of participants reported a history of hyperthyroidism. During 12 years of follow-up, 3159 women died (33%). In multivariate analysis, mortality among users of thyroid hormone was similar to that observed for nonusers (relative hazard [RH] 1.11, 95% confidence interval [CI], 0.98-1.24, P ⫽ .09). Previous hyperthyroidism was associated with a higher risk of all-cause mortality (RH 1.20, 95% CI, 1.06-1.36), particularly cardiovascular mortality (RH 1.46, 95% CI, 1.20-1.77). Low (ⱕ0.5 mU/L) or high (⬎5 mU/L) thyroid-stimulating hormone levels were not associated with excess total or cause-specific mortality, but the power to detect these relationships was limited. CONCLUSIONS: Among older women, thyroid hormone use is not associated significantly with excess mortality, but previous hyperthyroidism may be associated with a small increase in all-cause and cardiovascular mortality. Additional long-term studies of hyperthyroidism and its treatment should further explore these findings. © 2007 Elsevier Inc. All rights reserved. KEYWORDS: Thyroid diseases; Thyroid hormones; Thyrotropin; Mortality; Cardiovascular disease; Cohort study Thyroid dysfunction is common, particularly among older women and other high-risk groups.1 Prevalence estimates of thyroid dysfunction (both hyper- and hypothyroidism) in This work was supported by Public Service Grants K08 AG00629 (NIA), and AG05407, AR35582, AG05394, AR35584, AR35583. Dr. Rodondi was supported by a grant from the Swiss National Foundation (PBLAB-102353). Requests for reprints should be addressed to Douglas C. Bauer, MD, University of California, San Francisco 185 Berry, #5700, San Francisco, CA 94107. E-mail address: [email protected] 0002-9343/$ -see front matter © 2007 Elsevier Inc. All rights reserved. doi:10.1016/j.amjmed.2006.04.034 older women range from 5%-10%,2,3 and 10% of women over age 65 years in the US take thyroid hormone,4 a large proportion with biochemical evidence of over- or underreplacement.5-7 The clinical consequences of hypothyroidism or hyperthyroidism have been primarily studied in those with overt disease (symptomatic). Individuals with untreated overt thyroid dysfunction have a reduced life expectancy.8,9 Mortality rates among women with subclinical thyroid dysfunction have not been well studied, but even mild forms of thyroid disease may be associated with greater mortality for several 344 The American Journal of Medicine, Vol 120, No 4, April 2007 reasons. First, high thyroid-stimulating hormone is associFor the analyses of thyroid-stimulating hormone and ated with hyperlipidemia,6,10,11 which could promote coromortality we used a case-cohort design25 using a random nary disease. Second, abnormalities of cardiac contractility sample of 487 women nested in the entire cohort of 9449 and arrhythmias, particularly atrial fibrillation,12 have been women. Our analysis set for thyroid-stimulating hormone described among individuals with low thyroid-stimulating measurements consisted of 147 death (cases) and 340 surhormone, but the clinical signifivivors (controls). From the 1123 cance of these findings is uncerdeaths that had occurred as of tain.13 Finally, low thyroid-stimuMarch 1995 (mean follow-up ⫽ 6.7 CLINICAL SIGNIFICANCE lating hormone is associated with years), we randomly selected 92 an increased risk of fracture in cases. In addition, we randomly ● Long-term use of thyroid hormone did older women, and hip fractures in identified 400 women from the ennot affect all-cause, cardiovascular, or particular are associated with extire cohort, of whom 58 had died as cancer mortality. cess mortality.4 The treatment of of March 1995 and were analyzed ● Previous hyperthyroidism may be associhyperthyroidism also might be harmas cases, as recommended for this ful, as increased mortality among indesign.25 We excluded 2 survivors ated with an increase in mortality. dividuals with hyperthyroidism and 3 cases because of missing treated with radioiodine or anti-thybaseline data. roid drugs has been reported.14,15 Measurements The relationship between thyroid hormone use and morParticipants were interviewed and examined at one of the tality is also unclear, but a number of older studies have clinical centers during the baseline visit in 1986-1988. At linked thyroid hormone use to a variety of adverse outthat visit, detailed data about physician-diagnosed medical comes, including cancer16 and coronary disease.17 It should conditions and past medication use (before baseline) were be noted that the use of nonsynthetic thyroid hormone collected, and baseline medication use at the time of the preparations was common in these older studies, and their visit, including thyroid hormone use, was confirmed by findings have not been confirmed.18,19 Studies of the crossexamination of pill bottles by trained interviewers. Particisectional20,21 and longitudinal22 relationship between abnorpants were asked specifically about previous diagnoses of mal thyroid-stimulating hormone levels and cardiovascular hyperthyroidism or Graves’ disease ever in their life. Infordisease are similarly conflicting. A recent population-based mation on prior treatment for hyperthyroidism was not study found that an elevated thyroid-stimulating hormone collected. with normal thyroid hormone levels (subclinical hypothyroidism) was associated with a greater prevalence of aortic Ascertainment of Deaths. Women were contacted by postatherosclerosis.23 card every 4 months. If a participant died, copies of the To further examine the relationship among use of thyroid official death certificate and hospital records, if available, hormone, history of hyperthyroidism, abnormal thyroid were collected. The cause of death was then adjudicated by function, and mortality in older women, we performed a a physician-investigator at the Coordinating Center (Uniprospective analysis in the Study of Osteoporotic Fractures versity of California, San Francisco) who was unaware of examining the risk of mortality among those with and withthe participant’s thyroid status or other predictor variout thyroid conditions. ables. Causes of death were assigned by ICD-9 codes. Cardiovascular causes of death included codes 390-459, METHODS while cancer causes of death included ICD-9 codes 140Subjects and Design 240. All other codes were classified as “other.” Subjects in this prospective study were participants in the Thyroid-Stimulating Hormone Assays. Sera were colStudy of Osteoporotic Fractures (SOF), a population-based lected from each participant at the baseline visit and stored cohort study begun in 1986-1988 of 9704 communityat ⫺190°C. In 1995, thyroid-stimulating hormone assays dwelling white women aged 65 years and over at entry. were performed on thawed baseline sera from 2 groups: These women were recruited for SOF from populationbased listings at 4 clinical centers irrespective of osteopowomen who died during follow-up (n ⫽ 147) and women rosis status (Portland, Ore; Minneapolis, Minn; Baltimore, randomly selected from the cohort (n ⫽ 340). Thyroid-stimMd; and the Monongahela Valley near Pittsburgh, Penn). ulating hormone is highly stable in frozen sera over proOnly women with prior bilateral hip replacement were exlonged periods.5,26 cluded. The SOF study has been described in detail elseThyroid-stimulating hormone levels were measured uswhere.24 Our overall design was a prospective cohort study ing a highly sensitive, third-generation chemiluminescent to assess the relationship among history of hyperthyroidism, assay (Endocrine Science, Calabasas, CA). The normal thyroid hormone use, and mortality. These analyses inrange for this assay is 0.5-5.5 mU/L; the minimum detection cluded all women with complete baseline data who were not level is 0.01 mU/L. At thyroid-stimulating hormone conlost to follow-up (99% of the cohort). centrations of 0.5 mU/L, the intra- and interassay coeffi- Bauer et al Thyroid Disease and Mortality cients of variation (CV) are 4.7% and 6.3%, respectively. Thirty randomly selected specimens were blindly submitted for duplicate analysis. The correlation between these 2 thyroid-stimulating hormone results was high (r ⫽ 0.95). All hormone analyses were performed without knowledge of the participant’s vital status or thyroid history. Analysis Differences in baseline characteristics were tested with t test or chi-squared test. Thyroid-stimulating hormone levels were then categorized as low (ⱕ0.5 mU/L), normal (0.5-5.5 mU/L), or high (⬎5.5 mU/L) based on the normal range provided by the manufacturer. Additional analyses were performed using a low thyroid-stimulating hormone cutpoint of ⱕ0.1 mU/L, which is highly correlated with a suppressed response to thyroid-stimulating hormone stimulation and is the best indicator of thyroid excess among community-dwelling adults.27 The relationships among hyperthyroidism, thyroid hormone use, and mortality were analyzed with Cox proportional hazards models (SAS Institute, Cary, NC). The subcohort analyses examining the relationship between thyroid-stimulating hormone levels and mortality utilized proportional hazards models that take account of the casecohort sampling design (Epicure, Hirosoft International, Seattle WA).25 Multivariate models were constructed to account for potential confounders that were selected on the basis of either biologic plausibility (eg, hypertension, diabetes) or strong association (P ⬍.05) with hyperthyroidism or thyroid-stimulating hormone level (eg, age). Results are reported as relative hazards (RH), with 95% confidence intervals (CI). RESULTS During a mean follow-up of 11.9 years, with ascertainment of vital status 99% complete, 3159 (33%) women died. The most common causes of death were cardiovascular (n ⫽ 1210) and cancer (n ⫽ 818). Baseline Characteristics At the baseline visit, 12% of the 9449 women took thyroid hormone, and 9.4% reported previous hyperthyroidism (Table 1). Compared with women without previous hyperthyroidism, women who reported hyperthyroidism were older, less likely to report good or excellent health, less likely to drink alcohol, more likely to be hypertensive, and more likely to use estrogen and thyroid hormone. The baseline characteristics of the subcohort with thyroid-stimulating hormone measurements, including the 147 women who died and 340 who were alive as of March 1995, are shown in Table 2. Compared with the surviving women, those who died were older, lighter, less active, reported poorer health status, and more likely to be hypertensive. 345 Table 1 Previous Hyperthyroidism and Mortality: Baseline Characteristics of Entire Cohort Variable Age (years ⫾ SD) Weight (kg ⫾ SD) Self-reported health status (good or excellent, %) Baseline cigarette use (%) Baseline alcohol use (%) Physical activity (kcal/years) Diabetes (%) Hypertension (%) Baseline oral estrogen use (%) Thyroid hormone use (%) At baseline Before baseline History of Hyperthyroidism (n ⫽ 891) No History of Hyperthyroidism (n ⫽ 8558) 72.3 ⫾ 5.6† 66.7 ⫾ 11.8 76.3† 71.6 ⫾ 5.3 67.1 ⫾ 12.6 84.3 10.4 10.1 67.0* 70.1 1570 ⫾ 1716* 1612 ⫾ 1671 8.0 42.6† 15.5* 6.7 37.9 13.7 48.7† 20.6† 8.1 5.9 *P ⬍.05 compared with women without hyperthyroidism. †P ⬍.01 compared with women without hyperthyroidism. Previous Hyperthyroidism and Mortality In age-adjusted analyses in the entire cohort, previous hyperthyroidism was associated with an increased risk of total mortality (RH 1.29, 95% CI, 1.16-1.44). After further adjustment for thyroid hormone use, weight, health status, alcohol and tobacco use, physical activity, diabetes, hypertension, and baseline use of estrogen and thiazides, mortality was 20% higher (95% CI, 6%-36%) among women reporting previous hyperthyroidism (Table 3). In multivariate analyses, previous hyperthyroidism was associated with increased cardiovascular mortality (RH 1.46, 95% CI, 1.201.77). The associations between hyperthyroidism and cancer or other causes of death were not statistically significant (Table 3). The relationship between previous hyperthyroidism and mortality were similar among the smaller subset of women with thyroid-stimulating hormone measurements. After adjustment for thyroid-stimulating hormone levels and other factors, total mortality was still elevated among women with previous hyperthyroidism (RH 1.36), but without reaching statistical significance (95% CI, 0.64-2.93), perhaps as a result of the small sample size. Likewise, the risk of cardiovascular mortality remained elevated among women reporting previous hyperthyroidism, without being statistically significant (RH 2.06, 95% CI, 0.72-5.94). Thyroid Hormone Use and Mortality At the baseline visit, 12% of women were thyroid hormone users with a mean duration use of 15.8 years. In age- 346 The American Journal of Medicine, Vol 120, No 4, April 2007 Table 2 Thyroid-Stimulating Hormone and Mortality: Baseline Characteristics in Subcohort with Thyroid-Stimulating Hormone Measurements Variable Women Who Were Alive at the End of Follow-up (n ⫽ 340) Women Who Died During Follow-up (n ⫽ 147) Age (years ⫾ SD) Weight (kg ⫾ SD) Self-reported health status (good or excellent, %) Baseline cigarette use (%) Baseline alcohol use (%) Physical activity (kcal/years ⫾ SD) Diabetes (%) Hypertension (%) Baseline oral estrogen use (%) History of hyperthyroidism (%) Baseline thyroid hormone use (%) Duration of thyroid hormone use among users at baseline (years ⫾ SD) Thyroid-stimulating hormone (mU/L ⫾ SD) Low thyroid-stimulating hormone (ⱕ0.5 mU/L, %) High thyroid-stimulating hormone (⬎ 5.5 mU/L, %) 71.5 ⫾ 5.0 67.6 ⫾ 12.2 85.0 8.6 68.5 1570 ⫾ 1631 8.3 36.5 9.8 8.8 11.0 14.8 ⫾ 15.3 2.4 ⫾ 3.4 10.6 7.1 75.0 ⫾ 5.5† 64.8 ⫾ 14.0* 72.1† 13.6 65.3 1096 ⫾ 1466† 12.2 49.0† 9.7 10.5 10.3 19.2 ⫾ 19.9 2.3 ⫾ 3.7 11.6 8.2 *P ⬍.05 compared with women who were alive at the end of follow-up. †P ⬍.01 compared with women who were alive at the end of follow-up. adjusted analyses, thyroid hormone use at baseline was associated with total mortality (RH 1.20, 95% CI, 1.091.34). However, in multivariate analysis, mortality among baseline users of thyroid hormone was similar to that observed for nonusers (RH 1.11, 95% CI, 0.98-1.24, P ⫽ .09) (Table 3). Similar analyses of cause-specific death also revealed no statistically significant associations between thyroid hormone use and cardiovascular or cancer mortality. Thyroid hormone use before baseline was not associated with total or cause-specific mortality. Thyroid-Stimulating Hormone Level and Death In the subcohort, we found no significant associations among low, normal, or high thyroid-stimulating hormone values and Table 3 total or cause-specific mortality (Table 4). For example, in multivariate analysis, compared with women with normal thyroid-stimulating hormone (0.5-5.5 mU/L), the relative hazard of any death was 0.86 (95% CI, 0.39-1.87) among women with low thyroid-stimulating hormone (ⱕ0.5 mU/L) and 1.23 (95% CI, 0.55-2.74) among women with high thyroid-stimulating hormone. Results were qualitatively similar among subjects with thyroid-stimulating hormone levels ⱕ0.1 mU/L (total mortality RH 0.63, 95% CI, 0.23-1.73). Excluding subjects with thyroid-stimulating hormone ⱕ0.5 mU/L who used thyroid hormone (86%) yielded similar results. When examined as a continuous variable, neither thyroid-stimulating hormone nor log thyroid-stimulating hormone was related to subsequent mortality. History of Hyperthyroidism, Thyroid Hormone Use and Mortality: Multivariate Results among Entire Cohort* Variable (unit) History of hyperthyroidism (yes) Thyroid hormone use (yes) At baseline Before baseline Age (SD) Weight (SD) Self-reported health status (fair or poor) Baseline cigarette use (yes) Baseline alcohol use (yes) Physical activity (SD) Diabetes (yes) Hypertension (yes) Baseline oral estrogen use (yes) Baseline thiazide use (yes) All-cause Mortality RH (95% CI) CV Deaths RH (95% CI) Cancer Deaths RH (95% CI) Other Deaths RH (95% CI) 1.20 (1.06-1.36) 1.46 (1.20-1.77) 1.08 (0.83-1.41) 1.13 (0.91-1.40) 1.11 0.99 1.71 0.93 1.57 2.03 0.83 0.92 1.78 1.45 0.88 1.45 1.11 0.81 2.03 0.93 1.77 1.89 0.80 0.87 2.29 1.68 0.77 1.00 1.19 1.12 1.53 1.02 1.51 2.68 0.86 0.96 1.34 1.19 0.82 0.99 1.13 1.05 2.05 0.83 1.67 2.24 0.72 0.91 2.10 1.68 1.02 0.78 (0.98-1.24) (0.86-1.15) (1.65-1.76) (0.89-0.97) (1.44-1.72) (1.82-2.26) (0.77-0.89) (0.88-0.96) (1.58-2.00) (1.31-1.61) (0.78-0.99) (1.31-1.61) *The multivariate models include all covariates listed. †RH ⫽ Relative hazards for death (95% confidence interval [CI]). (0.92-1.34) (0.63-1.04) (1.93-2.14) (0.87-0.99) (1.54-2.04) (1.55-2.29) (0.70-0.90) (0.82-0.95) (1.92-2.74) (1.42-2.00) (0.63-0.94) (0.84-1.20) (0.94-1.50) (0.85-1.46) (1.42-1.64) (0.95-1.10) (1.26-1.82) (2.22-3.24) (0.74-1.01) (0.89-1.04) (1.02-1.76) (0.95-1.49) (0.66-1.03) (0.77-1.26) (0.93-1.37) (0.83-1.34) (1.94-2.16) (0.76-0.89) (1.44-1.94) (1.86-2.69) (0.64-0.82) (0.84-0.97) (1.73-2.56) (1.42-1.98) (0.85-1.23) (0.65-0.94) Bauer et al Thyroid Disease and Mortality 347 Table 4 Thyroid-Stimulating Hormone Level and Risk of Death: Multivariate Results among Subcohort with Thyroid-Stimulating Hormone Measurements Relative Hazards for Death (95% CI)* Thyroid-stimulating hormone level (mU/L) ⱕ0.5 ⬎0.5-5.5 ⬎ 5.5 History of hyperthyroidism Baseline thyroid hormone use Total Mortality (n ⫽ 147) CV Deaths (n ⫽ 54) Cancer Deaths (n ⫽ 55) Other Deaths (n ⫽ 39) 0.86 1.0 1.23 1.36 0.69 0.91 1.0 0.92 2.06 0.64 1.16 1.0 1.17 1.23 0.60 0.52 1.0 1.91 1.05 1.04 (0.39-1.87) (0.55-2.74) (0.64-2.93) (0.29-1.66) (0.28-2.95) (0.25-3.34) (0.72-5.94) (0.16-2.59) (0.40-3.40) (0.38-3.60) (0.42-3.63) (0.17-2.10) (0.10-2.63) (0.55-6.60) (0.25-4.43) (0.21-5.25) *Adjusted for variables shown plus age, weight, and baseline use of estrogen. Although limited by the small number of deaths, analyses of cause-specific death revealed no significant associations between thyroid-stimulating hormone level and mortality. There were too few breast cancer deaths among the women with thyroid-stimulating hormone measurements (n ⫽ 8) to examine the relationship between thyroid-stimulating hormone level and breast cancer. There was a trend towards increased noncardiovascular noncancer mortality among women with high thyroid-stimulating hormone (RH 1.91), but this relationship did not reach statistical significance (95% CI, 0.55-6.60). DISCUSSION In this large prospective study of community-dwelling older women, we found that prior hyperthyroidism (or its treatment) was associated with a small increased risk of total mortality, particularly cardiovascular mortality. Conversely, long-term users and nonusers of thyroid hormone had similar rates of all-cause, cardiovascular, and cancer mortality. Among women with baseline thyroid-stimulating hormone measurements, levels above or below the normal range were not associated with total or cause-specific mortality. These data provide reassuring evidence that the large number of postmenopausal women taking thyroid hormone do not face excess risk of mortality. Previous clinical studies of the association between thyroid hormone use and morbidity and mortality have been conflicting. For example, one prospective cohort study of 1180 individuals on thyroxine (90% women) found an increased incidence of coronary disease hospital admissions over 5 years compared with the general population.17 However, this risk was limited to those aged younger than 65 years. Another study of 1462 women found no evidence of an increased risk of coronary disease among thyroid hormone users, but this study had little power to detect mortality relationships, as all of the 22 long-term thyroid hormone users were alive 12 years later.18 Our data with a large number of thyroid hormone users and long-term prospective follow-up provide further evidence that thyroid hormone use is not associated with an increased risk of cardiovascular or cancer mortality. Although there have been numerous reports that subtle abnormalities of thyroid function are not physiologic and may result in cardiac,12 skeletal,4 and neuropsychiatric abnormalities,28-30 but with limited and conflicting data,1,13 we found no evidence that abnormal thyroid-stimulating hormone was associated with excess all-cause mortality. Older pathological studies have suggested that thyroid disease, particularly autoimmune thyroiditis (Hashimoto’s), may be associated with an increased prevalence of cardiovascular disease.31,32 Possible mechanisms postulated to account for the association between thyroid autoimmunity and coronary disease include both direct effects on coronary vasculature33 and indirect effects on serum lipids. However, previous clinical studies of the association between thyroid disease and cardiovascular disease have been conflicting.13 In a study of 945 consecutive hospital admissions, Tieche et al found that the prevalence of coronary disease was significantly higher among adults with elevated thyroidstimulating hormone (ⱖ4 mU/L) compared with agematched controls with normal thyroid-stimulating hormone.21 Another large study from Whickham, England found a weak association between elevated thyroid-stimulating hormone and minor (but not major) EKG abnormalities in women,20 but there was no association with coronary disease during a reanalysis of the same cohort after 20 years of follow-up.22 Consistent with our results, the Whickham study also found no evidence that women with elevated thyroid-stimulating hormone or antithyroid antibodies experienced greater total mortality (RR 0.90, 95% CI, 0.65-1.22). Other studies have found similar associations between hyperthyroidism and increased cardiovascular risk. One population-based study of 1191 individuals found an association between low thyroid-stimulating hormone and mortality, largely accounted for by an increase in cardiovascular disease.34 Another study of 1049 patients admitted from an emergency department found that compared with those with normal T3 values, patients with high serum T3 concentrations at the time of admission were more likely to have angina pectoris or myocardial infarction (OR 2.6) and were much more likely to develop subsequent cardiovascular 348 events during a 3-year follow-up.35 Moreover, hyperthyroidism has been associated with an abnormal left ventricular function36 and atrial fibrillation. For example, in the Framingham cohort, individuals with low thyroid-stimulating hormone were 3-fold more likely to develop atrial fibrillation during follow-up,7 which may lead to death by heart failure or stroke. Lastly, it has been postulated that treatment for hyperthyroidism itself may be associated with adverse cardiovascular outcomes. One population-based study found an unexpectedly high total and cardiovascular mortality rate among 7209 subjects with hyperthyroidism treated with radioactive iodine.14 However, this study did not clarify whether this increased mortality was attributable to radioiodine or hyperthyroidism per se, as it only compared these rates of death to the general population. It has not been reported that antithyroid medications might be associated with increased cardiovascular disease or cardiovascular mortality.37,38 Similar to these previous studies, we were not able to test these hypotheses, as we did not collect information on specific treatments for hyperthyroidism, but our results could indicate that hyperthyroidism itself and not its treatment is responsible. Further large studies are needed to clarify whether hyperthyroidism itself or its treatment is associated with cardiovascular mortality. Some, but not all, previous studies have suggested that thyroid disease is associated with malignancy, particularly breast cancer. In the study by Petersen et al noted above, 3% of thyroid hormone users developed cancer compared with 5.3% of nonusers, but there was no adjustment for age or other potential confounders.18 More recently, several studies have demonstrated an association between thyroid size or autoimmunity and breast cancer.39,40 Despite its relatively large size and high follow-up rates, our study did have several limitations. Our assessment of hyperthyroidism was by self-report, and previous studies have found that hyperthyroidism was over-reported by older women.41 Misclassification of thyroid conditions, such as inability to report a specific thyroid condition, may have biased our results, but such misclassification would be expected to underestimate the effect of any observed associations. We did confirm all self-reported thyroid hormone use, but were unable to analyze specific thyroid hormone preparations. We did not measure T4 levels in this subcohort and so were unable to differentiate abnormal thyroidstimulating hormone related to overt or subclinical thyroid disease. Furthermore, we did not measure thyroid autoantibodies and therefore may have overlooked more specific associations with pure thyroid autoimmunity. In the subcohort of 487 women, we had limited power to examine the relationship between thyroid-stimulating hormone levels and mortality, and were also not able to examine in detail the relationship between thyroid-stimulating hormone levels and cause-specific mortality because of the small number of each specific cause of death. In summary, in this large population-based prospective study, we found that previous hyperthyroidism was associ- The American Journal of Medicine, Vol 120, No 4, April 2007 ated with a small increase in mortality, particularly due to cardiovascular disease. Low or high thyroid-stimulating hormone was not associated with mortality in this cohort. Long-term users and nonusers of thyroid hormone had similar rates of all-cause, cardiovascular, and cancer mortality. Additional long-term studies of hyperthyroidism and its treatment are needed to confirm and further explore these findings. References 1. Helfand M. Screening for subclinical thyroid dysfunction in nonpregnant adults: a summary of the evidence for the US Preventive Services Task Force. Ann Intern Med. 2004;140:128-141. 2. Sawin CT, Castelli WP, Hershman JM, McNamara P, Bacharach P. The aging thyroid. Thyroid deficiency in the Framingham Study. Arch Intern Med. 1985;145:1386-1388. 3. Hollowell JG, Staehling NW, Flanders WD, et al. Serum TSH, T(4), and thyroid antibodies in the United States population (1988 to 1994): National Health and Nutrition Examination Survey (NHANES III). J Clin Endocrinol Metab. 2002;87:489-499. 4. Bauer DC, Ettinger B, Nevitt MC, Stone KL. Risk for fracture in women with low serum levels of thyroid-stimulating hormone. Ann Intern Med. 2001;134:561-568. 5. Stall G, Harris S, Sokoll LJ, Dawson-Hughes B. Accelerated bone loss in hypothyroid patients overtreated with l-thyroxine. Ann Intern Med. 1990;113:265-269. 6. Canaris GJ, Manowitz NR, Mayor G, Ridgway EC. The Colorado thyroid disease prevalence study. Arch Intern Med. 2000;160:526-534. 7. Sawin CT, Geller A, Wolf PA, et al. Low serum thyrotropin concentrations as a risk factor for atrial fibrillation in older persons. N Engl J Med. 1994;331:1249-1252. 8. Barker DJ, Phillips DI. Current incidence of thyrotoxicosis and past prevalence of goitre in 12 British towns. Lancet. 1984;2:567-570. 9. Goldman MB, Monson RR, Maloof F. Cancer mortality in women with thyroid disease. Cancer Res. 1990;50:2283-2289. 10. Bauer DC, Ettinger B, Browner WS. Thyroid functions and serum lipids in older women: a population-based study. Am J Med. 1998; 104:546-551. 11. Althaus BU, Staub JJ, Ryff-De Leche A, Oberhansli A, Stahelin HB. LDL/HDL-changes in subclinical hypothyroidism: possible risk factors for coronary heart disease. Clin Endocrinol (Oxf). 1988;28: 157-163. 12. Sawin C. Subclinical hyperthyroidism and atrial fibrillation. Thyroid. 2002;12:501-503. 13. Surks MI, Ortiz E, Daniels GH, et al. Subclinical thyroid disease: scientific review and guidelines for diagnosis and management. JAMA. 2004;291:228-238. 14. Franklyn JA, Maisonneuve P, Sheppard MC, Betteridge J, Boyle P. Mortality after the treatment of hyperthyroidism with radioactive iodine. N Engl J Med. 1998;338:712-718. 15. Ron E, Doody MM, Becker DV, et al. Cancer mortality following treatment for adult hyperthyroidism. Cooperative Thyrotoxicosis Therapy Follow-up Study Group. JAMA. 1998;280:347-355. 16. Kapdi CC, Wolfe JN, Shapiro S, et al. Breast cancer. Relationship to thyroid supplements for hypothyroidism. JAMA. 1976;236:1124-1127. 17. Leese GP, Jung RT, Guthrie C, Waugh N, Browning MC. Morbidity in patients on L-thyroxine: a comparison of those with a normal TSH to those with a suppressed TSH. Clin Endocrinol (Oxf). 1992;37: 500-503. 18. Petersen K, Bengtsson C, Lapidus L, Lindstedt G, Nystrom E. Morbidity, mortality, and quality of life for patients treated with levothyroxine. Arch Intern Med. 1990;150:2077-2081. 19. Shapiro S, Slone D, Kaufman DW, et al. Use of thyroid supplements in relation to the risk of breast cancer. JAMA. 1980;244:1685-1687. Bauer et al Thyroid Disease and Mortality 20. Tunbridge WMG, Evered DC, Hall R, et al. The spectrum of thyroid disease in a community: the Whickham survey. Clin Endocrinol. 1977;7:481-493. 21. Tieche M, Lupi GA, Gutzwiller F, Grob PJ, Studer H, Burgi H. Borderline low thyroid function and thyroid autoimmunity. Risk factors for coronary heart disease? Br Heart J. 1981;46:202-206. 22. Vanderpump MP, Tunbridge WM, French JM, et al. The development of ischemic heart disease in relation to autoimmune thyroid disease in a 20-year follow-up study of an English community. Thyroid. 1996; 6:155-160. 23. Hak A, Pols H, Visser T, Drexage H, Hoffman A, Witteman J. Subclinical hypothyroidism is an independent risk factor for atherosclerosis and myocardial infarction in elderly women: the Rotterdam Study. Ann Intern Med. 2000;132:270-278. 24. Cummings S, Nevitt M, Browner W, et al. Risk factors for hip fracture in white women. N Engl J Med. 1995;332:767-773. 25. Prentice RL. A case-cohort design for epidemiologic cohort studies and disease prevention trials. Biometrika. 1986;73:1-11. 26. Kashiwai T, Ichihara K, Tamaki H, et al. The stability of immunological and biological activity of human thyrotropin in buffer: its temperature-dependent dissociation into subunits during freezing. Scand J Clin Lab Invest. 1991;51:417-423. 27. Spencer C, Schwarzbein D, Guttler R, LoPresti J, Nicoloff J. Thyrotropin (TSH)-releasing hormone stimulation test responses employing third and fourth generation TSH assays. J Clin Endocrinol Metab. 1992;76:494-498. 28. Cooper D, Halpern R, Wood L, Levin A, Ridgway E. L-thyroxine therapy in subclinical hypothyroidism. Ann Intern Med. 1984;101:18-24. 29. Kong WM, Sheikh MH, Lumb PJ, et al. A 6-month randomized trial of thyroxine treatment in women with mild subclinical hypothyroidism. Am J Med. 2002;112:348-354. 30. Jaeschke R, Guyatt G, Gerstein H, et al. Does treatment with Lthyroxine influence health status in middle-aged and older adults with subclinical hypothyroidism? J Gen Intern Med. 1996;11:744-749. 349 31. Bastenie PA, Vanhaelst L, Neve P. Coronary-artery disease in hypothyroidism. Lancet. 1967;2:1221-1222. 32. Salabe GB, Salabe-Lotz H, Puletti M, Milani C. Hypothyroidism and thyroid autoimmunity in acute myocardial infarction (AMI). Thyroidology. 1989;1:67-72. 33. Sellitti DF, Dennison D, Akamizu T, Doi SQ, Kohn LD, Koshiyama H. Thyrotropin regulation of cyclic adenosine monophosphate production in human coronary artery smooth muscle cells. Thyroid. 2000;10: 219-225. 34. Parle JV, Maisonneuve P, Sheppard MC, Boyle P, Franklyn JA. Prediction of all-cause and cardiovascular mortality in elderly people from one low serum thyrotropin result: a 10-year cohort study. Lancet. 2001;358:861-865. 35. Peters A, Ehlers M, Blank B, et al. Excess triiodothyronine as a risk factor of coronary events. Arch Intern Med. 2000;160:1993-1999. 36. Forfar JC, Muir AL, Sawers SA, Toft AD. Abnormal left ventricular function in hyperthyroidism: evidence for a possible reversible cardiomyopathy. N Engl J Med. 1982;307:1165-1170. 37. Cooper DS. Antithyroid drugs. N Engl J Med. 2005;352:905-917. 38. Bartalena L, Bogazzi F, Martino E. Adverse effects of thyroid hormone preparations and antithyroid drugs. Drug Saf. 1996; 15:53-63. 39. Smyth PP, Shering SG, Kilbane MT, et al. Serum thyroid peroxidase autoantibodies, thyroid volume, and outcome in breast carcinoma. J Clin Endocrinol Metab. 1998;83:2711-2716. 40. Giani C, Fierabracci P, Bonacci R, et al. Relationship between breast cancer and thyroid disease: relevance of autoimmune thyroid disorders in breast malignancy. J Clin Endocrinol Metab. 1996;81: 990-994. 41. Brix TH, Kyvik KO, Hegedus L. Validity of self-reported hyperthyroidism and hypothyroidism: comparison of self-reported questionnaire data with medical record review. Thyroid. 2001;11:769-773. The American Journal of Medicine (2007) 120, 350-356 CLINICAL RESEARCH STUDY TB in a Low-Incidence Country: Differences Between New Immigrants, Foreign-Born Residents and Native Residents Gerd Laifer, MD,a Andreas F. Widmer, MD, MS,a Mathew Simcock, MSc,b Stefano Bassetti, MD,a Andrej Trampuz, MD,a Reno Frei, MD,c Michael Tamm, MD,d Manuel Battegay, MD,a Ursula Fluckiger, MDa a Division of Infectious Diseases and Hospital Epidemiology, bBasel Institute of Epidemiology, cDivision of Microbiology, and dDivision of Pneumology, University Hospital Basel, Switzerland. ABSTRACT BACKGROUND: New immigrants and foreign-born residents add to the burden of pulmonary tuberculosis (TB) in low-incidence countries. The highest TB rates have been found among recent immigrants. Active screening programs are likely to change the clinical presentation of TB, but the extent of the difference between immigrant and resident populations has not been studied prospectively. METHODS: Adult new immigrants were screened upon entry to 1 of 5 immigration centers in Switzerland. Immigrants with abnormal chest radiographs were enrolled and compared in a cohort study to consecutive admitted foreign-born residents from moderate-to-high incidence countries and native residents presenting with suspected TB. RESULTS: Of 42,601 new immigrants screened, 112 had chest radiographs suspicious for TB. They were compared with foreign-born residents (n ⫽ 118) and native residents (n ⫽ 155) with suspected TB (n ⫽ 385 patients included). Active TB was confirmed in 40.5% of all patients (immigrants 38.4%, foreign-born residents 50%, native residents 34.8%). Clinical signs and symptoms of TB and laboratory markers of inflammation were significantly less common in immigrants than in the other groups with normal results in ⬎70%. The proportion of positive results on rapid testing to detect M. tuberculosis (MTB) in 3 respiratory specimens was significantly lower in immigrants (34.9% for acid-fast staining; 55.8% for polymerase chain reaction) compared with foreign-born residents (76.2% and 89.1%, respectively) and native residents (83.3% and 90.9%, respectively). Isoniazid resistance and multi-drug resistance were more prevalent in immigrants. CONCLUSION: New immigrants with TB detected in a screening program are often asymptomatic and have a low yield of rapid diagnostic tests but are at higher risk for resistant MTB strains. Postmigration follow-up of pulmonary infiltrates is essential in order to control TB among immigrants, even in the absence of clinical and laboratory signs of infection. © 2007 Elsevier Inc. All rights reserved. KEYWORDS: Foreign-born; Clinical presentation; Immigrants; Residents; Screening; Tuberculosis More than one-third of the world’s population is estimated to be infected with Mycobacterium tuberculosis complex (MTB). Eight million new cases of pulmonary tuberculosis (TB) and approximately 2 million deaths attributable to TB are reported each year.1 In many developed countries, new immigrants and foreign-born residents are increasingly conRequests for reprints should be addressed to Gerd Laifer, MD, Division of Infectious Diseases and Hospital Epidemiology, University Hospital Basel, Switzerland; Petersgraben 4, 4031 Basel, Switzerland. E-mail address: [email protected] 0002-9343/$ -see front matter © 2007 Elsevier Inc. All rights reserved. doi:10.1016/j.amjmed.2006.10.025 tributing to the burden of TB in the host country. The proportion of TB cases in these 2 groups exceeds 50% in the US and parts of Europe.2-4 In particular, new immigrants who are screened for TB as they enter a country show high TB prevalences (256-504/100,000 population per year).3,5-8 Consistently high incidences (33-85/100,000 population per year) also have been reported for foreign-born residents in low-prevalence countries.3,6,9,10 Among the native residents in these countries, the TB incidence is below 10/100,000 population per year.3,10 The risk of disease for foreign-born Laifer et al New Immigrants with Tuberculosis residents is highest in the first 5 years after arrival, with 50% of cases occurring in this period.11 351 1 of the 5 State immigration centers (Basel) in Switzerland (active screening). Foreign-born residents (ie, persons with work permit in Switzerland and their families, students and Prompt identification, early effective treatment, and isotourists) are not actively screened for tuberculosis in Switlation of TB patients are important strategies in preventing zerland. Like the native residents, they were referred at the an increase in the occurrence of discretion of the general practitioTB in the general population of a ners (passive case detection). Delow-incidence country. The most mographic data (age, sex, country CLINICAL SIGNIFICANCE important criteria for establishing of origin), duration of isolation, an early diagnosis are positive relaboratory results, and microbio● Immigrants add substantially to the sults in rapid diagnostic tests on logical data were collected proburden of tuberculosis (TB) in lowrespiratory specimens (acid-fast spectively and recorded in a dataincidence countries. smear and polymerase chain reacbase. Additional data (fever, tion) and a case definition that is ● Screening programs to detect TB in imweight loss, night sweats, cough, based on clinical and radiographic sputum production, dyspnea, and migrants are recommended as a measure signs and risk factors. Although auscultatory findings) were exto support TB elimination efforts. scoring systems and decision trees tracted by chart review. Countries have been developed to more ad● Postmigration follow-up of pulmonary of origin were categorized into equately predict patients at high infiltrates is essential in order to control those with a low notification rate risk for active TB,12-15 they are TB among immigrants, even in the abof TB (⬍24/100,000 population difficult to apply in clinical sence of clinical signs of infection. per year) and those with a moderpractice. ate to high notification rate of TB The clinical presentation of TB (ⱖ24/100,000 population per depends largely on how far the year), as reported by the 1998 redisease has progressed in an individual. The diagnosis is port of the World Health Organization (WHO). The study particularly challenging in immigrants who are actively was reviewed and approved by the Ethics Committee of the screened upon entry to their host country. We hypothesized University of Basel. that active screening changes the presentation of TB compared with passive case detection and that many actively Microbiology screened immigrants presenting with TB are asymptomatic. Respiratory specimens were digested, decontaminated, conThe extent of this difference in comparison with the resident centrated, and stained with auramine-rhodamine and then population has not been investigated in prospective studies examined with fluorescent microscopy. Ziehl-Neelsen acidbefore. fast staining (AFS) was used to confirm the presence of Active screening programs are currently under debate beacid-fast bacilli. Mycobacterial cultures were performed by cause of their costs and the limited evidence of a reduction in sample-inoculation on to Loewenstein-Jensen media and transmitting TB in the host country. If most immigrants with into liquid media (radiometric Bactec 460 TB system, TB are asymptomatic, and thus cannot be diagnosed by passive Becton Dickinson, Franklin Lakes, NJ, used from 1997 to case detection, active screening programs should be reinforced. 2000; BacT/ALERT 3D system, BioMérieux Inc., Durham, This would aid in identification of large numbers of individuals NC, used from 2001 through 2004) according to the who will benefit from therapeutic interventions and limit the manufacturers’ instructions and incubated at 37°C for 8 transmission at least within the migrant community living weeks. Polymerase chain reaction (PCR) testing for MTB under crowded conditions. was performed by using the Roche Amplicor Mycobacterium test with a Cobas Amplicor analyzer (Roche DiMETHODS agnostics Systems, Basel, Switzerland) according to the manufacturer’s instructions on concentrated decontamiPatient Population nated specimens. From January 1997 through July 2004, all patients admitted to our hospital who were placed in respiratory isolation for Study Definitions suspected TB were included in this cohort study. The University Hospital Basel is a 780-bed primary and tertiary care Active TB was defined as one or more positive cultures of center with approximately 23,000 admissions annually. The respiratory specimens for MTB (proven TB), or as culturepatients were categorized into new immigrants who were negative with a compatible abnormal chest radiograph and actively screened for TB upon entry into Switzerland, forclinical and radiological improvement after therapy for 2-3 eign-born residents who emigrated from countries with a months with a standard combination therapy and without moderate to high prevalence of TB, and native Swiss resiany alternative diagnosis (probable TB needing treatment). dents. Immigrants were referred to our hospital if the Inactive TB was defined as negative cultures and an abnorscreening chest radiograph was suspect for TB upon entry to mal chest radiograph, which was stable after a standard 352 therapy for 2-3 months in suspected TB cases without alternative diagnosis. An alternative diagnosis was defined as a diagnosis of an infection other than TB, cancer, or noninfectious diseases diagnosed by treating physicians and explaining the abnormal chest radiograph and the clinical presentations. Multi-drug-resistance (MDR) was defined as the resistance of MTB to both isoniazid and rifampin. Excessive alcohol use was defined as consumption of ⬎14 standard drinks per week for men and ⬎7 standard drinks per week for women, according to the criteria for “at risk” drinking established by the National Institute on Alcohol Abuse and Alcoholism. Statistical Methods The analyses were carried out by using SAS software (SAS Institute Inc., Cary, NC). All predefined associations that were considered to be important predictors were investigated. They consisted of using t tests between continuous data variables and chi-squared tests between categorical data variables. In situations where the cell counts fell below The American Journal of Medicine, Vol 120, No 4, April 2007 5 in 20% or more of the cells, Fisher’s exact test was performed. To overcome the problem inherent in multiple testing, P-values were adjusted by using the Bonferroni correction method. RESULTS Patient Characteristics Between January 1997 and July 2004, 397 patients with suspected pulmonary TB were included in the study. Twelve patients (3.0%) were excluded because of incomplete data. The distribution of the patients and the diagnoses are shown in the Figure. There were 42,601 new immigrants ⬎16 years of age who were actively screened by chest radiograph upon entry to Switzerland at the Basel immigration center (median age 26 years; range 16-98 years). Of these, 112 (0.26%) were referred to the hospital with pulmonary infiltrates suspicious for TB. Table 1 shows the demographic characteristics and risk factors for TB. Figure Diagnoses of patients in respiratory isolation with pulmonary infiltrates suspicious for pulmonary tuberculosis. TB ⫽ tuberculosis; NTM ⫽ nontuberculous mycobacteria. Laifer et al New Immigrants with Tuberculosis 353 Table 1 Demographic Characteristics of New Immigrants, Foreign-born Residents and Native Residents with Active Pulmonary Tuberculosis Characteristic Age (years) Mean range Male sex (%) Area of origin (%) Africa Asia Latin America Eastern Europe Southern Europe Central Europe TB risk factors (%) HIV positive Excess alcohol use Diabetes Cancer History of TB (%) Immigrant Foreign-born Group Native Group Group (n ⫽ 54) (n ⫽ 43) (n ⫽ 59) 30.6 16-49 90.7 35.1 16-86 61.0 50.2** 23-88 72.2 18.6 9.3 — 62.8 9.3 — 0* 0* 0 0 0 14.0* 15.3 16.9 10.2 32.2 25.4 — 25.4 12.5 10.2 5.1 1.7 1.7 — — — — — 100 59.3** 18.4** 27.7** 7.4 1.9 3.7 34.8% in native residents). A prior history of tuberculosis was reported more often among new immigrants than among either foreign-born or native residents. Significantly more native residents with active TB had risk factors for TB, compared with new immigrants or foreign-born residents with active TB (Table 1). Excess alcohol use was the predominant risk factor. Clinical, Radiological, and Laboratory Presentation TB ⫽ pulmonary tuberculosis; HIV ⫽ human immunodeficiency virus. *P ⬍.05 immigrants vs native and vs foreign-born. **P ⬍.05 native vs foreign-born and vs immigrants. Active TB was confirmed in 40.5% of all patients isolated for suspected TB (38.4% in the screening group of new immigrants, 50.0% in foreign-born residents, and All clinical signs of infection (ie, fever, night sweats, weight loss, cough, sputum production, and dyspnea) were significantly less common in the screening group of new immigrants with active TB than they were in foreign-born and native residents with active TB (Table 2). The clinical presentation of TB in foreign-born and native residents did not differ with the exception of dyspnea, which was reported more often in foreign-born residents. Pulmonary auscultation was less likely to be abnormal in the screening group (new immigrants) compared with the foreign-born and native residents (Table 2). Radiological presentation was similar in the 3 groups with the exception of more multilobular involvement in native residents (Table 2), whereas foreign-born residents presented more often with cavitations (Table 2). Systemic signs of inflammation, as measured by C-reactive protein (CRP) and neutrophil counts, were significantly more elevated in native residents with active TB than they were in foreign-born residents with Table 2 Disease Characteristics of New Immigrants, Foreign-born Residents, and Native Residents with Active Pulmonary Tuberculosis Disease Characteristic Fever ⬎38.3 n (%) Night sweats n (%) Weight loss n (%) Cough n (%) Sputum n (%) Dyspnea n (%) Crackles n (%) Infiltrate Upper lobe n (%) ⬎1 Lobe n (%) Bilateral n (%) Cavitation n (%) Neutrophils Mean (109/L) Hemoglobin Mean (g/L) CRP Mean (mg/L) Albumin Mean (g/L) Case fatality rate (%) New Immigrant (n ⫽ 43) Foreign-born (n ⫽ 59) Native (n ⫽ 54) 7/42 7/40 11/40 19/42 10/42 3/39 6/42 40/56 30/53 32/52 51/56 43/55 10/55 20/56 (71.4) (56.6) (61.5) (91.1) (78.2) (18.2)† (35.7) 40/52 20/51 30/52 47/52 41/52 24/52 21/52 (76.9) (39.2) (57.7) (90.4) (78.8) (46.2) (40.4) 37/41 (90.2) 3/41 (7.3) 9/41 (22.0) 10/41 (24.4) 5.83* 46/57 (80.7) 7/57 (12.3) 12/57 (21.1) 26/57 (45.6)§ 6.36† 34/50 15/50 22/50 17/50 9.18 (68.0) (30.0)‡ (44.0) (34.0) 14.2* 12.2 12.0 17.0* 39.3* 0* 67.1† 32.0† 1/59 (1.7%)† 90.7 27.1 6/54 (11.1%) (16.7)* (17.5)* (27.5)* (45.2)* (23.8)* (7.7)* (14.3)* CRP ⫽ C-reactive protein. *P ⬍.05 immigrants vs foreign-born and vs native. †P ⬍.05 foreign-born vs native. ‡P ⬍.05 native vs immigrants. §P ⬍.05 foreign-born vs immigrants. 354 The American Journal of Medicine, Vol 120, No 4, April 2007 Table 3 Microbiological Data for Patients with Active Pulmonary Tuberculosis Results According to Patient Category Immigrant Type of Data Proportion of positive acid-fast smear Proportion of positive PCR Proportion of positive culture Foreign-born Per specimen n ⫽ 134 ⱖ1 Positive per patients n ⫽ 43 Per specimen n ⫽ 170 23.1%* 34.9%* 57.3% 35.4%* 52.2%* 55.8%* 76.7%* 81.4% 92.4% Native ⱖ1 Positive per patients n ⫽ 59 Per specimen n ⫽ 128 ⱖ1 Positive per patients n ⫽ 54 76.2% 75.6% 83.3% 89.1% 100% 80.8% 85.8% 90.9% 98.1% PCR ⫽ polymerase chain reaction. *P ⬍.05; immigrants vs foreign-born residents and vs native residents. active TB (Table 2). Systemic signs of inflammation were low in the screening group of new immigrants (Table 2) and were absent in a substantial proportion of patients with active TB (normal CRP in 73.8%; normal neutrophil count in 71.4%) in this population. Furthermore, hemoglobin levels and albumin levels were lower in foreign-born and native residents with active TB than they were in new immigrants (Table 2). In-hospital mortality was increased among native residents with active TB (11.1% vs 0% in new immigrants and 1.7% in foreign-born residents; Table 2). Microbiology A total of 1158 respiratory specimens were collected for mycobacterial diagnostics (mean 3.0 specimens/patient). The proportion of positive rapid tests for MTB (AFS and PCR) was significantly lower in new immigrants in all specimens of patients with active TB (23.1% for AFS; 35.4% for PCR) compared with foreign-born residents (57.3% and 81.4%, respectively; Table 3) and native residents (75.6% and 80.8%, respectively; Table 3). Similar results were obtained from cultures for MTB (proportion of positive results in 52.2% of specimens of new immigrants vs. 92.4% in foreign-born residents and 85.8% in native residents; Table 3). Accordingly, the proportion of patients with active disease and at least one positive rapid test for MTB was lower in new immigrants (34.9% for AFS, 55.8% for PCR) compared with foreign-born residents (76.2% and 89.1%, respectively; Table 3) and native residents (83.3% and 90.9% respectively; Table 3). Specificity was 98% or higher throughout all 3 groups for rapid diagnostic tests, as well as for cultures. A significant proportion of new immigrants had culture-negative TB (23.3%), whereas only 1/113 patients in the other 2 groups had culturenegative TB. Drug Resistance Isoniazid resistance and multi-drug resistance were more prevalent in the new immigrant population (21.9% and 6.3%, respectively) than they were in foreign-born residents (10.2% and 1.7%; P ⬍.05) and native residents (5.8% and 1.9%; P ⬍.05). DISCUSSION In our study, we demonstrated that immigrants in screening programs present with significantly fewer clinical signs compared with foreign-born residents and native residents living in a low-incidence country. This is not surprising because the latter 2 groups present with a disease, whereas the new immigrants were screened irrespective of clinical symptoms. The important result of this study is that the vast majority (⬎70%) of new immigrants screened upon entry show no clinical signs or symptoms of TB at all and present with normal laboratory markers of inflammation despite having active TB. The extent to which new immigrants are asymptomatic is a new finding. Previous retrospective studies report up to 50% of actively screened immigrants to be “symptom-free.”16 Moreover, the disappointing low yield of rapid tests for MTB underscores the diagnostic dilemma for this population and the need of a postmigration follow-up. Prompt identification and effective isolation of patients with active TB is considered to have a high priority in TB control policies, especially in immigrants. Patients are less contagious while still smear-negative17 and have a lower morbidity and mortality. In the US regulations require immigrants to undergo TB screening in their countries of origin, and travel to the US is permitted only if sputum smears are negative in individuals with pulmonary infiltrates. Almost 7% of immigrants who arrived in the US and were referred for further medical evaluation had active TB.18 Furthermore, more than 80% of new immigrants in the US who are subsequently diagnosed with active TB were screened within 6 months before arrival in the US with negative results, and 50% were given a diagnosis within 30 days after arrival.8 The ability of current overseas screening programs to detect TB based on chest radiographs and AFS is low19 and will miss persons with AFS-negative active TB, who constitute the majority (65.1%) of new immigrants Laifer et al New Immigrants with Tuberculosis in our study. Despite its superior accuracy compared with AFS20 and its high negative predictive value in refugees with culture-positive TB,5 PCR testing for MTB is not recommended in this setting. A strategy including chest radiographs upon arrival in the host country and a clinical work-up including repeated PCR testing in case of TBsuspicion may be superior, because the yield of AFS in the screening population in our study was disappointingly low and was even lower than previously reported in another screening population of immigrants in the Netherlands.21 Despite posing a substantial financial burden to host countries with a low incidence of TB, similar strategies have been shown to be cost effective.22,23 Both the underdiagnosis and overdiagnosis of patients at risk for TB make actual isolation guidelines difficult to implement and not fully effective. Importantly, scoring systems and decision trees to identify patients at high risk for active TB12-14 are not validated in screening populations and may not apply to this setting. In institutions that must deal with great numbers of TB patients, TB is confirmed in one of 7-10 patients isolated.4,24,25 In our single-center study, active TB was confirmed in 40.5% of all isolated patients and initially missed in only 5%, which is in accordance with published data from the literature.15 The sensitivities of single cultures for MTB range from 50% to 81%26 and are in line with the results obtained in our study. Low bacillary populations and temporal variations in the number of bacilli being expelled are possible explanations for a failure to isolate MTB. About 17% of all TB cases among foreign-born persons in the US are culture-negative.10 In our study, especially new immigrants in the screening group presented with a culture-negative TB, whereas the overall rate was only 7.1%, confirming the results of a retrospective study comparing active and passive screening for TB.16 The prevalence of drug-resistant MTB can reach up to 37% and is highest in Eastern Europe and parts of Asia.27 In the US, the primary resistance rate to isoniazid in foreignborn residents was reported to be 11.6%, with multi-drug resistance being 1.7%.10 Similar results were obtained in studies from the UK7 and from Texas,28 and these are in accordance with the rates obtained in our study. Importantly, especially in new immigrants the proportion of drugresistant MTB-strains is high, as shown in our study. Although the study was not designed to detect differences in mortality rates, native residents who died were older and had more risk factors for TB, including excess alcohol intake and HIV co-infection. Treating physicians possibly suspect TB less often in native residents in a low-incidence country, which may contribute to a delayed hospital admission, a more advanced disease at the time of presentation, and an increased case fatality rate. The higher proportion of HIV-infection in native residents with TB may explain the more frequent multilobular involvement on chest radiograph and is in concordance with previous reports from the literature.10 355 Our study shows several strengths. All 3 groups in the study consisted of a similar number of patients (more than 100 per group) with a high overall rate of confirmed TB (40.5%) and a similar TB rate in each group. The standard of care and the diagnostic approach of all patients in respiratory isolation were the same over a period of almost 8 years. There are 2 potential limitations to this study. First, this study is a single center study, which may not represent other settings in the Western world. Second, the communication with persons from foreign countries is often difficult, which may introduce a possible bias in taking an accurate patient’s history. In conclusion, foreign-born residents and native residents with active TB do not show significant differences in the clinical, radiological, and mycobacterial presentation in a low-incidence country. In contrast, new immigrants screened upon entry present without clinical signs and symptoms of TB in the majority of cases. Because the diagnostic yield of AFS in this population is low, a clinical work-up including better diagnostic tools like PCR testing and a postmigration follow-up is important in order to control TB among immigrants with pulmonary infiltrates, even in the absence of clinical and laboratory signs of infection. References 1. Dye C, Scheele S, Dolin P, Pathania V, Raviglione MC. Consensus statement. Global burden of tuberculosis: estimated incidence, prevalence, and mortality by country. WHO Global Surveillance and Monitoring Project. JAMA. 1999;282:677-686. 2. Centers for Disease Control and Prevention. Trends in tuberculosis morbidity—United States, 1992-2002. MMWR Morb Mortal Wkly Rep. 2003;52:217-222. 3. Maurer AM, Seiler AJ. Diagnosis and treatment of pulmonary tuberculosis in asylum seekers and refugees in the Bern canton 1993-1997. Schweiz Rundsch Med Prax. 2000;89:271-274. 4. Bloom BR. Tuberculosis—the global view. N Engl J Med. 2002;346: 1434-1435. 5. Laifer G, Widmer AF, Frei R, Zimmerli W, Fluckiger U. Polymerase chain reaction for Mycobacterium tuberculosis: impact on clinical management of refugees with pulmonary infiltrates. Chest. 2004;125: 981-986. 6. Van den Brande P, Uydebrouck M, Vermeire P, Demedts M. Tuberculosis in asylum seekers in Belgium. VRGT (Flemish Lung and Tuberculosis Association). Eur Respir J. 1997;10:610-614. 7. Control and prevention of tuberculosis in the United Kingdom: code of practice 2000. Joint Tuberculosis Committee of the British Thoracic Society. Thorax. 2000;55:887-901. 8. Thorpe LE, Laserson K, Cookson S, et al. Infectious tuberculosis among newly arrived refugees in the United States. N Engl J Med. 2004;350:2105-2106. 9. Wilcke JT, Poulsen S, Askgaard DS, Enevoldsen HK, Ronne T, Kok-Jensen A. Tuberculosis in a cohort of Vietnamese refugees after arrival in Denmark 1979-1982. Int J Tuberc Lung Dis. 1998;2:219224. 10. Talbot EA, Moore M, McCray E, Binkin NJ. Tuberculosis among foreign-born persons in the United States, 1993-1998. JAMA. 2000; 284:2894-2900. 11. Binkin NJ, Zuber PL, Wells CD, Tipple MA, Castro KG. Overseas screening for tuberculosis in immigrants and refugees to the United States: current status. Clin Infect Dis. 1996;23:1226-1232. 12. Tattevin P, Casalino E, Fleury L, Egmann G, Ruel M, Bouvet E. The validity of medical history, classic symptoms, and chest radiographs in 356 13. 14. 15. 16. 17. 18. 19. 20. predicting pulmonary tuberculosis: derivation of a pulmonary tuberculosis prediction model. Chest. 1999;115:1248-1253. El-Solh A, Mylotte J, Sherif S, Serghani J, Grant BJ. Validity of a decision tree for predicting active pulmonary tuberculosis. Am J Respir Crit Care Med. 1997;155:1711-1716. Wisnivesky JP, Kaplan J, Henschke C, McGinn TG, Crystal RG. Evaluation of clinical parameters to predict Mycobacterium tuberculosis in inpatients. Arch Intern Med. 2000;160:2471-2476. Wisnivesky JP, Henschke C, Balentine J, Willner C, Deloire AM, McGinn TG. Prospective validation of a prediction model for isolating inpatients with suspected pulmonary tuberculosis. Arch Intern Med. 2005;165:453-457. Monney M, Zellweger JP. Active and passive screening for tuberculosis in Vaud Canton, Switzerland. Swiss Med Wkly. 2005;135:469474. Behr MA, Warren SA, Salamon H, et al. Transmission of Mycobacterium tuberculosis from patients smear-negative for acid-fast bacilli. Lancet. 1999;353:444-449. DeRiemer K, Chin DP, Schecter GF, Reingold AL. Tuberculosis among immigrants and refugees. Arch Intern Med. 1998;158:753-760. Maloney SA, Fielding KL, Laserson KF, et al. Assessing the performance of overseas tuberculosis screening programs. Arch Intern Med. 2006;166:234-240. Jonas V, Longiaru M. Detection of Mycobacterium tuberculosis by molecular methods. Clin Lab Med. 1997;17:119-128. The American Journal of Medicine, Vol 120, No 4, April 2007 21. Verver S, Bwire R, Borgdorff MW. Screening for pulmonary tuberculosis among immigrants: estimated effect on severity of disease and duration of infectiousness. Int J Tuberc Lung Dis. 2001;6:419-425. 22. Schwartzman K, Menzies D. Tuberculosis screening of immigrants to low-prevalence countries. A cost-effectiveness analysis. Am J Respir Crit Care Med. 2000;161:780-789. 23. Verver S, van Soolingen D, Borgdorff MW. Effect of screening of immigrants on tuberculosis transmission. Int J Tuberc Lung Dis. 2002; 6:121-129. 24. Bock NN, McGowan JE Jr, Ahn J, Tapia J, Blumberg HM. Clinical predictors of tuberculosis as a guide for a respiratory isolation policy. Am J Respir Crit Care Med. 1996;154:1468-1472. 25. McGowan JE Jr. Nosocomial tuberculosis: new progress in control and prevention. Clin Infect Dis. 1995;21:489-505. 26. Levy H, Feldman C, Sacho H, van der Meulen H, Kallenbach J, Koornhof H. A reevaluation of sputum microscopy and culture in the diagnosis of pulmonary tuberculosis. Chest. 1989;95:1193-1197. 27. Espinal MA, Laszlo A, Simonsen L, et al. Global trends in resistance to antituberculosis drugs. World Health Organization-International Union against Tuberculosis and Lung Disease Working Group on Anti-Tuberculosis Drug Resistance Surveillance. N Engl J Med. 2001; 344:1294-1303. 28. El Sahly HM, Adams GJ, Soini H, Teeter L, Musser JM, Graviss EA. Epidemiologic differences between United States- and foreign-born tuberculosis patients in Houston, Texas. J Infect Dis. 2001;183:461468. The American Journal of Medicine (2007) 120, 357-363 CLINICAL RESEARCH STUDY Coronary Ischemic Events after First Atrial Fibrillation: Risk and Survival Yoko Miyasaka, MD, PhD,a,b Marion E. Barnes, MSc,a Bernard J. Gersh, MB, ChB, Dphil,a Stephen S. Cha, MS,c Kent R. Bailey, PhD,c James B. Seward, MD,a Toshiji Iwasaka, MD, PhD,b Teresa S. M. Tsang, MDa a c Division of Cardiovascular Diseases and Internal Medicine, and bSection of Biostatistics, Mayo Clinic, Rochester, Minn. Cardiovascular Division, Department of Medicine II, Kansai Medical University, Osaka, Japan. ABSTRACT PURPOSE: We aimed to determine the long-term, gender-specific incidence and mortality risk of coronary ischemic events after first atrial fibrillation (AF). METHODS: In this longitudinal cohort study, adult residents of Olmsted County, Minnesota, with an electrocardiogram-confirmed AF first documented in 1980 to 2000 and without prior coronary heart disease, were followed to 2004. The primary outcome was first coronary events (angina with angiographic confirmation, unstable angina, nonfatal myocardial infarction, or coronary death). Sex-specific incidence of coronary ischemic events and survival after development of such events were assessed using Cox proportional hazards modeling. Kaplan-Meier estimates of risks for coronary ischemic events were compared with those predicted by the Framingham equation. RESULTS: Of the 2768 subjects (mean age 71 years, 48% were men), 463 (17%) had a first coronary event during a follow-up of 6.0 ⫾ 5.2 years. The unadjusted incidence was 31 per 1000 person-years, and there was no difference between men and women. The incidence was higher in men (hazard ratio 1.32, P ⫽ .004) after adjusting for age. The 10-year event estimates were 22% and 19% in men and women, respectively, by our Kaplan-Meier analyses, and 21% and 11%, respectively, by Framingham risk equation. The mortality risk after coronary events was higher in women (hazard ratio 2.99 vs 2.33; P ⫽ .044), even after multiple adjustment. CONCLUSIONS: First AF marks a high risk for new coronary ischemic events in both men and women. AF conferred additional risk for coronary events beyond conventional risk prediction in women only. The excess mortality risk associated with the development of coronary events was significantly greater in women. © 2007 Elsevier Inc. All rights reserved. KEYWORDS: Atrial fibrillation; Coronary heart disease; Incidence; Prognosis Atrial fibrillation (AF) is a growing public health problem1 that has reached epidemic proportions.2,3 It is a potent risk factor for stroke,4,5 congestive heart failure,6,7 and possibly cognitive dysfunction.8,9 Although studies have shown that the risk of acute coronary ischemic events at the time of first AF is low,10,11 there are no This study was supported by the American Heart Association National Scientist Development Grant. There is no financial conflict on the part of any author. Requests for reprints should be addressed to Teresa S. M. Tsang, MD, Mayo Clinic, Division of Cardiovascular Diseases, 200 First Street SW, Rochester, MN 55905. E-mail address: [email protected] 0002-9343/$ -see front matter © 2007 Elsevier Inc. All rights reserved. doi:10.1016/j.amjmed.2006.06.042 published longer-term data. There is a paucity of data with regard to the incidence and timing of coronary events after first AF, as well as the predictors for such events. In addition, it is unknown whether gender differences exist in the risk of post-AF coronary ischemic events and survival after these events. We conducted a community-based longitudinal cohort study that spanned 2 decades and assessed the gender-specific incidence, timing, and predictors of coronary ischemic events after first diagnosis of AF in patients without prior evidence of coronary heart disease. We determined the gender-specific mortality risk conferred by the development of coronary ischemic events. 358 METHODS Study Setting The American Journal of Medicine, Vol 120, No 4, April 2007 no history or evidence of coronary heart disease before or at the time of AF diagnosis. The community-based cohort study was approved by the Definition and Ascertainment of Outcome Mayo Foundation Institutional Review Board. Olmsted Coronary Ischemic Events. The primary outcome of inCounty, Minnesota, is well suited terest was a first documented corfor the conduct of studies with onary ischemic event, defined as long-term follow-up because of a angina pectoris with angiographic CLINICAL SIGNIFICANCE number of unique features.12 Geoconfirmation, unstable angina, graphically, the community is relnonfatal acute myocardial infarc● Patients diagnosed with first atrial fibrilatively isolated from other urban tion, or coronary death occurring lation constitute a high-risk group for centers, and medical care is delivafter the date of first AF. We subsequent new coronary ischemic ered by only a few health care chose well-defined end points events. providers, principally the Mayo with high specificity and opted to Clinic and its associated hospitals. ● Atrial fibrillation conferred additional exclude the patients who had preThe majority of Olmsted County risk for the development of coronary sumed angina but without angioresidents return to the Mayo graphic confirmation of obstrucischemic events, beyond conventional Clinic on a regular basis, allowing tive coronary artery disease. risk prediction, in women only. capture of health-related events. A Coronary artery disease was deprevious study showed that 96% ● The excess mortality risk associated with fined as an angiographic finding of of Olmsted County women resithe development of new coronary events atherosclerotic narrowing of least dents aged 65 to 74 years returned post-atrial fibrillation was greater in 50% in any of the 3 main arterial to the Mayo Clinic within a 3-year women. distributions. Unstable angina was period.12 For each patient at the defined as the presence of new or Mayo Clinic, a unified medical accelerated ischemic symptoms record containing details of all inwith or without electrocardiopatient and outpatient encounters is maintained. Coded digraphic changes, but without elevation of cardiac enzymes. agnoses are electronically entered into a medical diagnostic Acute myocardial infarction was considered present if at index, allowing easy identification of all patients with a least 2 of the 3 diagnostic criteria were fulfilled: compatible diagnosis of interest. An electronic electrocardiogram dataclinical presentation, diagnostic cardiac enzyme/biomarker base has been in use at Mayo since 1976, allowing rapid levels, and electrocardiographic changes consistent with identification of the coded interpretation and diagnoses for myocardial infarction. Coronary death was defined as death each electrocardiogram. All electrocardiograms can also be attributable to fatal acute myocardial infarction and death retrieved for direct review. with the primary cause being coronary heart disease (based on documentation per death certificates or physician adjudication by chart review). The ascertainment of outcomes Incident Atrial Fibrillation Cohort and was accomplished through comprehensive review of the Study Population medical records in addition to cross-referencing the multiple The medical records of adult residents of Olmsted County, administrative databases to identify any inconsistencies. Minnesota, who had a first AF documented between January 1, 1980, and December 31, 2000, in any of the Mayo administrative databases (medical index, surgical index, electrocardiographic, and echocardiographic databases) were reviewed and followed forward in the medical records to March 2004 by 1 cardiologist (Y. M.). For the purpose of this study, we excluded subjects who had any history or evidence of coronary heart disease and subjects who sustained a first coronary ischemic event on the same day as the first AF. Because the unit record system at Mayo dated back to the early 1900s, any electrocardiogram performed in any patient was contained within the unit record. Any AF that occurred before the establishment of administrative databases would have been identified from the chart review process. Final inclusion in the study population required the following: The AF was sustained, allowing confirmation by 12-lead electrocardiogram; the AF episode was verified as the first recognized AF event for the person; and there was Death. The secondary outcome of interest was death. Ascertainment of death was accomplished through comprehensive review of the medical records, death certificates, Vital Status Information from Mayo Registration, Minnesota State Death Tapes, and Social Security Death Index. Statistical Analysis. Baseline characteristics were summarized by means and standard deviations or frequency percentages and compared between subjects with or without subsequent development of coronary ischemic events by using age-adjusted Cox proportional hazards analyses for both sexes. Average annual incidence rates were reported by sex and 10-year age interval, and summaries were tabulated as cases per 1000 person-years. The overall and sex-specific cumulative incidence of first coronary ischemic events after first AF was estimated using the Kaplan-Meier method. Incidence was assessed as a function of age and sex, using Miyasaka et al Risk of Coronary Ischemic Events in AF a Cox proportional hazards model for time to first coronary ischemic event. Cox models based on clinical variables at the time of first AF were also developed using backward stepwise selection. The clinical covariates considered included type of AF (paroxysmal vs chronic) at initial diagnosis, body mass index, systolic or diastolic blood pressure, history of systemic hypertension, dyslipidemia, diabetes mellitus, smoking, peripheral vascular disease, stroke, congestive heart failure, valvular heart disease, chronic obstructive pulmonary disease, obstructive sleep apnea, regular alcohol use, hyperthyroidism, chronic renal disease, and malignancy. We also analyzed whether AF provides additional predictive information, beyond conventional risk factor consideration, for the development of subsequent coronary ischemic events. We compared our sex-specific coronary incidence rates, estimated by Kaplan-Meier analysis, with those predicted by the Framingham risk equation13 at 10 years. The association of first coronary ischemic event with subsequent survival was estimated using time-dependent proportional hazards models, controlling for age and sex, and with and without clinical variables. The same clinical Table 1 359 covariates were considered, and the same selection method was used. The effect of interim coronary revascularization (percutaneous coronary intervention or coronary artery bypass grafting) on mortality was accounted for by including it as a time-dependent covariate in the model. Mortality ratios relative to the general Minnesota white population were calculated by dividing the observed number of mortality events by an “expected number” of deaths. This expected number was calculated as the sum of each individual’s cumulative hazard, based on the standard age, sex, and calendar-year specific life-table survival probability up to the individual’s follow-up time. Confidence intervals (CIs) were based on the Poisson distribution, and gender comparisons were based on a likelihood ratio chi-square test. All tests of significance were 2-tailed, and a P value less than .05 was considered statistically significant. RESULTS A total of 4618 subjects (51% were men; mean age 73 years) were confirmed to have developed a first AF during 1980 to 2000. We excluded 1776 subjects (38%) because they had a history of coronary heart disease and 74 subjects Baseline Characteristics of the Study Population Stratified by Subsequent Development of Coronary Ischemic Events Men Women Variable No Events (n ⫽ 1091) Had Events (n ⫽ 227) No Events (n ⫽ 1214) Had Events (n ⫽ 236) Age (y) Paroxysmal AF, N (%) BMI (kg/m2) Systemic hypertension, N (%) Hypertensive therapy, N (%) Systolic BP (mm Hg) Diastolic BP (mm Hg) Dyslipidemia, N (%) Lipid-lowering therapy, N (%) Total cholesterol (mg/dL)§ HDL cholesterol (mg/dL)§ Diabetes mellitus, N (%) Smoking, N (%) Peripheral artery disease, N (%) Stroke, N (%) Prior CHF, N (%) VHD, N (%) COPD, N (%) Obstructive sleep apnea, N (%) Regular alcohol use, N (%) Hyperthyroidism, N (%) Chronic renal disease, N (%) History of malignancy, N (%) 66 ⫾ 18 797 (73) 27.3 ⫾ 5.4 691 (63) 373 (34) 133 ⫾ 18 78 ⫾ 11 344 (32) 19 (1.7) 191 ⫾ 47 45 ⫾ 14 125 (11) 762 (70) 72 (6.6) 79 (7.2) 54 (4.9) 142 (13) 245 (22) 29 (2.7) 225 (21) 9 (0.8) 137 (13) 314 (29) 69 ⫾ 13‡ 151 (67) 28.4 ⫾ 5.2† 172 (76)‡ 91 (40)† 138 ⫾ 20† 79 ⫾ 11 87 (38)† 4 (1.8) 198 ⫾ 45 44 ⫾ 12 37 (16)† 174 (77)* 19 (8.4)* 18 (7.9) 9 (4.0) 39 (17)* 60 (26) 9 (4.0)* 47 (21) 2 (0.9) 36 (16)† 46 (20) 76 ⫾ 14 825 (68) 26.5 ⫾ 6.9 961 (79) 613 (50) 139 ⫾ 21 78 ⫾ 11 329 (27) 20 (1.6) 204 ⫾ 45 55 ⫾ 17 143 (12) 424 (35) 80 (6.6) 91 (7.5) 89 (7.3) 264 (22) 187 (15) 6 (0.5) 72 (5.9) 21 (1.7) 99 (8.2) 364 (30) 77 ⫾ 11‡ 147 (62) 27.4 ⫾ 7.3* 215 (91)‡ 136 (58)‡ 147 ⫾ 19‡ 80 ⫾ 10 64 (27) 3 (1.3) 211 ⫾ 46 52 ⫾ 14 49 (21)‡ 79 (33) 30 (13)‡ 17 (7.2) 18 (7.6)* 58 (25) 36 (15) 2 (0.8) 9 (3.8) 5 (2.1) 26 (11)‡ 48 (20) AF ⫽ atrial fibrillation; BMI ⫽ body mass index; BP ⫽ blood pressure; CHF ⫽ congestive heart failure; COPD ⫽ chronic obstructive pulmonary disease; HDL ⫽ high-density lipoprotein; VHD ⫽ valvular heart disease. Values are given as mean ⫾ standard deviation or number (percentage). P value for events status differences in each characteristics by Cox proportional hazards analysis after adjusting for age. *.01 ⬍ P ⬍.05 vs no events. †.001 ⬍ P ⬍.01 vs no events. ‡P ⬍.001 vs no events. §The available number of data were 1999 for total cholesterol and 1143 for HDL cholesterol. 360 The American Journal of Medicine, Vol 120, No 4, April 2007 confirmation (72 men [32%], 45 women [19%]), unstable angina (45 men [20%], 59 women [25%]), nonfatal acute myocardial infarction (66 men [29%], 79 women [34%]), and coronary death (44 men [19%], 53 women [22%]). Incidence, Timing, and Predictors of Coronary Ischemic Events Figure 1 The unadjusted incidence of first coronary ischemic events by time from first AF diagnosis among men (left) and women (right). AF ⫽ atrial fibrillation. (2%) because they had a coronary ischemic event that occurred on the same day as the first AF. The remaining 2768 subjects (48% were men, mean age 71 years, range 18-107 years) constituted the study population. Of these, 463 patients (17%) had a total of 841 coronary ischemic events during a mean follow-up period of 6.0 ⫾ 5.2 years, and 1700 died. The proportion of our cohort followed to death or to within 2 years of the last follow-up of this study (March 2004) was 92.4%. The baseline characteristics of the study population, stratified by sex and subsequent coronary ischemic events, are shown in Table 1. Distribution of Coronary Ischemic Events The type of first coronary ischemic events (227 men, 236 women) were as follows: angina pectoris with angiographic The unadjusted incidence of coronary ischemic events after AF was 31 per 1000 person-years and was not significantly different between men and women (30.2 vs 31.4 per 1000 person-years; P ⫽ .68). The risk of new coronary ischemic events was greatest during the first year of AF (cumulative incidence 4.7%, 95% CI, 3.9-5.6) and plateaued thereafter (2.5% per year after first year, cumulative event rate 14.4% at 5 years, 95% CI, 12.8-15.9) (Figure 1) (Table 2). When adjusted for age, male sex was associated with increased risk of coronary ischemic events (hazard ratio [HR] 1.32, 95% CI, 1.09-1.60, P ⫽ .004). When age stratified, the incidence of coronary ischemic events increased throughout the age range in women but did not increase in men after age 85 years or more (Table 2). When a sex-specific correction for “age 85 years or more” was added to the model with a linear term for age and sex, there was a significant (P ⫽ .028) downward correction for men but no apparent departure from linearity for women (P ⫽ .06 for the difference between the corrections). The overall incidence of coronary ischemic events did not differ between men and women, likely because the mean age of women was 10 years older (76 vs 66 years). In a multivariable Cox model for the prediction of first coronary events (Table 3), advancing age, male sex, higher systolic blood pressure, and history of systemic hyperten- Table 2 Age-and Sex-Specific Incidence Rates and Kaplan-Meier Estimated Cumulative Incidence of Coronary Ischemic Events for Patients Diagnosed with First Atrial Fibrillation Kaplan-Meier Estimated Cumulative Incidence Overall Men ⬍55 y 55-64 y 65-74 y 75-84 y ⱖ85 y Overall Women ⬍55 y 55-64 y 65-74 y 75-84 y ⱖ85 y Overall N Person-y Incidence Rate/1000 Person-y* 1 y, % (95% CI) 5 y, % (95% CI) 2768 15046.53 30.77 (463) 4.7 (3.9-5.6) 14.4 (12.8-15.9) 299 207 333 323 156 1318 2573.86 1428.25 1829.45 1321.64 371.87 7525.07 12.04 27.31 38.81 52.96 43.03 30.17 (31) (39) (71) (70) (16) (227) 0.7 2.5 8.4 6.3 5.0 4.8 (0.0-1.7) (0.3-4.7) (5.3-11.5) (3.3-9.2) (0.9-9.0) (3.5-6.0) 5.4 11.8 19.7 19.5 17.2 14.5 (2.5-8.2) (6.6-16.7) (14.7-24.4) (14.0-24.7) (7.7-25.7) (12.2-16.7) 101 139 288 533 389 1450 965.59 1058.37 1826.05 2589.81 1081.63 7521.45 10.36 21.73 29.02 35.52 53.62 31.38 (10) (23) (53) (92) (58) (236) 1.0 5.4 4.2 4.6 6.1 4.7 (0.0-2.9) (1.4-9.2) (1.7-6.6) (2.7-6.4) (3.5-8.7) (3.5-5.8) 3.2 10.2 10.9 16.1 22.7 14.3 (0.0-6.6) (4.5-15.6) (6.9-14.9) (12.3-19.7) (16.3-28.6) (12.1-16.4) CI ⫽ confidence interval. *Data are presented as incidence rate followed in parentheses by the actual number of cases observed. Miyasaka et al Risk of Coronary Ischemic Events in AF 361 Table 3 Overall and Sex-Specific Multivariable-Adjusted Hazard Ratios for the Coronary Ischemic Events in Patients Diagnosed with First Atrial Fibrillation Overall Age/10 y Men Systolic BP/10 mm Hg Systemic hypertension Diabetes mellitus Peripheral artery disease Valvular heart disease Obstructive sleep apnea Chronic renal disease Men Women HR 95% CI HR 95% CI HR 95% CI 1.30‡ 1.37† 1.06* 1.65‡ 1.76‡ 1.56† 1.39† 1.97* 1.47† 1.20-1.42 1.13-1.67 1.01-1.12 1.23-2.21 1.38-2.24 1.14-2.13 1.11-1.75 1.07-3.64 1.11-1.95 1.32‡ 1.04 1.47* 1.50* 1.39 1.39 1.97 1.34 1.18-1.46 0.96-1.13 1.02-2.12 1.04-2.17 0.85-2.28 0.98-1.97 0.99-3.89 0.91-1.96 1.29‡ 1.07 2.23† 2.04‡ 1.67* 1.44* 2.43 1.79† 1.13-1.47 0.99-1.14 1.33-3.73 1.47-2.82 1.12-2.50 1.06-1.95 0.59-9.97 1.17-2.72 BP ⫽ blood pressure, HR ⫽ hazard ratio, CI ⫽ confidence interval. *.01 ⬍ P ⬍.05. †.001 ⬍ P ⬍.01. ‡P ⬍.001. sion, diabetes mellitus, peripheral artery disease, valvular heart disease, obstructive sleep apnea, and chronic renal disease were significant independent predictors. The type of AF, paroxysmal or chronic AF, was not significant. Separate models for men and women including these same variables appeared similar (Table 3), and none of the interactions between the risk factors and the gender were significant. A prediction formula for the probability of coronary events within 1, 5, or 10 years based on this model is given in the Appendix, and Table 4 shows an array of sample calculations. Gender Differences in the Risk of Coronary Events after First Atrial Fibrillation Although men have higher age-adjusted incidence of coronary ischemic events after first AF, how our sex-specific coronary incidence rates relate to those predicted by the Framingham risk equation is of interest. Restricting the analysis to the subgroup aged 30 to 74 years (N ⫽ 1403), the same age range for which the Framingham coronary risk equation was developed,13 the estimations of coronary event rates at 10 years were 22% (95% CI, 18-26) for men and 19% (95% CI, 14-23) for women by Kaplan-Meier analyses, versus 21% for men and 11% for women by Framingham risk equation.13 Table 4 Impact of Coronary Ischemic Events on Survival In time-dependent Cox analysis adjusted for age, the hazard for death was highly significantly associated with the occurrence of post-AF coronary ischemic events in each sex (P ⬍.0001). When an overall model was fit, with age, sex, coronary events, and an interaction between coronary events and sex, the HR associated with events was significantly higher in women (HR 2.99, 95% CI, 2.53-3.53 vs HR 2.33, 95% CI, 1.94-2.81, P ⫽ .044). Before the occurrence of a coronary ischemic event, the age-adjusted HR for men versus women was 1.23 (95% CI, 1.10-1.37), whereas after the occurrence of a coronary ischemic event, there was no significant difference in age-adjusted mortality risk. After adjustment for age, clinical risk factors, and coronary revascularization as additional time-dependent covariates, the occurrence of a coronary ischemic event remained a highly significant independent predictor of death in both sexes (men, HR 2.71, 95% CI, 2.22-3.32; women, HR 3.55, 95% CI, 2.99-4.22; P ⫽ .033). Compared with the general Minnesota white population, the relative mortality HRs before coronary ischemic events were 1.56 (95% CI, 1.47-1.66) in men and 1.71 (95% CI, 1.62-1.82) in women (P ⫽ .10). After the development of a first coronary ischemic event, the corresponding relative Probability of Coronary Ischemic Event within 5 Years Using a Prediction Formula* (Appendix) Men Women Risk Factors None HTN HTN ⫹ DM HTN ⫹ DM ⫹ VHD None HTN HTN ⫹ DM HTN ⫹ DM ⫹ VHD Age 60 y Age 70 y Age 80 y 7% 9% 11% 11% 14% 17% 18% 23% 29% 24% 30% 37% 5% 6% 8% 8% 10% 13% 13% 17% 22% 18% 23% 29% HTN ⫽ systemic hypertension; DM ⫽ diabetes mellitus; VHD ⫽ valvular heart disease. *Imputing the mean value of systolic blood pressure (137 mm Hg) for these estimations. 362 Table 5 The American Journal of Medicine, Vol 120, No 4, April 2007 Mortality Ratios Relative to the General Minnesota White Population after Atrial Fibrillation Diagnosis Men Overall Pre-events Post-events Women Observed* Expected† Ratio‡ (95% CI) Observed* Expected† Ratio‡ (95% CI) 710 563 147 411.67 361.11 50.56 1.72 (1.62-1.84) 1.56 (1.47-1.66) 2.91 (2.35-3.66) 990 806 184 516.40 470.99 45.41 1.92 (1.81-2.04)§ 1.71 (1.62-1.82) 4.05 (3.23-5.36)储 CI ⫽ confidence interval. *Observed is number of deaths in the absence of coronary ischemic events (pre-events) or occurring after coronary ischemic events (post-events). †Expected is the cumulative hazard (based on age and sex using Minnesota white population) for follow-up before or in the absence of coronary ischemic events (pre-events) or after the occurrence of coronary ischemic events (post-events). ‡Ratio of observed to expected represents hazard ratio relative to the general population. §.01 ⬍ P ⬍.05 vs men. 储P ⬍.001 vs men. HRs were 2.91 (95% CI, 2.35-3.66) in men and 4.05 (95% CI, 3.23-5.36) in women (P ⬍.001) (Table 5). DISCUSSION In our community-based cohort, the first AF marks a high risk for new coronary ischemic events in both men and women. In contrast with men, AF conferred an additional risk of ischemic events in women beyond conventional risk prediction. The excess mortality risk associated with the development of new coronary ischemic events was greater in women. Incidence of Coronary Ischemic Events After First Atrial Fibrillation Coronary heart disease has been regarded as an independent risk factor of AF,14,15 although the data supporting this connection came from only a small handful of studies, and the event rate was modest.16,17 In the Framingham Heart Study, the 2-year age-adjusted incidence for chronic AF among patients with coronary heart disease, per 1000, was 8.9 for men and 2.3 for women.16 However, little is known regarding AF as a precursor of new coronary ischemic events in patients without prior evidence of coronary heart disease. Our study showed that the ischemic event rate was high after manifestation of first AF, and that the unadjusted incidence did not differ between men and women. Incidence, when adjusted for age, was higher in men. In fact, the incidence of post-AF coronary ischemic events was higher than that of post-AF stroke in the same cohort (10% at 5 years).18 The precise reasons for the high ischemic event rate after first AF among patients with no prior coronary heart disease could not be well delineated, but a likely explanation is that persons who develop AF frequently harbor the same cardiovascular risk factors for coronary ischemic events. In our cohort, more than 70% had hypertension, 30% had dyslipidemia, and 13% had diabetes. It is unclear why some develop ischemic events first and others develop AF first. In a multivariate Cox model, higher systolic blood pressure, systemic hypertension, diabetes mellitus, and obstructive sleep apnea were significant independent predictors of new coronary ischemic events after first AF. Early diagnosis and control of these treatable conditions may have implications on cardiovascular outcomes in patients who have AF. Although the age-adjusted incidence of new coronary events post-AF was higher in men; AF actually conferred an additional risk (⬃70%) of new coronary events in women only, based on the comparison of our KaplanMeier 10-year event rates and those predicted by the Framingham risk equation. Our data set does not lend itself readily to analyses for potential explanatory factors. The underlying reasons for this gender difference in the impact of AF on subsequent coronary risk warrant further investigation. Impact of Coronary Ischemic Events on Survival AF is known to be associated with excess mortality risk.14,19-22 Our study showed that the development of a first coronary ischemic event further increased the mortality risk, even after multivariable adjustment. In addition, the mortality risk relative to the general population was higher in women than in men. This was similar to our previous finding of greater relative mortality risk in women associated with post-AF stroke.18 The reasons for these differences could not be determined in this study but clearly require further studies. LIMITATIONS There were inherent biases associated with the retrospective design. It is possible that the incidence of AF may have been underestimated, given that some patients may not have received care at the Mayo Clinic, although the underestimation would likely be small because the Mayo Clinic is the principal health care provider and referral center for Olmsted County.12 Also, we may have under- Miyasaka et al Risk of Coronary Ischemic Events in AF estimated the coronary event rates because we did not include those who had presumed angina but did not have angiographic confirmation. The population of Olmsted County, Minnesota, is predominantly white and not racially ethnically diverse. CONCLUSIONS Patients diagnosed with a first AF constitute a high-risk group for subsequent new coronary ischemic events. Although the age-adjusted incidence of such post-AF coronary ischemic events was higher in men, AF actually conferred an additional risk for the development of ischemic events, beyond conventional risk prediction, in women only. Further, the excess mortality risk associated with the development of post-AF new coronary events was greater in women. See appendix online at http://www.amjmed.com References 1. Chugh SS, Blackshear JL, Shen WK, et al. Epidemiology and natural history of atrial fibrillation: clinical implications. J Am Coll Cardiol. 2001;37:371-378. 2. Braunwald E. Shattuck lecture— cardiovascular medicine at the turn of the millennium: triumphs, concerns, and opportunities. N Engl J Med. 1997;337:1360-1369. 3. Alpert JS. Atrial fibrillation: a growth industry in the 21st century. Eur Heart J. 2000;21:1207-1208. 4. Whisnant JP, Wiebers DO, O’Fallon WM, et al. A population-based model of risk factors for ischemic stroke: Rochester, Minnesota. Neurology. 1996;47:1420-1428. 5. Wolf PA, Abbott RD, Kannel WB. Atrial fibrillation as an independent risk factor for stroke: the Framingham Study. Stroke. 1991;22:983988. 6. Scheinman MM. Atrial fibrillation and congestive heart failure: the intersection of two common diseases. Circulation. 1998;98:941-942. 7. Wang TJ, Larson MG, Levy D, et al. Temporal relations of atrial fibrillation and congestive heart failure and their joint influence on mortality: the Framingham Heart Study. Circulation. 2003;107:29202925. 8. Kilander L, Andren B, Nyman H, et al. Atrial fibrillation is an independent determinant of low cognitive function: a cross-sectional study in elderly men. Stroke. 1998;29:1816-1820. 363 9. Ott A, Breteler MM, de Bruyne MC, et al. Atrial fibrillation and dementia in a population-based study. The Rotterdam Study. Stroke. 1997;28:316-321. 10. Zimetbaum PJ, Josephson ME, McDonald MJ, et al. Incidence and predictors of myocardial infarction among patients with atrial fibrillation. J Am Coll Cardiol. 2000;36:1223-1227. 11. Friedman HZ, Weber-Bornstein N, Deboe SF, Mancini GB. Cardiac care unit admission criteria for suspected acute myocardial infarction in new-onset atrial fibrillation. Am J Cardiol. 1987;59:866-869. 12. Melton LJ 3rd. History of the Rochester Epidemiology Project. Mayo Clin Proc. 1996;71:266-274. 13. Wilson PW, D’Agostino RB, Levy D, et al. Prediction of coronary heart disease using risk factor categories. Circulation. 1998;97:18371847. 14. Krahn AD, Manfreda J, Tate RB, et al. The natural history of atrial fibrillation: incidence, risk factors, and prognosis in the Manitoba Follow-Up Study. Am J Med. 1995;98:476-484. 15. Tsang TS, Barnes ME, Bailey KR, et al. Left atrial volume: important risk marker of incident atrial fibrillation in 1655 older men and women. Mayo Clin Proc. 2001;76:467-475. 16. Kannel WB, Abbott RD, Savage DD, McNamara PM. Coronary heart disease and atrial fibrillation: the Framingham Study. Am Heart J. 1983;106:389-396. 17. Orndahl G, Thulesius O, Hood B. Incidence of persistent atrial fibrillation and conduction defects in coronary heart disease. Am Heart J. 1972;84:120-131. 18. Miyasaka Y, Barnes ME, Gersh BJ, et al. Time trends of ischemic stroke incidence and mortality in patients diagnosed with first atrial fibrillation in 1980 to 2000. Report of a Community-Based Study. Stroke. 2005;36:2362-2366. 19. Benjamin EJ, Wolf PA, D’Agostino RB, et al. Impact of atrial fibrillation on the risk of death: the Framingham Heart Study. Circulation. 1998;98:946-952. 20. Stewart S, Hart CL, Hole DJ, McMurray JJ. A population-based study of the long-term risks associated with atrial fibrillation: 20-year follow-up of the Renfrew/Paisley study. Am J Med. 2002;113:359-364. 21. Vidaillet H, Granada JF, Chyou PH, et al. A population-based study of mortality among patients with atrial fibrillation or flutter. Am J Med. 2002;113:365-370. 22. Gajewski J, Singer RB. Mortality in an insured population with atrial fibrillation. JAMA. 1981;245:1540-1544. 23. McKee PA, Castelli WP, McNamara PM, Kannel WB. The natural history of congestive heart failure: the Framingham study. N Engl J Med. 1971;285:1441-1446. 363.e1 APPENDIX Definition of Covariates Chronic versus paroxysmal AF was defined by whether there were recognizable intervening episodes of sinus rhythm. Systemic hypertension was defined by a physician’s diagnosis, need for antihypertensive therapy, or systolic blood pressure greater than 140 mm Hg or diastolic blood pressure greater than 90 mm Hg on at least 2 occasions that were not associated with acute illness or injury. Dyslipidemia was defined by a total cholesterol level of 200 mg/dL or greater, triglyceride level of 150 mg/dL or greater, low-density lipoprotein cholesterol level of 130 mg/dL or greater or high-density lipoprotein cholesterol less than 40 mg/dL on 2 or more occasions, or treatment with lipidlowering agents. Diabetes mellitus was defined by physician’s diagnosis and treatment with insulin or oral hypoglycemic agents. Smoking history was classified as past (⬎6 months prior) or current smoker. Stroke included development of any type of stroke, as defined by clinical documentation of the diagnosis with or without confirmatory findings on imaging studies. Congestive heart failure was defined by the presence of 2 major or 1 major and 2 minor Framingham The American Journal of Medicine, Vol 120, No 4, April 2007 criteria.23 Valvular heart disease was defined by greater than mild stenosis or regurgitation by echocardiography or prior valve repair/replacement. Regular alcohol use was defined by self-reported consumption of more than 1 drink per day regularly. Chronic renal disease, chronic obstructive pulmonary disease, obstructive sleep apnea, and hyperthyroidism were defined by these clinical diagnoses in the medical records. Prediction Formula for the Probability of Coronary Ischemic Event The proportional-hazards model-based probability of having had a coronary ischemic event within year 1, 5, or 10 of first AF diagnosis, as defined by the multivariate model in Table 3, is estimated as follows: PROB ⫽ 1 ⫺ (Pi)eXB, where XB ⫽ 0.265*(age/10) ⫹ 0.316*{1 if male} ⫹ 0.059*(systolic blood pressure/10) ⫹ 0.500*{1 if systemic hypertension} ⫹ 0.563*{1 if diabetes mellitus} ⫹ 0.446*{1 if peripheral artery disease} ⫹ 0.332*{1 if valvular heart disease} ⫹ 0.679*{1 if obstructive sleep apnea} ⫹ 0.385*{1 if chronic renal disease} ⫺ 3.450, and (P1, P5, P10) ⫽ (.9608, .8682, .7467). The American Journal of Medicine (2007) 120, 364-368 CLINICAL RESEARCH STUDY Outbreak of Pertussis on a College Campus Allen S. Craig, MD,a,b Seth W. Wright, MD, MPH,c Kathryn M. Edwards, MD,d John W. Greene, MD,d MaryLou Haynes, RN,c Anthony D. Dake, MD,c William Schaffner, MDe a Office of Workforce and Career Development, Centers for Disease Control and Prevention, Atlanta, Ga; bTennessee Department of Health, Nashville; Departments of cEmergency Medicine, dPediatrics, and ePreventive Medicine, Vanderbilt University School of Medicine, Nashville, Tenn. ABSTRACT BACKGROUND: Pertussis is increasing among adolescents and adults despite universal childhood vaccination. This investigation describes an outbreak of pertussis among undergraduate students and assesses the burden of cough illness on a college campus. METHODS: Students presenting with prolonged cough were evaluated with culture, polymerase chain reaction (PCR), and serology. An e-mail survey was performed to determine the burden of cough illness on campus. RESULTS: Thirty-seven undergraduates were evaluated. Their mean duration of cough was 28 days. No student had cultures positive for B. pertussis; one was PCR positive. Ten (27%) had serologic values consistent with acute pertussis infection. The e-mail survey was returned by 225/500 (45%) students. Of these, 66 (29%; 95% confidence interval [CI], 23%-36%) reported a cough of 2 weeks or longer duration during the fall semester. A conservative estimate showed that the campus-wide incidence of a cough illness meeting the Centers for Disease Control and Prevention case definition for pertussis was 13% (95% CI, 10%-16%) during the fall semester. CONCLUSIONS: Adolescents and young adults are susceptible to pertussis infection. This study demonstrates that there was a substantial rate of pertussis infection during an outbreak on a college campus. Our findings support the routine use of the acellular pertussis vaccine in adolescents and adults. © 2007 Elsevier Inc. All rights reserved. KEYWORDS: Bordetella pertussis; College health; Respiratory tract infections; Whooping cough INTRODUCTION Adolescents and adults are at risk for pertussis infection because of waning immunity following childhood vaccination.1-4 Pertussis in adolescents and adults is often atypical, consisting primarily of a prolonged cough. However, the diagnosis is usually not considered by the patient or the treating clinician. Studies in a variety of populations have documented that pertussis is quite common, ranging from 12% to 26% of adolescents and adults with prolonged cough.1,4-6 Thus, it is not surprising that infections would occur on college campuses.7 Over a study period of 2½ years, Mink and colleagues8 examined 130 students presentRequests for reprints should be addressed to Allen S. Craig, MD, Tennessee Department of Health, 425 5th Avenue North, Nashville, TN 37243. E-mail address: [email protected] 0002-9343/$ -see front matter © 2007 Elsevier Inc. All rights reserved. doi:10.1016/j.amjmed.2006.06.035 ing to the University of California Los Angeles Student Health Service with cough of 1 week or longer and found that 26% had laboratory evidence of an acute pertussis infection. Pertussis was suspected when clinicians at the Vanderbilt University Student Health Service noted an increase in the number of students presenting with a prolonged cough. An investigation was begun to confirm the presumptive diagnosis of pertussis and to determine the burden of prolonged cough illness on the campus. METHODS Setting Located in Nashville, Tenn, Vanderbilt University is a private university with over 5800 undergraduate students en- Craig et al Pertussis Outbreak on Campus rolled. A large majority of undergraduates live on campus in student housing. The Student Health Service, staffed by physicians and certified nurse practitioners, provides primary care services to the students at no charge. Approval for this outbreak investigation was given by the Vanderbilt University Institutional Review Board. 365 hours, where they were plated on Bordet-Gengou, BordetGengou with penicillin, and buffered charcoal yeast extract with cephalexin agar at 35°C. They were read over a 7-10 day period. Suspicious colonies were transferred to a second Bordet-Gengou plate, and DFA was performed. DFA was also performed on slides streaked from the original nasopharyngeal swab and examined using stanCLINICAL SIGNIFICANCE dard techniques.9 The PCR was Surveillance for Pertussis performed at the Centers for DisCase Finding. In mid-October an ● Pertussis is increasing as a cause of ease Control and Prevention increase in the number of students cough illness in adults and adolescents. (CDC) using simultaneous detecpresenting to the Student Health ● The clinical presentation of pertussis is tion and discrimination of Service with cough was noted. A often atypical, consisting primarily of a B. pertussis and B. parapertussis as prospective assessment of cough described by van der Zee et al.10 prolonged cough. illness was conducted in collaboSerum samples were tested for ration with the Tennessee Depart● Clinicians must maintain a high index of antibodies to pertussis toxin (PT) ment of Health during the 4-week suspicion in patients with a cough lastby enzyme-linked immunoassay period between October 24 and ing ⬎2 weeks. (ELISA). Acute and convalescent November 22 in students with a samples were stored at ⫺20°C and cough of 2 weeks or longer. Deanalyzed concurrently. A standard mographic data collected included reference human antiserum with the age, sex, smoking status, and immunization history. The an assigned value of 200 ELISA units/mL was run with the duration of cough at the time of presentation and associated test serum on each plate. The lower limit of detection was 2 symptoms, including sore throat, rhinorrhea, fever, sputum ELISA units for antibody to PT; specimens with activity production, inspiratory whoops, paroxysms of cough, nightbelow the lower limit of detection were assigned a value of time awakening by cough, and post-tussive emesis, were 1 ELISA unit. Results were expressed in ELISA units per obtained. Students were asked if they previously had sought milliliter. medical care for their cough, if they were already taking antibiotics for the cough illness, and if they had any known Case Definition exposure to a person with a cough of 1 week or longer Cases of pertussis were defined using the CDC outbreak duration. case definition consisting of an unexplained cough illness Nasopharyngeal swab specimens were obtained for lasting 2 or more weeks with or without paroxysms of Bordetella pertussis culture, direct fluorescent antibody ascough, whoops, or post-tussive emesis.11 This case definisay (DFA), and polymerase chain reaction (PCR) from the tion is commonly used when 5 or more cases are clustered first 20 students because of limited resources and laboratory in time or space and, when used during an outbreak, has a availability. An acute blood specimen was obtained for sensitivity ranging from 84% to 100% and specificity of pertussis antibody titers from all students with a prolonged 35% to 90%.12,13 cough. A convalescent sample was obtained approximately A laboratory-confirmed case consisted of any student 4 to 12 weeks later. The students were followed until the with a positive culture, DFA, or PCR assay for B. pertussis, resolution of the cough. or serologic studies consistent with acute B. pertussis infection. Serologic assays were considered positive if the PT Survey of Students. An e-mail survey of a random sample antibody level showed a 4-fold or greater increase with at of 500 undergraduate students was performed to assess the least one value above a cutoff value, or a single PT antibody extent of cough illness on campus during the outbreak. The titer was above a cutoff value. The initial sample obtained students were randomized by computer, based upon the last was frequently a mid-illness sample.1 The cutoff value for digit of their computer account number. The e-mail survey PT antibody was determined from an analysis of 5409 was sent to the students the first week following the Christhealthy volunteers aged 10-49 years who had pertussis semas break. In the survey, students were asked if they had a rology obtained as part of the Third National Health and cough of 2 weeks or longer duration during the fall semesNutrition Survey (NHANES III).14 These PT antibody valter, whether they had sought medical care for their cough, ues were transformed using the log10 function and a mixand whether they had missed school because of the cough. ture model was developed that assumed a normal distribuLaboratory Methods tion for the population. A cutoff point was then chosen to Nasopharyngeal swab specimens were obtained using calattain high model specificity. When the cutoff point was cium alginate swabs. Swabs were placed in both charcoal applied to data collected in prospective pertussis surveilagar transport media and saline, and transported to the lance studies with culture-confirmed disease, the cutoff had Tennessee Department of Health Laboratory within 24 an 80% sensitivity and 93% specificity.14 A PT antibody 366 The American Journal of Medicine, Vol 120, No 4, April 2007 Table 1 Comparison of Patients with Cough of at Least 2 Weeks Duration Evaluated in the Student Health Service with and without Pertussis Laboratory Evidence of Pertussis Characteristic Age, mean ⫾ SD Female, n (%) Current smoker, n (%) Duration of cough at presentation, mean ⫾ SD number of days Total duration of cough, mean ⫾ SD number of days Paroxysmal cough, n (%) Presence of whoops, n (%) Post-tussive emesis, n (%) Awakened by cough, n (%) History of fever, n (%) Sputum production, n (%) Sore throat, n (%) Rhinorrhea, n (%) Exposed to persistent cough, n (%) Yes (n ⫽ 10) No (n ⫽ 27) P-value 19.8 ⫾ 1.1 19.6 ⫾ 1.1 4 (40) 17 (63) 1 (10) 3 (11) 37.6 ⫾ 19 24.2 ⫾ 13 .62 .27 .99 .02 73.8 ⫾ 31 46.7 ⫾ 21 .02 10 6 4 9 2 8 6 6 8 25 17 3 19 9 19 21 24 13 .99 .99 .07 .39 .69 .69 .41 .07 .14 (100) (60) (40) (90) (20) (80) (60) (60) (80) (93) (63) (11) (70) (33) (70) (78) (89) (48) value of ⱖ94 ELISA units/mL was considered positive for this investigation. Students lost to follow-up with a low initial titer and negative PCR or culture were considered in the analysis to be free of pertussis. Statistical Analysis Continuous data were compared with the unpaired Student’s t test. Categorical data were compared with the Fisher’s exact test. Statistical analysis was performed with the Statview 4.5 (Abacus Concepts, Inc. Berkeley, CA) and Instat 2.01 (Graphpad Software, San Diego, CA) statistical software packages. All tests were 2-tailed; a P-value of ⱕ.05 was considered significant. RESULTS During the 4-week surveillance period, all patients with cough for 2 weeks or longer who presented to the Student Health Services were recruited for diagnostic studies; 37 undergraduate students consented. Of these, 32 (86%) returned for follow-up serologic evaluation. The age range of the 37 students was 18-22 years (median 20 years); 21 (57%) were female. All students reported full childhood immunization. Eighteen (49%) had been seen previously by a health care practitioner for this coughing illness and 15 (41%) were taking antibiotics at the time of enrollment. The mean duration of cough at the time of enrollment was 28 days (range 14-83 days). There was no notable clustering of cases within a single dormitory, classroom, or extra-curricular activity. Table 1 compares the characteristics of students with and without laboratory evidence of pertussis. Students with laboratory evidence of pertussis had a significantly longer duration of cough at presentation and significantly longer time to cough resolution. There were no other significant differences between the groups, including the presence of paroxysmal cough, whoops, or post-tussive emesis. None of the 20 students evaluated by nasopharyngeal swab had a positive culture or DFA smear; one had a positive PCR test. Ten of the 37 students (27%) had serologic values indicative of an acute pertussis infection; 2 of these had 4-fold titer increase in PT antibody levels with at least one value ⱖ94 ELISA units/mL, and the remaining 8 had single antibody levels that equaled or exceeded the cutoff value of 94 ELISA units/mL (Table 2). The student with a positive PCR also had serologic evidence diagnostic of pertussis 18 days after cough onset. Table 2 Serologic Results of Students Presenting with Prolonged Cough in ELISA units/mL, n ⫽ 37 Student Number Acute PT* Antibody Convalescent PT Antibody Positive Serology 1 2 3 4† 5 6 7 8 9 10 11 12 13 14 15 16 17 18 19 20 21 22 23 24 25 26 27 28 29 30 31 32 33 34 35 36 37 13 621 1 7 119 10 11 38 11 207 6 2 3 2 3 1 58 90 3 67 76 2 1 2 22 1 21 53 7 5 721 11 173 363 2 383 231 13 115 1 174 45 12 7 21 10 55 No Yes No Yes Yes No No No No Yes No No No No No No No No No Yes No No No No No No No No No No Yes No Yes Yes No Yes Yes *Pertussis toxin. †Positive polymerase chain reaction. 3 3 2 13 92 3 295 57 1 2 73 1 54 9 6 281 16 104 246 1 218 6 Craig et al Pertussis Outbreak on Campus Replies to the student e-mail survey were received from 225 (45%) of the 500 students. Of these, 66 (29%) stated that they had had a cough of 2 weeks or longer duration during the fall semester. The severity of the cough was sufficient that 26 (39%) had sought medical attention for the cough and 31 (47%) of 66 had missed class because of the cough. Based on these results, it was estimated that as many as 1704 (29%; 95% confidence interval [CI], 23%-36%) of the 5877 total undergraduate students could have met the CDC case definition for pertussis during the fall semester. More conservatively, if it is assumed that none of the e-mail nonresponders had a persistent cough, 776 (13.2%; 95% CI, 10%-16%) students met the case definition. DISCUSSION Immunity following childhood pertussis vaccination rapidly wanes and outbreaks of pertussis occur even in populations with high rates of childhood immunization.15,16 Adolescents appear to be at particular risk for infection and outbreaks with attack rates ⬎20% have occurred in high school settings.16 Sporadic cases in adults and adolescents are also quite common but are rarely diagnosed. For instance, Cromer and colleagues followed a cohort of adolescents for 5 years and found that the annual incidence of serologically defined pertussis infection was 6.1%.3 None were diagnosed with clinical pertussis during that interval. The high frequency of laboratory-diagnosed pertussis in students presenting to the Student Health Center for treatment of prolonged cough illness, along with the results of the e-mail survey, support the conclusion that the observed cases were part of an outbreak of pertussis rather than recognition of endemic cases. Over one quarter of the patients with cough presenting to the Student Health Service and evaluated for pertussis during the 4-week surveillance period had laboratory evidence of a pertussis infection. Our 27% occurrence rate may also be somewhat conservative, because some students had received antibiotics before specimens were obtained and students who did not return for follow-up serology in our study may have been misdiagnosed as being disease free. The students with laboratory evidence of pertussis were clinically quite similar to the patients who did not meet the definition, reinforcing the difficulty facing clinicians attempting to distinguish pertussis from other causes of persistent cough, as well as the limitations of the current diagnostic methods. The largest difference was in the overall time until resolution of the cough. Patients with laboratory evidence of confirmed pertussis coughed, on average, about 27 days longer than those without laboratory-confirmed pertussis. The results of the e-mail survey indicated that prolonged cough illness was widespread on the campus during the period of the outbreak. During an outbreak, the CDC defines a clinical case of pertussis as a cough of 2 weeks duration or longer, with or without paroxysms of cough, whoops, or post-tussive emesis.11 Almost 30% of the survey responders 367 reported having had a cough illness that met this definition during the fall semester when it was documented that pertussis was on campus. The severity of the cough also appeared to be noteworthy, as over one-third of the affected students had sought medical care and almost half had missed class because of the cough. A conservative estimate indicated that between 10% and 16% of the student body may have had pertussis during the fall semester. The diagnosis of pertussis in adolescents and adults is difficult. Adults generally do not present for care until they have been coughing for a prolonged period and their cultures are often negative at that point in their illness.1,4,17-19 None of the 20 students evaluated had a positive culture, which is not surprising given its low sensitivity of 1%-15%, particularly after the first week of cough.16,17 Serologic diagnosis may be useful, although it is not widely available, is cumbersome, and interpretation of results is problematic as there are no universally accepted diagnostic criteria.20 The “acute” titer is usually obtained mid-illness and subsequent 4-fold increases in antibody are relatively uncommon; sensitivity of serologic testing has been reported to be 80% and is less dependent on timing of the specimen.1,14 Indeed, it is common for the follow-up titer to fall rather than increase.1 In this investigation we rapidly analyzed serum specimens for pertussis toxin antibodies on the first individuals we evaluated and were able to confirm within several days that pertussis was present. The availability of a research laboratory within the Vanderbilt University Medical Center with an established pertussis serologic assay greatly facilitated the investigation. PCR can also be a useful diagnostic tool, but it is not currently commercially available, has decreased sensitivity after 3 weeks of cough illness, and its sensitivity (42%-61%) and specificity (88%-97%) vary greatly among laboratories and are subject to differences in test interpretation.21,22 Only 1 of the 20 tested subjects had a positive PCR, although 7 of the 20 had serologic evidence of pertussis. In the past, DFA had been widely performed in outbreak settings, however, the usefulness of the test is limited by difficulty in interpretation and cross-reactions with other antigens.17 None of the DFA studies in this investigation were positive. Although antimicrobial prophylaxis with erythromycin or azithromycin during an outbreak appears to prevent transmission of the organism,15,16 it was not deemed practical to implement widespread chemoprophylaxis in this outbreak because the disease involved virtually the entire undergraduate body and there was an upcoming winter break. However, prophylaxis of roommates and other close contacts of infected individuals was undertaken and should be considered in similar situations. Adolescents and adults traditionally have not been revaccinated since the last pertussis booster dose delivered at 4 to 6 years of age. Acellular vaccines have been shown to be safe and immunogenic in adolescents and adults and have recently been licensed for use in older populations.23 The CDC’s Advisory Committee on Immunization Practices 368 (ACIP) has recently made new recommendations for a routine preadolescent booster dose of acellular pertussis vaccine (combined with diphtheria and tetanus toxoid [Tdap]) at age 11-12 years and at the time of the routine decennial booster in adults. As shown by our outbreak, routine vaccination of adolescents and adults with Tdap is clearly warranted. Pertussis in adults and adolescents is usually not life-threatening, but the cough is typically prolonged, and infected people seek medical care and may lose time from work or school.24 An additional reason for vaccination of adolescents and adults is that they are thought to be a common source of infection in infants and children.25,26 ACKNOWLEDGMENTS We thank Carol Worthington, Tennessee Department of Health, Laboratory Services, for performing pertussis cultures and direct fluorescent antibody testing; Gary N. Sanden, Bacterial and Mycotic Diseases, National Center for Infectious Diseases, Centers for Disease Control and Prevention, for performing PCR testing; and Peter M. Strebel, National Immunization Program, Centers for Disease Control and Prevention, for advice. References 1. Wright SW, Edwards KM, Decker MD, Zeldin MH. Pertussis infection in adults with persistent cough. JAMA. 1995;273:1044-1046. 2. Guris D, Strebel PM, Bardenheier B, et al. Changing epidemiology of pertussis in the United States: increasing reported incidence among adolescents and adults, 1990-1996. Clin Infect Dis. 1999;28:12301237. 3. Cromer BA, Goydos J, Hackell J, et al. Unrecognized pertussis infection in adolescents. Am J Dis Child. 1993;147:575-577. 4. Nennig ME, Shinefield HR, Edwards KM, et al. Prevalence and incidence of adult pertussis in an urban population. JAMA. 1996;275: 1672-1674. 5. Robertson PW, Goldberg H, Jarvie BH, et al. Bordetella pertussis infection: a cause of persistent cough in adults. Med J Aust. 1987;146: 522-525. 6. Schmitt-Grohe S, Cherry JD, Heininger U, et al. Pertussis in German adults. Clin Infect Dis. 1995;21:860-866. 7. Jackson LA, Cherry JD, Wang SP, Grayston JT. Frequency of serological evidence of Bordetella infections and mixed infections with other respiratory pathogens in university students with cough illnesses. Clin Infect Dis. 2000;31:3-6. 8. Mink CM, Cherry JD, Christenson P, et al. A search for Bordetella pertussis infection in university students. Clin Infect Dis. 1992;14: 464-471. 9. Murray PR, Baron EJ, Pfaller ME, et al. Manual of Clinical Microbiology. Washington, DC: American Society for Microbiology; 1995. The American Journal of Medicine, Vol 120, No 4, April 2007 10. van der Zee A, Agterberg C, Peeters M, et al. Polymerase chain reaction assay for pertussis: simultaneous detection and discrimination of Bordetella pertussis and Bordetella parapertussis. J Clin Microbiol. 1993;31:2134-2140. 11. Case definitions for infectious conditions under public health surveillance. Centers for Disease Control and Prevention. MMWR Recomm Rep. 1997;46:1-55. 12. Strebel PM, Cochi SL, Farizo KM, et al. Pertussis in Missouri: evaluation of nasopharyngeal culture, direct fluorescent antibody testing, and clinical case definitions in the diagnosis of pertussis. Clin Infect Dis. 1993;16:276-285. 13. Patriarca PA, Biellik RJ, Sanden G, et al. Sensitivity and specificity of clinical case definitions for pertussis. Am J Public Health. 1988;78: 833-836. 14. Baughman AL, Bisgard KM, Edwards KM, et al. Establishment of diagnostic cutoff points for levels of serum antibodies to pertussis toxin, filamentous hemagglutinin, and fimbriae in adolescents and adults in the United States. Clin Diagn Lab Immunol. 2004;11: 1045-1053. 15. Christie CD, Glover AM, Willke MJ, Marx ML, Reising SF, Hutchinson NM. Containment of pertussis in the regional pediatric hospital during the Greater Cincinnati epidemic of 1993. Infect Control Hosp Epidemiol. 1995;16:556-563. 16. Pertussis outbreaks—Massachusetts and Maryland, 1992. MMWR Morb Mortal Wkly Rep. 1993;42:197-200. 17. Mattoo S, Cherry JD. Molecular pathogenesis, epidemiology, and clinical manifestations of respiratory infections due to Bordetella pertussis and other Bordetella subspecies. Clin Microbiol Rev. 2005;18: 326-382. 18. Dworkin MS. Adults are whooping, but are internists listening? Ann Intern Med. 2005;142:832-835. 19. Senzilet LD, Halperin SA, Spika JS, et al. Pertussis is a frequent cause of prolonged cough illness in adults and adolescents. Clin Infect Dis. 2001;32:1691-1697. 20. Hewlett EL, Edwards KM. Clinical practice. Pertussis—not just for kids. N Engl J Med. 2005;352:1215-1222. 21. Heininger U, Schmidt-Schlapfer G, Cherry JD, Stehr K. Clinical validation of a polymerase chain reaction assay for the diagnosis of pertussis by comparison with serology, culture, and symptoms during a large pertussis vaccine efficacy trial. Pediatrics. 2000;105:E31. 22. Lievano FA, Reynolds MA, Waring AL, et al. Issues associated with and recommendations for using PCR to detect outbreaks of pertussis. J Clin Microbiol. 2002;40:2801-2805. 23. Ward JI, Cherry JD, Chang SJ, et al. Efficacy of an acellular pertussis vaccine among adolescents and adults. N Engl J Med. 2005;353: 1555-1563. 24. Lee GM, Lett S, Schauer S, et al. Societal costs and morbidity of pertussis in adolescents and adults. Clin Infect Dis. 2004;39: 1572-1580. 25. Edwards KM. Overview of pertussis: focus on epidemiology, sources of infection, and long term protection after infant vaccination. Pediatr Infect Dis J. 2005;24:S104-S108. 26. Halperin SA. Pertussis—a disease and vaccine for all ages. N Engl J Med. 2005;353:1615-1617. The American Journal of Medicine (2007) 120, 369.e1-369.e7 CLINICAL RESEARCH STUDY Prognostic Stratification of Patients with Left-Sided Endocarditis Determined at Admission José Alberto San Román, MD, PhD,a Javier López, MD,a Isidre Vilacosta, MD, PhD,b María Luaces, MD,b Cristina Sarriá, MD, PhD,c Ana Revilla, MD,a Ricardo Ronderos, MD,d Walter Stoermann, MD,e Itziar Gómez, MD,a Francisco Fernández-Avilés, MD, PhDa a c Instituto de Ciencias del Corazón, Hospital Clínico Universitario, Valladolid, Spain; bHospital Clínico San Carlos, Madrid, Spain; Hospital la Princesa, Madrid, Spain; dHospital San Juan de Dios, La Plata, Argentina; eCIMAC, San Juan, Argentina. ABSTRACT BACKGROUND: The prognosis of patients with left-sided endocarditis remains poor despite the progress of surgical techniques. Identification of high-risk patients within the first days after admission to the hospital would permit a more aggressive therapeutic approach. METHODS: We designed a prospective multicenter study to find out the clinical, microbiologic, and echocardiographic characteristics available within 72 hours of admission that might define the profile of high-risk patients. Of 444 episodes, 317 left-sided endocarditis cases were included and 76 variables were assessed. Events were surgery in the active phase of the disease and in-hospital death. A stepwise logistic regression analysis was undertaken to determine variables predictive of events. RESULTS: Multivariate analysis of the clinical variables found to have statistical significance in the univariate analysis identified the following as predictive: patient referred from another hospital (odds ratio [OR]: 1.8; confidence interval [CI], 1.1-2.9), atrioventricular block (OR: 2.5; CI, 1.1-5.9), acute onset (OR: 1.7; CI, 1.1-2.9), and heart failure at admission (OR: 2.3; CI, 1.4-3.8). When the echocardiographic and microbiological variables statistically significant in the univariate analysis were introduced, the presence of heart failure at admission (OR: 2.9; CI, 1.8-4.8), periannular complications (OR: 1.8; CI, 1.1-3.1), and Staphylococcus aureus infection (OR: 2.0; CI, 1.1-3.8) retained prognostic power. Risk could be accurately stratified when combining the 3 variables with predictive power: 0 variables present: 25% of risk; 1 variable present: 38% to 49% of risk; 2 variables present: 56% to 66% of risk; and 3 variables present: 79% of risk. CONCLUSIONS: The risk of patients with left-sided endocarditis can be accurately stratified with the assessment of variables easily available within 72 hours of admission to the hospital. © 2007 Elsevier Inc. All rights reserved. KEYWORDS: Left-sided endocarditis; Prognosis; Risk stratification Every physician accustomed to treating patients with leftsided endocarditis is aware not only of its devastating nature but also of its uncertain prognosis. Despite profound knowledge of the disease and a strictly correct management ac- The present study was financed in part by the Red de Centros Cardiovasculares, which is supported by the Instituto de Salud Carlos III. Requests for reprints should be addressed to José Alberto San Román Calvar, Instituto de Ciencias del Corazón (ICICOR), Hospital Clínico Universitario, C/ Ramón y Cajal 3, 47005 Valladolid. E-mail address: [email protected] 0002-9343/$ -see front matter © 2007 Elsevier Inc. All rights reserved. doi:10.1016/j.amjmed.2006.05.071 cording to accepted guidelines,1,2 a feeling of frustration predominates if rates of mortality are rigorously examined. Before the inclusion of antibiotics in the therapeutic armamentarium, left-sided endocarditis was almost always a fatal disease. With antibiotics, uncontrolled infection decreased significantly and hemodynamic deterioration emerged as the main cause of death. Two decades ago, surgery in the active phase of the disease in patients who met strict criteria was introduced in the therapeutic approach, and death again decreased.3,4 Since then, mortality rates remain unchanged.3-8 At this point, different therapeu- 369.e2 The American Journal of Medicine, Vol 120, No 4, April 2007 tic options must be tested with the aim of improving progECHOCARDIOGRAPHY nosis. We hypothesize that an early aggressive surgical All patients underwent transthoracic and transesophageal therapeutic approach in patients with poor prognosis would echocardiography. After introduction of the probe into the be beneficial. To test this hypothesis, we first have to idenesophagus, a systematic approach to cardiac structures was tify the profile of patients with poor prognosis within the used. We focused on special areas of interest, namely, initial 72 hours of admission to the native cardiac valves and their anhospital. Bearing the preceding nuli, prosthesis and their annuli, considerations in mind, we have unand mitroaortic continuity. DoppCLINICAL SIGNIFICANCE dertaken a prospective multicenter ler was used to interrogate the hestudy to identify early epidemiomodynamic status of the valves, ● Our model can help clinicians care for logic, clinical, electrocardiographic, presence or absence of flow within patients with endocarditis and predict radiographic, analytic, microbiologthe cavities, and communication their risk. ical, and echocardiographic predicbetween chambers. From an echo● The 3 cornerstones in the diagnosis of tors of poor prognosis. cardiographic perspective, a vegeendocarditis are pivotal regarding progtation was defined as a thrombusnosis: clinical examination, blood cullike mass with shaggy echoes and PATIENT POPULATION erratic motion independent of that tures, and echocardiography. In 1996, 5 tertiary care centers of the valve. The vegetation was with surgical facilities initiated a ● Patients with heart failure, periannular measured in various planes. The prospective study. For every pacomplications, and/or Staphylococcus maximal diameter and area were tient, a standardized case report aureus infection should be closely used for subsequent analysis. In form with 18 epidemiologic, 8 followed. case of multiple vegetations, the clinical, 10 analytic, 4 radiolargest was measured. Periannular graphic, 6 electrocardiographic, ● Hospitals without surgical facilities complications were defined as fol14 microbiological, and 16 echoshould refer these patients to tertiary lows:11-13 abscess, well-delineated cardiographic variables was comcare centers without delay. perivalvular area of reduced pleted. Between 1996 and 2003, echodensity with no flow; pseudo● A multidisciplinary team including car441 patients who met Duke criteaneurysm, echo-free perivalvular 9 diac surgeons should take care of these ria (406 with definite and 35 with pouch with flow in its interior; and patients. possible criteria) were included. fistula, narrow communication beOf these patients, 333 had lefttween 2 adjacent chambers. Once sided endocarditis. Sixteen paa periannular lesion was seen, it tients with septic shock at admiswas further analyzed by subtle movements of the transducer sion were excluded from further analysis to avoid an to better determine its morphologic characteristics. obvious bias because it was an absolute indication for urgent surgery. The remaining 317 patients made up our study population. The characteristics of these patients are shown DEFINITION OF EVENTS in Table 1. Death and surgery in the active phase of the disease were To ensure consecutive enrollment, all patients who unregarded as events. Any death occurring during hospital stay derwent echocardiography to rule out endocarditis were was considered an event irrespective of the final cause. followed until a diagnosis was established. In patients with Surgery in the active phase, that is, before adequate antibia final diagnosis of endocarditis, clinical data at admission otic treatment was completed according to established were collected. Patients were interviewed regarding their guidelines,1,2 was performed when any of the following past and current clinical history. All patients underwent a occurred: left-sided heart failure unresponsive to maximal detailed history, standard physical examination, electrocarmedical treatment; septic shock; or uncontrolled infection diogram, blood analysis, urine analysis, set of 3 blood culdefined as persistent bacteriemia or fever lasting more than tures, and transthoracic and transesophageal echocardiogra10 7 days after starting adequate antibiotic treatment when phy. All were done within 24 hours of admission except other causes had been excluded. The isolated echocardioechocardiography, which depends on expert availability; in graphic finding of a periannular complication (abscess, any case, it was performed within 48 hours. Blood culture pseudoaneurysm, fistula) was not considered an absolute results were reported within 72 hours. Therefore, all variindication for surgery. ables entered in the statistical model were available within 72 hours of admission. Patients referred from another institution were not sent DEFINITION OF TERMS straight to surgery but were evaluated and treated according to our protocol. They underwent operation only when they Acute onset was defined as the span of time between the met any of the 3 requirements described afterward. onset of symptoms and the admission to the hospital less San Román et al Table 1 369.e3 Clinical Characteristics of the 317 Patients Age (y) Male gender Referred Nosocomial acquisition Previous cardiopathy Degenerative Prosthesis Rheumatic Comorbid conditions Diabetes mellitus Cancer Chronic anemia Renal insufficiency Dermatopathy Intravenous drug users Immunocompromised state HIV Previous endocarditis Clinical manifestations: Acute onset Fever Dyspnea Heart failure Abnormal skin findings Splenomegaly Renal insufficiency Stroke Hematologic findings: Serum creatinine (mg/dL) Blood urea nitrogen (mg/dL) Hemoglobin (g/dL) Hematocrit (%) WCC ⫻ 103/mm3 WCC ⬎ 103/L Sedimentation globular rate (mm) Platelets ⫻ 103/mm3 Urine findings Hematuria Proteinuria Radiographic findings Cardiac enlargement Septic emboli Pleural effusion Pulmonary congestion Electrocardiographic findings Atrioventricular block Left bundle-branch block Right bundle-branch block Atrial fibrillation Acute myocardial infarction Supraventricular tachycardia Total (n ⫽ 317) No Events (n ⫽ 187) Events (n ⫽ 130) P Value 57 ⫾ 16 209 (66%) 118 (28%) 89 (29%) 202 (65%) 29 (9%) 124 (40%) 32 (10%) 57 ⫾ 16 128 (68%) 57 (31%) 45 (25%) 121 (66%) 16 (9%) 72 (39%) 17 (9%) 58 ⫾ 16 81 (62%) 61 (47%) 34 (43%) 81 (64%) 13 (10%) 52 (41%) 15 (12%) .82 .26 .003 .08 .72 .65 .76 .47 50 21 36 22 5 16 21 10 28 (16%) (7%) (11%) (7%) (2%) (5%) (7%) (3%) (9%) 30 9 16 10 4 11 10 5 16 (16%) (5%) (9%) (5%) (2%) (6%) (5%) (3%) (9%) 20 12 20 12 1 5 11 5 12 (15%) (9%) (15%) (9%) (1%) (4%) (9%) (4%) (9%) .86 .19 .06 .27 .65 .58 .39 .75 .80 133 223 150 126 45 35 43 30 (42%) (70%) (48%) (40%) (14%) (11%) (14%) (9%) 70 135 78 61 28 22 23 13 (39%) (72%) (42%) (33%) (15%) (12%) (12%) (7%) 63 88 72 69 17 13 20 17 (49%) (68%) (56%) (53%) (13%) (10%) (15%) (13%) .08 .39 .01 ⬍.001 .64 .62 .43 .07 1.49 ⫾ 1.19 55 ⫾ 38 11.2 ⫾ 2.1 33.8 ⫾ 5.9 12.2 ⫾ 5.3 79 (62%) 67 ⫾ 31 207 ⫾ 10 .94 .78 .50 .46 .59 .50 .23 .15 .02 .17 1.4 ⫾ 1.6 54 ⫾ 42 11.2 ⫾ 2.1 34 ⫾ 6 11.9 ⫾ 7.1 185 (59%) 63.5 ⫾ 32 216 ⫾ 94 1.5 ⫾ 1.8 53 ⫾ 45 11.3 ⫾ 2.1 34.3 ⫾ 6.1 11.7 ⫾ 8.1 106 (58%) 62 ⫾ 32 222 ⫾ 87 135 (51%) 56 (21%) 90 (57%) 29 (18%) 45 (43%) 27 (25%) 177 1 83 120 (56%) (0.03%) (26%) (38%) 95 0 48 51 (51%) (0%) (26%) (27%) 82 2 35 69 (64%) (1.5%) (27%) (54%) .02 .17 .74 ⬍.001 29 13 6 35 1 10 (9%) (4%) (2%) (11%) (0.03%) (3%) 12 5 4 20 1 5 (7%) (3%) (2%) (11%) (0.5%) (3%) 17 8 2 15 0 5 (13%) (6%) (1.5%) (12%) (0%) (4%) .04 .21 .99 .82 .99 .75 HIV ⫽ human immunodeficiency virus; WCC ⫽ white cell count; SGR ⫽ sedimentation globular rate. Univariate analysis comparing the event and no event group. Data are presented as number of patients (%) or mean ⫾ standard deviation. than 15 days. Antibiotic treatment was considered adequate when high-dose intravenous antibiotic combinations known to be bactericidal in vitro against the isolated microorganisms were used. Empiric antibiotic regimens were chosen for culture-negative cases. Renal failure was defined as serum creatinine equal to or higher than 2 mg/dL. Atrio- ventricular block included first-, second-, and third-degree block. A diagnosis of heart failure was established according to accepted criteria.14 Elective surgery was defined when a patient underwent surgery after the antibiotic regimen was completed. The latter was not considered an event. 369.e4 STATISTICAL ANALYSIS The statistical analysis included a comparison between 2 groups of patients, divided according to the presence or absence of events. Continuous variables were presented as mean value ⫾ standard deviation, and the groups were compared by a 2-tailed Student t test or Wilcoxon rank-sum test. Categoric variables were expressed as a frequency and a percentage and were compared by chi-square test and Fisher exact test when necessary. In patients with more than one event, only the first one was considered. Multivariate analysis considering events as the dependent variable was performed by a logistic regression model by means of a backward stepwise method. In consecutive steps, variables that were statistically significant in the univariate analysis, and others considered clinically relevant, were included in the logistic regression. First, we included clinical variables, then microbiologic variables, and finally, the echocardiographic variables were added to the model. No more than 1 variable per 10 outcome events was entered in the logistic models to avoid overfitting. The goodness-of-fit of the final model was examined by using the Hosmer-Lemeshow test and model discrimination with the concordance index (Cindex). The odds ratio (OR) and 95% confidence intervals (CIs) for each variable were expressed. All reported P values are 2-sided. Significance was set at a P value of less than .05. The Statistical Package for the Social Sciences statistical software package (version 11.0, SPSS Inc, Chicago, Ill) was used. RESULTS Events A total of 130 patients had an event before discharge; 65 died and 65 underwent operation in the active phase. The more frequent causes of death were uncontrolled infection (n ⫽ 24) and heart failure unresponsive to maximal medical treatment (n ⫽ 11). A total of 41 of 65 patients whose event was death did not go to surgery because the operative risk was considered prohibitive after a careful assessment was carried out by a multidisciplinary team composed of surgeons, clinicians, and experts in endocarditis. The remaining 24 died in the following days of elective surgery. Univariate and Multivariate Analysis of Epidemiologic, Analytic, Electrocardiographic, Radiographic, and Clinical Variables The univariate analysis identified 1 epidemiologic, 2 clinical, 1 electrocardiographic, 1 analytic, and 2 radiographic variables significantly more frequently in patients with an event (Table 1). Multivariate analysis of epidemiologic, clinical, radiographic, electrocardiographic, and analytic variables (Table 2) showed that only the following retained statistical significance: referral from another institution, acute onset, atrioventricular block, and heart failure at admission. The American Journal of Medicine, Vol 120, No 4, April 2007 Table 2 Multivariate Analysis of Epidemiologic, Clinical, Electrocardiograhsa⬎⫽ odds ratio; CI ⫽ confidence interval. Multivariate Analysis Adding the Microbiologic and Echocardiographic Variables The statistical univariate analysis of the microbiological and echocardiographic variables is shown in Table 3. After adding the microbiologic and echocardiographic variables found to be significant in the univariate analysis to the multivariate statistical model, only 3 variables retained prognostic power: heart failure at admission, periannular complications, and Staphylococcus aureus as the causative microorganism (Table 4). The Hosmer-Lemeshow goodness-of-fit test yielded a P value of .81. Calculation of model discrimination by using the concordance index was 0.70 (CI 95%, 0.63-0.75). To rule out that our results are biased by the fact that ours are tertiary care centers with many referred patients, we analyzed referred and nonreferred patients separately by using the same statistical model. We found the same predictors of poor outcome. Of note, heart failure was the most powerful in the referred population (OR 6.6, CI, 2.7-16.2) and periannular complications in the nonreferred population (OR 2.5, CI, 1.3-5). Stratification of Risk The factors encountered to bear prognostic importance in the multivariate analysis were combined to stratify risk. Patients without heart failure, periannular complications, or Staphylococcus aureus infection had the best prognosis with a 25% probability of having an event. If 1 of these factors was present, the risk increased to 38% to 49%. Risk was 56% to 66% in patients with 2 factors, and it increased to 79% when the 3 factors were present (Figure 1). DISCUSSION Our results show that the risk of patients with left-sided endocarditis can be stratified accurately with the assessment of variables easily available within 72 hours of admission to the hospital. Some practical consequences can be drawn from this study. First, the 3 cornerstones in the diagnosis of San Román et al Table 3 369.e5 Baseline Microbiologic and Echocardiographic Characteristics of the 317 Patients Positive blood cultures at admission Streptococcus viridans Streptococcus bovis Other Streptococci Staphylococcus aureus Methicillin-resistant Methicillin-sensitive Coagulase-negative Staphylococci HACEK Enterococci Polymicrobial Fungi Anaerobes Gram-negative bacilli Negative cultures Others Multivalvular Prosthetic Valve involved Aortic native valve Mitral native valve Aortic mechanical prothesis Mitral mechanical prothesis Mitral bioprosthesis Aortic bioprosthesis Vegetations Major diameter (mm) Area (cm2) Periannular complications: Abscess Pseudoaneurysm Fistula Valve perforation Ejection fraction Total (n ⫽ 317) No events (n ⫽ 187) Events (n ⫽ 130) 214 (67%) 127 (67%) 87 (67%) .91 18 5 7 29 27 2 21 1 12 3 4 1 6 20 2 30 51 .20 .89 .61 .03 54 14 21 53 47 6 48 1 25 16 6 3 15 48 13 51 114 (17%) (4%) (7%) (17%) (15%) (2%) (15%) (0.03%) (8%) (5%) (2%) (1%) (5%) (15%) (4%) (16%) (36%) 110 (35%) 95 (30%) 36 (11%) 55 (17%) 16 (5%) 10 (3%) 238 (79%) 13.9 ⫾ 7.7 90 (54%) 90 (28%) 39 (14%) 37 (13%) 29 (10%) 28 (9%) 62 ⫾ 12 36 (20%) 9 (5%) 14 (8%) 24 (13%) 20 (11%) 4 (2%) 27 (15%) 0 13 (7%) 13 (7%) 2 (1%) 2 (1%) 9 (5%) 28 (15%) 8 (4%) 21 (12%) 63 (34%) 59 (32%) 65 (35%) 17 (9%) 35 (19%) 30 (18%) 7 (4%) 137 (77%) 13.4 ⫾ 7.4 1.1 ⫾ 1.3 35 (23%) 13 (8%) 17 (11%) 16 (10%) 20 (11%) 62 ⫾ 12 (14%) (4%) (5%) (23%) (21%) (2%) (16%) (1%) (9%) (2%) (3%) (1%) (5%) (16%) (2%) (22%) (39%) 51 (39%) 30 (23%) 19 (15%) 20 (15%) 25 (17%) 9 (7%) 101 (82%) 14.9 ⫾ 8.1 1.7 ⫾ 1.1 46 (37%) 26 (21%) 20 (16%) 13 (11%) 8 (7%) 62 ⫾ 12 P value .392 .68 .41 .60 .11 .23 .99 .99 .93 .21 .09 .31 .16 .03 .13 .44 .80 .31 .35 .14 .08 .007 .002 .20 .95 .18 .88 HACEK ⫽ Haemophilus, Actinobacillus, Cardiobacterium, Eikenella, Kingella. Univariate analysis comparing the event and no event group. Data are presented as number of patients (%) or mean ⫾ standard deviation. endocarditis10 are also pivotal regarding prognosis: clinical examination, blood cultures, and echocardiography. Second, patients with heart failure, periannular complications, and/or Staphylococcus aureus infection should be closely followed. Third, hospitals without surgical facilities should refer these patients to tertiary care centers without delay. Finally, a multidisciplinary team including cardiac surgeons should take care of these patients because it can be anticipated that surgery will be needed as part of the therapeutic strategy in many of them. We demonstrate that risk can be accurately, easily, and rapidly stratified from simple clinical, microbiological, and echocardiographic variables; the more variables present, the higher the risk. This could help clinicians in one of the most challenging decisions in clinical practice, which is to choose between a watchful and active waiting or a combined medico-surgical approach in patients with active endocarditis. Unquestionably, this decision must be individualized, and many factors that cannot be trans- Table 4 Stepwise Multivariate Analysis Including All Variables in the 317 patients with Left-sided Endocarditis OR ⫽ odds ratio; CI ⫽ confidence interval. 369.e6 The American Journal of Medicine, Vol 120, No 4, April 2007 Figure Risk stratification according to the presence of variables found to be significant in the multivariate analysis. HF ⫽ heart failure; PAC ⫽ periannular complications; SA ⫽ Staphylococcus aureus. lated into a statistical model must be taken into account. In this sense, it must be emphasized that “there is still as much art as science in the care of patients with endocarditis.”15 We hope that our experience could help to tip the balance in favor of science. The inclusion of surgery in the active phase of the disease as an event must be argued. Our protocol established a tight criteria for a patient to be sent to surgery before finishing the antibiotic treatment. These criteria were based on studies that demonstrate a grim prognosis if surgery is not carried out7,16-18; in other words, had those patients not underwent operation, they would have died in all likelihood. Other investigations dealing with endocarditis have attempted to identify predictors of poor prognosis during hospital stay and are in agreement with our results.7,19,20 Hasburn and colleagues7 developed a weighted scoring system with 5 independent predictors of 6-month mortality applicable to patients with complicated left-sided native valve endocarditis. They identified the following prognostic factors: Charlson comorbidity scale score of 2 or greater, altered mental status, congestive heart failure, infection due to an organism other than Streptococcus viridans, or no surgery. According to the number of these variables present, they classified patients in 4 groups with mortality rates of 5%, 15%, 31%, and 59%. This classification system worked well in predicting mortality in a subsequent validation cohort group. Our work is unique for the following reasons: Our patients were consecutively and prospectively included in the study. All patients underwent transesophageal echocardiography. A high number of variables were analyzed. A total of 76 variables have been introduced in the statistical analysis, including the majority of those previously found to be predictive of poor prognosis. Only variables available within 72 hours of admission were included for analysis. The statistical model was designed with the purpose of mirroring the clinical approach to a patient. Thus, we designed the statistical analysis in the same manner we are confronted with a real patient. Most other studies consider variables altogether, forgetting that in clinical practice all those variables come available to the physician step by step. We first take the clinical history and examine the patient; then, we obtain an electrocardiogram and a blood and urine analysis, and in the following hours we have the results of blood cultures and transesophageal echocardiography available. Other authors have attempted to establish the profile of patients with a high probability of having events including a longer follow-up.8,14,18,21-24 Although useful for the management of patients, these studies do not help in the decision-making process in the early phase of the disease. Moreover, their results are heterogeneous given the differences in the recruitment of patients (right- and left-sided endocarditis,5,7,18,19,22,25-32 complicated,27,33-35 or noncomplicated endocarditis), follow-up period (from hospitalization to 20 years36), variables included,32,37-40 nature of the study (retrospective5,7,17,18,26,32,41 or prospective), and percentage of patients who underwent transesophageal echocardiography (43%42 to 90%28). Of course, this is just one more step in the fight against endocarditis. The prognostic model we developed must be prospectively validated in an independent population. Although several nonrandomized investigations suggest that an aggressive medico-surgical strategy could improve prognosis, this will need to be proven in a large randomized study. San Román et al References 1. Bonow R, Carabello B, Leon AC, et al. ACC/AHA guidelines for the management of patients with valvular heart disease. Executive summary. A report of the American College of Cardiology/American Heart Association task force on practice guidelines (committee on management of patients with valvular heart disease). J Am Coll Cardiol. 1998;32:1486-1582. 2. Horstkotte D, Piper C, Vogt J, et al. The Task Force on Infective Endocarditis of the European Society of Cardiology. Guidelines on Prevention, Diagnosis and Treatment of Infective endocarditis. Eur Heart J. 2004;25:267-276. 3. Durack DT. Evaluating and optimizing outcomes of surgery for endocarditis. JAMA. 2003;290:3250-3251. 4. Oakley CM. The clinical spectrum and prognosis of native valve endocarditis in non-addicts. Eur Heart J. 1995;16:1454-1455. 5. Wallace S, Walton B, Kharbanda R, et al. Mortality from infective endocarditis: clinical predictors of outcome.Heart. 2002;88:53-60. 6. Erbel R, Liu F, Rohmann J, Kupferwasser I. Identification of high-risk subgroups in infective endocarditis and the role of echocardiography. Eur Heart J. 1995;16:588-602. 7. Hasburn R, Vikram H, Barakat L, et al. Complicated left-sided native valve endocarditis. Risk classification for mortality.JAMA. 2003;289: 1933-1940. 8. Bouza E, Menasalvas A, Muñoz P, et al. Infective endocarditis: a prospective study at the end of the twentieth century. Medicine. 2001; 80:298-307. 9. Durack DT, Lukes AS, Bright DK. The Duke Endocarditis Service: new criteria for the diagosis of infective endocarditis: utilization of specific echocardiographic findings. Am J Med. 1994;96:200-209. 10. Bayer A, Bolger A, Tauber K, et al. Diagnosis and management of infective endocarditis and its complications. Circulation. 1998;98: 2936-2948. 11. San Román JA, Vilacosta I, Sarriá C, et al. Clinical course, microbiologic profile, and diagnosis of periannular complications in prosthetic valve endocarditis. Am J Cardiol. 1999;83:1075-1079. 12. Graupner C, Vilacosta I, San Román JA, et al. Periannular extension of infective endocarditis. J Am Coll Cardiol. 2002;39:1204-1211. 13. San Román JA, Vilacosta I, Zamorano JL, et al. Transesophageal echocardiography in right-sided endocarditis. J Am Coll Cardiol. 1993;21:1226-1230. 14. Cleland JF, Erdmann E, Ferrari OM, et al. The Task Force on Heart Failure of the European Society of Cardiology. Guidelines for the diagnosis of heart failure. Eur Heart J. 1995;16:741-751. 15. DiSesa VJ. Art and science in the management of endocarditis. Ann Thorac Surg. 1991;51:6-7. 16. Bishara J, Leibovici L, Gartman-Israel D, et al. Long-term outcome of infective endocarditis: the impact from early surgical intervention. Clin Infect Dis. 2001;33:1636-1643. 17. Netzer R, Zollinger E, Seiler C, Cerny A. Infective endocarditis: clinical spectrum, presentation and outcome. An analysis of 212 cases 1980-1995. Heart. 2000;84:25-30. 18. Netzer R, Altwwegg S, Zollinger E, et al. Infective endocarditis: determinants of long term outcome. Heart. 2002;88:61-66. 19. Granowitz E, Longworth D. Risk stratification and bedside prognostication in infective endocarditis. JAMA. 2003;289:1991-1993. 20. Mansur AJ, Grinberg M, Cardoso HA, et al. Determinants of prognosis in 300 episodes of infective endocarditis. Thorac Cardiol Surg.1996; 44:2-10. 21. Delahaye F, Ecochard R, de Gevigney G, et al. The long term prognosis of infective endocarditis. Eur Heart J.1995;16:48-53. 369.e7 22. Schulz R, Werner J.B, Andreas S, et al. Clinical outcome and echocardiographic findings of native and prosthetic valve endocarditis in the 1990s. Eur Heart J. 1996;17:281-288. 23. Tornos MP, Permanyer-Miralda G, Olona M, et al. Long term complications of native valve infective endocarditis in non-addicts. A 15-year follow-up study. Ann Intern Med. 1992;117:567-572. 24. Mansur AJ, Dal Bo C, Fukushima JT, et al. Relapses, recurrences, valve replacements and mortality during the long term follow-up after infective endocarditis. Am Heart J. 2001;141:78-86. 25. Castillo JC, Anguita MP, Ramírez A, et al. Clinical characteristics and evolution of recurrent infectious endocarditis in non drug addicts. Rev Esp Cardiol. 2000;53:344-352. 26. Cartón JA, Asensi V, Maradona JA, et al. Endocarditis infecciosa sobre válvula natural: perfil epidemiológico y análisis de la mortalidad entre los años 1984 y 1993. Med Clin (Barc).1995;104:493-499. 27. Chan KL. Early clinical course and long-term outcome of patients with infective endocarditis complicated by perivalvular abscess. CMAJ. 2002;16:19-24. 28. Hoen B, Alla F, Selton-Suty C, et al. Changing profile of infective endocarditis. Results of a 1-year survey in France. JAMA. 2002;288: 75-81. 29. Hecht S, Berger M. Right-sided endocarditis in intravenous drug users. Ann Intern Med. 1992;117:560-566. 30. Sandre RM, Shafran SD. Infective endocarditis: review of 135 cases over 9 years. Clin Infect Dis. 1996;22:276-286. 31. Chu VH, Cabel CH, Benjamin DK, et al. Early predictors of inhospital death in infective endocarditis. Circulation. 2004;109:17451749. 32. Goldman ME, Fisher EA, Winters S, et al. Early identification of patients with native infectious endocarditis at risk for mayor complications by initial clinical presentation and baseline echocardiography. Int J Cardiol.1995;52:257-264. 33. Karth G, Koreny M, Binder T, et al. Complicated infective endocarditis necessitating ICU admission: clinical course and prognosis. Crit Care. 2002;6:149-154. 34. Holenarasipur R, Buenconsejo J, Hasbun R, Quagliarello V. Impact of valve surgery on 6-month mortality in adults with complicated, leftsided native valve endocarditis. JAMA. 2003;290:3207-3214. 35. Baddour LM. Twelve-year review of recurrent native-valve infective endocarditis: a disease of the modern antibiotic era. Rev Infect Dis.1988;10:1163-1170. 36. Tornos P, Almirante B, Olona M, et al. Clinical outcome and longterm prognosis of late prosthetic valve endocarditis: a 20-year experience. Clin Infect Dis.1997;24:381-386. 37. Millaire A, Leroy O, Gaday V, et al. Incidence and prognosis of embolic events and metastatic infections in infective endocarditis. Eur Heart J. 1997;18:677-684. 38. Mügge A, Daniel W. Echocardiographic assessment of vegetations in patients with infective endocarditis. Echocardiography. 1995;12:651661. 39. Aranki S, Adams D, Rizzo R, et al. Determinants of early mortality and late survival in mitral valve endocarditis. Circulation.1994;92: 143-149. 40. Fernández-Guerrero ML, Verdejo C, Azofra J, de Gárgolas M. Hospital-acquired infectious endocarditis not associated with cardiac surgery: an emerging problem. Clin Infect Dis. 1995;20:16-23. 41. Zamorano J, Sanz J, Moreno R, et al. Comparison of outcome in patients with culture negative versus culture positive active infective endocarditis. Am J Cardiol. 2001;87:1423-1425. 42. Casabé JH, Deschle H, Cortés C, et al. Predictors of hospital mortality in 186 cases of active infective endocarditis treated in a tertiary medical center (1992-2001). Rev Esp Cardiol. 2003;56:578-585. The American Journal of Medicine (2007) 120, 369.e9-369.e14 CLINICAL RESEARCH STUDY Does Statin Therapy Decrease the Risk for Bleeding in Patients Who Are Receiving Warfarin? James D. Douketis, MD, FRCP(C),a Magda Melo, BSPhrm, MSc,b Chaim M. Bell, MD, PhD, FRCP(C),b,c,d,f Muhammad M. Mamdani, PharmD, MA, MPHb,c,e a Department of Medicine, McMaster University and St. Joseph’s Healthcare, Hamilton, Ontario, Canada; bInstitute for Clinical Evaluative Sciences, Toronto, Ontario, Canada; cDepartment of Medicine, University of Toronto, Ontario, Canada; dDivision of General Internal Medicine, St. Michael’s Hospital, Toronto, Ontario, Canada; eDepartment of Pharmacy, University of Toronto, Ontario, Canada; fDepartment of Health Policy, Management and Evaluation, University of Toronto, Ontario, Canada. ABSTRACT PURPOSE: Recent observations in patients with atrial fibrillation who are receiving warfarin suggest that concomitant treatment with a 3-hydroxy-3-methylglutaryl coenzyme A reductase inhibitor (statin) decreases the risk for bleeding. METHODS: We conducted a population-based, nested case-control study using the linked administrative databases of Ontario, Canada, to assess whether statin use decreases the risk of bleeding in warfarin users. Eligible patients were Ontario residents, age 66 years or more, with atrial fibrillation who were prescribed warfarin between April 1, 1994, and December 31, 2001. Patients were followed until hospitalization for upper gastrointestinal or intracranial bleeding, study end (March 31, 2002), discontinuation of warfarin, or death. Cases were matched to controls by age and sex. Logistic regression analysis was used to estimate odds ratios (ORs) and 95% confidence intervals (CIs) for the association between bleeding and statin use. RESULTS: We identified 79,207 warfarin users with atrial fibrillation. There were 1518 cases with an upper gastrointestinal or intracranial bleed and 15,100 matched controls without bleeding. Long-term (ⱖ1 year) statin use was associated with a lower risk for any bleeding (OR ⫽ 0.80; 95% CI, 0.66-0.97). However, there was no association between bleeding and recent (⬍6 months) statin use (OR ⫽ 1.04; 95% CI, 0.74-1.48) or statin use of any duration (OR: 0.91; 95% CI, 0.77-1.07), suggesting potential confounding of the association between statin use and bleeding by a health-user effect. CONCLUSION: Long-term statin use may be associated with a decreased risk for bleeding in warfarin users with atrial fibrillation. Additional research is needed to further explore this putative association. © 2007 Elsevier Inc. All rights reserved. KEYWORDS: Oral anticoagulants; Statins; Bleeding; Case-control study 3-Hydroxy-3-methylglutaryl coenzyme A reductase inhibitor drugs (statins) are widely used for the primary and Dr. Bell holds a Canadian Institutes of Health Research Phase 2 ClinicianScientist Award. Dr. Mamdani is currently an employee of Pfizer Inc, the manufacturer of one statin. The involvement of Dr. Mamdani in the development of this study and article was preceded by (⬃6 months) and was not influenced by his subsequent decision to work for Pfizer. Dr. Douketis, Dr. Bell, and Ms. Melo have no conflict of interest or financial disclosures. Requests for reprints should be addressed to James D. Douketis, MD, FRCP(C), St. Joseph’s Hospital, 50 Charlton Ave, Hamilton, ON, Canada, L8N 4A6. E-mail address: [email protected]. 0002-9343/$ -see front matter © 2007 Elsevier Inc. All rights reserved. doi:10.1016/j.amjmed.2006.06.008 secondary prevention of acute coronary syndromes, stroke, and other cardiovascular disease,1,2 and in recent years statin use has increased sharply.3 In addition to their lipidlowering effects, statins are considered to have several pleiotropic effects unrelated to lipid lowering, which include plaque stabilization in patients with an acute coronary syndrome.2 Recent observations have suggested that statin use may modify the risk for bleeding in patients who are receiving anticoagulants and in patients with acute intracerebral bleeding. An analysis of the SPORTIF III and V Study databases assessed risk factors for bleeding in 7329 patients with chronic 369.e10 The American Journal of Medicine, Vol 120, No 4, April 2007 atrial fibrillation who received warfarin, administered to of study period (March 31, 2002), patient death, or disachieve a target international normalized ratio (INR) of 2.0 continuation of warfarin, whichever came first. Patients to 3.0, or ximelagatran, 36 mg twice daily.4 Multivariate were not studied during their first year of eligibility for logistic regression analysis found, unexpectedly, that statin prescription drugs, corresponding to their 66th year, to use at the time of study enrollment conferred a 40% risk avoid incomplete medication records. Discontinuation of reduction for major bleeding in warfarin was deemed to have ocboth warfarin-treated patients (odds curred if there was more than ratio [OR] ⫽ 0.60; 95% confi180 days from the previous preCLINICAL SIGNIFICANCE dence interval [CI], 0.41-0.87) scription. In these cases of warand ximelagatran-treated patients farin discontinuation, the period ● Recent observations suggest that statin (OR ⫽ 0.61; 95% CI, 0.39-0.96). of observation was counted until use may be associated with a decreased The reason for this observation is 90 days after the last warfarin risk for bleeding in patients who are renot clear and is counterintuitive prescription date. A priori, we ceiving oral anticoagulant therapy. when one considers that statins separated warfarin users into 3 have antiplatelet and other antigroups based on their duration of ● By using a linked administrative datathrombotic properties that would warfarin use before the outcome: base, we found that long-term (ⱖ1 year) tend to promote bleeding.5,6 any warfarin user; long-term statin use was associated with a lower To test whether statin use has a warfarin users, based on at least risk for any bleeding (OR ⫽ 0.80; 95% CI, protective effect on clinically sig6 months of continuous warfarin 0.66-0.97), although a healthy user efnificant bleeding in anticoagulated use; and recent warfarin users, fect may also explain these findings. patients, we performed a populabased on less than 6 months of tion-based, nested case-control warfarin use. study involving patients with chronic atrial fibrillation who were receiving warfarin Definition of Case Patients therapy. Within the cohort of warfarin users with atrial fibrillation, case patients were defined as those registered in the CIHI METHODS DAD as having been admitted to hospital with a diagnosis of upper gastrointestinal or intracranial hemorrhage beStudy Design and Data Sources tween April 1, 1994, and March 31, 2002 (Appendix 1). We used a large linked population-based administrative database in Ontario, Canada, to perform a nested case-control study from April 1, 1994, to March 31, 2002. Prescriptions were Definition of Control Patients identified from the Ontario Drug Benefit Program, which From the cohort of continuous warfarin users who were not records prescription medications dispensed to residents of admitted to a hospital between April 1, 1994, and March 31, Ontario who are age 65 years and older. Hospital admissions 2002, we randomly selected 10 controls for each case, for upper gastrointestinal and intracranial bleeding were idenmatched for age (⫾1 year) and sex. If fewer than 10 controls tified from the Canadian Institute for Health Information Disexisted, we analyzed only those controls and did not alter charge Abstract Database (CIHI DAD), which provides dethe matching process. A case patient could serve as a control tailed documentation of all hospital admissions in Ontario. for a different case patient before his or her date of admisBaseline patient demographic and other clinical characteristics sion, and each control could be used for multiple case were obtained from the Ontario Registered Persons Database. patients.10,11 These databases are linked through encrypted patient identification numbers. Ethics approval was obtained from the Sunnybrook and Definition of Exposure Women’s College Health Science Centre and used the proThe exposure of interest was use of a statin drug before the tocols of the Institute for Clinical Evaluative Sciences to index bleeding event. The statin drugs included in the Onsafeguard patient confidentiality. tario formulary at that time were atorvastatin, cerivastatin, fluvastatin, lovastatin, pravastatin, and simvastatin. A priori, Cohort Definition a statin user was classified as any statin user, in whom there We studied patients with a history of atrial fibrillation was at least 1 prescription claim during the 2 years before based on hospitalization records for the 3 years before the index bleed; long-term statin user, in whom there was at cohort entry. Patient prescription records enabled us to least 1 statin claim in each of the 6-month periods of the define a period of warfarin use based on previously pubprevious year; recent statin user, in whom there was at least lished methods.7-9 The period of observation for the pa1 prescription claim during the 180 days before the index tient cohort began with any prescription of warfarin after bleed but no claim in the remaining 6 months of the year the age of 66 years and ended with a hospital admission for upper gastrointestinal or intracranial bleeding, the end before the event. Douketis et al Table 1 Statin Therapy and Bleeding Risk 369.e11 Characteristics of Study Subjects Subjects, n Age, mean (SD) Male Mean days of follow-up Prior bleeding event Products used in the past year, mean (SD) LTC facility Prescriptions in the previous 120 d ACE inhibitors Angiotensin receptor antagonists Aspirin Antibiotics (systemic) -blockers Calcium channel blockers Clopidogrel Digoxin Diuretics Fibrates Gastroprotectors CYP 2C9 inducers CYP 2C9 inhibitors NSAIDs Steroids Ticlopidine Any Warfarin Users Long-term Warfarin Users Recent Warfarin Users Cases Controls Cases Controls Cases Controls 1518 77.2 (7.2) 45.7 612.9 3.7 16.1 (8.0) 15,100 76.9 (7.0) 45.7 737.6 1.5 13.6 (6.9) 1003 76.9 (6.9) 45.7 895.2 3.3 15.9 (8.0) 9993 76.9 (6.7) 45.7 924.7 1.6 13.3 (6.7) 513 77.7 (7.7) 46.0 63.2 4.3 16.6 (7.9) 4921 77.7 (7.2) 46.0 82.8 1.7 14.8 (7.2) 11.7 7.3 11.7 8.2 11.5 8.5 52.4 3.3 46.9 3.4 52.0 4.4 46.5 3.9 53.4 1.2 47.8 2.9 11.4 39.5 30.8 33.2 0.3 63.3 64.3 2.2 32.7 1.4 9.0 16.7 30.4 1.0 5.4 32.6 30.7 32.8 0.1 64.5 59.2 1.3 23.8 2.0 9.1 9.0 27.8 0.3 6.2 37.9 28.2 32.2 0.1 63.1 64.4 1.9 30.0 1.6 7.5 16.4 31.5 0.3 3.3 31.6 29.4 32.0 0.1 65.3 58.5 1.4 23.2 2.2 8.2 8.7 27.7 0.1 21.6 42.3 36.1 35.3 0.6 63.6 64.1 2.9 38.0 1.0 11.9 17.4 28.5 2.3 15.4 36.9 37.7 32.7 0.4 61.4 58.1 1.5 26.8 1.8 13.1 11.2 28.0 1.0 SD ⫽ standard deviation; LTC ⫽ long-term care; ACE ⫽ angiotensin-converting enzyme; NSAID ⫽ nonsteroidal anti-inflammatory drug; CYP ⫽ cytochrome P450. Values are percentages, unless stated otherwise. CYP 2C9 inducers: rifampin, phenytoin. CYP 2C9 inhibitors: amiodarone, losartan, tolbutamide, cimetidine, fluvastatin, fluconazole. Exposure to Interacting Medications and Covariates To adjust for concomitant drug use that might be associated with an increased risk for bleeding or that might interfere with warfarin metabolism, drug use during the 120 days before the index bleed event was included in the regression analysis.12 To adjust for potential patient-related confounders that might impact on bleeding, several comorbid conditions, as outlined in Appendix 2, were included in the regression analyses. Residence in a long-term care facility was also identified as a covariate, because this might be an indicator of comorbidity.13 Adjustment also was made for the number of different drugs prescribed in the year before the index bleed, which is an additional measure of comorbidity.14 Statistical Analysis Conditional logistic regression analysis was performed to estimate the ORs and corresponding 95% CIs for the association between admission to a hospital for upper gastrointestinal or intracranial bleeding and use of a statin drug. We also performed a subgroup analyses on patients with upper gastrointestinal bleeding, because this condition has been extensively studied. In the multivariate analysis, adjustment was made for the covariates outlined in Appendix 2. To avoid overfitting the model, drugs that could have confounded the model were grouped by mechanism rather than inserted individually. All analyses were performed using SAS version 8.2 (SAS Institute, Cary, NC). RESULTS Study Subject Characteristics We identified 79,207 warfarin users with a history of atrial fibrillation, of whom 52% were women. The mean age at cohort entry was 79 years. Statin Use and Risk for Any Bleeding (Upper Gastrointestinal or Intracranial) During the period of observation, from April 1, 1994, to March 31, 2002, 1518 individuals from the warfarin cohort were admitted to a hospital with an upper gastrointestinal or intracranial bleed (cases) and were matched to 15,100 controls without a bleeding event (Table 1). Hospital admissions for upper gastrointestinal bleeding (n ⫽ 1201) were more common than for intracranial bleeding (n ⫽ 319) in 369.e12 Table 2 The American Journal of Medicine, Vol 120, No 4, April 2007 Association Between Statin Use and Bleeding (Upper Gastrointestinal Bleed or Intracranial Bleed) Among Warfarin Users Warfarin Users Statin Use Crude OR (95% CI) Adjusted OR (95% CI)§ Any use Any use* Long-term use† Recent use‡ Any use* Long-term use† Recent use‡ Any use* Long-term use† Recent use‡ 1.03 (0.88-1.20) 0.87 (0.72-1.05) 1.22 (0.87-1.72) 0.92 (0.76-1.13) 0.85 (0.68-1.07) 0.89 (0.54-1.47) 1.07 (0.82-1.39) 0.88 (0.63-1.22) 1.05 (0.67-1.65) 0.91 (0.77-1.07) 0.80 (0.66-0.97) 1.04 (0.74, 1.48) 0.82 (0.67-1.00) 0.79 (0.63, 0.99) 0.77 (0.46, 1.30) 1.02 (0.78-1.34) 0.82 (0.58-1.15) 1.06 (0.66-1.68) Long-term Recent use OR ⫽ odds ratio; CI ⫽ confidence interval. Any warfarin use: subject who had at least a claim for warfarin during the study period before the bleeding event (includes long-term users and recent users). Long-term warfarin user: subject who used warfarin continuously for at least 6 months. Recent warfarin user: subject who used warfarin for less than 6 months. *Any use of statins: any use in the previous 2 years of the index bleeding. †Long-term use of statins: at least one statin claim in each of the 6-month periods of the previous year. ‡Recent use of statin: at least one statin claim in the 6 months before index, but none in the 6 months before that. §Adjusted for number of drugs used in the past year, history of upper gastrointestinal bleeding or intracranial bleeding, residency in a long-term care facility at cohort entry, and use of ACE inhibitors, angiotensin receptor blockers, aspirin, NSAIDs, ticlopidine, steroids, diuretics, fibrates, gastroprotectors, digoxin, CYP 2C9 inducers, CYP 2C9 inhibitors, systemic antibiotics, beta-blockers, calcium channel blockers, and clopidogrel in the 120 days before index. our patient population. The analyses were run separately for upper gastrointestinal bleeding and intracranial bleeding. Two patients had both events but contributed only once to the “any bleed” category. For our primary analysis examining the association of any statin use in the previous 2 years in those also prescribed warfarin for upper gastrointestinal or intracranial bleeding, the multivariate analysis demonstrated no statistically significant effect (OR ⫽ 0.91, 95% CI, 0.77-1.07) (Table 2). However, those prescribed warfarin and on longterm statins had a statistically significant reduced risk for upper gastrointestinal or intracranial bleeding (OR ⫽ 0.80, 95% CI, 0.66-0.97). The statistically significant reduced risk was also found in long-term warfarin and statin users (OR ⫽ 0.79, 95% CI, 0.63-0.99). All other combinations of warfarin and statin use demonstrated no statistically significant difference (Table 2). Furthermore, when we restricted our analyses to upper gastrointestinal bleeding events, longterm statin use was also associated with a reduced risk of bleeding among warfarin users (OR ⫽ 0.78, 95% CI, 0.630.97), but not recent statin use (OR ⫽ 1.10, 95% CI, 0.741.66) or any statin use (OR ⫽ 0.92, 95% CI, 0.77-1.11). DISCUSSION The principal finding of this study is that in warfarin users, long-term statin use seems to be associated with a decreased risk for bleeding complications. However, because new use of a statin does not seem to confer a protective effect against warfarin-associated bleeding, the possibility exists that a protective effect of long-term statin use against bleeding may be related to a “healthy user effect.” Thus, long-term statin users or their physicians may be more attentive to personal health risks and more likely to have other unmeasured determinants that decrease bleeding risk (eg, better warfarin anticoagulation control) than statin nonusers. Fur- thermore, the lack of a biologically plausible mechanism further suggests that an association between statin use and bleeding should be interpreted with caution and may be spurious. Previous randomized, controlled trials of statin therapy did not assess bleeding as an outcome and, therefore, cannot be used to examine the effects of statin use on bleeding.2 In a small retrospective cohort study involving 54 patients with type 2 diabetes, there was a trend toward delayed vitreous hemorrhage in statin users compared with nonusers (21.4 years vs 16.2 years, P ⫽ .09).15 In studies that have assessed the effects of statin therapy on vascular reactivity in patients with subarachnoid hemorrhage, there is preliminary evidence that statins may reduce bleeding, possibly through an ameliorating effect on vasospasm.16-18 Taken together, there is no compelling evidence that statins have an effect on modifying bleeding risk in non-anticoagulated patients. This study has potential limitations. First, we acknowledge the potential for inaccurate ascertainment of cases with bleeding, which is germane to administrative database studies. The accuracy of the diagnostic codes we used to capture upper gastrointestinal and intracranial bleeds has not been validated in the Ontario hospital discharge database and was not feasible in our study. However, validation studies performed elsewhere, including in another Canadian jurisdiction, have shown that the positive predictive value for capturing intracranial bleeds with an International Classification of Diseases, Ninth Revision (ICD-9) code is 77% to 98% when the ICD-9 code was the most responsible diagnosis for the hospitalization.19-22 Similarly, the accuracy of ICD-9 codes for capturing upper gastrointestinal bleeds was 59% to 100% in other studies and greater than 81% when ICD-9 codes specific for bleeding sites were used.23,24 Furthermore, there is excellent agreement between administrative hospitalization data and chart audits in Douketis et al Statin Therapy and Bleeding Risk other clinical domains with the database used in this study.25 Second, our analyses assumed a statin drug class effect because of the exploratory nature of our study and because we considered our study unlikely to have sufficient power to assess bleeding risk with individual statins. Preparation-specific protective or adverse effects may occur because some statins (fluvastatin, lovastatin, simvastatin) have been found to potentiate the anticoagulant effect of warfarin and possibly increase the risk for bleeding.26 We cannot exclude the possibility that the effects we observed may differ according to individual statin preparations. Third, we excluded patients with atrial fibrillation who were aged less than 66 years and, therefore, cannot apply our findings to such patients. Fourth, we did not include anticoagulation control, as measured by the INR, as a variable in our regression analysis because this was not feasible. However, correlating INR level and bleeding risk is problematic even in randomized trials, unless regular INR testing is mandated.4 Furthermore, bleeding can occur irrespective of the INR level, and the INR at the time of clinical presentation may not reflect the INR at the time of a bleed.27,28 Finally, we could not assess the effect of using nonprescription (“over-the-counter”) drugs that affect hemostasis, such as aspirin or over-the-counter nonsteroidal anti-inflammatory drugs, on the association between statin use and bleeding risk. To summarize, long-term statin use seems to be associated with a decreased risk for bleeding in warfarin users with atrial fibrillation. However, potential confounders and a lack of biologic plausibility warrants additional studies to further investigate the putative association between statin use and bleeding risk in warfarin users. APPENDIX 1 International Classification of Diseases, Ninth Revision, Clinical Modification Diagnostic Codes Used to Identify Cases with Upper Gastrointestinal or Intracranial Bleeding ICD-9 Codes 431: Intracerebral hemorrhage 531.0: Gastric ulcer—acute with hemorrhage 531.2: Gastric ulcer—acute with hemorrhage and perforation 531.4: Gastric ulcer—chronic or unspecified with hemorrhage 531.6: Gastric ulcer—chronic or unspecified with hemorrhage and perforation 532.0: Duodenal ulcer—acute with hemorrhage 532.2: Duodenal ulcer—acute with hemorrhage and perforation 532.4: Duodenal ulcer—chronic or unspecified with hemorrhage 532.6: Duodenal ulcer—chronic or unspecified with hemorrhage and perforation 533.0: Peptic ulcer—acute with hemorrhage 533.2: Peptic ulcer—acute with hemorrhage and perforation 533.4: Peptic ulcer—chronic or unspecified with hemorrhage 533.6: Peptic ulcer—chronic or unspecified with hemorrhage and perforation 534.0: Gastrojejunal ulcer—acute with hemorrhage 369.e13 ICD-9 Codes 534.2: Gastrojejunal ulcer—acute with hemorrhage and perforation 534.4: Gastrojejunal ulcer—chronic or unspecified with hemorrhage 534.6: Gastrojejunal ulcer—chronic or unspecified with hemorrhage and perforation 578.0: Hematemesis 578.1: Blood in stool 578.9: Hemorrhage of gastrointestinal tract, unspecified ICD-9 ⫽ International Classification of Diseases, Ninth Revision. APPENDIX 2 Potential Confounders for Association Between Statin Use and Bleeding in Patients with Atrial Fibrillation Who Are Receiving Warfarin Potential Confounders Prior event in the previous 3 years of cohort entry - prior gastrointestinal bleeding - prior intracerebral bleeding Number of prescription drugs dispensed in the year before cohort entry Drug use in the 120 days preceding the event - Aspirin - Clopidogrel - Ticlopidine - Nonsteroidal anti-inflammatory drugs - COX-2 inhibitors - Cytochrome P450 2C9 inhibitors (amiodarone, losartan, tolbutamide, cimetidine, fluvastatin, fluconazole) - Cytochrome P450 2C9 inducers (rifampin, phenytoin) - Fibrates - Digoxin - Diuretics - -blockers - Calcium channel blockers - Angiotensin-converting enzyme inhibitors - Angiotensin receptor blockers - Systemic antibiotics - Corticosteroids - Gastroprotective drugs COX-2 ⫽ cyclooxygenase-2. References 1. Briel M, Studer M, Glass TR, Bucher HC. Effects of statins on stroke prevention in patients with and without coronary heart disease: a meta-analysis of randomized controlled trials. Am J Med. 2004;117: 596-606. 2. Cheung BMY, Lauder IJ, Lau C-P, Kumana CR. Meta-analysis of large randomized controlled trials to evaluate the impact of statins on cardiovascular outcomes. Br J Clin Pharmacol. 2003;57:640-651. 3. Tu JV, Gong Y. Trends in treatment and outcomes for acute stroke patients in Ontario, 1992-1998. Arch Intern Med. 2003;163;293-297. 4. Douketis JD, Arneklev K, Goldhaber SZ, et al. Ximelagatran versus warfarin: a comparison of bleeding outcomes in patients with nonvalvular atrial fibrillation. Arch Intern Med. 2006;166:853-859. 5. Szapary L, Horvath B, Marton Z, et al. Short-term effect of low-dose atorvastatin on haemorrheological parameters, platelet aggregation and endothelial function in patients with cerebrovascular disease and hyperlipidemia. CNS Drugs. 2004;18:165-172. 6. Undas A, Brummel KE, Musial J, Mann KG, Szceklik A. Simvastatin depresses blood clotting by inhibiting activation of prothrombin, Fac- 369.e14 7. 8. 9. 10. 11. 12. 13. 14. 15. 16. 17. tor V, and Factor XIII and by enhancing Factor Va inactivation. Circulation. 2001;103:2248-2253. Juurlink DN, Mamdani M, Kopp A, Laupacis A, Redelmeier DA. Drug-drug interactions among elderly patients hospitalized for drug toxicity. JAMA. 2003;289:1652-1658. Ray JG, Mamdani MM. Statins and the risk of idiopathic venous thromboembolism. Br J Clin Pharmacol. 2003;50:460. Mamdani MM, van Walraven C, Bica A, Williams JI, Naylor CD. Is there an association between lipid-lowering drugs and cholecystectomy? Am J Med. 2000;108:418-421. Lubin JH, Gail MH. Biased selection of controls for case-control analyses of cohort studies. Biometrics. 1984;40:63-75. Langholz B. Case-control study, nested. In: Armitage P, Colton C, eds. Encyclopedia of Biostatistics. Chichester, England: John Wiley & Sons Ltd; 1998;514-519. Michalets E. Update: clinically significant cytochrome P-450 drug interactions. Pharmacotherapy. 1998;18:84-112. Bravo G, Dubois MF, Hebet R, De Wals P, Messier L. A prospective evaluation of the Charlson Comorbidity Index for use in long-term care patients. J Am Geriatr Soc. 2002;50:740-745. Schneeweiss S, Seeger JD, Maclure M, Wang PS, Avorn J, Glynn RJ. Performance of comorbidity scores to control for confounding in epidemiologic studies using claims data. Am J Epidemiol. 2001;154:854-864. Banerjee S, Denniston AK, Gibson JM, Dodson PM. Does cardiovascular therapy affect the onset and recurrence of preretinal and vitreous haemorrhage in diabetic eye disease? Eye. 2004;18:821-825. Tseng M-Y, Czosnyka M, Richards H, Pickard JD, Kirkpatrick PJ. Effects of acute treatment with pravastatin on cerebral vasospasm, autoregulation, and delayed ischemic deficits after aneurysmal subarachnoid hemorrhage. Stroke. 2005;36:1627-1632. Parra A, Kreiter KT, Williams S, et al. Effect of prior statin use on functional outcome and delayed vasospasm after acute aneurysmal subarachnoid hemorrhage: a matched controlled cohort study. Neurosurgery. 2005;56:476-484. The American Journal of Medicine, Vol 120, No 4, April 2007 18. Singhal AB, Topcuoglu MA, Dorer DJ, Ogilvy CS, Carter BS, Koroshetz WJ. SSRI and statin use increases the risk for vasospasm after subarachnoid hemorrhage. Neurology. 2005;64:1008-1013. 19. Tirschwell DL, Longstreth WT Jr. Validating administrative data in stroke research. Stroke. 2002;33:2465-2470. 20. Rosamond WD, Folsom AR, Chambless LE, et al. Stroke incidence and survival among middle-aged adults: 9-year follow-up of the Atherosclerosis Risk in Communities (ARIC) cohort. Stroke. 1999;30: 736-743. 21. Leone MA, Capponi A, Varrasi C, Tarletti R, Monaco F. Accuracy of the ICD-9 codes for identifying TIA and stroke in an Italian automated database. Neurol Sci. 2004;25:281-288. 22. Broderick J, Brott T, Kothari R, et al. The Greater Cincinnati/Northern Kentucky Stroke Study: preliminary first-ever and total incidence rates of stroke among blacks. Stroke. 1998;29:415-421. 23. Cattaruzzi C, Troncon MG, Agostinis L, Garcia Rodriguez LA. Positive predictive value of ICD-9th codes for upper gastrointestinal bleeding and perforation in the Sistema Informativo Sanitario Regionale database. J Clin Epidemiol. 1999;52:499-502. 24. Raiford DS, Perez GS, Garcia Rodriguez LA. Positive predictive value of ICD-9 codes in the identification of cases of complicated peptic ulcer disease in the Saskatchewan hospital automated database. Epidemiology. 1996;7:101-104. 25. Cardiovascular Health and Services in Ontario: An ICES Atlas. Toronto, Canada: Institute for Clinical Evaluative Sciences; 1999. 26. Andrus MR. Oral anticoagulant drug interactions with statins: case report of fluvastatin and review of the literature. Pharmacotherapy. 2004;24:285-290. 27. Kucher N, Connolly S, Beckman JA, et al. International normalized ratio increase before warfarin-associated hemorrhage: brief and subtle. Arch Intern Med. 2004;164:2176-2179. 28. Fanikos J, Grasso-Correnti N, Shah R, Kucher N, Goldhaber SZ. Major bleeding complications in a specialized anticoagulation service. Am J Cardiol. 2005;96:595-598. The American Journal of Medicine (2007) 120, e1-e2 CLINICAL COMMUNICATION TO THE EDITOR An Unusual Case of Dysphagia and Chest Pain in a Non–HIV Patient: Esophageal Tuberculosis CASE REPORT A 25-year-old woman presented with substernal chest pain and dysphagia lasting 4 days. The patient described the pain as a sharp substernal pain with no radiation. Pain intensity only increased by swallowing food. She also reported a 2.5-kg weight loss in the past 3 months. The patient immigrated to the United States from India approximately 10 years previously. Physical examination revealed a temperature of 97.7°F, blood pressure of 138/86 mm Hg, heart rate of 94 beats/min, and respiratory rate of 18 breaths/min. Chest, heart, and abdominal examination results were unremarkable. Laboratory investigation revealed a white blood cell count of 6.7 103/mL, hemoglobin level of 13 Requests for reprints should be addressed to Bobbak Vahid, MD, 834 Walnut Street, Suite 650, Philadelphia, PA 19107. E-mail address: [email protected]. Figure 1 g/dL, and normal blood chemistry. Human immunodeficiency virus screening antibody was negative. A computed tomography scan of the chest was performed showing a subcarinal mass with a hypodense center that was inseparable from the esophagus (Figure 1). Flexible esophagoscopy showed a single deep linear ulcer in the middle third of the esophagus. A biopsy of the subcarinal mass showed a necrotizing granulomatous inflammation. Tissue cultures grew Mycobacterium tuberculosis complex. The diagnosis of esophageal tuberculosis was made. A gastrostomy tube was placed, and treatment with isoniazid, rifampin, ethambutol, and pyrazinamide was started. DISCUSSION Esophageal tuberculosis is rare. In autopsy studies, esophageal involvement was found in only 0.15% of patient who died of tuberculosis.1 The primary esophageal tuberculosis is defined as esophageal involvement with no other systemic manifestation of tuberculosis. Primary esophageal tuberculosis is rare, because squamous epithelium and peristalsis of esophagus have a strong protective effect against tuberculosis.2 Secondary esophageal tuberculosis is more common. Secondary esopha- CT scan of chest showing subcarinal mass with hypodense center involving the esophagus (arrow). 0002-9343/$ -see front matter © 2007 Elsevier Inc. All rights reserved. e2 geal tuberculosis can occur because of direct extension of mediastinal, pulmonary, and spinal tuberculosis.3 The symptoms of esophageal tuberculosis include dysphagia, odynophagia, chest pain, low-grade fever, and weight loss.2,4 Infection with human immunodeficiency virus, immunosuppressive therapy, and immigration from tuberculosis-endemic areas are risk factors for esophageal tuberculosis.5 The reported complications of esophageal tuberculosis are aspiration pneumonia,6 fatal hematemesis,6 esophagotracheal fistula,5 esophagomediastinal fistula,5 traction diverticula,3 and esophageal strictures.3 Approximately 65% of patients with esophageal tuberculosis have nonspecific findings on chest radiograph suggestive of tuberculosis. Enlarged lymph nodes with a hypodense center on computed tomography scan of the chest that are characteristic of tuberculous lymphadenitis were observed in the majority of these patients.3 Diagnosis of esophageal tuberculosis can be made by esophagoscopy or biopsy of associated mediastinal lymphadenopathy.4 A differential diagnosis of esophageal tuberculosis includes esophageal carcinoma, Crohn’s disease,7 moniliasis, actinomycosis, syphilis, and esophageal injury secondary to ingestion of caustic material.8 Treatment of esophageal tuberculosis with antituberculous antibiotics and surgical repair has been reported to be effective.8 Even the patients with esophageal tuberculosis complicated with esophagotracheal and esophagomediastinal fistulas were safely treated with antituberculous antibiotics alone.5 In patients with a risk factor for tuberculosis, esophageal tuberculosis should be included in the differential diagnosis of dysphagia and odynophagia even despite its rarity. The American Journal of Medicine, Vol 120, No 4, April 2007 Bobbak Vahid, MD Department of Pulmonary and Critical Care Medicine Thomas Jefferson University Hospital Philadelphia, Penn Nazmul Huda, MD Ali Esmaili, MD Department of Medicine Thomas Jefferson University Hospital Philadelphia, Penn doi:10.1016/j.amjmed.2005.12.026 References 1. Fujiwara T, Yoshida Y, Yamada S, et al. A case of primary esophageal tuberculosis diagnosed by identification of Mycobacteria in paraffinembedded esophageal biopsy specimens by polymerase chain reaction. J Gastroenterol. 2003;38:74-78. 2. Malathi S, So S. Esophageal tuberculosis. Indian J Pediatr. 2004;71: 457-458. 3. Nagi B, Lal A, Kochhar R, et al. Imaging of esophageal tuberculosis: a review of 23 cases. Acta Radiol. 2003;44:329-333. 4. Mokoena T, Shama DM, Ngakane H, Bryer JV. Oesophageal tuberculosis: a review of eleven cases. Postgrad Med J. 1992;68:110-115. 5. Devarbhavi HC, Alvares JF, Radhikavedi M. Esophageal tuberculosis associated with esophagotracheal or esophagomediastinal fistula: report of 10 cases. Gastrointest Endosc. 2003;57:588-592. 6. Abid S, Jafri W, Hamid S, et al. Endoscopic features of esophageal tuberculosis. Gastrointest Endosc. 2003;57:759-762. 7. Griga T, Duchna HW, Orth M, et al. Tuberculous involvement of the oesophagus with oesophagobroncheal fistula. Dig Liver Dis. 2002;34: 528-531. 8. Fang H, Lin T, Cheng C, et al. Esophageal tuberculosis: a rare presentation with massive hematemesis. Ann Thorac Surg. 1999;68:23442346. The American Journal of Medicine (2007) 120, e3-e4 ERRATA Due to technical difficulties with The American Journal of Medicine Website, the authors for several articles were correctly listed in the print journal but were incorrect on the Journal’s Website. INCORRECT INTERNET CITATIONS Wiener CM, Antonarakis ES, Wung PK, Durand DJ, Leyngold I, Meyerson DA. An Atypical Complication of Atypical Pneumonia. Am J Med. 2006;119: 824-827. Wiener CM, Burris G, Fraig M, Judson MA. Trouble Below the Surface. Am J Med. 2006;119:828-831. Wiener CM, Huston KK, Nielsen ME, Gelber AC. High Pressure Surgery. Am J Med. 2006;119:740-742. Pendleton RC, Rodgers GM, Wiener CM. A Necessary Detour. Am J Med. 2006;119:651-653. Scialla JJ, Hemmes AR, Wiener CM. A Pressing Situation. Am J Med. 2005;118:1347-1349. Aull FB, Mathiasen H. What can poetry teach physicians? Am J Med. 2005;118:1310. Stephens S, Brown CD, Wiener CM. Host to an Intruder. Am J Med. 2005;118:1102-1104. Leary P, Dunbar K, Wiener CM. A Very Close Call. Am J Med. 2005;118:968-971. Chen TM, Paniker P. A Much-Delayed Complication. Am J Med. 2005;118:833-835 Faris JE, Brown CD, Wiener CM. Time Tells the Tale. Am J Med. 2005;118:840-842. Gianankos D, Mathiasen H. The Sheila Experience. Am J Med. 2005;118:934. Antonovich DD, Callen JP, Paniker P. No Walk in the Park. Am J Med. 2005;118:715-716. Makaryus AN, Friedman GH, Bettmann MA. Single coronary artery. Am J Med. 2005;118:717. Helton, TJ, Bavry AA, Indik JH. Acute Myocardial Infarction. Am J Med. 2005;118:718-719. Scialla TJ, Cavanaugh KL, Wiener, CM. The Rare Needle in a Diagnostic Haystack. Am J Med. 2005;118:720-722. Roberts K, Mathiasen H. Walt Whitman, Civil War Nurse. Am J Med. 2005;118:787. Chen TM, Paniker P. An Unpleasant Momento. Am J Med. 2005;118:604-605. 0002-9343/$ -see front matter © 2007 Elsevier Inc. All rights reserved. S0002-9343(07)00098-8 Hsiao E, Charles R, Magid C, Nivatpumin P, Wiener CM. An Unusual Development. Am J Med. 2005;118: 609-611. Tauscher A, Paniker P. Rapid Resolution of a Common Problem. Am J Med. 2005;118:475-476. Ko N, Averett L, Brown C, Wiener CM. An Unexpected Finding. Am J Med. 2005;118:477-479. Stephens, RS, Brown C, Wiener CM. Persistent Lower Abdominal and Groin Pain: What Is the Diagnosis? Am J Med. 2005;118:364-367. Scatena L, Paniker P. What Triggered This Sudden Eruption? Am J Med. 2005;118:362-363. CORRECTED CITATIONS Antonarakis ES, Wung PK, Durand DJ, Leyngold I, Meyerson DA. An Atypical Complication of Atypical Pneumonia. Am J Med. 2006;119:824-827. Burris G, Fraig M, Judson MA. Trouble Below the Surface. Am J Med. 2006;119:828-831. Huston KK, Nielsen ME, Gelber AC. High Pressure Surgery. Am J Med. 2006;119:740-742. Pendleton RC, Rodgers GM. A Necessary Detour. Am J Med. 2006;119:651-653. Scialla JJ, Hemmes AR. A Pressing Situation. Am J Med. 2005;118:1347-1349. Aull FB. What can poetry teach physicians? Am J Med. 2005;118:1310. Stephens S, Brown CD. Host to an Intruder. Am J Med. 2005;118:1102-1104. Leary P, Dunbar K. A Very Close Call. Am J Med. 2005;118:968-971. Chen TM. A Much-Delayed Complication. Am J Med. 2005;118:833-835 Faris JE, Brown CD. Time Tells the Tale. Am J Med. 2005;118:840-842. Gianankos D. The Sheila Experience. Am J Med. 2005;118:934. Antonovich DD, Callen JP. No Walk in the Park. Am J Med. 2005;118:715-716. Makaryus AN, Friedman GH. Single coronary artery. Am J Med. 2005;118:717. e4 Helton, TJ, Bavry AA. Acute Myocardial Infarction. Am J Med. 2005;118:718-719. Scialla TJ, Cavanaugh KL. The Rare Needle in a Diagnostic Haystack. Am J Med. 2005;118:720-722. Roberts K. Walt Whitman, Civil War Nurse. Am J Med. 2005;118:787. Chen TM. An Unpleasant Memento. Am J Med. 2005;118:604-605. Hsiao E, Charles R, Magid C, Nivatpumin P. An Unusual Development. Am J Med. 2005;118:609-611. The American Journal of Medicine, Vol 120, No 4, April 2007 Tauscher A. Rapid Resolution of a Common Problem. Am J Med. 2005;118:475-476. Ko N, Averett L, Brown C. An Unexpected Finding. Am J Med. 2005;118:477-479. Stephens, RS, Brown C. Persistent Lower Abdominal and Groin Pain: What Is the Diagnosis? Am J Med. 2005;118:364-367. Scatena L. What Triggered This Sudden Eruption? Am J Med. 2005;118:362-363. The American Journal of Medicine (2007) 120, e5 LETTER Dosing Frequency of Aspirin and Prevention of Heart Attacks and Strokes suggested by others,8,9 are warranted to see whether such an approach might help prevent additional MI and stroke. John K. Amory, MD David W. Amory, MD, PhD To the Editor: We enjoyed the review by Dalen1 regarding the use of aspirin in the prevention of myocardial infarction (MI) and stroke and would like to raise the issue of dosing frequency in the discussion of the ideal aspirin regimen. Because aspirin irreversibly acetylates platelet cyclooxygenase-1, it prevents platelet activation and aggregation for the lifespan of the platelets (10 days), and it accomplishes this within 60 minutes of dosing.2 However, because approximately 10% of the circulating platelet pool is replenished daily and the serum-half life of aspirin is only a few hours, once-daily aspirin dosing has the potential to leave a significant fraction of the platelet pool uninhibited, especially 24 hours after dosing. Moreover, it has been shown that the presence of as little as 10% to 15% of platelets with normal cyclooxygenase-1 activity may result in normal hemostasis.3-5 Therefore, it seems possible that 81 mg twice-daily dosing of aspirin may be superior to once-daily dosing, because it would reduce the percentage of uninhibited platelets in the circulation. This could be an important issue because there is an increased incidence of both MI6 and stroke7 in the early morning hours when platelet aggregability and blood pressure are highest—and usually close to 24 hours after most patients have taken their once-daily dose of aspirin. Future studies of once versus twice-daily aspirin therapy, as 0002-9343/$ -see front matter © 2007 Elsevier Inc. All rights reserved. University of Washington, Seattle doi:10.1016/j.amjmed.2006.04.023 References 1. Dalen JE. Aspirin to prevent heart attack and stroke: what’s the right dose? Am J Med. 2006:119:198-202. 2. Patrono C, Coller B, FitzGerald GA, et al. Platelet-active drugs: the relationship among dose, effectiveness and side effects. Chest. 2004; 126:234S-264S. 3. DiMinno G, Silver MJ, Murphy S. Monitoring of the entry of new platelets into the circulation after ingestion of aspirin. Blood. 1983;61: 1081-1085. 4. Patrono C, Ciabattoni G, Patrignani P, et al. Clinical pharmacology of platelet cyclooxygenase inhibition. Circulation. 1985;72:1177-1184. 5. Catella-Lawson F, Reilly MP, Kapoor SC, et al. Cyclooxygenase inhibitors and the antiplatelet effects of aspirin. N Engl J Med. 2001;345: 1809-1817. 6. Ridker PM, Manson JE, Buring JE, et al. Circadian variation of acute myocardial infarction and the effect of low-dose aspirin in a randomized trial of physicians. Circulation. 1990;82:897-902. 7. Elliott WJ. Circadian variation in the timing of stroke onset. A metaanalysis. Stroke. 1998;29:992-996. 8. Krizbacher I, Koppan M, Bodis J. Aspirin for stroke prevention taken in the evening? Stroke. 2004;35:2760-2761. Letter to the Editor. 9. Krizbacher I, Ajtay Z, Koppan M, Bodis J. Can the time of taking aspirin influence the frequency of cardiovascular events? Am J Cardiol. 2005;96:608-610. The American Journal of Medicine (2007) 120, e7 LETTER The Reply: Amory and Amory raise some important issues regarding the dosing of aspirin. I agree that a clinical trial of aspirin 81 mg twice per day versus 162 mg once per day versus placebo would be of great interest. An appropriate trial would be for primary prevention of myocardial infarction in women aged more than 50 years. All the previous trials of primary prevention in women have used doses of aspirin of 100 mg per day or less, and they have failed to prevent myocardial infarction.1 0002-9343/$ -see front matter © 2007 Elsevier Inc. All rights reserved. James E. Dalen, MD, MPH Associate Editor American Journal of Medicine Tucson, Ariz doi:10.1016/j.amjmed.2006.05.023 Reference 1. Berger JS, Roncaglioni MC, Avanzini F, et al. Aspirin for the primary prevention of cardiovascular events in women and men. JAMA. 2006; 295:306-313. The American Journal of Medicine (2007) 120, e9 LETTER Enteric Coated Aspirin To the Editor: The review “Aspirin to Prevent Heart Attack and Stroke: What’s the Right Dose?” by Dalen1 was welcome. It presented more facts than “fiction,” not always found in the literature on the use of acetylsalicylic acid (ASA). Missing was a mention of enteric-coated acetylsalicylic acid (ECASA). As a long-time student of ASA therapy (⬃70 years) and a still-working, long-time practitioner (60 years) using ASA in large numbers of patients (first with some food and in the last 25 years as ECASA), I have yet to see an acute gastrointestinal bleed that clearly resulted from ECASA use. Perhaps such events occurred, and the patients decided to see other doctors. Twenty-five years ago it was established endoscopically in young volunteers that ECASA caused far less gastric irritation and ulceration than ASA. It may be of interest that during a visit to Berlin, Ger- 0002-9343/$ -see front matter © 2007 Elsevier Inc. All rights reserved. many, in 1995, a search of a large drug formulary yielded no information about ECASA. When “magen” (German for stomach) was searched, there was indeed a mention of ECASA. It has been mentioned in the literature that a study of ECASA in continental Europe was limited by the fact that it was not used in Sweden or Hungary. In a letter to Lancet in 1994,2 it was pointed out that no reports of significant gastrointestinal bleeding (compared with placebos) were found. Charles M. Grossman, MD Legacy Health System Department of Medicine Portland, Ore doi:10.1016/j.amjmed.2006.04.033 References 1. Dalen JE. Aspirin to prevent heart attack and stroke: what’s the right dose? Am J Med. 2006;119:198-202. 2. Grossman CM. NSAIDS and gut toxicity. (Letters). Lancet. 1994;344:57. The American Journal of Medicine (2007) 120, e11 LETTER Prehypertension and Elevated Risk of Cardiovascular Disease: Physiopathologic Mechanisms To the Editor: Kshirsagar and colleagues1 recently reported a strong association between prehypertensive blood pressure levels and cardiovascular disease. Perhaps a recent study of ours could cast some light on the mechanism underlying the increased risk of cardiovascular disease in subjects with prehypertensive blood pressure levels.2 We performed Doppler echocardiography and submaximal bicycle ergometry in 20 nonsmoking, sedentary, prehypertensive subjects and in 20 age, sex-matched, nonsmoking, sedentary, normotensive subjects to investigate the association between the systolic blood pressure response to exercise (SBPRE) and hypertensive target organ damage. An exaggerated SBPRE and a normal SBPRE were diagnosed from the mean ⫹2 standard deviation of systolic blood pressure at 100 Watts in normotensive subjects. This workload may be considered to reflect normal daily activities. As expected, resting blood pressure and systemic vascular resistance were higher in prehypertensive subjects. Approximately half the latter group had an exaggerated SBPRE. There were no differences in age, gender, body mass index, or glycemia and lipid levels between normotensive and prehypertensive subjects either with an exaggerated SBPRE or normal SBPRE. Resting blood pressure and systemic vascular re- 0002-9343/$ -see front matter © 2007 Elsevier Inc. All rights reserved. sistance were similarly increased in prehypertensive subjects irrespective of SBPRE versus normotensive subjects. Compared with normotensive subjects, prehypertensive subjects with an exaggerated SBPRE had a significantly greater left ventricular relative wall thickness, mostly because of a small cavity, a significantly longer left ventricular isovolumic relaxation time, and a significantly greater global arterial stiffness, as estimated by pulse pressure/left ventricular stoke volume ratio. These findings suggest that an exaggerated SBPRE is frequent among prehypertensive subjects and is associated with cardiovascular remodeling, which may herald cardiovascular disease. This findings provide a link between prehypertension and elevated risk of cardiovascular disease. Flora Affuso, MD Antonio Ruvolo, MD Serafino Fazio, MD Department of Internal Medicine Federico II University of Naples Naples, Italy doi:10.1016/j.amjmed.2006.02.032 References 1. Kshirsagar AV, Carpenter M, Bang H, Wyatt SB, Clindres RE. Blood pressure usually considered normal is associated with an elevated risk of cardiovascular disease. Am J Med. 2006;119:133-141. 2. Fazio S, Palmieri EA, Izzo R, et al. An exaggerated systolic blood pressure response to exercise is associated with cardiovascular remodeling in subjects with prehypertension. Ital Heart J. 2005;6(11):886-892. The American Journal of Medicine (2007) 120, e13 LETTER The Safety of Levofloxacin in Patients on Warfarin To the Editor: We would like to commend Stroud and colleagues for their excellent work regarding the safety of levofloxacin use in elderly patients on warfarin.1 Their large populationbased study attempts to rectify the conflicting evidence regarding the warfarin-levofloxacin interaction. They correctly note that prior case reports and case series appear to contradict data from more controlled trials. They also note a paucity of studies evaluating this interaction in acutely ill individuals, their so-called “real-world practice.” We have recently published data on the impact of the addition of antibiotics to warfarin in a real-world setting by studying acutely ill patients who were on stable warfarin doses and had stable international normalized ratios (INRs).2 In our retrospective cohort study, the incidence of supratherapeutic INR was 33% in those who were given levofloxacin (n ⫽ 27) with a mean increase in INR of .85. Nineteen percent and 11% of patients had an elevation of their INR to ⬎ 4.0 and ⬎ 5.0, respectively. Consequently, our study and that of others clearly suggest that there is an interaction in terms of elevation of INRs. There are several limitations to Stroud et al’s study that may have contributed to their negative findings. First, their study design does not allow for knowledge of laboratory monitoring either before or after commencement of the antibiotic and as such the stability of the patients’ anticoagulation. Second, they were unable to document potential anticipatory dosing changes (ie, lowering of warfarin doses) or more frequent monitoring after adding an antibiotic. It is possible that the reason patients did not bleed was not because of a lack of interaction but rather because of increased monitoring and dose adjustments. Third, significant elevations of the INR may have occurred, which may not have led to hospitalization for bleeding, but still put the 0002-9343/$ -see front matter © 2007 Elsevier Inc. All rights reserved. patient at higher risk for a hemorrhagic complication. Fourth, the study database did not evaluate emergency department or clinic visits, so it is possible that some less severe hemorrhages were missed. Finally, it is also possible that co-existing medication changes around the time of illness could have reduced the hypoprothrombinemic effects of warfarin, thus offsetting the potentiating effects of levofloxacin. Even though our data, like Stroud and colleagues’, did not demonstrate an increase in hemorrhagic events, this likely relates to the small sample size (warfarin and levofloxacin users) in both studies. Still, we did show a very significant increase in INR, which is a strong risk factor for warfarin-related bleeding, and we believe that the remaining body of literature still strongly supports the interaction between warfarin and levofloxacin in acutely ill patients. Thus, the results of this research should not alter the clinical dictum that close monitoring of INR levels after the addition of any medication, including quinolone antibiotics, is mandatory. Jeffrey J. Glasheen, MD Division of General Internal Medicine Department of Medicine University of Colorado at Denver Health Sciences Center Allan V. Prochazka, MD, MSc Division of General Internal Medicine Department of Medicine Denver VA Medical Center University of Colorado at Denver Health Sciences Center doi:10.1016/j.amjmed.2006.02.034 References 1. Stroud LF, Mamdami MM, Kopp A, Bell CM. The safety of levofloxacin in elderly patients on warfarin. Am J Med. 2005;118:1417.e71417.e12. 2. Glasheen JJ, Fugit RV, Prochazka AV. The risk of overanticoagulation with antibiotic use in outpatients on stable warfarin regimens. J Gen Intern Med. 2005;20:653-656. The American Journal of Medicine (2007) 120, e15-e16 LETTER The Reply: Glasheen and Prochazka highlight some limitations that they suggest explain our study’s negative findings.1 Specifically, they describe the absence of clinical information and our inability to document warfarin dose changes. They posit that co-existing medication changes may have had a protective effect on patients and our failure to include less severe patient outcomes could have biased the findings. The administrative data we used was detailed, but we were unable to control for changes in drug dosage or patient monitoring. Indeed, significant elevations in international normalized ratio (INR) could have occurred in many patients. However, the association between INR and hemorrhage is not perfect. First, assessing the effect of INR level is problematic unless data are available for the time period just preceding and at the time of the bleed. This is often not feasible, even in prospective trials.2 Second, the INR level may increase as a consequence of bleeding. Therefore, data at the time of the hemorrhage may not reflect the effect of over-anticoagulation. Third, bleeding can occur irrespective of the INR level, whether supra-therapeutic (⬎4.5) or subtherapeutic (⬍2.0).3,4 Moreover, our model incorporated drugs interacting with warfarin. Finally, our analysis did control for physician consultations to address the intensity of anticoagulation monitoring. Including less severe outcomes such as clinic appointments or emergency department visits may have captured more adverse events and increased statistical power. However, we could then be criticized for heterogeneous composite endpoints that include diverse severity levels ranging from an added physician visit to death (considerably different outcomes when considering a patient’s perspective). Had we demonstrated an adverse effect in this circumstance, others might argue for more severe clinically relevant endpoints. Glasheen and Prochazka also compare their study results with our work.5 Some of the variation in findings may relate to the different designs, choice of comparators, and statistical power. Our study used a population-based, nested case-control method. There were 4269 people who were on chronic warfarin therapy matched to 17,048 control patients requiring treatment with an antibiotic for similar disease indications. We accounted for many covariates. In contrast, 0002-9343/$ -see front matter © 2007 Elsevier Inc. All rights reserved. Glasheen et al used a cohort from a single Veteran’s Affairs Center. They assessed INR levels in 27 patients on warfarin also prescribed levofloxacin. They compared their findings with 3 other antibiotics that also demonstrated significant INR elevations (possibly implicating the effect of the illness). Further, most patients had no significant INR elevation. No hemorrhagic outcomes were observed. We are unsure whether the main reason both our studies did not demonstrate increased hemorrhagic events for patients prescribed levofloxacin while on warfarin is due to small sample size. Indeed, it is difficult to detect these events in population-based research. However, we were able to demonstrate an effect in patients prescribed cefuroxime, a drug with no previous reports of warfarin interaction. Much of the criticism raised by Glasheen and Prochazka, such as warfarin dosing, INR monitoring, and interacting drugs, are part of usual clinical practice. By including them in a real-world analysis, we maximize the generalizability of our findings. Still, we agree with their caution that patients on warfarin should be closely monitored after the addition of any medication. Chaim M. Bell, MD, PhDa,b Lynfa F. Stroud, MDc Alex Kopp, BAd Muhammad M. Mamdami, PharmD, MA, MPHe,f a Departments of Medicine and Health Policy Management and Evaluation University of Toronto b The institute for Clinical Evaluative Sciences Department of Medicine St. Michael’s Hospital Toronto, Canada c Department of Medicine University of Toronto Toronto, Canada d The Institute for Clinical Evaluative Sciences Toronto, Canada e Department of Pharmacy University of Toronto Toronto, Canada f Pfizer Inc. New York, New York doi:10.1016/j.amjmed.2006.06.030 e16 References 1. Stroud LF, Mamdami MM, Kopp A, Bell CM. The safety of levofloxacin in elderly patients on warfarin. Am J Med. 2005;118:1417.e71417.e12. 2. Douketis JD, Arneklev K, Goldhaber SZ, et al. Comparison of bleeding in patients with nonvalvular atrial fibrillation treated with ximelagatran or warfarin: assessment of incidence, case-fatality rate, time course and sites of bleeding, and risk factors for bleeding. Arch Intern Med. 2006;166:853-859. The American Journal of Medicine, Vol 120, No 4, April 2007 3. Kucher N, Connolly S, Beckman JA, et al. International normalized ratio increase before warfarin-associated hemorrhage: brief and subtle. Arch Intern Med 2004;164:2176-2179. 4. Fanikos J, Grasso-Correnti H, Shah R, et al. Major bleeding complications in a specialized anticoagulation service. Am J Cardiol. 2005;96: 595-598. 5. Glasheen JJ, Fugit RV, Prochazka AV. The risk of overanticoagulation with antibiotic use in outpatients on stable warfarin regimens. J Gen Intern Med. 2005;20:653-656. The American Journal of Medicine (2007) 120, e17-e18 LETTER Porcelain Gallbladder and Cancer: Ethnicity Explains a Discrepant Literature? Table 2 Two-by-Two Table Comparing Risk of Cancer According to Ethnicity To the Editor: Lee and colleagues1 are to be congratulated for an eloquent report of a case of porcelain gallbladder. Citing 2 recent studies, they discuss the possibility that the rate of gallbladder cancer occurring in calcified (porcelain) gallbladders is lower than previously thought (0%2-5%3 vs 12%4-62%5). However, 2 important aspects of this sparse and inconsistent literature warrant further comment. First, the conclusions of 2 recent cited studies suggesting that the incidence of cancer does not depend on the presence of porcelain gallbladder should be regarded with caution. Although the number of patients undergoing cholecystectomy in those North American studies was 5- to 10-fold larger than in the largest older study (South American),5 the number of patients with porcelain gallbladders was actually smaller in the North American studies compared with the South American study. In such a small cohort (17 patients as in 1 North American study), for example, the reported rate of cancer per porcelain gallbladder would increase from 0% to 6% or 12% if just 1 or 2 additional patients were diagnosed with cancer, approaching the rate of the older studies and rendering their conclusion incorrect.2 The second point regards a possible explanation for the inconsistent literature. Consider the hypothesis that recent North American investigators,2,3 conducting well-designed retrospective studies, found such different rates compared with those reported previously because of the influence of ethnic differences between cohorts, a factor that is known to Table 1 First Author 5 Etala Ashur7 Shimizu8* Kane9 Cornell4 Stephen3 Towfigh2 Cancer No cancer Total Asia/Latin America US Total 20 32 52 6 51 57 26 83 109 By a Fisher exact test (2-tail), P ⫽ .0007. affect the rate of gallbladder cancer.6 Table 1 shows a global review of the rates of cancer in porcelain gallbladders according to the ethnicity of the patient population reported. By a Fisher exact test comparing the rate of cancer in patients with porcelain gallbladder in North America versus Asia or Latin America, ethnicity is associated with the presence of cancer occurring in a porcelain gallbladder (Table 2) (P ⫽ .0007). This statistic is even more significant when nonsystematic case series are excluded, considering only the formal cholecystectomy series and holds regardless of whether the cases in the Stephen study are counted as porcelain gallbladders (0% rate of concomitant cancer in their study) or selective mucosal calcification (5% rate of concomitant cancer). Certainly, the reason that more recent series have reported lower rates of cancer in patients with porcelain gallbladder could be the more careful and systematic nature of recent studies of large patient cohorts or the fact that the diseased organs are being recognized earlier with widely available computed tomography scanning. Global Review of Cancer Occurring in Porcelain Gallbladders Year County N Cholecystectomies N Porcelain N Cancer Cancer/Porcelain 1962 1978 1989 1984 1959 2001 2001 Argentina Israel Japan US US US US 1786 NSCS NSCS NSCS 45 25,900 10,741 26 5 21 9 16 17 15 16 1 3 4 2 0 0 62% 20% 14% 44% 13% 0% 0% NSCS ⫽ nonsystematic case series. *Nine cases from the US literature9 are excluded, leaving 21 Japanese cases. 0002-9343/$ -see front matter © 2007 Elsevier Inc. All rights reserved. e18 The American Journal of Medicine, Vol 120, No 4, April 2007 The patient reported by Lee and colleagues1 proceeded through uneventful cholecystectomy. Discussions of decreased cancer risk in porcelain gallbladders, such as by Lee and colleagues, have led others to conclude that routine cholecystectomy may not be indicated for asymptomatic patients with porcelain gallbladder.2,3 We believe that when counseling patients regarding the possibility that they harbor an occult gallbladder carcinoma within a porcelain gallbladder, physicians should consider ethnicity. Steven C. Cunningham, MD H. Richard Alexander, MD Department of Surgery University of Maryland Medical Center Baltimore doi:10.1016/j.amjmed.2006.05.028 References 1. Lee TC, Liu KL, Lai IR, Wang HP. Diagnosing porcelain gallbladder. Am J Med. 2005;118:1171-1172. 2. Towfigh S, McFadden DW, Cortina GR, et al. Porcelain gallbladder is not associated with gallbladder carcinoma. Am Surg. 2001;67:7-10. 3. Stephen AE, Berger DL. Carcinoma in the porcelain gallbladder: a relationship revisited. Surgery. 2001;129:699-703. 4. Cornell CM, Clarke R. Vicarious calcification involving the gallbladder. Ann Surg. 1959;149:267-272. 5. Etala E. [Gallbladder cancer]. Prensa Med Argent. 1962;49:2283-2299. 6. Lazcano-Ponce EC, Miquel JF, Munoz N, et al. Epidemiology and molecular pathology of gallbladder cancer. CA Cancer J Clin. 2001;51:349-364. 7. Ashur H, Siegal B, Oland Y, Adam YG. Calcified gallbladder (porcelain gallbladder). Arch Surg. 1978;113:594-596. 8. Shimizu M, Miura J, Tanaka T, Itoh H, Saitoh Y. Porcelain gallbladder: relation between its type by ultrasound and incidence of cancer. J Clin Gastroenterol. 1989;11:471-476. 9. Kane RA, Jacobs R, Katz J, Costello P. Porcelain gallbladder: ultrasound and CT appearance. Radiology. 1984;152:137-141. The American Journal of Medicine (2007) 120, 370-373 BRIEF OBSERVATION Late Diagnosis of HIV Infection: The Role of Age and Sex Michael J. Mugavero, MD, MHS,a Chelsea Castellano, BS,b David Edelman, MD, MHS,c,d Charles Hicks, MDb a Division of Infectious Diseases and International Health, Department of Medicine, University of Alabama at Birmingham; bDivision of Infectious Diseases and International Health, Department of Medicine, Duke University, Durham, NC; cCenter for Health Services Research in Primary Care, Durham VA Medical Center, Durham, NC; and dDivision of General Internal Medicine, Department of Medicine, Duke University, Durham, NC. ABSTRACT BACKGROUND: Late diagnosis of human immunodeficiency virus (HIV) infection is detrimental to infected persons and to the public health. The objective of this study was to identify factors associated with late diagnosis of HIV infection, defined as an initial CD4 count ⬍200 cells/L, in a cohort of recently diagnosed persons. Additionally, we evaluated factors associated with HIV infection being diagnosed during hospitalization. METHODS: This was a cross-sectional study of a university-based HIV clinic in the southeastern US. Patients with newly diagnosed HIV infection evaluated at the Duke University HIV clinic between October 2002 and August 2004 were included in this analysis. Socio-demographic variables, site of HIV diagnosis, opportunistic infections present at diagnosis, initial CD4 count, and initial HIV RNA level were recorded for study subjects. RESULTS: Forty-nine percent of subjects met the immunologic definition of AIDS at the time of HIV diagnosis (CD4 count ⬍200 cells/L). In multivariable logistic regression analyses, older patients were more likely to be diagnosed with a CD4 count ⬍200 cells/L (adjusted odds ratio [AOR] 1.72, 95% confidence interval [CI], 1.12-2.64, P ⫽ .01), and older patients (AOR 1.79, 95% CI, 1.07-3.12, P ⫽ .03) and women (AOR 6.74, 95% CI, 2.08-21.81, P ⫽ 0.001) were more likely to be diagnosed during hospitalization. CONCLUSIONS: Late diagnosis of HIV infection is a considerable problem, particularly for older patients. Inpatient diagnosis of HIV infection is significantly more common among women and older patients. Improved HIV testing strategies may allow for more timely diagnosis of HIV infection, which may benefit both the infected individual and society. © 2007 Elsevier Inc. All rights reserved. KEYWORDS: AIDS; Diagnosis; HIV; Prevention; Rural; South Highly active antiretroviral therapy (HAART) has proven effective in reducing morbidity and mortality associated with human immunodeficiency virus (HIV) infection.1 Despite increased availability of HAART in the United States, These data were presented in part at the 3rd International AIDS Society Conference on HIV Pathogenesis and Treatment in Rio de Janeiro, Brazil July 25-28, 2005. Supported by Agency for Healthcare Research and Quality (AHRQ) training Grant T32 HS000079 and NIH K24 Grant NIAID 5 K24 AI001608. Requests for reprints should be addressed to Charles Hicks, MD, Division of Infectious Diseases and International Health; Duke University Medical Center, Box 3360, Durham, NC 27710. E-mail address: [email protected] 0002-9343/$ -see front matter © 2007 Elsevier Inc. All rights reserved. doi:10.1016/j.amjmed.2006.05.050 many HIV-infected persons do not fully benefit from therapy due to late diagnosis. Approximately 25% of the estimated 1.1 million persons living with HIV in the United States are unaware they are HIV-infected.2 Further, recent data from the Centers for Disease Control and Prevention (CDC) indicate that approximately half the persons meeting the case definition for acquired immune deficiency syndrome (AIDS) had been diagnosed with HIV infection less than a year before their AIDS diagnosis.3 This late diagnosis of HIV infection is detrimental both to the individual and to the public health. Studies assessing factors associated with late presentation for HIV care have focused on patients living in large urban settings in the Northeast and West.4,5 However, the Mugavero et al Late Diagnosis of HIV Infection 371 South has the highest rates of new HIV infections and is RESULTS home to 39% of persons living with AIDS in the US.6 Data were available for 113 patients who met study incluAdditionally, some socio-demographic patient characterission criteria (Table 1). Initial CD4 counts were ⬍200 tics, such as rural living, are common in the South. Over two cells/L in 49% of subjects, and 35% were diagnosed durthirds of patients with AIDS and residing in non-metropoling hospitalization. itan areas live in the South.7 A study done over a decade ago Initial CD4 Count <200 showed that only 12% of reCells/L CLINICAL SIGNIFICANCE cently diagnosed HIV-infected In bivariable and multivariable patients in South Carolina had ● Forty-nine percent of recently diagnosed analyses, older patients were more 8 CD4 counts ⬍200 cells/L. HIV-infected patients had clinical or imlikely to be diagnosed with a CD4 This suggests that late diagnosis munologic AIDS (CD4 T lymphocyte count ⬍200 cells/L (adjusted was relatively infrequent in that count ⬍200 cells/L). odds ratio [AOR] 1.72, 95% conera. Much has changed in the fidence interval [CI], 1.12-2.64, past 10 years regarding features ● Older patients were more likely to have P ⫽ .01) (Table 2). of persons living with HIV/ an AIDS diagnosis at the time HIV was AIDS, including increased prevdiagnosed. HIV Diagnosis during alence rates among AfricanHospitalization ● Older patients and women were more Americans, Latinos, and In bivariable analysis, this outlikely to be diagnosed with HIV during women.6 Further, public health come was more common among hospitalization. funding has decreased over this older patients (P ⫽ .02), females period. Given the importance of ● These findings support the recent CDC (P ⬍.001), and minorities (P ⫽ .02). the timing of HIV diagnosis for call for routine, nationwide HIV testing In multivariable analysis, HIV dithe individual and the public in primary care settings. agnosis during hospitalization was health, an assessment of HIV dimore common among older paagnosis among a Southern cohort tients (AOR 1.79, 95% CI, 1.07in the current era seemed 3.12, P ⫽ .03) and females (AOR appropriate. METHODS Study Design We evaluated medical records of clinic patients initially presenting for care at the Duke University HIV clinic between October 2002 and August 2004. Persons whose HIV infection had been diagnosed within 6 months of presentation to the clinic were included in this analysis. Abstracted data included socio-demographic and clinical information. Non-Caucasians were classified as racial/ethnic minorities. Consistent with the CDC classification, persons not residing in a metropolitan statistical area (population ⬍50,000) were considered to reside in nonmetropolitan locales.6,7 Age was categorized in 10-year increments. The study was approved by the Duke University Institutional Review Board. Statistical Analysis Bivariable analyses were done using Pearson’s chi-square test and logistic regression. The study had two primary outcome measures; an initial CD4 count ⬍200 cells/L and an initial diagnosis of HIV infection during hospitalization. Multivariable logistic regression analyses were performed for both outcome variables. Predictor variables were identified a priori and included age, sex, race/ethnicity, insurance status, and nonmetropolitan residence. All statistical analyses were performed using SAS E-Guide Version 2.05 for Windows (SAS Institute, Cary, NC). Table 1 Patient Characteristics of 113 Recently Diagnosed HIV-Infected Subjects Establishing Care at the Duke University HIV Clinic Characteristic Age (range 17-61 years) Female Race Caucasian Minority* Unknown Reported mode of HIV acquisition Men who have sex with men Heterosexual contact Intravenous drug use Other/unknown Uninsured Non-metropolitan Site of diagnosis Inpatient HIV diagnosis Outpatient HIV diagnosis Unknown Opportunistic infection at diagnosis† HIV RNA ⬎100,000 copies/mL CD4 Lymphocyte count ⬍200 cells/L Mean ⫾ SD or Frequency (%) 36.1 ⫾ 10 31 (27.4%) 35 (31.0%) 71 (62.8%) 7 (6.2%) 33 32 8 40 44 32 (29.2%) (28.3%) (7.1%) (35.4%) (38.9%) (28.3%) 39 54 20 20 66 55 (34.5%) (47.8%) (17.7%) (17.9%) (58.9%) (48.7%) *87% African American, 10% Latino. †Opportunistic infections: Pneumocystis carinii pneumonia (PCP) 9, Cryptococcal meningitis 5, Lymphoma 2, Cryptosporidial diarrhea 1, CNS toxoplasmosis 1, Progressive multifocal leukoencephalopathy 1, Kaposi’s sarcoma 1. 372 Table 2 The American Journal of Medicine, Vol 120, No 4, April 2007 Bivariable and Multivariable Logistic Regression Analyses* CD4 Count ⬍200 cells/L (n ⫽ 113) Inpatient HIV Diagnosis (n ⫽ 93) Bivariable Analysis Bivariable Analysis Multivariable Analysis Characteristic OR (95% CI) Age† (range 17-61 years) Female Minority Uninsured Non-metropolitan 1.74 (1.16-2.60) .005 1.72 (1.12-2.64) .01 1.63 (1.07-2.56) 1.68 1.37 0.94 1.28 1.30 1.56 1.06 1.19 6.71 3.27 1.71 1.58 (0.73-3.88) (0.61-3.08) (0.44-2.00) (0.57-2.91) P-value OR (95% CI) .22 .45 .87 .55 (0.51-3.35) (0.63-3.87) (0.46-2.45) (0.49-2.87) P-value OR (95% CI) .59 .34 .89 .71 Multivariable Analysis P-value OR (95% CI) .02 (2.52-17.87) ⬍.001 (1.20-8.87) .02 (0.74-4.00) .21 (0.63-3.93) .33 P-value 1.79 (1.07-3.12) .03 6.74 2.63 2.99 1.32 .001 .10 .05 .61 (2.08-21.81) (0.82-8.43) (0.99-9.00) (0.44-3.99) *Variables associated with immunologic AIDS (CD4 count ⬍200 cells/L) and inpatient HIV diagnosis among 113 recently diagnosed HIV-infected subjects establishing care at the Duke University HIV Clinic. †Odds ratios for 10-year increase in age. 6.74, 95% CI, 2.08-21.81, P ⫽ .001), whereas lack of insurance was of borderline statistical significance (AOR 2.99, 95% CI, 0.99-9.00, P ⫽ 0.05) (Table 2). DISCUSSION Despite efforts to increase HIV prevention and awareness, half the recently diagnosed HIV-infected patients evaluated at a university-based HIV clinic in North Carolina had initial CD4 counts ⬍200 cells/L, compared with only 12% of those reported a decade earlier from South Carolina.8 This may relate to changes in socio-demographic characteristics among persons living with HIV/AIDS, such that persons now at greatest risk are less likely to be tested due to issues of stigma and lower perceived risk. The ready availability of effective antiretroviral medications may also play a role by providing a sense of security to at-risk populations, thereby reducing the urgency with which they seek HIV testing. Further, decreases in public health spending over this time may also contribute to this finding. Late diagnosis of HIV infection is detrimental both to the individual and to society. HIV-infected patients whose CD4 counts are below 200 cells/L experience increased morbidity and mortality, diminished responses to antiretroviral therapy, and higher health care expenditures.9,10 Focusing prevention of transmission strategies on HIV-infected persons reduces rates of high-risk sexual behaviors that might transmit HIV to others.11 Patients diagnosed late have “missed out” on prevention programs for years while unaware of their infection. Moreover, antiretroviral therapy that reduces HIV RNA levels almost certainly reduces risk of transmission to sexual partners.12 The delay in initiating antiretroviral therapy due to late diagnosis thus likely generates more secondary HIV infections. Testing based on perceived risk of HIV infection, rather than broader screening approaches, likely contributes to the problem. This study shows that older patients and women are more likely to be diagnosed during hospitalization. This suggests that these populations may have lower perceived risk for HIV infection by both themselves and by their providers, and are therefore less likely to be tested for HIV as outpatients. As a single, academic medical center study, our findings may not be generalizable to other medical settings or regions of the country. However, our findings are consistent with other recently reported estimates, including a cohort of patients in a large health maintenance organization.4,5 Given the relatively modest sample size, it is possible that there was insufficient power to identify other important associations. These findings support the notion that late diagnosis of HIV infection is a significant problem, particularly among older patients. Additionally, these data indicate that diagnosis of HIV infection during hospitalization is common, especially among older patients and women. Recent initiatives call for HIV testing to become a more routine part of medical care,13 in part because of the problem of late HIV diagnosis substantiated by this study. Routine rather than risk-based HIV testing is advocated, because high-risk behaviors are frequently not identified in primary care encounters.5 Prospective studies assessing the impact of routine screening in various medical settings are ongoing and will be important in developing an evidence-based HIV screening policy. References 1. Palella FJ Jr, Delaney KM, Moorman AC, et al. Declining morbidity and mortality among patients with advanced human immunodeficiency virus infection. HIV Outpatient Study Investigators. N Engl J Med. 1998;338:853-860. 2. Glynn M, Rhodes P. Estimated HIV prevalence in the United States at the end of 2003. In: Program and Abstracts of the National HIV Prevention Conference (Abstract 595), Atlanta, GA, June 2005. 3. Centers for Disease Control and Prevention. Late vs. early testing of HIV—16 sites, United States, 2000-2003. MMWR Morb Mortal Wkly Rep. 2003;52:581-586. 4. Dybul M, Bolan R, Condoluci D, et al. Evaluation of initial CD4⫹ T cell counts in individuals with newly diagnosed human immunodeficiency virus infection, by sex and race, in urban settings. J Infect Dis. 2002;185:1818-1821. 5. Klein D, Hurley LB, Merrill D, Quesenberry CP Jr. Review of medical encounters in the 5 years before a diagnosis of HIV-1 infection: Mugavero et al 6. 7. 8. 9. Late Diagnosis of HIV Infection implications for early detection. J Acquir Immune Defic Syndr. 2003;32:143-152. Centers for Disease Control and Prevention. HIV/AIDS Surveillance Report, 2003 (Vol. 15). Atlanta, GA: US Department of Health and Human Services, Centers for Disease Control and Prevention; 2004: 1-46. Centers for Disease Control and Prevention. HIV/AIDS Surveillance in Urban and Nonurban Areas L206 slide series. Available at: http:// www.cdc.gov/hiv/graphics/rural-urban.htm. Accessed March 1, 2006. Luby S, Jones J, Horan J. Using CD4 counts to evaluate the stages and epidemiology of HIV infection in South Carolina public clinic patients. Am J Public Health. Mar 1994;84(3):377-381. Egger M, May M, Chene G, et al. Prognosis of HIV-1-infected patients starting highly active antiretroviral therapy: a collaborative analysis of prospective studies. Lancet. 2002;360:119-129. 373 10. Chen RY, Westfall AO, Accort NA, et al. Distribution of health care expenditures for HIV-infected patients. Clin Infect Dis. 2006;42:10031010. 11. Marks G, Crepaz N, Senterfitt JW, Janssen RS. Meta-analysis of high-risk sexual behavior in persons aware and unaware they are infected with HIV in the United States: implications for HIV prevention programs. J Acquir Immune Defic Syndr. 2005;39:446453. 12. Quinn TC, Wawer MJ, Sewankambo N, et al. Viral load and heterosexual transmission of human immunodeficiency virus type 1. Rakai Project Study Group. N Engl J Med. 2000;342:921-929. 13. Centers for Disease Control and Prevention. Revised recommendations for HIV testing of adults, adolescents, and pregnant women in health-care settings. MMWR Morb Mortal Wkly Rep. 2006;55(RR14); 1-17. APM Perspectives APM Perspectives The Association of Professors of Medicine (APM) is the national organization of departments of internal medicine at the US medical schools and numerous affiliated teaching hospitals as represented by chairs and appointed leaders. As the official sponsor of The American Journal of Medicine, the association invites authors to publish commentaries on issues concerning academic internal medicine. For the latest information about departments of internal medicine, please visit APM’s website at www.im.org/APM. The Lost Art of Clinical Skills Christopher A. Feddock, MD, MS Department of Internal Medicine, University of Kentucky, Lexington. With the rapid extension of laboratory tests of greater accuracy, there is a tendency for some clinicians and hence for some students in reaching a diagnosis to rely more on laboratory reports and less on the history of the illness, the examination and behavior of the patient, and clinical judgment. While in many cases laboratory findings are invaluable for reaching correct conclusions, the student should never be allowed to forget that it takes a man, not a machine, to understand a man.1 Although seemingly contemporary, this critique about the use of clinical skills in medical education was made in 1946. By the end of World War II, x-rays, which formerly entailed several minutes of exposure time, could be performed in a matter of seconds and, for the first time, arterial blood gas measurement was possible. As attractive as these technologies seemed in the 1940s, the advancements of medical technology since then are even more alluring. Yet, technology seems to be replacing basic medical skills rather than complementing them. In “Introduction to Clinical Medicine: A Time for Consensus and Integration,” Omori and colleagues discuss concerns over history-taking and physical examination instruction, particularly during the first 2 years of medical school.2 The authors recommend a national collaboration on the integration of clinical skills education through medical school curriculum. Although this is a critical initial step, beyond the poor acquisition of basic clinical skills is the documented decline of some rudimentary skills after the second year of medical school.3,4 Why should historyRequests for reprints should be addressed to Christopher A. Feddock, MD, Department of Internal Medicine and Pediatrics, University of Kentucky, K522 Kentucky Clinic, Lexington, KY 405360284. E-mail address: [email protected] taking and physical examination skills crest when they remain esoteric concepts and plateau or decrease when they should be used in actual practice of medicine? Regardless of the formal educational curriculum, the skills should improve if they are used to guide patient care decisions. Multiple editorials have decried the loss of clinical skills and medical educators justify not only teaching but also using basic history-taking and physical examination skills in routine patient care.5-7 However, some skeptics suggest that emphasis on clinical skills is from a bygone era and that the availability of advanced imaging techniques and laboratory tests have supplanted ambiguous history and physical findings.7-9 Numerous studies and meta-analyses describe the poor operating characteristics of most history-taking and physical examination findings. For example, in a metaanalysis identifying the symptoms, signs, and tests most useful in diagnosing congestive heart failure (CHF), no single history-taking or physical examination findings provided adequate discrimination.10 The most discerning features of CHF—such as the presence of paroxysmal nocturnal dyspnea, an S3 gallop, or jugular venous distention— have such a low incidence (each documented in ⬍50% of patients with CHF) that their presence is not particularly helpful in diagnosing CHF. In fact, the best single predictor of CHF was found to be a B-type natriuretic peptide (BNP) value of 250 pg/mL with a sensitivity of 89% and a specificity of 81%. However, physicians rarely make decisions based upon one isolated finding, and the overall gestalt of the patient’s illness is perhaps most important. In the CHF study, a high initial clinical suspicion (based upon the complete history and physical) was the most predictive element in the diagnosis of CHF.10 In fact, the authors concluded that ordering a BNP level was useful only in cases with an equivocal clinical suspicion. The impor- 0002-9343/$ -see front matter © 2007 The Association of Professors of Medicine. All rights reserved. doi:10.1016/j.amjmed.2007.01.023 Feddock Clinical Skills tance of clinical judgment was even more apparent in a study of patients presenting to an outpatient clinic with either abdominal pain or chest pain.11 Physicians correctly classified 93% of patients with abdominal pain and 98% of patients with chest pain as having either an organic or nonorganic etiology solely on the basis of their initial clinical judgment and before ordering any diagnostic tests. These findings clearly indicate that clinical skills are important, but can technology replace thorough history-taking and physical examinations? Contrary to the paramount importance often ascribed to technology, numerous studies have demonstrated that technology has not necessarily improved the quality of patient care. Successive cohorts of autopsies over the last century have consistently demonstrated similar rates of misdiagnosis despite the use of advanced diagnostic procedures.12,13 For example, unknown malignancies were diagnosed in 36.5% of autopsies in 1923, compared with 41% in 1972 and 44% in 1998.13 In another study of 167 patients who died during a stay in the intensive care unit, autopsies uncovered a major diagnostic error in 32% of patients despite extensive diagnostic testing.14 In fact, the use of imaging was noted to contribute to misdiagnosis. Physicians missed the diagnosis of endocarditis in 9 patients despite ordering echocardiograms in the week before each of their deaths. By contrast, 3 patients diagnosed with endocarditis by echocardiogram subsequently had their diagnoses refuted during autopsy. In another autopsy study, the authors determined that ultrasound and computed tomography scanning provided misleading information for 7% of patients, whereas history and physical examinations rarely misled physicians (⬍1% for history and 2% for physical examination).12 More recently, the Medicare program evaluated the use of imaging services nationwide and found a threefold variation in the number of examinations obtained across the United States.15 Despite substantial differences in the use of imaging studies, no demonstrable changes in quality or patient outcomes were noted. Although recent technological advances offer numerous tools to aid in diagnosis, their use should be guided by thorough history and physical examinations. Studies have consistently demonstrated that history-taking and physical examinations are the most important factors in arriving at a correct diagnosis, whereas lab tests and imaging studies play only minor roles.12,16 The aforementioned study of autopsy results concluded that history-taking and physical examinations provided conclusive information for determining the main diagnosis in 73% and 62% of patients, respectively.12 By comparison, imaging techniques provided conclusive information for diagnoses of 35% of patients and standard lab tests for 22% of patients. In fact, inaccurate, incomplete, or misinterpreted patient histories are among the 375 leading causes for diagnostic errors.8,17 Physicians acknowledge the poor discrimination of individual history and physical examination findings but often neglect to consider the true sensitivity and specificity of imaging and other tests.6,7 Using technology becomes a “gold standard” for diagnosis instead of an adjunct to clinical judgment. THE STATE OF CLINICAL SKILLS Inconsistencies between laboratory findings and clinical data go undetected simply because too many physicians are insufficiently disciplined in the proper use of clinical skills and in the analysis of clinical data. Too often, palpably illogical laboratory findings are accepted without question.6 Despite the importance of history-taking and physical examination, clinical skills education has decreased since the 1960s, with deficiencies beginning in medical school and continuing through residency and into practice.3-5,9,18-22 With the erosion of thorough historytaking and physical examinations, clinical reasoning (the ability to develop the gestalt impression) has also decreased.2,5 Although essential to determining the correct diagnosis, appropriate history-taking and physical examination are futile without the ability to interpret gathered information. History-taking is frequently limited by close-ended questions that fail to gather specific details critical to clinical decision-making.5-8 For example, instead of determining the severity, context, alleviating factors, exacerbating factors, and chronology of dyspnea, its presence becomes a yes or no response. Beyond the clear decline in skills, medical students who demonstrate proper technical ability have serious deficiencies in clinical reasoning before they enter residency training.5-8,21 In a study comparing student scores on an objective structured clinical examination (OSCE), which requires a complete organ system examination and a clinical performance examination (CPX), which requires a focused physical based on the patient’s history, a large discrepancy was noted among student scores.21 Students who excelled in the technical examination (OSCE) performed inconsistently when deciding on the appropriate physical examination elements during the patient scenario (CPX). In fact, the two scores showed no correlation on individual cases. Apparently, being able to perform a physical examination correctly during an OSCE (the standard used by most medical schools) does not translate into appropriate use of those skills in patient care. CLINICAL SKILLS IN TEACHING HOSPITALS A glimpse of clinical education during medical school and residency illuminates several reasons for the overall decline in clinical decision-making skills. Before the 376 The American Journal of Medicine, Vol 120, No 4, April 2007 1970s, internal medicine rounds with the attending physician were considered the platform for demonstrating history-taking, physical examinations, and clinical decision-making.5,22 Attending physicians demonstrated clinical skills, refined a physician-in-training’s techniques, and corrected errors or misinterpretations. By 1978, the rate of performing bedside examinations during teaching time had decreased to 16%, and many physicians estimate that number has decreased even further.5,22 Today, physicians-in-training rarely see attending physicians demonstrate history-taking and physical examination techniques and apply their findings to clinical decision-making.5,22,23 Rounds at many hospitals have shifted from bedside interactions with patients focused on the patient’s history and physical examination to conference room learning focused on the patient’s latest laboratory and imaging results.5,22 A recent national survey of medical students inquired about the quality of teaching during the inpatient component of their internal medicine clerkships.23 Onethird of students reported that their attendings rarely or never saw new patients with the team, not including the number who saw but did not examine the patients with the team. Not only are senior physicians failing to demonstrate clinical skills, but physicians-in-training are rarely observed taking histories or performing physical examinations, or offered feedback on their clinical skills.6,19,22,24,25 Less than 50% of medical students reported that the attending physician observed them performing some aspect of a physical examination, and less than 20% reported they were observed interviewing a patient.24 Even when faculty members do observe a student’s performance, many do not identify the errors made by those students during their examinations.25 Observation and feedback are essential because physicians-in-training commit a high number of errors in routine history-taking and physical examinations.8,17,19,20 These errors have significant consequences; in one study, an attending physician’s physical examination ultimately changed the diagnosis or disease management for one-quarter of the patients admitted to an internal medicine service, providing proof that any feedback on clinical skills is beneficial.20 In another study of the accuracy of resident presentations, resident physical examination skills directly correlated to the amount of time attending physicians spent with them at the bedside examining patients.18 However, physical examination skills did not correlate with classic measures of medical knowledge, such as resident in-training examination scores or prior medical school class rank, indicating those measurements do not automatically translate to clinical skills. Despite its decline, both medical educators and physicians-in-training still consider bedside teaching one of the most valuable learning tools.22,23 Although many lament the changes in medical education focus, medical schools overall have done little to improve the way clinical skills are taught.6,7,26,27 Since the 1980s, innovations in medical education have attempted to refocus the activities of medical schools and teaching hospitals back on education.26-28 New modalities, such as standardized patients, simulators, and computer technology, have been included to improve the teaching of clinical skills. However, these recent instructional methods have one common factor—they require less faculty involvement. In a recent case study, faculty members at one medical school consistently made curricular decisions that would best preserve faculty research time, resulting in a persistent decrease over the last half-century in student-faculty contact.27 Identifying faculty who will take the time to teach medical students is now one of the most substantial difficulties faced by course directors.28 Although many of the new teaching technologies offer outstanding, nonintimidating platforms for students to refine their skills, they cannot replace patient interactions supervised by faculty.29 CONCLUSION Current movements to improve clinical skills education are essential and long overdue. Acknowledging that the provision of high quality medical care requires strong clinical skills and clinical reasoning, the Association of American Medical Colleges established the Task Force on the Clinical Skill Education of Medical Students. Several recommendations from this task force emphasize the importance of clinical skills.29 First, the task force acknowledged that clinical skills education is a longitudinal process that must be taught throughout medical school, residency training, and postgraduate work. Clinical skills are often ignored after the second year of medical school, even though they should be continuously reinforced and advanced to include more sophisticated techniques. Second, the task force emphasized that faculty members must take the primary role in teaching clinical skills. The development of clinical skills requires close mentorship with someone who can not only teach the specified skills, but also assess and provide feedback to the student. Third, the task force recommended that the evaluation of clinical skills must be patient-centered. Simulators and computerized technology are useful adjuncts to teaching clinical skills, but to deliver high-quality patient care, students must learn with actual patients. Emphasizing clinical skills is as significant as acknowledging the impact of the hidden curriculum perpetuated in many clinical arenas.5,30 Students and residents will value what their faculty mentors value and their observations of faculty-patient interactions demonstrate what skills are truly important to succeed as a physician. Rushed rounds with attending physicians Feddock Clinical Skills exaggerate the importance of ancillary testing at the expense of clinical skills. With a greater reliance on laboratory studies and imaging, the details of history and physical examinations become inconsequential and no longer change the diagnostic approach.7,9 Physician educators must not only dedicate themselves to teaching clinical skills, but also emulating those skills in everyday work. They must integrate new technology into clinical education without diverting attention from patients. Expectations for physicians-in-training should include a progressive improvement in clinical skills, guided by faculty feedback to correct and advance those skills. Although clinical faculty members play an essential role in promoting the development of necessary clinical skills in physicians-in-training, they must have sufficient support from medical school or teaching hospital leadership, as well as individual departments. Even motivated teaching faculty find numerous barriers within the administration of the medical school or teaching hospital.28,31-33 Medical education, particularly basic clinical skills education, is a low priority, especially in comparison to the income-generating endeavors of research and clinical work.28,31 In general, faculty are given little time to dedicate to teaching duties, so they either risk salary cuts or they teach “on their own time” after completing their clinical or research activities.32 At one medical school, it was estimated that, after paying for fringe benefits, faculty members were compensated approximately $16 for each hour they spent teaching.31 In addition, teaching activities often do not contribute significantly to promotion and tenure decisions.33 Many medical school promotion and tenure committees have difficulty accepting the expanded definition of scholarship that rewards certain teaching activities.34 Ultimately, medical schools and teaching hospitals must instill value in teaching basic clinical skills by providing physicians the time and the compensation for these activities. Teaching clinical skills is time-intensive and requires dedicated faculty who are able to demonstrate, teach, and provide feedback. Current faculty members may lack the clinical expertise to be successful, adding to the difficulty in finding strong physician models proficient in teaching clinical skills. Most current medical school or teaching hospital faculty completed their education during a time of diminished emphasis on clinical skills, so they may lack confidence in their own skills.4,22 Teaching is not an intuitive endeavor for all physicians, and faculty are limited in their ability to assess clinical skills and provide quality feedback to physicians-in-training.24,25 Faculty development is necessary to improve the current clinical skills of medical school faculty and provide proper instruction on the teaching and evaluation of clinical skills. 377 Although history-taking and physical examination skills are often considered rudimentary, they serve as the foundation for all clinical decision-making and their significance should not be disregarded or forgotten. Modern technology has improved physician understanding of ailments and created new tools to use in diagnostic paradigms, but the technology is not infallible.7,12-16 Indiscriminate use of new technology will not improve health care but will only contribute to spiraling health care costs.15 The enhancement of clinical skills curricula must be accompanied by focusing clinical training back on patients and away from computerized data. In the words of Sir William Osler, “it is a safe rule to have no teaching without a patient for a text, and the best teaching is that taught by the patient himself.”35 References 1. Allen, RB. Medical Education and the Changing Order. New York: The Commonwealth Fund; 1946. 2. Omori DM, Wong RY, Antonelli MA, Hemmer PA. Introduction to clinical medicine: a time for consensus and integration. Am J Med. 2005;118:189-194. 3. Pfeiffer C, Madray H, Ardolino A, Willms J. The rise and fall of students’ skill in obtaining a medical history. Med Educ. 1998: 32:283-288. 4. Vukanovic-Criley JM, Criley S, Warde CM, et al. Competency in cardiac examination skills in medical students, trainees, physicians and faculty. Arch Intern Med. 2006;166:610-616. 5. Ahmed MEK. What is happening to bedside clinical teaching? Med Educ. 2002;36:1185-1188. 6. Engel GL. Are medical schools neglecting clinical skills? JAMA. 1976;236:861-863. 7. Bordage G. Where are the history and physical? Can Med Assoc J. 1995;152:1595-1598. 8. Wiener S, Nathanson M. Physical examination: frequently observed errors. JAMA. 1976;236:852-855. 9. Mangione S, Nieman LZ, Gracely E, Kaye D. The teaching and practice of cardiac auscultation during internal medicine and cardiology training. Ann Intern Med. 1993;119:47-54. 10. Wang CS, Fitzgerald JM, Schulzer M, et al. Does this dyspneic patient in the emergency department have congestive heart failure? JAMA. 2005;294:1944-1956. 11. Martina B, Bucheli B, Stotz M, et al. First clinical judgment by primary care physicians distinguishes well between nonorganic and organic causes of abdominal or chest pain. J Gen Intern Med. 1997;12:459-465. 12. Kirch W, Schafii C. Misdiagnosis at a university hospital in four medical eras: report on 400 cases. Medicine (Baltimore). 1996; 75:29-40. 13. Burton EC, Troxclair DA, Newman WP. Autopsy diagnoses of malignant neoplasms: how often are clinical diagnoses incorrect? JAMA. 1998;280:1245-1248. 14. Combes A, Mokhtari M, Couvelard A, et al. Clinical and autopsy diagnoses in the intensive care unit: a prospective study. Arch Intern Med. 2004;164:389-392. 15. Iglehart JK. The new era of medical imaging—progress and pitfalls. N Engl J Med. 2006;354:2822-2828. 16. Peterson MC, Holbrook JH, Hales DV, et al. Contributions of the history, physical examination, and laboratory investigation in making medical diagnoses. West J Med. 1992;156:163-165. 17. Bordage G. Why did I miss the diagnosis? Some cognitive explanations and educational implications. Acad Med. 1999;74(10 Suppl):S138-S143. 378 The American Journal of Medicine, Vol 120, No 4, April 2007 18. Johnson J, Carpenter JL. Medical house staff performance in physical examination. Arch Intern Med. 1986;146:937-941. 19. Wray NP, Friedland JA. Detection and correction of house staff error in physical diagnosis. JAMA. 1983;249:1035-1037. 20. Reilly BM. Physical examination in the care of medical inpatients: an observational study. Lancet. 2003;362:1100-1105. 21. Wilkerson L, Lee M. Assessing physical examination skills of senior medical students: knowing how versus knowing when. Acad Med. 2003;78(10 Suppl):S30-S32. 22. Ramani S, Orlander JD, Strunin L, Barber TW. Whither bedside teaching? A focus-group study of clinical teachers. Acad Med. 2003;78:384-390. 23. Guarino CM, Ko CY, Baker LC. Impact of instructional practices on student satisfaction with attendings’ teaching in the inpatient component of internal medicine clerkships. J Gen Intern Med. 2006;21:7-12. 24. Holmboe ES, Fiebach NH, Galaty LA, Huot S. The effectiveness of a focused educational intervention on resident evaluations from faculty: a randomized controlled trial. J Gen Intern Med. 2001;16:427-434. 25. Noel GL, Herbers JE, Caplow MP. How well do internal medicine faculty members evaluate the clinical skills of residents? Ann Intern Med. 1992;117:757-765. 26. Bloom SW. Structure and ideology in medical education: an analysis of resistance to change. J Health Soc Behav. 1988;29: 294-306. 27. Cuban L. How Scholars Trumped Teachers: Change Without Reform in University Curriculum, Teaching and Research, 18901990. New York: Teachers College Press; 1999. 28. Mangan KS. Physician, teach thyself. Chron High Educ. 2003; 50:A18. 29. Association of American Medical Colleges. The AAMC Project on the Clinical Education of Medical Students: Clinical Skills Education. Washington, DC: AAMC; 2005. 30. Hafferty FW. Beyond curriculum reform: confronting medicine’s hidden curriculum. Acad Med. 1998;73:403-407. 31. Shea S, Nickerson KG, Tenebaum J, et al. Compensation to a department of medicine and its faculty members for the teaching of medical students and house staff. N Engl J Med. 1996;334: 162-167. 32. Sheffield JV, Wipf JE, Buchwald D. Work activities of clinicianeducators. J Gen Intern Med. 1998;13:406-409. 33. Batshaw ML, Plotnick LP, Petty BG, et al. Academic promotion at a medical school: experience at Johns Hopkins University School of Medicine. N Engl J Med. 1988;318:741-747. 34. Nora LM, Pomeroy C, Curry TE, et al. Revising appointment, promotion, and tenure procedures to incorporate an expanded definition of scholarship: the University of Kentucky College of Medicine experience. Acad Med. 2000;75:913-924. 35. Osler W. Aequanimatus, and Other Addresses. Philadelphia: P. Blakiston’s Son & Co; 1904.


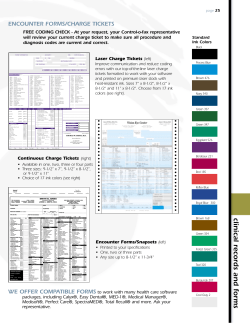


© Copyright 2026