
QUALITYOF LIFE ASSESSMENT OF THE 5 AND 6 YEAR OLD... CHRONIC DISABILITIES IN ALMATY AND KYZYLORDA REGIONS
Центрально-Азиатский научно-практический журнал по общественному здравоохранению UDC: 616-053.2(4)-056.4 Zh. A. Kalmatayeva, E.K. Bekbotayev, A.B. Skakov, A.E. Omarova, B.E. Aryspayev School of Public Health of the Ministry of Healthcare of the RK, Almaty QUALITYOF LIFE ASSESSMENT OF THE 5 AND 6 YEAR OLD CHILDREN WITH CHRONIC DISABILITIES IN ALMATY AND KYZYLORDA REGIONS Keywords: children population, chronic disability diseases, quality of life, regional indicators. Summary. For the first time in the Republic of Kazakhstan a study was done on the quality of life of 5-6 years old children with chronic disability according to the international methodological standards. Quality of life comparison was done for the children living in urban and rural areas in Almaty and Kyzylorda regions. Health Related Quality of Life (HR QoL) study will allow to get a more comprehensive picture of patient’s health, because it takes into consideration his subjective opinion about own physical, psychological and social welfare. The aim of this study was to identify the quality of life indicators of 5-6 year old children with chronic disability. The subjects of the study were 5-6 year old children in Almaty and Kyzylorda regions with chronic disability diseases. As a study tool we have used the Russian version of the generic quality of life questionnaire (PedsQL™ 4.0 GenericCoreScales)for 5-7 year old children (parents’ form). Therewereatotalof205 parents/guardianssurveyed: among them in Almaty region– 64,4±3,34% and in Kyzylorda region– 35,6±5,60% respondents. Out of total number of respondents, there were 44,4±5,21% of boys’ parents/guardians and 55,6± 4,65% of girls’. In the nosology and disease groups structure, children with congenital anomalies (development pathologies) of the central nerveous system (CNS), cardio-vascular system (CVS), other congenital pathologies, bronchial asthma as well as trauma consequences take dominant position – 89,8±2,11%. In general it can be noted that chronic disability diseases significantly decrease the QL of 5-6 year old children in both regions. Statistically the differences in the QL indicators of the diseased and relatively healthy children differ with a high confidence interval (р<0,01). At the same time it was noticed that QL of the rural area population is lower than urban population on all scales except for RF. The indicator of the psychosocial function in gamong urban children was higher by 7,7 points and in general or sum scale it was higher by 8,7 points. Depending on children’s gender higher parameters of QL were seen in girls(in summary scale by 2,6 points), mainly due to the difference in the physical functioning scale (physical functioning in boys was worse more than in girls). It is necessary to notea different degree of adverse in fluence from various diseases on the QLof5-6 year old children: of all nosologies and disease groups included in the study, QL was lower among 5-6 year olds with congenital CNS pathologies, especially physical (39,9 points) and social (52,8 points) functioning and with other congenital pathologies –role functioning (49,4 points). Therefore the studied disability conditionslower the QL of 5-6 year olds with high confidence(р<0,01). QL indicators of children in ruralarea are lower than those of urban children with high certainty (р<0.01). 5-6 year old girls with chronic disability conditions had certainly higher QL indicators on all scales than boys. In both studied regions QL suffered the most in 5-6 year olds with congenital pathologies of CNS (especially physical and social functioning). Fur ther more it was lower in those living in Kyzylorda region than of their peers in Almaty region with high confidence. 1 Центрально-Азиатский научно-практический журнал по общественному здравоохранению Introduction According to the definition of international center for quality of life studies (Russia),quality of life (QL) is an integral character is ticofphysical, psychological, emotional and social function in gof the patient, based on his subjective perception[1]. Until present time mostly objective data of laboratory an dinstrumental studies were taken into accountin assessment of patient’s state, where as QL criteria gave an opportunity to learn the person’s subjective opinion about own physical health, psychological state, own role in the society and create a full and holistic picture of health. Common in QL studies is application of standardized question naires to assess quality of life and symptoms, tested in research and clinical practice, which have satisfactory psychometric properties (reliability, validity, sensitivity) [2, 3]. One of the most common lyused international questionnaires in pediatrics is Pediatric Quality of Life Inventory (PedsQL™ 4.0), the purpose of which is to assess the QL of relatively healthy as well assick children. The questionnaire has parent and children forms, it consists of 21-23questions, which are grouped in the following scales: physical functioning – FF (8 questions), emotional functioning – EF (5 questions), social functioning – SF (5 questions), life in school or pre-school – LS (3-5questions depending on age)[4]. The aim of the present study was to identify quality of life of 5-6 year old children with chronic disability diseases. Materials and methods Subjects of our research were children aged 5-6 in Almaty and Kyzylorda regions with the follow in gnosologies and disease groups:bronchial asthma; cysticfibrosis; ce- liac syndrome; acuteleukemia, histiocytosis, aplasticanemia, haemophilia; obstructiveuropathy; congenital pathologies of respiratory organs, gastric organs, circulatory system and heart, genitourinary and central nervous systems; retinopathy in premature infants; traumas; other congenital pathologies (congenital pathologies of osteoarticular system and tissues,such as: congenital hip dislocation, clubfoot etc.). As an instrument for study (after obtaining the permission from the International institute of the quality of life study – MAPI, France) Russian version of the international QL questionnaire was used – PedsQL™ 4.0 Generic Core Scales for children aged 5-7 years (parent form).The survey was done in their presence, on a voluntary basis, after the informed consent form was signed. After the survey with the help of guidelines, scaling of the questionnaires was done. According to the guidelines answers on all scales were transformed into points: «never» - 100 points, «almost never» - 75 points, «sometimes» - 50 points, «often» 25 points and «almost always» - 0 points. Therefore mean values were identified in all scales and average psychosocial functioning scales were identified– PSF (according to the scales EF, SF, RF) and their sum– SS (average point on all scales). Results Inordertoassessthe quality of life of 5-6 year olds with chronic disability diseases 205 surveys of parents/guardians were done (picture 1). Among the min Almaty region – 132 respondents (64,4±3,34%), in Kyzylorda region – 73 respondents (35,6±5,60%). 2 Центрально-Азиатский научно-практический журнал по общественному здравоохранению Picture 1 – Share of the respondents of 5-6 year olds by region and gender, in % Of the total number of the respondents boys’ parents/guardiens were 91 people (44,4±5,21%), girls’ – 114 people (55,6± 4,65%). Picture 2 presents the distribution of the respondents by location type. Total number of the respondents living in urban area exceeded rural area by 3,7 times (78,5%, vs. 21,5%), among them in Almaty region by 3,3 times and in Kyzylorda region 4,6 times. Picture 2 – Distribution of urban and rural area respondents aged5-6 years, in % In the nosology and diseases groups structure children with congenital pathologies of the CNS, CVS, other congenital pathologies, bronchial asthms, as well as trauma consequences take the dominating place (table 1). Their summary share among children of this age group is 89,8±2,11%. With a big gap to the other groups the first place is taken by the congenital pathologies of the cen- tral nervous system (29,3±3,18%);then almost with equal share come traumas (17,5±2,65%), congenital pathologies of the circulatory system and heart (17,1±2,63%) and other congenital pathologies (16,6±2,60%). Children suffering from bronchial asthma have taken the 5th place in ranking (9,3±2,03%). 3 Центрально-Азиатский научно-практический журнал по общественному здравоохранению Table 1 – Distribution of the respondents by region and diagnosis Diagnosis Region and patients number Almaty region Kyzylorda region Total Abs. ratio, Abs. ratio, Abs. ratio, No. in % No. in % No. in % Bronchial asthma 8 6,1±2,08 11 15,1±4,19 19 9,3±2,03 Congenitalpathologiesofcirculatorysystemandheart 19 14,4±3,06 16 21,9±4,84 35 17,1±2,63 CongenitalpathologiesoftheCNS 44 33,3±4,10 16 21,9±4,84 60 29,3±3,18 Trauma, accidents. 31 23,5±3,69 5 6,9±2,97 36 17,5±2,65 Other congenital pathologies 17 12,9±2,92 17 23,3±4,95 34 16,6±2,60 Other 13 9,8±2,59 8 10,9±3,65 21 10,2±2,11 Total 132 100,0 73 100,0 205 100,0 latory system and heart with the ratio of Among urban and rural area population 18,2±5,82%. Children with traumas shared the first place by frequency is taken by conthe 3rd and 4 th places in frequency with othgenital pathologies of CNS, urban – er congenital pathologies (по 11,4±4,79%). 27,3±3,51%, rural area – 36,3±7,25% reThe fifth place in dominating pathologies is spectively (table 2). Amongurbanpopulataken by bronchial asthma, both is urban tionthesecondplaceistakenbythetrau(10,0±2,36%), and rural (6,8±3,80%) popumaswiththeratioof19,3±3,11%, and among lation. rural area population the second place is taken by the congenital pathologies of circuTable 2 – Distribution by location type and diagnosis Diagnosis Location type and patient number Urban Rural Total Abs. ratio, Abs. ratio, Abs. ratio, No. in % No. in % No. in % Bronchial asthma 16 10,0±2,36 3 6,8±3,80 19 9,3±2,03 Congenitalpathologiesofcirculato18,2±5,8 rysystemandheart 27 16,8±2,95 8 2 35 17,1±2,63 CongenitalpathologiesoftheCNS 36,3±7,2 44 27,3±3,51 16 5 60 29,3±3,18 Trauma, accidents. 11,4±4,7 31 19,3±3,11 5 9 36 17,5±2,65 Other congenital pathologies 11,4±4,7 29 18,0±3,03 5 9 34 16,6±2,60 Other 15,9±5,5 14 8,6±2,21 7 1 21 10,2±2,11 Total 161 100,0 44 100,0 205 100,0 system and heart – 18,7±4,09%, 3rd and 4th As for gender structure among 5-6 year place is shared by traumas and other olds with chronic disability diseases congenital pathologies (each 13,2±3,55%). congenital pathologies of CNS were seen Among girls second place is taken by most often, is boys – 32,9±4,93%, in girls – traumas (21,0±3,81%), third – by congenital 26,3±4,12% respectively, and more rarely pathologies (19,3±3,70%), 4th – by bronchial asthma, in boys– 9,9±3,13%, and congenital pathologies of circulatory system girls – 8,8±2,65%respectively (table 3). and heart (15,8±3,42%). Among boys second ranking was taken by congenital pathologies of circulatory 4 Центрально-Азиатский научно-практический журнал по общественному здравоохранению Table 3 – Distribution of the respondents by gender and diagnosis Diagnosis Gender and number of patients Boys Girls Total Abs. ratio, Abs. ratio, Abs. ratio, No. in % No. in % No. in % Bronchial asthma 9 9,9±3,13 10 8,8±2,65 19 9,3±2,03 Congenitalpathologiesofcirculatorysystemandheart 17 18,7±4,09 18 15,8±3,42 35 17,1±2,63 CongenitalpathologiesoftheCNS 30 32,9±4,93 30 26,3±4,12 60 29,3±3,18 Trauma, accidents. 12 13,2±3,55 24 21,0±3,81 36 17,5±2,65 Other congenital pathologies 12 13,2±3,55 22 19,3±3,70 34 16,6±2,60 Other 11 12,1±3,42 10 8,8±2,65 21 10,2±2,11 Total 91 100,0 114 100,0 205 100,0 functioning of both regions are similar. In pictures 3 and 4 there are QL There is a significant difference in the scale parameters of the children in Almaty and of physical functioning– FF indicator (52,8) Kyzylorda regions in comparison with of the Kyzylorda region children is lower by regional population norms in the form of 8,8 points. However, confidence interval of vector diagrams. At the same time QL the QL differences among Almaty and indicators of 5-6 year olds with chronic Kyzylorda region children is statistically disability diseases across the regions on the insignificant (р>0.05). scales of emotional, social and role Almaty region Normative values FF 82,5 SS 86,8 66,9 65,5 66,7 PSF88,2 89,4 EF 61,6 72,4 60,9 94,1 SF 81,0 RF Picture 3 – Profile of QL of 5-6 year old children with chronic disability diseases in Almaty region with regional population norms in points 5 Центрально-Азиатский научно-практический журнал по общественному здравоохранению Kyzylorda region Normative values FF 76,5 SS 82,4 63,4 67,7 66,9 PSF 84,4 85,1 EF 52,8 72,1 60,9 88,4 SF 79,7 RF Picture 4 – Profile of QL of 5-6 year old children with chronic disability diseases in Kyzylorda region with regional population norms in points In general it can be noted that chronic disability diseases significantly decrease the QL of 5-6 year old children in both regions. Statistically the differences in the QL indicators among diseased and relatively healthy children are confirmed by a high degree of certainty (р<0,01). In table 4 there are QL indicators of 5-6 year old children with chronic disability diseases depending on their location and gender. According to the location of the re- spondents it can be noted that QL of rural population is lower than in urban population on all scales except for RF. Psychosocial functioning scale indicator of urban population is 7,7 points higher and on the total or summary scale it is even by 8.7 points. The differences of QL of rural and urban population are statistically significant with high confidence (р<0.01). Table 4 – QLindicatorsofurbanandruralchildrenaged5-6 years with chronic disability diseases, in points Location type, gender FF EF SF RF PSF SS Bylocationtype Urban 60,9 69,3 75,1 60,9 68,4 66,6 Rural 49,5 59,3 62,0 60,9 60,7 57,9 By gender Male 54,8 66,7 71,4 60,2 66,1 63,3 Female 61,4 67,6 73,0 61,5 67,4 65,9 shown (table 5), that the points of children Depending on the gender of children, with bronchial asthma in summary scale difhigher QL indicators are seen in girls (by the fer insignificantly in population of both resummary scale by 2,6 points), mainly due to gions. At the same time PSF indicator is the difference in physical functioning score slightly higher in Kyzylorda region children: (among boys the physical state is worse 75,8 points vs. 74,2 –in Almaty region. more than among girls). ThesegenderdifferPoints on all scales in children with conencesof the QL indicators are confidently genital pathologies of circulatory system and significant (р<0.05). heart are compatible in both regions. HowAnalysis of QL indicators of children ever, the reliability of the differences of QL aged 5-6 according to the nosologies and indicator in children, suffering from brondisease groups in the studied regions has chial asthma and congenital circulatory sys6 Центрально-Азиатский научно-практический журнал по общественному здравоохранению tem and heart diseases of the studied regions is statistically insignificant (р>0.05). Table 5 – QL indicators of the 5-6 year old children with bronchial asthma across the regions in points Region FF EF SF RF PSF SS Bronchial asthma Almaty region 61,3 73,1 82,5 67,0 74,2 71,0 Kyzylorda region 59,1 70,9 83,2 73,3 75,8 71,6 Congenitalpathologiesof the circulatory system and heart Almaty region 65,0 69,2 82,9 63,6 71,9 70,2 Kyzylorda region 67,6 67,8 84,4 65,0 72,4 71,2 CongenitalpathologiesofCNS Almaty region 46,5 58,6 56,3 56,0 57,0 54,4 Kyzylorda region 21,9 58,8 43,4 46,7 49,6 42,7 Trauma Almaty region 69,1 71,8 81,5 68,5 73,9 72,7 Kyzylorda region 71,9 68,0 82,0 45,0 65,0 66,7 Other congenital pathologies Almaty region 83,6 77,4 87,1 56,0 73,5 76,0 Kyzylorda region 47,8 64,4 71,5 41,3 59,1 56,3 of the children in the studied regions, who Among the studied nosologiesand disease have suffered from trauma (р>0,05). groups the lowest indicators of the QL were Among children suffering from other seen in all scales among 5-6 year old chilcongenital pathologies(along with children dren with congenital pathologies of CNS. It with congenital CNS pathologies) there is should be noted that except foremotional the greatest difference in QL indicators in functioning scale, indicators on all scales are the regions. Kyzylorda children have low lower among Kyzylorda region children: QL indicators in all scales compared to Alaccording to the PSF scale by 7,4 points and maty region. In PSF scale this difference is according to the summary scale by 11,7 14,4 points and in summary scale 19,7 points. Especially low indicator has been points. Reliability of the QL indicators difidentified according to the scale of physical ferences among Kyzylorda and Almaty refunctioning of children in Kyzylorda region gion children in this disease group is very - 21,9 points, which is more than 2 times high (р<0,01). lower than in Almaty region. Differences in Average QL indicators of the total numthe QL indicators of the children with conber of 5-6 year old children for the given genital pathologies of CNS in the studied nosologies are shown in table 8. regions are statistically significant (р<0,05). The refore , different exten to fad verse in It was noted that in children with traufluenceon QL can be noted for various dismas living in Kyzylorda region role funceasesin 5-6 year old children: of all nosolotioning was worse to the greater extent giesand disease groups included in the (41,3). In Almaty region the indicators of study, the QL of 5-6 year olds is the lowest psychosocial functioning were higher than for children with congenital CNS patholoin Kyzylorda region by 8,9 points and on gies, especially physical(39,9 points) and summary scale by 6,0 points. However, stasocial (52,8 points) functioning and other tistical calculations have reliably shown incongenital pathologies –role functioning signi ficance of differences in quality of life (49,4 points). 7 Центрально-Азиатский научно-практический журнал по общественному здравоохранению Table 8 – QLparametersofthechildren age 5-6 by nosologies in points FF EF SF RF Nosology PSF SS Bronchial asthma 60,0 71,8 82,9 69,4 74,7 71,0 Congenital pathologies of CVS 66,2 68,6 83,6 64,2 72,1 70,7 Congenital pathologies of CNS 39,9 58,7 52,8 54,4 55,3 51,5 Traumas 69,4 71,3 81,5 65,3 72,7 71,9 Other congenital pathologies 65,7 70,9 79,3 49,4 66,5 66,3 Discussion We have identified the quality of life of 5-6 year old children with chronic disability diseases in Kyzylorda and Almaty regions. We have analyzed the results of a range of QL studies for children ages5-7 years usingPedsQL™ 4.0 GenericCoreScalesfor children ages5-7 years, conducted in Russia. Specifically, during the study conducted in2007-2009 in Orenburg region [5], negative in fluence of chronic diseases and low resistance of the organism on the QL was proven for children of 5-7 years old. There is a QL study of children with recurrent respiratory conditions in Sakha republic[6], in which the researchers also reached the conclusion that QL of 5-7 year olds with this pathology group is lower than in relatively healthy children. In some studies the authors have established the in fluence of social determinantson QL of pre-school children, and it was identified that QL of children ages5-7 from low-income families is lower than that of children from wealthy families [7]. The last decade demonstrated increased global interest in the studies with use of QL approach. The search in PubMed database of the key phrase «qualityoflife» returns about 205000 results, among them more than 135000 done in the last 10 years. Atthesametimeabout15000 works in the last 10 years are devoted to studying children QL. Similar studies are an ewand perspective direction for Kazakhstan, especially during the development and implementation of the comprehensive treatment and rehabilitation programs efficiency assessment. Conclusions As a result of the study it was established that all chronic disability conditions decrease the QL of children of with high confidence (р<0,01). At the same time, QL indicators of the rural population is lower than those of urban population (р<0.01). Girlsaged5-6 years with chronic disability diseases had higher QL indicators on all scales than boys. In both regions QL suffers the most in children ages 5–6 years old with congenital pathologies of CNS (especially physical and social functioning). Quality of life of children ages 5-6 with congenital pathologies of CNS and other congenital pathologies living in Kyzylorda region is lower than that of their peers from Almaty region. References 1. NovikA.A., IonovaT.I. Guidelinesonqualityoflifestudiesinmedicine/Edited by Yu.L. Shevchenko. - М.: RANS, 2012. – 528 p. 2. BowlingA., EbrahimS. Handbookofhealthresearchmethods. Maidenhead: OpenUniversityPress, 2005. 3. FayersP., HaysR. AssessingQualityofLifeinClinicalTrials: MethodsandPractice. OxforduniversityPress: Oxford, NewYork, 2005. 4. NovikA.A., IonovaT.I. Quality of life studies in pediatrics /Edited by Yu.L. Shevchenko. - М.: RANS, 2008. – 108 p. 5. VinyarskayaI.V., PavlenkoT.N., MurzinaYu.M.Quality of life of children age 5-7, living in Orenburg city // Collection of the materials of the XIIIPediatricians congress of Russia «Topical problems of pediat- 8 Центрально-Азиатский научно-практический журнал по общественному здравоохранению rics» with international participation. – М., 2010. – P. 155. 6. UarovaA.V., SavvinaN.V.Modern approaches to the recurrent sinusitis and bronchitis among frequently ill children// Materials of the Icongress of pediatricians of the Far East «Topical issues of maternity and childhood protection on the modern stage». – Khabarovsk, 2010. – P. 310-312. 7. VolginaS.Ya., KurmayevaE.A. Quality of life of pre-school children from poor families // Kazan medical journal. – Kazan, 2010. №1. – P. 91-94. Ziad A. Memish, Nischay Mishra, Kevin J. Olival, Shamsudeen F. Fagbo, Vishal Kapoor, Jonathan H. Epstein, RafatAlHakeem, Abdulkareem Durosinloun, Mushabab Al Asmari, Ariful Islam, AmitKapoor, Thomas Briese, Peter Daszak, Abdullah A. Al Rabeeah, and W. Ian LipkinComments to Author Ministry of Health, Riyadh, Saudi Arabia (Z.A. Memish, S.F. Fagbo, R. AlHakeem, A. Durosinloun, A.A. Al Rabeeah); Columbia University, New York, New York, USA (N. Mishra, V. Kapoor, A. Kapoor, T. Briese, W.I. Lipkin); EcoHealth Alliance, New York (K.J. Olival, J.H. Epstein, P. Daszak); Ministry of Health, Bisha, Saudi Arabia (M. Al Asmari); EcoHealth Alliance, Dhaka, Bangladesh (A. Islam) MIDDLE EAST RESPIRATORY SYNDROME CORONAVIRUS IN BATS, SAUDI ARABIA Key words: knitting factories, women, working conditions, job performance, dynamics of the functional state of cardiovascular system, increased air temperature, noise. Summary. The source of human infection with Middle East respiratory syndrome coronavirus remains unknown. Molecular investigation indicated that bats in Saudi Arabia are infected with several alphacoronaviruses and betacoronaviruses. Virus from 1 bat showed 100% nucleotide identity to virus from the human index case-patient. Bats might play a role in human infection. Introduction The knitting industry is one of the most promising and rapidly developing sectors of Uzbekistan’s economy. Currently, there are more than 40 factories and small businesses where cotton fiber is processed into fabric. The complexity and diversity of the process, the scale of production resulted in a large number of workers, predominantly women, being employed in the field. Therefore, improvement of working conditions in the knitting industry, the promotion of occupational health, the development and implementation of measures aimed at the prevention of occupational hazards – are the main priorities. Reaching those goals will ensure the wellbeing and improve job performance of a large number of women employed in the industry. In the recent years the economy of Uzbekistan enjoyed the establishment of joint factories supplied by the newest equipment, which created more work opportunities for women. The modern technologies have been introduced which led to the change of the working conditions in the knitting factories, increased work intensity, neuroemotional strain and increased intellectual work. However, occupational health of women working at the modern knitting factories in the republic has not been studied extensively. The influence of many harmful factors on the physiological processes of various body systems in working women has not been identified. It is particularly important to study the industrial effect on worker’s cardiovascular system, which supports all organs and systems and, therefore, maintains performance, regulates responses to the var- 9 Центрально-Азиатский научно-практический журнал по общественному здравоохранению ious processes in the body. Moreover, climatic conditions of Uzbekistan with its hot dry climate put additional burden on the human body, its thermoregulatory system, which is controlled by changes in vascular tonus and entire cardiovascular system. Some data suggests that morbidity rates among women working at the textile factories located in hot areas are significantly higher than in other places [1]. Goal and objectives of the study To identify the impact of working conditions on the functional state of cardiovascular system and the job performance of the operators of the knitting machines and develop recommendations to improve their working conditions. Methods Traditional hygienic methods have been used to study the working conditions of women working at the knitting factories. Some of the measurements have been done using a psychrometer, anemometer, sound level meter, aspirator, light meter, in accordance with the methodological requirements. The functional state of cardiovascular system has been studied based on hemodynamic parameters. The pulse rate was determined by the palpation of the radial artery; Korotkov sound method was used to measure blood pressure; mathematical calculations were performed to determine the following: the systolic end-volume and cardiac output based on the Starr’s formula; average-dynamic pressure and peripheral vascular resistance based on the Chikem’s formula [2]. Measurements were taken at the workplace in the beginning of the workday, before the lunch break and at the end of the first shift, during the most favorable spring season (to determine the effect of working conditions) and during the hottest period of the year when the air temperature was at its highest. The level of job performance was assessed based on the time needed to remove the break, and the change of this pa- rameter throughout the working day based on the chronometric measurements [3]. The study was conducted on the basis of the knitting factories in Tashkent that produce cotton fabric and knitwear. The study included healthy women aged 10 to 40 years old with work experience from 1 year to 20 years. Results The working process of the operator of a knitting machine includes the following: tucking of the bobbin into the spinning machine (56-109 items depending on the machine brand); regulating the mode of work of the knitting machine depending on the type of the linen; sticking the end of the thread of each bobbin to the end of the yarn; turning the machine on and controlling its working process; removing the break, and producing the fabric. If the needle is damaged, the operator stops the machine, calls the mechanic to replace the needle, then inserts the thread back into the needle and continues the work. The knitting process also results in the production of cotton dust, which lands on the equipment, as well as the skin of working women. Cotton dust concentrations at the workshops were ranging from 0,8 to 5,2 mg/m3, with mean concentration of 4,2 ± 0,2 mg/m3. Taking into account that the maximum acceptable concentration of cotton dust is 4.0 mg / m ³, it is possible to assume that the dust content of surrounding air at the working sites of the knitting factories is insignificant; however, given the potential of fibrogenic cotton dust to cause allergic reactions, close contact with the dust throughout the work shift for prolonged periods could have an adverse effect on the women’s organism. During the cold season of the year the air inside the factories had the following characteristics: the average temperature of the air during the shift was 16,4 ± 1,4ºC ; relative humidity was 56,4 ± 3,4% and velocity was 3,5 ± 0,4 m/sec (increased level of air velocity depends on the power of fans that are installed into the upper part of the knitting machine to remove the remaining cotton 10 Центрально-Азиатский научно-практический журнал по общественному здравоохранению dust from the junction and decrease the possibility of the thread breakage). During the warm season of the year the average air temperature was 34,0 ± 1,6ºC, with the relative humidity of 37,4 ± 2,8% and velocity of 3,5 ± 0,1 m/sec. The knitting machines generate noise, the level of which depends on the brand of a knitting machine: such brands as “Terrot”, “Pajlon”, “Pai Lunj” make the noise that measures at 82 dBA; others, like “Wellknit”, make the noise up to 86 dB, knitting machines of the model “Terrot”, that produce knitted fabric of 32 diameter, can make the noise up to 106 dBA, the noise has high frequency, with the maximum frequency of 8000 Hrz. Interesting to note that as the number of spins of the knitting machine increase, the noise level at the working places also increases. The level of lightning of working spaces was uneven and insufficient, varying from 70 to 660 lx. The working process of operators of the knitting equipment differs based on intensity, monotony and sensory load. Moreover, the operators have to be concentrated 75% of the shift time. The study performed suggests that working conditions of the knitters working at the modern knitting factories can be classified as the third class, third degree of harmfulness which indicates the occupational health risk for the working women. The results of chronometry of time needed for removal of one break - the leading manufacturing procedure performed by the operators of knitting machinery - showed that the time spent to remove a break by the operators of the knitting machines during the shift period increases (p<0.01). During the first hour of work, the average time it took for operators to remove the break was 12.4 sec; during the second hour that time decreased down to 10,8 sec (this was likely due to increased repetition); by the lunch break the time increased up to 12,5 sec (15.7% increase), and by the end of the work day up to 14,3 sec (32.4% increase), which indicates the reduction in work efficiency due to work fatigue [3]. We have identified a significant correlation between reduced performance and increased noise level at the workplace. In addition, a correlation between reduced job performance and increased noise levels was noted (r=0.63). Table 1 presents data on the state of operators’ cardiovascular system. Table 1 – Cardiovascular system characteristics of the operators of knitting machines during the spring season Hemodynamic characBeginning of Lunch break End of workday Significance teristics workday M±m M±m M±m t P<2-4 1 2 3 4 5 6 Pulse (b/min) 72,8± 2,5 78,5± 3,7 84,0± 2,2 3,39 0,01 Arterial blood pressure (mm Hg) maximum 102,0± 1,8 126,0± 3,7 132,0± 1,8 7,8 0,001 minimum 70,0± 2,7 76,0± 3,7 82,0± 1,8 3,7 0,01 Pulse pressure 32,0± 1,8 50,0± 2,4 50,0± 1,2 4,4 0,001 Average-dynamic pres- 83,9± 3,0 92,6± 3,7 98,6± 1,8 6,1 0,001 sure End-systolic volume 61,2± 3,3 61,6± 2,8 58,0± 2,8 0,7 (ml) Cardiac output (ml) 4459,3± 290,4 4824,1± 116,9 4871,0± 232,7 2,2 0,05 Peripheral vascular re1539,0± 130,0 1438,7± 164,2 1547,6± 182,8 1,02 sistance (dyne) 11 Центрально-Азиатский научно-практический журнал по общественному здравоохранению Study materials show that from the start to the end of the workday the heart rate of the knitters increased. In the beginning of the workday the average heart rate was 72.8 ±2,5 b/min; during the first half of the work day the rate increased up to 78.8 ±3.7 b/min, and during the second half – up to 84.0 ± 2.2 b/min (p<0,01). Maximum arterial blood pressure increased from 102.0 ± 1.8 mm Hg in the beginning of the workday up to 126.0 ± 8.7 mm Hg by lunchtime and up to 132.0 ± 1.8 mm Hg by the end of workday (p<0,001). Minimum arterial blood pressure in the beginning of the workday was, on average, 70.0 ± 2.7 mm Hg, increasing up to 76.0 ± 3.7 mm Hg by lunchtime, and up to 82.0 ± 1.8 mm Hg by the end of the workday (р<0,001). Throughout the day the pulse and average-dynamic pressure tended to in- crease, while end-systolic heart volume tended to decrease. Cardiac output increased due to increases in pulse frequency. Peripheral vascular resistance remained unchanged. Thus, from the beginning till the end of the workday during the spring season, when the climatic conditions are the most favorable, the changes in hemodynamic parameters indicate compensatory strain of hypertensive nature, which is likely to happen due to the weakening of the functional reserves of the cardiovascular system. During the hot season of the year when the impact of cumulative factors on the knitters’ body exacerbated by high temperature levels (34 - 35 ° C), cardiovascular characteristics are adversely affected as well (Table 2). Table 2 – Cardiovascular system characteristics of the operators of knitting machines during the hot (summer) season Hemodynamic Beginning of Lunch break End of workday Significance characteristics workday M±m M±m M±m t P<2-4 1 2 Pulse (b/min) 70,4± 1,9 Arterial blood pressure (mm Hg) maximum 115,2± 2,3 minimum 60,3± 1,4 Pulse pressure 54,9± 1,8 Average-dynamic 78,6± 3,4 pressure End-systolic volume 61,6± 3,6 (ml) Cardiac output (ml) 4336,6± 48,4 Peripheral vascular resistance (dyne) 1449,6± 21,7 From the beginning till the end of the workday, women’s heart rate significantly increased; maximum pressure lowered, minimum pressure increased, pulse pressure, as well as average-dynamic arterial pressure increased. End- systolic volume and cardiac output decreased, in spite of increased heart rate and peripheral vascular resistance (p<0.05-0.001). According to the previously published data [4], hemodynamic changes 3 76,2± 1,4 4 84,8± 2,1 5 5,08 6 0,001 110,4± 2,4 62,5± 1,7 47,9± 1,6 78,4± 2,8 102,0± 1,4 70,4± 1,6 32,2± 2,3 81,1± 2,2 4,68 4,76 7,77 2,5 0,001 0,001 0,001 0,05 56,8± 2,7 44,2± 1,7 4,37 0,001 4328,1± 37,2 3753,2± 42,4 9,06 0,001 1448,7± 32,4 1728,2± 38,6 6,29 0,001 described here indicate significant decrease in functional reserves of the cardio-vascular system, which could potentially result in other pathological changes. Discussion The study results are consistent with those of other authors and prove that intensive industrial noise acts as a stress factor and results in changes in central nervous 12 Центрально-Азиатский научно-практический журнал по общественному здравоохранению system, disorders of internal organs and systems, including the cardiovascular system [5-7]. The study results have been used in the development of national work and rest schedules of the operators of knitting machines, as well as recommendations to improve the working conditions, implementation of which has yielded positive results by reducing the tedium of the working process and improving hemodynamic parameters. Conclusion 1. The working conditions and nature of the working process of the operators of knitting machines affect their performance and strain the functional state of the cardiovascular system, bearing a compensatory nature. 2. In the hot season, the impact of working conditions on the functional state of the cardiovascular system is aggravated by exposure to elevated temperatures, which leads to a significant weakening of the functional reserve of the cardiovascular system. 3. The data obtained indicate the need for revising the work and rest regimen and implementation of measures to improve the working conditions in the knitting factories. References 1. Singh M.B., Fotedar R., Lakshminarayana J. Occupational morbidities and their association with nutrition and environmental factors among textile workers of desert areas of Rajasthan, India. Desert medicine Research Сentre (ICMR), Jodhpur, India. [email protected] J.Occup Health, 2005, Vol. 47(5):P.371-377. 2. Lichnitskaya I.I. Evaluation of the functional systems in determining of the work performance.-Leningrad, 1962. 3. Rosenblat V.V. The problem of fatigue.-Moscow: Medicina, 1975. 4. Umidova Z.I., Glezer G.A., Yanbaeva Kh., I., Korol G.P. Essays on cardiology of the hot climate -Tashkent, 1975. 5. Izmerov N.F. Manual Book on occupational health.-Moscow:Medicina, 1987. 6. Izmeov N.F. Physical facors, ecological-hygienic assessment and control.Moscow: Medicina, 1999. - Vol.2. –P. 6. 7. Izmerov N.F., Suvorov G.A., Prokopenko L.V. The human and noise.Moscow: Medicina. – 381 p. UDC: 614.2-614.88 1 1 U.S. Samarova , D.S. Mussina , Zh.M. Tentekpayev2 1 State medical university of Semey, Kazakhstan. 2 Municipal state public enterprise (MSPE) «Polyclinic №1» of the Pavlodar city, Kazakhstan IMPROVEMENT OF A PRIMARY HEALTH CARE FACILITY Key words: primary medical health care, screening, demographic indicators, hospitalization, driving component to per capita funding. Summary. Development of primary medical care is a key direction for increasing accessibility, quality and efficiency of the health care system. General accessibility level and quality of medical care is largely defined on an out-patient stage. This study considers the issues of a primary medical facility. Analysis of screening studies was done for cervical cancer, breast cancer, colorectal cancer, diabetes, circulatory system diseases, and glaucoma. Organization of hospital replacing technologies, patient hospitalization is considered. 13 Центрально-Азиатский научно-практический журнал по общественному здравоохранению The goal of the study was to develop recommendations for improving primary medical care by assessing the organization of out- and inpatient facility. Materials of the study are statistical data of the departments of statistics and quality control of medical services, of the center of family health and out-patient department of the Municipal state public enterprise «Polyclinic №1» of the Pavlodar city. Methods of study used: information and analytical, statistical, transverse analysis. Many indicators of this organization have improved. There is an improvement of demographic situation, increase of the birth rate, decrease and stabilization of mortality indicator, increase of the natural population growth coefficient up to 9,8±0,6 (2011 - 7,7±0,5) per 1000 of population. Birth rate indicator per 1000 people in 2011 is equal to 17,9±0,8, in 2012 - 19,1±0,8. Birth rate for the last two years is below average, the indicator has increased by 7 %. The mortality indicator per 1000 of people in 2011 is equal to 10,2±0,6, in 2012 - 9,3±0,6. Mortality indicator per 1000 people has decreased by 8%, mortality level is average. Infant mortality decreased by 2, infant mortality in 2011 was 9,1±4, in 2012 4,6±3 (low) per 1000 live-born children. There is a trend of minor increase of incidents from 2,4±0,4 to 2,9±0,4. During the year of 2012, 3033 patients have been treated in the day hospital. Among them 2895 - in the day patient facility and 138 - in the house-based facility. Average cost of treated patients in 2012 was 14 765 KZT, patient-day- 17506 KZT, average length of stay – 6 days, bed turnover – 54 times a year. Inappropriate organization of medical care leads to the increase of patient movement. Service to the patients, who are not registered in this hospital leads to the increase of the indicators and decrease of the incentive component. In order to improve the organization of primary medical care the following is necessary. In order to decrease errors in all cases it is necessary to do internal analysis, heads of the departments should have personal responsibility for the incidents prevention; it is necessary to establish a medical expertise system for improving the quality of medical services. ties, early identification of malignant neoIntroduction plasms by means of screening programs, and According to the health care and medical promotion of healthy lifestyle. According to science development concept in the Repubthe task of the President of the Republic of lic of Kazakhstan, there is a stage by stage Kazakhstan N.A. Nazarbayev «Program of reform of the medical care organization sysoncologic care development in the Republic tem. The priorities change – the focus is of Kazakhstan for 2012-2016» was develshifted from treatment to prevention, from oped and adopted. One of the priority direcin-patient to out-patient facilities [1]. Gentions of the program is development of early eral level of accessibility and quality of diagnostics of oncologic diseases, expansion medical care is largely defined on an outof screening studies. patient stage [2]. Center for family health provides qualiCurrently there is a creation of different fied pre-hospital service to the population in organizational models of out-patient clinical the out-patient conditions, at home at a day help on the basis of stage by stage implepatient facility or home-based care, includmentation of role of general practice physiing implementation of prevention and cian [3]. General practice physicians in the screening programs [5]. National screening structure of out-patient facilities play the system allows to identify and prevent dismain role in the PHC system, with the goal eases at early stages [6]. Screening examinaof providing most of the prevention work, tions of adult population are aimed at preensuring certain social effect [4]. State vention, early identification and prophylaxis health care development program «Salaof the following 1) main diseases of circulamatty Kazakhstan» for 2011-2015 emphatory system – arterial hypertension, ischemic sized the strengthening of prevention activiheart disease and their development risk fac14 Центрально-Азиатский научно-практический журнал по общественному здравоохранению tors among men and women; 2) diabetes among men and women; 3) pre-tumor, malignant neoplasm of cervix among women; 4) pre-tumor, malignant neoplasm of breast among women; 5) glaucoma among men and women; 6) pre-tumor, malignant neoplasm of large intestine and rectum among men and women [7]. Thanks to a common national health care system, the Ministry of Health of the Republic of Kazakhstan allocates funds for improvement of medical workers motivation in local services (incentivizing component to the per capita norm) for the provision of accessible and high quality primary medical care. Work of the local service is evaluated by the following indicators: maternal mortality, pregnancy with extra genital pathology, abortion to the number of live births ratio, infant mortality from acute intestinal or respiratory infections, neglected cases of lung TB, neglected cases of malignant neoplasms, hospitalization level with complications of the cardiovascular system, level of out-patient care use. The goal of our study is to set recommendations for improving the activity of primary medical care services by assessing the organization of medical services in an out-patient facility. In order to achieve this goal the following objectives were set: 1. To calculate main demographic indicators; 2. To assess the organization of screening activities based on statistical information; 3. To conduct monitoring of scheduled hospitalization on the republican and regional levels under the framework of guaranteed amount of free medical help; 4. Assessment of organization of inpatient-replacing care. This study was done on the basis of Municipal state public enterprise «Polyclinic №1» of the Pavlodar city, Kazakhstan. Number of people registered in this hospital was 91080 in 2012, and 91340 in 2011. Materials and methods Materials of the study are statistical data of the departments of statistics and quality control of medical services, of the center of family health and out-patient department of the Municipal state public enterprise «Polyclinic №1». Methods of study used: informational and analytical, statistical, cross-section analyses. Study design - descriptive. This type of design allowed to identify programs for further health care development and improvement of primary medical care provision to the population. With the help of «REST» program we have received statistical data for the screening-based studies. Statistical data of the portal of hospitalization bureau allowed identifying cases related to incorrect hospitalization of patients. The quality and level of medical care provided can be evaluated based on demographic indicators. Results During the research, the demographic indicators have been calculated, organization of screening-based studies and MSPE Polyclinic №1 of Pavlodar city hospitalization bureau were assessed, results of mathematic calculations and statistical data are shown in Tables №1,2,3. Many indicators of the MSPE Polyclinic №1 of Pavlodar city have improved. There is an improvement of demographic situation, increase of the birth rate, decrease and stabilization of the mortality coefficient, increase of the natural population growth coefficient up to 9,8±0,6 (2011 - 7,7±0,5) per 1000 population. Whereas the general birth rate coefficient (in %) is varying from 15 to 19,9, the assessment of the birth rate is below average. Whereas the general mortality coefficient (in %) was varying from 10 to 14,9, the mortality indicator is considered as low. In this case the birth rate indicator per 1000 people in 2011 is equal to 17,9±0,8, in 2012 - 19,1±0,8. Birth rate level for 2 years was lower than average, the indicator increasing by 7%. Mortality indicator per 1000 population has decreased by 8%, mortality remained at average level. Infant mortality has 15 Центрально-Азиатский научно-практический журнал по общественному здравоохранению decreased by half, the level of infant mortality in 2011 was 9,1±4, in 2012 4,6±3 (low) per 1000 of live-born children (Table 1). Population registered in the polyclinic undergoes screening according to the plan and schedule. Despite positive changes in the demographic situation according to the data of screening studies, there is still low level of health among women and children. In course of screening in 2012 there were 7 cases of breast cancer, 5 cases of colorectal cancer, 1 case of cervical cancer identified (Table 2). There is a trend of minor increase of incidents from 2,4±0,4 to 2,9±0,4 (Table 3). Table 1 – Demographic indicators of the MSPE «Clinics №1» of the Pavlodar city Demographic indicators 2011 2012 N % N Birth rate per 1000 people 1635 17,9±0,8 1740 Mortality rate per 1000 people 929 10,2±0,6 849 Infant mortality per 1000 live-born children 15 9,1±4 8 Natural growth 706 7,7±0,5 891 Table 2 – Preventive screening in 2012 Population group Plan of Patients identified prof. Exam cov- N % erage Children and 18001– 6193 34,4±0,7 adolescents 100% Women (30-60) years 2492 – 1 0,04±0,08 old for cervix cancer 100% Women (50-60) for 23817 0,3±0,2 breast cancer 100% Men and women (408122 – 8 01,±0,07 70) for glaucoma 100% Men and women (1810085 – 394 64) for circulatory dis3,9±0,4 100% eases, diabetes Men and women (505300 – 70) for colorectal can5 0,09±0,08 100% cer Healed N % 6193 34,4±0,7 % 19,1±0,8 9,3±0,6 4,6±3 9,8±0,6 Included into register N % 966 5,4±0,3 1 0,04±0,08 1 0,04±0,08 7 0,3±0,2 7 0,3±0,2 8 01,±0,07 8 01,±0,07 394 3,9±0,4 394 3,9±0,4 5 0,09±0,08 5 0,09±0,08 Table 3 – Scheduled hospitalization and round the clock in-patient departments 2011 2012 Scheduled hospitalization N % N % Hospitalized 7014 7,7±0,2 7216 7,9±0,2 Incidents 167 2,4±0,4 209 2,9±0,4 As for the in-patient replacing care there is a day patient care facility at the polyclinic for 53 beds. State order in 2012 was 3015 patients with a total of 42 518 000 KZT (with additional 2 000 000 KZT in December 2012). Day patient care works 2 shifts. For 12 months of 2012 there were 3033 patients treated in day patient care, out of them 2895 in the day patient care facility and 138 at home-based care. Average cost of a treated patient in 2012 was 14 765 KZT, bed-days –17 506, average 16 Центрально-Азиатский научно-практический журнал по общественному здравоохранению length of treatment was 6 days, bed turnover – 54 times a year (4,5 times per month). Discussion Each year the issue of oncologic conditions becomes more serious, which is supported by the organizational statistics. Local services, which ideally should include general practice physicians, local nurses, social workers, conducts preventive work with population, however new cases of neoplasms are registered more often. This is related to the fact that these specialists serve not only the population registered to this hospital, but others too. According to the Prikaz of the Republic of Kazakhstan «On health of the population and health care system», the citizens have a guaranteed right to the free choice of medical organizations and a physician, as well as high quality and timely medical care, however, each clinics of family outpatient facility should strive to serve only the population registered with them, because incentivizing coefficient to each local area facility depends on that number. New cancer cases can decrease their quarterly payments because it is one of the indicators for assessing the work of medical staff. In order to exclude cancer diagnostics cases it is necessary to crosscheck whether the patient is found in the portal of population registry, this will allow to lower the values of this indicator and increase the incentivizing component. The trend of insignificant increase of incidents is related to the fact that when registering the patients through the portal of bureau for hospitalizations, physicians may enter the wrong the IDC-10 code. Furthermore, certain conditions can be treated in a day patient facility. Conclusion In order to improve the organization of primary medical care it is necessary to pay attention to the following aspects. 1. To decrease mistakes, the internal investigations of all cases is essential; all department heads also need to take personal responsibility for not allowing such incidents to happen; 2. It is necessary to create medical expertise system to improve medical services quality; 3. Physicians need to know the list of diseases that should be treated in day patient facility, because the lack of awareness on this issue leads to increased patient movement and incidents; 4. It is necessary to decrease the level of in-patient care, providing out-patient replacing care; 5. By decreasing the level of in-patient care provision, we safe state budget funds and increase funds for motivation of medical workers; 6. Patients service, who are not registered with this particular polyclinic, leads to the increase of indicators and decrease of incentivizing component. References 1. State program of health care development in the Republic of Kazakhstan «Salamatty Kazakhstan» for 2011 – 2015, approved by the decree of the President of 29 November 2010, № 1113; 2. Ricbard J. Baron, MD, Maryland, USA. “New pathways for primary care: an update on primary care programs from the innovation center at CMS”// Journal Article. Annals of Family Medicine 2012 Mar-Apr; Vol. 10 (2), pp. 152-5. 3. Chizhikova T.V. Improvement of primary medical care to the population of rural municipal area // author’s summary, Moscow, 2010; 4. Sinyavskiy V.M., Zhuravlev V. A. Organization of systemic management, records and control in out-patient clinics service // Glavvrach. – 2006., №6. – P.41-50; 5. Order of the acting Minister of healthcare of the Republic of Kazakhstan of 5 January 2011, № 7 On approval of the Policy on work of medical organizations, providing out-patient services. Registered in the Ministry of justice of the Republic of Kazakhstan on 14 February 2011, № 6774; 6. Address of the President of the Republic of Kazakhstan– Leader of the nation 17 Центрально-Азиатский научно-практический журнал по общественному здравоохранению 10 November 2009, № 685 «On approval of the Rules of preventive medical examinations of the target population groups» with amendments and changes of 16 March 2011, № 145. Nursultan Nazarbayev to the people of Kazakhstan «Strategy «Kazakhstan-2050» new political course of an accomplished state» of 14.12. 2012; 7. Order of the acting Minister of healthcare of the Republic of Kazakhstan of UDC:616.36-002 1 1 2 3 M.K.Saparbekov , A.A.Bekbulatova , I.H.Shuratov , E.S.Utegenova , A.S.Mutaliyeva 1 3 Kazakhstan school of public health of the Ministry of Health of the Republic of Kazakshstan 2 Research center of hygiene and epidemiology named after Kh. Zhumatov 3 Scientific-research center of sanitary-epidemiological expertise and monitoring of the MoH RK APPROACHES TO IMPROVEMENT OF EPIDEMIOLOGIC SURVEILLANCE OVER VIRAL HEPATITIS C ON REGIONAL LEVEL Key words: hepatitis С virus, epidemic process, epidemiological surveillance, laboratory diagnostics, prevention, Almaty, Kazakhstan. Summary. Hepatitis C virus (HCV), forming a chronic process in the liver, is a relevant topic for public health. According to WHO assessment in different countries of the world there are 180 million people infected with HCV. Progressing growth of the HCV morbidity, difficult process with relapses, often complications, high mortality require organization and conduct by health care organizations of an efficient and high quality epidemiological surveillance over Hepatitis C. The aim of the work is to form approaches to improvement of epidemiological surveillance over HCV on the basis of epidemiological characteristics study of the HCV in Almaty city. There were epidemiologic, serologic, sociologic and statistical methods used. Analysis of epidemiological situation with HCV in Almaty was done on the basis of official reporting study of Department of state sanitary epidemiological surveillance of Almaty for the period of 19982012, as well as results of serological study of etiological structure of viral hepatitis in 171 adults with subclinical manifestations of hepatitis C – all Almaty residents- with the help of enzyme immunoassay (EIA). In order to establish possible factors and infection ways an anonymous survey was done. Peculiarities of HCV distribution in Almaty were specified. It was noted that according to the official statistics data for the studied period among Almaty population there was a low level of acute HCV morbidity registered (3 per 100 thousand people). Serological study of 171 people, who came to the laboratory with chronic hepatitis has identified that the share of acute hepatitis is 52,0%. High frequency of antibodies to HCV was identified in the age group of 20-24 years – 30,3%. During the analysis of anonymous questionnaires it was found out that the leading infection risk factor is sexual transmission (64,0%). In the process of study with consideration of the reference data there were approaches identified to improvement of epidemiological surveillance over HCV in Almaty, the essence of which lies in enhancing the quality of etiological diagnostics, systematic tracking of different determinants of epidemic process (monitoring of epidemiological situation, laboratory-epidemiologic control, social monitoring). The studies allowed to identify peculiarities of epidemic process of acute hepatitis C virus in Almaty, show high frequency of chronic hepatitis C identification (52,0%) among people with 18 Центрально-Азиатский научно-практический журнал по общественному здравоохранению subclinical hepatitis forms on the regional level with consideration of identified peculiarities of epidemic process. Background Hepatitis C is a globally spread viral infection and is the main reason for chronic liver diseases, including liver cirrhosis, hepatocellular carcinoma [1-5]. According to the WHO assessment there are 180 million people in the world infected with hepatitis C virus [6]. The data on hepatitis C prevalence in Kazakhstan are incomplete and contradictory, because official registration of HCV in the republic has started in 1998 [7]. Currently there is a range of research studies in Kazakhstan aimed at studying the infection and morbidity of HCV in certain regions of the country among different population groups [7-10]. At the same time there are not enough studies related to the improvement of epidemiological surveillance system over hepatitis C virus on the regional level with consideration of infection prevalence in a particular administrative district. The aim of our study was to form approaches to improvement of epidemiological surveillance over HCV on the basis of epidemiological and etiological characteristics study of the HCV in Almaty city. Materials and methods In order to achieve the aim and objectives there were epidemiologic, serologic, sociologic and statistical methods used. Almaty was chosen as the territory for study conduction, where hepatitis C identification and registration on the basis of clinicalbiochemistry and laboratory tests is better compared to other regions of the country. Materials for the study were data of official reporting of Department of state sanitary epidemiological surveillance of Almaty for the period of 1998-2012. During retrospective epidemiological analysis of HCV morbidity longstanding dynamics and morbidity development trends were studied. In order to assess morbidity intensive indicators per 100 thousand people were used. Intensity of changes in a dynamic time series was defined by means of increase (decrease) rate calculation Тincr (±). Increase (decrease) rate is a ratio of absolute increase (decrease) of the present period and absolute level of the previous period, represented in percent [11]. In order to identify the prevalence of HCV among 171 inhabitants of Almaty, who turned to the laboratory of Research center of hygiene and epidemiology named after Kh. Zhumatov an identification of antibodies to HCV with EIA method was done, using testing systems «Best– anti-HCV Ig G and Ig M» of the CJSC «Vector- Best» (Novosibirsk, Russian Federation). The results of optical density measurements were registered at the wave length 450 nm with a reader «Bio – Rad Instruments Inc». At the same time in order to assess demographic indicators and study of the possible infection factors and ways an anonymous survey was done of the people tested for HCV. There were a total of 171 people surveyed, including 107 men (59,1%) and 70 women (40,9%). Mean age was 32,5 ± 3,4 years. Surveyed individuals were people diagnosed with «chronic hepatitis», who were referred for study of viral hepatitis markers, as well as people, who turned with the request to get tested for viral hepatitis. Statistical analysis was done using a PC and «Excel» application. Mean error was calculated– m, reliability of mean differences was defined using Student’s test – t, with р ≥95%. Results Study of the acute hepatitis C virus morbidity among Almaty population in the given period has shown that during the first year of hepatitis C cases registration there was high morbidity within the limits of 1,7 to 2,8 per 100 thousand people. Later on there was a gradual decrease of morbidity indicators down to 0,07 – in 2012. Calculated decrease rate Т inc(-) in Almaty was 95,9%. Analysis of the serological study re19 Центрально-Азиатский научно-практический журнал по общественному здравоохранению sults has shown that antibodies to HCV were identified in 89 people (52,0 ± 3,8%), to HBV in 65 people (38,0 ± 3,7%). Mixed cases of chronic hepatitis C and B were (3,9 ± 1,4%), B and D– 4 (2,3 ± 1,1%). In 7 (4,1 ± 1,5%) cases there were no specific antibodies of chronic hepatitis В, С and D identified. Among antibodies carriers there were 41 (46,1%) men, 48 (53,9%) women. The age distribution among the carriers was as follows: 27 people were ages 20-24 (30,3%), 23 people –in the age group of 25-29 years (25,8%), 22 people – in the age group of 3039 years (24,7%), 17 people were 40 and older (19,1%). An important question was related to the information on possible factors and ways of infection. Out of 89 carriers of HCV antibodies 64,0% pointed out the sexual contact as a possible way of transmission, 11,2% pointed out IV use of drugs, 16,8% surgical interventions, 7,9% of the respondents did not provide an answer. In course of the study based on the reference data and collected data, there was an epidemiological surveillance algorithm created for HCV (picture 1). When developing main points of the algorithm we were aware that epidemiological surveillance system is rather comprehensively developed by both domestic and foreign authors [6,12-14]. However, despite relative consensus over «epidemiological surveillance» definition in the literature there are seen different approaches to its contents from functional standpoint. A range of authors [15] points out surveillance as a generalized form of epidemic work, i.e. surveillance is matched with the system of epidemiologic services to population in general. Lately CDC experts have taken an active part in the development of epidemiological surveillance concept, who define epidemiological surveillance as a «systematic collection, analysis, interpretation and distribution of data on health» [6,13,14]. This definition considers modern epidemiology as a diagnostic instrument for public health care, allowing to identify and solve problems to improve health of the nation. We suggest the following definition of epidemiologic sur- veillance for hepatitis C virus. Epidemiologic surveillance for HCV means continued collection, systemic analysis of epidemiological and diagnostic information on HCV, having the goal of assessing possible territorial spread of infection in order to implement targeted epidemic and prevention activities, analysis and assessment of their efficiency, forecasting, justification and development of efficient managerial decisions. As it is seen from picture 1, recommended algorithm for epidemiologic surveillance system suggests in its structure 2 blocks, ensuring its function: 1. Block of information-diagnostic support; 2. Block of epidemiologic analysis. Guided by the WHO recommendations on «10 elements of epidemiologic surveillance» [4,13], we have identified the following information flows in the epidemiologic surveillance system: 1. Information, characterizing the situation with HCV in the world, Kazakhstan, and in certain regions of the country. 2. Information, characterizing the condition of laboratory-epidemiological control of hepatitis C virus. By laboratoryepidemiological control we mean a system of activities, including organization of HCV laboratory diagnostics, tracking the epidemic process dynamics by transmission ways and factors, ensuring laboratory testing quality control on pre-analytical, analytical and post-analytical stages. 3. Information, characterizing social environment factors, which determine epidemic process (social monitoring). It should be noted that such distribution of information flows for HCV is not accidental, and it is related to the fact that epidemiological surveillance in Kazakhstan on a regional level of implementation is mostly a prerogative of practical facility, capabilities of which in regards of access to certain part of information are limited. Furthermore, the issue of correct information flows organization is also important for the republic from the standpoint of tracking (monitoring) 20 Центрально-Азиатский научно-практический журнал по общественному здравоохранению organization with the help of computer technologies. The baseline in the recommended HCV epidemiological surveillance system is block of epidemiologic situation analysis, including descriptive-analytical methods, forecast and development of a relevant prevention program. Block of informational diagnostic support Information on HCV in the world, CIS, Kazakhstan and specific region Laboratory-epidemiological control State of HCV epidemic process by transmission ways and factors Information on social factors, influencing spread of HCV (social monitoring) Serologic diagnostics of viral hepatitis, registration of acute, chronic and subclinical forms Ensuring of laboratory testing quality control Epidemiologic analysis block Retrospective analysis Operational analysis Prospective analysis HCV epidemiological situation assessment in the region Forecast HCV prevention program Picture 1 – HCV epidemiological surveillance algorithm From organizational standpoint implementation of epidemiologic surveillance system implies participation both of treatment and prevention, as well as specialized medical facilities. Epidemiologic surveillance is done by comprehensive interaction of all healthcare bodies and facilities of a given region. Central role among organizations is played by the Department of sanitaryepidemiological surveillance, laboratory of the Sanitary-epidemiological expertise center with organizational-methodological support of the Research center of sanitaryepidemiologic expertise and monitoring of the committee of state sanitaryepidemiological surveillance of the MH of RK. Discussion Conducted study has shown that in initial years of HCV registration (1998-2001) in Almaty there were the highest morbidity indicators seen in the range of 1,7 to 2,8 per 100 thousand people. Such wide interval of morbidity indicators is probably explained by a range of reasons, such as: imperfect diagnostics testing-systems of EIA on an initial stage, their insufficiency and diagno21 Центрально-Азиатский научно-практический журнал по общественному здравоохранению sis «acute hepatitis C » on the basis of only clinical-biochemistry data, as well as unsatisfactory qualification level of the lab technicians at that period. Assessing epidemiologic situation in Almaty with acute hepatitis C it is necessary to state that by morbidity level it is insignificant, its intensive indicator being no more than 3,0 per 100 thousand people and it is not possible to assess the infection development trend in the region with it. A similar low morbidity with acute forms of viral hepatitis is seen in many countries of the world. So, according to the data of the US Centers for disease control and prevention (СDС), in the USA the level of acute hepatitis C prevalence has decreased from 80-s till 1996 by more than 80% and was 1,8% [16]. Nechayev et al. (2011), studying chronic hepatitis epidemic process evolution in Saint-Petersburg have noted that despite significant decrease of acute hepatitis C morbidity in general the situation with hepatitis C in the region is adverse [1]. The authors recommend to conduct HCV prevalence assessment for three registered clinical entities: acute hepatitis, chronic hepatitis (CHC) and anti-HCV carriage. Considering the US experience, where acute hepatitis C is currently not registered [16], for assessment of epidemiologic situation with HCV in Kazakhstan we recommend to exclude «acute hepatitis C» from reporting, and include «chronic HCV» a general registry of all cases of HCV – infection among patients with acute and chronic hepatitis, including laboratory confirmed subclinical forms. Analysis of possible transmission factors and ways has shown that among hepatitis C patients the predominant transmission way is sexual (64,0%), although by the data of E.S. Utegenova (2009) this way is almost 3 times lower and is 23,2% [8]. As follows from the survey conducted the rate of HCV infection by using IV drugs is 11,2%. Apparently, IV drug use, although is a high risk factor according to the references [3,4,7,16,17], in our studies of the given population did not have a significant impact. The study of etiological structure of 171 examples of serum of the patients with suppressed form of hepatitis have shown that except for the cases of independent nosological forms of chronic hepatitis В and С there are mixed forms of these diseases (3,9%), including cases of chronic hepatitis D (2,3%), as well as not-typed chronic hepatitis (4,1%). Let us emphasize that identification of mixed forms of chronic viral hepatitis is important for both clinicians and epidemiologists for improvement of epidemiological surveillance quality over viral hepatitis. Furthermore, identification of the nottyped forms of chronic liver damage suggests existence of other types of hepatitis and stimulates search for them. With regard to this data we thing it is reasonable to study each hepatitis case for all specific antibodies of acute and chronic hepatitis with the goal of maximizing identification and registration of all possible cases. Such methodological approach, in our opinion, will allow quality implementation of epidemiological surveillance over acute and chronic forms of hepatitis in the country, significantly raising the quality, information and efficiency of prevention activities for this infection in practice. Conclusions 1. Dynamics of acute hepatitis C morbidity of Almaty population does not reflect objective reality, does not allow to judge trends of infection development or epidemiological potential of HCV – infection. 2. Proposed approaches to improvement of epidemiological surveillance system over hepatitis C virus that are epidemiological-diagnostic in nature and that consider different surveillance levels (information flows), ensure control over epidemiological situation, fast implementation of epidemiological activities and targeted prevention. 22 Центрально-Азиатский научно-практический журнал по общественному здравоохранению logical factors that influence health of urban territories population // XIV International scientific conference «Family health - XXI century»- Rimini (Italy), 28 April-5 May, 2010.-P.337-338. 11. ReznikV.L., Arystanova G.T., Nurbayev A.S. et al. Bases of statistical analysis and its application in medicine and public health care (educational-methodological guideline). Алматы, 2003, - 60 p. 12. Dalmatov V.V. Current state of epidemiological surveillance issue as a specific form of epidemiological diagnostics in the system of epidemiological services to population // In the book: «Epidemiological surveillance. Theory, methods and organization». Saint Petersburg, 1997. – P. 127-13. 13. Davidyanz V.A., Gyirdzhan K.T. Modern epidemiological survewillance (study guide).- Yerevan, 2007.-153 p. 14. Saparbekov M.K. Lectures on general epidemiology. Selected lectures.- Almaty, 2012.- 78 p. 15. Belyakov V.D. Epidemiological surveillance as the basis of modern epidemiological work organization // Microbiology journal. – 1985. - №5. – P. 53-58. 16. Margolis H. Viral Hepatitis // Public Health Preventive Medicine/ Ed by R.B. Walace. – Stamford, 1998. – 1291 p. 17. Nechayev V.V., Mukomolov S.L., Nazarov V.Yu et al. Evolution of epidemiological process of chronic hepatitis in Saint Petersburg // Gastroenterology of Saint Petersburg – 2011. - №1. – P. 21-24. References 1. Report on health care condition on Europe. 2009 // WHO, 2011. -205 p. (translated form English). 2. Lobzin Yu.V. Infectious diseases. Saint Petersburg, 2001.-543 p. 3. Anderson R., May R. Human infectious diseases. Dynamics and control. М, 2004.-784 p (translated form English). 4. Johan Gisecke. Modern encyclopedia of infectious diseases. Stockholm, 2004.-276 p (translated form English). 5. Kudyrova B.M. Quality of life of Hepatitis C virus patients in different treatment types //Epidemiological and infectious diseases.- 2007.- №3.- p.36-38. 6. Viral hepatitis: etiology, epidemiology, clinical diagnostics, treatment and management of patients // CDC- USAID Edition.- 2001. – 253 p. 7. Shuratov I.H., Saparbekov M.K. Problems of viral hepatitis and HIVinfection on the verge of the XXI century and their solution ways //Journal. Medicine of Kazakhstan. -2001.-№3.-P.23-30. 8. Utegenova E.S. Hepatitis C morbidity of Almaty city.- Medicine, 2009. -№1. P.47-48. 9. Shuratov I.H., Khan O.E., Omarova M.N.et al.. Improvement of hepatitis C epidemiological surveillance technology // XIV International scientific conference «Family health - XXI century»- Rimini (Italy), 28 April-5 May, 2010.-P.498-499. 10. Omarova M.N., Orakbay L.Zh., Shuratov I.H., Saparbekov M.K. Biotechno- UDC: 616.36-002 1 1 2 2 3 I.Kh.Shuratov , A.B.Dzhumagaliyev , A.M.Kuatbayeva , Sh.U.Zhandossov , Z.K.Kushtekova , 4 E.V.Karpushnikova , S.T.Suleymenova 5 1 Research Center for Hygiene and Epidemiology named after Khamza Zhumatov of the Ministry of Health of the Republic of Kazakhstan; 2 Republican state budget-supported enterprise «Scientific-Practical Center of the Sanitary Expertise and Monitoring» of the committee of the state sanitary-epidemiologic surveillance of the Ministry of Health of the RK; 3 State sanitary-epidemiological surveillance of the Zhambyl area of Almaty region, Republic of Kazakhstan; 23 Центрально-Азиатский научно-практический журнал по общественному здравоохранению 4 Sanitary-epidemiological surveillance of Atbasar area of Akmola region, Republic of Kazakhstan 5 Sanitary-epidemiological surveillance department of the sanitary-epidemiological surveillance administration of the Alamly area of Almaty, Republic of Kazakhstan. EPIDEMIOLOGIC PARAMETERS OF HEPATITIS A IN CENTRAL AND SOUTHEASTERN REGIONS OF KAZAKHSTAN Key words: hepatitis А, epidemiologic parameters, vaccination, immunizing power. Summary. Up until 2000 viral Hepatitis А was characterized by high prevalence among Kazakhstan population. Despite notable decrease of Hepatitis A morbidity, up to present time the share of children under 14 among all people with the disease ranges between 65-80% in different years. There is a difference in the distribution of Hepatitis A cases across the regions of Kazakhstan. Under this conditions, the characteristics of epidemiologic parameters of Hepatitis A and vaccination efficiency are important to control the infection. The work was done with the application of the generally accepted epidemiologic analysis methods of morbidity and enzyme immunoassay of the serums from children for the presence of anti-HepA IgG. In Almaty and Akmola regions the main parameters of epidemiological process of Hepatitis A are preserved. The differences are related to the lower share of children under 14 (50%) and morbidity shift to older groups (11-14 years) in the age structure of people with the disease, as well as high prevalence of students (41%) in the structure of social-professional groups of patients in Akmola region. Additionally, high immunizing power of the Hepatitis A vaccine is shown for the children in rural areas. It is necessary to further strengthen epidemiological surveillance and etiological control over Hepatitis А with identification of the HepA genotypes, as well as nation-wide vaccination of children. Introduction Recently a notable decrease in Hepatitis A (HepA) morbidity is seen in a range of countries, including Kazakhstan [1-4]. The reason is tied both with the natural cycle of HA epidemiological process dynamics and decrease of birth-rate, reduction of number of pre-school organizations and number of children attending them, and selective immunization for HA by epidemiologic indications [5 - 7]. However, the issue of Hepatitis A remains topical for healthcare in many, including Kazakhstan. This is primarily related to the identification of the mutant and recombinant virus strains of the HepA, their dissemination across the population and complexity of epidemic situation [8 - 12]. Under these conditions, the most radical way to manage epidemic process of HepA is vaccination of children against this infection, which is shown on the example of Mangistau region, where the HepA morbidity among children has decreased more than 60 times during the period of 2001-2010 as the result of widespread immunization. [13]. Unfortunately, high cost of the HepA vaccine has limited wide-scale application of the vaccine in a number of regions in Kazakhstan up to 2012. In this regard, ensuring adequate surveillance over HepA is very important on the basis of identifying the differences of epidemiologic parameters of the disease in various regions. Materials and methods We used the official HepA morbidity data of the departments of the state sanitaryepidemiological surveillance, published in the bulletin of the Republic sanitaryepidemiological service during 2005-2011. Epidemiologic analysis of the HepA morbidity was performed according to the methods described elsewhere [14]. 24 Центрально-Азиатский научно-практический журнал по общественному здравоохранению Serums of 156 children ages 3 to 13-14, vaccinated against HepA with one and two doses of vaccine, received in 3-5 months after the last shot, as well as 97 nonvaccinated children were studied for the presence of anti- HepA IgG using the Enzyme-linked immunosorbent assay (ELISA). To perform ELISA we used testing systems of the CJSC «Vector Best» (Novosibirsk) on the equipment of “Anthos” (Austria). The work was done in Almaty (South Region) and Akmola (Central Region) Oblasts, which are different in the nature of productive activity and climatic conditions. HepA morbidity analysis for the last 7 years has been performed. 156 vaccinated and 97 non-vaccinated (control group) kids, who live in rural area, were tested for the presence of anti-HepA IgG. Results and discussion Dynamics of annual HepA morbidity indicators among the general population in 2005-2011 across the country and in Almaty and Akmola regions specifically is shown in table 1. Table 1 - Dynamics of HepA morbidity among the general population across the country and in Almaty and Akmola regions Regions Republic of Kazakhstan Almaty region Akmola region Morbidity indicator (0/0000) by years 2005 2006 2007 2008 2009 53,5 52,2 69,6 40,4 31,6 32,5 25,6 44,4 43,7 35,1 16,3 13,8 25,8 9,5 7,7 As seen from the table, HepA morbidity in Kazakhstan was fluctuating from 53,5 to 13,7 per 100 thousand people with slight increase up to 69,7 in 2007. The rate of decrease in 2005-2011 was 3,9. In Almaty region the incidence indicators were fluctuating from 32,5 down to 11,8. In 2007 there was a slight increase up to 44,4 per 100 thousand people. In general, the morbidity has decreased 2,75 times. In Akmola region the indicators were lower compared to Almaty region and the country overall; the variations were within the limits of 16,3 to 6,3. The decrease rate was 2,6. There was a slight increase in 2007 (25,8). In general, it should be noted that the HepA Decrease rate 2010 27,4 26,7 11,0 2011 13,7 11,8 6,3 3,9 times 2,75 times 2,6 times morbidity indicators among the population of Almaty region are similar to those of the country. The annual HepA morbidity indicators in Akmola region were 2-4 times lower than in Almaty region and the country, but the decrease rate is the slowest at 2,6. Perhaps, these differences depend on the age structure of the registered patients. The HepA morbidity dynamics among children, the data for which is presented in Table 2, in the studied regions follows the HepA dynamics among the general population. In Akmola region morbidity among children was also lower than in other regions. The decrease rate was the lowest as well (3,2). Table 2 – Dynamics of HepA morbidity among children population of the RK and studied regions Regions Republic of Kazakhstan Almaty region Akmola region Morbidity indicator (0/0000) 2005 2006 2007 175,0 180,2 239,9 83,3 68,2 68,1 47,7 34,7 56,9 The share of children among the HepA patients was predominating. So, in the RK the share of children under 14 (table 3) is fluctuating from 65,9% to 86,2% (80,8% on average), in Almaty region - 76,8% (fluctua- 2008 133,5 141,2 19,3 2009 102,2 37,5 14,4 2010 84,0 80,9 22,8 2011 36,9 22,0 14,9 Decrease rate 4,7 times 3,8 times 3,2 times tions from 63,3% to 88,5%). In Akmola region the share of children with HepA in 2005 was 70,3%, during the next years 2006-2011 it was fluctuating from 40,3% to 55,3%. The average annual value was 25 Центрально-Азиатский научно-практический журнал по общественному здравоохранению 50,6%. In other words the other half of patients (50%) in Akmola region was com- prised of adults, whereas in Almaty region their share was 23,2%. Table 3 – Share of children under 14 with HepA Regions Republic of Kazakhstan Almaty region Akmola region Share of children with HepA (in%). 2005 2006 2007 2008 2009 86,2 85,1 82,2 87,1 85,1 88,5 87,5 74,1 78,4 73,8 70,3 55,3 48,2 43,6 40,3 Obviously? The abovementioned low morbidity level and low rate of decrease in HepA morbidity in Akmola region is related to the higher prevalence of adult population among patients who were unlikely to be 2010 74,5 72,4 44,4 2011 65,9 63,3 52,2 Average annual value 80,8 76,8 50,6 vaccinated because of the epidemiologic indications. Average HepA incidents indicators for 2005-2011 by age risk groups are shown in Table 4. Table 4 – HepA incidence by age group (average values for 2005-2011) Age groups Average HepA incidence by regions for 2005-2011 Kazakhstan Almaty region Akmola region 3-6 years 150,0 95,6 24,7 7-10 years 122,8 102,3 38,7 11-14 years 72,8 86,3 36,3 15-29 years 27,2 32,ё 16,4 By the social-professional status, school As seen in the country, HepA prevalence children dominate among the HepA patients was the highest in the age group of 3-6 years in Almaty region (64,2 per 100 thousand), (150,0). In Almaty region in the group of followed by organized (29,5) and nonchildren of 7-10 years old the morbidity inorganized children (22,6). In Akmola region dicator was 102,3; in the group of 3-6 years significant morbidity is seen among the stuit was slightly lower (95,6). In Akmola redents (41,1), school children (17,0) and nongion with rather low indicator in the group organized children (8,0). of children of 3-6 years (24,7), as well as in As it can be seen the studied regions difother older groups of 7-10 and 11-14, the fer in social-professional structure of the indicators were almost the same (38,7 and HepA patients. For instance, in Akmola re36,3 respectively). gion the HepA is more common in adult Therefore, there is a notable shift in morpopulation. bidity seen to the elder groups of children Analysis of HepA transmission factors and adolescents. Average annual HepA has shown that in Almaty region the share of morbidity indicators of the population of the identified factors is on average 61,5, includstudied area are shown in the picture. ing swimming– 1,1%, water factor – 5,5%, As seen in picture 1, compared the counfood factor - 0,0 and household contact – try with a long-standing average HepA mor54,9% ; in 38,5% of the cases the transmisbidity indicator of 136,4, in Almaty region it sion factor has not been identified. In Akmowas 71,6 (almost 50%), in Akmola region it la region the share of identified factors was was even lower (30,1). In the areas of Al73,9%, including water factor – 28,3%, maty region, namely in Karatak area, this household contact– 45,6%; in 26,1% of the indicator was 26,5; on the territory of cases the factor has not been identified. Zhambyl area is was 29,5. In the areas of The similarities of both regions lie in the Akmola region these indicators were lower. dominant role of contact-household transThus, in Atbasar area - 8,9; in Burabai area mission route, as well as participation of the 8,6. 26 Центрально-Азиатский научно-практический журнал по общественному здравоохранению water factor in this process. Earlier we HepA have shown that water factor acts like a trigger, spreading HepA further by means of close contact in households, among colleagues and in teams (at home, at preschool, school and others) [15]. Results of the analysis of the share of children susceptible to HepA and the influence of children vaccination are presented in table 5. As seen from the data in table 5, among 97 non-vaccinated children 42 (43,3%) were not susceptible to HepA. They had antibodies to HepA in blood, apparently as a result of earlier HepA infection. Other 55 (56,7%) children were susceptible to HepA, and among them the HepA morbidity was spread, which is seen in the regions. After vaccination with 2 doses of vaccine 97,4% of the vaccinated people became unsusceptible to HepA, creating specific IgG – antibodies against HepA. Table 5 – Decrease of HepA susceptibility by means of children vaccination Serums studied Groups of children HepA resistant HepA susceptible (presence of anti(absence of antiHepA IgG) HepA IgG) abs (M±m %) abs (M±m %) Serums from nonvaccinated (n=97) Serums from vaccinated (n=156) Children age 3-11 (n=97) Children age 3-11 (n=156) The refore, vaccination immediately increases the resistance of children to HepA, due to its high immunizing power. However, vaccination of children in the regions is funded from local budget with tactically different selective methods: either 42 43,3±5,03 152 97,4±1,24 55 56,7±5,03 4 2,6±1,24 only children of 2-3 years, or children from 3 to 6 years of age, as the most vulnerable, or as pre-seasonal vaccination of the risk groups or children, who were in contact with HepA patients in their teams. Such HepA fight tactics, conducted in the regions since 27 Центрально-Азиатский научно-практический журнал по общественному здравоохранению 2003, did not lead to drastic changes of its epidemiologic parameters and HepA epidemic process dynamics. The preserved epidemiologic parameters of HepA in the regions are a sign of active HepA spread. In the midst of the growth of birth rate i seen in Kazakhstan, Russian Federation and other neighboring countries, the children are being the main group, among who HepA spreads in the first place. A strong correlation coefficient was identified (r=0,7) between HepA morbidity and number of children in a range of regions in the Russian Federation [16]. Relatively high HepA morbidity is seen in Kyzylorda, SouthKazakhstan, Zhambyl and Almaty regions, where relatively high birth rate is recorded. The abovementioned conditions are a favorable setting for unfettered spread of HepA strains, including mutant and recombinant strains, which are increasingly circulating among the population of different regions and countries [17 - 22]. Understanding the serious nature of the problem, one of the leading hepatologists, P. Van Damme, [1] has mentioned, that in the last years we have witnessed «a new fight with an old disease », and the fight against HepA, mostly affecting children, requires all efforts. In such conditions the situation can only be saved by large scale vaccination of the child population against HepA, because the antigenic structure of all virus strains is constant. References 1. Andre F., Van Damme P., Safary A. et al. Inactivated hepatitis A vaccine: immunogenicity, safety and review of official recommendations for use. //Expert Rev. Vaccines.-2002.-V.1.-P.9-23. 2. Shlyakhtenko L.I. Epidemiologic peculiarities and vital measures of hepatitis A prevention in the modern period //Newsletter. World of viral hepatitis.-М.2002. № 11.-P. 4-6. 3. Shuratov I. Kh. Saparbekov M.K. Modern issues of viral hepatitis and AIDS on the verge of XXI century, their solutions. //Medicine of Kazakhstan.- 2003.- №3.P.25-28. 4. A. B. Dzhumagaliyeva, Ospanova E.N. Dependency of the hepatitis A morbidity on the level of collective immunity //Hygiene, epidem. And immunobiol., 2005.-№3.-P.78-82. 5. Onishenko G.G. About the infectious hepatitis prevention measures in the Russian Federation. //Epidemic and infectious diseases. 2002.-№3.-P.4 - 8. 6. Viral hepatitis in the Russian Federation. Epidemiologic peculiarities of the hepatitis A and its sanitary-epidemiological surveillance system in the RF in 2002-2003. //Analytical review.-St. Petersburg.-2005.issue 5.- P.19-39. 7. Modern epidemiological characteristics of hepatitis А. Enteral viral hepatitis (M. I. Mikhalkov etc.) –М.-2007.-P.77-126. 8. Costa-Mattioli M., Ferree V., Casane D. et al. Evidence of recombination in natural populations of hepatitis A virus. //Virology.-2003.-V. 311. –P. 51-59. 9. Costa-Mattioli M., Di Napoli A., Ferree V. et al. Genetic variability of hepatitis A virus. //J. Gen.Virol.-2003.-V. 84. –P. 3191-3201. 10. Stene-Johanson K., Jonassen T.O., Skaug K. Characterization and genetic variability of hepatitis A virus genotype IIIA. //J. Gen.Virol.-2005.-V. 86. –P. 2739-2745. 11. De paula V.S., Saback F.L., Gaspar A.M., Niel C. Mixed infection of a child care provider with hepatitis A virus isolated from subgenotypes 1A and 1B revald by heteroduplex mobility assay. //J viral. . //J. Gen.Virol.-2003.-V. 84. –P. 3191-3201. 12. .Tjon G., Xiridou M., Coutindo R., Bruisten S. Different transmission patterns of hepatitis A virus for main risk groups as evidenced by molecular cluster analysis. //J. Med.Virol.-2007.-V.79.-P.488-494. 13. I.Kh. Shuratov, M.N. Omarova, A.M. Kuatbayeva, E.U. Beybossynov, A.B. Dzumagaliyeva, Akkoshkarova A.O., Salimbayeva A., Sultanbayeva S.N. Analysiss 28 Центрально-Азиатский научно-практический журнал по общественному здравоохранению of epidemiologic situation with hepatitis A in Kazakhstan for 2005 –2009 and improvement measures. // Hygiene, epidemiology and immune biology.. 2010 № 4, C 5356. 14. Omarova M.N., Umbetpayev A.T., Laikov R.T., Shuratov I. Kh. et al. Retrospective epidemiological analysis of infectious morbidity (methodological guidelines). –Astana.-.2004..-.53 p. 15. Shuratov I.Kh., Surdina T.Yu., Victor J.C., Favorov M.O. Study of the vulnerability to viral hepatitis A of the contact persons. //Hygiene, epidemiology and immune biology. 2002 № 3-4, P. 85-92. 16. Mindlina L.Ya. Ways to optimize epidemiologic surveillance for anthroponosis fecal-oral transmission mechanism.//Epidemiologic and infections newsletters.-2012. -№4.-P.16-20 17. Tallo T., Norder H., Teyanova V. et al. Sequential changes in hepatitis A virus genotype distribution in Estonia during 1994 to 2001. //J. Med. Virol.-2003.-V.70.-P. 187-193. 18. Stene-Johanson K., Jenum P.A., Hoel T. et al. An outbreak of hepatitis A among homosexuals linked to a family outbreak. //Epidemiol Infect.-2002.-V.120.P.113-117. 19. Mukomolov S.L., Iriya Davidkin, Zheleznova N.V. et al. Molecular epidemiology of hepatitis A in Saint-Petersburg in 1997-2006. //World of viral hepatitis. –М.2007.-№4.-P.10. 20. Nainan O.V., Armstrong G,L., Hanx H. et al. Hepatitis A molecular epidemiology in the United States, 1996-1997: sources of infection and implications of vaccination policy. //J. Infect. dis. -2005.-V.191.-P.957963. 21. Cuvalon V.P., Podkolzin A.T., Nedachin A.E. et al. Molecular epidemiology of hepatitis A virus in Russian Federation Infection. //Genetics and Evolution.-2003.V.2.-P.211. 22. Ternovoy B.A., Chaussov S.B., Bondarenko T. Yu. Et al. Genetic diversity of hepatitis А in Siberia. //Issues of virology.-2003.-№1.-P. 23-27. UDC: 616-002.26-06:616.155.194.8 A.Balibayevа Karmakshy TB dispensary, Kyzylorda region, RK ANALYSIS OF LONGSTANDING DYNAMICS OF TUBERCULOSIS MORBIDITY IN KARMAKSHY AREA OF THE KYZYLORDA REGION OF KAZAKHSTAN Key words: morbidity, tuberculosis, Kazakhstan, Kyzylorda region. Summary. As a result of implementing a complex of TB prevention activities in the country since 2000 there was seen a stable trend in the decrease of morbidity, which by the end of 2012 was lower than target numbers, identified by the state health care development program «Salamatty Kazakhstan» for 2010-2015. However despite certain successes in the country, the morbidity rate is still high, especially among the adolescents. In 2012 in the area there was a growth in incidence rate among the adolescents from 117,5 to 238,7 per 100 thousand (49,2 %). Materials for the analysis were data, that was gathered by the automated information system of the national register of the TB patients in the Karmakshy area of the Kyzylorda region of Kazakhstan. Material analysis was done by calculating intensive, extensive factors, statistical series indicators, and confidence intervals. For the assessment of the longstanding trend of morbidity, the method of the least squares, the growth (decrease) rate was also calculated. 29 Центрально-Азиатский научно-практический журнал по общественному здравоохранению During the period of 2000-2012, the total TB morbidity indicator of the Karmakshy area decreased by 5,3 times and was equal to 70,3 per 100 thousand of population. For the investigated period of time, the share of children and adolescents among the TB patients was high - 9,5% and 8,6 % accordingly. In order to study epidemic process presentation in different population groups and risk factors, the ranking of the average morbidity level and ratio of patients was established. Analysis done for the average longstanding data has shown that the most significant risk for morbidity was seen in the adolescents group (251,6%+-24,4). By assessing the ranking of the prognostic intensive and extensive indicators of the TB morbidity among the population of the Karmakshy area it was established that without the change in trend the most epidemiologically significant groups will be adolescents of 15-17 years. Among the adult population despite high ration (1 rank) of the prognostic value, in the longstanding dynamics there is a clear decrease trend. Introduction One of the priority key directions of Kazakhstan’s social policy is battle with tuberculosis. This is underlined in the Statement of the President of the Republic of Kazakhstan to the nation of Kazakhstan. As a result of successful implementation of TB prevention activities, since 2000 there was seen a stable trend of decrease in tuberculosis morbidity in the country, which at the end of 2012 was lower than target indicators of the state healthcare development program «Salamatty Kazakhstan». However, despite certain successes in the country, the morbidity rate is still high, especially among the adolescents. TB morbidity indicator in Kyzylorda region is 97,9 per 100 thousand of population (2011) [1]. There is a growth of TB morbidity among adolescents. The number of adolescents in the area is 7 times smaller than the total number children population; at the same time the morbidity of this population group exceeds the children morbidity by 5 times. So in 2012 there was a growth of TB morbidity among adolescents from 117,5 to 238,7 per 100 thousand (49,2 %) [2]. Due to the current situation, the goal was set to study the longstanding dynamics of morbidity to identify the most vulnerable group of population. national TB patients register of the Karmakshy area of Kyzylorda region from 2000 to 2012. We have studied annual reports data № 8,33 on new incidents of TB, registered in the area. We have performed calculations of intensive, extensive indicators, mean values, statistical series indicators, and confidence intervals. In order to assess the longstanding dynamics trends we used the least squares method. The growth (decrease) rate was calculated using the formula: T growth= B ⋅ K / Icp⋅100% In order to exclude the «pop-up» values of the morbidity indicator we calculated significantly different indicators using Chauvenet criteria. In the analyzed range no significantly different, «pop-up», values were identified. Results In dynamics, the indicator of initial TB morbidity of the population of the area decreased from 376 ± 28,5 cases per 100 thousand people in 2000 to 70,3 ± 11,6 in 2012, the difference was statistically significant (р<0,05). When adjusted the total TB morbidity indicators with the least squares method, there was a moderate trend towards the decrease and annul decrease rate was = 11,9 ( Picture 1). Materials and methods Data was collected on the basis of automated information system of the 30 Центрально-Азиатский научно-практический журнал по общественному здравоохранению Picture 1 – TB morbidity trend of the Karmakshy area of Kyzylorda region from 2000 to 2012 Regarding the trend in dynamics of total TB morbidity during the period of 2000 to 2012 there were high (2001, 2003-2005, 2008) and low morbidity levels (2000, 2002, 2006-2007, 2009-2012). When leveling the dynamic curve with weighted moving line there were periods of 4 years with increases in TB morbidity long and periods of 3 years with low morbidity. By applying the method of prognostic extrapolation we have calculated theoretical morbidity. During the calculation we found that theoretical morbidity exceeded the registered values and was within the limits of 191-148 per 100 thousand people since 2006. Actual TB morbidity level for 2012 was 1,1 times lower than theoretical; in 2011 – it was 1,3 times lower. Therefore, decrease in morbidity in 2013 was a continuation of the total decrease in morbidity. Average children morbidity level for the mentioned period of time was 56,5 ± 10,7 per 100 thousand population and in dynamics a decrease was seen from 110,2 to 20,0 per 100 thousand children. Adjusting the statistical series with the method of the least squares allowed to identify a moderate trend of morbidity decrease, with the average decrease rate of 12,1% (Picture 2). Difference between the indicators was statistically significant (р<0,05). Picture 2 – TB morbidity trend in children of Karmakshy area of Kyzylorda region in Kazakhstan for the period 2000 - 2012 Regarding the trend line in the longstanding dynamics of TB morbidity among children under 14 high level was registered in 2000-2001, 2005, 2009, 201131 Центрально-Азиатский научно-практический журнал по общественному здравоохранению 2012; low morbidity level was registered in 2002-2004, 2006-2008, 2010. There was no cycle identified. In the dynamics the indicator of initial TB morbidity among adolescents had a decreasing trend from 279,6 ± 93,1 in 2001 to 238,7 ±90,1 in 2012. Long-time average annual indicator of initial TB morbidity was 254,2 +-24,5 per 100 thousand people (р<0,05). When adjusting the indicators of absolute TB morbidity in adolescents, a trend to a moderate decrease was seen, with the average decrease rate of 4,8% (Picture 3). Regarding the trend line in the longstanding dynamics of intensive TB morbidity among adolescents, an alternation of the high morbidity years in 2001,2005,2007,2010 and 2012 and low morbidity years in 2000, 2002- 2003, 2006, 2008-2009, 2011 was observed. In order to study the manifestation of epidemic process in different population groups as well as possible risk factors, a ranking of the average morbidity level and share of diseased people was conducted. Analysis of the table material (table 1), conducted with the long-time average annual data shows that the highest morbidity risk was seen in the adolescents group (251,6%+-24,4). Table 1 – Long-time average annual intensive indicator and share of TB morbidity in different population groups in 2000-2012 Group Children Adolescents Adults Long-time average annual TB morbidity indicators I ‰rank Average intensive indicator Р% I -+м Р%+-м 59,7+-5,5 3 9,5+-0,8 251,6+-24,4 1 8,6-+0,8 257,8-+8,1 2 81,9+-1,1 rank 2 3 1 Picture 3 – TB morbidity trends among adolescents Considering the morbidity share volumes, the most epidemiologically significant groups were children under 14, as well as adolescents of 15-17 years. 32 Центрально-Азиатский научно-практический журнал по общественному здравоохранению The long-time morbidity dynamics in different population groups is characterized with explicit and versatile trends. Analysis of level and structure for prognostic values is done. Table 2 – Prognostic intensive indicator and share of people with TB by population groups in 2013 Group Children ages 0-14 Adolescents ages 15-17 Adults TB morbidity forecast for 2013. I‰ rank 30,6+-3,9 3 186,9+-21,0 1 162,2+-6,4 2 Having assessed the ranked prognostic intensive and extensive TB morbidity indicators for the population of Karmakshy area, it was established that if the trend does not change, then the most epidemiologically significant group will be adolescents ages 15-17 лет. For the adult population, despite high share of the prognostic value (1 rank), an explicit decrease trend was seen in the long-time dynamics. Conclusion Thus, for the period of 2000-2012, the total TB morbidity indicator for the population of Karmakshy area has decreased 5,3 times and was equal to 70,3 per 100 thousands of population. During the time of this study, the share of children and adolescents in the Р% 8,3+-1,3 10+-3,9 81,7+-5,1 rank 3 2 1 total number of TB patients was high, 9,5 and 8,6 % accordingly. In dynamics, this indicator of TB morbidity among adolescents will remain on a high level: the longtime average annual indicator for this period being from 229,7 to 278,7 per 100 thousand people. Adolescents will be of the most significance for TB epidemiologic process in Karmakshy area in 2013. References 1. TB statistical review for Kazakhstan / Almaty -2009-P.5-6 2. Bekembayeva G.S. Modern epidemiologic situation in TB among children and adolescents in Kazakhstan // Medicine-2012- №8- P .43-44 UDC: 616-002.5 F.A.Iskakova School of Public Health of the Ministry of Health of the Republic of Kazakhstan, Almaty FIBROUS-CAVERNOUS TUBERCULOSIS AS AN INDICATOR OF THE ANTITUBERCULOSIS PROGRAM EFFICIENCY ASSESSMENT IN KAZAKHSTAN Key words: Fibrous-cavernous tuberculosis, indicator, DOTS strategy, correlation, mortality, morbidity, prevalence. Summary. Global TB burden still exists despite the decrease in mortality (41% (2011-1990), morbidity and prevalence due to implementation of new anti-TB programs (DOTS strategy, Stop TB, treatment of multi-drug-resistant tuberculosis (MDR-TB)), justifying the control of TB by the World Health Organization. Kazakhstan is a country that has implemented new programs and reached a decrease in main epidemiological TB indicators. The aim of the work was to assess TB programs with application of well-known and new indicators. Materials were statistical data on absolute numbers and TB patients’ indicators, patients with fibrous-cavernous tuberculosis on the country level during 1973-2012. Descriptive and analytical methods were used. 33 Центрально-Азиатский научно-практический журнал по общественному здравоохранению Analysis of epidemiological indicators for the period of 1973-2012 on TB in Kazakhstan defined the trends in the decrease of prevalence by 4,3 (r=0,45), mortality by 3,1 (r=0,01) and morbidity by 1,4 (r=0,15). Analysis of the dynamics with consideration of biological and social factors identified changes in five time periods respectively: soviet (1973-1985), anti-alcohol campaign (1986-1991), social and economic crisis (1992-1998), DOTS strategy implementation (1999-2004) and stabilization period (2005-2012). Patient levels with fibrous-cavernous TB (FCTB) were identified among new cases and patients of TB treatment facilities, which served as indicators for assessment of anti-TB programs. The level of newly identified FCTB reflects not timely patient identification and FCTB as health outcome reflects treatment inefficiency. Decrease in the main epidemiological TB indicators and stable decrease of initially identified FCTB (lower than 1%) and decrease of FCTB share among the target groups by 2,7 during 1973-2012 reflects success and efficiency of new anti-TB programs in the condition of the TB epidemics. In the last years there is a significant proIntroduction gress in the fight against TB in the world: Global burden of TB is still significant TB mortality has decreased (by 41% during due to high morbidity and mortality in the 2011-1990) as well as morbidity (8.7 mln.) world despite the fact that the disease has (16). There are some achievements on the been well researched in the last 300 years. part of the domestic TB fighting service: TB morbidity and mortality growth in Eurodecrease of TB morbidity, prevalence and pean countries in XYIII – XIX centuries mortality. were the reasons for developing anti-TB At the same time activity of the anti-TB programs and improvement of the global TB service in conditions of the new programs situation by the mid-XX century, which lead has raised discussions in the medical comto the creation of a concept of TB as a dismunity and mass media (10,11). More inappearing disease (1,5). Increase in the depth research is necessary to assess the efnumber of patients and deaths from TB by ficiency of the existing programs on the bathe end of XXth century lead to WHO prosis of evidence methods and distribution of nouncing TB a world threat and recommenthe results to ensure their utilization and dation of «DOTS strategy», new program of benefits for the medical community. EpideTB control in 1993 and program «Stop TB» miological situation with TB and efficiency since 2004 (2,3,4). Significance of the disof anti-TB programs is characterized by inease grew even more due to the pandemic of dicators, which mainly are intensive indicaHIV-infection, because co-morbidity of TB tors of morbidity, prevalence and mortality, and HIV is fatal for ¼ of HIV-infected peoas well as treatment efficiency. At the same ple. In Kazakhstan there were same trends time, the informational capacity of the epiidentified in epidemiological situation with demiologic indicators is influenced by many TB, delayed by two centuries, which were factors, which are not always taken into acaccompanied by implementation of anti-TB count by the traditional analysis methods. programs according to the current TB That is why the aim of our study was to fighting concepts (7). The time period since evaluate anti-TB program efficiency in Ka1998 is characterized by the implementation zakhstan with application of new indicators of the DOTS strategy, efficient program in on the basis of modern statistical methods. the conditions of TB epidemics and insuffiThere were objectives of the study identicient funding. Since 2002 anti-TB program fied: analysis of the epidemiological situawas adopted to country conditions, in 2003 a tion with TB by level of morbidity indicaprogram was implemented for treating pators, mortality indicators, disease prevatients with MDR-TB, and since 2007 it was lence; correlation analysis of extensive indistrengthened by the elements of «Stop TB» cators – share of patients with fibrousprogram (7,8,9). cavernous TB among initially identified 34 Центрально-Азиатский научно-практический журнал по общественному здравоохранению lung TB cases and among patients of TB clinics and its ratio indicator from 1973 to 2012. The observation period was divided into different sub-periods based on the presence of bio-social network risk factors. Materials included statistical data on absolute numbers and indicators of TB patients, FCTB patients on the country level during 1973-2012. Descriptive and analytical methods were used. The first observation period (1973 - 1985), also known as «soviet period», is related to the period of Kazakhstan being a part of USSR; it is characterized by stable economic structure, efficient healthcare and anti-TB system, which was regulated by Prikaz №747 from 7 September 1972 «On measures to enhance the fight against TB of the Ministry of Health of USSR», Prikaz № 361 from 23 April 1974 «On approval of new TB classification», pictures 1 and 2. Picture 1- Morbidity, prevalence and mortality indicators in the RK, 1973 -2012. In this period there was a stable decrease of morbidity for the whole period by 39.8% (range of 71,1-118 per 100 thousand of population), mortality by 2 (range of 2.9 12,8 per 100 thousand of population) and prevalence by 1,9 (range of 321,7 – 618 per 100 thousand of population). Analysis of ratio of patients with FCTB identified its decrease by 2,9 among initially identified patients with lung TB (range 4-1,4%) and among the target groups by 20,2% (range 23.8-18,5%); its ratio has been 9,0 (picture 2). 35 Центрально-Азиатский научно-практический журнал по общественному здравоохранению Picture 2 – Proportion of patients with fibroid-cavernous TB among initially identified TB forms and target groups in Kazakhstan, 1973-2012 Table 1- Correlation analysis by Pearson’s test on the level of patients with FCTB among initially identified patients and target groups in the RK, 1973-2012 № 1 2 3 4 5 Years 1973-1985 1986-1991 1992-1998 1999-2004 2005-2012 Periods RK, r Soviet Anti-alcohol campaign Social and economic crisis Implementation of DOTS strategy Stabilization The second observation period (19861991) was characterized by the implementation of anti-alcohol campaign. On 7 and 16 May 1985 there were legislative acts published of the Central committee of the communist party of the Soviet union and Cabinet of the USSR on enhancing efforts against alcoholism and home-brewing, which was caused by the increase in mortality from alcohol and shorter life expectancy compared to other countries (10). During the period of alcohol ban there was the most favorable situation according to the indicators: morbidity was on average 70,4 (- 9,4%, range 64,4 – 73,9 per 100 thousand people), prevalence (-9,0%, range 308,2- 292,6 per 100 thousand people) and mortality (-17,2%, range 12.8 – 9,9 per 100 thousand people). There was a stable level of FCTB recorded 0.91 0.20 -0.78 0.76 0.66 among patients with initially identified lung TB (1,3-1,5%) and slight decrease of FCTB among target groups from 17,7% to 16,7%; their ratio was 13.3. Correlation analysis by Pearson pointed out weak relations between extensive indicators in Kazakhstan (r=0.20). The third observation period (1992 1998 гг.) is related to the transition policy, which should have improved economic state and liberalize political life of the country. This lead to the collapse of the USSR into independent republics. Within independent countries there were social and economic changes happening, which were accompanied by decrease of healthcare system funding, including anti-TB service. This period in the RK was signified by the increase of mortality by 3,3 times (indicator range 11,7 36 Центрально-Азиатский научно-практический журнал по общественному здравоохранению – 38,4 per 100 thousand people); increase of morbidity by 1,8 times (range 59.7 – 118,8 per 100 thousand people) and prevalence by 34.4%, (range 268 - 379.6 per 100 thousand people). There was an increase recorded in the share of FCTB among new cases by 1,7 (range 1,5-2,5%), decrease of its share among target groups by 21,6% (range 13,1% -16,3%), at the same time the value of the indicator has decreased to 7,4 (4,7 - 11), which was an adverse prognostic sign, reflecting the worsening of situation on TB. Increase of epidemiological indicators was seen along with destabilization of anti-TB service: weak funding, lack of TB drugs, decrease of disease identification cases and uncontrolled growth of TB mortality. There was a negative correlation identified between extensive indicators of FCTB share in the morbidity structure and target groups in Kazakhstan (r= -0.78). Growth of lethal outcomes of TB in the country is related to the growth of individuals with initially identified forms and individuals with active TB forms. Sharp worsening of situation with TB in the RK is a consequence of DOTS strategy implementation recommended by the WHO to the countries with difficult TB situation in October 1998. The fourth observation period (1999 – 2004) is related to the activities of anti-TB service on implementation of DOTS strategy. The period is characterized by sharp decrease of mortality indicators by 1,9 times (range 20,6 - 38,8 per 100 thousand people) and prevalence by 18,4% (range 323 - 449.5 per 100 thousand people) with further increase of the morbidity indicators by 29,9% (range 141 - 165,1 per 100 thousand people) in Kazakhstan. Morbidity increase is related to significant increase of new TB cases identification by the mucus swab microscopy and by other methods (mostly x-ray method), which is proven by the share of new cases with positive swab in 1/3 and with 2/3 with negative mucus swab. In 2002 – 2003 there were the highest morbidity levels recorded (165,1 – 160,4 per 100 thousand people). There was a decrease seen in the share of FCTB among new cases by 4,6 times (2,3% - 0,5%) and among target groups by 34,8% (15.8%-10,3%), at the same time the indicator for their share was 14,9 (range 5,227,8). There was a strong positive correlation seen between the shares of FCTB among new cases and target groups in Kazakhstan (r= 0.76). The fifth observation period (2005-2009) is characterized by further decrease of epidemiological indicators of TB in Kazakhstan: prevalence by 2,5 (range 180 - 449.5 per 100 thousand people), mortality by 1,6 (range 12,9 – 20,8 per 100 thousand people), morbidity by 1,5 (range 105,3 – 154,3 by 100 thousand people). The present observation period is compatible in the intensity of epidemic process with the Soviet period. By the morbidity level the country has come close to epidemic threshold (105,3 per 100 thousand people in 2009). There was a negative correlation identified between the share of FCTB among new cases and target groups in Kazakhstan (r= 0,33). The data of correlation analysis show dissociation between extensive indicators, this is possibly related to changes of the registration and management conditions among target groups; and, which is no less important with the accuracy of data collection. Analysis of TB situation with traditional assessment of the intensive and extensive indicators level, indicator of ratio of patients’ shares with FCTB in the morbidity and prevalence structure, and presence of interrelation during correlation analysis by Pearson depending on the biosocial environment factors has identified certain trends of epidemic processes, anti-TB programs and activities of the healthcare system efficiency. In the Soviet period there was a decrease recorded in intensive indicators, share of FCTB in the morbidity structure and prevalence, and presence of positive correlation between the indicators in the country and regions reflects high efficiency of antiTB program, the aims of which were prevention, identification and treatment of TB patients in conditions of stable social and 37 Центрально-Азиатский научно-практический журнал по общественному здравоохранению economic environment and healthcare system. The anti-alcohol campaign period is characterized by insignificant decrease in intensive indicators and relatively stable share of FCTB in the morbidity and prevalence structure. At the same time there was no interrelation identified between FCTB shares among new cases and patient target groups in the country, which shows effects of other factors on the TB epidemiology, namely increase of general health level, related to sharp decrease of alcohol consumption on the the country level. In the period of social and economic crisis and transition with decline of social and economic conditions and health care system collapse, including anti-TB service, there was a development of TB epidemics seen in the country with dramatic increase of intensive indicators. During this time there was an increase recorded of the share of patients with FCTB among new cases, which reflects decrease of TB patients’ diagnostics; and decrease of its share among target groups shows low efficiency of its treatment associated with lethal outcomes. DOTS strategy implementation period is characterized by significant decrease of mortality in the RK by 1,9, insignificant decrease of prevalence (14,8%) with increase of morbidity in Kazakhstan (29,9%). Such situation was justified with the DOTS program objectives – identification of new TB cases aimed at identification of TB mycobacteria (70%) and its treatment (85%). At the same time decrease of mortality of TB associated with efficient treatment does not correlate with the growth of new TB cases, justified by increase of recorded morbidity. In this period there was no correlation identified between the shares of FCTB in the morbidity and prevalence structure in Kazakhstan. The period from 2005 to 2012 is characterized by the most favorable situation with TB, the country passed an epidemic threshold by morbidity level (81,7 per 100 thousand people). There was a decrease recorded in all indicators of TB, especially prevalence and morbidity in Kazakhstan by 2,8 and 3,1. In this period there was a positive correlation identified between the shares of FCTB among new cases and TB clinics target groups during correlation analysis, which demonstrates efficiency of anti-TB programs for the issues of timely identification and TB cases treatment efficiency in general. The efficiency of treatment of new cases with positive swabs increased in Kazakhstan in the last 15 years of DOTS strategy, STOP TB program implementation, and reached 83,1% in the country in 2012. On the territory of 62,5% of the country (Almaty city, Almaty, Zhambyl, North Kazakhstan, West Kazakhstan, Pavlodar, Almaty, Atyrau, Mangystau, Kyzylorda regions) there has already been a target indicator achieved for the treatment of new TB cases in 2012. Correlation analysis of the share of patients with FCTB among the target groups and indicators treatment efficiency of the new cases with positive swab has identified a strong correlation between them (r=0,79). A significant contribution to the efficiency of anti-TB program, which is identified by TB cases treatment efficiency indicators, intensive and extensive morbidity, mortality and prevalence indicators, by the level of patients with FCTB among target groups, is made by the treatment program of patients with MDR-TB. Treatment efficiency of patients with MDR-TB has reached 75,8%. Discussion The epidemiologic situation with TB depends on many biosocial environment factors, which have negative or positive influence on TB epidemiology. The last observational period is assessed by us as a stabilization period according to the level of intensive indicators and share of FCTB in the morbidity and prevalence structure. Correlation analysis of FCTB shares among new cases and target groups of TB clinics on the national level demonstrates efficiency of anti-TB program by its main tasks: timely identification and treatment efficiency. Indicator of FCTB shares can serve as a criteria for not only the control of program efficien38 Центрально-Азиатский научно-практический журнал по общественному здравоохранению cy, but also the reliability of extensive indicators – frequency of FCTB. The value of ratio of patients with FCTB in the structure of initially identified TB lower than 3% in the Russian Federation is evaluated as positive prognostic sign for efficiency of TB activities for identification of new disease cases. In Kazakhstan with morbidity indicator value of around 100 per 100 thousand people until present time, the share of patients with FCTB is lower than 1% (0,4%) for the last 10 years, in the conditions of new TB program implementation, which is a consequence of new cases identification due to large scale of preventive medical examinations of population, integration of TB clinics with PMC and raising awareness about TB among population. Great work is done to improve identification of new TB cases among population, results of patients treatment, education of the PMC staff, preventive medical work among population and in target groups, work is conducted with governmental and non-governmental organizations. Established increase in share of patients with FCTB among target groups of TB clinics in the last period during 20062008 indirectly reflects the low performance of TB patients’ treatment, related to growth in cases with multiple resistance. Implementation of treatment programs for patients with MDR-TB in the country in general contributed to decrease of its share by 1,5 in the last years (2007-2012). Along with identifying the share of FCTB among new cases and target groups, the correlation method reflects severity of the disease, success level of tasks of identification and treatment of TB patients. The data on the lowest ratio (6,3; 5,1; 4,7; 4,9; 5,2; 6,9 and 6,7, 1994-2000) reflects the worst situation with TB in Kazakhstan. And vice versa, increase of the ratio reflects improvement of the situation, as the data show – 11,1 in 2001, 20,6 in 2004, 29,8 in 2008 and 86 in 2012. Conclusion In general the situation with TB in Kazakhstan should be assessed as stabilizing by significant decrease of intensive indicators of morbidity, prevalence and mortality. At the same time, the morbidity level exceeds the epidemic threshold by 1,6 times (50 cases per 100 000 people), which points out the presence of TB activator spread, unidentified infection sources and incomplete amount of epidemic and preventive activities. Despite successes reached in the decrease of TB spread on the territory of Kazakhstan there are problems and outstanding issues in TB epidemiology and fight against it. In order to achieve the UN Millennium Development Goals for decrease of prevalence and mortality of TB by 50% compared to 1990 data and liquidate TB as a public healthcare issue (WHO) and achieve country goal, it is necessary to conduct the assessment of epidemiologic situation with TB and assessment of TB programs efficiency to identify priority tasks and plan further activities. New approaches are needed for the assessment of the situation with TB and operative reaction and correction of changes with the use of analytical epidemiological methods. References 1. Palomino JC, Leao SC, Ritacco V. Tuberculosis 2007. From basic science to patient care//www.tuberculosis textbook.com. 2. Tuberculosis. Handbook, WHO, 1998, 222 P. 3. The global plan to stop TB 20062015: progress report 2006-2008, November 2009 4. Global Tuberculosis Control Report. This is the 13th WHO annual report on global TB control, March 2009. 5. Khomenko A.G. Modern trends of tuberculosis spread in Russia .- 1998. № 17, 5. 6. Zhangiryeev A.A. Tuberculosis epidemiology in Kazakhstan. International conference on tuberculosis control and 5th congress of phthisiologists of Kazakhstan. Almaty,1998, 3-4. 39 Центрально-Азиатский научно-практический журнал по общественному здравоохранению 7. Zubritskiy A.N. TB according to the autopsy data, p.14. 8. Ismailov S.S. Significance of general practice physician in the PMC system in control over TB //http://www.kzfamilydoctor.org/news/kafp_ news/files/FMFP/18.06.2009/Ismailov_Doct orRole_OLS.ppt. 9. Mishkinis K., Muminov T.A., Iskakova F.A.. DOTS strategy. Main provisions and start of implementation in the Republic of Kazakhstan //Almaty, 1999, p.24 10. Aliyev M.A. On the modern issues in fighting TB ///Materials collection of the I congress of phthisiologists of Kazakhstan, Almaty, 1998, p. 200. 11. Statistical review of TB in the Republic of Kazakhstan, Almaty, 2010, 70 p. 12. TB in the Russian Federation. Analytical review of the main statistical TB indicators used in the Russian Federation //edited by M.I. Perelman, Yu.V. Mikhaylova.– М., 2009. – 172 p. 13. Statistical review of TB in the Republic of Kazakhstan, Almaty, 2011, 71 p. 14. Statistical review of TB in the Republic of Kazakhstan, Almaty, 2012, 76 p. 15. Global tuberculosis report, WHO, 2012, p. UDC: 613.1 R.O.Kasymova Kyrgyz- Russian Slavic University named after B.N. Yeltsin , Bishkek , Kyrgyz Republic WEATHER AND CLIMATE: EFFECT OF CHANGE ON HUMANS Global climate change presents a relatively new challenge for the international community and determines new policies and efforts of the governments to protect human health. Development of climate change adaptation strategies in the countries of the WHO European Region, including Kyrgyz Republic, has been studied taking into account a number of different characteristics such as population growth , poverty , medical care , nutrition , access to health care services and medications , the level of environmental distress caused by anthropogenic pollution of the living environment, i.e .complex factors influencing the vulnerability of the population and its adaptive capacity . This lead to the development of response activities to the climate change by the health sector, taking into account specific morbidity and mortality indicators. Our study presents expected indicators in relation to climate change in the Kyrgyz Republic. UDC: 616. 61-036. 11:618 3/7 K.N.Mambetov, S.T.Nurpolatova, A.U.Seitnazarova, Z.O.Kunazarova, G.A.Karimova, R.M.Begaliyeva, E.Zh.Yesenbekova Nukuss branch of Tashkent pediatric medical institute ACUTE RENAL FAILURE, CAUSED BY BLOOD LOSS DURING DELIVERY Key words: acute renal failure, pregnancy, delivery, blood loss. 40 Центрально-Азиатский научно-практический журнал по общественному здравоохранению Summary. Acute renal failure (ARF), condition that can develop during pregnancy and delivery is still one of the leading causes of maternal death in the Republic of Uzbekistan, especially in the Aral area [1,2] . The data provided in the article is a part of the study of specifics of development, clinical process and causes of ARF, developed during pregnancy and delivery in the conditions of ecological disaster of Aral area, forecasting and prevention of purulent-septic complications and improvement of the general treatment outcome. During the study general biochemistry tests were used: complete blood count and simple urine test, BUN, creatinine, blood electrolytes, total protein, protein fractions, acid-base balance, central hemodynamics value, volemic value; x-ray and ultrasound. 34 women ages 23,14,0 years have been examined in nephrology unit with hemodialysis and in intensive therapy of the Republican clinical hospital №1 of Nukuss city, in which ARF was a result of massive bleeding during delivery which occurred in a normal pregnancy. It was identified that there were following reasons for bleeding: Premature separation of normally positioned placenta (in 29 patients - 79,2%), hypo- and atonic hemorrhage (in 3 patients - 12,5%), central placental presentation (in 2 patients - 8,3%), long time between membrane rupture and delivery, prolonged labor. In all cases there were diuretics administered secondary to non-compensated blood loss. 21 patients (61%) had long inefficient conservative haemostatic treatment and surgical intervention for restoring haemostasis was delayed. Introduction Acute renal failure (ARF), can develop as a result of pregnancy and during delivery and is still one of the leading causes in of maternal death in the Republic of Uzbekistan, especially in the Aral area [1,2] . ARF is a condition caused by a decreased kidney function and is characterized by hyperazotemia, water-electrolyte and acid-base imbalance, normotonia and erythropoeisis defect. The data provided in the article are a part of the results of studying peculiarities of development, clinical process and results of ARF, caused as a results of pregnancy and delivery in the conditions of ecological disaster of Aral area, forecasting and prevention of purulent-septic complications and improvement of the general treatment outcome. Materials and methods In the study general biochemistry blood tests were used: complete blood count and simple urine test, BUN, creatinine, blood electrolytes, total protein, protein fractions, acid-base balance, central hemodynamics value, volemic value; x-ray and ultrasound studies. 34 women ages 23,14,0 years have been examined in nephrology unit with hemodi- alysis and in intensive therapy of the Republican clinical hospital №1 of Nukuss city, in which ARF was a result of massive bleeding during delivery which occurred in a normal pregnancy. In order to exclude the role of extragenital diseases (EGD) this group of patients with ARF of obstetrical etiology included birthing mothers who had normal pregnancy with no extragential pathology. The only case of extragenital disease was recorded as moderate anemia with initial values of Нb (according to labor and delivery record), within the limits 11 – 12 g/l. Results It was identified that there were following reasons for bleeding: premature separation of normally positioned placenta (in 29 patients - 79,2%), hypo- and atonic hemorrhage (in 3 patients - 12,5%), central placental presentation (in 2 patients - 8,3%), long time between membrane rupture and delivery, prolonged labor. Records of labor and delivery evidenced that pregnancy was with no obstetric or extragenital pathology. Red blood cell count showed light anemia (Hb – 11,10,2 g/l). In all cases blood loss was more than 30 ml/kg of body mass, there was obvious hypotension lasting on average 1,90,7 hours. On average, volume of blood 41 Центрально-Азиатский научно-практический журнал по общественному здравоохранению loss was 2,10,2 l (31 ml/kg). Hemorrhagic shock treatment conducted in obstetric organizations, as a rule, was different both in qualitative and quantitative way. A common feature was delayed transfusion in all cases (from 1,5 to 8 and more). The volume of transfused blood was no more than 36% of the blood loss, which in majority of the cases was underestimated by more than 40%. In all cases there were diuretics administered secondary to non-compensated blood loss. 21 patients (61%) had long inefficient conservative haemostatic treatment and surgical intervention for restoring haemostasis was delayed. All patients during admission had moderate increase of blood pressure. On average blood pressure was 160,45,1 by 90,92,7 mm Hg, which is higher than initial values. The majority of the patients had elevated blood urea and creatinine (35,73,0 mmole /l and 490,1167,0 mcmole/l). Daily increase of urea in the period of anuria was on average 7,90,6 mmole /l, and creatinine – 106,99,7 mmole/l. There were changes noted in electrolyte balance. 24 patients had hyperkalemia, being on average 7,70,4 mmole/l. Potassium level in plasma was normal in 2 patients, being 5,01,0 mmole/l. They had moderate hyponatremia and hypocalcemia. Sodium concentration in plasma was 120,01,2 mmole/l. Therefore there was a decrease of sodium in red blood cells 16,20,6 mmole/l. Apparently, hyponatremia was a result of extrarenal losses of this electrolyte (diarrhea, vomiting) and massive infusions. Hypocalcemia was more expressed 1,350,15 mmole/l. Level of magnesium in blood was slightly elevated (2,10,21 mmole/l). In all patients the abovementioned electrolyte imbalance was accompanied by hypoproteinemia, registered during admission. Total count of protein in blood was decreased to 44,02,0 g/l by means of both fractions, with slightly higher decrease of albumins. A/G index was 0,610,02. All studied women had metabolic acidosis. Acid-base balance was as follows: рН=7,200,007, рСО2=4,1300,350 kPa, SВ=15,11,6 mmole/l, ВВ=28,01,6 mmole/l, ВЕ=-13,11,6 mmole/l, which is a sign of decompensated metabolic acidosis with a slight compensation of breathing and depletion of reserves of bicarbonate and hemoglobin buffer systems. In 10 (29,4%) studied patients there were circulating auto antibodies to kidney tissue and its structural elements identified. In 11 patients (32,3%) antibodies were found for tissue and subcellular liver elements, which was also clinically manifested with more expressed changes of liver tests (serum transaminase, bilirubin) and clinical manifestations of moderate cholestasis. All of the above gave us the right to consider this as a combination of acute liver and renal failure. During discharge the following criteria were considered: general condition, haemogynamics indicators normalization, water-electrolyte balance, acidbase balance, diuresis, decreasing azotemia to normal or subnormal level, decrease of pathological urine changes. At the time of discharge 10 women still had leukocyturia (up to 70-90 in per HPF), 5 had cylindruria, 8 patients had microhematuria. All patients were recommended to get monitoring by physician (nephrologist) at place of residence and second consult in a month. Special attention was paid to the analysis of death causes for further development of treatment and prevention activities. We have studied all complications in detail, which had adverse influence on ARF that directly or indirectly have caused death. In this group 12 patients have died, which is 35,2%, 6 patients died secondary to reversible renal processes, moderate necrotic nephrosis. Three women (8,8%) have died within first few hours after admission (in 6 – 12 hours) as a result of progressing cardiac weakness with expressed overhydratation, hypotension, pulmonary edema and posthemorrhagic anemia. In four patients (11,8%) there was an acute symmetric cortical necrosis recorded. Among the studied patients acute cortical necrosis was developed in 11,8% of cases, 42 Центрально-Азиатский научно-практический журнал по общественному здравоохранению which has significantly surpassed the data that consider renal cortex necrosis a rare cause of ARF. Therefore, only for 5 patients in this group applied treatment methods were inefficient. They have died within 10 – 25 days. In these cases causes of death were complications (hemorrhage, infections, circulation dysfunction). In 50% of the patients in the process of ARF treatment besides anemia developed other complications. Majority of them have developed in the oligoanuria period (20 patients). The most difficult were: septic metroendometritis in 2 patients, genital hemorrhage in 2 patients, acute cardiovascular failure and pulmonary edema in 7 patients, pneumonia in 4 patients, peritonitis in 2 patients, with suture lack on uterus in 2 patients, major thrombophlebitis of lower limb with venous insufficiency cases in 1 patient. Discussion In our opinion blood loss during delivery that worsened initial anemia is a condition for septic infection development. For prevention purposes right after the blood loss we consider antibiotics prescription to be essential. In majority of the described cases this has not been done. 4 of the patients, who died, had operations too late (after 5 – 7 hours after the onset of bleeding) after blood loss and hemorrhagic shock manifestation. One of the patient had second hemorrhage in the period of dieresis restoration with high level of azotemia (from uterus stump), it was necessary to do second laporatomy for the purpose of hemostasis. Several patients with acute cortical necrosis have died as a result of progressing cardiovascular and cardio-pulmonary failure secondary to uremia. Causes of deaths of the studied patients were: bilateral cortical renal necrosis, acute cardiovascular and cardiopulmonary failure, purulent-septic complications. Patients treatment and hospitalization depended on the severity of disease progress and complications, and it lasted 21 – 42 days, on average 34,14,1 days. Therefore in this group of women ARF occurred secondary to normal pregnancy, complicated by massive > (30 ml/kg body mass) inadequately compensated blood loss. During labor and delivery all patients have suffered hemorrhagic shock for 4,51,2 hours. To almost all of them vasoconstrictors, cardiotonics and hormones were administered secondary to uncompensated blood loss to increase blood pressure. It was noted that the main reason for ARF in this group of patients was massive blood loss with development of hemorrhagic shock, i.e. all patients had shock kidney. Abundant data have shown that if blood pressure decreases lower than 70 – 60 mm Hg there are glomerular filtration and canaliculi defects with changes of intrarenal blood flow from surface cortical layer to deeper ones. The reason for intrarenal circulatory failure during blood loss and shock is increased activity of reninangiotensin system, catecholamines. Hypovolaemia that occurs in hemorrhage and shock is a kind of mechanism launching neuro-endocrine reactions (vasoconstriction, anti-diuresis), aimed at normalization of circulatory volume by means of decreasing the volume of blood-stream, fluid replacement. Therefore decreased renal blood flow and oliguria are peculiar phenomena in hypovolaemia. Among the scientists there is a widely accepted opinion that ARF is developed according to the following scheme: shock-renal ischemia –renal hypoxia – canaliculus necrosis and other changes of ARF [3,4]. Because blood loss of absolute number of patients in the group was practically related to premature separation of normally and abnormally positioned placenta, we have paid much attention to impairment of initial immune status of these women. Conclusions Therefore, it can be stated that kidneys are the weakest link in the chain of defects that can be caused by hemorrhage and shock in pregnant women, as a result of which ARF is developed. References 1. Avakov V.E., MAmbetov K.N. // Peculiarities of clinical progress and outcomes 43 Центрально-Азиатский научно-практический журнал по общественному здравоохранению of acute renal failure, caused by pregnancy and delivery pathology in women with difficult forms of gestational toxicosis and extragenital diseases in conditions of Aral area /Medical journal of Uzbekistan, №1, 2008 17-20 p. 2. Atabiyazova O.A. //Anemia in pregnant women in Karakalpakstan republic. In the book «Materials of international seminar «Environmental factors and maternal and child health in Aral crisis region ». - Tashkent, 2001,. 18-19 p. 3. Avakov V.E., et al. //Acute renal failure of obstetric etiology. Modern state of the problem / Journal of theoretical and clinical medicine– 2000 - № 6 - 6-8 p. 4. Avakov V.E., Makhmudov O.A., Mambetov K.N. Н. // Acute renal failure of obstetric etiology. Modern state of the problem / Journal of theoretical and clinical medicine– 2000 - 6-8 p. UDC: 616.314-74:053(053.54) Zh.A. Kalmatayeva, Z.N. Yelzhanova Kazakhstan School of Public Health, MоH RK PROBLEMS OF DENTAL CARE PROVISION TO CHILDREN WITH INFANTILE CEREBRAL PALSY ON THE EXAMPLE OF THE REHABILITATION CENTER FOR CHILDREN WITH DISABILITIES «ARDI» Key words: infantile cerebral palsy, dental care, children with disabilities. Summary. The study was conducted on the basis of the rehabilitation center for children with disabilities «ARDI». The study subjects were disabled children diagnosed with infantile cerebral palsy (ICP) (n = 60) and their parents (n = 60). All children were separated into the three age groups: children under 5 of age (30,5%), ages 5 to 10 years (49,2%) and ages 10-14 years (20,3%). In order to analyze the specifics of dental care provided to children with ICP, a structured interviewing of children was conducted at the first phase of the study. At the second phase, dental status of the patients was studied. As a result of the survey it was found that the main source of information about the prevention of dental disease was inner circle and mass media. Dental health education by the dentists in this category of patients was absent. Therefore, dental hygiene knowledge level among children with ICP was low. A high percent of cases with complicated caries was identified, the prevalence of dento-facial anomalies was 96%, with an overall complicated clinical situation with anomalies. Almost all interviewed children (98,3%) had impairments of physiological functions: respiratory issues, difficulties swallowing, chewing and sucking. Changes in oral vestibule were seen in 73,3% of the cases. Delayed eruption of deciduous (temporary) and permanent teeth was observed. 75% of all children had cavities; with almost of them having more than one cavity. The reasons that prevented seeing the dentist included fear of treatment (72% of children) and high cost of treatment (18%). The lack of specialized dental care for children with ICP leads to the deterioration of dental health. This in turn has an adverse effect on the underlying condition. Therefore additional state funds are needed for treatment and care for this category of patients. This justifies the creation of specialized care for children with ICP. Introduction Based on the official data provided by the Ministry of Labor and Social Protection the Republic of Kazakhstan, more than 388 000 people or 3,5% of population in the country live with disabilities, including 211 000 women. There are 49 000 children under 16 44 Центрально-Азиатский научно-практический журнал по общественному здравоохранению (13% of all people with disabilities), 58 800 people have been disabled since childhood [1]. According to the data of CJSC «Medinfo» RK, ICP morbidity per 100 thousand people in 2011 in the republic was 71. For the period from 1990 to 2011 ICP morbidity in the RK increased by, in the city of: Almaty from 26,5 to 124,1 people per 100 thousand [2]. As of 2013, there are 8301 children under 14 years registered with ICP in the RK [3]. When looking at statistical data on ICP prevalence and morbidity among children with ICP, issues were raised on the prevalence of dental diseases among disabled children with ICP diagnosis. Currently there are no statistical data on dental issues among children with ICP in our country. There are only few publications from within the CIS and abroad on the diseases of oral cavity among disabled children (R.S. Starodubtseva, 1974, B. Bayzhanov 1980, Solonko G.M., 1991,PodeJ.ECurron 1991, Kilyin E.T., 2002, Atezhanov D.O. 2005). Those studies show that prevalence and intensity of caries among children with disabilities is higher than in healthy children. Unlike healthy children, those with disabilities tend to have more pernicious habits and need more orthodontic treatment. On average, the prevalence of malocclusion in children with disabilities is 73,5 %, while in healthy children the prevalence is shown to be 62% [4]. Severity of ICP, significant impairments of dentofacial system (DFS), peculiarities of care, treatment specifics and difficulties with performing corrective manipulations and other procedures in oral cavities of these children call for the organization of specific evidence-based dental care help to this category of children [5]. Presence of dental pathologies not only worsens the condition of DFS, but also affects general wellbeing of a child, which leads to higher spending of public funds on providing in-patient care for these children [6]. All of the abovementioned has defined the goal of our study, which is to evaluate the state of dental care provision to children with ICP on the basis of a rehabilitation center for children with disabilities. Materials and methods The study subjects were disabled children diagnosed with infantile cerebral palsy (ICP) (n = 60) and their parents (n = 60). All children were separated into the three age groups: children under 5 of age (30,5%), ages 5 to 10 years (49,2%) and ages 10-14 years (20,3%). 57,6% were male and 42,4% female. In order to analyze the specifics of dental care provided to children with ICP, a structured interviewing of children was conducted at the first phase of the study. When children were not able to answer the questions due to their pathology, their parents were interviewed instead. The questionnaire contained 18 questions and included questions on demographics, awareness about dental disease prevention and child’s health, and on the organization of dental care for children with ICP. During the second stage of the study dental status of a patient was examined. To do this an examination scheme was created: collection of demographic data, patient history, objective examination, physiological processes, condition of the oral vestibule, paradontium tissue and dental arch. Descriptive characteristics of the data were done with calculation of standard deviation. Data analysis was done with the help of Microsoft Excel and IBMSPSS Statistics 19. Results The interview questions on the behavioral factors revealed that only 28% of children under 5, 41% of children ages 5 to 10, 33% of children from 10 -14 years brush their teeth twice a day. At the same time, only 66%, 41% and 75% of children in each of the respective groups did that for more than 2 minutes. With age the number of children that do not change the toothbrush in half of a year increases (16%, 27%, 33% in respective groups). At the same time, only 37% of 45 Центрально-Азиатский научно-практический журнал по общественному здравоохранению children and their parents think about brand of toothpaste and its benefits. Almost half of the respondents (51,6%) never rinse they mouth after food intake, this relates both to boys and girls. When studying the issue of visits to dentist the survey has shown that 20% of children visit the dentist once a year during the regular checkup examination, 66% go to the specialists if they have a toothache. It was found out that the patients do not turn to dentist on their own, and it is known that these children need to visit dentists no less than 3 times a year. The reasons for not seeing the dentist included fear of treatment (72%) and high cost of treatment (18%). Based on patient history it was established that if these children went to dental clinics there were difficulties in conducting treatment and prevention procedures, which sometimes resulted in using general anesthesia or referring the patients to other specialized medical facilities. Almost all of the respondents (96,6%±2,36) saistated that dentists never visited this rehabilitation center. Likewise, only 8,5%±3,63 of the respondents have received information on oral hygiene from the dentist, 40,7%±6,4 from mass media, 50,8%±6,51 from a friend, peer or a relative. Based on the primary documentation of children it was revealed that 86,7% had an serious health condition, 83,3%±4,2 had a co-morbidity. Data received during oral examination is presented in Table 1. Table 1 – Results of oral examination of children with ICP Characteristics External assessment of dentofacial area Physiological processes Acute distress seen No acute distress Impaired Not impaired vestibulum orus Pathology No pathology buccal mucous membrane With changes Paradontal tissue condition Pathology Dental arch Physiological No changes No pathology Pathological Age Under 5 1 11,1± 10,47 8 88,9± 10,47 9 100 0 0 8 88,9±10,47 1 11,1±10,47 8 88,9±10,47 1 11,1±10,47 5 55,6±16,56 4 44,4±16,56 3 33,3±15,71 6 66,7±15,71 During oral examination it was found that almost all children have buccal mucous membrane pathology (88,3%). There were tongue changes: increased size, swelling, flattening or hyperplasia of filiform papilla, Total From 5 to 10 4 16,0 ±7,33 21 84,0± 7,33 24 96,0±3,92 1 4,0±3,92 19 76,0±8,54 6 24,0±8,54 22 88,0±6,5 3 12,0±6,50 9 36,0±9,60 16 64,0±9,60 1 4,0±3,92 24 96,0±3,92 From 10 to 14 3 11,5± 6,26 23 88,5± 6,26 26 100 0 0 17 65,4±9,33 9 34,6±9,33 23 88,5±6,26 3 11,5±6,26 14 53,8 ±9,78 12 46,2±9,78 4 15,4±7,08 22 84,6±7,08 8 13,3± 4,38 52 86,7± 4,38 59 98,3±1,67 1 1,7±1,67 44 73,3±5,71 16 26,7±5,71 53 88,3±4,15 7 11,7±4,15 28 46,7±6,44 32 53,3±6,44 8 13,3±4,38 52 86,7±4,38 tongue and articulation hyperkinesias, desquamative and geographical tongue. On the part of buccal mucous membrane there was catarrhal stomatitis, ulcerative stomatitis. Paradontium tissues condition identification 46 Центрально-Азиатский научно-практический журнал по общественному здравоохранению has shown that almost all children have chronic generalized paradontitis. During oral examination major dental deposits were seen, which evidences insufficient care for oral cavity. Almost all examined children (98,3%) had impairments of physiological processes: respiratory, swallowing, sucking, and chewing acts. In vestibulum orus there are changes in 73,3% of the cases. Delayed eruption of both deciduous and permanent teeth was seen. 75% of children had cavities, among them almost half had multiple teeth with caries. Discussion In Kazakhstan dental care is provided free of charge to the following groups of population: 1. Emergency dental care for socially unprotected groups of population, 2. Scheduled dental care (except orthodontic and orthopedic) to children under 18 and to pregnant women, including teeth extraction, preparation and tooth filling form composite materials chemical cure. 3. Orthodontic care to children with congenital pathology of dentofacial area with use of dentofacial anomalies correction apparatus (biteplate) [7]. In the RK provision of dental care to children with falls under the framework of state guaranteed amount of free medical care. However, children with ICP, especially with its hyperkinetic form, have significant difficulties in conducting treatment and prevention activities. The quality of general dental service to this category of people is not perfect and for the patients with severe form of ICP it is usually impossible to get such care. Provision of additional services or their provision in a more comfortable way requires additional costs, both for the patient and the family in general. There is insufficient information on the services provided for free, and low incentives for healthcare workers. Under the framework of state guaranteed amount of free medical care there is no scheduled orthopedic and orthodontic care, therapeutic care is only provided in the form of chemical tooth filling. There is no preventive medical examination of children. The lack of specialized dental care for children with ICP leads to the deterioration of dental health. This in turn has an adverse effect on the underlying condition. Therefore additional state funds are needed for treatment and care for this category of patients. This justifies the creation of specialized care for children with ICP. Conclusions The study allows to draw the following conclusions: 1. Currently in the RK there is no specialized program of dental care provision to children with ICP; 2. There are no official statistical data on dental status of children with ICP. 3. Under the framework of guaranteed amount of state medical care scheduled orthopedic and orthodontic care, therapeutic care to children with ICP is only done in the form of chemical tooth filling. 4. Study of records of MSPE «Pediatric dental clinic» (form № 043/у, 039) identified that there are not records of children with ICP diagnosis; 5. As a result of the survey it was found that the main source of information about the prevention of dental disease was inner circle and mass media. Dental health education by the dentists in this category of patients was absent. Therefore, dental hygiene knowledge level among children with ICP was low. 6. High prevalence of caries complications, prevalence of dental anomalies is 96%, difficult clinical picture of anomalies is frequent. Children are in need of orthodontic treatment. Severe impairments of mucous membrane and oral cavity paradontium are seen. Children with ICP diagnosis have impairment of physiological processes: respiratory function, swallowing, sucking, and chewing acts. 96,2% of children with indications for orthopedic treatment do not receive it. 47 Центрально-Азиатский научно-практический журнал по общественному здравоохранению References 1. Leyla Muzarapova.//Situation of the disabled: problems and ways of social rehabilitation.- Kazakh institute of strategic research -2006. 2. CJSC «Medinfo» http://www.medifo.kz 3. Web site of the Ministry of labor and social protection of the RK http://www.enbek.gov/kz 4. Starobudtseva R.S. // Teeth caries in cerebral paralysis cases/ Dental issues.- Almaty 1978- 38-40 p. 5. Atezhanov D.O.// Dental issues №4(30)- 85-88 p. 6. Elizarova V.M., Bashirova N.V.// Dental care for children with limited abilities, children with ICP / Topical issues of child dental care and dental diseases prevention: collection of research works edited by prof. Kisselnikova L.P., ass.prof. Drobotko L.N.– М., SPb, 2012. 7. Act of the Government of the Republic of Kazakhstan of 15 December 2009, № 2136. UDC: 616.697 G.N. Nazarova Kazakhstan School of Public Health, MoH RK MEDICAL AND SOCIAL ASPECTS OF MALE INFERTILITY Key words: male infertility, medical-social factor, reproductive health. Summary. Infertility in marriage is a complex problem, solution of which is important not only from the medical, but from the social and demographic standpoints as well. Currently there is an increase in the number of male infertility cases registered in the world [1]. We attempted to study the prevalence of male infertility as well as specific factors affecting male fertility based on the utilization of medical services by the population of Almaty from 2010 to 2012. Materials included patients medical charts and annual reports. A total of 122 charts have been studies. The study was conducted on the basis of the City Center for Reproduction in Almaty, Kazakhstan. In order to assess the relationship of medical and social factors to infertility, Pearson's chi-squared test was used. Linear regression was used to predict the prevalence of male infertility. Based on the study findings, the prevalence of male infertility increased in 2012 compared to 2011 by 37%. Some social and demographic factors influencing male infertility included: social status, place of residence, age period. The prevalence was highest in the age group of 30 to 39 years. It was revealed that urban population is at higher risk for being diagnosed with infertility than rural population. Infertility rates are higher among labor workers. More than half of all patients (66%) represented the native ethnicity. The main underlying cause of infertility was candida infection. Chronic prostatitis was the most common co-morbidity. Disturbed spermatogenesis in male infertility most of the time was represented by asthenozoospermia. Results of our study highlight the need to implement measures for prevention of male infertility among the population, as well as more comprehensive study of social and medical aspects of the condition. 48 Центрально-Азиатский научно-практический журнал по общественному здравоохранению Introduction Materials and methods Protection of male and female reproductive health is one of the priorities of medical and social directions. The need to improve the demographic situation in the country determines the need for close examination of lifestyle factors and reproductive behavior and their impact on reproductive health [1]. According to the data of screening study of the National Center of Urology named after B.U. Dzharbussynova, signs of fertility abnormalities were found in 30,4% of men in the Republic of Kazakshstan, signs of erectile dysfunction were found in 56,3% of men [2]. A range of studies is devoted to problem of male health, but they are mainly devoted to study of etiological and pathogenic factors of male infertility and its treatment [2, 3]. At the same time there is a lack of research in the area of reproductive health of young men with consideration of medical and social factors influencing it. Furthermore, there is a need to improve medical and social approaches to the prevention of men reproductive health abnormalities [4,5,6]. According to some researchers, the situation with infertility and diseases leading to this pathology is a consequence of insufficient research on this issue, as well as differences in methodological approaches [6]. The aim our research was to study the prevalence of male infertility among the population of Almaty and identification of social and demographic factors that influence the development of male infertility. The study was conducted on the basis of the medical faciity «City center for reproduction» (CCR) of the Department of Healthcare of the city of Almaty. According to the research design, during the first stage we conducted content-analysis conducted of CCR annual reports for the period of 2010 – 2012. Prevalence of primary and secondary male infertility was studied for the given period, as well as data on male infertility co-morbidities. During the second stage of the study, medical and social information derived from 122 medical charts (primary morbidity) of patients with infertility was done. The following information was considered: medical record number, date of birth, place of residence, ethnicity, profession and diagnosis. Data analysis was done using Microsoft Excel and IBMSPSS Statistical Application. In order to analyze the relationship of medical and social factors with infertility, Pearson's chi-squared test was performed. Linear regression method was used to predict the prevalence of male infertility. Results Based on the annual reports of CCHR (2010-2012), 452 men were treated for male infertility. Table 1 presents data on male infertility for the period of 2010-2012 which shows that the prevalence of this condition is increasing. From 2011 to 2012 the prevalence increased by 37%. Table 1 – absolute and relative indicator of male infertility for the period of 2010-2012 and prediction up to 2030 Types of infertility I primary infertility II secondary infertility Total Absolute and relative indicator of male infertility for the period of 20102012 and predictions up to 2030. 2010 102 (67,6±3.8) 49 (32,4±3,8) 151 (100) 2011 59 (46,5±4,4) 68 (53,5±4,4) 127 (100) 2012 2020 129 (74,1±3,3) 45 (25,9±3,3) 218 (86±2,2) 36 (14±2,2) 174 (100) 254 (100) 2030 353 (96±1,0) 16 (4±1,0) 369 (100) 49 Центрально-Азиатский научно-практический журнал по общественному здравоохранению During the analysis of medical charts it was identified that 66% of patients with infertility were of Kazakh, 24% of Russian and 8% of Uyghur origin (Picture 1). It is necessary to note that both primary and secondary infertility is more spread among the native ethnicity (Picture 1). Statistical confidence of connection of ethnicity with infertility type is defined with chi-squared criteria (χ2 = 7.48, p = 0.05). Picture 1– Distribution of infertility types with consideration of ethnicity Most often infertility is registered in the age group of 30 to 39 years (51%), followed by the age group from 20 to 29 (31%). In the first age group the prevalence of primary infertility is 53±6,1% and secondary is 59,1±6,1%. Picture 2 there shows data on the prevalence of primary and secondary infertility in each of those age groups. 59,1% 60,0% 53,0% 50,0% 40,0% 33,0% 30,0% 20,0% 10,0% 22,7% 13,6% 12,0% 2,0% 4,5% 0,0% Picture 2 – Distribution of infertility types in each age group. I infertility II infertility Main share of primary (80,2±4,0%) and and secondary infertility is more spread from 20 to 29 years from 30 to 39 years from 40 to 49 years From 50 to 59 years secondary (81,8±3,9%) infertility is seen among labor workers (37,7±4,4%) of inferwithin the urban population. Both primary tility (Picture 3). 50 Центрально-Азиатский научно-практический журнал по общественному здравоохранению 38,0% 40,0% 36,4% 35,0% 30,0% 25,0% 21,0% 18,2% 20,0% 15,0% 18,2% 15,0% 15,0% 13,6% 11,0% 10,0% 5,0% Picture 3 – Distribution of infertility morbidity with consideration of patients social status 0,0% The data peculiarities on pathogenic I infertilitymicroflora in infertility cases were also studoffice employee ied. Picture 4 presents infection structure in male infertility. Leading place is taken by II infertility candida infection, which is seen in worker Individual labor unemployed Other 23,2±1,5% of infertility cases. 23,2% 12,7% 14,9% 12,4% 12,3% 12,0% 5,9% 6,7% Picture 4 – Infection structure in male infertility Most common co-morbidity is chronic prostatitis (77±1,9%) (picture 5). 51 13,6% Центрально-Азиатский научно-практический журнал по общественному здравоохранению 8% 2% chronic prostati 6% varicocele 77% 7% hypogenitalism epididymitis epididymis cyst Picture 5 – Co-pathology in male infertility It was identified that spermatogenesis abnormality in male infertility (picture 6) is mostly presented by asthenozoospermia (61,6±2,4%) and oligospermia (21,7±2,0%). 22% Asthenozoospermia 8% 62% 8% oligospermia Aspermia Hypooligoasthenozoospermia Picture 6 – Co-pathology of male infertility Discussion In the gender equality strategy of the Republic of Kazakhstan for 2006-2016 is stated that it is necessary to increase men responsibility for preserving their health, provide free information on different male health issues, and ensure the provision of consultation on family issues. Currently in Kazakhstan there is no targeted policy for protection of male reproductive health; there is no special infrastructure for men in the healthcare system on the level of primary medical care; there is low awareness of men in the issues of health protection [8]. In recording primary documentation it is necessary to pay attention to medical and social factors, such as knowledge on the issues of preserving and strengthening men health, work and living conditions, contraception methods, nutrition, behavioral risk factors. In the joint report of WHO/World Bank on disabilities from 9 June 2011 it is stated that infertility is an eighth by prevalence and serious global abnormality, which is no less urgent than maternal sepsis and unsafe abortion. Among the population groups under 60 years infertility takes 5th place by prevalence as a serious global abnormality after depression, refractive visual impairments, unintentional trauma and alcoholism [9]. Study results evidence that it is necessary to take measures to prevent the progression of male infertility, as well as study social and medical aspects of this pathology more thoroughly. 52 Центрально-Азиатский научно-практический журнал по общественному здравоохранению Conclusions There is a growth of male infertility cases and according to the forecast, in the next 10 years the male infertility indicators will increase thrice. The study has identified effect of social factor on the development of infertility, namely: а) dependency of infertility on ethnicity, b) disease localization in the age group from 30 to 39 years, c) disease concentration among state population, d) specifics of disease development among labor workers. There were medical aspects of male infertility identified: а) specifics of special microflora in infertility, with dominance of candida infection, b) co-morbidity with chronic prostatitis, c) spermatogenesis abnormality in infertility with domination of asthenozoospermia. References 1. WHO, World Bank / World Report on Disability // Geneva, World Health Organization, 2011. 2. M.K. Alchinbayev.// State of male health according to the data of NUC named after B.U. Dzharbussynov,/ Urology and nephrology of Kazakhstan, 4(5) - 2012. - 616 p. 3. T.E. Khussainov //Main causes of male infertility and new treatment directions / Urology and nephrology of Kazakhstan. 4(5), 2012. - 108-122 p. 4. Kulavskiy V.A., Dautova L.A.//. Medical and social aspects of reproductive health protection / Mother and child: Materials of the IV Russian forum. M.,2002. – 50-52 p. 5. Medik V.A., Yuriyev V.K., Petrenko A.A., Pribysh I.A.// Female infertility/ Spb.: «Chimera», 2001. - 160 p. 6. Vassilyeva T.P., Bostrikov E.B. //Medical and social problems of fatherhood/ Young family at the turn of the ХХХХ1 centuries: regional experience and problems: materials of regional scientificpractical conference – Ivanovo, 2000. – 3233 p. 7. Ivanov A.G. // Comprehensive medical and social assessment of reproductive potential of modern youth // author’s summary of dissertation of doct.med.sci / Ryazan, 2005. – 35 p. 8. Act of the President of the Republic of Kazakhstan of 29 November 2005, N 1677 On approval of Gender equality strategy in the Republic of Kazakhstan for 20062016. 9. Current practices and controversies in assisted reproduction: report of a WHO meeting on "Medical, Ethical and Social Aspects of Assisted Reproduction, 2001. Geneva, World Health Organization, 2001. 53


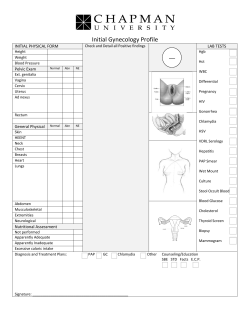


© Copyright 2026