
How to Put ACE 3T Mistake Proofing into Your Standard... Procedures (SOP) to Optimise Your Taguchi Loss Function
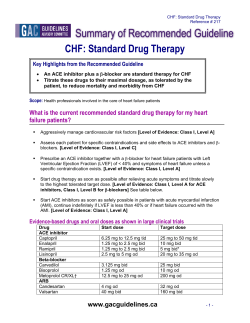
Phone:
Fax:
Email:
Website:
+61 (0) 402 731 563
+61 (8) 9457 8642
[email protected]
www.lifetime-reliability.com
How to Put ACE 3T Mistake Proofing into Your Standard Operating
Procedures (SOP) to Optimise Your Taguchi Loss Function
Abstract
How to Put ACE 3T Mistake Proofing into SOPs to Optimise Your Taguchi Loss Function: The least
wasteful and maximum profit-making outcome of an activity can be described by the optimised region of its
Taguchi Loss Function. By identifying the optimal outcome of a task and setting it as the target to be
achieved in standard operating procedures (SOPs) you force innovation and continual improvement towards
maximum operating profits. The Accuracy Controlled Enterprise (ACE) 3T error proof method of writing
SOPs sets the optimal Taguchi Function Loss zone as the target you need to meet to control work to the
optimal performance for maximum business profit.
Keywords: Taguchi Loss Function, Mistake Proof, Error Proof, Work Quality Assurance
The Taguchi Loss Function is a concept describing the loss to our societies and the world when a system or
process is not operated at optimum performance. When any process or system operates it produces a range
of outcomes. The distribution of the outcomes is termed the process variation. We want processes and
systems that are centred on the optimal zone of their loss function while also producing the least variation. If
we can achieve minimum loss in a process we automatically get maximum value from it.
Loss
Figure 1 shows the characteristics of a symmetrical loss function and how it is used to identify the losses and
wastes that a system or process causes at different values of an adjustable parameter. Producing on either
side of the optimal region leads to rapidly rising losses from such things as scrap and waste, rework, plant
and machinery breakdowns, workplace stress, fatigue and many other unwanted outcomes.
Minimum
Loss
A Variable Factor
Figure 1 A Symmetrical Loss Function (often they are not symmetric)
When a process is away from its optimal operating zone it may still perform satisfactorily but it will not be
its best possible results—value is left behind and forever lost. Figure 2 shows the range of a process’
outcomes taking the form of a normal distribution. There are several other forms of distribution but a normal
distribution is often found. In Figure 2 the process outputs are well off-centre and the business is suffering
great losses and missing much profit because the process performance is far from the optimum.
This process is a candidate for improvement and it is well worth doing improvements if the process
performance can be economically brought across to the minimum loss zone. There might be some very
serious money to be made with some very simple changes.
C:\Users\Mike\Documents\Lifetime Reliability\LRS Maintenance Methodology\How to Use ACE 3T Procedures to Optimise the Taguchi Loss Function.docx
Loss
Phone:
Fax:
Email:
Website:
Minimum
Loss
+61 (0) 402 731 563
+61 (8) 9457 8642
[email protected]
www.lifetime-reliability.com
Great Losses
Suffered by this
Process Outcome
Distribution
A Variable Factor
Figure 2 Distribution of Process Variation not Centred on the Minimal Loss
Figure 3 shows the process variation has been moved to the optimal zone by tuning the operating factor and
improving the process control so as to cause the process outcomes to distribute around the loss optima.
Loss
This can be accomplished by use of Accuracy Controlled Enterprise (ACE) 3T error proofing standard
operating procedures. The 3Ts are Target – Tolerance – Test. ACE 3T mistake proof procedures require
you to specify the optimal loss zone as the Target outcome for each activity in a process task. By setting the
Target as the optimal loss zone you create momentum and energy in the job to achieve those results.
Minimum
Loss
Process Outcome
Distribution after
Process
Improvement
A Variable Factor
Figure 3 Distribution of Process Variation now Centred on the Minimal Loss
Figure 4 shows how the Target outcome is set in ACE 3T Mistake Proof SOPs to straddle the optimal loss
area. The Target is called the ‘Best’ result to differentiate it from an acceptable result within Tolerance but
not ideal. The Tolerance values are set at the maximum acceptable specification limits. Provided an
outcome is within Tolerance it is ‘Good’ enough. Between Best and Good zones we define a ‘Better’ result
as a stepping stone to guide people towards our optimal intent. The third ‘T’ is a proof Test to confirm
where you are on the loss function. The further away from Best that you are the more loss in value and
quality. If the proof Test shows that you are outside the Tolerance zone you must correct the problem and be
within Tolerance as a minimum before continuing the job. The Test is the vital quality control step where
error proofing occurs. If you are not within Tolerance it is an error and must be corrected before continuing.
Finally you squeeze every last bit of value out of the process by doing what is shown in Figure 5—reducing
the process variations to always be within the optimal zone for maximum profit. The 3Ts error proof work
and ensure a job is done optimally to maximise the benefits to the business, our society and the planet.
C:\Users\Mike\Documents\Lifetime Reliability\LRS Maintenance Methodology\How to Use ACE 3T Procedures to Optimise the Taguchi Loss Function.docx
Phone:
Fax:
Email:
Website:
+61 (0) 402 731 563
+61 (8) 9457 8642
[email protected]
www.lifetime-reliability.com
Only accept this range of outcomes
because they are what we want
Best
Better
Good
Loss
Better
Good
ACE 3T Procedures
used to Move Process
Outcome Distribution
Minimum
Loss
Value of a Variable Factor
Tolerance
Tolerance
Target
Target
Figure 4 ACE 3T Procedure Sets the Minimal Loss Zone as the Target Outcome
Only accept this range of outcomes
because they are what we want
Best
Better
Good
Loss
Better
Good
ACE 3T Procedures used
to Optimise Process
Outcome Distribution
Minimum
Loss
Value of a Variable Factor
Tolerance
Target
Tolerance
Target
Figure 5 Reduce Process Variation so all Distribution is in the Minimal Loss Zone
Read more about 3T error proofing at Moving to Quality Accuracy in Production and Maintenance and see
an example 3T mistake proof SOP at ACE 3T Error Proof Procedure Plummer Block Example.
My best regards to you,
Mike Sondalini
www.lifetime-reliability.com
C:\Users\Mike\Documents\Lifetime Reliability\LRS Maintenance Methodology\How to Use ACE 3T Procedures to Optimise the Taguchi Loss Function.docx


© Copyright 2026