
HOW TO DO (AND HOW NOT TO DO) FIELDWORK ON... RURAL POVERTY ABSTRACT
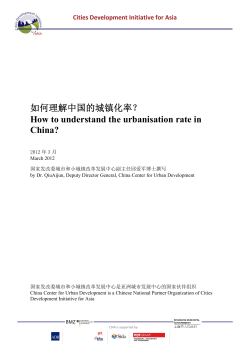
HOW TO DO (AND HOW NOT TO DO) FIELDWORK ON FAIR TRADE AND RURAL POVERTY ABSTRACT This paper addresses the methodological challenges of understanding the dynamics of poverty and labour markets in rural areas of developing countries. It does so by drawing on methodological choices made for the Fair Trade, Employment and Poverty Reduction project (FTEPRP) in Ethiopia and Uganda, which is gathering new evidence on the mechanisms through which agricultural commodity exports affect the welfare of poor people. FTEPRP research has a particular interest in the extent to which and ways in which Fair Trade may affect the welfare of those relying for their survival on wage employment opportunities. The paper contrasts the methods used in this research with standard approaches to rural development economics research. Four innovations are highlighted. First, in marked contrast to most surveys in rural Africa and to virtually all previous evaluations of fair trade schemes, FTEPR methods were designed specifically to collect evidence on wage workers rather than producers. Second, the project adopted a form of contrastive venue-based sampling, based on explicit sample selection criteria. Third, within the selected research sites, stratified random sampling procedures, aided by the use of GPS devices and handheld computers (PDAs), were based on clearly identifiable ‘residential units’ as opposed to often inaccurate official registers of ‘households’. And, fourth, when constructing a ‘household roster’ the research used an economic definition rather than the more common and often misleading residential rules. Key Words: Agriculture, Labour Markets, Africa, Methodology INTRODUCTION Careful and transparent research methodologies are central to efforts to advance understanding of how labour markets work and to improve knowledge of the mechanisms through which agricultural commodity exports may affect the welfare of poor people. This paper contributes to methodological debates (and their significance for the policy recommendations of research) through a discussion of the methodology adopted in a study of the implications for poor rural workers of fair trade certified as well as non-certified production in Ethiopia and Uganda. The methodological argument has broader implications for research on poverty and agrarian change, contrasting the approach developed for the Fair Trade, Employment, and Poverty Reduction Project (FTEPR) with standard approaches to rural development economics research.1 1 Fair Trade, Employment and Poverty Reduction in Ethiopia and Uganda is a four year research project (2009-13) funded by the UK Department for International Development (DFID). Project details may be found at www.ftepr.org 1 The paper highlights four methodological contributions. First, in marked contrast to most rural surveys in Africa and to virtually all previous evaluations of fair trade schemes, FTEPR methods were designed specifically to collect evidence on wage workers rather than producers. Second, the project adopted a form of purposive contrastive venue-based sampling, with clear and transparent site selection criteria. Third, within the selected research sites, stratified random sampling procedures, aided by the use of GPS devices and handheld computers (PDAs), were based on clearly identifiable ‘residential units’ as opposed to ill-defined ‘households’. And, fourth, when constructing a ‘household roster’ the research used an economic definition, discussed below, rather than the more common and often misleading residential rules. Further, besides describing some (soft and hard) technology used in the research, the paper advocates a very simple reform to the way that most rural research on poverty reduction is reported, recommending a greater openness and clarity on how and why particular research sites are chosen and sampling methods adopted. The methodological and ideological shortcomings of much previous research on Fair Trade are especially egregious examples of more widespread features of rural development economics research: for example, the most recent review of research on Fair Trade and other ethical labels argues that field studies ‘lack a convincing and consistent methodology’ (International Trade Centre, 2011: 25). And Fair Trade is just one among many institutional forms of the broader phenomenon of agricultural exports. It has been acknowledged that too little is known about the transmission mechanisms linking agricultural commodity trade and poverty reduction. Collecting more evidence, specifically on complex rural labour markets linked to agricultural export production, is therefore urgently required. This much has been acknowledged by, among others, the Wold Bank, in its 2008 World Development Report, and the UK’s DFID, which has begun to commission research on labour markets and growth in low-income countries.2 The evidence needed is not available because almost all socioeconomic surveys in developing countries fail to capture data on the most vulnerable, poorly educated casual and seasonal workers, especially temporary migrant workers (Sender et al., 2005, Sender and von Uexkull, 2009: 64-66, Pincus and Sender, 2008).3 As we will argue below, one reason for this failure and for the strong bias it introduces into the majority of rural economic research is the a priori standardized, narrow and 2 The World Development Report 2008 emphasised, for example, that ‘stunningly little policy attention has been given to the structure, conduct and performance of rural labor markets and how they ease successful transitions out of agriculture’ (World Bank, 2008: 221). For DFID’s ongoing research programme see http://www.dfid.gov.uk/r4d/Project/60890/Default.aspx . 3 On the poor coverage of rural wage employment in commonly cited Ethiopian surveys specifically see Rizzo (2011). The more general point has been made that ‘in much of the development literature on propoor growth nowadays, little or no attention is paid to the underlying mechanisms that determine the dynamics of income…specifically, the dynamics of employment growth and of how and to what extent productivity growth translates into the growth in labour earnings is left out of the equation’ (Wuyts, 2010: 10). On the ‘jobs dementia’ that affects development aid thinking and agencies more generally, Amsden (2011) points out: ‘Despite championing the cause of poor people around the world, and dramatizing the human condition, the United Nations’ Millennium Development Goals make not the slightest mention of employment generation as a means to battle poverty’ (2011: 57). 2 inappropriate definition of ‘the household’ and its ‘residents’, and the use of incomplete household lists that miss out migrant workers at their workplace. The methodology presented in this article is based on research techniques that differ from the methods commonly used in both standard rural surveys in Africa and in the evaluation of Fair Trade. These methods include: the use of contrastive case-studies to understand causal channels leading to differences in employment and poverty; the construction of up-to-date household lists using GPS technology in order to remove some common but damaging biases that emerge in the use of official household lists; and an innovative approach based on a wider and more useful definition of household membership. These techniques are designed to try to overcome both the technical challenges of gathering evidence on elusive populations and the common analytical evasion of the significance of wage employment to the lives and prospects of the poorest people. The second section of the paper (Neglect of Wage Work in Fair Trade Research) shows how little is known specifically about wage employment in Fair Trade schemes and highlights some of the common methodological weaknesses in this regard of research and impact studies. While rural wage work may be extensive in scale, the ideological and practical factors that tend to limit the coverage of such workers suggest that rural casual wageworkers should be regarded as a vulnerable, ‘hard-to-reach’ or ‘hidden’ population, excluded from many official statistical surveys and rural development programmes. This is why rigorous epidemiological research on similarly ‘hard-to-reach’ populations, such as illegal migrants, refugees, commercial sex workers, injecting drug users and other groups at high risk of HIV, offers valuable lessons for the design of surveys of rural labour markets in Africa. Indeed, the method adopted in the FTEPRP shares many features with Venue-based Sampling as developed by the US Centers for Disease Control and Prevention (Muhib et al., 2001, Vermund et al., 2010). As Landry and Shen (2005: 1) explain, excluded populations tend not to be missing at random, so that census or survey data is usually biased, ‘particularly with respect to minorities, immigrant groups, or the homeless’. The success of this method depends on the ability of researchers to triangulate limited quantitative data with ethnographic qualitative work to identify specific geographic areas (or ‘Venues’) with a high density of the target population to be sampled. The third section of this paper (Selecting the Research Sites) describes the rationale for and the qualitative methods used to identify the research sites for the FTEPRP: the main examples are drawn from fieldwork in Ethiopia, though some information is given also on the work in Uganda, and considerably more detail is provided on the project’s web site (www.ftepr.org). This follows criticisms of the rather casual approach taken by many other rural surveys to the key issue of research site selection. The research method reported in this paper is based on a contrastive case study approach that 3 highlights the rationale for the purposive selection of different research sites and that generates comparisons within as well as between sites. The purpose is to assess the strength of mechanisms connecting agricultural commodity export production with the lives and prospects of poor rural people, particularly those involved in wage employment. The fourth section of the paper (Selecting the Research Sub-sites and Sampling) discusses the additional methods used by the FTEPRP to select research sub-sites, i.e. the ‘hotspots’ containing concentrated populations of wageworkers producing export crops. This section also describes methods used to obtain household lists that are more accurate than those used in many other studies. This approach may be regarded as an adaptation of techniques using hand-held computers and global positioning devices – also pioneered by epidemiologists (Vanden Eng et al., 2007). The section on sub-site selection also explains our approach to household membership, where we eschew the misleading and narrow criteria used by many other studies, in favour of an approach that allows the linkages between geographically distant individuals to be better understood. NEGLECT OF WAGE WORK IN FAIR TRADE RESEARCH The key aim of the FTEPRP was to provide robust data on wage employment. In contrast, most Fair Trade research has concentrated on an ideal type of crop producer, i.e. the small farm household using more family than hired labour to produce the certified crop. One systematic review of the certification literature found that ‘most of the studies reviewed deal with the producer as a self-employed individual and with producer cooperatives’ (International Trade Centre, 2011: 19). The Fairtrade Foundation commissioned a review of 33 case studies, which concluded that: ‘there is limited evidence of the impact on workers of participation in Fairtrade, and more research is required …’ (Nelson and Pound, 2009: 35). A recent impact evaluation commissioned by the Fair Trade Foundation of certified smallholder banana organizations failed to obtain any data at all on workers hired by producers or their organizations in two of the three case studies (Smith, 2010: 52). Other research on the impact of Fair Trade certification, based on case studies of six rather successful small producer organizations, simply assumes that the landless, women and those with limited education do not benefit from and are ‘outside the dynamics of’ Fair Trade labelling (Laroche and Guittard, 2009: 34). The International Initiative for Impact Evaluation highlights the problem that ‘many Fairtrade organizations … establish a minimum price for producers but do not deal with the conditions of workers that the producers may employ’ (International Initiative for Impact Evaluation, 2010: 2).4 A good and especially relevant example is Jena et al (2012) whose study of the impact of coffee certification in Jimma Zone, Ethiopia, fails to examine wage employment and focuses solely, for a study of the impact of coffee certification on poverty reduction, on ‘smallholder farmers’. 4 Important exceptions to this neglect of wageworkers include research by Valkila and Nygren (2009), Leuchtford et al. (2008), Maertens and Swinnen (2011), and Maertens et al (2011). 4 Thus, the majority of these studies do not even attempt to construct samples of seasonal and permanent wageworkers producing certified export commodities. On the rare occasions when wageworkers are included in Fair Trade research, information on these workers is often collected from lists of wageworkers provided, and sometimes selected, by employers or by officially sanctioned worker representatives (Barrientos and Smith, 2006: 4, Ruben et al., n.d.: 23, Omosa et al., 2006: 7). These lists may well be censored and are certainly unlikely to contain all casual workers, let alone recently dismissed or disgruntled workers. The other main source is focus groups, with group membership guided by employers’ advice, or over-representing the leaders of the permanent workforce, rather than large numbers of illiterate casual (female) wageworkers. No convincing rationale for the selection of members of these focus groups is provided (Pound and Phiri, 2009, Gonzalez, 2010). The unrepresentative workers who appear on these lists or in these focus groups are, all too frequently, interviewed on their employer’s premises (Ewert et al., 2005: 22-3, Barrientos et al., 2009: 27). Such interviews are unlikely to solicit reliable information; workers who are not interviewed in private and with firm assurances of confidentiality may go to great lengths to avoid the risk of being seen to offend dominant classes. In Nicaragua, for example, some workers for cooperative coffee processing mills were interviewed at their workplace and some while waiting for buses along the roads outside the mills. ‘Unsurprisingly, workers interviewed outside the mills were more critical of their working place than those interviewed inside. According to these workers, visitors often come to the mill to ask about their working conditions, but they are afraid to say anything negative for fear of losing their job’ (Valkila and Nygren, 2009: 5).5 SELECTING RESEARCH SITES One unresolved issue in previous Fair Trade research concerns the criteria used in the selection of research sites. Certified or Fair Trade production takes place in very different contexts, with certified schemes varying, among other factors, in terms of the level of external subsidy/support they have received, the number of producers participating, the number of years of operation, the degree of financial viability, distance from markets. The range of rural areas participating in Fair Trade schemes (and therefore the range of possible research sites within a country) is very wide, but the reasons for deciding to focus fieldwork in a particular rural area, or on one particular group 5 FTEPRP fieldwork highlighted precisely that employers, who have close ties to local officials, are keen to avoid situations where their workers have the freedom to engage independently and privately with researchers. Local security officials and the police in one fieldwork site detained research assistants for several hours and lectured the senior researchers on ‘proper’ research methods, which included asking ‘the owner’ of a large agro-export (multinational) business to select workers and then interviewing only the selected workers at the workplace. 5 of certified producers, have rarely been explained in any detail. For example, the only rationale for choosing producers in one methodologically ambitious, ‘quasiexperimental’ study of the welfare impact of fair trade programmes is briefly (and unsatisfactorily) stated as: ‘The selection of FT organizations for the analysis has been conducted in coordination with Solidaridad’ (Ruben et al., n.d.: 17; Ruben et al., 2009). The study of smallholder banana producer organizations, mentioned above, was carried out in three countries, but provided little discussion of the choice of smallholder organizations or the countries themselves (Smith, 2010: 28). Nevertheless, this study did acknowledge that one very important country producing fair trade bananas (Colombia) was for some unstated reason excluded from this ‘Global Assessment of Impact’ and that the three banana plantations selected were not at all representative of the majority of fair trade certified plantations (ibid: 33). In particular, two of the case studies of smallholders involved organizations that were ‘larger, more sophisticated and/or more supported by external partners’ than other fair trade organizations. Further, all three banana case studies were also unrepresentative of the majority of fair trade producers in that they sold almost their entire output to the fair trade market (ibid: 138). These problems are shared by much economic research in poor rural areas. For example, the most influential rural surveys conducted in Ethiopia in recent decades have made little effort to justify their selection of sample sites. Debates on rural poverty in Ethiopia very often cite the results of The Ethiopian Rural Household Surveys 1989-2004. These surveys selected only 15 (out of more than 20,000) kebeles in Ethiopia as the sites for data collection.6 The rationale provided for the selection of these kebeles is confusing: initially some were chosen on the grounds that they were typical (in some undefined sense) of areas affected by the 1984-5 famine; additional kebeles were later selected ‘to account for the diversity of the farming systems in the country’ and it was then claimed that that households in the survey are ‘broadly representative of households in nonpastoralist farming systems as of 1994’ (Dercon and Hoddinott, 2009: 6-8).7 However, 18 agroecological zones have been defined for Ethiopia (CSA, 2006: 16) and within each of these zones 6 In Ethiopia, the kebele is the smallest administrative unit. It is broadly comparable to a ward. 7 A similar claim was made concerning the choice of the 36 villages surveyed in an influential study of poverty in rural Uganda: ‘The selected villages represent quite well the considerable diversity that exists within the two selected regions’. However, the researchers make it clear that the actual choice of villages was heavily influenced by the wishes of District-level bureaucrats; the measures, or the relevance to issues of poverty, of the indicators of ‘diversity’ are not discussed (Krishna et al., 2006). Another study in four Districts of rural Uganda (of coffee producers) sampled only those producers appearing in the Uganda National Household Survey (UNHS). Unfortunately, the UNHS was not designed to be representative of coffee producers (or of households in each District), so that the sample cannot be considered representative of robusta producers in the Districts concerned, let alone of coffee producers in Uganda as a whole. This fundamental problem did not prevent the World Bank funded researcher from drawing conclusions about ‘the Ugandan coffee market’ and ‘the majority of coffee grown in Uganda’ from unrepresentative data (Hill, 2010: 455 and 438). The fact that the UNHS specifically excluded larger scale coffee farmers in Uganda from the survey is another important reason for caution in extrapolating its results to the coffee market as a whole (Ssekiboobo, 2008: 7). 6 there are many hundreds of alternative kebeles that could have been be selected as research sites. The reasons for selecting the 15 particular kebeles that continue to be the focus of so much research are not discussed. There were plans to study exactly the same 15 kebeles in 2010, not on the old grounds that they are representative of agro-ecological zones, but because they ‘fall into five main livelihood categories of broad relevance for policy’ (Bevan, 2009: 14). However, no less than 175 extremely diverse ‘livelihood zones’ have been identified and mapped in Ethiopia (Livelihoods Integration Unit (LIU), 2011). The 15 kebeles selected for the ERHS obviously provide a limited coverage of this wide range of livelihood categories (The Livelihoods Integration Unit, 2010: 121). The claimed policy relevance of the selected sites is also questionable; they will certainly not be useful to illuminate some key economic policy debates - about floriculture, coffee or foreign exchange availability, for example - since they do not represent key areas characterized by agricultural export production.8 By contrast, a much more transparent discussion of the choice of rural research sites for another longitudinal survey in Ethiopia notes that ‘budgeting constraints and concerns regarding the long-term sustainability of the study meant that the rural sites selected were located in relatively better accessible areas. This is likely to have resulted in (surveyed) rural households being located in wealthier sites than the typical Ethiopian rural household’ (OutesLeon and Sanchez, 2008: 4). The choice of fieldwork site may be expedient and more or less defensible. For example, an authoritarian ruling political party or the Fair Trade certifying body or manipulative Co-operative Union officials may have pre-selected the area for researchers, discouraging research in other areas; there may be insufficient research funding to travel to more distant research sites; record keeping may be weak at other sites, or production volumes erratic; local managers and state officials may welcome (or refuse) visits from outsiders. These types of practical issue will always play a role, but it is difficult to make a judgement about the meaning of research results if all the reasons for the selection of research sites are not discussed in detail. It is necessary to weigh up and balance complex information about potential sites, since sampling will have little credibility if it appears to have been ad hoc or whimsical (Wilson et al., 2006). There is, therefore, a strong case for more detailed discussions than are typical of the rationale for and methods of site selection in research projects. One principle of site selection – though not the only justifiable one – is that of contrastive case studies. The point of contrastive research is to explore the factors responsible for differences between phenomena in conditions with some common features: first, to establish whether there are 8 The broader political relevance of the sample is also questionable; the ERHS is not representative of the ethnic and religious composition of the rural Ethiopian population: e.g. Oromos are underrepresented (Kumar and Quisumbing, 2010: 2). Further criticisms of World Bank funded household surveys in other developing economies, focusing on their failure to provide a robust, transparent record of poverty incidence, has been provided by Walters et al., 2012. 7 contrasts, and what they are, (between Fair Trade and non-Fair Trade crop production, or between Fair Trade production and labour in coffee versus flowers, for example); second, to try to explain some of these differences (Lawson, 2003, Lawson, 2004).9 Thus, for example, the FTEPRP adopted a contrastive approach to studying rural employment and poverty dynamics in two very poor sub-Saharan African countries, based on a theoretical interest in researching the impact of small- and large-scale export crop production, certified and non-certified production, and production of different commodities.10 Contrastive case study research that involves an element of ‘impact assessment’ may appear to have something in common with the randomized controlled trial (RCT), ‘experimental’ method used to evaluate development ‘treatments’ (Banerjee and Duflo, 2011). This paper does not intended to provide a detailed critique of RCT ‘randomista’ methods. However, it is worth briefly distinguishing these from the contrastive research method reported and recommended in this paper. For example, the purposive selection of sub-sites was motivated by FTEPRP’s aim to understand complex mechanisms and to accumulate new knowledge about rural development processes through old-fashioned theoretically motivated descriptive research. Such methods have been favourably compared to more fashionable ‘quasi-experimental’ methods promoted by the RCT advocates (Deaton, 2010). Deaton’s argument is that it is far more important to achieve an improved understanding of how (through what mechanisms), for whom (which specific population groups), or why the production of export commodities might influence rural poverty, rather than to answer the narrow question of whether or not significant poverty reduction effects have been achieved on ‘average’ in the ‘treatment’ (e.g. the Fair Trade certified) group. Our research questions go beyond the usually narrow scope of the parameters of interest in social experiments through RCTs (Ravallion 2009, 2). Further, a contrastive case study strategy does not have to make over-ambitious claims to establish ‘control’ groups, emphasising rather the complexity and flux within specific rural populations and research sites. A contrastive case study approach can more easily explore and emphasise the distributive implications of different institutional arrangements for agricultural export production (for example) than the typical RCT effort to isolate average ‘treatment’ effects. One additional point about randomized experiment methods should be made: these methods are most readily applicable in the case of discrete, homogenous interventions with clearly delineated target groups, rather than in the study of more complicated sets of interventions to improve rural welfare through promoting commodity exports. ‘A proper RE [RCT] requires a high degree of 9 See also George and Bennett (2005) on comparative case studies. 10 The choice of Ethiopia and Uganda specifically was partly a function of budget constraints discussed in collaboration with the funding agency, DFID, and partly it represented a selection of two poor economies with a strong dependence on coffee for foreign exchange earnings (coffee being a particularly significant Fair Trade commodity). 8 homogeneity in intervention, target groups and context over time, conditions which are unlikely to hold in many cases’ (Vaessen, 2010: 15). Moreover, as Ravallion (2009: 2) notes, ‘randomization is only feasible for a non-random subset of the interventions and settings relevant to development… [and] better suited to relatively simple projects, with easily identified “participants” and “nonparticipants”’, not the case in projects supporting fair trade’. Thus, in the FTEPRP research a decision was taken early on in consultation with the funding agency to select two commodities in each country, allowing for further contrasts within – and in the case of one commodity across – the two countries. Thus, the research team chose to study labour markets in coffee and flower producing sites in Ethiopia and coffee and tea producing sites in Uganda. The reasons for choosing coffee, tea and flower production include: the macroeconomic importance of at least two of these commodities in Ethiopia and Uganda; the labourintensity and contribution to employment of all these commodities; the relatively long history of Fair Trade and other certification schemes for these commodities; the dramatic contrast between the dynamism of floriculture in Ethiopia and the relative stagnation in the production of both coffee and tea in Uganda and in the production of coffee in Ethiopia; and the opportunity to contrast techniques of arabica production with those of robusta production. Briefly explaining some of the decisions taken in the FFEPRP research project may illustrate the method. The contrastive objectives implied that it would be useful to identify several of the most important agricultural commodity exporting research sites in each country. An effort was made to identify cases exemplifying the ‘best’ producing sites in terms of reputation for quality and technological dynamism in addition to other relatively ‘average’ sites, in order to achieve a consistent method of contrastive exploration. Table 1 indicates the degree to which the objective of studying certified and non-certified production on large and small-scale farms could be combined in each country.11 It can be seen that it was impossible to identify appropriate research sites to complete all of the elements of the simple matrix in Table 1 because, for example, there are no small-scale Fair Trade certified floricultural enterprises in Ethiopia and no large-scale Fair Trade certified coffee estates in either country. This was one reason for the selection of only six research sites in each country, although the constraints imposed by the FTEPRP budget also limited the total number of research sites that could be considered. There are clearly difficulties involved in this approach. It may, for example, be difficult to attribute outcomes to certification as opposed to scale. This will present challenges that may in part be addressed through the detailed evidence and, especially, the qualitative research conducted for the project in 2012 to complement the quantitative analysis of a large survey. 11 Large-scale farms are defined as enterprises employing at least 75 wageworkers; small-scale farms are defined as enterprises that are members of Fair Trade certified smallholder cooperatives, or as enterprises employing less than 75 workers. 9 Table 1: Research Site Selection in Ethiopia and Uganda ETHIOPIA Floriculture Large Scale Fair Trade Coffee Small Scale Large Scale Golden Rose n.a. Non-Fair Trade Ziway n.a. Holeta Small Scale Ferro Limu-Kossa Kochera UGANDA Tea Fair Trade Coffee Large Scale Small Scale Large Scale Small Scale n.a. Mpanga n.a. ACPCU Kabale Kaweri Masaka Non-Fair Trade Ankole Within the boundaries of each of these six research sites, it was possible to achieve additional variation, i.e. to identify further contrastive opportunities, by careful selection of heterogeneous sub-sites, or ‘venues’, for sampling. For example, some export production sub-sites are in rural areas of very recent settlement and others in areas where people have been living for many years. A very much more detailed discussion of the selection of sites (including maps), showing how contrastive exploration has been operationalized, can be found in ‘Methodological Issues’, FTEPRP Discussion Paper No.1 on the project website (www.ftepr.org). SELECTING RESEARCH SUB-SITES AND SAMPLING Beyond the choice of sites to conduct research in, there are important methodological challenges in sampling in order to capture the dynamics of poverty and employment, largely swept under the carpet by much socioeconomic research. Researchers must decide how to define a household or residential unit and to be clear about the implications of such definitions. Pragmatic concerns as well as methodological ones will influence sample size. Sampling procedures may then depend on how important it is to capture variations within sites and among sub-groups in a population. Efforts purposively to capture those most typically ignored in socioeconomic research and to gather evidence, for example, on the heterogeneity of poor rural wageworkers, may require some over-sampling. By this is simply meant a stratified non-proportional sampling. Specific examples of the application of these methodological principles are elaborated below. Sample Size and Stratification For most researchers, practical constraints, including budget limitations, will combine with methodological principles and research objectives to shape samples. FTEPRP experience illustrates some ways of resolving these challenges and overcoming the biases shown above to be 10 a characteristic of many widely cited surveys. The budget for fieldwork was one of the determinants of the overall sample size in the FTEPRP. It was calculated that the first round quantitative survey could only afford to interview approximately 750 individual respondents, equivalent to about 120 respondents per site, in each country. Since comparisons between sites are an extremely important part of the FTEPRP analysis, there were good arguments for achieving a roughly equal sample size in each site, also considering possible variation within sites (Wilson et al., 2006: 357-8). The random sample at each purposively chosen site was large enough to be statistically representative of all female and male adults (aged 14 years or older) resident in the research subsite areas (see Table 2). However, the total sample at each research site was also designed to oversample those adults whose experience has been neglected in previous surveys but was most relevant to FTEPRP research, namely casual wageworkers producing the relevant export crop. Since the focus of the research was on this particular group and given qualitative evidence gathered about heterogeneity among wageworkers during scoping trips in the pre-selected sites, it was considered that a sufficiently large sub-sample of wageworkers was necessary to be able to account for variation and allow comparisons between different wageworkers. In other words, selective oversampling reflected the priority given to comparisons among different groups of wageworkers. Nevertheless, since the overall site samples were designed to be large enough in absolute terms to be representative of the local adult population, they include and allow comparisons with both male and female non-wageworkers. Moreover, the design did not rely on an arbitrary definition of the ‘Household Head’ in selecting the target respondents; and the lists from which the samples were drawn were far more accurate and up-to-date than in most rural surveys. In addition, the total sample at each research site was designed to ensure some variation in the characteristics of respondents, mainly through the choice of analytically relevant sub-sites. Several days of qualitative research and discussions with key informants living in each research site provided sufficient information to identify sub-sites (venues) where there was a relative concentration of Residential Units (RUs) housing wageworkers. A boundary was drawn around each research sub-site with the aid of waypoints defined by the GPS Unit attached to a handheld computer (PDA).12 For example, in Ziway two distinctive sub-sites were selected, both of which contain a large proportion of flower wageworkers. The first was an established part of Ziway town, where most residents originated from Ziway or its immediate surroundings. The other subsite was a very new neighbourhood on the border of the rapidly growing town. This is an area 12 Epidemiologists have pioneered the use of these technologies for surveys in rural Africa; see for example Vanden Eng et al (2007). The FTEPRP benefited from advice and training in the use of PDAs with GPS provided by Anja Terlouw and James Smedley of the Liverpool School of Tropical Medicine. 11 where most newly-arriving migrant workers settle, many of them originating from the Southern Nations, Nationalities, and People’s Region (SNNPR) of Ethiopia. Exclusively sampling in only one of the two would have resulted in the virtual exclusion of either group of core respondents. The point is that each sampling site is likely to contain quite distinct sub-sites, because rural areas are rarely homogenous. By random sampling in several contrasting, purposively selected sub-sites it was possible to achieve much more heterogeneous samples – samples that included non-migrant and food crop wageworkers, females, more highly paid and permanent wageworkers, nonwageworkers, etc. The analysis could, therefore, be based on comparisons of data covering very different types of local people, leading to a better understanding of the complexities of the determinants of rural welfare. Constructing a sampling frame Official household surveys in Ethiopia and Uganda are based on samples drawn from lists of rural households provided by village-level authorities. Officially maintained registers of ‘households’ are often used as the basis for the distribution of scarce resources such as food aid, or subsidized agricultural inputs and credit; rural elites are likely to have good reasons for selective editing of the names appearing on lists of potential beneficiaries.13 Besides, fieldwork experience in these two countries, as well as elsewhere in Africa, indicates that these lists are frequently unreliable because, apart from excluding marginalized people who have encroached as squatters and all those living in arrangements that do not correspond to standardized households, the lists are not sufficiently up-to-date to include all newly arrived (or departed) residents.14 An alternative, adopted in the FETPRP research, is to create a sample frame on the basis of a new and complete census of all types of housing structures discovered in the research sub-sites. Thus, the FTEPRP sampled from an up-to-date list of Residential Units created specifically for the project rather than from a conventional list of arbitrarily defined ‘heads of households’. The process of listing Residential Units started with a complete enumeration (census) by the research 13 Ethnographic work in two villages in Northeast Ethiopia describes how local officials administering the Productive Safety Net Programme constructed lists of households so as to reserve the benefits of the programme for ‘the more affluent and economically potent households’, excluding ‘the poorest and chronically food-insecure households’, many of which depended on casual agricultural wage labour (Bishop and Hilhorst, 2010). 14 For example, fieldwork in Kabale District in Uganda compared the official list of households maintained by one LC1 Chairman with a careful FTEPRP village census. The Chairman’s list was found to be grossly inaccurate. There is also evidence, insufficiently discussed in the relevant survey documentation, that the lists of households at the kebelle level in Ethiopia, which are regularly used as rural sampling frames, are also unreliable. For example, a choice has to be made between alternative lists of households held by the kebelle Chairman, local Health Extension Workers or Development Agents; one or more of these lists may well have been amended by the survey team (IFPRI and EEPRI, n.d.). It has been admitted that not all villages sampled in the Ethiopian Rural Household Surveys had ‘good’ lists of registered households (Dercon and Hoddinott, 2009: 7). A quantitative survey in the Northeastern Highlands of Ethiopia, backed up by careful qualitative work, indicated that official kebelle lists usually excluded households that did not pay tax, as well as some single person households and people belonging to ‘socially marginalized groups’ (Sharp et al., 2003: 36). 12 officer and a field supervisor of all the RUs observed within the sub-site boundaries (defined above). An RU was defined as any structure in which at least one person was sleeping. Special care was taken by these senior and experienced members of the research team to record the precise GPS location and to assign an identifier to all RUs, including non-conventional RUs, e.g. temporary shacks and the doors of rented rooms where migrants were sleeping. The complete census of a sub-site could be completed fairly rapidly, since it involved walking up to the door of each RU and entering its position on the PDA.15 Once the preliminary residential census had been completed, field teams constructed a more detailed and up-to-date sampling frame of adult potential respondents living in RUs in the research sub-site by conducting a PDA survey that included seven questions, designed to stratify the selection of respondents for the main paperbased interview. A high proportion of RUs - between 45 and 100 per cent of the total number of RUs identified in the census - were randomly selected, using the software installed on the PDA.16 Enumerators were then sent to each of the randomly selected RUs (or to all of the RUs) to make contact with any willing adult who had slept in the RU on the previous night. It was usually easy, with the aid of the GPS device and the locations recorded in the census, for enumerators to find these randomly selected RUs and a willing respondent. The interviews were completed electronically, using a short questionnaire installed on the PDA. On average, completing an interview and entering all the basic data on the PDA required less than 15 minutes. Data on a very large number of adults could then be uploaded onto spreadsheets by the research officer, as the basis for the final random and stratified sample of respondents. The PDA survey, equivalent to a quasi-census given the large samples involved, was used to build the final sampling frame for each sub-site. The research officer, in consultation with all the members of the research team (by email or Skype), analysed on a spreadsheet the data uploaded to his laptop computer from the electronic questionnaires. The key information used to define strata for the final sample of adults concerned labour market participation and migration. For example, adults could be classified into the 15 The census of RUs in rural Ethiopia and Uganda was much less problematic than similar exercises listing unregistered urban populations in China with the aid of PDAs; there it was necessary to take a great deal of time to enumerate thoroughly, ‘looking for doors behind doors’ (Treiman et al., 2005: 13). Depending on settlement density and topography, the FTERP research teams might enumerate between 80 and 150 RUs a day in rural settings, while in the more urban settlements of Ziway this could rise to more than 300 a day. 16 The software used for GPS navigation and the collection of GPS census data was CDCGPS2, developed by a team of researchers at the Centre for Disease Control (freely available at http://ftp.cdc.gov/pub/gpscs/). The digital questionnaires were designed and programmed using ‘Syware Visual CE’ (http://www.syware.com/products/visual_ce.php). In some smallholder coffee research sub-sites in Uganda, all of the RUs identified in the census, as opposed to a random selection of RU’s, were re-visited to obtain the expanded sampling frame of individuals. This strategy was adopted in research sites where export crop wageworkers lived in scattered RUs interspersed with many other RUs containing no such workers. The aim was to ensure that the population list of individuals contained a sufficient number of the scattered wageworkers, so that a random sample drawn from the list of individuals was likely to capture both respondents with and without relevant labour market experience. 13 following strata: ‘never worked for wages’; ‘currently working for (a named certified or noncertified export crop enterprise)’; ‘currently working for wages for another farm’; ‘currently working for wages for an export crop processing factory’; ‘recent migrant’.17 It was easy to confirm that the final sample was representative of the large population list of adults from which it was drawn – in the sense that the gender, mean age and education of the sample respondents generally closely matched the gender, mean age and education recorded in the population lists, as shown in Chart 1.18 This congruence was to be expected, since rather high percentages of the individuals in all the strata on the population list were sampled. Ensuring a complete picture of residential unit members Almost all socioeconomic surveys in developing countries fail to capture data on the most vulnerable, poorly educated casual and seasonal workers, especially temporary migrant workers.19 One reason for this failure is that the most influential of these surveys, the Living Standards Measurement–type household surveys (LSMS) promoted and funded by the World Bank throughout the developing world, rely on an a priori standardized, narrow and inappropriate definition of ‘the household’ and its ‘residents’. So, in both Ethiopia and Uganda, the Rural Household Surveys and the National Household Surveys fail to collect detailed information from ‘non-residents’ concerning migration episodes in search of wage employment.20 Important groups of vulnerable wageworkers, especially those engaged in seasonal, casual and low-paid jobs outside major urban centres, are frequently not ‘resident’ in ‘households’. They live and work for long periods in hostels, labour camps, barracks, construction sites and illegal squatter settlements, or they have been given some space to sleep at their workplace during the harvest season, or while working as domestic servants. These are the ‘nowhere people’, the uncounted flocks of footloose migrants who ‘drift in and out of temporary worksites’ (Breman, 2010: 135). Such migrant workers remit part of their wage earnings to other individuals and these remittances are usually recorded in the LSMS Surveys covering the recipients’ households. Unfortunately these wage 17 The list of possible classifications of respondents varied across research sites. The electronic questionnaire included additional questions for some research sites, reflecting the type of variation that FTEPRP hoped to achieve in the context of different crops and production contexts. 18 There are exceptions as in the case of poorly educated male tea workers in Uganda. This difference between sample and population may be due to the over-sampling of a particular group, and can be corrected for site-level inference with the use of sampling weights. 19 At the other end of the scale, the largest and richest farmers in a rural area may also be excluded from lists of households or farm households, because their farms are not defined as being operated by ‘households’ (Choudhry, 2008: 11), or simply because surveys of households usually exclude the top end of the wealth/income distribution (Banerjee and Piketty, 2003: 4, Székely and Hilgert, 1999, Deaton, 2001). The domestic and farm servants living with and working for the rural rich are, therefore, also missing from rural household surveys. 20 Some implications of the failure to collect information on young, mobile rural people who are defined as ‘non-residents’ in conventional household surveys have been quantified using data from Burkina Faso – their exclusion has a major influence on assessments of rural living standards (Akresh and Edmonds, 2010). In Vietnam, assessments of rural and urban living standards have been shown to be unreliable for the same reasons (Pfau and Giang, 2008). 14 earnings are not classified as wage income in the receiving households, leading to a serious underestimate of the degree to which poor rural households depend on income derived from wage employment. In the FTEPRP, enumerators were instructed to visit the respondents selected for the final sample and they then completed a long, paper-based questionnaire that provided information not only about the selected individual respondent, but also about a large number of other individuals to whom the respondent was ‘economically linked’. The concept of a roster of ‘economically linked’ individuals replaces the more conventional concept of a ‘household roster’ (based on residential criteria), providing additional and extremely useful information on labour market participation and the other characteristics of individuals usually considered ‘absent’ and therefore irrelevant to an analysis of the welfare of rural populations.21 The problems and associated ‘myths’ surrounding the use of conventional (residential) definitions of the ‘household’ in rural surveys in Africa have been subject to extensive debate and criticism (Adato et al., 2007, Akresh and Edmonds, 2010, Guyer and Peters, 1987, O'Laughlin, 1995).22 Randall et al (2011: 217) point out that despite widespread ‘international endorsement of the importance of household surveys as providers of data for development planning, little attention has been paid to the issue of what “household” means in these surveys: how it is defined for data collection purposes and what the definition implies for the analysis and interpretation of results’. Despite widespread knowledge of the limitations of traditional, simple residence coding rules for household membership, few alternatives have been applied in large-scale surveys. There are challenges in using a more realistic ‘economic household’ definition; but these are far outweighed by the benefits of not missing relevant linked members and therefore achieving a more solid basis for understanding individual and household welfare. Finally, GPS identifiers helped enumerators to locate the individuals selected for the sample and to locate respondents randomly selected as substitutes by the research officer in case the individual originally selected could not be found or did not consent to the interview. On average the time gap between compiling the sample frame and conducting the eventual interview was about 10-14 days. However, given the highly mobile nature of the target group, it proved necessary to interview substitutes in 247 out of 1705 interviews (14.5 per cent). All substitutes were selected randomly 21 The definition was designed to include the four following categories of linked individuals: (1) those who live permanently with the principal respondent and who share income and expenditure; (2) those who, even if not sharing residence on a regular basis, make significant economic contributions (in cash or in kind) to the expenses of the household/respondent; (3) those who, even if not sharing residence, regularly depend on economic contributions in cash or in kind from the respondent or others in the RU; (4) those who, even if not resident at all in the same place as the respondent, either can be relied upon by the respondent, or receive contributions from the respondent. 22 Evidence from different disciplines ‘shows that the household as defined by survey statisticians may bear little resemblance to the social unit in which people live’ (Randall et al, 2011: 217). 15 within the specific sub-site where the originally selected respondent lived.23 CONCLUSION This paper has made it clear how fragile are the methodological foundations of many rural socioeconomic studies, including perhaps especially those of the impact of Fair Trade. Lack of clarity about research site selection and ill considered sampling methods are often compounded by ideological blind spots. It is to highlight the significance of these methodological weaknesses and to begin to address them that this paper has summarized the fieldwork methods designed for the FTEPRP research. Aside from the aim of ensuring that rural wage workers were included along with non-wage workers, three methodological choices with broad relevance have been highlighted: a site selection protocol allowing for contrastive explanation; the construction of accurate and up-to-date household lists using GPS technology and a particular approach to sampling within research sites; and an approach to household membership emphasizing economic linkages rather than short-term residence criteria. The hope is that these methods can allow for more accurate evidence to be collected and more rigorous analysis developed of the large number of ‘hidden’ wageworkers in rural Africa. This marks the project out from much rural economic research in poor countries. Adapting technology that has more widely been used by epidemiologists, FTEPRP research used a combination of techniques, including global positioning satellite (GPS) devices, handheld (PDA) computers and traditional paper based questionnaires to carry out rural surveys that yield evidence that could not be so easily made available by other means. The methods adopted in this project may also be of interest to those hoping to carry out their own rural research while avoiding the pitfalls that so many researchers in rural Africa have failed to circumvent. In particular, the discussion here may be helpful to those with an interest in redressing the remarkable lack of evidence on the ways rural labour markets operate, the ways in which and extent to which wage employment is central to the lives of huge numbers of poor rural people, and the mechanisms through which involvement in successful and less successful agricultural export activities affects the welfare and prospects of extremely poor people. The project’s methods differ from 23 The site selection and sampling methods and GPS technology allow for a follow-up survey of a subsample of the original respondents. FTEPRP research also involves qualitative research methods, including life histories of a small sample of those included in the initial survey. The advantages of “nesting” qualitative life histories within larger quantitative surveys are described in Shatz, 2102 and in Sender et al., 2006. 16 ‘traditional’ area-sampling approaches. For aside from the convenience of using GPS and computer technology rapidly to generate reliable sampling frames, FTEPRP research has presented a clear rationale for and has described in detail the process of selecting research sites, instead of fetishizing the random first stage selection of administratively or geographically defined areas, or making dubious claims concerning the national representativity of the research sites selected. 17 Table 2. Summary of FTEPRP Sample Sizes ET ET UG tea flowers coffee UG coffee total GPS census, RUs 2280 2441 1350 1906 7977 PDA survey, RUs 1066 1407 890 1380 4743 PDA survey, individuals PDA survey sample size (% of total RUs) 2358 3958 2014 2765 11095 46.75% 57.64% 65.93% 72.40% Average number of adults per RU 2.21 2.81 2.26 Extrapolated no of adults in site 5043 6867 3055 59.46% 2.33923 7 18660.0 9 Total number of individuals interviewed (paper-‐based questionnaire) Estimated % of total population interviewed 335 571 347 6.64% 8.32% 11.36% 2.00 3819 438 1705 11.47% 9.14% Chart 1. Comparing Selected Statistics for the FTEPRP Sample and the Total Population % never completed primary school Emily MacDougall 13-4-12 7:39 AM Formatted: None, Don't keep with next, Don't keep lines together Emily MacDougall 13-4-12 7:39 AM Formatted: None, Don't keep with next, Don't keep lines together Emily MacDougall 13-4-12 7:39 AM Formatted: None, Don't keep with next, Don't keep lines together Emily MacDougall 13-4-12 7:39 AM Formatted: None, Don't keep with next, Don't keep lines together Emily MacDougall 13-4-12 7:39 AM Formatted: None, Don't keep with next, Don't keep lines together Emily MacDougall 13-4-12 7:39 AM Formatted: None, Don't keep with next, Don't keep lines together Emily MacDougall 13-4-12 7:39 AM Formatted: None, Don't keep with next, Don't keep lines together Emily MacDougall 13-4-12 7:39 AM Formatted: None, Don't keep with next, Don't keep lines together Emily MacDougall 13-4-12 7:39 AM Formatted: None, Don't keep with next, Don't keep lines together Emily MacDougall 13-4-12 7:39 AM Formatted: None, Don't keep with next, Don't keep lines together Population Sample % never completed primary school (female) Population Sample 18 % never completed primary school (male) Population Sample Mean Age Population Sample % Female Population Sample 19 References Adato, M., F. Lund and P. Mhlongo (2007) 'Methodological Innovations in Research on the Dynamics of Poverty: A Longitudinal Study in KwaZulu-Natal, South Africa', World Development, 35(2): 247263. Akresh, R. and E. Edmonds (2010) 'The Analytical Returns to Measuring a Detailed Household Roster'. The Institute for the Study of Labor (IZA), Discussion Paper No. 4759. Amsden, A. (2011), ‘Say’s Law, Poverty Persistence, and Employment Neglect’, Journal of Human Development and Capabilities, 11 (1): 57-66. Banerjee, A. and T. Piketty (2003) Top Indian Incomes, 1956-2000, Cambridge, MA. Banerjee, A. V. and E. Duflo (2011) Poor economics: a radical rethinking of the way to fight global poverty, New York: PublicAffairs. Barrientos, S., J. Anarfi, N. Lamhauge, A. Castaldo and A. Akua, N. Akua (2009) 'Social Protection for Migrant Labour In the Ghanaian Pineapple Sector'. Development Research Centre on Migration, Globalisation and Poverty. Barrientos, S. and S. Smith (2006) The ETI Code of Labour Practice: Do Workers Really Benefit?, Brighton. Bevan, P. (2009) 'Methodological Approach and Fieldwork Plan'. Mokoro Limited, Oxford. Bishop, C. and D. Hilhorst (2010) 'From food aid to food security: the case of the Safety Net policy in Ethiopia', Journal of Modern African Studies, 48(2): 181-202. Breman, J. (2010) 'A Poor Deal', Indian Journal of Human Development, 4(1): 133-142. Choudhry, G. H. (2008) Consultancy Report on The World Bank Mission to Uganda For Developing a Sample Design for the Uganda Agriculture Census and Surveys, Washington, DC. CSA, C. S. A. (2006) 'Atlas of the Ethiopian Rural Economy'. Central Statistical Agency (CSA), Addis Ababa with International Food Policy Research Institute, Washington, DC, USA Ethiopia. Deaton, A. (2001) 'Counting the world’s poor: problems and possible solutions', The World Bank Research Observer 16(2): 125-147. Deaton, A. (2010) 'Instruments, Randomization, and Learning about Development', Journal of Economic Literature, 48(2): 424-455. Dercon, S. and J. Hoddinott (2009) 'The Ethiopian Rural Household Surveys 1989-2004: Introduction'. Department of Economics, University of Oxford and International Food Policy Research Institute, Washington DC. Ewert, J., A. Martin and V. Nelson (2005) 'Assessment of The Social Impact of Adoption of Codes of Practice in The South African Wine Industry'. Natural Resources Institute and DFID. George, A. L. and A. Bennett (2005) Case studies and theory development in the social sciences, Cambridge, Mass.; London: MIT Press. Gonzalez, A. M. R. (2010) 'Estudio Sobre La Cadena De Valor Del Café Ugandés De Comercio Justo: Análisis de la cadena de valor del café Robusta de Uganda de Comercio Justo y su impacto en los Medios de Vida de los productores ugandeses'. Intermón Oxfam. Guyer, J. I. and P. E. Peters (1987) 'Introduction', Development and Change, 18(2): 197-214. 20 Hill, R. V. (2010) 'Liberalisation and producer price risk: examining subjective expectations in the Ugandan coffee market', Journal of African Economies, 19(4): 433. IFPRI, I. F. P. R. I. and E. E. P. R. I. EEPRI (n.d.) Making Rural Services Work for the Poor and Women: Local Public Investments in Agricultural and Water Services in Ethiopia, Addis Abeba. International Initiative for Impact Evaluation (2010) Fair and square: better market share, more benefits through Fairtrade, New Delhi. International Trade Centre (2011) The impacts of private standards on producers in developing countries, Geneva. Jena, P.R., B.B. Chichaibelu, T. Stellmacher and U. Grote (2012) ‘The impact of coffee certification on small-scale producers’ livelihoods: a case study from Jimma Zone, Ethiopia’, Agricultural Economics, 43: 429-440. Krishna, A., D. Lumonya, M. Markiewicz, F. Mugumya, A. Kafuko and J. Wegoye (2006) 'Escaping poverty and becoming poor in 36 villages of Central and Western Uganda', The Journal of Development Studies, 42(2): 346-370. Kumar, N. and A. R. Quisumbing (2010) 'Policy Reform towards Gender Equality in Ethiopia: Little by Little the Egg Begins to Walk'. International Food Policy Research Institute, Wasgington DC. Landry, P. F. and M. Shen (2005) 'Reaching Migrants in Survey Research: The Use of the Global Positioning System to Reduce Coverage Bias in China', Political Analysis, 13(1): 1-22. Laroche, K. and B. Guittard (2009) 'The impact of Fairtrade labelling on small-scale producers: Conclusions of the first studies'. Max Havelaar France. Lawson, T. (2003) Reorienting economics: Economics as Social Theory, London: Routledge. Lawson, T. (2004) 'Modern Economics: A Problem and a Solution', in Edward, F. (ed) A guide to what's wrong with economics, pp. 21-32. London, Anthem Press. Leuchtford, P., G. De Neve and D. Wood (2008) 'The hands that pick fair trade coffee: Beyond the charms of the family farm', in Leuchtford, P., De Neve, G., Wood, D. and Pratt, J. (eds) Hidden Hands in the Market: Ethnographies of Fair Trade, Ethical Consumption, and Corporate Social Responsibility, pp. 143-169. Bingley, Emerald Group Publishing Ltd. . Livelihoods Integration Unit (LIU) (2011) 'Livelihoods analysis', Addis Abeba, http://www.dppc.gov.et/Livelihoods/livelihoodhome.html (accessed on 13 November 2011). Maertens, M., L. Colen and J. F. M. Swinnen (2011) 'Globalisation and poverty in Senegal: a worst case scenario?', European Review of Agricultural Economics, 38(1): 31-54. Maertens, M. and J. F. M. Swinnen (2011) 'Gender and Modern Supply Chains in Developing Countries'. Katholieke Universiteit Leuven, Belgium (mimeo). Muhib, F., B., L. Lin, S., A. N. Stueve, N., R. Miller, L., W. Ford, L., W. Johnson, D. and P. Smith, J. G. (2001) 'A venue-based method for sampling hard-to-reach populations', Public Health Report, 116 (Suppl 1): 216-222. Nelson, V. and B. Pound (2009) 'The Last Ten Years: A Comprehensive Review of the Literature on the Impact of Fairtrade'. Fairtrade Foundation. O'Laughlin, B. (1995) 'The Myth of the African Family in the World of Development', in Bryceson, D. F. (ed) Women Wielding the Hoe: Lesson from Rural Africa for Feminist Theory and Development Practice. Oxford, Berg Publishers. 21 Omosa, M., M. Kimani and R. Njiru (2006) 'The Social Impact of Codes of Practice in the Cut Flower Industry in Kenya'. Natural Resources Institute and DFID. Outes-Leon, I. and A. Sanchez (2008) 'An Assessment of the Young Lives Sampling Approach in Ethiopia'. Young Lives Technical Note No. 1. Pfau, W. D. and L. T. Giang (2008) Groups Excluded from ‘Representative’Household Surveys: An Analysis Based on Remittances Sent and Received in Vietnam, Tokyo. Pincus, J. and J. Sender (2008) 'Quantifying Poverty in Viet Nam: Who Counts?', Journal of Vietnamese Studies, 3(1): 108-150. Pound, B. and A. Phiri (2009) 'Longitudinal Impact Assessment Study of Fairtrade Certified Tea Producers and Workers in Malawi'. Natural Resources Institute and Fairtrade Foundation. Randall, S., E. Coast and T. Leone (2011), ‘Cultural constructions of the concept of household in sample surveys’, Population Studies: A Journal of Demography, 65 (2): 217-229. Rizzo, M. (2011) Rural wage employment in Rwanda and Ethiopia: A review of the current policy neglect and a framework to begin addressing it, Geneva. Ruben, R., R. Fort and G. Zuniga (n.d.) 'Fair Trade programme evaluation: Impact Assessment of Fair Trade Programs for Coffee and Bananas in Peru, Costa Rica and Ghana'. Centre for International Development Issues Nijmegen, Radboud University Nijmegen, The Netherlands. Ruben, Ruerd, Ricardo Fort, and Guillermo Zúñiga-Arias. “Measuring the Impact of Fair Trade on Development.” Development in Practice 19, no. 6 (August 2009): 777–788. Schatz, Enid. “Rationale and Procedures for Nesting Semi-structured Interviews in Surveys or Censuses.” Population Studies 66, no. 2 (July 2012): 183–195. Sender, J., C. Cramer and C. Oya (2005) 'Unequal Prospects: Disparities in the Quantity and Quality of Labour Supply in sub-Saharan Africa'. World Bank. Sender, J., C. Oya and C. Cramer (2006) 'Women Working for Wages: Putting Flesh on the Bones of a Rural Labour Market Survey in Mozambique', Journal of Southern African Studies, 32(2): 313333. Sender, J. and E. von Uexkull (2009) A Rapid Impact Assessment of the Global Economic Crisis on Uganda: ILO, Geneva. Sharp, K., S. Devereux and Y. Amare (2003) 'Destitution in Ethiopia‚Äôs Northeastern Highlands (Amhara National Regional State), Final Report'. Institute of Development Studies and SC-UK Ethiopia. Smith, S. (2010) 'Fairtrade Bananas: A Global Assessment of Impact'. Institute of Development Studies, University of Sussex, UK. Ssekiboobo, A. M. (2008) 'Practical Problems in the Estimation of Performance Indicators for the Agricultural Sector in Uganda'. Institute of Statistics and Applied Economics, Department of Planning and Applied Statistics, Makerere University Kampala. Székely, M. and M. Hilgert (1999) What’s behind the inequality we measure? An investigation using Latin American data, Washington, DC. The Livelihoods Integration Unit (2010) An Atlas of Ethiopian Livelihoods, Addis Abeba, http://www.fegconsulting.com/what/services/early_warning/livelihood-integrationunit-liu/liu-atlas/completeatlas/Atlas%20Final%20Web%20Version%206_14.pdf (accessed on 15 November 2011). 22 Treiman, D. J., W. M. Mason, Y. Lu, Y. Pan, Y. Qi and S. Song (2005) 'Observations on the design and implementation of sample surveys in China', Los Angeles, CA: California Center for Population Research Working Papers Series CCPR-006-05. Vaessen, J. (2010) Challenges in impact evaluation of development interventions: opportunities and limitations for randomized experiments, Antwerpen. Valkila, J. and A. Nygren (2009) 'Impacts of Fair Trade certification on coffee farmers, cooperatives, and laborers in Nicaragua', Agriculture and Human Values, 27(3): 321 333. Vanden Eng, J. L., A. Wolkon, A. S. Frolov, D. J. Terlouw, M. J. Eliades, K. Morgah, V. Takpa, A. Dare, Y. K. Sodahlon, Y. Doumanou, W. A. Hawley and A. W. Hightower (2007) 'Use of handheld computers with global positioning systems for probability sampling and data entry in household surveys', The American Journal of Tropical Medicine and Hygiene, 77(2): 393-399. Vermund, S. H., S. L. Hodder, J. E. Justman, B. A. Koblin, T. D. Mastro, K. H. Mayer, D. P. Wheeler and W. M. E. Sadr (2010) 'Addressing Research Priorities for Prevention of HIV Infection in the United States', Clinical Infectious Diseases, 50(Supplement 3): S149-S155. Walters, Bernard, Richard Marshall, and Frederick Nixson. “Consistent and Transparent? The Problem of Longitudinal Poverty Records.” Development and Change 43, no. 4 (July 2012): 899–918. Wilson, I., S. Huttly and B. Fenn (2006) 'A Case Study of Sample Design for Longitudinal Research: Young Lives', International Journal of Social Research Methodology, 9(5): 351-365. World Bank (2007), World Development Report 2008: Agriculture for Development. World Bank: Washington. Wuyts, M. (2011), ‘Growth, Employment and the Productivity-Wage Gap: Revisiting the Growth-Poverty Nexus’, Development and Change, 42 (1): 437-447. 23


© Copyright 2026