
Clinical Pharmacokinetics & Anticoagulation Guidelines (2009)
CLINICAL PHARMACOKINETICS SERVICE & ANTICOAGULATION GUIDELINES Pharmacy Services University of Kentucky Chandler Hospital July 2009 (31st Edition) Editors: George A. Davis, Pharm.D., BCPS Clinical Pharmacist Specialist, Therapeutic Drug Monitoring/Internal Medicine Pharmacy Services, UK HealthCare Associate Adjunct Professor, Pharmacy Practice & Science University of Kentucky College of Pharmacy Daniel A. Lewis, Pharm.D., BCPS Clinical Pharmacist Specialist, Therapeutic Drug Monitoring/Internal Medicine Pharmacy Services, UK HealthCare Assistant Adjunct Professor, Pharmacy Practice & Science University of Kentucky College of Pharmacy Editions 1-19 (1987-97) compiled & edited by Mary H.H. Ensom, Pharm.D., FASHP, FCCP, FCSHP, FCAHS Professor, Faculty of Pharmaceutical Sciences, and Distinguished University Scholar, The University of British Columbia Clinical Pharmacy Specialist, Children's and Women's Health Centre of British Columbia Disclaimer: The Clinical Pharmacokinetics Service and Anticoagulation Guidelines are provided to assist with clinical pharmacokinetic monitoring and anticoagulation management of selected drugs for the Department of Pharmacy Services at the University of Kentucky Chandler Medical Center. Although the information contained in the guidelines has been obtained from reputable sources in accordance with currently available information, the editors do not assume any liability in connection with the use of any specific information contained herein. While great care has been taken to ensure the accuracy of the information presented, the reader is advised that it is possible that these pages contain some errors and omissions. If you find an error, please report it to George Davis at [email protected] or (859) 323-1789 and Daniel Lewis at [email protected] or (859) 257-8403. The information provided in the guidelines is not intended to replace sound clinical judgment in the delivery of healthcare. Dosing of monitorable drugs and anticoagulation management require independent and informed decisions by appropriate healthcare professionals. Also, the information in this manual may not be applicable to other healthcare institutions. Complete information concerning drug administration, dosage, sampling times, clinical laboratory procedures, pharmacokinetic data, and pharmacological and toxic effects of monitorable drugs should be assessed and contrasted with other sources prior to its clinical use. Table of Contents Page Department of Pharmacy Policy on Clinical Pharmacokinetics Service 1 Therapeutic Drug Monitoring (TDM) Laboratory Critical Value Call Policy 4 List of Monitorable Drugs and Therapeutic Ranges 5 Basic Pharmacokinetic Concepts 7 Guidelines for Pharmacokinetic Monitoring 14 General Equations for BSA, IBW, and Clcr 16 Monitorable Drugs Aminoglycosides – Conventional Dosing 19 Aminoglycosides – High Dose Extended Interval 30 Carbamazepine 40 Digoxin 43 Lidocaine 50 Lithium 52 Methotrexate 56 Pentobarbital 59 Phenobarbital 62 Phenytoin 65 Phenytoin, Free 74 Procainamide 77 Quinidine 81 Theophylline 84 Valproic Acid 91 Vancomycin 97 Guidelines for Saliva Collection and Monitoring 106 Anticoagulation Guidelines 108 1 UNIVERSITY OF KENTUCKY HOSPITAL CHANDLER MEDICAL CENTER POLICY NUMBER: PH-02-05 FIRST ISSUED: 1/88 Department of Pharmacy Policy CURRENT AS OF: 05/07 SUBJECT: PURPOSE: FUNCTIONS AFFECTED: GENERAL: Clinical Pharmacokinetics Service Policy/Procedures To establish a standardized pharmacokinetic monitoring approach for patients receiving drugs that are routinely monitored utilizing serum drug concentrations at the University of Kentucky Hospital. Clinical Pharmacist Specialists, Clinical Staff Pharmacists, Pharmacy Residents, and Pharmacy Students The Clinical Pharmacokinetics Service (CPS) Guidelines were developed to ensure safe and efficacious dosage regimens through the application of pharmacokinetic/pharmacodynamic principles and the determination of drug serum concentrations. The policy/procedure manual outlines standard guidelines which should be followed when providing clinical pharmacokinetic monitoring of the following drugs: aminoglycosides, carbamazepine, digoxin, fosphenytoin, lidocaine, lithium, phenobarbital, phenytoin (free and total), procainamide, quinidine, theophylline, valproic acid, and vancomycin. In addition to the above list, the CPS will also provide monitoring for warfarin for patients without assigned pharmacists. Monitoring Responsibility Within the pharmaceutical care process, the primary pharmacist/resident who attends rounds or precepts pharmacy students on the primary medical team is responsible for providing appropriate and costconscious therapeutic drug monitoring and provision of clinical pharmacokinetic evaluations. The CPS is responsible for overseeing the kinetic monitoring process for all patients and providing pharmacokinetic assessments for any patient that does not have an assigned primary pharmacist/resident. This responsibility is met through a team approach including a faculty member who serves as the Manager of Clinical Pharmacokinetics Service along with Pharmacy Practice Residents and PY4 pharmacy students as part of a resident/student rotation in Clinical Pharmacokinetics. Patients with serum drug concentrations on non-covered services are identified on a daily basis utilizing Sunrise Clinical Manager (SCM). Also, the Therapeutic Drug Monitoring (TDM) Laboratory provides an electronic report of all completed serum drug concentrations of patients admitted to the hospital twice daily. This allows for identification of any non-covered patients who are prescribed monitorable drugs which have not obtained serum concentrations. Physicians may also initiate a request for pharmacy to provide a clinical pharmacokinetic evaluation by verbal communication or through a pharmacy to dose requisition in (SCM). TDM Notification of Supratherapeutic Concentrations The Therapeutic Drug Monitoring Laboratory is responsible for the analysis of all "routine" serum drug assays evaluated by pharmacy during a pharmacokinetic evaluation. The TDM Lab notifies the primary pharmacist of any supratherapeutic concentrations between 8AM-4PM during the week; after 4PM and on weekends and holidays the Pharm D. resident on-call (beeper #330-3883) is notified. The TDM Lab notifies the clinical pharmacokinetic service of any supratherapeutic levels for any uncovered service. All other TDM issues should be directed to either Daniel Lewis (pager #330-4325) or George Davis (pager #330-4215). 2 Documentation in the Patient Medical Record When a patient has a serum drug concentration drawn, the primary pharmacist should write a “Clinical Pharmacokinetics” note in the patient’s chart within 24 hours for normal or subtherapeutic concentrations. For concentrations that are supratherapeutic, the medical team should be notified immediately if clinically warranted and a chart note should be written as soon as possible, but no more than 12 hours after the concentration is reported. The chart note should contain all relevant patient information and pharmacokinetic parameters necessary to produce the dosing and monitoring recommendations. Please refer to the CPS Policy/Procedure Manual (http://www.hosp.uky.edu/pharmacy/cps/default.html) for guidelines for documentation of pharmacokinetic evaluations for specific monitorable drugs. Notes written by students and non-licensed pharmacists/residents must be co-signed by a Kentucky-licensed pharmacist within 24 hours. Pharmacy to Dose Orders Purpose: To provide a policy/procedure for provision of pharmacy-directed monitoring in patients on medication regimens that lend themselves to therapeutic monitoring. Therapeutic drug monitoring is the utilization of pharmacokinetic and pharmacodynamic principles (often through drug concentrations) to optimize the safety and efficacy of a medication regimen. Information: All new orders for monitorable drugs will be assessed by a clinically trained pharmacist within 48 hours of initiation. If further monitoring is determined to be necessary by the pharmacist, the primary service will be contacted with the initial recommendation. At that time, the consulting pharmacist may request a verbal order for a pharmacy to dose order for that patient’s medication regimen in order to continue to follow the medication regimen. Alternatively, at any time, a physician may choose to order a pharmacy to dose consult. Pharmacy to Dose: 1. Any physician may request a pharmacist to provide therapeutic dosing and/or monitoring services for any specified pharmacologic agent. Such a request may be made by submitting a pharmacy to dose order in Sunrise Clinical Manager (SCM) or by giving a verbal order entered on his/her behalf. a. Such requests by the physician will result in the pharmacist being authorized to write orders for the initial drug dose, laboratory tests relevant to monitoring the drug, and/or subsequent orders for dosing adjustments as deemed appropriate by the pharmacist. Examples of these include ordering drug concentrations and/or assessments of renal/hepatic function relative to the dosing of an agent. b. At any time, the physician may alter the dosing and/or monitoring orders that have been initiated by the pharmacist. c. At any time, the physician may request the pharmacist discontinue the dosing/monitoring consult services being provided to a particular patient. 2. Upon receiving an order for pharmacy to dose a specific medication, a pharmacist will assess the patient and collect relevant information necessary to appropriately dose/monitor the specified drug so as to achieve therapeutic drug levels and minimize any potential risks of toxicity. Such items of information may include, but are not limited to: a. Indication for therapy (i.e. type and site of infection for antibiotic dosing/monitoring consults) b. Age 3 c. d. e. f. g. h. Sex Height/Weight Renal/Hepatic function Estimated pharmacokinetic parameters Medication history and/or time of last dose (if applicable) Current/last known serum drug concentration (if applicable) 3. Upon selecting a dosing and/or monitoring plan, the pharmacist will enter applicable orders into SCM. Any orders written by the pharmacist in response to a pharmacy to dose order will be entered under the requesting physician with the specified source of “Per Protocol”. 4. The pharmacist will provide a progress note in the chart to provide information regarding the course of the dosing and/or monitoring services in accordance with department of pharmacy policies PH-0204 and PH-02-05. 5. The pharmacist will be responsible for follow-up monitoring and/or dose adjustments if the pharmacist deems such actions necessary as documented in the progress notes. Pharmacokinetic Guidelines Refer to Clinical Pharmacokinetics Service and Anticoagulation Guidelines (updated annually) 4 UNIVERSITY OF KENTUCKY HOSPITAL CHANDLER MEDICAL CENTER POLICY NUMBER: FIRST ISSUED: 01/07 CURRENT AS OF: 07/2009 Clinical Laboratory Policy Subject: Therapeutic Drug Monitoring (TDM) Laboratory Critical Value Call Policy Purpose: To define guidelines for communicating supratherapeutic critical values at the University of Kentucky Medical Center. Information: • Supratherapeutic critical values for common TDM medications are listed in Appendix I. • • Supratherapeutic critical values (except cyclosporine, tacrolimus, and sirolimus) for patients admitted to a hospital service will be called to a pharmacist 24 hours a day based on the following schedule: o Monday through Friday from 8:00AM – 4:00PM: Critical values will be called to the pharmacist covering the medical service (list of service coverage will updated monthly by the Department of Pharmacy Services and provided to the TDM Lab Manager) If no response in 30 minutes from initial page, then TDM lab will page the Pharmacy Resident on Call (Pager #330-7400) If no response in 30 minutes from initial page, then TDM lab will contact the pharmacist in the Central Pharmacy at 3-5641. o Monday through Friday from 4:00PM – 8:00AM: Critical values will be called to the Pharmacy Resident on Call (Pager #330-7400) If no response in 30 minutes from initial page, then TDM lab will contact the pharmacist in the Central Pharmacy at 3-5641. o On weekends (beginning Friday at 4:00PM and ending Monday at 8:00AM) and holidays, critical values will be called to the Pharmacy Resident on Call (Pager #330-7400) If no response in 30 minutes from initial page, then TDM lab will contact the pharmacist in the Central Pharmacy at 3-5641. Supratherapeutic critical values for patients located in the Emergency Department will be called to a pharmacist 24 hours a day based on the following schedule: o Daily from 1:00PM - 11:00PM: Critical values will be called to the ED Clinical Pharmacist Specialist (Pager# 330-4327) If no response in 30 minutes from initial page, then TDM lab will page the Pharmacy Resident on Call (Pager #330-7400) If no response in 30 minutes from initial page, then TDM lab will contact the pharmacist in the Central Pharmacy at 3-5641. o Daily from 11:00PM – 1:00PM: the Pharmacy Resident on Call (Pager #330-7400) If no response in 30 minutes from initial page, then TDM lab will contact the pharmacist in the Central Pharmacy at 3-5641. • Immunosuppressants (cyclosporine, tacrolimus, and sirolimus) will be called to the transplant coordinator on the transplant service. o Heart/Lung: 330-2484 o Renal: 323-5953, 323-6099, 323-5737 o Liver: 323-4661 • Supratherapeutic critical values for patients in the University of Kentucky Clinics will be called directly to the ordering physician. 5 Appendix I. THERAPEUTIC DRUG MONITORING (TDM) CRITICAL VALUE CALL CRITERIA Phone# (859) 323-6393 UKCMC 6th floor (HA 647) List of monitorable drugs and therapeutic ranges. Monitorable Drugs acetaminophen amikacin (peak) amikacin (trough) amikacin (random) carbamazepine carbamazepine (saliva) cyclosporine digoxin gentamicin (peak) gentamicin (trough) gentamicin (random) lidocaine* lithium methotrexate phenobarbital phenobarbital (saliva) phenytoin (total) phenytoin (free) phenytoin (saliva) primidone* procainamide* (N-acetyl) procainamide* quinidine* salicylate Lab Abbr. ACAM AMIKP AMIKT AMIKR CRBZ FCRBZS CSA DIG GENTP GENTT GENTR LIDO LIT MTRX PHNO FPHNOS PHTN FPHTN FPHTN PMDN PROC NAPA QUIN ASAS Therapeutic Range Metric Units 10 – 30 25 – 35 5 – 10 variable 4 – 12 1.4 – 3.5 renal 100 – 200 cardiac 100 – 300 hepatic 100 – 300 lung 150 – 350 0.8 – 2.0 5 – 10 < 2.0 variable 1.5 – 6.5 0.6 – 1.2 ≥5 @ 24hrs ≥0.5 @ 48hrs ≥0.05 @ 72hrs ≥0.02 @ 1-2 weeks 15 – 40 5 – 15 10 – 20 0.8 – 1.6 1–2 5 – 12 4 – 10 NA 2–5 < 25 Supratherapeutic values called to PHARMACIST Lower Limit of Clinical Reportable Range 10.0 3.0 3.0 3.0 0.2 0.5 Upper Limit of Clinical Reportable Range 900 End Point End Point End Point 60 20 μg/mL μg/mL μg/mL μg/mL μg/mL μg/mL >35.0 >35.0 >10.0 >35.0 >15.0 >6.0 ng/mL >400 called to transplant coordinator 25 2000 ng/mL μg/mL μg/mL μg/mL μg/mL mmol/L >2.3 >10.0 >2.0 >10.0 >6.5 >1.2 0.5 0.5 0.5 0.5 1.0 0.1 13.5 36.0 36.0 36.0 10.0 End point 0.01 2000 5.0 5 2.5 0.5 0.5 0.1 0.2 0.3 0.2 5.0 240 240 40.0 12.0 4.0 End point End point End point End point 300 μmol/L μg/mL μg/mL μg/mL μg/mL μg/mL μg/mL μg/mL μg/mL μg/mL μg/mL called to floor >45.0 >18 >22.0 >1.6 >2.2 >15.0 sum >30 sum >30 >5 >30.0 Therapeutic Range International Units (μmol/L) 66 – 199 43 – 60 8.5 – 17 17 – 51 6 – 15 83 – 166 nmol/L 83 – 249 nmol/L 125 – 290 nmol/L 1.0 – 2.6 nmol/L 10.5 – 21 <4.2 variable 6.4 – 27.8 0.6 – 1.2 ≥5 @ 24hrs ≥0.5 @ 48hrs ≥0.05 @ 72hrs ≥0.02 @ 1-2 weeks 65 – 172 21.6 – 64.7 40 – 79 3.2 – 6.4 4–8 23 – 55 17 – 42 6.2 – 15.4 - 6 List of monitorable drugs a nd therapeutic ranges. (cont.) Monitorable Drugs sirolimus tacrolimus theophylline tobramycin (peak) tobramycin (trough) tobramycin (random) valproic acid vancomycin (peak) Lab Abbr. Therapeutic Range Metric Units SIRO 3-20 ng/mL TACRO 4-17 ng/mL THEO TOBP TOBT TOBR VALP VANCP 10 – 20 (bronchodilator) 6 – 13 (neonatal apnea) 5 – 10 < 2.0 variable 50 – 100 20 – 40 μg/mL μg/mL μg/mL μg/mL μg/mL μg/mL Supratherapeutic values called to PHARMACIST >15 called to transplant coordinator >25 called to transplant coordinator Lower Limit of Clinical Reportable Range Upper Limit of Clinical Reportable Range Therapeutic Range International Units (μmol/L) 2.0 50.0 - 2.0 50.0 5-21 55.5 – 111 >22.0 2.0 120.0 0.5 0.5 0.5 10.0 5.0 36.0 36.0 36.0 450.0 150.0 >13.0 >10.0 >2.0 >10.0 >120.0 >40.0 VANCT vancomycin (random) VANCR 15 – 20 (life threatening infections) variable 10 – 21 <4 variable 346 – 693 14 – 28 3 – 10 10 – 20 vancomycin (trough) 33 – 72 μg/mL >20.0 5.0 150.00 μg/mL >40.0 5.0 150.00 *Sent to outside laboratory and may require 2-3 days to report results. End point = sample can be diluted up to 3X. 10 – 14 variable Basic PK Concepts 7 Basic Pharmacokinetic Concepts: Linear pharmacokinetics: • Concentration (mg/L) • Serum concentrations change proportionally with increase in dose (e.g., increase dose from 500mg/day to 1000mg/day, concentrations and AUC double). Most drugs follow linear pharmacokinetics 40 30 20 10 0 0 500 1000 Dose (m g/day) Nonlinear or Michaelis-Menten pharmacokinetics: • • • Concentration (mg/L) • As dose increases, a disproportionately greater increase in plasma concentration is achieved Vmax = maximum amount of drug that can be metabolized per unit time (mg/day) Km = Michaelis-Menten constant, representing the concentration of phenytoin at which the rate of this enzyme-saturable hepatic metabolism is one-half of maximum Classic example: phenytoin 40 Drug elimination rate = 30 dX Vmax*Css = dt Km+Css ⎛ Dose ⎞ ⎜ τ ⎟ (S)(F)(K m ) ⎝ ⎠ Css = ⎡⎛ Dose ⎞ ⎤ (Vmax ) - ⎢⎜ (S)(F)⎥ ⎟ ⎣⎝ τ ⎠ ⎦ 20 10 0 0 500 Dose (mg/day) 1000 Basic PK Concepts 8 Clearance (Cls): • • • • Represents the volume of plasma (or blood) from which drug is removed, in a given time period Expressed in volume/time (e.g., ml/min, L/hr) Most IMPORTANT pharmacokinetic parameter Cls = ClHep + ClRen + ClOther Model-independent parameter used to estimate average steady-state concentrations and adjust maintenance doses (“c-bar equation”): C= • C= S ⋅ F ⋅ Xo Cls ⋅ τ or Cls = S ⋅ F ⋅ Xo C ⋅τ or Xo = Cls ⋅ C ⋅ τ S ⋅F Relationship between K, Vd, and Cl: K= • Ko ; Cls Cls or Cls = Vd*K; Vd NOTE: Vd and Cls are INDEPENDENT VARIABLES Hepatic Clearance (ClHep) Extraction (E) = fub *ClInt QH + (fub *ClInt ) where QH = hepatic blood flow; fub = fraction unbound; Clint - intrinsic clearance ClHep = QH X E ClHep = QH *fub *ClInt QH + (fub *ClInt ) For HIGH EXTRACTION (>70%) drug, fub *ClInt >>>>> QH , the equation reduces to: ClHep = QH For LOW EXTRACTION (<30%) drug, QH >>>>> fub *ClInt , the equation reduces to: ClHep = fub *ClInt • Renal Clearance (ClRen) ClRen = ClGFR + ClTS - ClTR GFR = glomerular filitration rate, TS = tubular secretion, TR = tubular reabsorption Basic PK Concepts Half-life (t½) & elimination rate (K): • Elimination t½ = time required for serum concentration to decrease by ½ after absorption & distribution phase Expressed in hours or minutes Takes approximated 3-5 half-lives to reach steady-state Dependent variable (depends on Cls and Vd): t½ = 0.693 ⋅ Vd or t½ = 0.693 • Clinically, can be calculated by 2 concentrations: t½ = • Most drugs follow first-order elimination • • • K C2 K Same with a log scale y-axis. Plasma drug concentration versus time after an intravenous (bolus) drug dose, assuming a onecompartment model with first-order elimination (linear y-scale). K = fraction of the drug in the body eliminated over time: ln K= C1 C2 0.693 or K = T' t½ ln 10 K= Concentration (mg/L) • Cl C ln 1 5mg/L t1/2 = 5 mg/L 2.5 mg/L = 0.173 hr -1 4 hrs 0.693 = 4 hrs 0.173 2.5mg/L 4hrs 1 0 2 4 6 Time (hours) 8 10 12 9 Basic PK Concepts 10 Volume of distribution (Vd): • • • • • • Vd is a hypothetical volume that is the proportionality constant that relates amount of drug in body to the serum concentration. Expressed in liters (L) or liter/kg (L/kg). Drugs distribute based on composition of body fluids and tissues. Xo where Xo = dose administered; Co = initial concentration Co Useful for calculating loading dose: LD = Vd ⋅ C Vd = Can calculate Vd using steady-state peak concentration after multiple dosing: Vd = K o (1 − e −Kt ) e-KT ss Cpk ⋅ K(1 − e −Kτ ) One-compartment model IV bolus 1-compartment model with first-order elimination following IV bolus: Cartesian graph paper Sem i-log paper 100 Concentration (mg/L) 100 Concentration (mg/L) • K 1 80 60 40 20 10 1 0 0 4 8 12 Time (hours) 16 20 24 0 4 8 12 16 Time (hours) 20 24 Basic PK Concepts 11 Two-compartment model: • Many drugs follow 2-compartment model (see model and concentration-time plot below) • However, 1-cpt model is sufficient to individualize doses of selected drugs (e.g., aminoglycosides, vancomycin) in the clinical setting if concentrations are drawn appropriately. IV bolus K12 1 2 K21 K10 Concentration (mg/L) 100 10 1 0 4 8 12 T im e (h r s ) 16 20 24 Basic PK Concepts 12 Multiple dosing and steady-state equations: ss pk C = K o (1 − e −Kt ) e-KT Vd ⋅ K(1 − e −Kτ ) ss Cpk = concentration (referred to as peak) drawn at T, time post infusion Ko = dosing rate in mg/hr K = elimination rate in hr -1 t = infusion time in hours (e.g., usually 0.5hrs for aminoglycosides) ss T = post infusion time in hours that corresponds with Cpk (e.g., usually 0.5hrs for aminoglycosides) Vd = Volume of distribution in liters τ = Tau, dosing interval in hours This equation is used for aminoglycosides and vancomycin which when dosed as intermittent IV infusion. You can build the steady-state multiple dosing equation using the following equations (also see next page): 1. The infusion (e.g., 30 min for aminoglycosides, 60 min for vancomycin) is a continuous infusion: C= Ko (1-e-kt ) Cl or Ko (1-e-kt ) Vd ⋅ K where t = infusion time This above equation will calculate the concentration at the end of an intermittent IV infusion following the first dose (assuming 1-cpt model and 1st order elimination). 2. Peak concentrations are obtained post-distributional to fit a 1-cpt model so the concentration must be eliminated the time after the end of the infusion (e.g., aminoglycosides = 30min; vancomycin = 60min). This can be accounted for by eliminating the concentration by multiplying the concentration by e -kT where T = time post infusion resulting in the following equation: pk C1st dose = Ko (1-e-kt ) ⋅ e-kT Vd ⋅ K 3. Concentrations are obtained at steady-state so accumulation must be considered using the following equation: 1 resulting in the final equation: 1-e-kτ K o (1-e-kt ) 1 C= ⋅ e-kT ⋅ = Vd ⋅ K 1-e-kτ ss pk C = K o (1 − e −Kt ) e -KT Vd ⋅ K (1 − e −Kτ ) Basic PK Concepts Multiple dosing of intermittent infusion (0.5 hr infusion every 8 hrs) Concentration (mg/L) 16 12 8 4 0 0 8 16 24 32 Time (hours) e -kT Concentration Ko (1 - e -kt ) Vk A ccum ulation F actor 1 t (1 − e − k τ ) T τ 13 Guidelines for PK Monitoring 14 GENERAL GUIDELINES FOR PHARMACOKINETIC MONITORING I. When a patient is on a monitorable drug A. Assess the necessity for serum drug concentrations and address this issue with the medical team. B. Avoid problems with interpretation of upcoming concentrations by: 1. 2. 3. 4. II. Obtaining the concentration at steady-state if possible. Avoiding ordering concentrations during third shift. Ascertaining that the nurse has marked the appropriate dose for obtaining concentrations on the EMAR (ex. Doses may have been given in the ER or documented in different areas of the medical records). Staggering penicillin doses away from the dose of an aminoglycoside around which concentrations are drawn (ideal if penicillin dose is given at least 2 hours apart from aminoglycoside dose). When a concentration is obtained A. Using the collect/received time reported in the lab computer and the EMAR, verify that the concentration is a peak or a trough. B. Document that the doses preceding the concentration were on time to verify that the concentration represent steady-state conditions. C. Calculate the appropriate pharmacokinetic parameters and compare with predicted population values. D. Write concise notes including kinetic parameters on all concentrations, whether therapeutic or subtherapeutic. (See sample notes on pages 25 & 100) E. Document any information, not retrievable from the medical records, that was used in making your calculations or recommendations (weight, height, or information obtained directly from the patient or healthcare provider). Remember… appropriate documentation will: 1. Improve the quality of care; 2. Allow continuity of care when changing services; 3. Document your role in patient management; 4. Protect you legally; 5. Protect you professionally in audits on quality of care. Guidelines for PK Monitoring III. 15 How does Clinical Pharmacokinetic Monitoring fit into the Pharmaceutical Care Process? Pharmacist’s primary responsibilities in PCare: • Identifying a patient’s actual and potential drug-related problems • Resolving the patient’s actual drug-related problems • Preventing the patient’s potential drug-related problems from becoming actual problems Clinical Pharmacokinetics role in PCare: Identifying and resolving potential problems if the patient is: • Taking or receiving the wrong dose of the correct drug • Experiencing an adverse drug reaction • Experiencing a drug-drug or drug-food interaction Pharmacist’s Role in Clinical Pharmacokinetic Monitoring (Am J Health Syst Pharm. 1998 Aug 15;55(16):1726-7) • • • • • • • Designing patient-specific drug dosage regimens based on pharmacologic characteristics of the drugs used, the objectives of drug therapy, concurrent diseases & drug therapy, and other pertinent patient factors. Monitoring & adjusting dosage regimens based on pharmacologic responses and on biological fluid (e.g. plasma, serum, blood, CSF) and tissue drug concentrations in conjunction with clinical signs and symptoms or other biochemical parameters. Evaluating unusual patient responses to drug therapy for possible pharmacokinetic and pharmacologic explanations. Communicating, verbally and in writing, information on patient-specific drug therapy to physicians, nurses, and other clinical practitioners. Educating pharmacists, physicians, nurses, and other clinical practitioners on pharmacokinetic principles and/or appropriate indications for clinical pharmacokinetic monitoring. Recommending assays or procedures for the analysis of drug concentration in order to facilitate the evaluation of dosage regimens. Developing quality assurance programs to document improved patient outcomes and economic benefits resulting from clinical pharmacokinetic monitoring. Equations for BSA, IBW and Clcr 16 GENERAL EQUATIONS for BSA, IBW, and Clcr Equations for body surface area (BSA): [ Wt(kg)0.425 x Ht(cm)0.725 x 71.84 ] BSA (m2 ) = 10,000 BSA (m2 ) = Ht(cm) x Wt(kg) 60 (Dubois; Arch Internal Med 1916;17:863) (Mosteller; NEJM 1987;317:1098) Equation for Ideal Body Weight (IBW): IBW (male, kg) = 50 + (2.3 x ea. inch over 5 ft) IBW (female, kg) = 45 + (2.3 x ea. inch over 5 ft) (Devine; Drug Intell Clin Pharm 1974;8:650) Estimation of GFR using serum creatinine (Scr) • Creatinine is endogenous substance derived from muscle metabolism, small & not bound to plasma proteins, maintains a fairly constant level, and predominantly filtered ~85% (~15% TS) with minimal non-renal elimination. • Proportional to muscle mass & body weight • Normal 24-hour excretion: 20-25 mg/kg IBW (males) and 15-20mg/kg (females) • Creatinine production decreases with age: 2mg/kg/24hrs per decade • Several equations have been published to predict GFR using creatinine clearance (Clcr) Estimation of GFR using Cockcroft-Gault Equation: (140-age)(ABW) ; (Female) Multiply by 0.85 (72)(Scr) ABW = actual body weight (Male) Clcr(ml/min) = Note: Use ABW unless obese (>125% ideal body weight), suggest use Salazar & Corcoran equation. Clcr (standardized to BSA, ml/min/1.73m2 ) = Clcr X • • • • • 1.73m2 BSA Most commonly used equation for estimating GFR in clinical practice Derived from multiregression analysis Relationship includes corrections of creatinine production for age, weight, and gender Several limitations (best for patients with average muscle mass and stable production of creatinine) Should be used with caution in patients with changing Scr (e.g., acute renal failure), low Scr (e.g., lack of mobility, patients with loss of muscle mass, spinal cord injury), and severe renal insufficiency. Equations for BSA, IBW and Clcr 17 Estimation of GFR in obese patients (>125% X IBW) using Salazar-Corcoran Equation: (Male) Clcr(ml/min) = [137-Age] x [(0.285 x Wt) + (12.1 x Ht 2 )] (51 x Scr) (Female) Clcr(ml/min) = [146-Age] x [(0.287 x Wt) + (9.74 x Ht 2 )] (60 x Scr) Wt = actual body weight in kg; Ht = height in meters Note: Ht should be converted to meters before squared (i.e. 6'0" = 72" = 183cm = 1.83m) Estimation of GFR by calculating Clcr from 24-hour urine collection: Clcr (ml/min) = creatinine production rate (mg/1440min) Scr (mg/100ml) 1 ⎛ 1dL ⎞ X Uvol X ⎛ ⎞ ⎟ ⎜ ⎟ ⎝ 100ml ⎠ ⎝ 1440min ⎠ ⎛ 1dL ⎞ Scr X ⎜ ⎟ ⎝ 100ml ⎠ Ucr X ⎜ = Ucr = urine creatinine concentratio n (mg/dL); Uvol = total urine volume (ml/24 hrs); Scr = serum creatinine (mg/dL) Modification of Diet in Renal Disease (MDRD) Equation (Ann Intern Med. 1999 Mar 16;130(6):461-70.) MDRD study equation: GFR (ml/min/1.73m2 ) = 170 X [Scr]-0.999 X [Age]-0.176 X [BUN]-0.170 X [Alb]0.318 X [0.762, if female] X [1.18, if patient is African-American] Abbreviated MDRD study equation (ml/min/1.73m2 ): GFR = 186 X [Scr]-1.154 X [Age]-0.203 X [0.742, if female] X [1.210, if patient is African-American] • Among adults, the MDRD Study equation provides a clinically useful estimate of GFR (up to ~ 90 mL/min/1.73 m2) • The MDRD Study equation derived based on: – GFR measured directly by urinary clearance of 125I-Iothalamate; – A large sample of >500 individuals with a wide range of kidney diseases; – Inclusion of both European-American and African-American participants; – Validated in a large (n > 500) separate group of individuals • This equation provides estimates of GFR standardized for BSA. Equations for BSA, IBW and Clcr 18 • The abbreviated version (J Am Soc Nephrol. 2000;11: A0828) requires only serum creatinine, age, sex, and race. • Basic metabolic panel at UKCMC uses the abbreviated equation to report GFR. • Per National Kidney Foundation recommendations: “Nonetheless, questions remain about the equation’s generalizability because it has not been validated in diabetic kidney disease, in patients with serious comorbid conditions, in normal persons, or in persons older than 70 years of age. Clinical conditions in which it may be necessary to measure GFR by using clearance methods include extremes of age and body size, severe malnutrition or obesity, diseases of skeletal muscle, paraplegia or quadriplegia, vegetarian diet, rapidly changing kidney function, and calculation of the dose of potentially toxic drugs that are excreted by the kidneys.” Many of these limitations also apply to the use of Cockcroft-Gault. • Please note there are not sufficient studies to date that use the MDRD equation for adjusting drug dosages for patients with renal insufficiency. This may change in the near future as more studies with the MDRD equation are published. Estimation of Clcr in Pediatrics: = 0.45 X Ht (cm) Scr Clcr (children 1 to 10 years of age, mL/min/1.73m2 ) = 0.55 X Ht (cm) Scr Clcr (infants up to 1 year of age, mL/min/1.73m2 ) References: Schwartz GJ et al. J Pediatr. 1984;104:849-54 and Pediatrics. 1976;58:259-63. Aminoglycosides – Conventional Dosing 19 AMINOGLYCOSIDES - CONVENTIONAL DOSING 1. Time of Sampling ($132) a. Relative to Dose 2. Cpk at 30 min after end of 30 min infusion (IV); 1 hr after injection (IM) Ctr within 30 min prior to dose at ss (4 to 5 estimated half-lives; normal renal function: t½ = 2-3 hrs) usually around 3rd maintenance dose (or later) preferably during day Recommended Frequency of Sampling a. b. Routine Use In "Uncomplicated" Patients initial Cpk and Ctr repeat Cpk and Ctr, at new steady state, if initial values differ > 25% from predicted (i.e. suggestive of unusual kinetic parameters or deviation from sampling guidelines) Scr and BUN at least 2x/week; monitor other signs of renal function repeat Cpk and Ctr q 1-2 wks, when duration of therapy > 2 wks Use in “Complicated” patients (e.g., diminished or changing hydration status and/or renal function, concurrent ototoxic or nephrotoxic drugs) initial Cpk and Ctr at steady state Scr and BUN daily repeat Cpk and Ctr weekly (or more frequently as dictated by clinical condition). Aminoglycosides – Conventional Dosing 3. 20 Therapeutic Range (Conventional Dosing)* Patients with normal renal function: Conventional dosing for gentamicin and tobramycin ~1-2 mg/kg-DBW/dose q8hrs and amikacin ~5mg/kg-DBW/dose q8hrs. NOTE: Elderly patients often require a q12hr or longer dosing interval. - Primarily used as double coverage or synergy with β-lactams for aerobic gram-negative infections (e.g. Pseudomonas, Enterobacter, Proteus, E. coli, Serratia) - Can be used for synergy with some gram-positive infections (e.g. Enterococcus, Staphylococcus) Concentration Cpk (mg/L) Ctr (mg/L) gentamicin, tobramycin 5 -10 0.5 - 2 amikacin 25 - 35 4 - 10 *Desired Cpk and Ctr concentrations for conventional aminoglycoside dosing should be determined clinically by site and severity of infection, causative organism and its MIC, immunocompetence of patient, intent of therapy, etc. See table below for general recommendations for desired Cpk based on type of infection. *Final decision for desired concentrations should be based on clinical outcomes in addition to a pharmacokinetic assessment. Types of infections* Abdominal infections Bacteremia Empiric therapy in cystic fibrosis Endocarditis, Bacterial (prevention & treatment) gram positive (synergy: 1mg/kg/q8hrs) gram negative Eye infections Meningitis Neutropenic patients Peritonitis Pneumonia Skin and soft tissue infections Urinary tract infections Suggested Target Peak Concentrations (mg/L) (gentamicin or tobramycin) 6-8 6-8 8-12 3-5 8-10 6-8 8-10 6-10 6-8 8-10 6-8 4-6 Aminoglycosides – Conventional Dosing 21 4. General Guidelines for Monitoring a. Initial Dosing 1. Select desired Cpk and Ctr based on site and severity of infection, causative organism and MIC, immunocompetence of patient, intent of therapy. 2. Estimate Clcr; standardize Clcr to 1.73 m2 if BSA known: Clcr (std) = Clcr × 1.73m 2 actual BSA For obese patients use DBW = [IBW + 0.4 (TBW-IBW)] in the Cockcroft-Gault equation to estimate Clcr and standardize to 1.73m2 to estimate aminoglycoside K. (Leader WG, Tsubaki T, Chandler MHH. Am J Hosp Pharm 1994; 51:2125-30) 3. Estimate K: K = 0.00293 ∗ Clcr(std) + 0.014 4. Estimate t½: t½ = 0.693 K 5. Estimate Vd*: Vd = 0.25 L/Kg, average Vd = 0.20 L/Kg, if dehydrated Vd = 0.30 L/Kg, with CHF, volume overload, ICU patients *Use ABW unless patient is obese (>125% IBW or TBW/IBW > 1.25) If obese use dosing body weight: DBW = IBW + 0.4 (TBW-IBW) 6. Calculate dosing interval (τ) : τ= ln(Cpk /Ctr ) K t = infusion time (e.g., 0.5hr) +t+T T = time between end of infusion & Cpk (e.g., 0.5hr) 7. Calculate maintenance dose (Ko) using target Cpk: ss -Kτ t = infusion time (e.g., 0.5hr) Ko = Cpk ⋅ Vd ⋅ K ⋅ (1-e ) (1 − e-Kt ) ⋅ e-KT T = time between end of infusion & Cpk (e.g., 0.5hr) **NOTE that Ko = mg/HOUR and the dose must be adjusted to account for 0.5hr infusion. (e.g. If Ko = 200mg/HR, then the dose = 100mg/30min for ½ hr infusion) Aminoglycosides – Conventional Dosing 22 8. Round dose to nearest 10mg or available stock bag dose (e.g., 80,100,120mg) then recalculate the actual Cpk: desired Cpk X actual (rounded) dose = actual Cpk calculated dose ss −KT ' 9. Estimate trough: C ss tr = C pk ⋅ e T’ = time between Cpk and Ctr 10. If necessary, calculate loading dose (Ko*): K *o = Ko (1-e -Kτ ) or = Cpk ⋅ V ⋅ K (1 − e -Kt ) ss or = V ⋅ Cpk Weight-based method: 1.5 to 2 mg/kg (use DBW if obese) b. Dosage Adjustment Using Sawchuk-Zaske Method: Assumptions: Concentrations represent steady-state conditions; 1-compartment model; principle of superposition; linear elimination. 1. Verify administration and sampling times. 2. Calculate K: ln ( K = ss C pk C T' ss tr ) T’ is determined by subtracting the time difference between Cpk and Ctr from the Tau. For example, if the time difference between Cpk and Ctr was 1.5hrs and the Tau = q8hrs, then T’ = (8 - 1.5) = 6.5hrs. 3. Calculate t½: t½ = 0.693 K 4. IF peak concentration is drawn late, calculate if drawn at correct time: Cpk ss Cpk = e-Kt' ss where Cpk = peak concentration drawn at appropriate time; ss Cpk = peak concentration drawn late; t' = time between late Cpk and Cpk Aminoglycosides – Conventional Dosing 23 5. IF trough concentration is drawn early (e.g., >30min prior to dose), calculate if drawn at correct time: -Kt' Css tr = C tr ∗ e where Css tr = trough concentration drawn at appropriate time (e.g., suggest use dose administration time) Ctr = trough concentration drawn early; t' = time between early Ctr and Css tr 6. Calculate Vd: If doses have reached steady state (e.g., previous doses on time, concentrations drawn appropriately), use: Vd = K o (1 − e −Kt ) e-KT ss Cpk ⋅ K (1 − e −Kτ ) t = infusion time (e.g., 0.5hr) ss (e.g., 0.5hr) T = time between end of infusion & Cpk If doses have NOT reached steady state AND there are at least 3 concentrations after a multiple dose (e.g., trough, peak, & random) or 2 concentrations after the 1st dose (e.g., peak and random or 2 random concentrations) use: Vd = K o (1-e-Kt ) K (Cmax - Ctr e-Kt' ) pk Cmax = peak extrapolated to END of infusion pk t = time of infusion t' = time between Ctr and Cmax pk To use above equation, calculate peak at end of infusion: Cpk Cmax = -KT pk e max T = time between Cpk and Cpk 7. IF measured Ctr is high, calculate time required to achieve desired Ctr: Ctr ⎞ ln ⎛⎜ 1 Ctr2 ⎟⎠ ⎝ t' = K Ctr1 = high Ctr; Ctr2 = desired Ctr t' = time required from Ctr1 to Ctr2 8. Calculate new dosing interval (τ): τ= ln(Cpk /Ctr ) K +t+T t = infusion time (e.g., 0.5hr) T = time between end of infusion & Cpk (e.g., 0.5hr) Aminoglycosides – Conventional Dosing 24 9. Calculate new dosing rate: Ko = ss Cpk Vd K(1-e-Kτ ) (1-e-Kt ) e-KT t = infusion time (e.g., 0.5hr) T = time between end of infusion & Cpk (e.g., 0.5hr) **NOTE that Ko = mg/HOUR and the dose must be adjusted to account for ½ HOUR infusion. (e.g. If Ko = 200mg/HR, then the dose = 100mg/30min for ½ hr infusion) 10. Round dose to nearest 10mg or available stock bag dose (80,100,120mg) then recalculate the actual Cpk: desired Cpk X actual (rounded) dose = actual Cpk calculated dose 11. Estimate trough to be obtained with above Ko and τ: ss -KT' Css tr = Cpk e 12. Document the pharmacokinetic assessment in the medical records. Document pertinent clinical monitoring parameters, dose recommendations and estimated and/or calculated pharmacokinetic parameters in the medical record. (Also refer to Department of Pharmacy Guidelines for Writing Notes in Patient Charts, PH-02-04) - - - - Briefly describe the rationale of the drug and determine if warranted based on clinical and patient information. Document the current day of therapy and goal length of therapy (e.g., Day #2/10 gentamicin), and any concomitant antibiotics. Document the collect times of the reported concentrations and note if the samples were obtained appropriately. For example, if actual Cpk was drawn late, also document the estimated Cpk if drawn correctly. Include the calculate PK parameters: K (hr-1), t½ (hrs), Vd (L) and Vd (L/kg – DBW). Write a new dosage in mg and mg/kg-DBW/dose (e.g., gentamicin 100 mg IV q8hrs, 1.5mg/kg/dose). When changing a dosage, include the start time of new dosing regimen with the order (very helpful for the pharmacist entering the order and the nurse administering the drug). Include a range for the predicted concentrations with the new dosage recommendation: (e.g., Cpk = 8-10mg/L; Ctr <2mg/L, ~1mg/L). Include other pertinent information used to assess the patient: weight (ABW, IBW, DBW), height, BSA, Scr, Clcr, BUN, urine output, I/Os, cultures, Tmax, WBC, differential, allergies, and other nephrotoxic medications (e.g., furosemide, amphotericin, vancomycin). Sample note provided on next page. Aminoglycosides – Conventional Dosing 25 Sample Note PHYSICAL/HISTORY/ PROGRESS NOTES Date Patient Name: Medical Record: Date of Birth: Clinical Pharmacokinetics Service RE: Tobramycin Day #2/14 9/2/2001 12:00 Patient is 50yo WM being treated with tobramycin 120mg IV q8hrs (1.45 mg/kg/dose) and Zosyn 3.375gm IV q6hrs for nosocomial pneumonia based on positive sputum cultures for Pseudomonas aeruginosa. Current Tmax 102.5, WBC = 15K. ABW = 90kg Ht = 6’0” IBW = 77.6kg DBW = 82.6kg BSA = 2.13m2 Tobramycin concs drawn around 3rd dose on 9/2: Trough = 2.2 mg/L C: 07:30 Dose = 120 mg IV infused from 08:00 – 08:30 Peak = 7 mg/L C: 09:00 Scr = 1.2 (today) Clcr = 86ml/min Clcr (std) = 70ml/min/1.73m2 Assessment of concs: Previous doses administered on time & represent steadystate; Ctr & Cpk drawn appropriately; Cpk is below recommended range for pneumonia (810mg/L) & Ctr above therapeutic range (<2mg/L). Renal function stable. PK parameters: K = 0.18hr-1; t½ = 3.9 hrs; Vd = 19.6L (0.24 L/kg) Recommendations: 1. Suggest changing tobramycin to 160mg IV q12hrs (1.9 mg/kg/dose) to yield a Cpk ~8-10 mg/L & Ctr ~ 1mg/L; begin next dose at 20:00 today when conc. = 1mg/L; discussed with resident on primary team. 2. Not necessary to recheck Cpk & Ctr unless change in clinical status or renal function; if continue therapy > 7 days, would suggest recheck concentrations to assess for drug accumulation. 3. Suggest checking Scr/BUN at least 2X/week to assess renal function. George Davis, Pharm.D. #330-4215 Aminoglycosides – Conventional Dosing 26 Pediatric Guidelines (gentamicin, tobramycin): Neonatal dosing guidelines (gentamicin, tobramycin) Assume Vd (0.5 - 0.6 L/kg) Gestational age Dosage < 34 weeks 4 mg/kg q24hrs Comments 9 9 9 9 ≥ 34 weeks <2 months postconceptional age 4 mg/kg q24hrs 9 9 9 Don’t confuse “once daily” dosing with every 24-hour dosing interval in neonates. Neonates require a longer dosing interval (decreased clearance) and larger mg/kg dose (increased volume). Concentrations may not be warranted in all neonatal patients. If extended therapy is indicated (e.g., positive blood culture), concentrations (peak and trough) should be obtained with the 3rd dose. If urine output decreases < 1ml/kg/hr for at least 8 hours, concentrations are warranted. Goal concentrations usually: peak = 5-8mg/L; trough < 2mg/L. Dose may be infused over 20 minutes (always check administration technique as possible source of error). Infant and children dosing guidelines (gentamicin, tobramycin) Assume Vd (0.3 - 0.35 L/kg) Age Dosage Infants: ≥2 months <10 years 7.5 mg/kg/day IV divided q8hrs or 2.5mg/kg/dose IV q8hrs Children: ≥10 –14 years 5 – 7.5 mg/kg/day IV divided q8hrs or 1.67-2.5 mg/kg/dose IV q8hrs Children: >14 years - adult 1-2 mg/kg/dose IV q8hrs Pediatric cystic fibrosis (CF) patients dosing guidelines (gentamicin, tobramycin) Vd = 0.4 – 0.45 L/kg Dosage Comments 9 10 mg/kg/day IV divided q8hrs 9 (Initial dosing or minor disease) 9 or 9 9 14 mg/kg/day IV divided q12hrs 9 (Moderate to severe disease) 9 Larger Vd (0.4-0.45 L/kg) due to decreased body fat and increased Cl due to increased GFR. Pedaitric CF patients are excluded from the once-daily aminoglycoside dosing but some patients may be receiving a “high dose regimen” twice a day. For CF patients, levels are usually obtained on the 3rd day rather than the 3rd dose to allow for rehydration. Concentrations should be obtained at 4 and 10 hours post dose if dosed q12h (12 hours may not be measurable). Peak and trough levels appropriate for q8h dosing. Usually require higher doses to achieve desired concentrations (Cpk 8-14 mg/L; Ctr < 1mg/L). Must be very cautious of nephrotoxicity and ototoxicity because of long term and recurrent use. Repeat concentrations are usually not obtained unless significant changes in dose are warranted (e.g., >30%), available concentrations are not reliable, or therapy is continued beyond 14 days. Aminoglycosides – Conventional Dosing 6. 27 Guidelines for Dosing in End Stage Renal Disease (ESRD) - Defined as GFR < 15 ml/min or on renal replacement therapy (RRT) Gentamicin and Tobramycin Dosing/Monitoring – Conventional IHD Monitor based on duration of therapy 1. Serum concentrations not necessary in patients on therapy <3-5 days 2. Serum concentrations recommended in patients with culture positive infection or expected duration of therapy > 5 days. Guidelines for Monitoring 1. Initial dosing a. Assume Vd – 0.3-0.35 L/kg b. Synergy dosing i. Loading dose 1.5-2 mg/kg (DBW) ii. Maintenance dose 1mg/kg (DBW) after each hemodialysis c. Moderate to severe infections (aggressive management) i. Loading dose 2-2.5 mg/kg (DBW) Effect of hemodialysis 1. Removes approximately 50% (4 hour session) 2. Levels taken post dialysis are true troughs; levels taken prior to dialysis can be used during the 50% removal assumption. Concentrations 1. Single drug level approach (synergy dosing) a. Most commonly utilized approach b. Pre-dialysis (random) concentration c. Extrapolate post-dialysis concentration (trough) by assuming 50% drug removal during a 4 hour dialysis session d. Target of trough < 2 mg/L to conserve remaining kidney function and minimize risk for ototoxicity. 2. Multiple drug level approach (aggressive management) a. Peak concentration drawn 2 hours after dose b. Pre-dialysis (random) concentration Maintenance dosing (multiple drug levels) 1. Calculate Keoff IHD a. Keoff IHD = (Ln Cp1/Cp2)/t Cp1 = Peak concentration; Cp2 = Pre-dialysis (random) t = time between Cp1 and Cp2 2. Calculate half-life off IHD a. t1/2 = 0.693/keoff IHD b. Extrapolate actual peak concentration c. Extrapolate post-dialysis concentration (trough) by assuming 50% drug removal during dialysis 3. Determine Vd 4. Calculate maintenance dose using desired peak concentration (Cpk) a. Ko = (Cpk(des) – Ctr) x Vd b. Typical dosing 1-1.8 mg/kg after each dialysis session Aminoglycosides – Conventional Dosing Dialysis factors that may lead to lower percentage of drug removed 1. Dialysis duration <2 hours 2. Blood flow reduced to <200 mL/min 3. Ultrafiltration only (no hemodialysis) 4. Less permeable dialyzers (filters) used 5. Patient is volume overloaded Aminoglycoside Dosing/Monitoring – CRRT Dosing recommendations for critically ill adults receiving CVVHD/CVVHDF* Infection with Gm Infection with gram-negative bacteria positive bacteria Aminoglycoside Synergy dosage Loading dose Maintenance dosage Gentamicin 1 mg/kg q24-36h 3 mg/kg 2 mg/kg q24-48h Tobramycin Not applicable 3 mg/kg 2 mg/kg q24-48h Amikacin Not applicable 10 mg/kg 7.5 mg /kg q24-48h Note: Use calculated dosing body weight. Target peak and trough levels vary depending on type of infection. *Trotman RL et al. CID 2005;41:1159-66. Guidelines for Monitoring 1. Typical dosing interval during CRRT is q24-48h 2. Synergy dosing yields target peaks of 3-4 mg/L 3. Higher target peaks require longer dosing intervals Levels 1. Two random serum concentrations will be obtained 4 and 12 hours after completion of the 1st dose. 2. Determine appropriate maintenance dose based upon calculated PK parameters (ensure CRRT uninterrupted between concentrations) Factors that may lead to changes in amount of drug removed 1. Changes in ultrafiltration rate 2. Dialysis interrupted (i.e. filter clotted, particularly overnight) 3. Alterations in existing renal function (ARF vs CRF) References 1. Dager WE, King JH. Aminoglycosides in intermittent hemodialysis: pharmacokinetics with individual dosing. Ann Pharmacother 2006;40:9-14. 2. Trotman RL, Williamson JC, Shoemaker M, Salzer WL. Antibiotic dosing in critically ill adult patients receiving continuous renal replacement therapy. CID 2005;41:1159-66. 28 Aminoglycosides – Conventional Dosing 29 Suggested References for Influences of Pathophysiological States on Aminoglycoside Kinetics: Ascites: Sampliner (1984) J Clin Pharmacol 24:43. Burn Patients: Zaske (1976) J Trauma 16:824. Zaske (1978) Surgery 84:603. Loirat P (1978) N Engl J Med. 26;299(17):915-9 Zaske (1991) J Burn Care Rehabil. 12(1):46-50 Hollingsed TC (1993) J Trauma 35(3):394-8 Weinbren MJ. (1999) J Antimicrob Chemother 44(3):319-27 Critically Ill Patients: Dasta (1986) Critical Care Med 14:393. Hassan (1986) Critical Care Med 14:394. Bressolle F (1996) Antimicrob Ag Chemother 40(7):1682-9 Watling SM (1993) Ann Pharmacother. 27(3):351-7. Mann HJ (1998) Pharmacotherapy. 18(2):371-8. Barletta JF (2000) J Trauma Nov;49(5):869-72 Cystic Fibrosis: Kearns (1982) J Pediatr 100:312. Kelly (1982) J Pediatr 100:318. Vic (1996) Eur J Pediatr 155:948-953. Campbell D (1999) Ther Drug Monit. 21(3):281-8. Elderly: Bauer (1981) Antimicrob Ag Chemother 20:587 Zaske (1982) JAMA 248:3112 Matzke (1987) J Clin Pharmacol 27:216 Morike K (1997) Drugs Aging. 10(4):259-77. Triggs E (1999) Clin Pharmacokinet. 37(4):331-41. Obesity: Blouin (1979) Clin Pharmacol Ther 26:508. Bauer (1980) Am J Hosp Pharm 37:519. Traynor (1995) Antimicrob Ag Chemother 39(2):545 Pediatrics: Watterberg (1989) Ther Drug Mon 11(1):16-20 Butler (1994) Clin Pharmacokinet 26(5):374-395. Ettinger (1996) J Antimicrob Chemother 38:499-505. Semchuk (1995) Biol Neonate 67:13-20 Murphy (1998) AJHP 55:2280-88. Thureen (1999) Pediatrics 103:594-598 Langlass (1999) AJHP 56:440-43. Aminoglycosides – High-dose, Extended Interval Dosing 30 HIGH-DOSE, EXTENDED INTERVAL DOSING (HDEI) There are several studies suggesting that larger doses of aminoglycosides with extended intervals (e.g., q24hrs) are just as effective, and less toxic, than conventional dosing given three times a day. HDEI regimens take advantage of concentration-dependent killing through the optimization of peak concentration / MIC ratios. In addition, there are potential cost savings for nursing, pharmacy, and laboratory personnel. The HDEI policy has been used on the Trauma Surgery Service at the University of Kentucky Chandler Medical Center since 1993. This is also referred to as ONCE DAILY DOSING OF AMINOGLYCOSIDES. Inclusion Criteria: All patients ordered aminoglycosides for prophylaxis, empiric therapy, or documented infection. (Aminoglycosides are usually indicated as synergistic or adjunctive therapy with other antibiotics as double coverage for gram-negative infections). Exclusion criteria: 1. Patients with ascites 2. Patients with burns on >20% of total body surface area 3. Pregnant patients 4. Patients on dialysis 5. Patients with gram positive bacterial endocarditis 6. Pediatric patients Initial Dose: Doses should be based on DOSING BODY WEIGHT, ideal body weight plus 40% of estimated adipose tissue mass (see Dosing Guidelines). Patients with estimated Clcr ≥ 40 mL/min/1.73m2 will receive initial gentamicin/tobramycin dose of 7 mg/kg-DBW, infused over 30 minutes. Amikacin dosage is 15-20mg/kg/day-DBW. Exceptions include: • Orthopedic Surgery services which commonly use gentamicin/tobramycin 5mg/kg-DBW for prophylaxis/pre-emptive therapy with open fracture • Obstetrics which use gentamicin/tobramycin 5mg/kg -post-partum dosing body weight (see page 36 for OB guidelines) • Cystic fibrosis patients (Guidelines on page 26 for pediatric CF dosing and page 35 for adult CF dosing) Patients with estimated creatinine clearances < 40 mL/min/1.73m will receive an initial gentamicin dose of 3 mg/kg, infused over 30 minutes. Aminoglycosides – High-dose, Extended Interval Dosing 31 INITIAL DOSING GUIDELINES FOR ADULTS: 1. Estimate Creatinine Clearance (Clcr) using Actual Body Weight (ABW) for non-obese patients; in obese patients (>125% IBW) use Dosing Body Weight (see below for equation). Males Clcr = (140-Age ) ×ABW Females 72×Scr Clcr =Clcr *0.85 2. Estimate Body Surface Area (BSA) using the Mosteller equation: BSA (m2 ) Ht(cm) x Wt(kg) 60 = 3. Calculate Standardized Creatinine Clearance: Clcr(Std) = Clcr * 1.73m2 BSA 4. Determine Ideal Body Weight (IBW). IBW (kg) = 50 (kg) + (2.3 (kg) x ea. inch over 5 ft) male = 45 (kg) + (2.3 (kg) x ea. inch over 5 ft) female 5. Calculate Dosing Body Weight (DBW): DBW = IBW + 0.4 (ABW-IBW) 6. (If ABW<IBW, then DBW = ABW) Calculate the patient’s dose (gentamicin & tobramycin) based on Dosing Body Weight. a) If Clcr(std) ≥ 40 ml/min/1.73m2, then give 7 mg/kg-DBW. b) If Clcr(std) < 40 ml/min/1.73m2, then give 3 mg/kg-DBW. Amikacin: Doses used for single daily administration of amikacin range from 15 to 20 mg/kg/day (Marik et al, 1991; Maller et al, 1993 - 20mg/kg/dose: Cpk ~40mg/L and Ctr24hr <4mg/L). 7. Dilute dose in 100 ml of either 5% Dextrose or Normal Saline and infuse over 30 minutes. 8. Order two concentrations at 4 and 12 hours after the end of 1st dose. Aminoglycosides – High-dose, Extended Interval Dosing 32 Monitoring: Two concentrations (ordered as “random” concentrations) will be obtained: 1) 1st concentration will be drawn ~4 hours* after completion of the 1st dose. NOTE: The random concentration at 4 hours post-infusion may range from 4-13 mg/L depending on renal function and volume status. Patients with normal renal function (>100 ml/min) usually average a 4-hour random ~5-8 mg/L (see mean concentration-time curve on page 41). The rationale for obtaining a “4-hour” sample versus a “peak” is to determine the serum concentration after the distribution phase. A prolonged distribution phase has been described in trauma patients (Jennings HR, et al. Pharmacotherapy. 2000;20(10):1265) and healthy volunteers (McNamara DR, et al. J Clin Pharmacol 2001 Apr;41(4):374-7) who received 7 mg/kg. Postdistribution concentrations provide a more accurate calculation of elimination rate and the estimation of the 24-hour concentration. 2) 2nd concentration will be drawn ~12 hours after completion of the 1st dose. NOTE: The concentration at 12 hours post-infusion will vary depending on renal function. The 12-hour concentration may be <1 mg/L in patients with normal renal function. Patients with normal renal function should have a prolonged “drug-free” period. ODA therapy should usually NOT be used as the single antibiotic agent and patients should not receive a dose of 7mg/kg more frequently than once every 24 hours until more studies are available. Some patients may warrant conventional dosing to maintain concentrations. Please consult the Clinical Pharmacokinetic Service (257-8403) or ID service regarding any concerns about ODA therapy or patient eligibility. Subsequent Doses: The goal of the initial concentrations after the 1st dose is to verify that the drug is eliminated appropriately before the 2nd dose and to establish the dosing interval. Subsequent doses will be the same as the initial dose, but the dosing intervals will be adjusted to achieve troughs < 1 mg/L. Appropriate dosing intervals include every 24, 36, or 48 hours. Scr/BUN should be measured at baseline and 2X/week thereafter. • • • • Patients with normal renal function will usually have a “drug-free” period with an undetectable trough concentration < 0.3 mg/L. For patients with trough concentration > 0.3 mg/L, renal function should be monitored closely and risks of nephrotoxicity and ototoxicity evaluated carefully. If the serum concentration following a 7mg/kg dose requires > 48 hours to decline to <1mg/L, then 3mg/kg or conventional dosing may be warranted. Patients should not receive a single dose of 7mg/kg more frequently than every 24 hours until more studies are available. Follow-up monitoring: If ODA therapy is continued for > 7days, a trough concentration should be obtained weekly to check for drug accumulation and assess risk of nephrotoxicity. Scr/BUN should also be monitored at least 2X/week to assess any changes in renal function and risk of nephrotoxicity. Concomitant nephrotoxic drugs should be avoided if possible. Ototoxicity should be monitored closely. Ototoxicity results from damage to the vestibular and cochlear portions of the eighth cranial nerve. Auditory symptoms include tinnitus, roaring, ringing, or “buzzing” in the ears, and varying degrees of hearing impairment. Loss of high-frequency perception is only detectable by audiometric testing and usually occurs before clinical hearing loss. Vestibular symptoms include nausea, vomiting, dizziness, vertigo, nystagmus, oscillopsia, and ataxia. A feeling of fullness in the ears and tinnitus are early signs of ototoxicity. Symptoms are exacerbated in the dark. Hearing loss may be irreversible, but patients usually retain normal conversational hearing. Other ototoxic drugs (e.g., lasix) should be avoided if possible. Aminoglycosides – High-dose, Extended Interval Dosing 33 CALCULATE PARAMETERS: 1) Calculate K: C1 ⎞ ln ⎛⎜ random C2random ⎟⎠ ⎝ K= T' 2) Calculate Cpk at 0.5hr after 1st dose (30-min infusion): 0.5hr Cpk = 3) C1random e-KT' 0.5hr T' = time between C1random and Cpk Calculate Ctr at 24 hours: 0.5hr C24hr = Cpk ∗ e-K∗23 tr 4) C1random = 1st random ~4hrs after dose C2random = 2nd random ~12 hrs after dose T’ = time between C1random and C2random If 24hr Ctr ≤ 1 mg/L continue q24hr dosing If 24hr Ctr > 1 mg/L extend dosing interval (peak extrapolated to the END of infusion) Calculate V using Cmax pk max pk C = 0.5hr Cpk 0.5hr t = 0.5hr (time between Cmax and Cpk ) pk e-Kt K o (1 − e−Kt ) V= K(Cmax pk ) t = infusion time If assistance is required in selecting patients or determining the proper dose or dosage interval, contact the pharmacist rounding with the service, the Clinical Pharmacokinetics Service (257-3378, UK beeper #1740), the Pharm.D. Resident on call (UK beeper #1875), or the Infectious Disease Service. Aminoglycosides – High-dose, Extended Interval Dosing 34 35 Gentamicin 7mg/kg-DBW Mean±StdDev Serum Concentrations Concentration (mg/L) 30 Trauma Patients (n=13) University of Kentucky Chandler Medical Center 25 20 15 10 5 0 0 1 2 3 4 5 6 7 8 9 10 11 12 13 Time Post 30-minute Infusion (hrs) Jennings HR, Coyle EA, Kearney PA, Davis GA. . Characterization of once-daily aminoglycoside (ODA) Pharmacotherapy. pharmacokinetics (PKS) in the critically ill: Suggestions for clinical monitoring. 2000;20(10): 1265. SUGGESTED REFERENCES: J Infect Dis 1987; 155:93-9 J Infect Dis 1990; 162:414-20 Antimicrob Agents Chemother 1995; 3:650-5 Ann Pharmacother 1994; 28:757-66 Pharmacotherapy 1995; 15:297-316 Pharmacotherapy 1995; 15:201-9 Ther Drug Monit 1996; 18:263-6 Ann Intern Med 1996; 124:717-25 J Antimicrob Chemother 1997; 39:677-686 J Burn Care Rehab 1997; 18:116-24. Ann Pharmacother 1998; 32:417-21. J Clin Pharmacol 2001;41(4):374-377. ODA in Pediatrics: J Pediatr 1997;131:76-80. J Antimicrob Chemo 1997; 39:431-33. (cystic fibrosis patients) J Antimicrob Chemother. 1998 Jul;42(1):103-6. (cystic fibrosis patients) J Pediatr Surg. 1998 Jul;33(7):1104-7. Pediatrics. 1999 Jun;103(6 Pt 1):1228-34. Ther Drug Monit. 2001 Oct;23(5):506-13. Pediatr Infect Dis J. 2001 Dec;20(12):1169-73. Aminoglycosides – High-dose, Extended Interval Dosing 35 ODA Dosing for Adult Cystic Fibrosis Patients: Inclusion criteria: 9 Adult patients 18-35 years of age 9 Estimated Clcr > 60ml/min 9 Must obtain baseline SCr in patients at increased risk of renal insufficiency o History of renal dysfunction o Diabetes mellitus Dosing and monitoring recommendations (Tobramycin): 9 12 mg/kg (DBW) IV q24 hours 9 Obtain 4 and 10 hour concentrations following infusion of third dose o Goal Ctr < 0.5 mg/L o If 12 hour concentration is <1 mg/L, consider increasing dose to 15 mg/kg/day or shorten dosing interval (i.e. 7-8 mg/kg IV q12h). o If estimated (calculated) trough level prior to next dose (Ctr) is >0.5 mg/L, calculate new dose to achieve Ctr <0.5mg/L 9 Repeat trough concentrations indicated if significant changes in dose occur or if therapy is to continue an additional 7 days o Draw trough concentration once weekly, goal Ctr ≤0.5mg/L o If patient on other nephrotoxic medications (e.g., vancomycin), more frequent monitored may be warranted o Assess renal function at least 2x weekly while patient on therapy SUGGESTED REFERENCES: 1. Smyth A, Tan, KH, Knox A et al. Once versus three-times daily regimens of tobramycin treatment for pulmonary exacerbations of cystic fibrosis – TOPIC study. Lancet 2005; 573-78 2. Aminimanizani A, Beringer PM, Shapiro BJ et al. Distribution and elimination of tobramycin administered in single or multiple daily doses in adult patients with cystic fibrosis. J Antimicrob Chemother 2002; 50:553-9. 3. Beringer PM, Vinks AA, Shapiro BJ et al. Pharmacokinetics in adults with cystic fibrosis: Implications for once-daily administration. Antimicrob Agents Chemother 2000; 44(4):809-13. 4. Bates RD, Nahata MC, Barson WJ et al. Pharmacokinetics and safety of tobramycin after once-daily administration in patients with cystic fibrosis. Chest 1997; 112:1208-13. Aminoglycosides – High-dose, Extended Interval Dosing 36 ODA Dosing for Postpartum Endometritis Indications: • Postpartum endometritis • Postpartum treatment of chorioamnionitis - Prior to delivery, use conventional gentamicin dosing (e.g., 1-2 mg/kg/dose IV q8hrs); start once daily dosing 8 hours after conventional dose Inclusion criteria: • Current postpartum weight • Age ≥ 18 years old • Normal renal function (serum creatinine < 1.4mg/dL) - Must obtain baseline serum creatinine in patients with increased risk for renal insufficiency prior to receiving once daily gentamicin including: − History of renal dysfunction − Diabetes mellitus − Preeclampsia − Toxemia Dosing Recommendation: 1. Assess if patient is obese using height and postpartum weight - Refer to table on next page to determine obesity 2. If NOT obese, use ACTUAL postpartum body weight (PPABW): GENTAMICIN DOSAGE = 5mg/kg X PPABW IV q24hrs 3. If obese, use postpartum DOSING body weight (PPDBW): PPDBW = PPIBW + 0.4 (PPABW - PPIBW) GENTAMICIN DOSAGE = 5mg/kg X PPDBW IV q24hrs Follow-up Monitoring: SERUM GENTAMICIN CONCENTRATIONS are NOT warranted unless the patient meets at least one of the following criteria: a. Increased risk for renal insufficiency (risk factors listed above) b. Duration of gentamicin therapy is continued for > 3 days c. Patient is not responding to antibiotic therapy • • If serum gentamicin concentrations are warranted (refer to list above): TWO GENTAMICIN CONCENTRATIONS should be obtained 4 AND 12 hours after the dose (order as “4 and 12 random gentamicin concentrations”) − A pharmacist on the Clinical Pharmacokinetics Service (#1740) will assess the concentrations and calculate the gentamicin trough (goal: <1mg/L) and recommend a new dosage if necessary. − A pharmacy resident on-call (#330-3883) is also available after 5pm and weekends if necessary. Additional monitoring: If duration of aminoglycoside therapy continues > 3 days, suggest checking a serum creatinine • If duration of aminoglycoside therapy continues > 7 days, suggest checking follow-up gentamicin TROUGH CONCENTRATION to assess for potential accumulation • Aminoglycosides – High-dose, Extended Interval Dosing 1. PPIBW = postpartum ideal body weight: PPIBW (kg) = 54* + (2.3 X every inch in height over 5 feet). NOTE: PPIBW calculated by adding 9kg (20lbs) to normal ideal body weight. Patient is considered obese if PPABW is >125% X PPIBW. Height PPIBW (kg) PPABW considered to be obese 2 (kg) 4'10" 4'11" 5'0" 5'1" 5'2" 5'3" 5'4" 5'5" 5'6" 5'7" 5'8" 5'9" 5'10" 5'11" 6'0" 6'1" 6'2" 6'3" 6'4" 6'5" 49 52 54 56 59 61 63 66 68 70 72 75 77 79 82 84 86 89 91 93 62 65 68 70 73 76 79 82 85 88 91 93 96 99 102 105 108 111 114 116 6'6" 95 119 37 Aminoglycosides – High-dose, Extended Interval Dosing 38 Other methods used for ODA dosing (NOTE: This information is provided for comparison only, please refer to UKCMC approved protocol): Hartford Hospital Nomogram (Nicolau et al Antimicrob Agents Chemother 1995;39.) • Dose = 7mg/kg IV q24hrs for Clcr > 60ml/min (also refer to table below) • Interval based on nomogram using SINGLE random concentration between 6-14 hours – Computer simulated dosing nomogram • Designed to achieve Cpk ~20 mg/L • Tested with PK parameters of patients on conventional dosing regimens • Confirmed in patients (n=20) receiving 7 mg/kg • Assumes one-compartment model • Assumes 60 min distribution phase • May not be accurate for doses less than 7mg/kg (e.g., 5mg/kg) Comparison of different methods: Nomogram Hartford Hospital* Barnes-Jewish Hospital* University of Rochester* UKCMC Gentamicin Dose (mg/kg) 7 5 Dosing Interval (hrs) Clcr ≥ 60 ml/min Clcr 40-59 ml/min Clcr 20-39 ml/min 24 24 36 36 48 48 5 24 36 48 7 24 24 Use 3mg/kg IV q24hrs *Source: Pharmacotherapy. 2002 Sep;22(9):1077-83. Aminoglycosides – High-dose, Extended Interval Dosing 39 Sanford Guide 2004 – Recommended Gentamicin/Tobramycin Dosing Regimen Clcr (ml/min) ≥ 80 60-79 40-59 30-39 20-29 10-19 <10 Dose (mg/kg) 5.1 (7 if critically ill) 4.0 3.5 2.5 4.0 3.0 2.0 Interval (hrs) 24 24 24 24 48 48 48 AUC Method (Br J Clin Pharmacol. 1995 Jun;39(6):605-9.): Clcr (ml/min) >66 54-66 42-53 30-41 21-29 <21 • • • • Starting Dose (mg/kg) 5, 6, or 7 5 or 6 5 4 3 Seek specialist advice Target AUC 72, 86, 101 86, 101 101 101 101 Time of Second Sample 6-14 hr 8-16 hr 10-18 hr 12-20 hr 14-22 hr Administer dose over 30 minutes Take blood sample 30 minutes after end of infusion (Cpk) Take second blood sample within time frame indicated in table Calculate the patient’s aminoglycoside AUC using: AUC (0-24hrs) = 1.065 ( Cend of infusion - C24 K ) • AUCtarget Dose 2 = X Dose 1 Calculate 2 dose: AUCobserved • • Administer 2nd dose 24hrs after the first dose Monitor as above every 48hrs or according to the patient’s clinical condition nd Carbamazepine 40 CARBAMAZEPINE 1. Time of Sampling ($114) a. Relative to Dose 2. 3. trough within 1 hour prior to dose at ss Recommended Frequency of Sampling a. Initially after reaching steady-state (2 to 10 days of chronic dosing); "true" steady-state may not be reached for several weeks, due to autoinduction, which results in increasing clearance. Induction begins within 3 to 4 days of therapy and is maximal after 3 to 4 weeks. b. After each dosage adjustment at ss. Therapeutic Range 4 – 12 µg/ml (8-12 µg/ml reported by UKCMC TDM Lab) 1.4 – 3.5 µg/ml (saliva) Note: Carbamazepine used as single anticonvulsant therapy may require higher serum concentrations than when used in a multiple anticonvulsant regimen. 4. General Guidelines for Monitoring a. Initial Dosing Empiric b. - epilepsy - trigeminal neuralgia 200 mg PO BID 100 mg PO BID Maintenance Dose Increase dose by 100-200 mg/day every week Based on initial level and response to therapy, dosage may have to be gradually increased during the first few weeks, due to autoinduction. Final maintenance dose is usually: - epilepsy 10-20 mg/kg/day - trigeminal neuralgia 3-20 mg/kg/day Best to give in divided doses, usually q 12o (or q 8o), rather than in a single daily dose. Dosing best at mealtime. Maximum dose - usually 1200 mg/day Carbamazepine c. Dosage Adjustment The c equation may be used once "true" steady-state is achieved. S × F × Xo c= S = 1; F = 0.7-1.0 (Tegretol) Cls × τ d. Available products at UK Hospital Tegretol® 200mg tablets, 100mg chew tabs, 100mg/5ml suspension 5. Pediatric Guidelines 6. Other Monitoring Guidelines 7. Baseline CBC CBC every month (x 2), then every 6 months after stabilized Drug Interactions 8. Should not be used in infants < 1 yo (although package insert states < 6 yo) Initial dose - 10 mg/kg/day Maintenance dose - 20-60 mg/kg/day (gradually increase from initial dose) Also see #9 - Miscellaneous CBZ induces its own metabolism (P450 3A4) during prolonged treatment, and is complete 3 to 5 weeks with a fixed dosing regimen (Prod Info Tegretol(R), 1998). Active metabolite: carbamazepine-10,11-epoxide Since CBZ is an enzyme inducer of many P450 enzymes (3A4, 2D6, 2C), it may enhance the elimination of other drugs (e.g. ethosuximide, warfarin, and benzodiazepines that undergo hydroxylation). Enzyme inhibitors may increase CBZ levels (e.g. cimetidine, erythromycin, isoniazid, propoxyphene, and verapamil) Phenytoin - CBZ interaction is variable. Phenytoin levels may increase, decrease, or stay the same. CBZ levels usually decrease. Adult Pharmacokinetic Parameters Vd Cl t½ = = = = = 1.4 ± 0.4 L/kg 1.3 ± 0.5 ml/min/kg (multiple dosing) 0.4 ± 0.1 ml/min/kg (single dose) 15 ± 5 hours (multiple dosing) 36 ± 5 hours (single dose) 41 Carbamazepine 9. 10. Miscellaneous Absorption is variable, depending on factors such as presence of food and product formulation (recommend not using generics - only Tegretol®). Patients with severe renal failure (Clcr < 10 ml/min) should receive only 75% of the usual daily maintenance dose. Protein binding is approximately 70% (binds to both albumin and α-1 AGP). Suggested References General: Bertilson (1978) Clin Pharmacokin 3:128. Drug Interactions: Phenytoin Zielinski (1985) Ther Drug Monit 7:51. Zielinski (1987) Ther Drug Monit 9:21. Verapamil Macphee (1986) Lancet 1:700. 42 Digoxin 43 DIGOXIN 1. Time of Sampling ($70) a. Relative to Dose 2. Recommended Frequency of Sampling a. Routine Use in "Uncomplicated" Patients b. 3. Drug concs should be drawn during the post-absorptive, postdistributive phase of drug elimination, ie, during the 6 to 24 hour interval following the previous dose Prefer trough within 1h prior to dose At ss (usually 5-7 days; if normal renal/hepatic fx: t½ = 36 ± 8hrs, adults) Initial level at ss Use in Unstable Patients Initial level at ss Repeat level every 5 to 7 days, or as dictated by a change in concurrent disease state/drug therapy, lack of adequate response to a previously adequate dose, or occurrence of adverse effects attributable to digoxin. Therapeutic Range** UK: 0.8-2.0 ng/ml (conversion note: 1ng/ml = 1µg/L) CHF: 0.5-1.0 ng/ml Pharmacotherapy.1999 Oct; 19(10): 1123-6. Arrhythmias: may require higher concs for atrial fibrillation ** Establishment of a true therapeutic range is complicated by effects of electrolyte imbalances and of assay interference by digoxin-like immunoreactive substances (DLIS) and digoxin metabolites. (see 4b. Dosing Adjustments) Digoxin 4. 44 General Guidelines for Monitoring a. Loading Dose Rapid digitalization can typically be achieved utilizing loading doses of 8-12 mcg/kg LBW (normal renal function). Use LBW, since digoxin does not distribute appreciably into body fat. C×V X* = o S×F S =1 F = 0.7 (tablet) = 0.8 - 0.85 (elixir; capsule) V = 7.3 L/Kg in normal renal function** ** For patients with compromised renal function: 298 ∗ Clcr (stdz to 1.73m2 ) 226 + 29.1 + Clcr (stdz to 1.73m2 ) V(L/1.73m2 ) = e.g. std Clcr = Clcr ∗ V(L/70 Kg) = 1.73m2 actual BSA 269 + 3.12 ∗ Clcr (stdz to 70 Kg) e.g. std Clcr = Clcr ∗ 70 Kg actual LBW (Kg) The loading dose should be given in divided doses so that the patient can be evaluated for toxicity and efficacy prior to receiving total load. (e.g. usually give 1/2 of the calculated load initially, followed by 1/4 in 6h and the remaining 1/4 in 6h after the second dose, making sure to monitor the patient after each dose). b. Maintenance Dose: Xo (mcg) = c ⋅ Cls ⋅ τ F⋅S (Helpful hint: use mcg/L for c, 24hrs for τ , and L/hr for Cl) **For patients without HF: Cls = 1.303 (Clcr, std to 1.73 m2) + 40 ml/min/1.73 m2 (ml/min/1.73m2) **Patients with uncompensated HF (e.g. pitting edema, hepatic congestion): Cls = 1.303 (Clcr, std to 1.73m2) + 20 ml/min/1.73m2 (ml/min/1.73m2) ** To calculate estimated Cls for specific patient, need to unstandardize, i.e., multiply Cls calculated above by “actual BSA/1.73m2” Digoxin c. Dosing Adjustments Calculate actual Cls, based on administered). Cls = c (level, usually obtained at τ), F, and Xo (dose S ⋅ F ⋅ Xo c ⋅τ Calculate new maintenance dose. Xo = c ⋅ Cls ⋅ τ F⋅S One should check if the therapeutic response to digoxin correlates well with the level(s) obtained, prior to making dosage adjustment(s). The failure of digoxin levels to correlate with therapeutic/toxic response is often due to aberrations in serum and tissue concentrations of sodium, potassium, magnesium, and calcium. Patients with low potassium, magnesium, or sodium levels or high calcium levels may be more sensitive to digoxin) or due to presence of DLIS in certain subpopulations (e.g. renal failure patients, combined renal and hepatic failure patients, pregnant women, neonates, infants). d. Chart note Monitoring parameters should include heart rate, ECG, serum electrolytes (K, Mg, Na, Ca), Scr, Clcr, interacting medications and monitoring for signs and symptoms of toxicity. PK parameters should include digoxin Cls in ml/min. 5. 45 Factors Influencing Digoxin Pharmacokinetics/Pharmacodynamics Renal dysfunction, obesity, CHF (see 4a.) Hypothyroidism: ↓ digoxin Cls Hyperthyroidism: ↑ digoxin Cls Hypokalemia, hypomagnesemia, hypercalcemia: ↑ digoxin cardiac effects Drug interactions: Drugs associated with ↓ digoxin absorption include: antacids, cholestyramine, colestipol, kaolin-pectin, metoclopramide, neomycin, sulfasalazine; ↑absorption include: propantheline. Quinidine - ↓ digoxin Cls; multiply digoxin Cls by 0.5 Verapamil - ↓ digoxin Cls; multiply digoxin Cls by 0.7 Spironolactone - ↓ digoxin Cls; multiply digoxin Cls by 0.5 Amiodarone - ↓ digoxin Cls; multiply digoxin Cls by 0.7 Digoxin 6. 46 Pediatric Guidelines Dosage Recommendations for Digoxin1, 2 AGE Preterm neonate Full-term neonate 1 mo - 2 yrs 2 - 5 yrs 5 - 10 yrs >10 yrs Total Digitalizing Dose* (mcg/kg) Oral Intravenous 20-30 15-25 Daily Maintenance Dose# (mcg/kg) Oral Intravenous 5-7.5 4-6 25-35 20-30 6-10 5-8 35-60 30-40 20-35 10-15 30-50 25-35 15-30 8-12 10-15 7.5-10 5-10 2.5-5 7.5-12 6-9 4-8 2-3 Average Dosage Recommendations for Adults (mg) Adults 0.75-1.5mg 0.5-1mg 0.125-0.5mg 0.1-0.4mg 1. Bendayan R, McKenzie MW. Digoxin Pharmacokinetics and dosage requirements in pediatric patients. Clin Pharm 1983;2(3):224-35. 2. Park MK. Use of digoxin in infants and children with specific emphasis on dosage. J Pediatr 1986; (6): 871-7. * Administer ½ of the total digitalizing dose in the initial dose, then ¼ of the total dose in each of two subsequent doses at 6-12 hour intervals. The doses are divided to allow sufficient time for distribution and maximum effect to assess for therapeutic response and potential toxicity after each dose. # Divided every 12 hours in infants and children < 10 years of age. Administered once daily for children > 10 years of age and adults. e. Other Considerations Vd: 6-20 L/kg • • • (caution: wide patient variability may be secondary to design problems in initial studies) DLIS (digoxin-like immunoreactive substance): very common in newborn infants. Serum concentrations may not be warranted in every patient. Digoxin therapy should first be evaluated based on response and toxicity versus measuring drug concentrations. Digoxin 7. Dosage forms on UK formulary Digoxin tablets 0.125mg, 0.125mg Digoxin injection 500 mcg AMP/2ML; 250mcg TUBEX Digoxin elixir 50 mcg/ml 60ml BTL; 250mcg 5ml TUB; 125mcg 2.5ml TUB Digoxin injection (PEDIATRIC STRENGTH): 100 mcg/ml (1ml AMP); Also 10mcg/ml *DILUTED* 8. Suggested References for Factors Influencing Digoxin Disposition Applied Pharmacokinetics (2006), 4th ed., p. 410-439. Renal dysfunction: Jusko (1974) J Clin Pharmacol 14:525-535. Obesity: Ewy (1971) Circulation 44:810-814. CHF: Koup (1975) Clin Pharmacol Ther 18:9-21. Thyroid diseases: Ochs (1982) Clin Pharmacokinet 7:434-451. Drug interactions: Waldorff Klein Pedersen Bigger Pedersen Nademanee (1978) Clin Pharmacol Ther 24:162-167. (1980) New Engl J Med 303:160. (1981) Clin Pharmacol Ther 30:311-316. (1981) Int J Cardiol 1:109-116. (1983) Eur J Clin Pharmacol 24:41-47. (1984) J Am Coll Cardiol 4:111-116. 47 Digoxin ® 48 ® Digoxin Immune Fab (DIGIBIND , DIGIFAB ) 1. Indications a. Manifestations of severe toxicity: ventricular arrhythmias, progressive bradyarrhythmias, 2nd or 3rd degree heart block not responsive to atropine, refractory hypotension. b. Potassium concentration >5 mEq/L in patients with manifestations of severe cardiac glycoside toxicity c. Significant risk of cardiac arrest: ingestion of >10 mg in an adult, >4 mg in a child, level >10 ng/mL post-distribution (generally 6-8 hours postingestion), progressive increase in potassium level postingestion. d. Unresponsiveness to immediately available conventional therapy. e. Digoxin serum levels of >10 ng/mL by 6 hours after the overdose, even in asymptomatic patients, is considered an indication for digoxin immune FAB by some authors (Bailey et al, 1997). 2. Recommended dosing for adults NOTE: (Pharmacy acquisition cost ~$500/vial) a. Acute ingestion of known amount: Each vial of Digoxin Immune Fab will bind approximately 0.5mg of digoxin (or digitoxin). Thus, one can calculate the total number of vials required by dividing the total digitalis body load by 0.5mg/vial: Dose (in # of vials)= Total digitalis body load in mg 0.5 mg of digitalis bound/vial b. Based on steady-state digoxin concentrations Adult dose estimate of Digoxin Immune Fab (in # of vials) is represented in the table below or can be estimated using the following equation: Dose (in # of vials)= Patient Weight (kg) 40 60 70 80 100 V = vials (Serum digoxin concentration in ng/ml)(weight in kg) 100 Serum Digoxin Concentration @ Steady State (ng/ml) 1 2 4 8 12 16 20 0.5V 1V 2V 3V 5V 7V 8V 0.5V 1V 3V 5V 7V 10V 12V 1V 2V 3V 6V 9V 11V 14V 1V 2V 3V 7V 10V 13V 16V 1V 2V 4V 8V 12V 16V 20V Digoxin 3. 49 Total Serum Digoxin Levels After Digoxin Immune Fab Administration: Purpose: Total serum digoxin levels obtained immediately after administration are unreliable. The Fab fragments bind to free digoxin, causing tissue-bound digoxin to be released from receptors and subsequently bind to the Digoxin Immune Fab. Digoxin levels drawn within 72 hours (for patients with normal renal function) or 7 days (in patients with renal failure) of administration will be falsely elevated. Policy regarding total serum digoxin levels: a. The pharmacist will alert TDM lab when Digoxin Immune Fab is ordered for any patient in the hospital. b. TDM lab will not measure total serum digoxin levels for a period of at least 72 hours following administration for patients with normal renal function. c. TDM lab will not measure total serum digoxin levels for a period of at least 7 days following administration for patients with severely impaired renal function. d. If a digoxin level is ordered within the above times, TDM lab will notify the Pharm.D. managing that service for assessment. References 1. Allen NM., Dunham GD. Treatment of digitalis intoxication with emphasis on the clinical use of digoxin immune Fab. DICP The Annals of Pharmacotherapy; 24: 991-998, 1990. 2. Antman EM., Wenger TL Butler VP., Haber E, Smith TW. Treatment of 150 cases of life threatening digitalis intoxication with digoxin specific Fab antibody fragments. Circulation; 81: 6: 1744-1752, 1990. 3. Schaumann W., Neubert P., Smolarz A., Kinetics of the Fab fragments of digoxin antibodies and of bound digoxin in patients with severe digoxin intoxication. European Journal of Clinical Pharmacology; 30: 527-533, 1986. 4. Ujhelyi MR., Colucci RD., Cummings DM., Green PJ., Robert S, Vlasses PH, Zarowitz BJ., Monitoring serum digoxin immune Fab therapy. DICP, The Annals of Pharmacotherapy; 25: 1047-1049, 1991. Lidocaine 50 LIDOCAINE 1. Time of Sampling ($39) a. Relative to Dose 2. Recommended Frequency of Sampling 3. 2h after load or 6-12h after initiation of therapy without load (ie @ ss) Send out lab, may take 2-3 days for results to be reported when toxicity is suspected when ventricular arrhythmias occur (or recur) despite lidocaine administration patients with suspected cardiac or hepatic insufficiency may require intensive serum concentration monitoring Therapeutic Range 1.5 - 6.0 mcg/ml 4. General Guidelines for Monitoring a. Initial Dosing* Load MULTIPLE-BOLUS REGIMEN: Initial 75-100 mg (1 mg/kg) bolus, followed by 50 mg in 5-10 min. One to two additional 50 mg bolus doses may be given in 5-10 min intervals thereafter if necessary. or RAPID-INFUSION METHOD: Initial 75-100 mg bolus (over 2 min) and loading infusion of 150-200 mg (over 20 to 25 min). Lidocaine 51 Maintenance Dose: 1-4 mg/min (15-50 μg/min/kg, recommended for patient of lighter bodyweight) Mean Systemic Clearance and Recommended Infusion Rates for Selected Patient Populations Population Systemic clearance (ml/min/kg) Infusion rate (μg/kg/min) to achieve 3 μg/ml Infusion rate (mg/min/70kg) Mean ± SD Mean (Range) Mean (Range) Normal 15.6±4.6 47 (33-61) 3.3 (2.3-4.3) Congestive heart failure 5.5±1.7 17 (11-22) 1.2 (0.8-1.5) Acute myocardial infarction** 9.1±2.0 27 (21-33) 1.9 (1.5-2.3) Congestive heart failure plus acute myocardial infarction 6.3±1.4 19 (15-23) 1.3 (1.1-1.6) Chronic liver disease 6.0±3.2 18 (8-27) 1.3 (0.6-1.9) Renal disease 13.2±3.2 40 (30-49) 2.8 (2.1-3.4) Propranolol co-administration 9.4±3.1 28 (19-38) 2.0 (1.3-2.7) Applied Pharmacokinetics (1986), 2nd ed., p. 662. * For obese patients, it has been suggested that loading doses be based on TBW and maintenance infusions be based on IBW. [Abernathy (1984) Am J Cardiol 53: 1183)]. ** α-1 acid glycoprotein (AAG) concs are elevated in AMI patients. Plasma protein binding of lidocaine is also conc-dependent. Consequently, free concentrations may be more useful for monitoring therapy. Dosing Adjustments: 5. c= Ko Cl Other Factors Which Influence Lidocaine Disposition (See Table above) Cimetidine co-administration: Empirically ↓ usual infusion rate by 25%. Feely (1982) Ann Intern Med 96:592. Elderly patients: Empirically ↓ usual infusion rate by 20-30%. Abernethy (1984) J Cardiovas Pharmacol 5:1093. Lithium 52 LITHIUM 1. Time of Sampling ($29) a. 2. Relative to Dose At least 12 hours after the previous evening's dose (obtain concentration at same time of day). At steady state ~ 5 days; t½ ~24hrs with normal renal function. Recommended Frequency of Sampling a. Routine Use in Stable Patients b. 3. 4. Initial level (at steady-state) Use in Unstable Patients Initial level (at estimated steady-state) Subsequent levels are appropriate with changes in renal function, to assess compliance, addition of concurrent medications that may affect lithium disposition or to assess toxicity. Therapeutic Range 0.6 to 1.2 mmol/L (Flame Photometry at UKMC) (1 mmol/L Lithium equals 1 mEq/L; 300 mg lithium carbonate = 8.12 mEq Li) Concentrations from 1.2 to 2.0 mmol/L may be warranted in patients with acute mania. Greater than 2.0 mmol/L are considered toxic. General Guideline for Monitoring a. Initial Dosing Use population parameters with C-bar equation using Cls ≈ 0.25 * ClCr [L/hr] Vd ≈ 0.8 L/kg; t½ ≈ 18 - 24 hours Lithium b. 53 Empiric Dosing Usually 600 to 1200 mg/day in 3 to 4 divided doses for immediate release dosage forms (once or twice a day for sustained release formulations). Initial dose for acute mania: 900-1800 mg/day Single Point Methods Cooper Nomogram 600mg test dose of lithium carbonate One lithium serum concentration 24 hours later Converts observed lithium concentration to dosage required to achieve a steady-state concentration of 0.6 – 1.2 mmol/L Lithium serum concentration must be zero before test dose administration LITHIUM SERUM CONCENTRATION 24 HOURS AFTER TEST (mmol/L) < 0.05 0.05 – 0.09 0.10 – 0.14 0.15 – 0.19 0.20 – 0.23 0.24 – 0.30 > 0.30 LITHIUM CARBONATE DOSAGE REQUIREMENT 1200mg TID (3600mg/d) 900mg TID (2700mg/d) 600mg TID (1800mg/d) 300mg QID (1200mg/d) 300mg TID (900mg/d) 300mg BID (600mg/d) 300mg QD (300mg/d) Perry Nomogram 1200mg test dose of lithium carbonate One lithium serum concentration 24 hours later Converts observed lithium concentration to maintenance dosage for desired steady-state concentration If using in acutely manic patient, anticipate a decrease in lithium maintenance dose once patient starts sleeping due to decrease in lithium clearance Lithium 54 Multiple-Point Method Perry Method • 600 – 1500mg test dose • Two lithium serum concentrations 12 and 36 hours after the test dose • Calculate elimination rate, half-life, accumulation factor, and so on • Lithium serum concentration must be zero prior to test dose administration c. Dosing Adjustments using steady-state concentration: S ⋅ F ⋅ Xo F= ~1.0; S = 1.0 Calculate Lithium Clearance: Cls = C ⋅ τ ss Recalculate Lithium dosing regimen: 5. * Xo = Css ∗ Cls ∗ τ S ∗F Factors affecting Lithium concentration Decrease Variable or no effect Acetazolamide Aminophylline Caffeine Osmotic diuretics Pregnancy* Sodium supplements Amelioride Aspirin Furosemide Sulindac Increase ACE Inhibitors Ibuprofen Indomethacin Chronic lithium therapy Phenylbutazone Thiazides Dehydration Renal Impairment Sodium Loss Increasing age Lithium clearance and serum concentrations return to pre-pregnant values after delivery. Lithium 55 Patient Monitoring MONITORING PARAMETERS Cardiac ECG Pulse and Blood Pressure Hematologic CBC with differential Metabolic/Endocrine Weight Serum electrolytes (Na, K, Ca, Phos) T3, T4, free thyroxine index, TSH Renal function Scr Urinalysis/osmolatity/specific gravity Pregnancy Test In women of childbearing age Plasma lithium concentrations BASELINE 12 MONTHS * * * * * * * * TSH is a better indicator of hypothyroidism and should be obtained every 3-6 months during maintenance therapy if thyroid function tests change, if TSH >4mIU/mL, or if symptoms of hypothyroidism occur. * * * * Measure Scr in patients with impaired renal function; 24-hour Clcr indicated at baseline with hx of renal disease or abnormally high Scr or significant increases in Scr * Products on UK Formulary Lithium carbonate SR TAB 450MG Lithium carbonate CAP 300MG Lithium carbonate SR TAB 300MG Lithium carbonate 300MG TAB Lithium citrate LIQ 8MEQ/5ML 500ML 7. References • • Patients older than 50 or those with preexisting cardiovascular disease; measure at baseline and every 6-12 months as indicated * * 6. • COMMENTS Measure every 1-3 months during maintenance therapy; every 5-7 days after any dosage change or possible drug interactions; less frequent monitoring in stable patients (every 6-12 months) Applied Pharmacokinetics: Principles of Therapeutic Drug Monitoring: © 1992 Third edition by Applied Therapeutics, Inc. Winter ME. Basic Clinical Pharmacokinetics. 1994 Third edition by Applied Therapeutics, Inc. Ward ME, Musa MN, Bailey Ll J Clin Pharmacol. 1994 Apr;34(4):280-5. Review. Methotrexate 56 METHOTREXATE Rationale for kinetic monitoring ($76) • Clinically relevant concentration-toxicity response • Administration of an antidote – MTX is unique in that the administration of reduced folate compounds (leucovorin) will bypass the biochemical blockade and reverse the cellular damage Absorption • Incomplete & erratic absorption from GI tract – Highly variable absorption 2 • n = 12 pediatric ALL F = 13-76%, DR=13-120mg/m ) – Dose-dependent absorption (Michaelis-Menten pharmacokinetics) • ↑DOSE = ↓F – Generally at lower doses (≤ 25mg/m2) F ~100% but still variable • Tmax = 1-5hrs, Cmax = 0.25-1.25μM – Rate/extent of absorption affected by: • Food, oral nonabsorbable antibiotics, shortened intestinal time • IM injection – Less variable, possible alternative if oral route problem Distribution • Very polar, requires active transport mechanisms to enter mammalian cells. • Drug displays a bi or tri-exponential elimination curve resulting in a 2 or 3 compartment model • Initial Vd ~ 0.2 L/kg • Apparent Vd ~ 0.7 L/kg (variable, incr. w/higher concs. due to saturation of active transport system) • Third spacing (e.g. by ascites or pleural effusion) creates a site of storage and “sustained release” of drug – Results in prolonged elevation of plasma concentrations and more severe toxicity and additional doses of antidote • 50% bound to plasma proteins (albumin) – Potential drug interactions: • Sulfonamides • Salicylate • Chloramphenicol • Phenytoin • CSF relatively impermeable, CSF concentrations 3% of plasma concentration; intrathecal administration is usually required Metabolism • Metabolism is minimal; 3 metabolic pathways – Intracellular polyglutamylation • Important pathway for selective retention of folates • Addition of up to 5 additional glutamate residues by the enzyme folyl polyglutamate synthetase (FPGS) • ACTIVE metabolite, contributes to cytotoxicity • Polyglutamylated MTX is potent DHFR inhibitor as MTX Methotrexate – Hydroxylation • 7-hydroxy metabolite (low H2O solubility) can accumulate leading to nephrotoxicity • 1/100th the affinity for DHFR (inactive) – Removal of glutamate residue (DAMPA) • Conversion performed by intestinal bacteria • Low levels in plasma may interact with MTX assay but NOT clinical significant Excretion • Excreted unchanged in the urine with minor biliary secretion • Bi or tri-exponentional elimination (see figure below) – α t½ ~ 3 hrs – β t½ ~ 10 hrs - not apparent until concentrations < 5X10⁻⁷ molar • Primarily renal eliminated – Combination of GFR & TS • At low concentrations correlates with GFR – MTX Cl(ml/min) ~ 1.6 X Clcr(ml/min) – Normal MTX Cl = 40-400ml/min • High concentrations saturation of TS which ↓ net renal Cl – RENAL FUNCTION MOST IMPORTANT DETERMINANT OF MTX PHARMACOKINETICS • Hydration status and urine pH – More acidic pH = decreased Cl • Drug interactions: – Reduce renal blood flow (e.g. NSAIDs) – Inhibit renal transport of MTX (e.g. sulfisoxazole, weak acids) – Nephrotoxic (e.g. cisplatin) M e th o tre x a te 3 6 -H o u r In fu s io n α t1 /2 = 3 ho u rs MTX Concentration 1 X 10 -5 M T X co ncen tratio n s r eq u ir in g in crea se d rescue factor d oses 1 X 10 -6 β t1 /2 = 1 0 h o u rs “R escue C o n centration ” 1X 10 -7 M T X in fu sio n 0 12 24 L eu cov orin rescue sched u le 36 48 60 72 84 T im e (H o u rs) Adapted from Winters ME. Basic Clinical Pharmacokinetics, 3rd Edition. 96 10 8 57 Methotrexate 58 MTX is usually administered in mg or gm doses • Low dose 15-20mg/m2 twice weekly up to high dose 1-12 g/m2 every 1-3 weeks • Plasma concentrations are reported in units of mg/L, μg/mL, and molar or micromolar units (usual range 10-8 to 10-6). MW = 454gm/mole • 1 micromolar would be equivalent to the following: • 1μM (micromolar) • 0.01 X 10⁻⁴ molar • 0.1 X 10⁻⁵molar • 1.0 X 10⁻⁶ molar • 10 X 10-7 molar • 0.454 mg/L Therapeutic/toxic plasma concentrations • • Normal therapeutic range – variable • NOTE: This is time after beginning of MTX infusion Toxic plasma range (increased risk) >10 X 10-6 molar (10 μM) at 24 hrs >1 X 10⁻⁶ molar (1μM) at 48 hrs >0.1 X 10⁻⁶ (0.1μM) or 1 X 10⁻⁷ at 72 hrs Toxicities • Cytotoxic effects due to inhibition of DHFR – Function of both concentration & duration of exposure • Pancytopenia (sometimes irreversible) • Severe mucositis • GI and skin desquamation • Renal and hepatic dysfunction Leucovorin rescue • To ensure that MTX toxicities do not occur, rescue factor (citrovorin factor or leucovorin) is administered every 4-6 hours in doses that range from 10 to 500 mg/m2. • Usual course is 12 to 72 hours until the plasma concentration of MTX falls below the critical value of 1 X 10⁻⁷ molar. • If MTX conc. > 1X10⁻⁶ molar at 48 hours, leucovorin rescue dose is usually increased to 50 to 100mg/m2 every 3-6 hours until concentration < 1 X 10⁻⁷ molar; also see alternative dosing below: MTX serum concentration ≥42 hr from beginning of infusion 20-50 μmol 10-20 μmol 5-10 μmol 1-5 μmol 0.6-1 μmol 0.1-0.5 μmol 0.05-0.1 μmol Approximate leucovorin dose required 500 mg/m2 IV q6hr 200 mg/m2 IV q6hr 100 mg/m2 IV q6hr 30 mg/m2 IV or PO q6hr 15 mg/m2 PO q6hr 15 mg/m2 PO q12hrs 5-10 mg/m2 PO q 12hrs Adapted from Crom WR, Evans WE. Methotrexate. In: Evans WE, et al., eds. Applied Pharmacokinetics: Principles of Therapeutic Drug Monitoring, 3rd ed. Pentobarbital 59 PENTOBARBITAL 1. Time of Sampling ($133) a. Relative to Dose 2-3h after load (not recommended) 12 and 24h after maintenance infusion begins (not recommended) 2. Recommended Frequency of Sampling Dose is based on pharmacologic response (intracranial pressure (ICP) control and electrical burst suppression on EEG), therefore concentrations are usually not warranted to assess efficacy or toxicity. Serum concentrations may be helpful in determining the persistence of a druginduced coma after the pentobarbital infusion has been discontinued. For example, a severe traumatic brain injury patient recently taken off of pentobarbital, but still not demonstrating any neurologic motor function. A serum concentration approximately 24-72 hours after discontinuation of the infusion should provide some idea as to if the persistent lack of neurologic function is due to the patient’s injury or due to continued neurologic suppression from pentobarbital. 3. Therapeutic Range* 20-40 mcg/ml (therapeutic coma) *Variable. Titration to individual patient response (based on neurologic and hemodynamic factors) is required. Therapeutic benefits at levels > 50 mg/ml are yet unproven. 4. General Guidelines for Monitoring Initial Dose Load High dose regimen (Eisenberg protocol): 25-30 mg/kg (infuse over 3h); may give as 10mg/kg initial load, followed by 3-4 5mg/kg miniloads Typical Cpk = 25-30 mcg/ml (may see hypotension, particularly with bolus) Low dose regimen: 5-10 mg/kg (infuse over 1-2h) Pentobarbital 60 Typical Cpk = 5-10 mcg/ml Maintenance infusion 1-3 mg/kg/h Dosage Adjustments Mini-boosts of 1-5 mg/kg may be given for breakthrough ICP increases. Typically 1-5mg/kg bolus will lead to an increase in the serum concentration by 1-5 mcg/ml. Titrate maintenance infusion rate according to clinical response (typically ICP control or cessation of seizure activity). The following conditions must be met prior to pharmacist involvement in pentobarbital monitoring: a. Patient must be on a ventilator. b. An ICP monitor must be in place with an initial pressure reading recorded (goal ICP typically < 20) c. A pulmonary artery catheter (or at minimum, a CVP line and arterial line) should be in place along with an initial hemodynamic profile recorded. Some patients may not require invasive hemodynamic monitoring. It is recommended to have a vasopressor such as norepinephrine or dopamine on-hand during loading in case of hypotension. 5. d. A urinary catheter must be in place. e. Monitoring of cerebral electrical activity via continuous EEG (or BIS monitor as temporary substitute) is recommended. Factors Altering Pentobarbital Disposition Renal failure and dialysis - no specific dosage adjustment appears necessary. Reidenberg (1976) Clin Pharmacol Ther. 20:67. Wermeling (1985) Ther Drug Monit. 7:485. No specific guidelines or recommendations are available for other patient subpopulations. Pentobarbital induces the metabolism of other oxidatively metabolized drugs (e.g., phenytoin, corticosteroids). Enzyme inhibitors (e.g. cimetidine) may decrease pentobarbital Cls. Prolonged pentobarbital Pentobarbital 61 infusions (typically > 6-7 days) may result in auto-induction & increased dose requirement. Patients with traumatic brain injury may have an elevated dose requirement due to disease-induced enzyme induction (therefore, typically the Eisenberg protocol is used). 6. Pediatric Considerations Same as adults 7. Other Suggested References Cormio (1999) J Neurotrauma 16:927. Boucher (1998) Clin Pharmacokinetics 35:209. Woster (1990) Clin Pharm 9:762. Eisenberg (1988) J Neurosurgery 69:15. Wermeling (1987) Drug Intell Clin Pharm 21:459. Heinemeyer (1986) Ther Drug Monit 8:145. Bayliff (1985) Clin Pharmacol Ther 38:457. Quandt (1984) Drug Intell Clin Pharm 18:105. Schaible (1982) Pediatrics 100:655. Phenobarbital 62 PHENOBARBITAL 1. Time of Sampling ($63; saliva = $47) a. 2. Relative to Dose trough within 1h prior to dose; any consistent time within dosing interval is acceptable due to long t½ ~ 5 days. at ss ~ 3 – 5 weeks Recommended Frequency of Sampling a. Routine Use in Stable Patients b. initial level Use in Unstable Patients* initial level repeat level, as dictated by changes in concurrent disease state/drug therapy or the lack of adequate response to previously adequate doses, or signs/symptoms of toxicity. Patients in status epilepticus require more intensive monitoring. Note: Since at least 15 to 20 days are required to achieve steady state, a loading dose is usually given to rapidly place the patient in the therapeutic range. Levels obtained prior to steady state may be useful in verifying if actual level is close to predicted level (e.g. if 20 mcg/ml is the predicted steady state value, it will take one t 1/2 to reach a level of 10 mcg/ml). 3. Therapeutic Range 10 – 40 µg/ml 5 – 15 µg/ml (saliva) 4. General Guidelines for Monitoring a. Initial Dosing Load: Xo* = C⋅V S ⋅F V = 0.7 L/Kg (adults) S = 0.9 (sodium salt) F = 1.0 or 20 mg/kg Infusion rate should not exceed 65 mg/min. Respiratory status should be closely monitored. Phenobarbital b. 63 Maintenance Dose: Usual adult dose: 1-3mg/kg/day in divided doses c ⋅ Cls ⋅ τ Xo = S ⋅F S F Cls = 0.9 (sodium salt) = 1.0 = 0.096 L/Kg/D (adults with normal hepatic function) It is common practice to give 25% of the total maintenance dose for one week, ↑ to 50% the second week, ↑ to 75% the third week, and ↑ to the full dose the fourth week to minimize toxicity. c (at ss) produced by any given maintenance dose is approximately 10 times the daily dose in mg/kg (e.g. 2 mg/kg - 20 mcg/ml). For patients with liver disease, empirically decrease maintenance dose of phenobarbital by 30%. c. Dosing Adjustments Cls = Xo = 5. S ⋅ F ⋅ Xo c ⋅τ c ⋅ Cls ⋅ τ S ⋅F c Calculate actual Cls, based on (level, usually obtained at trough), τ, S,F, and Xo (dose administered). Calculate new maintenance dose. Factors Influencing Phenobarbital Disposition Liver disease: See 4a. [Alvin (1975) J Pharmacol Exp Ther 192:224]. Pharmacokinetic interactions: PB induces metabolism of other oxidatively metabolized drugs (e.g. carbamazepine, phenytoin, warfarin, steroids, theophylline) but PB itself does not require dosage adjustment. Exceptions include: valproic Acid and chloramphenicol which inhibit PB metabolism and require an empiric PB dosage adjustment downward by 50%. Pregnancy: ↑ PB Cls 6. Pediatric Guidelines: Neonates LD: MD: 20-30 mg/kg; V = 0.9-1.1 L/Kg < 32 wks (postconceptional age) 1-2 mg/kg/D ≥ 32 wks (postconceptional age) 3-5 mg/kg/D Phenobarbital 64 Infants and Children LD: MD: 20-30 mg/kg; V = 1.0 L/Kg (V in older children approaches that of adults) 5-10 mg/kg/D (Start MD 12 hours after LD) • Infants 5-6 mg/kg/d in 1-2 divided doses • 1-5 years: 6-8 mg/kg/day in 1-2 divided doses • 5-12 years: 4-6 mg/kg/day in 1-2 divided doses • 12 years: 2-3 mg/kg/day in 1-2 divided doses Other Considerations Infusion rate should not exceed 2-3 mg/kg/min. Normal loading doses should be administered over 10 min. Respiratory depression is more commonly seen in patients who have recently received chloral hydrate or parenteral benzodiazepines prior to initiation of phenobarbital therapy. Tablet and elixir dosage forms are interchangeable. Dosage forms available: Elixir: Injection: Tablets: 4mg/ml, 30mg/7.5ml, 20mg/5ml, 15mg/3.75ml 10mg/ml 15mg, 30mg, 60mg, 100mg Phenytoin 65 PHENYTOIN 1. Time of Sampling ($53 for Ctotal; $69 for Cfree; $47 for saliva) a. Relative to Dose Trough within 1 hr prior to dose At steady state (The time to achieve steady state is variable, ranging from 3 to 50 days, due to saturation kinetics). − − 2. After oral administration of Kapseals: average half-life ~ 22 hrs (Prod Info Kapseals® Dilantin®, 2000) but can range from 7 to 42 hrs; value is variable due to the saturation kinetics After intravenous administration, half-life ranges from 10 to 15 hrs (Prod Info Phenytoin Sodium Injection, USP, 2000). Recommended Frequency of Sampling a. Routine Use in Stable Patients b. One steady-state concentration Repeat concentration at steady-state after each dosage adjustment Use in Unstable Patients After a loading dose, an initial level may be drawn to assess attainment of therapeutic concentrations. (Recommended to be drawn ~2 hours after IV LD and 6-8 h after oral LD). Trough in 3 to 4 days Weekly thereafter The frequency of sampling is also dictated by: 3. Changes in concurrent disease states or drug therapy Lack of adequate response to previously adequate doses Signs/symptoms of toxicity Patients with recurrent status epilepticus require more intensive monitoring. Therapeutic Range Total: 10-20 µg/mL (assuming normal albumin) Free: 1-2 µg/mL (normal; at body temperature) 0.8 – 1.6 µg/mL* (therapeutic range reported by UKCMC Clinical Lab) * The reported free concentration at UKCMC is adjusted since the assay is performed at room temperature which alters protein binding. Saliva: 1-2 µg/mL Phenytoin 4. 66 General Guidelines for Monitoring a. Loading Dose Use TBW unless patient is obese (>125% IBW). If obese: adjusted weight = IBW + (1.33)(TBW-IBW). NOTE: Phenytoin is lipophilic and has a larger Vd in obese patients. The above equation calculates a phenytoin dosing weight greater than ABW. Use the equation to calculate the dose, and then administer a dose that is comfortable based on experience and condition of the patient. Sometimes the calculated dose may need to be reduced initially (i.e. ½ the dose). Administer the dose, and then reassess the patient based on clinical response or serum concentrations for subsequent doses. Xo* = C⋅V S ⋅F V= S= F= OR Xo* 0.7 L/kg 0.92 (sodium salt; caps, inject) 1.0 (acid; chewtabs, suspension) 1.0 (oral - only if given in divided doses); variable with suspension = 14-16 mg/kg (Stable patients/seizure prevention) = 16-20 mg/kg (control of status epilepticus) May be administered as one dose, or in 3 divided doses given q 4 h (IV or PO); Suggested max single oral dose = 400mg due to erratic and delayed absorption. Avoid IM injections - painful; erratic absorption IV infusion rate is usually 10-25 mg/min, although some patients may tolerate up to 50 mg/min (MAXIMUM RECOMMENDED RATE). Blood pressure should be checked q 5 min x 3, then q 15 min until 1 hr after the end of the infusion. When administered by a floor nurse, the rate should not exceed 10 mg/min. Blood pressure should be checked q 15 - 20 min. Hypotension may occur due to propylene glycol (diluent). Phenytoin b. 67 Maintenance Dose 1. Initial Empirically based on body weight: 5-7 mg/kg/day For obese patients, the maintenance dose should be based on IBW. Alternative: Ludden Method and estimate both Km and Vm from Appendix 1. Dose = (Vm ) ⋅ (Css ) ⋅ (τ ) (K m + Css ) ⋅ (S) ⋅ (F) F = 1.0 S = 0.92 If hypoalbuminemia, use the ADJUSTED CONCENTRATION (see 6A) 2. Dosage Adjustment using Ludden Method [Ludden (1976). Lancet 1:307]. Assumptions: 1. Steady state 2. Patient compliance 3. Normal renal and hepatic function 4. Normal albumin a) On basis of a single concentration at steady state with the same dose: Css = measured concentration Dose ( Vm ) ⋅ (Css ) = (S) ⋅ (F) ⋅ Dose = present dose τ (K m + Css ) Usually assume Km (less variable) and rearrange the above equation to estimate Vm using the single steady-state concentration: Dose ) ⋅ (K m + Css ) (S) ⋅ (F) ⋅ ( τ Vm = (Css ) Then calculate a new dosage using the equation below by using the assumed Km, the calculated Vm and the desired concentration and Tau. Dose = ( Vm ) ⋅ (Css ) ⋅ (τ ) (K m + Css ) ⋅ (S) ⋅ (F) Recalculate Css after rounding dose: ⎛ Dose ⎞ (S)(F)(K m ) ⎜ τ ⎟⎠ ⎝ Css = ⎡⎛ Dose ⎞ ⎤ (Vmax ) - ⎢⎜ ⎟ (S)(F)⎥ ⎣⎝ τ ⎠ ⎦ Css = desired concentration Dose = new dose Phenytoin 68 b) On basis of two concentrations at steady state obtained at different daily doses. Vm (mg/D) - m = Km (mg/L) Dose per day (mg/D) Km = - rise run or Vm = Dose per day + (Km ∗ Dose per day ) Css b = y - mx Dose per day / Css (L/D) After calculating individual patient's Km and Vm as shown above, may calculate new dose. Dose = 3. ( Vm ) ⋅ (Css ) ⋅ (τ ) (K m + Css ) ⋅ (S) ⋅ (F) Css = Dose = desired level new dose Mini-loading Used when patient has sub-therapeutic concentration, to immediately put patient in the therapeutic range before starting new maintenance dose. Mini-loading dose = 4. (Vd ) (Css desired - Css measured) S ⋅F Toxic levels Used when concentration is too high, to determine how long (t) until patient achieves concentration in therapeutic range (C); Co = measured concentration. t (days) = [K m x (ln Co )] + (Co − C) C Vmax Vd (integrated form of Michaelis-Menten equation) Phenytoin 5. 69 Pediatric Guidelines Vd – 1-1.2 L/kg (neonates) 0.8-0.9 L/kg (term) 0.7 L/Kg (infants/children) Km = 3-9mg/L; Vm = 5-20mg/kg (infants/children) Loading dose: same loading dosing equation as adults Maintenance dose: 8-10 mg/kg/day (oral); 5-8 mg/kg/day (iv) • Maintenance dose should be administered in 2-3 divided doses (some pediatric patients may require q8hr dosing due to increased clearance; oncedaily dosing is usually not possible 12.5 mg/m2/min maximum 3-5 mg/kg/min (avg. 10-12 mg/min) Infusion rate: REMEMBER TO SHAKE THE PHENYTOIN SUSPENSION BOTTLE WELL TO PROVIDE CONSISTENT DOSE! Stagger dosing (at least one hour) with feedings - if on formula (decreases absorption - similar to enteral feeding products) Avoid phenytoin in neonates with indirect hyperbilirubinemia requiring phototherapy Phenytoin 6. 70 Other Factors That May Influence Phenytoin Disposition a) Hypoalbuminemia (normal albumin = 3.2 – 4.6 g/dL): ↓ ↑ ↓ Protein binding sites Free fraction (ff) Total concentration (will not be reflective of free concentration of 1-2 mcg/ml since free fraction is increased) The total phenytoin concentration* can be adjusted to account for the decrease in albumin using the following equation: Cpredicted = Cobserved Cpredicted = Ctotal adjusted for ↓ albumin (0.25 × alb) + 0.1 Cobserved = observed phenytoin concentration *Based on protein binding when determined at room temperature (25º C). Anderson GD, Pak C, Doane KW et al. Revised Winter-Tozer equation for normalized phenytoin concentrations in trauma and elderly patients with hypoalbuminemia. Ann Pharmacother. 1997 Mar;31(3):279-84. The free fraction can also be adjusted using the following equation: fub = 1 1 + (2.1 × alb) Winter MG, Tozer TN. Phenytoin. In: Evans WE, Schentag JJ, Jusko WJ, eds. Applied Pharmacokinetics. Principles of therapeutic drug monitoring. 2nd ed. Spokane: Applied Therapeutics Inc.;1986. b) Uremia - displacement from protein binding sites ↑ ↓ free fraction total concentration needed to achieve free phenytoin concentration of 1-2 mcg/ml ↑ Vd (Adjust Vd for low albumin): Vd (L/kg) = 6.5 1 + alb Winter and Tozer in Applied Pharmacokinetics. 2nd Ed. p. 501. Boobis (1977) Clin Pharmacol Ther. 22:147. Hooper (1974) Clin Pharmacol Ther. 15:276. Phenytoin c) 71 Obesity ↑ ↔ ↔ Vd (Use 0.7 L/kg) Free fraction unchanged Clearance unchanged Abernathy (1985) Arch Neurol. 42:468. d) Elderly ↓ ↑ ↓ Vm (about 21% less phenytoin per day is required to maintain Css of 15 mcg/ml) free fraction total concentration needed to achieve free phenytoin concentration of 1-2 mcg/ml Bauer (1982) Clin Pharmacol Ther. 31:301. e) Critically ill ↔ ↔ ↑ ↓ Vd unchanged Km and Vm unchanged free fraction may increase with time (even when albumin is unchanged) total and free conc. may decrease with time, warranting higher maintenance doses. Boucher (1987) Clin Pharm. 6:881. f) Drug interactions - several types (phenytoin substrate for CYP 2C9/2C19). Displacement from protein binding sites results in ↓ total conc. needed to achieve free conc. of 1-2 mcg/ml. ex. -valproic acid, phenylbutazone, aspirin and sulfa drugs. Enzyme Inducers - increase phenytoin Cl ex. -phenobarbital, carbamazepine and folic acid Enzyme Inhibitors - decrease phenytoin Cl ex. -cimetidine, chloramphenicol, valproic acid, disulfiram and isoniazid Phenytoin is also a potent enzyme inducer and increases Cl of many drugs including theophylline, oral anticoagulants and steroids. HOLD TUBE FEEDS 1 HR BEFORE AND 1 HR AFTER PHENYTOIN SUSPENSION DOSE PER FEEDING TUBE. ADJUST TUBE FEED RATE ACCORDINGLY. Phenytoin 7. Other Selected References 8. oral loading - Jung (1980) Clin Pharmacol Ther. 28:479. utility of Ludden method - Ludden (1976) Clin Pharmacol Ther. 21:287. Population Parameters Appendix I. APPENDIX 1 PHENYTOIN PHARMACOKINETICS AGE (years) Vmax (mg/kg/day) PARAMETERS Km (mg/L) Vd (L/kg) 7.5 6.6 6.0 5.7 5.4 5.8 0.7 0.7 0.7 14.0 10.9 10.1 8.3 6.6 6.8 6.5 5.7 1.6 Adult 20-39 40-59 60-79 Pediatric 0.5-3 4-6 7-9 10-16 Dosage forms available: Capsule 30mg, 100mg Chewtab 50mg Suspension 125mg/5ml (5mg/ml) Injection 100mg/2ml (50mg/ml) 0.6 72 Phenytoin 73 FOSPHENYTOIN Introduction - Water soluble prodrug intended for parenteral administration - Active metabolite is phenytoin - Dose should be expressed, labeled, and ordered in phenytoin equivalents (PE). 1.5mg fosphenytoin = 1mg phenytoin sodium but on vial FOSPHENYTOIN is written as PE/ml, not mg/ml. - Costs of Fosphenytoin and intravenous phenytoin are similar (2008: 1gm fosphenytoin = $9 versus 1gm IV phenytoin = $4) Potential advantages: 1. Less phlebitis & local tissue damage at injection site (fewer return visits, lower tx costs, & fewer lawsuits) 2. Less risk of hypotension with rapid IV loading 3. Less frequent need to restart IV lines due to local irritation 4. Elimination of need of filter in IV line 5. IM administration possible 6. Greater patient satisfaction due to less morbidity Absorption/Bioavailability - IV: max concentrations achieved after at the end of infusion but - IM: peak concs ~ 30min post dose Distribution - 95 – 99% protein bound, primarily albumin - increases with dose/rate, ranges from 4.3 to 10.8L Metabolism/Elimination - phenytoin cleaved from the prodrug by phosphatase enzymes - conversion t½ ~ 8-15 minutes - complete conversion IV ~ 2hrs; IM ~ 4hrs - NO drugs are known to interfere with the conversion Dosing Guidelines & Monitoring - Dosage similar to phenytoin BUT use PHENYTOIN EQUIVALENTS - Because of risk of hypotension, NOT recommended to exceed 150 PE/min - Need to wait at least 2 hours after IV dose and 4 hours after IM dose for complete conversion to measure serum concentrations Suggested patient criteria for administration of fosphenytoin*: 1. Age: <7yo or >60yo 2. History of underlying cardiovascular problems or preexisting hypotension) 3. Chronic or acute debilitating illness, emaciation, hyponatremia, peripheral vascular disease, hemodynamic instability, or sepsis 4. Poor intravenous access qualified by one of the following: size smaller than the antecubital fossa vein, catheter size < 20 gauge, no preexisting central venous catheter 5. Pain intolerance with phenytoin sodium recognized. *Guidelines for Fosphenytion Use (Meek PD, et al. Arch Intern Med. 1999; 159:2639-2644) Phenytoin, Free 74 FREE PHENYTOIN Policy: 1. Any medical (or surgical or other) service can order free phenytoin levels if patients meet criteria (See Appendix II). 2. Physicians on the Neurology service can request or interpret their own results, although the Clinical Pharmacokinetics Service will provide clinical interpretation if consulted. 3. For services other than Neurology, the following will apply: Once the TDM Lab receives a request for a free phenytoin level, TDM Lab will notify the pharmacist on that service or contact the Clinical Pharmacokinetics Service (for uncovered services). The pharmacist will monitor the criteria and provide essential clinical input regarding the need for the level. The pharmacist should make sure that a total concentration is ordered concomitantly with the free concentration to assess free fraction. The pharmacist will notify TDM Lab if the assay should be run or cancelled. If an order is to be cancelled, the pharmacist needs to notify the physician first and document (in the patient's chart) the recommendation to cancel the level. Once the TDM Lab runs the assay, the result will be reported in the computer. The pharmacist will write a note in the patient's chart and provide an interpretation and/or recommendation. A pharmacist will be available from 08:00 to 17:00 Monday-Friday to provide clinical interpretation. Any request received outside of this time frame will be reviewed prior to the TDM Lab cut-off time the next day. 4. The therapeutic range of free phenytoin concentrations will be reported as 0.8 to 1.6 mcg/ml.* 5. The patient charge for the free phenytoin assay is $89 per sample. * Derived from TDM Lab assay (performed at 25oC) data of 8% free fraction in patients with normal albumin [i.e. 8% of the usual total therapeutic range for total concentrations (10 to 20 mcg/ml) is 0.8 to 1.6 mcg/ml]. Phenytoin, Free 75 Appendix II. Free phenytoin concentrations should be reserved for the situations described below. For example, a "normal" patient with normal albumin and normal renal function who is not on concurrent medications that alter phenytoin protein binding or clearance would not warrant a free phenytoin concentration. A free phenytoin concentration is warranted when: 1. The total phenytoin dosage is >7 mg/kg/day and the total concentration is <10 mcg/ml. or 2. A patient is seizure-free at a total level of <10 mcg/ml and you need to determine whether a dosage increase is necessary. or 3. A patient is exhibiting signs of toxicity at a dosage of <7 mg/kg/day and has a total concentration of <20 mcg/ml. or f. A patient is in a unique subpopulation (e.g. a pregnant female, a patient on multiple anticonvulsant therapy, etc.) Phenytoin, Free 76 Modified Michaelis – Menten Equation for adjusting phenytoin dosage based on steady-state free concentration. free ss Css free ) to calculate free fraction (fub) = ss . Ctotal - Use a steady-state free concentration ( C - free Use Css , fub, Ko, and population Km to calculate Vm (mg/day) with equation #4. - free Use the desired Css (UKCMC range: 0.8-1.6mg/L), fub, Vm, and Km to calculate for a new dosage, Ko (mg/day) with equation #3. ______________________________________________________ Derivation of the Modified Michaelis - Menten Equation: total total Ko Vm ⋅ Css Vm ⋅ Css 1.) = = total total fub ) fub ⋅ (K m +Css ) (fub ⋅ K m )+ (fub ⋅ Css Multiply both sides by fub : 2.) K o = total ⋅ fub) Vm ⋅ (Css total ) fub ⋅ (K m + Css Substitute Cssfree for (Csstotal × fub) : 3.) ∴ K o = free Vm ⋅ Css free (fub ⋅ K m ) + Css _____________________________________________________________ Equation rearranged to solve for Vm : free ] K o ⋅ [(fub ⋅ K m ) + Css 4.) Vm = free Css Rhoney DH, Leader WG, Chandler MHH. Modified Michaelis-Menten Equation for Estimating UnboundPhenytoin Concentrations. Clin Pharm. 1993:12:913-917. Procainamide 77 PROCAINAMIDE 1. Time of Sampling ($32, PA and NAPA) a. 2. Relative To Dose trough within 30 min prior to dose at ss (12 to 25 hours after initiation of therapy, in patients w/ normal renal function). Recommended Frequency of Sampling a. Routine Use in Stable Patients b. 3. initial level (at ss) Use in Unstable Patients After a loading dose, an initial level may be drawn to assess attainment of therapeutic concentrations. Repeat level every 2 to 3 days [or as dictated by: changes in concurrent disease states or drug therapy; lack of adequate response to previously adequate doses (e.g. after recurrence of arrhythmia to determine if subtherapeutic or unresponsive to therapeutic concentrations); and/or signs/symptoms of toxicity]. Therapeutic Range 4-10 mcg/ml (procainamide)* 5-30 mcg/ml (NAPA); NAPA > 20 potentially toxic** * PA commonly used at EPS; level documented here (if drug effective) should be the target conc. chronically. ** TDM Lab automatically reports NAPA levels in conjunction w/ procainamide levels. Procainamide 4. 78 General Guidelines for Monitoring a. IV Dosing Initial Dosing: 17 mg/kg (if obese, use IBW) loading infusion (over 1h), followed immediately by a 2.8 mg/kg/h (ABW) maintenance infusion Patients w/ moderate impairment of renal function or cardiac output: ↓ maintenance infusion rate by 1/3. Patients w/ severe impairment of renal function or cardiac output: ↓ maintenance infusion rate by 2/3; ↓ loading infusion to 12 mg/kg. Dosage Adjustments Css = F ⋅ S ⋅ Ko Cls If rapid achievement of the new Css is desired, additional loading doses of 2 mg/kg (IBW) may be administered for each 1 mcg/ml increase in plasma concentration desired. Avoid aggressive dosage changes (e.g. doubling dosing rate) secondary to potential disproportionate increases in plasma concs. Alternative Dosing Approach b. Administer 100 mg (infuse over 2 min) q 5 min until control of arrhythmia or attainment of a 1 gm cumulative dose, or development of toxicity (e.g. QRS > 50% baseline, hypotension). Follow with maintenance infusion of 2 to 6 mg/min. Oral Dosing* For patients previously on IV infusion: Ko S-R preps: τ = 6h Immediate-release preps: τ = 3-4h Xo = oral dose C(po) = desired conc. (w/ po dosing) C(iv) = measured conc. (w/ IV dosing) Ko = infusion rate (mg/h) F = 0.83, variable S = 0.87 (HCl salt) Capsules: 250mg, 375mg, 500mg SR tablets: 250mg, 500mg, 750mg ER: 1gm (Procainabid®) c po ⋅ ( Xo = c iv F ) ⋅τ Procainamide 79 Changing from IV to oral prep: S-R: Administer oral prep; d/c IV 2 h later Immediate-release: Administer oral prep; d/c IV 1 h later For patients not previously on IV infusion Empiric: 10-15 mg/kg (IBW) 35-50 mg/kg (ABW)/day load maintenance Oral therapy should be initiated with immediate-release preps. Estimation of Cls: Cls (ml/min/70kg) = [Clm + (Clr X fraction of renal fx remaining)] Cls (ml/min/70kg) = [275 (ml/min) + (275 (ml/min) X (Clcr / 100)) ] Dosage Adjustments: S-R preps: c = S ⋅F ⋅ X o Cl s ⋅ τ Immediate-release preps: 5. V = 2L/kg C ss tr = S ⋅F ⋅ X o 1 ∗ e −Kτ ∗ ( ) τ -K V 1- e Patients w/ moderate impairment of renal function or cardiac ↓ maintenance dose by 1/3. output: Patients w/ severe impairment of renal function or cardiac ↓ maintenance dose by 2/3. output: NAPA (N-acetylprocainamide) Recommended for measuring as an index of toxicity, in patients w/ moderate to severe renal impairment. Risk of toxicity should be assessed based on individual concentrations of PA and NAPA concentrations. Acetylator phenotype: Caucasians, African-Americans, Indians, Mexicans - 50 to 65% are slow acetylators. Eskimos, Chinese, Japanese - 80 to 90% are rapid acetylators. Slow acetylators excrete a smaller fraction of a PA dose as NAPA, possibly resulting in unexpectedly high plasma concs. of PA and predisposition to toxicity (if pt has renal dysfunction). Procainamide 80 Plot used to determine if patient is slow or fast acetylator using average Cpss (PA):Cpss(NAPA) ratio and Clcr (ml/min/70kg). Ratios of procainamide to NAPA concentrations, which lie between the lines for fast and slow acetylators, would be assigned to the closest adjacent line. Phenotype status is uncertain for patients with Cpss (PA):Cpss(NAPA) ratios that are intermediate. Cpss (PA) / Cpss (NAPA) 2.5 2 Slow Acetylators 1.5 1 0.5 Fast Acetylators 0 0 30 60 90 120 150 Clcr (ml/min/70kg) Adapted from Basic Clinical Pharmacokinetics, M.E. Winter, ed., 1994. 6. Drug Interactions 7. Cimetidine: Amiodarone: Trimethoprim: empirically ↓ PA dose by 40% empirically ↓ PA dose by 20% ↓ Cls Suggested References Applied Pharmacokinetics (1986), 2nd ed., p. 682-711. Dosing: Obesity: Elderly: Renal Impairment: Hepatic Impairment: Cardiac Impairment: Drug Interactions: Lima (1978) Eur J Clin Pharmacol 13:303. Giardina (1973) Ann Intern Med 78:183. Christoff (1983) Drug Intell Clin Pharm 17:516. Reidenberg (1980) Clin Pharmacol Ther 28:732. Gibson (1977) Kidney Int 12:422. DuSouich (1977) Clin Pharmacol Ther 22:588. Lima (1979) Am J Cardiol 43:98. Christian (1984) Clin Pharmacol Ther 36:221. Saal (1984) Am J Cardiol 53:1264. Quinidine 81 QUINIDINE 1. Time of Sampling* ($27) a. Relative to Dose trough within 1 h prior to dose at ss (4 to 5 estimated half-lives); t½ ~ 7hrs, get Css in 2-3 days *NOTE: Samples are sent to an outside laboratory with results reported in 2-3 days) 2. Recommended Frequency of Sampling a. Routine Use in Stable Patients b. 3. Use in Unstable Patients After a loading dose, an initial level may be drawn to assess attainment of therapeutic concentrations. Repeat level every 2 to 3 days or as dictated by changes in concurrent disease states or drug therapy; lack of adequate response to previously adequate doses (e.g. after recurrence of arrhythmia to determine if subtherapeutic or unresponsive to therapeutic concentrations); and/or signs/symptoms of toxicity. Therapeutic Range 4. initial level (at ss) 2-5 mcg/ml General Guidelines for Monitoring a. Initial Dosing* X *o = Load (PO): C⋅V S ⋅F V = 2.7-3 L/kg 1.8 L/kg 3.8 L/kg (normals) (CHF) (cirrhosis) sulfate: S = 0.83; F = 0.73 (PO) gluconate: S = 0.62; F =0.70 (PO), 1.0 (IV), variable (IM) polygalacturonate: S = 0.60; F= 0.70 (PO) (IV): 6-10 mg/kg Quinidine 82 Oral loads should be divided (maximum 400 mg per single dose, e.g. 400 mg q 3h X 3 doses) to minimize GI upset. 25% dosage reduction needed for patients with CHF. Infusion rate should not exceed 25 mg/min to minimize hypotension. Maintenance Dose* Usual daily dose (PO): sulfate 23 mg/kg/D in divided doses (e.g. q6h; S-R, q 8-12h) gluconate 30 mg/kg/D in divided doses (e.g. q8h) Usual daily dose (intermittent IV infusion or IM**): gluconate * ** b. 17-21 mg/kg/D in divided doses (e.g. q8h) Use IBW for morbidly obese patients. With IM may see transient ↓ in conc. following switch from po to IM, due to slow tissue release. Dosage Adjustment Sustained release product: Cl s = Xo = Calculate actual Cls, based on c (level, usually obtained at trough), τ,S,F, and Xo (dose administered). S ⋅F ⋅ X o c ⋅τ c ⋅ Cl s ⋅ τ S ⋅F Calculate new maintenance dose Rapidly absorbed oral product or intermittent IV infusion: ss -Kτ Css = tr = Cpk ∗ e 5. S ∗ F ∗ Xo -Kτ 1 ∗e ∗ Vd 1-e-Kτ Alterations in Quinidine Disposition a. Cls normal CHF cirrhosis elderly children (< 12 yo) = = = = = 4.5 ml/min/kg, variable 3 - 3.9 ml/min/kg 3.8 ml/min/kg 2.6 ml/min/kg 7.7 ml/min/kg Quinidine b. Protein Binding (NL = 60 - 90%) ↑ f liver disease; cyanotic congenital heart disease; concomitant heparin therapy; neonates, infants <18 mo. old ↓ f post-trauma; surgery; cardiac arrest; MI ↔f renal dysfunction; CHF; respiratory insufficiency hyperlipoproteinemia Note: Quinidine is a low extraction drug: c. Ko K ; C free = o f ⋅ Cl I Cl I 6-7h, variable ↔ ↑ (9h) ↑ (9.7h) ↓ (2-3 h) Drug Interactions • • • • • • 6. C total = t½: normals CHF; renal dysfunction cirrhosis elderly children (<12 yo) d. Quinidine is a potent inhibitor of CYP2D6 (TCA, β-blockers) Phenobarbital, phenytoin, and rifampin ↑ Cls of quinidine. Cimetidine and amiodarone ↓ Cls of quinidine; ↓ quinidine dose by ≅ 25% (w/ cimetidine) and ≅ 37% (w/ amiodarone) Nifedipine ↑ Cls of quinidine (poorly documented) Decreases digoxin Cls by 50% Antacids/antidiarrheals ↓ absorption Miscellaneous Formulary quinidine products, UKMC: 7. 83 quinidine sulfate tablet 200 mg capsule 300 mg quinidine gluconate S-R tablet (Quinaglute Dura-Tab®) 324 mg injection 80 mg/ml, 10 ml vial Suggested References Applied Pharmacokinetics (1992), 3rd ed., p. 23-1 – 23-22. CHF: Cirrhosis: Renal dysfunction: Elderly: Pediatrics: Drug interactions: Ueda (1978) Clin Pharmacol Ther 23:158. Kessler (1978) Am Heart J 96:627. Levy (1976) Clin Res 24:85A Ochs (1978) Am J Cardiol 42:481. Szefler (1982) Pediatrics 70:370. Hardy (1983) Am J Cardiol 52:172. Saal (1984) Am J Cardiol 53:1264. Theophylline 84 THEOPHYLLINE 1. Time of Sampling ($60) a. Relative to Dose Oral (tablet, liquid, S-R preps with duration of absorption < τ, e.g. Slo-Phyllin Gyrocaps). trough within 1h prior to dose S-R preps or continuous infusion with duration of absorption > τ e.g. Theodur S-R preps: tr within 1h prior to dose; any consistent time within dosing interval is acceptable if S-R preparation. Continuous infusion: Single level > 24h after dosage adjustment made during continuous infusion (w/o bolus). Multiple levels (for use with Chiou equation): Continuous infusion (w/o bolus): anytime during true zero-order infusion with 2 levels separated optimally by one t½. Continuous infusion (with bolus): > 1 hour after bolus as 1st sampling time and one t½ later as 2nd sampling time. Intermittent injection b. trough within 1h prior to dose Relative to Steady State After at least 4-5 half-lives (normal t½ ~8-9hrs) Theophylline 2. 85 Recommended Frequency of Sampling a. Routine Use in Stable Patients b. initial level Use in Unstable Patients* initial level repeat level every 2 to 3 days *The frequency of sampling is dictated by changes in concurrent disease state/drug therapy or the lack of adequate response to previously adequate doses, or signs/symptoms of toxicity. Patients in acute respiratory distress require more intensive monitoring. 3. Therapeutic Range 4. 5-20 mcg/ml 6-13 mcg/ml for apnea of prematurity General Guidelines for Monitoring a. Initial Dosing Aminophylline (Theophylline) Dosage Guidelines* For patients not currently receiving theophylline products: Age Infants (6 weeks – 6 months) Loading Dose mg/kg (IBW)* 6 (5) Maintenance Dose Maintenance Dose For next 12 hours Beyond 12 hours mg/kg/hr (IBW)* mg/kg/hr (IBW)* 0.5 (0.4) Children (6 months – 1 year) 6 (5) 0.6-0.7 (0.48-0.56) Dosage should be adjusted based on serum theophylline concentrations Children (1 year – 9 years) 6 (5) 1-1.2 (0.8-1.0) 1.0 (0.8) Children (9 – 12 years) & young adult smokers 6 (5) 0.9 (0.72) 0.8 (0.64) Children (12-16 years) 6 (5) 0.7 (0.55) 0.8 (0.7) Otherwise healthy nonsmoking adults 6 (5) 0.7 (0.55) 0.5 (0.4) *Equivalent anhydrous theophylline dose in parenthesis Theophylline 86 Theophylline maintenance dosage guidelines for patients not currently receiving theophylline products. (Hendeles L, Jenkins J, Temple. Revised FDA labeling guideline for theophylline oral dosage forms. Pharmacotherapy 1995;15(4):409-427.) Initial Dosagea Age Final Dosagea Premature neonates: <24 days postnatal 1.0 mg/kg every 12 hrs ≥24 days postnatal 1.5 mg/kg every 12 hrs Total daily dosage (mg) = Full term infants up to 1yr [(0.2 X age in weeks) + 5.0] x (body weight kg) Children 1 – 15 yrsc < 45kg ≤26 weeks; divided q8hrs >26 weeks; divided q6hrs 12 – 14 mg/kg/day divided q4-6hrs (Maximum: 300 mg/day) After 3 days, if tolerated: 400 mg/day divided q6-8hrs 300 mg/day divided q6-8hrs and After 3 more days, if tolerated: 600 mg/day divided q6-8hrs Adults (16 – 60 yrs)d b. c. d. After 3 days, if tolerated: 16 mg/kg/day divided q4-6hrs (Maximum: 400 mg/day) After 3 more days, if tolerated: 20 mg/kg/day divided q4-6hrs (Maximum: 600 mg/day) Children 1 – 15 yrsc > 45kg a. Dosage should be adjusted based on serum theophylline concentrations to obtain peak steady-state serum theophylline concentrations of 5-10 mg/L for neonates and 10-15 mg/L for infants and older children. If trough concentrations are low before the next dose, then slow-release products may decrease the fluctuation and permit longer dosing intervals. Products containing an aminophylline salt should divide the listed dose by 0.8. Children 1 – 15 years of age, the initial theophylline dose should not exceed 16 mg/kg/day up to a maximum of 400mg/day in the presence of risk factors for reduced theophylline clearance or if not feasible to monitor serum theophylline concentrations. In adolescents ≥ 16 years, the initial theophylline dose should not exceed 400mg/day in the presence of risk factors for reduced theophylline clearance or if not feasible to monitor serum theophylline concentrations. Initial dosing using volume of distribution: Load dose: X o* = C × Vd Assume V = 0.5 L/kg Theophylline 87 b. Concentration Predictions/Dosage Adjustments S-R (e.g. Theodur) c= F ⋅ S⋅ X o Cl s ⋅ τ S = 1; F = 1 Continuous infusion c= S • Ko 1-e-Kt Cls c= S • Ko Cls ( ) S = 0.8, if aminophylline K = Cls/V at ss The Chiou equation may be used to calculate Cls, prior to reaching ss. Basic assumptions: (1) known V; (2) true zero-order infusion between 2 sampling points (C1 and C2). Obtain two levels at 1 and 9h after starting infusion (optimally, one t 1/2 apart). Cl s = 2 ⋅ K o ⋅ 0.8 2 ⋅ V ⋅ (C 1 − C 2 ) + C1 + C 2 (C 1 + C 2 ) ⋅ ( t 2 − t 1 ) Oral (rapidly absorbed product) ss -Kτ = Css tr = Cpk ⋅ e S ⋅ F ⋅ Xo -Kτ ⋅e V ⎛ 1 ⎞ ⋅⎜ -Kτ ⎟ ⎝ 1-e ⎠ Changing from iv to oral S-R prep (e.g. Theodur) Administer oral S-R prep; d/c IV 1 to 2 h later. 88 Theophylline 5. Selected factors altering theophylline clearance Subpopulation V L/kg Cl (L/kg/h) Cls* Factor t½ (h) Maintenance Dose (mg/kg/h) Aminophylline Theophylline AGE Nonsmoking adult Premature infant (3-15 days) Premature infant (25-57 days) Infant (4-18 months) Children (1-4 yrs) Children (6-17 yrs) Elderly (>65 yrs) 0.5 0.7 0.040 0.018 1.0 0.4 8.7 12-48 0.5 0.2 0.4 0.16 0.039 0.6 - 0.3 0.24 0.56 0.48 0.46 0.4-0.5 0.089 0.100 0.087 0.0360.040 2.0 2.0 1.6-2.0 0.87-1.0 4.8 3.4 3.7 7.98.7 1.0 1.0 0.8-1.0 0.4-0.5 0.8 0.8 0.64-0.8 0.32-0.4 0.5 0.5 0.5 0.064 0.072 0.090 1.6 1.8 2.2 5.4 4.8 3.8 0.8 0.9 1.1 0.64 0.72 0.88 0.5 0.5 0.5 0.5 0.025 0.028 0.053 0.030 0.6 0.7 1.2 0.6-0.8 13.9 12.4 6.5 10.8 0.3 0.35 0.6 0.3-0.4 0.24 0.28 0.48 0.24-0.32 0.6 0.6 0.5 0.5 0.56 0.5 0.033 0.011 0.016 0.016 0.017 0.015 0.8 0.25 0.4 0.4 0.4 0.4 13-17 41-55 12-24 22 22.9 23 0.35-0.4 0.13 0.2 0.2 0.2 0.2 0.28-0.32 0.1 0.16 0.16 0.16 0.16 0.6-0.9 0.032 0.8 13-19 0.4 0.32 1.0 8.7 0.5 Use IBW 0.4 Use IBW SMOKING cigarettes marijuana cigarettes / marijuana DRUG cimetidine erythromycin phenobarbital propranolol DISEASE STATE cirrhosis (bilirubin <1.5) cirrhosis (bilirubin >1.5) congestive heart failure cor pulmonale pulmonary edema viral respiratory illness with COPD, Pneumonia severe obstructive pulmonary disease 0.032 WEIGHT obesity 0.5 Use IBW 0.04 Use IBW *The product of all the factors that are present should be multiplied by the average clearance value (0.04 L/kg/h). Theophylline 6. 89 Pediatric Guidelines See dosing guidelines. 7. Suggested References for Influences of Pathophysiological States on Theophylline Kinetics Age: adults Hendeles (1978) Am Rev Resp Dis 118:97. Powell (1978) Am Rev Resp Dis 118:229. Hendeles (1995) Pharmacotherapy 15(4):409-427 premature infants Aranda (1976) NEJM 295:413. Giacoia (1976) J Pediatr 89:829. infants Rosen (1979) Pediatrics 64:248. children Loughnan (1976) J Pediatr 88:874. Ellis (1976) Pediatrics 58:542 elderly Chandler (1988) J Geriatric Drug Ther (3:23) Smoking: Powell (1977) Am Rev Resp Dis 116:17 Jusko (1978) Clin Pharmacol Ther 24:400. Drug: cimetidine Weinberger (1981) N Engl J Med 295:413. Jackson (1981) Am Rev Resp Dis 123:615. Reitberg (1981) Ann Intern Med 95:582. erythromycin Cummins (1977) Pediatrics 59:144. Prince (1981) J Allergy Clin Immunol 68:427. May (1982) J Clin Pharmacol 22:125. propranolol Conrad (1980) Clin Pharmacol Ther 28:463. phenobarbital Landay (1978) J Allergy Clin Immunol 62:27. Theophylline Disease State: cirrhosis Piafsky (1977) N Engl J Med 296:1495. Mangione (1978) Chest 73:616. CHF/cor pulmonale Jenne (1977) Am J Hosp pharm 34:408. Vicuna (1979) Br J Clin Pharmacol 7:33. pulmonary edema Piafsky (1977) Clin Pharmacol Ther 21:310. viral illness Chang (1978) Lancet 1:1132. Clark (1979) Lancet 1:492. severe airway obstruction Powell (1978) Am Rev Respir Dis 118:229. Weight: Obesity Gal (1978) Clin Pharmacol Ther 23:438. Blouin (1980) Clin Pharmacol Ther 28:619. 90 Valproic Acid 91 VALPROIC ACID 1. Time of Sampling ($101) a. Relative to Dose 2. trough within 30 min prior to dose at ss Recommended Frequency of Sampling Initially after reaching steady-state (usually 2-4 days) After each dosage adjustment at ss Sampling should always be done at the same time before a dose and before the same dose each day. (preferably before AM dose, due to effects of diurnal variation on clearance). Bauer (1985) Clin Pharmacol Ther 37:697. 3. Therapeutic Range 4. 50-100 mcg/ml Utility of serum concentration monitoring for valproic acid (VPA) has not been fully determined. This is partially due to concentration-dependent protein binding. It also may take several weeks to achieve a therapeutic effect even after the patient has achieved ss within the therapeutic range. Continued anticonvulsant effects are also seen even after VPA is undetectable in the blood. Studies are controversial in determining an exact relationship between serum concentration and therapeutic effect or toxicity. General Guidelines for Monitoring a. Initial Dosing IV loading (see next page) Empiric - 5-10 mg/kg/day Should be given in divided doses, usually TID - due to short t 1/2 and to minimize GI side effects. Utility of QD dosing has been documented, although many patients cannot tolerate the associated GI discomfort. Baseline and follow-up LFTs should be obtained to assess liver toxicity. Valproic Acid 92 Loading Doses for IV Valproic Acid (Depacon®) IV Valproic Acid has been used in Europe since the 1980s; approved in USA in 1997. Indicated as an intravenous alternative when oral administration of maintenance doses are temporarily not feasible. Not systemically studied as initial therapy. There are no established guidelines for the use of IV valproic acid as a loading dose. Recommended doses from package insert: Complex partial seizures: 10-15 mg/kg/day, incr. 5 – 10 mg/kg/week with usually max ~ 60 mg/kg/day. Simple and complex absence seizures 15 mg/kg/day, increase 5 – 10 mg/kg/week. Recommended infusion rate: No faster than 20mg/min. Recent studies with IV loading doses: Wheless, 1998 Venkataraman, 1999 Hovinga, 1999 Chez, 1999 White, 1999 Naritoku, 1999 Cloyd, 2003 b. Loading doses of 15-45mg/kg (1050 – 3150mg/70kg) infused over 1 hour (max rate ~ 50mg/min) in epilepsy patients (n=25, ages 4-39 yrs) without active seizures. Average Cpk 10min post infusion: 71-277 (mean, 135.3±59.5ug/ml). No significant adverse effects observed except 1 patient with Cpk > 200ug/ml had mild sedation. Loading doses of ~25mg/kg infused at 3-6mg/kg per min (82-319 mg/min) in epilepsy patients (n=21, ages 2-54 yrs). Cpk 20min post infusion= 64-204.1ug/ml (mean 132.6ug/ml). Five patients had pain at site of injection due to high concentration of VPA in infusion fluid. Recommended minimal dilution 1:1 with D5W, NS or LR. Three pediatric patients. Pt#1: 10yo, LD: 20mg/kg followed by 2mg/kg/h infusion; Cpk 1hr post = 69.2ug/ml; 4 hrs later = 40ug/ml. Pt#2: 8yo, LD 13.4mg/kg; Cpk 3hrs post = 33.3ug/ml. Pt#3: 34 months, LD = 20mg/kg over 30min; Cpk 7hrs post = 49ug/ml. Three pediatric patients with status epilepticus. Pt#1: 22 months, 30mg/kg over 60min (no side effects); Cpk = 74.9ug/ml. Pt#2: 13 months, 30mg/kg; Cpk 1hr post = 33.9ug/ml additional 30mg/kg given; Cpk = 102.6ug/ml. Pt#3: 8yo: LD = 30mg/kg & MD = 30mg/kg IV q6; Cpk = 100ug/ml, then 2 hours post = 40ug/ml. Case report in 11yo. LD = 30mg/kg (960mg) over 1hr. BP decr. (130/80 to 70/55) ~39min after start of infusion, respiratory depression, required intubation. Cpk 5hrs post = 104 ug/ml. BP stabilized 14 hrs later after pressor therapy. Loading doses ~19.4±5.4mg/kg (range 10.6-27.8), ~1420±540mg (range 7002800mg) at rates of 20-50mg/min in epilepsy patients (n=20, 52.8±23.5yrs). Reported N/V in 2 patients; decr. BP in one patient. Recommended 0.23L/kg (16.1L/70kg) for LD calculation. Loading doses ~ 15mg/kg infused over 5 min (3mg/kg/min) or 10 min (6mg/kg/min) in 112 patients with epilepsy (mean age = 36±16 yrs; wt = 76.6±25 kg). Mean Vd ~ 0.2 L/kg (range 0.12 – 0.30 L/kg, ~20% CV) but determined with limited sampling strategy (6hrs post dose). Mean (%CV) Cmax at 1hr: Ctotal = 73.5 (22%) mg/L, Cfree = 8.3 (46%) mg/L. Authors recommend using Vd = 0.2 L/kg to estimate loading dose. Dosage Adjustments Increase dose by 5-10 mg/kg/day every 5-7 days until reach therapeutic effect usual maintenance dose: 15 mg/kg/day max dose: 60 mg/kg/day Valproic Acid 5. 6. 7. 93 Pediatric Guidelines dose: 10-60 mg/kg/day (avg. 30 mg/kg/d) t½ : 8-12 hours in neonates 5-8 hours in children dosing interval: syrup caps tabs 90% will have transient increase in LFTs (usually no more than 2x normal) - returns to normal with chronic dosing q 4-6 h q8h q 8-12 h Drug Interactions Anticonvulsant polytherapy makes achievement of therapeutic serum concentrations of valproic acid very difficult. Carbamazepine, phenytoin, and phenobarbital all induce the metabolism of VPA (↑ Cl). Sackellares. (1981) Epilepsia 22:437. VPA ↓ s clearance of phenobarbital. Kapetanovic. (1981) Clin Pharmacol Ther 29:480. VPA displaces phenytoin from protein binding sites - initially, see ↑ f, ↓ CT. VPA also inhibits phenytoin metabolism - with chronic dosing, see ↓ ClI and a rise in CT to approximate CT prior to VPA therapy. Monks. (1980) Clin Pharmacol Ther. 27:89. Bruni. (1980) Neurology 30:1233. Cimetidine inhibits the metabolism of VPA (i.e. up to 20% ↓ in Cl of VPA). Webster (1984) Eur J Clin Pharmacol. 27:341. Dosage Forms Syrup - sodium valproate (Depakene) Capsules - valproic acid (Depakene) Enteric coated tablets - divalproex sodium (Depakote) Divalproex sprinkle capsules Valproate sodium injection - (Depacon®) 250mg/5ml 250mg 125,250,500mg 125mg 100mg/ml (5ml vial) Valproic Acid No difference in bioavailability (as measured by AUC) between the three products. Only difference is in the time to peak for each product. syrup capsules tablets 8. 2 hours 3-4 hours 3-8 hours Food delays the absorption of all three products. Miscellaneous t½ 8-17 h (↑ in hepatic disease, but questionable clinical significance). Vd 0.15 L/Kg (range 0.13-0.23 L/Kg) f variable; concentration-dependent (with ↑ conc, see ↑ f) clinical significance of variability unknown at 50 mcg/ml, f ≅ 0.05-0.1 at 70 mcg/ml, f ≅ 0.2 also affected by disease states (decreased protein binding) renal failure - f = 0.18. Gugler. (1978) Br J Clin Pharmacol. 5:44l. liver failure - f = 0.29 Klotz (1978) Eur J Clin Pharmacol. 13:55 hypoalbuminemia - f increased depending on severity elderly ↑f ↓ Cl Perucca. (1984) Brit J Clin Pharmacol. 17:665. 9. Other Suggested References Applied Pharmacokinetics. (1986), 2nd ed., p. 540-69 Rectal Admin: Thorpy. (1980) Neurology. 30:1113. Cloyd. (1981) Neurology. 31:1348. General Review: Rimmer. (1985) Pharmacotherapy. 5:171. 94 Valproic Acid 95 FREE VALPROIC ACID NOTE: Free valproic acid concentrations are sent to an outside laboratory; allow 2-3 days for reporting. Policy: 1. Any medical (or surgical or other) service can order free valproic levels if patients meet criteria in Appendix II. 2. Physicians on the Neurology service can request or interpret their own results, although the Clinical Pharmacokinetics Service will provide clinical interpretation if consulted. 3. For services other than Neurology, the following will apply: Once the TDM Lab receives a request for a free valproic acid level, TDM Lab will notify the pharmacist on that service or contact the Clinical Pharmacokinetics Service (for uncovered services). The Pharm.D. will monitor the criteria and provide essential clinical input regarding the need for the level. The pharmacist should make sure that a total concentration, as well as the free valproic acid concentration, is ordered. The pharmacist will notify TDM Lab if the assay should be run or cancelled. If an order is to be cancelled, the pharmacist needs to notify the physician first and document (in the patient's chart) the recommendation to cancel the concentration. 4. The therapeutic range of free valproic acid concentrations will be reported as 2.5 to 11.0 mcg/ml.* Valproic Acid 96 Appendix II Free valproic acid concentrations should be reserved for the situations described below. For example, a "normal" patient with normal albumin and normal renal function who is not on concurrent medications (that alter valproic acid protein binding or clearance) would not warrant a free valproic acid concentration. A free valproic acid concentration is warranted when: g. The total valproic acid dosage is >60 mg/kg/day. h. A patient is seizure-free at a total level of <50 mcg/ml and you need to determine whether a dosage increase is necessary. OR OR 1. A patient is exhibiting signs of toxicity at a dosage of <60 mg/kg/day. OR i. A patient is in a unique subpopulation (e.g. a pregnant female, a patient on multiple anticonvulsant therapy, etc.) Vancomycin 97 VANCOMYCIN 1. Time of Sampling Relative to Dose • Verify that the patient will be approved to receive vancomycin beyond 72 hours (automatic stop date; see UK Hospital Vancomycin Policy) BEFORE ORDERING CONCENTRATIONS • Peak at 1 h after end of 1h infusion (Note that peak concentrations have not been shown to correlate well with toxicity or efficacy and not recommended by 2009 ASHP/IDSA guidelines). • Trough within 30 min prior to dose • Trough should be at steady-state (24 to 30 hours after initiation of therapy with normal renal function; approximately after the fourth dose in adults) 2. Recommended Frequency of Sampling Patients in whom vancomycin serum drug concentrations should NOT be obtained: • Adult patients < 60yo with normal body weight, stable renal function with Clcr > 40 ml/min, and short course of therapy (e.g., <7 days) Patients in whom TROUGH vancomycin serum concentrations should be obtained at steady-state: - Patients on vancomycin ≥ 7 days - Renal impairment – estimated Clcr < 40ml/min - Changing renal function defined by increase in serum creatinine by 0.5 mg/dL or 50% from baseline - Special patient populations with altered volume distribution or renal clearance including: o Elderly: ≥ 60 years old o Burn o Cancer o Obesity > 125% ideal body weight o Pediatric - Concomitant nephrotoxic drugs including: o Aminoglycosides o Amphotericin B o Loop diuretics o Vasopressor agents o Others (IV contrast dye, ACE inhibitors) - Patients who may require more frequent monitoring to achieve goal concentrations and prevent toxicity: - Higher doses of vancomycin required to penetrate site of infection; treatment of serious life-threatening infections; extended duration of therapy: o Meningitis, Endocarditis, Osteomyelitis, Pneumonia, Sepsis Vancomycin 3. 4. 98 Therapeutic Range* Peak: 20 – 40 µg/mL (at 1hr after end of 1hr infusion) Trough: 10 – 20 µg/mL Vancomycin troughs of 15-20 mg/L may be warranted for lifethreatening infections, organisms with high MICs (e.g., MRSA, MIC = 1), or to ensure vancomycin concentration at the site of infection. Assuming 50% protein binding, target trough concentrations of 8 to 10x MIC for total vancomycin may be warranted. General Guidelines for Dosing and Monitoring a. Initial Loading Dose • 20-25 mg/kg based on ABW o 40-60kg = 1000 – 1500mg IV X 1 o 61-80kg = 1500 – 2000mg IV X 1 o 81-100kg = 2000mg IV X 1 o >100kg (see morbidly obese guidelines below) b. Initial Maintenance Dose • Modified Matzke Nomogram: Dose = 15 - 20 mg/kg using ABW and Dosing Interval (τ) should maintain serum trough concentrations of 15 mcg/ml. Each dose should be infused over at least 1 hour. Nomogram* for vancomycin in patients with various degrees of renal function Creatinine Clearance (mL/min) ≥120 100 80 60 40 30 20 ≤10 Dosing interval Dosing interval (τ) (τ) HOURS DAYS 0.35 8-12 0.5 12 0.5 12 0.75 18 1.0 24 1.5 36 2.0 48 ≥4.0 Determined by concentrations Hemodialysis Not significantly removed by conventional hemodialysis. Initial dose = 20-25 mg/kg then suggest checking “random” serum concentration in 3-4 days. Redose with 15mg/kg when concentration is 15mg/L. *Adapted from Matzke GR, et al. Antimicrob Agents Chemother. 1984 Apr;25(4):433-7. Vancomycin • 99 For morbidly obese patients (> 90% over their IBW) with normal renal function: 15-20 mg/kg/dose X ABW every 12 hours. Consider maximum initial dose of 2000mg and assess concentrations to determine dosing interval. NOTE: Obese patients may require larger total daily doses at less frequent intervals (i.e., q8hrs) in order to avoid low trough concentrations for prolonged periods. *Bauer LA; Black DJ; Lill JS. Vancomycin dosing in morbidly obese patients. Eur J Clin Pharmacol 1998 Oct;54(8):621-5 • For morbidly obese patients with renal insufficiency (estimated Clcr using the Salazar-Corcoran equation): Use 15mg/kg X ABW every τ determined from the table above (Matzke nomogram). Consider maximum initial dose of 2000mg and assess concentrations to determine dosing interval. Alternative dosing method using estimated pharmacokinetic parameters (Vd and K) and Sawchuk-Zaske Method (refer to aminoglycoside section for equations): Normal Vd range: 0.5 – 0.9 L/kg (use average 0.7 L/kg) Estimate K using Clcr: K (hr-1) = 0.00083 (Clcr) + 0.0044 (Matzke) c. Dosage Adjustment with trough concentration only: Assumptions: Concentration obtained at steady-state; 1-compartment model; principle of superposition; linear elimination 1. Verify administration and sampling times. 2. If concentration above target consider holding next dose and adjust either dose (e.g., decrease dose by % to achieve target concentration using a proportion) and/or adjust interval (e.g. extend interval). d. Dosage Adjustments Using Sawchuk-Zaske Method: Assumptions: 2 concentrations obtained at steady-state; 1-compartment model; principle of superposition; linear elimination. 1. Verify administration and sampling times. 2. Calculate K: ln ( K = 3. ss C pk C ss tr T' ) Calculate t½: T’ is determined by subtracting the time difference between Cpk and Ctr from the Tau. For example, if the time difference between Cpk and Ctr was 1.5hrs and the Tau = q8hrs, then T’ = (8 - 1.5) = 6.5hrs. t½ = 0.693 K Vancomycin 100 4. IF peak concentration is drawn late, calculate if drawn at correct time: Cpk ss Cpk = e-Kt' ss where Cpk = peak concentration drawn at appropriate time; ss Cpk = peak concentration drawn late; t' = time between late Cpk and Cpk 5. IF trough concentration is drawn early (e.g., >30min prior to dose), calculate if drawn at correct time: -Kt' Css tr = C tr ∗ e where Css tr = trough concentration drawn at appropriate time (e.g., suggest use dose administration time) Ctr = trough concentration drawn early; t' = time between early Ctr and Css tr 6. Calculate Vd: If doses have reached steady state (e.g., previous doses on time, concentrations drawn appropriately), use: Vd = K o (1 − e −Kt ) e-KT ss Cpk ⋅ K (1 − e −Kτ ) t = infusion time (e.g., 1hr) ss (e.g., 1hr) T = time between end of infusion & Cpk If doses have NOT reached steady state AND there are at least 3 concentrations after a multiple dose (e.g., trough, peak, & random) or 2 concentrations after the 1st dose (e.g., peak and random or 2 random concentrations) use: Vd = K o (1-e-Kt ) K (Cmax - Ctr e-Kt' ) pk Cmax = peak extrapolated to END of infusion pk t = time of infusion t' = time between Ctr and Cmax pk To use above equation, calculate peak at end of infusion: Cpk Cmax pk = e-KT max T = time between Cpk and Cpk 7. IF measured Ctr is high, calculate time required to achieve desired Ctr: Ctr ⎞ ln ⎛⎜ 1 ⎟ Ctr 2 ⎠ ⎝ t' = K Ctr1 = high Ctr; Ctr2 = desired Ctr t' = time required from Ctr1 to Ctr2 Vancomycin 101 8. Calculate new dosing interval (τ): τ= ln(Cpk /Ctr ) K +t+T t = infusion time (e.g., 1hr) T = time between end of infusion & Cpk (e.g., 1hr) 9. Calculate new dosing rate: Ko = ss Cpk Vd K(1-e-Kτ ) (1-e-Kt ) e-KT t = infusion time (e.g., 1hr) T = time between end of infusion & Cpk (e.g., 1hr) 10. Round dose to nearest 10mg or available stock bag dose (80,100,120mg) then recalculate the actual Cpk: desired Cpk X actual (rounded) dose = actual Cpk calculated dose 11. Estimate trough to be obtained with above Ko and τ: ss -KT' Css tr = Cpk e 12. Document the pharmacokinetic assessment in the medical records. WRITE A CHART NOTE. Document pertinent clinical monitoring parameters, dose recommendations and estimated and/or calculated pharmacokinetic parameters in the medical record. (Also refer to Department of Pharmacy Guidelines for Writing Notes in Patient Charts, PH-02-04) - Briefly describe the rationale of the drug and determine if warranted based on clinical and patient information. Refer to UK Hospital guidelines for appropriate use of vancomycin. - Document the current day of therapy and goal length of therapy (e.g., Day #2/14 vancomycin), and any concomitant antibiotics. - Document the collect times of the reported concentrations and note if the samples were obtained appropriately. For example, if actual Cpk was drawn late, also document the estimated Cpk if drawn correctly. - Include the calculate PK parameters: K (hr-1), t½ (hrs), Vd (L) and Vd (L/kg – DBW). - Write a new dosage in mg and mg/kg-DBW/dose (e.g., vancomycin 1000 mg IV q12hrs, 15mg/kg/dose). - When changing a dosage, include the start time of new dosing regimen with the order (very helpful for the pharmacist entering the order and the nurse administering the drug). - Include a range for the predicted concentrations with the new dosage recommendation: (e.g., Cpk = 8-10mg/L; Ctr <2mg/L, ~1mg/L). - Include other pertinent information used to assess the patient: weight (ABW, IBW, DBW), height, BSA, Scr, Clcr, BUN, urine output, I/Os, cultures, Tmax, WBC, differential, allergies, and other nephrotoxic medications (e.g., furosemide, amphotericin, aminoglycosides). - Refer to the sample note on the next page. Vancomycin 102 Sample Note PHYSICAL/HISTORY/ PROGRESS NOTES Date 9/2/2001 14:30 ABW = 80kg Ht = 6’0” IBW = 77.6kg Scr = 1.2 (today) Clcr = 93ml/min Patient Name: Medical Record: Date of Birth: Clinical Pharmacokinetics Service RE: Vancomycin Day #2/14 Patient is 40yo WM being treated with vancomycin 1000mg IV q12hrs (12.5 mg/kg/dose) for staphylococcal bacteremia based on positive blood cultures (9/1, both bottles) for Staphylococcus aureus. Current Tmax 102.5, WBC = 15K. Vancomycin therapy meets approval criteria. ID service is following patient and recommends Cpk ~ 35-40mg/L and Ctr = 10-15 mg/L (discussed with ID resident). Vancomycin concs drawn around 3rd dose on 9/2: Trough = 8.7 mg/L C: 07:30 Dose = 1200 mg IV infused from 08:00 – 09:00 Peak = 22 mg/L C: 11:00 Assessment of concs: Previous doses administered on time & represent steady-state; Ctr drawn appropriately; Cpk drawn 1hr late & if drawn correctly @ 10:00 = 24.6 mg/L; Cpk and Ctr below recommended range. Renal function stable. PK parameters: K = 0.11hr-1; t½ = 6.3 hrs; Vd = 47.1L (0.6 L/kg) Recommendations: 1. Suggest changing vancomycin to 1500mg IV q12hrs (18.75 mg/kg/dose) to yield a Cpk ~35-40 mg/L & Ctr ~ 12mg/L; begin next dose at scheduled time (9/2 @ 20:00); discussed with ID resident and primary team. 2. Not necessary to recheck Cpk & Ctr unless change in clinical status or renal function; if continue therapy > 7 days, would suggest checking Ctr each week to assess for drug accumulation. 3. Suggest checking Scr/BUN at least 2X/week to assess renal function. Vancomycin 103 1. Pediatric Guidelines Empiric dosing administration guidelines for vancomycin in neonates, infants, and children# Postconceptional age Bodyweight Dose*# < 27 weeks < 800 grams 18 mg/kg q36 hrs 27-30 weeks 800-1200 grams 16 mg/kg q24 hrs 31-36 weeks 1200-2000 grams 18 mg/kg q12 hrs >36 weeks & postnatal age < 7 days >2000 grams 15mg/kg q12 hrs >36 weeks & postnatal age 8-30 days >2000 grams 15mg/kg q8 hrs >36 weeks & postnatal age >30 days >2000 grams 10mg/kg q6 hrs Infants > 1month and children 60 mg/kg/day in divided doses every 6-8 hrs For CNS infections 60-90 mg/kg/day in divided doses every 6-8 hrs *Dosing interval should be extended in renal impairment; #parenteral administration of vancomycin should be administered over at least 60 minutes at a final concentration <5mg/mL; CNS = central nervous system # Rodvold KA, Everett JA, Pryla RD, Kraus DM. Pharmacokinetics and administration regimens of vancomycin in neonates, infants, and children. Clin Pharmacokinet 1997;33(1):32-51. Vancomycin 104 2. Vancomycin- Hemodialysis Dose 1. Loading dose of 15-20 mg/kg based on ABW 2. Enter “intermittent” vancomycin order as an active order between doses Effect of hemodialysis 1. Not significantly dialyzed by conventional low-flux dialysis less than 10% of total body stores removed over a 3-4 hour hemodialysis session. 3. When high-flux filter is used serum concentrations decrease by 1/3 but slowly rebound to 90% of pre-dialysis levels over 10-12 hours. 4. Elimination primarily due to residual kidney function of patient. Limited extrarenal mechanisms of elimination. 5. Average half-life in ESRD patients is 4-5 days depending on residual kidney function. Concentrations 1. Usually drawn 3-5 days post-dose ordered as a random level. 2. Redose when level is expected to be < 15 mg/L. 3. Levels drawn 10-12 hours following high-flux hemodialysis may be misleading. Obtaining level prior to hemodialysis is preferred. References (Drug dosing in renal failure/dialysis): 1. National Kidney Foundation, Kidney Disease Outcomes Quality Initiative; Clinical Practice Guideline for Chronic Kidney Disease. www.KDOQI.org. 2. Bauer LA. Applied Clinical Pharmacokinetics. United States: McGraw Hill; 2001. 3. Aronoff GR, Berns JS, Brier ME, et al. Drug Prescribing in Renal Failure: Dosing Guidelines for Adults. 10th ed. Philidelphia, PA:American College of Physicians:1999. 3. Suggested References for Influences of Pathophysiologic States on Vancomycin Kinetics Infants and Children: Schaad (1980) J Pediatrics 96:119-126. Elderly: Cutler (1984) Clin Pharmacol Ther 36:803-810. Obesity: Blouin (1982) Antimicr Ag Chemother 21:575-580. Burn Patients: Brater (1986) Clin Pharmacol Ther 39:631-634. Critically Ill Patients: Garaud (1984) J Antimicrob Chemother 14 (Suppl D):53-57. Vancomycin 105 4. Other Suggested Readings 1. Rybak M., Lomaestro B., et al. Therapeutic monitoring of vancomycin in adult patients: A consensus review of the American Health-System Pharmacists, the Infectious Diseases Society of America, and the Society of Infectious Diseases Pharmacists. Am J Health-Sys Pharm 66; 2009:82-98. 2. Karam C., McKinnon P., et al. Outcome assessment of minimizing vancomycin monitoring & dosing adjustment. Pharmacotherapy 9(3);1999:257-66. 3. Cohen E., Dadasher A., Drucker M., et al. Once daily vs. twice daily IV administration of Vancomycin for infections in hospitalized patients. J. Antimicobial Chemotherapy 49; 2002:155-60. 4. Zimmerman A., Katona B., Plaisance K. Association of vancomycin serum concentrations with outcomes in patients with gram-positive bacteremia. Pharmacotherapy 15(1);1995:85-91. 5. Cantu T., Yamanaka-Yuen N., Lietman P. Serum vancomycin concentration: reappraisal of their clinical value. Clin Infect Dis 18;1994:533-43. 6. Moellering Robert Jr. Editorial: Monitoring serum vancomycin levels: Climbing the mountain because it is there? Clin Infect Dis 18;1994:544-6. 7. Leader W., Chandler M., Castiglia M. Pharmacokinetic Optimisation of Vancomycin Therapy. Clin Pharmacokinetics 28(4);1995:327-342. 8. Hammett-Stabler C., Johns T. Laboratory guidelines for monitoring of antimicrobial drugs. Clin Chem 44;1998:1129-1140. 9. Palmer-Toy D. Therapeutic monitoring of vancomycin. Arch Pathol Lab Med 124;Feb2002:322-3. 10. Matzke GR, McGory RW, Halstenson CE, Keane WF. Pharmacokinetics of vancomycin in patients with various degrees of renal function. Antimicrob Agents Chemother 1984 Apr;25(4):433-7. Guidelines for Saliva Monitoring 106 GUIDELINES FOR SALIVA MONITORING Saliva Antiepileptic Monitoring • Saliva monitoring is available for carbamazepine, phenobarbital, and phenytoin Drug Carbamazepine Phenobarbital Phenytoin Therapeutic Range 1.4 - 3.5 μg/mL 5 - 15 μg/mL 1 – 2 μg/mL Interpretation Use C-bar equation Use C-bar equation Same as free phenytoin Saliva should NOT be used when • Patients need a STAT concentration – It takes about two hours to get results from saliva testing • Patients took their dose of carbamazepine, phenobarbital, or phenytoin in the last 3 hours • Patients who have eaten or drunk anything but water in the last 15 minutes Ordering the test • Write “saliva phenobarbital” or “saliva carbamazepine” or “saliva phenytoin” on Lab Miscellaneous form Collecting the saliva • It is important to remember that saliva, not sputum, needs to be collected – If the patient is able to follow directions, he/she should be asked to spit in a 5 dram vial. This should be the saliva collected in the mouth (i.e., nothing from the lungs) – If the patient is unable to follow directions, the saliva can be collected with a disposable plastic pipette directly from the mouth to the 5 dram vial. – Do NOT use a suction tube to collect a sputum specimen • Saliva Collection Packets can be obtained from Special Chemistry (3-6093) and contain a 5 dram vial and a premarked disposable pipette in a Ziploc bag. • At least 0.5 mL of saliva needs to be collected. • Cap the vial and label it with the addressograph label • Deliver the specimen to the laboratory using the usual means. Helpful tips • If the patient is having difficulty producing saliva, have him/her think about food and/or make chewing motions with his/her mouth • For infants, tilting the head sideways will cause saliva to pool in the cheek pocket. It is then easier to collect the sample • When collecting saliva directly from the mouth, be careful that the patient doesn’t bite you Result reporting • Results are reported routinely in Clinipac and Sunrise Clinical Viewer at the completion of the analysis (approximately 2 hours). Guidelines for Saliva Monitoring 107 Suggested References 1. Anavekar SN, Saunders RH, Wardell WM, et. al. Parotid and whole saliva in the prediction of serum total and free phenytoin concentrations. Clin Pharmacol Ther 1978;24:629-37. 2. Bartels H, Oldigs HD, Gunther E. Use of saliva in monitoring carbamazepine medication in epileptic children. Eur J Ped 1977;126:37-44. 3. Kristensen O, Larsen HF. Value of saliva samples in monitoring carbamazepine concentrations in epileptic patients. Acta Neurol Scand 1980;61:344-50. 4. Miles MV, Tennison MB, Greenwood RS. Evaluation of the Ames Seralyzer for the determination of carbamazepine, phenobarbital, and phenytoin concentrations in saliva. Ther Drug Monit 1990;12:501-10. 5. Miles MV, Tennison MB, Greenwood RS. Intraindividual variability of carbamazepine, phenobarbital, and phenytoin concentrations in saliva. Ther Drug Monit 1991;13:166-171. 6. Moreland TA, Priestman DA, Rylance GW. Saliva carbamazepine levels in children before and during multiple dosing. Brit J Clin Pharmacol 1982;13:647-51. 7. Paxton JW, Rowell FJ, Ratcliffe JG, et. al. Salivary phenytoin radioimmunoassay. Eur J Clin Pharmacol 1977;11:71-4. 8. Paxton JW, Donald RA. Concentrations and kinetics of carbamazepine in whole saliva, parotid saliva, serum ultrafiltrate, and serum. Clin Pharmacol Ther 1980;28:695-702. 9. Grim SA, Ryan M, Miles MV, Tang PH, Strawsburg RH, deGrauw TJ, Fakhoury TA, Baumann RJ. Correlation of levetiracetam concentrations between serum and saliva. Ther Drug Monit. 2003 Feb;25(1):61-6. Guidelines to Anticoagulation 108 Guide to Anticoagulation For Inpatient Questions between 0800-1700 Monday to Friday Page PharmD on Service or Anticoagulation Management Service pager 330-4325 For Inpatient Questions after hours please page PharmD on call pager 330-3883 UNIVERSITY OF KENTUCKY HOSPITAL CHANDLER MEDICAL CENTER POLICY NUMBER: PH-02-12 FIRST ISSUED: 1/04 Department of Pharmacy Policy CURRENT AS OF: 11/08 SUBJECT: Anticoagulation Management Service Policy/Procedures SEE ALSO: PH02-04 Guidelines for Writing Notes in Patient’s Chart; PH02-05 Clinical Pharmacokinetics Service Policy/Procedures; PH02-08 Patient Education-Inpatients; PH02-11 Prescribing Guidelines; HP-2-14 Discharge Medication Planning, Education, and Procurement, PH02-17 Role of the Pharmacist in the Electronic record, CN-08-01E Drug-Nutrient Interactions PURPOSE: To establish a standard approach to the management of inpatients receiving medications used for anticoagulation at the University of Kentucky Chandler Medical Center. STAFF AFFECTED: GENERAL: Clinical Pharmacist Specialists, Clinical Staff Pharmacists, Staff Pharmacists, Pharmacy Residents, and Pharmacy Students under the supervision of a licensed pharmacist. The Anticoagulation Management Service (AMS) Policy/Procedures were developed to ensure the safe and efficacious use of medications used for anticoagulation. The policy/procedure manual outlines standard guidelines which should be followed when providing clinical monitoring of the following drugs: warfarin, heparin, low molecular weight heparins (LMWH), and direct thrombin inhibitors. Monitoring Responsibility Within the pharmaceutical care process, the primary pharmacist/resident who attends rounds or precepts pharmacy students on the primary medical team is responsible for providing appropriate and cost-effective monitoring and provision of clinical anticoagulation evaluations. Patients on a service without a rounding service will be identified and followed according to the pharmacy monthly service coverage list. The AMS is available on a consultant basis as well for assistance with anticoagulation issues via pager 330-4325 M-F 0800-1700 or pager 330-3883 (PharmD on-call) after-hours and weekends. Ordering Pharmacists consulted via pharmacist to dose orders within SCM are authorized to order lab tests pertinent to the management of a patient’s anticoagulation. These orders must state “Per Protocol”. Lab tests will be limited to those pertinent to the monitoring of the medication (i.e. PT, INR, aPTT, anti-factor Xa concentrations, SCr, BUN, CBC, and Albumin). In addition, Guidelines to Anticoagulation 109 pharmacists are able to order dosage adjustments for heparin, LMWH, direct thrombin inhibitors, and warfarin in consultation with the prescribing physician. Documentation in the Patient Medical Record When a pharmacist is providing a consult on a patient on anticoagulation therapy, the pharmacist should write a “Clinical Anticoagulation” note in the patient’s medical record to indicate initial recommendations in dosage or monitoring and to indicate changes in these recommendations. Alternatively, this note may be included as a component of the daily physician progress note. For laboratory values or dosages that are supratherapeutic, the medical team should be notified immediately if clinically warranted and appropriate recommendations should be documented. Documentation in the medical record should contain all relevant patient information necessary to reproduce the dosing and monitoring recommendations. Patients receiving warfarin should receive an initial anticoagulation note upon admission or restart of their warfarin therapy. The pharmacist managing that patient should also leave notes upon any dosage change recommendation and documenting patient education prior to discharge. Education The nurse and/or pharmacist will provide patient education for patients receiving anticoagulant therapy prior to discharge. Direct Pharmacist patient counseling will be available as consulted. This education will include anticoagulation counseling and include such items as importance of taking the medication and being adherent with laboratory monitoring, drug and nutrient interactions, as well as potential adverse reactions. In addition, written information will be disseminated to the patient. Anticoagulation Management Guideline See the University of Kentucky Chandler Medical Center Anticoagulation Guide http://www.hosp.uky.edu/pharmacy/cps/default.html. This guideline will be used by pharmacists to adjust warfarin, heparin, direct thrombin inhibitor and LMWH regimens. Continuous Quality Improvement (CQI) The AMS will report annually to the P&T Committee. Areas included in this review are appropriate indications for anticoagulation, appropriate dosing, appropriate laboratory monitoring, achievement of therapeutic INRs, adverse drug reactions including rates of bleeding and thrombotic episodes, and patient satisfaction. These results will be included in Pharmacy Services annual CQI activities. Guidelines to Anticoagulation 110 Warfarin Mechanism of Action: - Inhibits reduction of vitamin K epoxide, thereby limiting activation of vitamin K dependent clotting factors: II (prothrombin), VII, IX, X. Antithrombotic effect primarily due to reduction in prothrombin. - Inhibits synthesis of anticoagulant proteins C and S (potential procoagulant effects). Pharmacokinetics: Warfarin is a racemic mixture of two active isomers, R and S. The S-isomer is approximately five times more potent than the R-isomer. Oral Administration Absorption: rapidly and completely absorbed Distribution: primarily intravascular, highly protein bound Half-life: 36-42 hours - Time to steady state = approximately 10 days Half-lives of Clotting Factors: Factor II = 60 hrs Factor VII =6 hrs Factor IX = 24 hrs Factor X = 40 hrs Anticoagulation may be seen within 24 hours due to inhibition of Factor VII, but peak anticoagulant activity is delayed for 72-96 hours due to Factor II inhibition (2-3 days after 1st therapeutic INR) Metabolism: Hepatic microsomal enzymes to inactive metabolites - S-isomer is metabolized primarily by cytochrome P450 (CYP) 2C9 - R-isomer is metabolized by CYP 1A2 and CYP 3A4 - Reduce dose with hepatic dysfunction and with hypermetabolic states (increased catabolism of vitamin-K dependent factors) - Not significantly affected by dialysis Dosing and Monitoring: Dose that is required is variable and dependent on a number of patient-specific and environmental factors. Refer to dosing guidelines on following page. Baseline INR within 48 hours of warfarin initiation should be reviewed to assess sensitivity. If an INR is not present, the pharmacist will contact the physician or enter an order to obtain an INR prior to verification of the order. Collect INR daily in hospitalized patients being initiated on warfarin until INR is within the desired therapeutic range, then two or three times weekly. • Consider holding warfarin therapy if INR > 4 Guidelines to Anticoagulation Warfarin Anticoagulation Initiation Dosing for Warfarin Naïve Patients Warfarin High Sensitivity* 2.5-5 mg INR Day 1 Baseline INR Warfarin Moderate Sensitivity** 5-7.5 mg Warfarin Low Sensitivity*** 7.5-10 mg 2 <1.5 2.5-5 mg 5-7.5 mg 7.5-10 mg 1.5-1.9 2.5 mg 2.5 mg 2.5 mg 2-2.5 1-2.5 mg 1-2.5 mg 1-2.5 mg >2.5 0 0 0 ____________________________________________________________________ Continue for all patients ____________________________________________________________________ Day 3 INR <1.5 1.5-1.9 2-2.5 2.6-3 >3 Dose 5-10 mg 2.5-5 mg 0-2.5 mg 0-2.5 mg 0 4 <1.5 1.5-1.9 2-3 >3 10 mg 5-7.5 mg 2.5-5 mg 0-2.5 mg 5 <1.5 1.5-1.9 2-3 >3 10 mg 7.5-10 mg 2.5-5 mg 0-2.5 mg 6 <1.5 1.5-1.9 2-3 >3 7.5-12.5 mg 5-10 mg 2.5-5 mg 0-2.5 mg 7 *High Sensitivity Baseline INR >1.5 >65 years of age Significant hepatic disease Decompensated CHF Malnourished Malabsorption syndrome/ chronic diarrhea Cancer Hypoalbuminemia (esp<2) Thyrotoxicosis Genetic polymorphism of CYP-450 2C9 Make adjustment based on total weekly dose (Increase or decrease dose by 5-20% depending on current INR and target INR) **Moderate Sensitivity Baseline INR 1.2-1.5 50-65 years of age Concurrent CYP-450 hepatic enzyme inhibitor (see table for details) ***Low Sensitivity Baseline INR <1.2 <50 years of age and no other risk factors 111 Guidelines to Anticoagulation 112 Adverse reactions Warfarin: - Over Anticoagulation / Bleeding Guidelines on Vitamin K1 Administration for Reversal of Warfarin INR Greater than therapeutic but < 5 with no significant bleeding Action/Recommendation Continue with lower warfarin dose, OR omit a dose and resume therapy at a lower dose. 5-9 (No significant bleeding) Omit 1 or 2 doses (monitoring INR more frequently), and resume therapy at a lower dose when INR therapeutic, OR If patient is at risk of bleeding omit a dose and administer vitamin K1 1.25 to 2.5 mg PO 5-9 (Rapid reversal required for urgent surgery)* Administer vitamin K1 2.5 mg PO (INR to normalize in 24 hours); if INR still high, administer additional 1.25 to 2.5mg of vitamin K1 PO. >9 (No significant bleeding) Hold warfarin therapy AND administer vitamin K1 2.5-5 mg PO, administer additional vitamin K1 in 24-48 hours if necessary; resume therapy at a lower dose when INR therapeutic. Significant bleeding at any INR value Hold warfarin therapy AND administer vitamin K1 10 mg by slow IV infusion (1mg/min) diluted in D5W or NS; may repeat every 12 hours if needed. (Supplement with fresh frozen plasma, depending on urgency) Life threatening bleeding Hold warfarin therapy AND administer fresh frozen plasma AND administer vitamin K1 10 mg by slow IV infusion (1mg/min) diluted in D5W or NS. *For patients with INR >1.5 but <5 requiring reversal for urgent surgery administer vitamin K1 2.5 to 5 mg PO, or for patients NPO, 1 mg IV. Reduction in INR may take 24hrs. In general oral route is preferred over subcutaneous Guidelines to Anticoagulation Selected Factors Altering Warfarin Pharmacokinetics and Pharmacodynamics Increased Warfarin effect Acetaminophen (high doses) Alcohol (acute ingestion) Aminosalicylic acid Allopurinol Amiodarone Aspirin Cimetidine Ciprofloxacin Clarithromycin Dexamethasone ( >20 mg) Disulfiram Erythromycin Fluconazole Flu vaccine Itraconazole Isoniazid (600 mg/day) Levothyroxine Metronidazole Omeprazole Phenytoin (long term) Propoxyphene Quinidine Sulfonylurea Tamoxifen Tetracycline TMP/SMX Decrease Warfarin effect Alcohol (chronic ingestion) Aminoglutethimide Barbiturates Carbamazepine Cholestyramine Dicloxacillin Griseofulvin Nafcillin Phenytoin Rifampin Sucralfate Vitamin K Increased Bleeding Aspirin NSAIDs Ticlopidine Clopidogrel Thrombocytopenia 113 Guidelines to Anticoagulation Optimal Therapeutic Range for Oral Anticoagulation Indication Atrial Fibrillation Atrial Fibrillation with high risk factors (age >75 years, history of TIA or stroke, hypertension, history systemic embolus, mitral stenosis, bioprosthetic cardiac valve, thyrotoxicosis, left ventricular dysfunction, CHF, rheumatic mitral valve disease) Atrial Fibrillation with > 2 moderate risk factors (Age 65-75 years, diabetes mellitus, coronary artery disease) Pre-cardioversion (for Afib >48 hours) Post-cardioversion Cardioembolic Stoke Left Ventricular Dysfunction Ejection Fraction < 30% Following embolic event despite anticoagulation Myocardial Infarction (MI) Following anterior MI Following MI with continued risk factors (Afib, LV dysfunction, CHF, mural thrombosis, history of embolism) Thromboembolism (DVT, PE) Treatment/prevention of recurrence (reversible or time-limited risk factors) Treatment/prevention of recurrence (first episode of idiopathic thrombus) Continued presence of risk factors (AT-III, protein C or S deficiency, malignancy) Symptomatic calf vein thrombosis Prophylaxis of venous thrombosis (high risk surgery) INR 2-3 (chronic) 2-3 (chronic) 2-3 (3 weeks) 2-3 (4 weeks) 2-3 (chronic) 2-3 (chronic) 2-3 (chronic) plus ASA 81 mg 2-3 (1-3 months) 2-3 (chronic) 2-3 (3 months) 2-3 (6 months) 2-3 (12 monthschronic) 2-3 (6-12 weeks) 2-3 114 Guidelines to Anticoagulation 115 Optimal Therapeutic Range for Oral Anticoagulation Indication Valvular Disease Aortic valve disease with concurrent mitral valve disease with associated atrial fibrillation Mitral annular calcification with associated atrial fibrillation with history of systemic embolization Mitral valve prolapse with associated atrial fibrillation with history of systemic embolization with history of TIA despite Aspirin therapy s/p embolic event despite anticoagulation Patent foramen ovale/atrial septal anuerysm with history of systemic embolization with history of TIA Rheumatic mitral valve disease with left atrial diameter > 5.5 cm with associated atrial fibrillation with history of systemic embolization s/p embolic event despite anticoagulation Valve Replacement Mechanical valve prosthesis (tilting disk valves, bileaflet mechanical valves in the mitral position or aortic position with atrial fibrillation) Bileaftet aortic mechanical valve (provided normal sinus rhythm, normal ejection fraction, and normal sized atrium) Mechanical valve following systemic embolization or risk factors (Concurrent atrial fibrillation, history of systemic embolization left atrial thrombus, severe left ventricular dysfunction) Tissue valve prosthesis Tissue valve with history of systemic embolization Tissue valve with atrial fibrillation or pacemaker INR 2-3 (chronic) 2-3 (chronic) 2-3 (chronic) 2-3 (chronic) 2-3 (chronic) 2-3 (chronic) 2-3 (chronic) 2-3 (chronic) plus ASA 325 mg 2-3 (chronic) 2-3 (chronic) 2-3 (chronic) 2-3 (chronic) 2-3 (chronic) 2.5-3.5 (chronic) or 2-3 (chronic) plus ASA 81 mg or clopidogrel 75mg 2.5-3.5 (chronic) 2-3 (chronic) 2.5-3.5(chronic) plus ASA 81 mg 2-3 (3 months) 2.5-3 (3-12 months) 2-3 (chronic) Guidelines to Anticoagulation Sample of Documentation Template for Warfarin HPI: ABW: Height: IBW: PMHx: Social Hx: EtOH: Tobacco: Current Medications: Indication for Anticoagulation: Target INR: Expected Duration: Anticoagulation History: Previously on warfarin YES/NO Previous warfarin maintenance dose: Start Date: Dates: Previous Indication: Other information: Hospital Anticoagulation: Date INR Warfarin Dose (mg) Labs: (CBC, LFTs) HCT: HGB: PLT: LFTs Anticoagulation Assessment/Recommendation (include evaluation of potential drug-drug interactions): Initial warfarin teaching: Done/Not Done/Date to be Done: Healthcare Provider to manage warfarin after discharge: Name (#Beeper) _____________________________ Contact Info: 116 Guidelines to Anticoagulation 117 Unfractionated Heparin Mechanism of Action - Binds to and causes conformational change in anti-thrombin III thereby accelerating inactivation of activated clotting factors IIa (thrombin), IXa, Xa, XIa and XIIa, subsequently halting coagulation. Low dose predominantly affects factor Xa (prophylaxis) Full-dose predominantly affects factor IIa (thrombin) (established clot) Pharmacokinetics Unfractionated Heparin (IV or SQ): Absorption (SQ): completely absorbed (at treatment doses); peak concentrations at 2-4 hrs Distribution: primarily intravascular Half-life: 90 minutes (range 0.5-2 hours) - Mean time to steady state = 6 hours (3-5 half-lives) - Increases with larger doses (non-linear) - Decreases with PE, massive thrombus, or new clot (increased clearance) Metabolism: degraded by reticuloendothelial system - No dose adjustment necessary for hepatic or renal dysfunction - Not significantly affected by dialysis Prophylaxis Dosing General Surgery / Medicine Patients - Unfractionated heparin (UFH) 5000 units sq q8h or q12h Treatment (initial dosing) General Considerations - Initial doses based on using actual body weight - See heparin protocol for additional dosing adjustment and monitoring recommendations Management of venous thromboembolis (VTE)/ pulmonary embolism (PE) - UFH 80 units/kg (bolus), not to exceed 8,000 units. - UFH 18 units/kg/hr (maintenance), max initial infusion rate 1,800 units/hr, titrate to goal aPTT. Acute Coronary Syndrome (ACS) - UFH 60 units/kg (bolus), not to exceed 5,000 units UFH 12 units/kg/hr infusion (maintenance), max initial infusion rate of 1,000 units/hr, titrate to goal aPTT Monitoring Activated partial thromboplastin time (aPTT) - Collect 6 hours after initiation or rate change of heparin infusion, adjust per protocol Goal aPTT range changes annually based on the site specific reagent used to perform the test. This is done at UK by correlating aPTT values with therapeutic heparin levels (measured by factor Xa inhibition). Guidelines to Anticoagulation 118 Adult Full-Dose Heparin Protocol (Effective March 2008- Present) Laboratory: 1. Baseline CBC, then daily while on heparin 2. Baseline PT with INR and aPTT prior to initiation of heparin 3. aPTT q6h and adjust according to sliding scale below. May decrease to daily aPTT once two consecutive aPTTs are within the therapeutic range. Heparin Bolus and Infusion: 4. Bolus: 80 units/kg (max of 8,000 units) 5. Infusion: 18 units/kg/hour (initial max of 1,800 units/hour) 6. Discontinue all other orders for heparin products (i.e. heparin, enoxaparin) Heparin Sliding Scale: 7. aPTT in 6 hours 8. Adjust heparin drip as follows: Goal aPTT: 64-86 seconds Hold aPTT Bolus Infusion 60 units/kg 0 min <30 Rate Change Repeat aPTT increase by 3 units/kg/hr 6 hours 0 min increase by 2 units/kg/hr 6 hours (max of 5000 units) 30-63 30 units/kg (max of 2500 units) 64-86 No bolus 0 min No Change 6 hours* 87-110 No bolus 0 min decrease by 2 units/kg/hr 6 hours >110 No bolus 60 min decrease by 3 units/kg/hr 6 hours * Once two consecutive aPTTs are within range, may collect daily with AM labs 9. Round all bolus doses to the nearest 500 units, and infusion rates to the nearest 10 units/hr Overlapping with Oral Anticoagulation: Oral anticoagulation (e.g. warfarin) should typically be started on Day 1 of enoxaparin or heparin treatment and should be continued along with warfarin for a minimum of four days and until INR in within desired therapeutic range on 2 consecutive occasions at least 24 hours apart. Guidelines to Anticoagulation 119 ACS/MI Heparin Protocol (Effective March 2008- Present) Laboratory: 1. Baseline CBC, then daily while on heparin 2. Baseline PT with INR and aPTT prior to initiation of heparin 3. aPTT q6h and adjust according to sliding scale below. May decrease to daily aPTT once two consecutive aPTTs are within the therapeutic range. Heparin Bolus and Infusion: (also see chart on the right) 4. Bolus: 60 units/kg (max of 5,000 units) 5. Infusion: 12 units/kg/hour (initial max of 1,000 units/hour) 6. Discontinue all other orders for heparin products (i.e. heparin, enoxaparin) Heparin Sliding Scale: 7. aPTT in 6 hours 8. Adjust heparin drip as follows: Goal aPTT: 50-70 seconds Hold aPTT Bolus Rate Change Infusion 60 units/kg 0 min increase by 3 units/kg/hr <30 (max of 5000 units) 30-49 30 units/kg (max of 2500 units) Repeat aPTT 6 hours 0 min increase by 2 units/kg/hr 6 hours 50-70 No bolus 0 min No Change 6 hours* 71-95 No bolus 0 min decrease by 1 units/kg/hr 6 hours >95 No bolus 60 min decrease by 2 units/kg/hr 6 hours * Once two consecutive aPTTs are within range, may collect daily with AM labs 9. Round all bolus doses to the nearest 500 units, and infusion rates to the nearest 10 units/hr Heparin Reversal Recommendations Protamine - Binds to heparin forming a stable complex devoid of anticoagulant activity. - Reserved for patients with clinically significant bleeding episodes while receiving heparin therapy. The drug is not indicated in cases of minor bleeding as withdrawal of heparin will generally result in correction of bleeding within several hours. - Use with supportive care of the patient and possible transfusion therapy. - Dosing o 1 mg of protamine will reverse approximately 100 units of heparin o Initial doses rarely exceed 50mg - Infusion related adverse effects including hypotension and bradycardia can be minimized by extending the infusion time (10 minutes) - Follow-up aPTT should be drawn 15 min post-dose to assess response Guidelines to Anticoagulation 120 Enoxaparin Mechanism of Action - Low molecular weight heparin (LMWH) derived from porcine heparin with an average molecular weight of 4500 daltons. Both heparin and LMWH binds to and causes a conformational change in anti-thrombin III thereby accelerating inactivation of activated clotting factors. Due to its smaller size, enoxaparin preferentially inhibits factor Xa, with an anti-Xa:anti-IIa ratio of 3.6:1. Pharmacokinetics Absorption (SQ) - 90% absorbed by subcutaneous route - Peak anti-factor Xa activity 3-5 hours after injection Distribution - Similar to intravascular volume Elimination - Primarily renal, follows linear, first order kinetics Half-Life (based on anti-factor Xa activity) - 6 hours (multiple doses) - Prolonged in patients with renal insufficiency due to decreased clearance Prophylaxis Dosing 40 mg SQ daily - General Surgery / Medicine patients - Orthopedic hip replacement 30 mg SQ bid - Orthopedic Trauma patients - Orthopedic knee replacement Treatment Dosing 1 mg/kg SQ bid (Actual body weight) - DVT/PE treatment - Unstable angina and NSTEMI - Bridge therapy to warfarin 1.5 mg/kg SQ daily - DVT/PE treatment o 1mg/kg SQ bid preferred in following patients Proximal DVT Obesity Hypercoagulable state Increased bleeding risk Monitoring Not generally necessary - May be considered in special populations. Those at extremes of body weight or with renal insufficiency (defined as Clcr < 30 ml/min). - Limited data are available that correlate a specific anti-factor Xa range to antithrombotic activity or bleeding risk. Appropriate surrogate marker of antithrombotic effect when the clinical situation dictates monitoring. Guidelines to Anticoagulation 121 Anti-factor Xa levels - Concentrations measured by the anticoag lab on Mondays, Wednesdays, and Fridays - Collect peak concentration 3-5 hours after the subcutaneous dose - Enoxaparin should be at steady state to account for accumulation, typically prior to third dose - Therapeutic Range (peak concentration): o 0.6-1 Unit/ml (1mg/kg dosing) Dosage adjustment - Changes in dose can be calculated by using a ratio of dose and anti-factor Xa level o Assumes current Xa level is at steady state o Goal Xa level for treatment doses in therapeutic range New Dose = (Current Dose) · (Goal anti-factor Xa level) Current anti-factor Xa level Renal Insufficiency 9 Enoxaparin is primarily eliminated renally. Its use in patients with severe renal dysfunction will prolong the elimination half-life and may increase bleeding risk. 9 Inverse correlation exists between Clcr and anti-factor Xa levels. Patients with severe renal impairment (Clcr < 30 ml/min) require dosage adjustment due to reduced clearance. - Prophylaxis dosing: Enoxaparin 30mg SQ daily - Treatment dosing: Enoxaparin 1mg/kg SQ daily 9 UFH is recommended for dialysis patients or patients with renal insufficiency at high risk of bleeding. Extremes of Body Weight Underweight (<45 kg): Consider monitoring anti-factor Xa levels Obesity: No dosage adjustment is necessary in patients with a BMI < 40 kg/m2. Data on the use and monitoring of enoxaparin in patients >150 kg is limited. Capping the enoxaparin dose at 150 mg for patients > 150 kg should NOT be done. - Peak concentrations may be delayed in this population (4-6 hours) - When compared to non-obese patients, overall exposure at steady state was 16% higher in obese population receiving the same weight-based dose (1.5mg/kg daily). Use with caution in patients > 150kg - Consider treatment with UFH in these patients - If LMWH used, consider dose adjustment with anti-factor Xa monitoring. Enoxaparin Reversal Recommendations Protamine - - Reverses the antithrombin activity of enoxaparin but ≤ 60% of the anti-Xa activity. o No accepted method available to neutralize all effects of enoxaparin Reserved for patients with clinically significant bleeding episodes while receiving enoxaparin therapy. Reversal may be incomplete due to lack of anti-factor Xa neutralization. Use with supportive care of the patient and possible transfusion therapy. Dosing (within 8 hours of SQ dose) o 1 mg of protamine will reverse approximately 100 anti-factor Xa units (1 mg of enoxaparin = 100 anti-factor Xa units). o Repeat dose of protamine 0.5 mg per 100 anti-factor Xa units may be given if bleeding continues. Guidelines to Anticoagulation 122 Direct Thrombin Inhibitors Argatroban Mechanism of Action - A direct, selective thrombin inhibitor. Reversibly binds to the active thrombin site of free and clot-associated thrombin. Inhibits fibrin formation; activation of coagulation factors V, VIII, and XIII; protein C; and platelet aggregation. Pharmacokinetics Immediate onset with IV infusion Metabolism - Hepatic - requires initial dosage adjustment in patients with moderate to severe hepatic dysfunction Half-Life - 40 minutes - Prolonged in patients with hepatic insufficiency due to decreased clearance Treatment (initial dosing) General Considerations - Initial doses based on using actual body weight - See argatroban protocol for additional dosing adjustment and monitoring recommendations Management of Heparin Induced Thrombocytopenia (HIT) - Initial Infusion rate - Standard o 2 mcg/kg/min Initial Infusion rate - Critically ill patient o 0.5-1 mcg/kg/min Initial Infusion rate – moderate-severe hepatic insufficiency (Child-Pugh score >6) o 0.5 mcg/kg/min Monitoring Baseline LFTs and PT/INR - assess hepatic function prior to initiation - Patients with hepatic dysfunction may exhibit prolonged half-lives Activated partial thromboplastin time (aPTT) - Collect 2 hours after initiationthen every 4 hours (after rate changeor if in range) until two consecutively in range, and then daily with AM labs. Adjust per protocol Argatroban Interaction with INR Argatroban can cause an elevation in INR beyond that seen with warfarin alone (reversal with vitamin K and/or Fresh Froze Plasma is not necessary) Collect baseline INR prior to initiation of infusion and again once on argatroban prior to initiation of warfarin Accurate INR can be obtained by holding argatroban infusion for approx 4 hours prior to checking INR (Refer to argatroban to warfarin conversion guidelines) Guidelines to Anticoagulation 123 Bivalirudin Mechanism of Action Specific and reversible direct thrombin inhibitor; it binds to the catalytic and anionic exosite of both circulating and clot-bound thrombin. Inhibits coagulant effects by preventing thrombinmediated cleavage of fibrinogen to fibrin monomers, and activation of factors V, VIII, and XIII. Pharmacokinetics Immediate onset with IV infusion Elimination - Proteolytic cleavage - Renal o requires initial dosage adjustment in patients with severe renal dysfunction, CrCl < 30 ml/min Half-Life - 25 minutes - Prolonged in patients with severe renal insufficiency Treatment (initial dosing) General Considerations - Initial doses based on using actual body weight - See bivalirudin protocol for dosing adjustment and monitoring recommendations Management of Heparin Induced Thrombocytopenia (HIT) - Initial Infusion rate - Standard o 0.2 mg/kg/hr - Initial Infusion rate - Critically ill patient o 0.1 mg/kg/hr - Renal insufficiency o 0.08–0.12 mg/kg/hour (CrCl 30–60 ml/min) o 0.05–0.08 mg/kg/hour (CrCl below 30 ml/min, also consider argatroban Kiser et. al. Safety, efficacy, and dosing requirements of bivalirudin in patients with heparin-induced thrombocytopenia. Pharmacotherapy Vol. 28 (9), 2008 1115-1124 Management of Acute Coronary Syndrome - - Prior to PCI (management on the floor) o Initial Bolus: 0.1 mg/kg followed by 0.25 mg/kg/hr infusion until PCI o No aPTT/ACT monitoring necessary if < 48hrs o Should not be used for this indication if CrCl < 30 ml/min Management of PCI (For use IN CATH LAB ONLY) o Larger initial bolus (0.75 mg/kg) followed by CI (>1.7 mg/kg/hr) for duration of catheterization and up to 4 hours post procedure. Monitoring Baseline serum creatinine - assess creatinine clearance prior to initiation Management of HIT or prolonged infusion: Activated partial thromboplastin time (aPTT) - Collect 2 hours after initiationthen every 4 hours (after rate change or if in range) until two consecutively in range, and then daily with AM labs. Adjust per protocol Guidelines to Anticoagulation 124 DTI Reversal No antidote or reversal agent is available for direct thrombin inhibitors - Bivalirudin is removed via hemodialysis/filtration and can be considered in patients actively bleeding with elevated aPTT (Argatroban is not significantly removed) - Consider fresh frozen plasma (FFP), Factor VII for refractory/life threatening bleeding Adult Heparin Induced Thrombocytopenia (HIT) Guidelines HIT should be considered in patients exhibiting a decrease in platelet count after 5 days of receiving a heparin/LMWH product (may be seen much sooner if previous exposure to heparin), and one of the following: o Platelet count of less than 150000/μL OR 50% drop in baseline platelet count o Development of a new arterial or venous thrombus o Inflammation or necrosis at heparin injection site o Patient with previous documented HIT or heparin induced thrombocytopenia thrombotic syndrome (HITTS) requiring treatment Initial Assessment and labs: o o o o o Discontinue all heparin/LMWH products (IV, SC, flushes, and coated catheters Collect HIT assay (ELISA), preferably >4 hrs after heparin discontinued. o May collect earlier if lab turnaround time will be significantly improved. Collect baseline CMP (renal and hepatic function) and CBC Collect baseline aPTT, INR/PT Consider initiation of treatment for suspected HIT/HITTS (see below) The decision to administer DTI therapy for HIT is based on a clinical-pathologic diagnosis Clinical probability can be assessed using the 4T scoring system below: • Consider HIT in patients with intermediate to high probability The “4 Ts” Estimation of pretest probability of heparin-induced thrombocytopenia Points* Thrombocytopenia Timing of onset of platelet fall Thrombosis Other causes of platelet fall 2 > 50% platelet fall to nadir >20 Days 5-10, or < 1 day with recent heparin (past 30 days) Proven new thrombosis, skin necrosis, or acute systemic reaction after IV UFH bolus None evident 1 30-50% platelet fall, or nadir 10-19 > 10 days or timing unclear, or < 1 day with recent heparin (past 31100 days) Progressive or recurrent thrombosis, erythematous skin leasions, suspected thrombosis (unproven) Possible 0 <30% platelet fall, or nadir <10 < Day 4 (no recent heparin) None Definite Pretest probability scores: 6-8 indicates high; 4-5 intermediate; and 0-3 low. Warkentin TE, Heddle NM. Laboratory Diagnosis of Immune Heparin-induced Thrombocytopenia. Curr Hematol Rep; 2003, 2:148-157. Guidelines to Anticoagulation 125 All laboratory tests for HIT should be interpreted within the context of the clinical probability assessment obtained from the 4T scoring system : o Collect HIT assay (ELISA) o Positive – Possible HIT, consider direct thrombin inhibitor (DTI) If available, consider optical density value in the interpretation of positive ELISA • Optical density (OD) value of 0.4-1.0 are associated with a relatively low risk of HIT and should be interpreted within the context of the clinical estimate for the probability of HIT • OD value of >1 demonstrate nearly a 6-fold increased risk of thrombosis over those less than 1. o Negative – HIT diagnosis very unlikely consider other causes for thrombocytopenia, DTI NOT INDICATED o Serotonin release assay (SRA) should be sent to confirm ALL positive Elisa Guidelines for initiation of DTI 4T Score/risk for HIT Low Intermediate High ELISA Result Positive Negative Positive Negative Positive Negative Interpretation Evaluate OD value Low probability Intermediate prob, eval OD Low probability High probability Low probability Action Discuss options DTI not indicated Initiate DTI DTI not indicated Initiate DTI DTI not indicated unless thrombosis Initial treatment for HIT/HITTS: UKCMC Preferred agent based on indication Argatroban X Bivalirudin X X HIT / HITTS HIT w/ hepatic insufficiency HIT w/ renal X insufficiency HIT and PCI X HIT and CABG X HIT and VTE prophylaxis *Fondaparinux may be considered for treatment of subacute HIT. Fondiparinux* X Warfarin is not indicated as initial therapy and should be withheld until platelet count resolves. Lepirudin (Refludan®) is available for catheter instillation in patients with a diagnosis of HIT that require an anticoagulant to maintain port patency. Concentration used is 1mg/ml. Volume dispensed should equal the size of the port. Guidelines to Anticoagulation 126 Direct Thrombin Inhibitors (DTI): o Argatroban continuous IV infusion, initial rate of 2 mcg/kg/min o Requires dosage adjustment in patients with hepatic insufficiency, (Child-Pugh score >6) initial dose 0.5 mcg/kg/min, or critically ill patients, initial dose 0.5-1 mcg/kg/min. OR o Bivalirudin continuous IV infusion, initial rate of 0.2 mg/kg/hr o Requires dosage adjustment in patients with renal insufficiency (Clcr < 60 ml/min) or critically ill patients (see above) OR Factor Xa Inhibitor (hematology/oncology consultation required): o o o o Fondaparinux (Arixtra®), therapeutic weight based dosing (actual body weight) o <50 kg: 5 mg SC once daily o 50-100 kg: 7.5 mg SC once daily o >100 kg: 10 mg SC once daily Contraindicated in patients with a Clcr < 30 ml/min Assess patient for appropriateness of SC route and use of agent with long half-life Monitor CBC to assess platelet count and evidence of bleeding Routine labs/monitoring (direct thrombin inhibitors): Collect aPTT 2 hours after initiation of therapy Adjust direct thrombin inhibitor (DTI) dose according to nomogram to achieve a goal aPTT of 1.5-2.5x baseline, capping the aPTT target range at 80 seconds. o Collect aPTT 2 hours after initiation of infusion then every 4 hours. o After 2 consecutive aPTTs in the therapeutic range, collect aPTT daily o Monitor CBC daily to assess platelet count and evidence of bleeding This is not intended as a nurse-managed protocol o o Argatroban nomogram for HIT Bivalirudin nomogram for HIT aPTT based on goal range of 1.5-2.5x baseline aPTT based on goal range of 1.5-2.5x baseline (See above for initial rate) (See above for initial rate) aPTT Dosage Adjustment aPTT Dosage Adjustment <1.2x control increase rate by 40% <1.2x control increase rate by 40% 1.2-1.5x control increase rate by 20% 1.2-1.5x control increase rate by 20% 1.5 – 2.5x control No Change 1.5 – 2.5x control No Change 2.5 – 4x control 2.5 – 4x control (upper limit 80) (less than100) >4x control or aPTT > 100 decrease rate by 20% Hold for 1 hour, reassess aPTT; decrease rate by 50% once aPTT < 100 (upper limit 80) (less than100) >4x control or aPTT > 100 decrease rate by 20% Hold for 1 hour, reassess aPTT; decrease rate by 50% once aPTT < 100 Guidelines to Anticoagulation 127 Initiation of warfarin: o o o Should be held until platelet count returns to above 150000/μL Combined therapy of a DTI with warfarin should be continued for a minimum of 4 days and until the INR is in the desired range Argatroban can cause an elevation in INR beyond that seen with warfarin alone (reversal with vitamin K not necessary) o Collect baseline INR on argatroban prior to initiation of warfarin o Refer to argatroban to warfarin conversion guidelines Argatroban to warfarin conversion guidelines Patient with HIT on argatroban titrate to aPTT of 50 -80s ; send bas eline INR After patient is stabilized, check platelets; if within normal limits initiate warfarin Add warfarin therapy n ot exceed 5 mg; Continue at least 4 days of combinatio n therapy. Collect daily INR For INR is < 4, continue concomitant therapy and consider increasing warfarin dose For INR is > 4, stop argatroban infusion, and repeat INR with aPTT in 4-6 hours If INR and aPTT are in therapeutic range*, continue warfarin monotherapy * Supratherapeutic aPTT may indica te Argatroban effe cts on INR are still pre se nt. **F alsely elevate d. D o not gi ve Vi t K for inc re ased INR, only gi ve if blee ding, s/s hemorrhage, e tc. DTIs directly inte rfe re with PT /INR. If INR is below therapeutic range*, resume argatroban combination therapy Guidelines to Anticoagulation 128 Patients with HIT/HITTS Undergoing Percutaneous Coronary Intervention (PCI) Bivalirudin Dosing (CATH LAB ONLY) o o o o o Patient currently on infusion of bivalirudin o Initial bolus of bivalirudin 0.5 mg/kg, increase infusion rate to 1.75 mg/kg/hr Patient not currently on infusion of bivalirudin o Initial bolus of bivalirudin 0.75 mg/kg, initiate infusion rate of 1.75 mg/kg/hr Check activated clotting time (ACT) 5 minutes after bolus o If less than 225s, give additional 0.3 mg/kg bolus Continue infusion for up to 4 hours post-procedure If additional anticoagulation is necessary for bridging to warfarin or other indication, continue at a rate of 0.2 mg/kg/hr o Adjust according to nomogram to achieve goal aPTT of 1.5-2.5x baseline. Patients with HIT/HITTS Undergoing On-Pump Coronary Artery Bypass Surgery Bivalirudin: o o 1 mg/kg IV bolus, followed by 2.5 mg/kg/hr infusion for the duration of the procedure o In addition, bivalirudin 50 mg is added to the pump prime o Discontinue infusion 15 min prior to expected separation from CPB Goal to maintain ACT > 2.5-times baseline o Administer additional 0.1-0.5 mg/kg boluses if subtherapeutic * Infusion rate may need to be reduced by as much as 50% in patients with renal insufficiency (Clcr < 30 ml/min) or critically ill patients Patients with HIT/HITTS Undergoing Off-Pump Coronary Artery Bypass Surgery (OPCAB) Bivalirudin: o o o 0.75 mg/kg IV bolus, starting dose of 1.75 mg/kg/hr infusion for the duration of the procedure Goal to maintain ACT above 300 seconds Adjust infusion rate by 0.25 mg/kg/hr increments to maintain ACT within desired range * Reduce initial infusion rate by 50% in patients with renal insufficiency (Clcr < 30 ml/min) Patients required VTE prophylaxis with history of HIT or patients with resolved HIT/HITTS: Factor Xa Inhibitor: o o o Fondaparinux 2.5 mg SC daily Caution in patients with a CrCl < 30 ml/min Monitor CBC daily to assess platelet count and evidence of bleeding Guidelines to Anticoagulation 129 References (Warfarin) 1. Eighth ACCP Consensus Conference on Antithrombotic Therapy. Chest 2008;133;160s198s. 2. Hirsh J, Fuster V, Ansell J, Halperin J. American Heart Association/American College of Cardiology foundation guide to warfarin therapy. JACC 2003;41:1633-52. 3. Harrison L, Johnson M, Massicote MP, et al. Comparison of 5 mg and 10 mg loading doses of warfarin therapy. Ann Intern Med 1997;126:133-6. 4. Kovacs M, Rodger M, Anderson D, et al. Comparison of 10 mg and 5 mg warfarin initiation nomograms together with low-molecular-weight heparin for outpatient treatment of acute venous thromboembolism. Ann Intern Med 2003;138:714-719. 5. Dager W. Initiating warfarin therapy. Ann Pharmacother 2003;37:905-8. References (Heparin/Enoxaparin) 1. Eighth ACCP Consensus Conference on Antithrombotic Therapy. Chest 2008;133;141s159s. 2. Brill-Edwards P, Ginsberg JS, Hirsh J et al. Establishing a therapeutic range for heparin. Ann Intern Med. 1993; 119:104-109. 3. Weitz JI. Low-molecular-weight heparins. NEJM 1997; 337(10):688-98. 4. Fareed J, Hoppensteadt D, Sheikh T et al. Pharmacodynamic and pharmacokinetic properties of enoxaparin. Clin Pharmacokinet 2003; 42(12):1043-57. 5. Chow SL, Zammit K, West K, et al. Correlation of antifactor Xa concentrations with renal function in patients on enoxaparin. J Clin Pharmacol 2003; 43:586-90. 6. Kruse MW, Lee JJ. Retrospective evaluation of a pharmacokinetic program for adjusting enoxaparin in renal impairment. Am Heart J 2004; 148:582-9. 7. Sanderink G, Liboux AL, Miro A. Pharmacokinetics and pharmacodynamics of enoxaprin in obese volunteers. Clin Pharmacol Ther 2002;72:308-18. References (Heparin Induced Thrombocytopenia) 1. Eighth ACCP Consensus Conference on Antithrombotic Therapy. Chest 2008;133;340s380s. 2. Warkentin TE. New approaches to the diagnosis of heparin-induced thrombocytopenia. Chest 2005;127(2 Suppl):35S-45S. 3. Kelton JG. The pathophysiology of heparin induced thrombocytopenia: biological basis for treatment. Chest 2005:127(2 Suppl):9S-20S. 4. Dyke CM, Smedira NG, Speiss BD et al. A comparison of bivalirudin to heparin with protamine reversal in patients undergoing cardiac surgery with cardiopulmonary bypass: EVOLUTION-ON. J Thorac Cardiovasc Surg 2006; 131:533-9 5. Smeira NG, Dyke CM, Aronson S, et al. Anticoagulation with bivalirudin for off-pump coronary artery bypass grafting: EVOLUTION-OFF. J Thorac Cardiovasc Surg 2006; 131:686-92. Additional references available upon request.


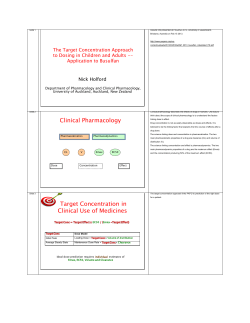

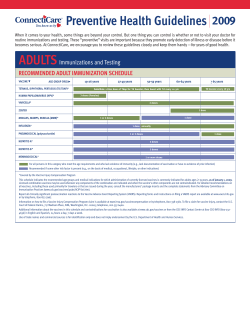


© Copyright 2026