
What is meta-analysis? Volume 1, number 8 Published by Hayward Medical Communications
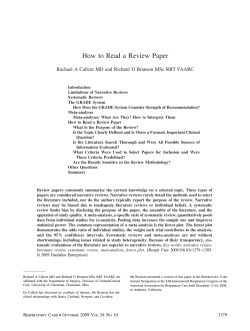
Volume 1, number 8
What is
meta-analysis?
Published by Hayward Medical Communications
PhD HonMFPHM
● Meta-analysis is a statistical technique for combining
the findings from independent studies.
Lecturer in Health
Care Management,
University of
St Andrews
● Meta-analysis is most often used to assess the clinical
effectiveness of healthcare interventions; it does this by
combining data from two or more randomised control trials.
Huw T O Davies
and
Iain K Crombie
PhD HonMFPHM
Reader in
Epidemiology,
University of
Dundee
● Meta-analysis of trials provides a precise estimate of
treatment effect, giving due weight to the size of the
different studies included.
● The validity of the meta-analysis depends on the quality of
the systematic review on which it is based.
● Good meta-analyses aim for complete coverage of all
relevant studies, look for the presence of heterogeneity,
and explore the robustness of the main findings using
sensitivity analysis.
www.evidence-based-medicine.co.uk
1
What is
meta-analysis?
What is meta-analysis?
Trials, systematic reviews
and meta-analyses
In some therapeutic areas (especially drugs
and the treatment of cancer and heart disease)
there exist numerous trials attempting to
answer similar questions about clinical
effectiveness, for example: Does this
treatment confer significant benefits
when used for this group of patients?
The difficulty for clinicians and managers
lies in making sense of a range of disparate
literature spread over many journals,
generated over many years and frequently
carried out in diverse settings. The task is
made no easier when, as often happens, many
individual trials show great uncertainty
(because of small size) or even conflict in their
estimation of net effect (some studies showing
harm while others show benefit).
Systematic reviews provide a rational
synthesis of the research base and offer clear
advantages to healthcare decision-makers.1
They attempt to overcome the deficiencies of
narrative reviews and polemics by applying
the same rigorous standards to secondary
research (where the unit of study is other
research studies) as should be applied to
primary research (original empirical study).
Good systematic reviews take great care to
find all the relevant studies (published and
unpublished), assess each study for the
quality of its design and execution, and
combine the findings from individual studies
in an unbiased manner. In this way they aim
to present a balanced and impartial summary
of the existing research evidence. Frequently,
such systematic reviews provide a quantitative
estimate of net benefit aggregated over all the
included studies. Such an approach is
termed a meta-analysis.
Benefits of meta-analyses
Meta-analysis offers a rational and helpful
way of dealing with a number of practical
difficulties that beset anyone trying to make
sense of effectiveness research.
2
1. A clearer picture
Individual clinical trials may mean little,
especially when they are small or mediumsized. Small studies tend to be inconclusive –
they may show no statistical difference
between the treated and control groups,
but on the other hand they may be unable
to exclude the possibility of there being a
sizeable effect (that is, they have low power).
Aggregating studies in a systematic and
unbiased way may allow a clearer picture
to emerge. The question we are asking is
whether, on average, a particular treatment
confers significant benefits when used for
specific patient groups. Meta-analysis allows
this aggregate picture to emerge.
2. Overcoming bias
The danger of unsystematic (or narrative)
reviews is that there is plenty of scope for
bias. Certain (perhaps favourable) reports
may be preferred over those that show no
benefit. Informal synthesis may be tainted
by the prior beliefs of the reviewer.
Meta-analysis carried out on a rigorous
systematic review can overcome these
dangers – offering an unbiased synthesis
of the empirical data.
3. Precision
The precision with which the size of any
effect can be estimated depends on (among
other things) the number of patients
studied. Meta-analyses that draw on patients
studied in many trials thus have more power
to detect small but clinically significant
effects, and can give more precise estimates
of the size of any effects uncovered. This
may be especially important when an
investigator is looking for beneficial (or
deleterious) effects in specific subgroups.
Individual studies may contain too few
patients in the subgroup of interest to show
anything, but a clearer picture may be
presented by the systematic aggregation of
data from many individual studies (there are,
however, some problems with this approach
which are discussed later, see page 4).
What is
meta-analysis?
4. Transparency
It is not simply the case that meta-analyses
can always exclude bias better than other
forms of review. Their advantage also lies in
the openness with which good meta-analyses
reveal all the decisions that have been taken
throughout the process of achieving the
final aggregate effect sizes. Thus, good
meta-analyses should allow readers to
determine for themselves the reasonableness
of the decisions taken and their likely impact
on the final estimate of effect size.
Requirements for meta-analysis
The main requirement for a worthwhile
meta-analysis is first and foremost a
well-executed systematic review.1 However
competent the meta-analysis, if the original
review was partial, flawed or otherwise
unsystematic, then the meta-analysis may
provide a precise quantitative estimate that
is simply wrong. The main requirements of
systematic review are easier to state than to
execute: a complete, unbiased collection of
original, high-quality studies that examine
the same therapeutic question. Guidance on
avoiding the pitfalls of systematic reviews is
readily available.2–4
Figure 1. Presentation
of the findings from a
meta-analysis
(Reproduced with permission
from Antman et al.5)
Overall
20,138
0.1
l
0.2
l
0.5
1
l
2
l
l
5
l
10
The inelegantly named ‘blobbogram’ displays
the findings from each individual study as a
blob or square (the measured effect), with a
horizontal line (usually the 95% confidence
interval) around the main finding. The size
of the blob or square (sometimes just a small
vertical line) may vary to reflect the amount
of information in that individual study; the
length of the horizontal line represents the
uncertainty of the estimate of the treatment
effect for that study. The aggregate effect size
for certain subgroupings and the overall effect
size are also usually displayed in the same
figure. An example is shown in Figure 1.5
2. Odds ratios
The main measure of effect usually used in
meta-analyses is the odds ratio (OR). This
somewhat confusing measure is used because
77
307
469
3,522
4,242
4,353
6,237
7,340
11,177
12,633
13,193
13,777
14,078
14,607
16,348
18,743
20,138
●
●
●
●
●
●
●
●
●
●
●
●
●
●
●
●
Favours treatment
1. Blobbograms
l
l
●
●
The usual way of displaying data from a
meta-analysis is by a pictorial representation
(sometimes known as a blobbogram), and a
summary measure of effect size known as an
odds ratio.
Cumulative Mantel-Haenszel method
odds ratio (log scale)
Number
1
of patients 0.5
Individual RCT and overall meta-analysis
results odds ratio (log scale)
Number
Year of patients
77
1972
230
1974
162
1974
3,053
1977
720
1980
111
1980
1,884
1981
1,103
1982
3,837
1982
1,456
1982
560
1982
584
1983
301
1983
529
1983
1,741
1984
2,395
1987
1,395
1988
Interpreting the
main findings
l
2
l
●
●
Z=2.29 P<0.05
●
●
●
●
Z=3.99 P<0.0001
●
●
Z=4.78 P<0.00001
●
●
●
●
●
●
●
●
Z=4.47 P<.00001
Z=4.47 P<0.00001
Favours treatment
Favours control
3
Favours control
What is
meta-analysis?
it offers some technical advantages when
combining data from different studies.
For most practical purposes, the odds
ratio can be interpreted as though it were
a relative risk.6 That is, an odds ratio of 2
implies that the defined outcome happens
about twice as often in the intervention
group as in the control group; an odds ratio
of 0.5 implies around a 50% reduction in the
defined event in the treated group compared
with the controls.
Interpreting an odds ratio in this way (as
an increase or decrease in risk) will always
tend to overestimate the effect of treatment.
However, the level of this overstatement is
almost always quite small, especially when
the event rate in the intervention and control
groups is less than 30%.6
Flaws in meta-analyses
As with all research techniques, there may be
flaws in the conduct and interpretation of
meta-analyses. Although meta-analyses of
treatment effect collate data from randomised
studies, they are themselves essentially
observational studies of evidence.7 Thus, they
are subject to many potential biases that may
undermine confidence in their findings.
1. Location and selection of studies
One widely quoted definition of
meta-analysis is: ‘a statistical analysis
which combines or integrates the results
of several independent clinical trials
considered by the analyst to be
“combinable”.’8 The key difficulty lies
in deciding which sets of studies are
‘combinable’. A meta-analysis is only as good
as the set of studies on which it is based.
There are many ways in which the studies
included may be incomplete or biased.
Individual studies that report positive
findings (that is, treatment benefit) are more
likely to be published than those that find
no effect of treatment. Further, they are more
likely to be published in English-language
journals, more likely to be published in
journals that are indexed in bibliographic
databases, more prone to multiple
publication, and more likely to be cited by
other papers thereafter.9 Thus, failure to
4
find all relevant studies may produce
misleading meta-analyses.
Once all relevant studies have been
identified, decisions must be taken about
which studies are sufficiently well conducted
to be worth including. This process may
again introduce bias, so good meta-analyses
will use explicit and objective criteria
for inclusion or rejection of studies on
quality grounds.2
One simple way of assessing the likely
presence of selection bias is to examine a
funnel plot.10 Funnel plots display the
studies included in the meta-analysis in a plot
of effect size against sample size. As smaller
studies have more chance variability than
larger studies, the expected picture is one of
a symmetrical inverted funnel (see Figure 2,
opposite).11 If the plot is asymmetrical, this
helps to identify that the meta-analysis may
have missed some trials – usually smaller
studies showing no effect.
Another approach to assessing the possible
impact of publication bias is to work out
how many studies of a given size with null
or negative findings (ie, studies with no
apparent effect of treatment, or those
showing evidence of harm) would need to be
included to counterbalance any positive effect
found in the meta-analysis. This approach at
least helps to make explicit the necessary size
of any bias needed to invalidate the main
findings. The interest then lies in whether it
is likely that the calculated number of studies
could have been missed. If the amount
of missing data needed to invalidate the
meta-analysis is large, and the initial literature
search was thorough, then the main findings
are less likely to be subject to selection bias.
2. Heterogeneity
A major concern about meta-analyses is the
extent to which they mix studies different in
kind (heterogeneity). Clearly, to get a precise
answer to a specific question it makes sense
to collate only studies exactly matching that
question. Unfortunately, all studies differ on
a number of different dimensions:
● The patient groups studied will often
differ. In some instances this will be obvious,
as in studies carried out on patients with
different severities of disease. In other cases it
What is
meta-analysis?
Streptokinase
Intravenous magnesium
105-
105-
104-
Number of patients
Number of patients
ISIS-4
Meta-analysis
●
103●
●
102-
●
●
●
●●
●
●
●● ●
●
●
104-
ISIS-2
GISSI-I
Meta-analysis
●
103-
●● ●
● ●●
●
●
●
●
●
●●
●
●
102● ●
10-l
0.1
Figure 2. Funnel plots
used to identify possible
missing studies
l
1
Odds ratio
l
10
10-l
0.1
●
●
l
1
Odds ratio
l
10
Points indicate odds ratios from small and medium sized trials, diamonds indicate combined odds
ratios with 95% confidence intervals from meta-analysis of these trials, and squares indicate
odds ratios with 95% confidence intervals from mega trials
(Reproduced with permission from
Egger et al.11)
will be less clear how the patient groups differ
– for example, when studies are included from
different geographical areas.
● The interventions applied may differ
between individual studies. A meta-analysis
might include a mixture of interventions
rather than a single pure treatment.
Meta-analyses have been carried out on
single drugs (for example, magnesium or
streptokinase), on classes of drugs (for
example, cholesterol-lowering agents) or even
on broad packages of care such as ‘stroke
rehabilitation units’.
● The primary outcome examined may
differ between studies, yet a meta-analysis seeks
to aggregate data to some common endpoint.
● All studies are carried out in distinct
settings, which may differ markedly
between the studies included (for example,
meta-analyses frequently combine data from
many different countries). Within these
diverse settings there may be many other
factors (for example, concomitant care) that
contribute to the success or failure of the
intervention under test.
This mixing of sometimes diverse studies
varies between meta-analyses. Some are quite
tightly drawn – for example, a meta-analysis
examining the role of aspirin in preventing
death after myocardial infarction. Others
involve more of an assortment – for example,
5
a meta-analysis of ‘nicotine replacement
therapy’ in smoking cessation included gum,
patches and nasal sprays used on patients
ranging from those well motivated to quit
to those identified during opportunistic
screening.12 This mixing of diverse studies can
make for a strange fruit salad: mixing apples
and oranges may seem reasonable enough,
but when sprouts, turnips or even an old sock
are added, it can cast doubt on the meaning
of any aggregate estimates.
Heterogeneity of studies is an unavoidable
fact of meta-analysis. The question is not
whether it is present but whether its extent
seriously undermines the conclusions being
drawn. For example, meta-analyses have
examined the role of low-molecular-weight
heparins (LMWHs) as postoperative
thromboprophylactic agents,13,14 and in
the treatment of established deep venous
thrombosis.15 While these reviews largely
demonstrate the usefulness of this class of
drugs, some individual meta-analyses have
been less conclusive.13 One possibility is that
not all LMWHs are the same,15,16 and that
the beneficial effects of the most efficacious
compounds are being diluted by inappropriate
heterogeneous aggregation. If this is the case,
different LMWHs should be considered as
distinct chemical entities and meta-analyses
should be designed accordingly.
What is
meta-analysis?
Thus, consideration of heterogeneity
has important implications for
the design and interpretation of
meta-analyses, even in apparently
focused clinical areas.
Graphical presentation of the findings
from individual studies, perhaps grouped by
important variables (eg, patient, intervention
or setting characteristics), may at least help to
make such heterogeneity explicit. Although
statistical tests to detect heterogeneity do
exist (and are often quoted in published
work), in fact they lack power to detect
anything but substantial differences. Simple
‘eyeballing’ of study diversity and the
application of common (clinical) sense may
be a better guide.
3. Loss of information on
important outcomes
In order to have some ‘common currency’
of outcome on which to combine data from
different studies, meta-analyses may have to
discard some data. Typically, meta-analyses
are concerned with dichotomous outcomes
(for example, alive/dead; cured/still ill;
recurrence/non-recurrence of disease).
In order to fit this framework, data from
individual studies may have to be discarded,
resulting in a potential loss of information.
For example, meta-analyses of pain relief
typically use 50% reduction in pain as the
dichotomous outcome – thus, the detail of
exactly how much pain was relieved is lost in
the meta-analysis, patients being merely
divided into ‘successes’ and ‘failures’.
4. Inappropriate subgroup analyses
Exploring subgroup findings is a common
feature of meta-analyses, sometimes as a way
of explaining a failure to find any overall
effect. A subset of studies may be examined
in isolation (perhaps those with high
methodological quality) or, if individual
patient data have been used in conducting
the meta-analysis, subgroups of patients
(perhaps the elderly, or those with severe
disease) may be analysed separately. While
this approach may offer insights that can be
tested in further (prospective, randomised)
studies, caution should be exercised in
interpretation. Despite the underlying studies
6
being randomised, this randomisation and
the subsequent likely balance between treated
and control groups does not extend to
subgroups defined after the fact. Thus, there
is great potential for confounding and
misleading findings.17 Hunting around for
subgroup effects should be seen for what it is
– exploration and not explanation.
5. Inadequate sensitivity analyses
Because of the many ways in which decisions
taken about selection, inclusion and
aggregation of data may affect the main
findings, it is usual for meta-analysts to
carry out some sensitivity analysis. This
explores the ways in which the main findings
are changed by varying the approach to
aggregation. A good sensitivity analysis will
explore, among other things, the effect of
excluding various categories of studies – for
example, unpublished studies or those of poor
quality. It may also examine how consistent
the results are across various subgroups
(perhaps defined by patient group, type of
intervention or setting). In meta-analyses
without sensitivity analyses the reader has to
make guesses about the likely impact of these
important factors on the key findings.
6. Conflict with new
experimental data
Meta-analyses seek new knowledge from
existing data. One test of the validity of this
new knowledge is to compare the results from
meta-analyses with subsequent findings from
large-scale, well-conducted, randomised
control trials (so-called ‘mega trials’). The
results of such comparisons have, so far, been
mixed – good agreement in the majority of
cases but some discrepancies in others.18,19 For
example, one such exercise led to publication
of a paper subtitled ‘Lessons from an
“effective, safe, simple intervention” that
wasn’t’ (use of intravenous magnesium after
heart attacks).11
With the benefit of hindsight, the flaws
in meta-analyses that have been subsequently
contradicted by data from mega trials can
often be uncovered. Such post mortems
have led to a number of methodological
improvements (such as funnel plots) and a
greater understanding of the pitfalls
What is
meta-analysis?
outlined above. Nonetheless, they underline
the need for caution in interpretation
because, as one reviewer of meta-analyses
commented: ‘we never know as much as
we think we know’.19
Conclusion
Meta-analyses offer a more systematic and
quantitative approach to reviewing important
therapeutic questions. Nonetheless, pitfalls
abound in the execution of meta-analyses
and they are fundamentally limited by the
quality of the underlying studies (the
so-called GIGO principle of ‘garbage in,
garbage out’). For healthcare managers and
clinicians, careful reviewing of published
meta-analyses and a balanced assessment
of their deficiencies is likely to become an
increasingly important way of resolving
therapeutic uncertainty.
Further information
The authors are indebted to the excellent
series on meta-analysis published in the British
Medical Journal.7,9,17,21–23 The interested reader
will find that these papers offer much more
detail than can be contained in this short
briefing document.
References
1. Davies HTO, Crombie IK. What is a Systematic Review? Newmarket: Hayward Medical Communications, 1998.
2. Cook DJ, Sackett DL, Spitzer WO. Methodologic guidelines for systematic reviews of randomized control trials in health care
from the Potsdam consultation on meta-analysis. J Clin Epidemiol 1995; 48: 167–171.
3. Milne R, Chambers L. Assessing the scientific quality of review articles. J Epidemiol Community Health 1993; 47: 169–170.
4. Oxman AD, Cook DC, Guyatt GH. Users’ guides to the medical literature: VI. How to use an overview. JAMA 1994;
272: 1367–1371.
5. Antman EM, Lau J, Kupelnick B, Chalmers TC. A comparison of results of meta-analysis of randomized control trials and
recommendations of clinical experts. JAMA 1992; 268: 240–248.
6. Davies HTO, Crombie IK, Tavakoli M. When can odds ratios mislead? BMJ 1998; 316: 989–991.
7. Egger M, Davey Smith G, Phillips AN. Meta-analysis: principles and procedures. BMJ 1997; 315: 1533–1537.
8. Huque MF. Experiences with meta-analysis in NDA submissions. Proceedings of the Biopharmaceutical Section of the American
Statistical Association 1988; 2: 28–33.
9. Egger M, Davey Smith G. Meta-analysis: Bias in location and selection of studies. BMJ 1998; 316: 61–66.
10. Egger M, Davey Smith G, Schneider M, Minder C. Bias in meta-analysis detected by a simple graphical test. BMJ 1997;
315: 629–634.
11. Egger M, Davey-Smith G. Misleading meta-analysis: Lessons from “an effective, safe, simple” intervention that wasn’t. BMJ
1995; 310: 752–754.
12. Silagy C, Mant D, Fowler G, Lodge M. Meta-analysis on efficacy of nicotine replacement therapies in smoking cessation.
Lancet 1994; 343: 139–142.
13. Nurmohamed MT, Rosendaal FR, Buller HR et al. Low-molecular-weight heparin versus standard heparin in general and
orthopaedic surgery: a meta-analysis. Lancet 1992; 340: 152–156.
14. Leizorovicz A, Haugh MC, Chapuis F-R, Samama MM, Boissel J-P. Low-molecular-weight heparin in prevention of
perioperative thrombosis. BMJ 1992; 305: 913–920.
15. Lensing AWA, Prins MH, Davidson BL, Hirsh J. Treatment of deep venous thrombosis with low-molecular-weight heparins.
Arch Intern Med 1995; 155: 601–607.
16. Samama MM, Bara L, Gouin-Thibault I. New data on the pharmacology of heparin and low-molecular-weight heparins. Drugs
1996; 52(Suppl 7): 8–15.
17. Egger M, Davey Smith G, Phillips AN. Meta-analysis: beyond the grand mean? BMJ 1997; 315: 1610–1614.
18. LeLorier J, Gregoire G, Benhaddad A, Lapierre J, Derderian F. Discrepancies between meta-analyses and subsequent large
randomized controlled trials. N Engl J Med 1997; 337: 536–542.
19. Villar J, Carroli G, Belizan JM. Predictive ability of meta-analyses of randomised controlled trials. Lancet 1995; 345: 772–776.
20. Bailar III JC. The promise and problems of meta-analysis. N Engl J Med 1997; 337: 559–561.
21. Egger M, Davey Smith G. Meta-analysis: potentials and promise. BMJ 1997; 315: 1371–1374.
22. Egger M, Schneider M, Davey Smith G. Spurious precision? Meta-analysis of observational studies. BMJ 1998; 316: 140–144.
23. Davey Smith G, Egger M. Meta-analysis: unresolved issues and future developments. BMJ 1998; 316: 221–225.
7
What is… ? series
The implementation of evidence-based practice is increasingly vital
for healthcare professionals. The What is...? series explains the key
concepts in a clear, concise and accessible format.
The short, practical bulletins provide a fresh slant on evidence-based
medicine and the ideas behind it. All the publications in the series
(listed below) have been written by respected figures from various
NHS backgrounds.
The ongoing NHS reforms have resulted in greater emphasis on value
for money and fuelled the growth of health economics and its related
terminology. This series provides invaluable help for managers at all
levels in their increasing involvement in policy discussions on, and
analysis of, the cost-effectiveness of clinicial practice.
■
■
■
■
■
■
■
■
■
■
■
■
■
■
■
■
■
■
■
■
■
What is evidence-based medicine?
What is an NNT?
What is cost-effectiveness?
What are health utilities?
What is a systematic review?
What is a QALY?
Implementing NNTs
What is meta-analysis?
What is quality of life?
What is a Cox model?
What makes a good clinical guideline?
What is clinical governance?
Implementing QALYs
What is critical appraisal?
What is an integrated care pathway?
What are confidence intervals?
What is NICE?
What is clinical audit?
What is PBMA?
Implementing PBMA
What is health economics?
www.evidence-based-medicine.co.uk
© Hayward Medical Communications, a division of Hayward Group plc
Published by Hayward Medical
Communications, a division of
Hayward Group plc.
www.hayward.co.uk
‘What is ...’ is a Hayward
Group plc publication.
Copyright © 2003 Hayward
Group plc.
All rights reserved.
This publication, along with
the others in the series, is
available on the internet at
www.evidence-based-medicine.co.uk
The data, opinions and statements
appearing in the article(s) herein
are those of the contributor(s)
concerned. Accordingly, the
sponsor and publisher, and their
respective employees, officers
and agents, accept no liability
for the consequences of any such
inaccurate or misleading data,
opinion or statement.


© Copyright 2026