
Document 237373
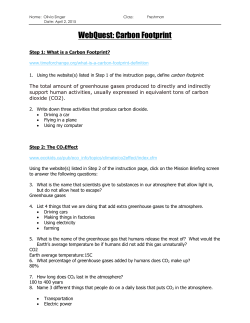
CLIMATE CHANGE: Connections and Solutions
High School
Copyright © 2013 Facing the Future
Commercial reproduction of Facing the Future materials is prohibited without prior written permission.
Materials may be reproduced and used for nonprofit educational purposes, providing the user contacts
Facing the Future prior to reproduction, and appropriately acknowledges Facing the Future as the writer and
developer of said materials.
Facing the Future is a nonprofit organization whose mission is to create tools for educators that equip
and motivate students to develop critical thinking skills, build global awareness, and engage in positive
solutions for a sustainable future. For more information and to order copies of this guide,
visit our website or contact us at:
FACING THE FUTURE
1904 Third Avenue, Suite 510
Seattle, WA 98101
(206) 264-1503
www.facingthefuture.org
Climate Change:
Connections and Solutions
Two-Week Unit for High School
(Grades 9-12)
This unit was developed with generous funding from the Hewlett-Packard Company.
Acknowledgements
Curriculum Development
Laura Skelton, M.S.
Cecilia Lund, M.A.
Copy Editing
Sandra Pederson
Design and Layout
Mike F Leonen
Research and Editing
Kim Rakow Bernier, M.P.A.
David Wilton, M.Ed.
Sheeba Jacob, M.Ed.
Danica Hendrickson, M.Ed.
Danielle Shaw, J.D.
Stacey Hammond, M.Ed.
Field Testing
Thank you to the following teachers and their students for field testing the curriculum:
Thomas R. Allison, Science Facilitator, Marion County Marine Institute
Antony Blaikie, Science Teacher
Angela Brener-Suarez, Social Studies Teacher, Cesar Chavez School for Social Change
Nancy Butler, Science Teacher, Harbour View High School
Alexandra Chauran, Science Teacher, Kent Phoenix Academy
Brenda Cloyed, Counselor/Teacher, Moravia Community School
Elise Cooksley, Science Teacher, Two Rivers School
Margy Dieter, Anthropology Teacher, Marshall High School
Bill DeMartini, Language Arts and Social Studies Teacher, Tyee Middle School
Teresa Eastburn, UCAR/NCAR Public Visitor and School Programs Coordinator, National Center for
Atmospheric Research
Mary Margaret Elmayan, Science Teacher and AMGEN-NSTA Teaching Fellow, Zebulon Gifted and
Talented Magnet Middle School
Emily Flaherty, Science Teacher, Kennebunk High School
Jan Hertel, Geography Teacher and Department Chair, Hastings Middle School
Mike Johnston, Global Issues and Environmental Education Teacher, American School of Doha
Emily LeLacheur, Science Teacher, Marymount International School
Christine Loeffler, Science Teacher, Laguna-Acoma High School
Steven Marks, Social Science Teacher, Marion County Marine Institute
Irene Martine, Science Teacher, Spacecoast Jr/Sr High
Bray McDonald, Educator, Tennessee Aquarium
Kate Perry, Science Teacher, DCMO Board of Cooperative Educational Services
Suzy Schulz, Pathfinder Educator, Lancaster County Youth Services Center
Kathryn Kurtz Smith, Science Teacher, Polaris K-12
Debra Smrchek, Science Chairperson, Academy of the Holy Cross
Additional Contributions
Thank you to the following individuals for reviewing, editing, and contributing to the curriculum:
Char Alkire, Science Teacher Supervisor, University of Washington
Dave Aplin, Bering Sea Program Officer, World Wildlife Fund
Miriam Bertram, Program Manager, Program on Climate Change, University of Washington
Pierre Delforge, Energy and Climate Program Manager, Hewlett-Packard Corporate
Environmental Strategies
Ava Erickson, Science and Math Teacher, Seattle Girls School
Charles C. Eriksen, Professor, School of Oceanography, University of Washington
Kate Graves, Southeast Climate Program Officer, World Wildlife Fund
Scott Jamieson, Teacher, Lakeside School
Theressa L. Lenear, Director of Diversity and Inclusion, Child Care Resources
Hanna Poffenbarger, Student Teacher, University of Maryland
LuAnne Thompson, Associate Professor, School of Oceanography, University of Washington
Deanna Ward, Corporate Philanthropy, Hewlett-Packard Company
Facing the Future Advisory Council
Char Alkire, Science Teacher Supervisor, University of Washington
Jim Bennett, Vice President, Cinematch, Netflix Inc.
John de Graaf, PBS Producer and Author, Affluenza
Dee Dickinson, Founder and CEO, New Horizons for Learning
Wendy Ewbank, Teacher, Seattle Girls School
Scott Jamieson, Teacher, Lakeside School
Marie Marrs, Teacher, Eagle Harbor High School
Kate McPherson, Director, Project Service Leadership
Robin Pasquarella, Former Director, Alliance for Education
Abby Ruskey, Executive Director, Environmental Education Association of Washington
Dr. Debra Sullivan, Dean, Praxis Institute for Early Childhood Education
Dr. Anand Yang, Director, Jackson School of International Studies, University of Washington
What Is Climate
and How Is It
Photo by Jesse Stanley
Changing?
Student
Reading
1
Exit Glacier in Alaska has receded significantly in
the last century. Photo by Jesse Stanley
FACING THE FUTURE
You have probably seen or heard
the term climate change in numerous places, from
magazines to movies, at school, and at home. Everyone is talking about it. But what exactly is climate change, and how does it relate to our lives?
Climate change refers a significant shift in Earth’s
overall climate over an extended period of time.
“
W H AT I S C L I M AT E A N D H O W I S I T C H A N G I N G ?
97
Eating foods that are grown closer to home
can reduce greenhouse gas emissions from
transporting food long distances.
Climate is average weather (including
temperature, precipitation, and wind) over
a period of time (from months to millions
of years).1 When we examine weather
over many years, climate patterns emerge.
Weather events not only make up climate,
but they can also be affected by changes to
the climate.
Earth’s Greenhouse Effect
To study climate change, we need to
understand Earth’s greenhouse effect. The
greenhouse effect is an important phenomenon that makes conditions on Earth suitable for life; without it Earth would be a
much colder planet. Some of the sun’s radiation that reaches Earth’s surface is absorbed
by the earth, but some of it is reflected back
into space by clouds, air particles, snow, ice,
and deserts. When reflected back, the radiation changes into infrared radiation (or heat).
Certain gases in Earth’s atmosphere act like
a blanket to retain (and reflect back down to
the earth) much of this infrared radiation,
making surface temperatures on Earth about
33°C (57° F) warmer than they would be
otherwise. Although the natural greenhouse
effect increases the earth’s temperature from
0°F (–18°C) to 57°F (14°C), human activities
such as fossil fuel combustion and deforestation have increased the effect.2
Some greenhouse gases occur naturally,
and some are human-made. Water vapor
is a greenhouse gas that occurs naturally,
as a result of Earth’s water cycle. Other
greenhouse gases such as chlorofluorocarbons (CFCs) are manufactured entirely by
humans.
Many greenhouse gases that occur naturally are also released through human activities. For example, carbon dioxide (CO2),
nitrous oxide (N2O), and methane (CH4) are
all cycled through Earth’s atmosphere during processes that occur in nature. Carbon
dioxide is released by all living things, nitrous
oxide is released by organisms in the soil, and
methane is a natural byproduct of decomposition. Human activities such as burning
fossil fuels (when we drive gasoline-powered
cars, for example) increase the amounts of
these gases in Earth’s atmosphere, affecting
the balance of natural cycles.
CLIMATE CHANGE
98
The Greenhouse Effect
Solar radiation
passes through the
clear atmosphere
Some of the infrared radiaton
passes through the atmosphere, and
Some solar radiation some is absorbed and re-emitted
in all directions by greenhouse gas
is reflected by
the earth and the molecules. The effect of this is to
warm the earth’s surface and the lower
atmosphere
atmosphere.
Most radiation is absorbed by the
earth’s surface and warms it
Infrared radiation is emitted
from the earth’s surface
Source: United States Environmental Protection Agency
Scientists who study climate change
often focus on carbon dioxide because the
concentration of CO2 in the atmosphere is
greater than any other greenhouse gas, excluding water vapor. CO2 accounts for over
84% of global greenhouse gas emissions
from human activities.CO2 can remain in
the atmosphere for 50- 200 years.3
CO2 levels in the atmosphere have
continued to rise since 1750. Because
this increase coincides with industrial
activities (manufacturing, processing, and
transporting goods), many experts attribute
the increased CO2 to humans. The Intergovernmental Panel on Climate Change
estimates that CO2 levels have increased
by about 35% during the industrial era,
primarily due to deforestation and consumption of fossil fuels.4 The rate of
increase is also changing. For example,
CO2 levels increased 80% between 1970
and 2004. Between 1990 and 2011, CO2
emissions rose by 10% in the United
States primarily due to fossil fuels.
FACING THE FUTURE
Carbon Sources and Sinks
Carbon is one of the two elements that
make up carbon dioxide (the other is oxygen). Many processes are carbon sources
that add CO2 to the atmosphere by emitting
more carbon to the atmosphere than they
absorb. Carbon sources include burning
fossil fuels (coal, petroleum oil, natural gas),
deforestation, and agricultural processes,
such as tilling soil and raising livestock.
Many industrial/manufacturing processes,
such as making cement, steel, and agricultural fertilizers, are also carbon sources.5
Certain places called carbon sinks can
retain carbon for a long time, keeping it
out of the atmosphere. They tend to absorb
more CO2 than they emit. Forests, oceans,
and soil are currently the main carbon sinks
on Earth.
We can alter the ability of carbon sinks
to retain carbon. For example, when we
remove trees from a forest or till soil, the
carbon they have been holding is released
W H AT I S C L I M AT E A N D H O W I S I T C H A N G I N G ?
into the atmosphere as CO2. Fossil fuels
can also be considered carbon sinks because
carbon is locked inside them for thousands
of years. It is only when we burn them for
energy that they release CO2.
Measuring Carbon Dioxide and
Temperature Trends
Historic levels of atmospheric CO2 can
be measured by analyzing ice cores. Tiny
gas bubbles trapped deep in the ice provide
evidence of many gases present in Earth’s
atmosphere thousands of years ago. One dataset, from ice cores at the Russian Vostok
research station in East Antarctica, has
allowed scientists to determine CO2 levels
from over 400,000 years ago.6
A much shorter and more recent dataset
has been obtained in a different manner,
by sampling air from atop a volcano. The
world’s most complete and continuous CO2
record has been collected since the 1950s
at an observatory near the summit of the
Mauna Loa Volcano in the U.S. state of
Hawaii.7 Because this volcano is far from
many human activities (a carbon source)
and vegetation (a carbon sink), it is an ideal
site for accurately measuring CO2.
Carbon dioxide trends from the Vostok
ice cores show that atmospheric CO2 concentrations have risen faster during the past
two centuries than at any time in the preceding 400,000 years.8 The ice cores reveal
a strong link between CO2 concentrations
and temperature changes on Earth. CO2
concentrations measured at Mauna Loa also
indicate a steep increase over the past 50
years.
99
Data Source C02:
ftp://cdiac.ornl.
gov/pub/trends/
co2/vostok.
icecore.co2
Data Source
Temp: http://
cdiac.esd.ornl.
gov/ftp/trends/
temp/vostok/
vostok.1999.
temp.dat
Graphic by
Michael Ernst,
The Woods Hole
Research Center
For the past 27 years, global land and
ocean temperatures rose above average.
According to the record, 2001 to 2012
marked the top 13 warmest years. 2012 was
documented as the ninth warmest year since
1850, when record keeping began.9 Warming air and ocean temperatures have caused
snow and ice to melt. Melting glaciers and
CLIMATE CHANGE
The Spirit Lake
Community
School District in
Iowa powers its
buildings by using
wind turbines.
Photo from Spirit
Lake Community
School District
snow have led to sea level rise, resulting in
decreased salinity of oceans. Oceans have
become more acidic due to increased CO2
levels. Wind and precipitation patterns have
changed in many regions during the past
century, resulting in increased rainfall in
some places and droughts in others.10
Where Do We Fit In?
The exact amount of climate change that
can be attributed to human actions is not
clear. However, it is clear that increasing
greenhouse gas emissions result in warmer
global temperatures and that human activities emit greenhouse gases. While climate
change may not be due solely to human
activities, it is very likely that the changes
observed during the past 50 years are not
due to natural causes alone.11
Is it too late to become part of the solution? No—we already have the knowledge
FACING THE FUTURE
and technology to start making positive
changes. For example, a change in lifestyle
(consuming fewer resources, conserving energy, reducing travel, etc.) can help mitigate
climate change.12 Switching from fossil
fuels to sources of clean, renewable energy
sources like wind and solar can reduce
greenhouse gas emissions. Even how we eat
can make a difference. Eating foods that
are grown closer to home can reduce greenhouse gas emissions from transporting food
long distances.13
Schools, organizations, businesses, cities,
and governments around the world are taking steps to respond to the challenges of climate change. These groups are all made up
of individuals like you. For better or worse,
your actions can have an impact far beyond
your own life. You can start making positive
changes today to reduce your impact on our
climate.
101
W H AT I S C L I M AT E A N D H O W I S I T C H A N G I N G ?
Vocabulary
atmosphere—The blanket of air that surrounds Earth, composed of gases such as nitrogen, oxygen,
and carbon dioxide.
carbon sink—A natural or human-made system that absorbs and stores more carbon dioxide than it releases.
carbon source—A natural or human-made system that releases more carbon dioxide than it absorbs
and stores.
climate change—A significant shift in Earth’s overall climate over an extended period of time.
fossil fuel—A nonrenewable energy source created when plants and animals are exposed to heat and
pressure over a long period of time.
greenhouse effect—The process by which gases in Earth’s atmosphere retain infrared radiation (heat)
from the sun, warming Earth’s surface.
greenhouse gas—A gas found in Earth’s atmosphere that both absorbs and re-emits infrared radiation.
Checking for Understanding
1. How is carbon dioxide related to climate change? Include a discussion of the greenhouse effect in
your explanation.
2. List three activities that you did today (or things that you used) that emitted greenhouse gases.
3. List three specific ways that you can personally reduce greenhouse gas emissions.
4. Imagine yourself 50 years from now. What do you want the earth to look like in 50 years?
5. What are some steps you can take now to ensure your vision of the future?
1 IPCC, “Historical Overview of Climate Change Science,” Climate Change 2007: Working Group 1: The Physical Science Basis; Contribution of Working
Group I to the Fourth Assessment Report of the Intergovernmental Panel on Climate Change (IPCC), ed. S. Solomon et al. (Cambridge, UK: Cambridge
University Press, 2007): 93-128, http://www.ipcc.ch/publications_and_data/ar4/wg1/en/contents.html.
2 “Global Warming Frequently Asked Questions,” National Oceanic and Atmospheric Administration
National Climatic Data Center, August 21, 2013, accessed June 3, 2013, http://www.ncdc.noaa.gov/cmb-faq/globalwarming.html.
3 “Overview of Greenhouse Gases: Carbon Dioxide Emissions,” United States Environmental Protection Agency, under Climate Change: Emissions, April
22, 2013, accessed May 31, 2013, http://www.epa.gov/climatechange/ghgemissions/gases/co2.html.
4 IPCC, “Historical Overview.”
5 IPCC, “Climate Change 2007: Synthesis Report,” IPCC Fourth Assessment Report: Climate Change 2007, under Publications and Data, accessed June
10, 2013, http://www.ipcc.ch/publications_and_data/ar4/syr/en/spms2.html.
6 “Overview of Greenhouse Gases.”
7 Ibid.
8 NOAA National Climate Data Center, Vostok Ice Core, accessed May 28, 2013, http://www.ncdc.noaa.gov/paleo/icecore/antarctica/vostok/vostok.html.
9 “Welcome to Mauna Loa Observatory,” U.S. Department of Commerce: National Oceanic and Atmospheric Administration, under Earth System
Research Library: Global Monitoring Division, accessed May 28, 2013, http://www.esrl.noaa.gov/gmd/obop/mlo/.
10 J.-M. Barnola, D. Raynaud, and C. Lorius, Historical Carbon Dioxide Record from the Vostok Ice Core (Oakridge, Tenn.: U.S. Department of Energy:
Carbon Dioxide Information Analysis Center, February 2003) accessed May 28, 2013, http://cdiac.ornl.gov/trends/co2/vostok.html.
11 Louis Sahagun, “The Year 2012 Was Among the 10 Warmest Years on Record,” Los Angeles Times: Science, May 2, 2013, accessed May 31, 2013,
http://www.latimes.com/news/science/sciencenow/la-sci-sn-2012-record-heat-20130502,0,2784525.story.
12 “Climate Change Indicators in the United States: Ocean Acidity,” Environmental Protection Agency, under Climate Change: Science, April 22, 2013,
accessed May 31, 2013, http://epa.gov/climatechange/science/indicators/oceans/acidity.html.
13 “Climate Change and Health,” World Health Organization, under Media Centre: Fact Sheets, accessed May 31, 2013, http://www.who.int/
mediacentre/factsheets/fs266/en/.
CLIMATE CHANGE


© Copyright 2026