
ForestWatch Monitoring Manual
ForestWatch
Monitoring Manual
What is a Forest?
A forest may be defined as a biological community dominated by trees and other woody
vegetation. The diversity in climate, topography and geology in Illinois, along with natural and
anthropogenic disturbance factors, resulted in a variety of wooded communities which exhibit a
wide range in the density of the tree canopy in wooded areas. Such areas range from savannas
(grassland with scattered trees), to open canopy woodlands (predominantly tree-covered but
with some light penetration), to dense forests (heavily wooded). In addition to the variety of
upland forests, a variety of bottomland (i.e. floodplain) forests occur throughout the state.
Safety
The following information provides a brief overview of how to stay safe and comfortable when
monitoring. Remember, your safety is far more important than the data you collect.
• Things to Bring:
insect repellent
water bottle
rain gear
warm clothes as needed
first aid kit
• General Precautions:
Always tuck in your shirt. When possible, tuck your pants into your socks to avoid ticks.
Wearing light-colored clothing can help to locate ticks. Many insects, including mosquitoes, are
attracted to dark colors, particularly red and black. Use insect repellent to help keep mosquitoes
and other insects from biting you. Do not allow any repellent to come in contact with plastics,
like watches or contact lenses.
Be careful of steep or variable terrain, or various objects which may be dangerous, such as
fallen trees, holes, or human artifacts (old fences, broken glass, etc.).
• Appropriate Dress:
boots or athletic shoes (never open-toed shoes)
long pants
long-sleeved shirt when possible
long socks
hat with brim
Never monitor when there is lightning or thunder. If the weather conditions worsen while you
are outside, seek shelter. Never stand in the open, under an isolated tree, or in water during
periods of lightning. If you cannot get to an indoor shelter, seek shelter among small trees.
1
• Monitoring During Hunting Seasons:
It is best to avoid monitoring during hunting seasons. Do not monitor during firearm seasons for
white-tailed deer. It is a good idea to wear bright colors (orange or yellow - avoid white) when
monitoring. Before monitoring, check with the landowner to make sure that hunters will not be
using the land when you plan to monitor.
• Animals:
All ticks should be removed if found, whether attached or not. There are several types of ticks in
Illinois, but the deer tick is the most common carrier of diseases, like Lyme disease. Know what
a deer tick looks like. Always check your clothing after being outside. Also, closely check your
skin for ticks.
The forests of Illinois contain many other animals that may be harmful to humans, including the
cottonmouth (or water moccasin), massasauga rattlesnake, timber rattlesnake, copperhead
(snake), black widow spider, brown recluse spider, mosquitoes, biting flies, bees, and wasps.
Some animals that may not appear dangerous, like a stray dog or a squirrel, can carry rabies
(though this is rare). Know where people can receive prompt medical care. It is best to observe
animals, not touch.
• Plants:
Poison ivy is found throughout the state and grows in many forms. It can be a small erect
ground layer plant, shrub, climbing vine, or trailing vine. Vines tend to appear hairy, but not
always. Poison ivy has three leaflets, with the center leaflet having a long stalk and the two side
leaflets having very short stalks. The fruits of poison ivy are small white berries. All parts of the
plant contain the oil that causes a reaction. The reaction is generally swelling, blistering, and
itchiness of the infected area. People vary in their reaction but direct contact with the plant
should be avoided. If exposed, promptly (within 1-2 hours) clean the area with hot, soapy water.
The oil from poison ivy can remain active for weeks on clothing; launder all field clothes after
contact. If available, use a strong alkali soap or naptha. Also, alcohol will dissolve and remove
the oily substance from the skin and if applied soon enough will prevent irritation.
Poison sumac mainly grows in bogs and swamps and is not widespread across the state.
Chances of exposure are minimal.
Stinging nettle (genus Urtica) usually grows in moist areas, such as bottomland forests. It
grows erect up to 4 feet, and is covered with small, stiff, stinging hairs which can irritate the
skin on contact. Leaves are opposite, heart-shaped, with a long stalk and large teeth.
Wood nettle (genus Laportea) also grows in moist areas. It resembles stinging nettle, but has
alternate leaves. This species is also covered with stinging hairs which can irritate the skin.
2
Forest Etiquette
Forest ecosystems are important for many reasons. Our forests provide more than 75% of the
state’s wildlife habitat, they are home to over 60% of the state’s native plants, including over
half of the state’s threatened and endangered species, and they protect watersheds from
excessive soil loss. But forests are delicate systems which can be easily disturbed, even by
people who are not intentionally trying to harm them. Therefore, it is important to minimize the
amount of damage inflicted when monitoring.
People are often responsible for unintentionally spreading the non-native, invasive plant, garlic
mustard (Alliaria petiolata), a major threat to the quality of our forests. The seeds of garlic
mustard are distributed when people track mud bearing the seeds. Thus, it is important to clean
your boots/shoes before you enter the woods to monitor, and again when you are finished.
Forest Monitoring Tips
DO
carry a first-aid kit.
obtain written access permission from the landowner.
make sure the landowner knows when you are in the forest. Let others know where you will be
and when you plan to return.
stay near established trails. Minimize trampling of vegetation.
look out for potential dangers and avoid them.
try to be quiet. The forest is home to many animals that are frightened by humans, particularly
by loud noises.
be polite to anyone you encounter in the forest.
wear appropriate clothing.
pick up garbage found in the forest, when possible.
enjoy nature and being outside.
clean all mud off of your boots/shoes before you enter the woods and again when you are
finished monitoring.
DON’T
DON’T attempt to monitor a site without written access permission from the landowner.
DON’T intentionally damage vegetation.
DON’T work alone.
3
DON’T touch any plant believed to be poisonous. Most plants can be identified without
touching them.
DON’T bother animals. Some may be dangerous, and excessive stress may be harmful.
DON’T work during dangerous weather conditions.
DON’T go near waterways during rain. Flash flooding may occur.
DON’T leave anything behind.
Site Establishment
Task:
Establish forest monitoring site.
Purpose:
Transects are laid in order to mark the site location.
Materials:
ForestWatch Monitoring Manual
copy of access permission letter
three 101-m ropes marked at 5- and 10-m intervals
one 20-m rope
2 meter sticks
12 plastic or metal tent stakes
1 hammer or mallet
3 compasses
topographic map, directions and/or site sketch
local road map
Get Transects Set Up Ahead of Time!
Establishing your forest site involves scouting your site for a safe and accessible location
with sufficient forest buffer, carefully laying three straight 100 m transect lines and marking
them with stakes, and drawing a sketch of the site. This work can take up to one-half day for
some sites, so it is recommended that this work not be done on the same day as monitoring.
Don’t rush it - take your time and make sure your lines are straight and well-documented on
your site sketch.
Procedure- Establishing a New Site:
Beginning from any forest edge or trail, lay the three 100-m transects. The transects will run
perpendicular to the edge or trail from which you enter the forest, they will be laid in parallel
and spaced 20 m apart, with a 50-m buffer zone on each side and at the far end, and they will be
permanently marked with tent stakes. (The 50-m buffer includes the first 50 m of the transects).
See Figure 1.
4
Please note that accurate line placement and being able to re-lay the transect lines in precisely
the same location each time you monitor are essential! This is the only way that data you
collect will be useful for identifying trends in forest conditions. Follow the site establishment
procedures exactly and carefully document your stake locations on your site sketch.
Figure 1. The three transects will be 100 m long and 20 m apart, with a 50-m forest buffer zone
along the sides and end of the transects. This will give a 50-m buffer completely around the area
that is monitored, since data are only taken from the last 50 m of each transect line.
5
1. Determine the general location of your three transects.
Go to the site. You need to walk the ground and make sure that there is a place where you can
lay three parallel 100-m transect lines spaced 20 m apart, with at least 50 m of forest buffer on
each side and at the far end. The minimum dimensions for setting up a site are 150 m deep and
150 m wide.
2. Locate the starting point of the first transect.
When selecting a starting point for your first transect, the important considerations are to find a
place that is easy to get to, and one which will be easy to find in the future. Avoid the
temptation to select a starting point based on your impression of what may be “good” or “bad”
forest habitat. Also, you need to be sure that you begin where your transects will have at least 50
m of forest buffer on both sides and at the far end. If you are using a global positioning system
(GPS unit), you should take a latitude/longitude reading right where you enter the forest, then
record these coordinates.
Once you decide where to enter your forest, the starting point of your first transect should be at
the interior edge of the crown of the canopy tree that is closest to where you enter. Optionally,
you may choose to place the stake near the base of the tree if you feel it would be easier to find
in the future. A canopy tree is a tree whose leaf-bearing branches, or crown, reach the canopy,
which is the layer of foliage of the tallest trees. Once you have found the nearest canopy tree,
look up at its branches, and walk into the forest until you are standing directly under the last of
its interior branches (Figure 2).
Tap one of the stakes into the ground at the starting point of the transect. Pick a spot which is
easy to find but which is also out of the way so that the stake will not be easily discovered by
others or perhaps trip an unsuspecting hiker. Then tie one end of the 101-m rope so that the 0-m
mark is right at the stake.
Figure 2. The transect should start a little way into the forest, at the inner edge of the crown of
the first large tree that reaches the canopy.
6
3. Determine the direction the transect will follow.
Determine a direction that is perpendicular to the forest edge or trail from which you entered.
Set your compass to determine the precise bearing the transect will follow. To use your
compass, simply point the base plate in the exact direction you want to go, and turn the dial
(keeping the baseplate still) until the needle is lined up with N on the ring. Determine your
bearing from the ring of your compass, and record the bearing on your data sheet.
4. Lay the transect line.
Identify a large tree or other landmark directly on line with your bearing, walk directly toward it
with the rope, then repeat as necessary until you reach 100 m.
An easy way to do this is to have one person stand over the stake with the compass and direct a
person with the rope, who walks in the direction indicated. The compass director then tells the
rope layer to stop when nearly out of sight, so the director can catch up and repeat the process. If
a third person is available, have them walk ahead of the rope layer and act as a “target,”
standing right on the transect bearing as instructed by the compass director.
Run the 101-m rope from the starting point of the transect to the 50-m point, making sure the
line is straight along the compass bearing. Pull the line tight and then drive a stake into the
ground at the 50-m point directly under the rope. Attach the rope so that the 50-m mark is right
at the stake. Repeat the process from 50 to 75 m, proceeding directly on line with your compass
bearing. Pull the line tight, tap the third stake into the ground at exactly 75 m, and attach the
rope so that the 75-m mark is right at the stake. Repeat the process from 75 to 100 m,
proceeding directly on line with your compass bearing, pull line tight, and tap the 100-m stake
into the ground so that the 100-m mark is right at the stake. Finally, mark each stake to identify
the site, transect and stake.
Note:
If a stream or small road cuts right through the area where you are trying to establish your
transects, and it would be large enough to disrupt your sampling, move the transects over to
one side to avoid running into the stream or road, provided that you still have a 50-m buffer
zone on all sides. If this is not possible, you will have to stop monitoring before the stream or
road, then continue on the other side. You will have to mark the transect rope at the point
where the stream or road begins, then slide the rope forward until the mark on the rope is on
the other side, and re-anchor your line.
5. Draw a map.
Draw a detailed map of your site, including the precise location of all stakes. This resource will
enable you to find your stakes the next time you monitor.
Make notes on how to locate the stakes at the beginning, middle and end of the transect. Make a
sketch of the site showing the location of each stake. Include any distinctive, reasonably
permanent landmarks in your sketch, such as proximity to roads, fence posts, road signs,
buildings, land forms, streams, rocks, and possibly large trees. Don’t use ephemeral landmarks
such as a bird’s nest or vines which may not last from season to season. (See Figure 3.)
7
For each stake, locate a distinctive feature close to the stake (a large tree, for example) and
determine the compass bearing from the feature toward the stake. You can do this by going to
the feature, pointing the direction arrow on the base of the compass at the stake and twisting the
dial until the needle lines up with North. The compass bearing will be the number of degrees
right below the direction arrow on the compass.
Now, measure the distance to the stake with a meter tape, a 20-m rope, or a meter stick. On your
map, you should sketch the feature, the compass bearing, and the distance in meters. Repeat this
procedure for two other features for that stake, if available. It is important to identify at least one
reference feature for each stake! This information will make the job of finding your stakes much
easier in subsequent years.
Repeat steps two through five for the second and third transect lines.
The beginning stake for the second transect should be placed exactly 20 m from the beginning
stake for the first transect. Use a meter tape or 20-m rope and compass to make sure that you are
exactly 20 m from the first stake, on a perpendicular course from the first transect. Then, using
the exact same compass bearing as for the first transect, run the second transect parallel to the
first.
Laying parallel transects can be challenging. To make sure that you are staying in parallel to the
first line as you lay the second line, take the 20-m rope, go back to the 50-m point on the first
line, and walking a perpendicular course in the direction of the second transect, measure the
correct distance over from the first line. This should also be done at 75 and 100 m. Have a
“spotter” stand right on the 50-m spot while the rope is being laid. (If a third person is not
available, just measure over and put a stake in the ground at 50, 75, and 100 m before laying the
second line). When you are done laying the second transect, the end stake should be exactly 20
m from the end stake for the first transect (stakes may not line up exactly on sites with variable
terrain). Now lay the third transect in the same manner, exactly 20 m from the second transect.
8
Figure 3. Make a drawing of the site and include all important features that will aid in locating
the transects in the future. At ALL the stakes, including those at 50 m and 75 m, include
references to landmarks so the stakes can be located again in the future.
9
Procedure Summary: Establishing a New Site
1.
•
•
Determine the general location of your three transects.
Locate an accessible spot that is 150 m by 150 m.
Make sure that the 50 m by 50 m monitoring area is all upland or all bottomland forest.
•
•
•
•
Locate the starting point of the first transect.
Spot must be accessible and easy to find.
Need 50-m buffer on each side and at end of transects.
If using GPS unit, take reading where you enter the forest.
Start at interior crown edge of first canopy tree or at base of tree.
2.
3.
Determine the direction the transect will follow (should be perpendicular to edge or
trail.) Determine exact compass bearing and record on site sketch.
4.
•
•
•
•
•
5.
•
•
6.
•
•
Lay the transect line.
Have one person with the compass stand over the stake and direct the person with the
rope.
At 50 m drive stake into ground, pull the line tight, and attach rope.
At 75 m drive stake into ground, pull the line tight, and attach rope.
At 100 m drive stake into ground, pull the line tight, and attach rope.
Move away from obstacles such as streams or roads.
Draw a map so that others may find the transect stakes.
Sketch the site showing the location of each stake.
For each stake, identify nearby features and note distances and bearings from features to
stake.
Repeat steps 2 through 5 for the second and third transect lines.
Each transect is 20 m from the adjacent transect(s).
Use 20-m rope and compass to make sure that you are parallel to the other transect(s).
Procedure Summary: Re-establishing an Existing Site
1. Locate the stakes for all three transects on your site. (Use GPS unit to help locate site if GPS
readings were taken previously.)
2. Mark the transects with the 101-m ropes. Lines must always be re-laid so that they go
directly to the stakes and follow the correct compass bearing!
3. Mark the 50- and 75-m points with a stake, if not already marked.
10
Monitoring Procedures
Tree Survey – Fall Session
Purpose:
The data collected in this procedure will be used to examine the composition and ages of the
different species of trees in the forest. By looking at the mixture of seedlings, saplings,
subcanopy trees, and canopy trees, you may be able to tell whether the forest composition is
changing, or whether the forest is regenerating. Large shrubs and vines will also be included
in this procedure.
One common trend in many Illinois forests is that sugar maples are slowly replacing oak and
hickory trees (a process known as “maple takeover”). The most likely explanation for this
process is that people have vigorously prevented fires in the state for over a century.
Preventing fires allows forests to become extremely dense and overgrown with vegetation.
The shade-intolerant oaks and hickories are unable to grow under these conditions, whereas
sugar maples are very shade-tolerant and derive a competitive advantage. Oaks and hickories
survive fires better and often resprout even when the aboveground stems are killed. Both
maple forests and oak-hickory forests are ecologically valuable, and in some forest types
maple dominance is perfectly natural. However, many native plants and animals of Illinois are
adapted to live in oak-hickory forests with their associated food resources, light levels,
nesting/resting areas, and other ecological attributes. Given the ecological value of oakhickory forests, as well as their aesthetic appeal and resource value, scientists are concerned
with the gradual loss of these forests.
The data from this procedure will show the age distribution of trees in the forest. Multi-aged
stands of trees provide a diversity of habitats for wildlife and are typical of high-quality
woodlands. In contrast, stands of trees which are all the same age allow only particular groups
of plants and animals to survive.
Large shrubs, vines, and standing dead trees (referred to as “snags”) will also be surveyed in
this procedure. Snags represent an important habitat and food source for birds and other forest
animals.
Materials (for one transect):
ForestWatch Monitoring Manual
two 10-m ropes marked at 5 m (see figure 4)
2 meter sticks with DBH interval marks
tree identification key
pencils
clipboard
Tree Survey data sheet (plus some extras)
airtight plastic bags or plant press for specimens, specimen labels
binoculars
10 wire flags
hand lens (optional)
50-m tape (optional)
11
Procedure:
On three transects between 50 and 100 m, you will identify trees to genus or species and
measure their trunk diameter at breast height (DBH). All trees with a DBH ≥ 5 cm and within
5 m of the transects are recorded in this procedure. Any shrub or vine encountered with
individual stems ≥ 5 cm DBH will also be included in this procedure if it is rooted within 5 m
of the transect.
Go to the 50-m point of the first transect. One person will record data, while others identify
and measure DBH of trees, shrubs and vines. It is helpful to have one ID/DBH person
working on each side of the transect.
Walk along the transect from the 50-m point toward 100 m, working in each 10-m interval,
and record the name and DBH class for all trees, large shrubs and large vines within 5 m
on either side of the transect (10 m-wide belt) and ≥ 5 cm DBH. Also record DBH for all
snags ≥ 5 cm. Trees that are on the edge of the 10 m-wide belt are not tallied if the trunk base
is less than half-way inside the 10 m-wide area. Use wire flags to mark the edge of the 10
m-wide sampling area.
Tips for Monitoring Trees
Be sure to count only those trees, shrubs, and vines that lie within 5 m of the transect line! To
help keep the sampling area well-defined, we strongly recommend the use of wire flags to mark
corners of each 10 m by 10 m plot. To do this, lay out two 10-m ropes at the start and end of
each 10 m segment, perpendicular to the transect line. (Make sure that the middle of each 10-m
rope crosses over the transect line; see Figure 4.) Wire flags are then placed at the corners of
each 10 m by 10 m plot (5 m to each side of the transect line) to define the sampling area.
Simply run out and line up the corner flags with any tree that appears to be near the edge of the
10 m-wide sampling area, and determine whether the trunk base is more than half-way inside
the plot. Alternatively, you can just measure out to the tree using a meter stick or one of the 10m ropes.
Figure 4. Use 10-m ropes to set
wire flags on the corners of each
10-m by 10-m plot. Use the
flags to make sure that only
trees, large shrubs, and large
vines that are within 5 m of the
transect line are counted.
12
For every leaf-bearing tree, large shrub or large vine that is within 5 m of the transect line and
has a DBH ≥ 5 cm, you will perform the following steps.
1. Identify the Tree, Large Shrub or Large Vine.
Trees—
You will identify all trees either to genus or to species. If you cannot identify the tree to
species with confidence, identify and record the tree to the genus level.
If you can’t reach a leaf-bearing twig, or collecting is not allowed by the landowner or land
manager, identify the tree to the level to which you are confident. Note your inability to
access a specimen on the data sheet and include a written description of the tree.
Several oak species can be difficult to distinguish from one another and often have leaves that
are unreachable. Try looking for acorns under the tree in question; often acorns are very
helpful in identifying oaks.
Large Shrubs—
You will also be looking for large shrubs (≥ 5 cm DBH) rooted within 5 m of the transect.
Very few shrubs will be found with a DBH ≥ 5 cm. Stem counts are tallied individually for
the following invasive shrubs.
• bush honeysuckle (Lonicera spp.)
• common and glossy buckthorn (Rhamnus cathartica and R. frangula)
• multiflora rose (Rosa multiflora)
• European high-bush cranberry (Viburnum opulus)
• autumn olive (Elaeagnus umbellata)
• Missouri gooseberry (Ribes missouriense)
All other large shrubs (including native buckthorn, if encountered) will be coded as “Other
Shrub.”
Large Vines—
You will also tally all large woody vines (≥ 5 cm DBH) rooted within 5 m of the transect. Vines are
plants that wrap around trees or trail along the ground. Large vines will be counted as a group and not
identified further; record as “Vine.” Count each vine once, at the point where it is rooted.
What’s the Difference Between a Tree and a Shrub? A tree is a woody plant which has a single
stem or trunk coming out of the ground. Trees usually grow to a height of at least 12 feet (3.5 m), and
they branch well above the ground. A shrub is a woody plant that is multiple-stemmed at or near the
base. Shrubs seldom attain a height greater than 10 feet (3 m). Some woody plants do not neatly
conform to these definitions.
No Need to Panic!
While there are over 250 species of trees in Illinois, most forest sites will have a relatively small
number of species (e.g., 10 to 20); once you have learned to identify the limited number of species
present on your site, tree identification will be much easier. The use of recognized tree keys, such as
Tree Finder by May Watts, will help with identification. For a brief introduction to tree identification,
refer to the appendix entitled, “Tree Identification Basics.” Remember, tree identification is a
skill: it is essential that you practice identifying trees before you monitor.
2.developed
Measure DBH.
13
2. Measure DBH.
All trees, other large woody plants, and snags ≥ 5 cm DBH are recorded in the following
DBH (cm) size classes:
A
5-10
B
10.1- 20
C
20.1- 30
D
30.1-40
E
40.1-50
F
50.1-60
G(#cm)
> 60
For trees > 60 cm DBH, the exact DBH is measured (to the nearest whole cm).
For trees, large shrubs and large vines with a DBH less than 60 cm, you don’t need to
measure the exact diameter; you only need to find out the DBH interval in which they fall.
For example, it makes no difference whether a tree is 12 cm or 13 cm DBH – either way, it
falls in DBH class “B.” The use of meter sticks on which the DBH intervals have been
clearly marked will make it easy to quickly determine the correct interval. (See Equipment
Section.) If a tree’s DBH is exactly 5 cm, or exactly 10 cm, this tree is included in size class
A. You may encounter a tree with a trunk that is noticeably noncircular in cross-section. In
this case, take the average DBH of two measurements - one from the widest angle, one from
the narrowest angle.
DBH - Diameter at Breast Height—
You will measure the diameter of the tree or shrub at a height of exactly 1.3 m above the ground.
This measurement is known as “diameter at breast height,” or DBH, and it is a universally accepted
method of tree measurement. Measuring the trees at this height standardizes your measurement so
that it can be compared to trees measured by others. Before you begin monitoring, measure your
own body with a meter stick and carefully note where your own personal 1.3-m mark is. Use this as
a reference when measuring trees.
Figure 5. Avoid problems with parallax by making sure that the two lines of sighting are
parallel (a). If the lines of view are not parallel, the measurement will not be accurate (b). The
shaded areas of the meter sticks (a and b) show the diameters that would be read. With the
meter stick held at breast height, lean over to view it at eye level with the line of sight
perpendicular
to it (c).
14
Most trees will be easy to measure, but some will be odd- or irregularly shaped. For example, a
tree that has a branch coming out 1.3 m above the ground will have a diameter much larger than
if the branch wasn’t coming out at that height. Also, some trees may have more than one trunk
at 1.3 m; count each trunk separately, and record DBH separately for each trunk. Use Figure 6
to guide you on how to adjust for various irregularities.
Large shrub stems should be counted and measured separately at 1.3 m, as should large vine
stems, if they are within 5 m of the transect.
Figure 6. Use this chart to help decide where you should measure the DBH (diameter at breast
height) of the tree.
3. Count Snags
As you conduct the tree survey, count all standing dead trees and shrubs, ≥ 5 cm DBH and
within 5 m of the transect. Record as “snags” (do not attempt to identify) and use the data
code for snags listed on the Tree List. Also record the DBH using the DBH size classes used
for living trees.
15
4. Record Data
You will record data on tree, shrub, and vine names and DBHs for each 10-m transect interval
between 50 and 100 m. Enter the letter (A through G) which represents the appropriate DBH
size class for that tree/shrub/vine, and record the exact DBH in the column “DBH > 60 cm” if
the plant is greater than 60 cm DBH.
5. Repeat this procedure for all trees, large shrubs and vines, and snags in each 10-m
interval between 50 and 100 m.
6. Calculate the total number of trees, large shrubs and large vines in each DBH size
class.
7. Repeat steps on the second and third transects.
Procedure Summary: Tree Survey
On each of three transects between 50 and 100 m you will:
1. Identify and measure DBH for all trees, large shrubs and vines, and snags ≥ 5 cm
DBH and within 5 m of the transect (10-m wide area).
•
•
•
Identify each tree, large shrub, or large vine. If a woody plant is not listed, count
it as an “Other Shrub” or “Other Vine.”
Measure the plant’s “diameter at breast height” (DBH), which is 1.3 m from the
ground.
For trees with more than one trunk at 1.3 m, and for all large shrubs, count each
trunk or stem separately and record DBHs separately for each.
2. Count and record as “snags” all standing dead trees and shrubs ≥ 5 cm DBH and within
5 m of the transect. Do not identify. Also record DBH class.
3. Record the data in 10-m transect intervals using the DBH classes (A-G) and also record
the exact measurement if > 60 cm DBH.
Shrub Layer Survey - Fall Session
Purpose:
The data collected in this procedure will be used to examine the structure of the forest shrub
layer, and also to monitor the presence and extent of invasive and non-native shrub species.
Since the number of shrub, sapling and vine stems is usually much greater than the number of
large trees in a given area, a much smaller area is required to obtain a sufficient sample.
The shrub layer is an important component of the forest ecosystem, in part because it provides
important habitat for many species of birds and other organisms. In addition, shrubs represent
over one-half of the woody plant taxa found in Illinois forests (284 shrub taxa). Thus, shrubs
are an important component of the plant diversity of the forest.
The shrub layer consists of several different forms of woody plants. Woody plants are plants
whose stems and roots are long-lived and increase in size from year to year.
16
Shrub layer woody plants include shrubs, vines, and tree saplings. Shrubs are multiplestemmed at or near the base of the plant. Trees have one main stem (trunk). Vines are plants
that wrap around trees or trail along the ground.
The shrub layer is particularly vulnerable to intrusion by non-native, or “exotic,” shrubs and
vines. Non-native shrubs pose a serious threat to Illinois forests because they are particularly
aggressive and often crowd out a variety of native plants that would otherwise grow in the
area. As a consequence, biodiversity is reduced. Species of buckthorn are a major problem in
northern Illinois, while multiflora rose and various honeysuckle species are a major problem
in forests throughout the state. Even some species of native shrubs, such as gooseberry, can
invade or spread throughout the forest after a disturbance, causing many of the same problems
as non-native shrubs.
Materials (for one transect):
Forest Watch Monitoring Manual
2 meter sticks
tree key
pencils
clipboard
Shrub Layer Survey data sheet
Procedure:
In this procedure, one person, the “counter,” walks along the transect counting shrub, vine and
sapling stems and identifying the plants. The other person, the “recorder,” follows along and
records the data on the data sheets, and helps keep track of the number of stems and plant
species.
Stem counts are tallied individually for the following invasive shrubs:
• bush honeysuckle (Lonicera spp.)
• common and glossy buckthorn (Rhamnus cathartica and R. frangula)
• multiflora rose (Rosa multiflora)
• European high-bush cranberry (Viburnum opulus)
• autumn olive (Elaeagnus umbellata)
• Missouri gooseberry (Ribes missouriense)
All other large shrubs (including native buckthorn, if encountered) will be coded as “Other
Shrub.” Some species of honeysuckle grow as vines. You will count the stems of Japanese
honeysuckle (Lonicera japonica) under the VINES category on the data sheet. All other vine
species encountered during the procedure are identified as “Other Vine.” Tree saplings are
identified to the level indicated. Snags are not included in the shrub layer survey.
Note that some shrubs, such as buckthorn, multiflora rose, gooseberry, blackberry and
raspberry will grow in both single- and multiple-stem form. All shrub taxa should be counted
as shrubs regardless of the number of stems.
Note:
There is one native species of buckthorn, the Carolina buckthorn (Rhamnus caroliniana)
that occurs in southern Illinois. If this plant is encountered, it should be recorded as an
“Other Shrub” on the data sheet.
17
1. Determine 1-m height using your body as a reference.
Take a meter stick, stand it on the ground next to you, and carefully note how high the end of
the stick reaches on your body. For some people, this will be approximately waist-height; for
others, it may be higher up near the ribs. You will need to remember your own personal “1meter mark” for the following procedure.
2. Count all shrub, woody vine, and tree sapling stems < 5 cm DBH that are at least 1 m
tall and within 1 m of the transect line (2 m-wide belt).
Go to the 50-m point of the first transect. Take two meter sticks, place them together end to
end, and hold them perpendicular to the transect line at a height of 1 m.
Now walk right on the transect line toward the 60-m point, and proceed until a woody stem
touches the meter sticks. (For “border line” stems that are around 1 m in height, stand the
meter stick up next to the stem to determine whether it is ≥ 1 m tall.) If the stem is less than 5
cm DBH and is rooted within the 2 m-wide belt, then it is included in this survey. Count the
stems as follows:
▪ Shrub stems are identified as one of the listed shrub taxa or as “Other Shrub.” Count the
number of stems rooted in the 2-m area that have branches that are at least 1 m tall. Follow
the stem down to the ground level (“basal stems”) and count the stems there, and not at the 1m level. You will count all basal stems that have branches that touch the meter sticks. See
Figure 7.
Some shrub stems will branch right at or near the ground. For these stems you must carefully
observe where the stems split--count the stems right at the ground level. You may need to
wisk away the leaf litter to determine if the stems branch above ground. Use your best
judgment to determine if the stems branch above ground; if they do, just count as one stem. If
more than one stem is coming out of the ground (and they each hit the meter stick at 1 m),
count each stem individually. If a shrub had stems ≥ 5 cm DBH that were included in the tree
survey, but the shrub also has stems < 5 cm DBH coming out of the ground, count the < 5 cm
stems as you would a normal shrub in the shrub procedure, i.e. at ground level.
To touch the meter sticks, stems must be at least 1 m tall and within a 2-m wide belt
centered on the transect line. The plants must also be rooted within the 2-m area to be
included in the count.
18
Figure 7. Count the number of basal stems rooted in the two meter-wide area that have
branches touched by the meter sticks, at 1 m above the ground. In this figure, two stems hit
the meter sticks, but they have only one basal stem.
▪ Vine stems are identified as Japanese honeysuckle or “Other Vine.” Count the number of vines
that are rooted in the 2-m area that have stems touching the meter sticks at the 1-m height.
Count vines at ground level as with shrubs. Avoid touching any vine--it might be poison ivy.
▪ Tree saplings that are rooted in the 2-m area and that touch the meter sticks are identified using
a tree key, and then counted. DBH is not recorded for saplings < 5 cm. Also, note that if a
sapling forks below 1.3 m it is still counted as one sapling.
Counting Resprouts
In some cases trees and shrubs will send up stem resprouts, or stems that grow out of
the base of an old trunk. This may occur naturally, or it may be due to a trunk being
cut. If you encounter a stem resprout when monitoring the shrub layer, for trees count
each stem coming from the same plant individually, but for shrubs count all stems
coming up from the same plant as only one stem.
3. Repeat the above procedure in the remaining transect intervals until you reach 100 m.
4. Calculate TOTAL STEMS for each type of plant identified on the transect, then record.
5. Repeat steps two through four on the remaining two transects.
19
NOTE:
Two non-native woody vines, kudzu (Pueraria lobata) and Oriental bittersweet (Celastrus
orbiculatus) are spreading rapidly in the state and are becoming a major concern.
Kudzu is a high-climbing twining vine with alternate, compound leaves with three toothless,
sometimes palmately lobed leaflets. Kudzu has violet flowers that are borne in clusters in late
summer/early fall, and are said to smell like grape Kool-Aid. Oriental bittersweet is also a highclimbing twining vine, with alternate, simple leaves that are very broad and nearly round with small
rounded teeth. Its white flowers bloom in May or June, and flower clusters are located in the leaf
axils. It can be distinguished from the native climbing bittersweet (C. scandens) which has flowers
in terminal clusters on branchlets and more elongate, ovate leaves about twice as long as wide.
Procedure Summary: Shrub Layer Survey
On each of three transects between 50 and 100 m, you will:
1.
Count all shrub, woody vine, and tree sapling stems < 5 cm DBH that intersect the 2 mwide belt transect at a height of 1 m. To be counted, all stems must be rooted within the 2-m
belt.
•
Walk on the transect line until a stem touches the meter sticks. If the stem is < 5
cm DBH and is rooted within the 2 m-wide area, then it is included in the survey.
•
Shrub stems are identified and then counted at ground level (“basal stems”), not
at the 1-m level. Count all basal stems that have branches that touch the meter
sticks. If a basal stem branches above ground level, count as one stem.
•
Vine stems are identified as Japanese honeysuckle or “Other Vine,” then counted
at ground level.
•
Tree sapling stems are identified then counted. (DBH is not recorded for < 5 cm
saplings.)
2.
Record stem counts in the correct intervals on the data sheet.
3.
Once finished with a transect, calculate/record total stems in the TOTALS box for each
type of plant.
4.
Note presence of kudzu or Oriental bittersweet.
Vegetative Shading Survey - Fall Session
Purpose:
Light levels on the forest floor have a direct impact on the understory species that grow there.
Early-blooming spring ephemeral wildflowers have adapted to low-light conditions in some
forests by growing and blooming before the tree canopy, subcanopy, and shrub layers are filled
out, although some invasive species green up early and compete for sunlight with the spring
20
ephemerals. Other herbaceous ground layer species are summer-blooming plants that require
some amount of direct sunlight in order to survive. In addition, some species of trees, such as
many oaks and hickories, require direct sunlight in order to germinate and grow. Thus, light
levels in the understory will directly affect the suitability of a forest or woodland as habitat for
many species of plants.
Light levels in the forest understory may be the result of many possible factors. The tree canopy
and subcanopy may be thinned due to air pollution, disease, insect outbreaks, storm damage,
drought, or old age. The suppression of fire, and the resultant takeover effect of invasive trees
and shrubs, can dramatically reduce light levels in the understory, often to the detriment of
many native plant species that formerly grew there. Many restoration activities are directed at
overcoming the adverse effects of fire suppression and invasive woody plant encroachment,
such as prescribed burning and selective tree and shrub removal. The result is a thinning of
canopy, subcanopy and shrub vegetation, thereby increasing light levels in the understory.
Shading is also a function of forest type. By monitoring canopy, subcanopy and shrub layer
vegetation at your forest site, you will be helping scientists to look beyond the normal year-toyear changes that may occur, and to identify long-term changes in forest light levels that may
help to explain changes in the plant community and also reveal any signs of stress.
Materials (for one transect):
ForestWatch Monitoring Manual
ocular tube
meter stick
pencils
clipboard
Vegetative Shading Survey data sheets
Procedure:
You will measure vegetative shading along each of three transects using an ocular tube, which is
a viewing tube with cross-hairs at one end. (To make an ocular tube, see Appendix E.) You will
walk along each transect from 50 to 100 m and note the presence (+) or absence (-) of canopy,
subcanopy, and shrub vegetation directly overhead.
It is important that you keep your eyes closed until the tube is pointing straight up, in order to
minimize bias. (With your eyes open, you may be tempted to select a spot.) Also, be careful
not to move the tube once you have opened your eyes.
21
1. Measure tree and shrub cover along the first transect.
Go to the 50-m point of the first transect.
Using your meter stick, measure to the 52-m point, then stop.
Close your eyes, and with the tube at your eye, tip your head back until the tube is vertical.
Now open your eyes, and observe whether vegetation (leaves or branches) appears directly in
the center of the crosshairs. See Figure 8. Include vegetation associated with mature trees, tree
saplings, shrubs, or vines. Do not include any herbaceous (non-woody) vegetation that may be
tall enough to obstruct your view upward.
Record presence (+) or absence (-) of vegetation, then move on to 54 m and repeat.
Record measurements every two meters along the transect between 50 and 100 m (25 readings
total per transect), beginning at the 52-m mark and ending at 100 m.
2. Repeat the same procedure on the second and third transects.
Figure 8. To measure vegetative shading, record all tree, sapling, shrub or vine “hits” when
looking straight up. If your view is obstructed by herbaceous (non-woody) vegetation, move
slightly to the side and try again.
22
Procedure Summary: Vegetative Shading Survey
On each of three transects between 50 and 100 m, you will:
1.
Walk along each transect and, using an ocular tube, note the presence (+) or absence (-) of
vegetation directly overhead. At each observation point:
•
Close your eyes and tip your head back, with the ocular tube at your eye.
•
Open your eyes and observe whether vegetation appears directly in the
crosshairs.
•
Record presence or absence as a “+” or “-,” respectively.
•
Be careful not to count herbaceous (non-woody) vegetation.
2. Start at 52 m and record data every 2 m, to and including 100 m (25 readings total per
transect).
Forest Conditions - Fall Session
Purpose:
You will look for signs of two harmful conditions in Illinois forests; dogwood anthracnose and
gypsy moths.
Dogwood Anthracnose
Flowering dogwood (Cornus florida) is an understory tree (up to 12 meters, or 40 feet tall) that
is widespread in central and southern Illinois woodlands. It is considered by many to be one of
Illinois’ most beautiful flowering trees. Its fruit is an important food source for birds, squirrels,
and other wildlife.
Flowering dogwoods in Illinois are currently under attack by an exotic disease known as
Discula anthracnose. It is caused by an Asian fungus (Discula destructiva) that was first noticed
on the east coast of the United States in the late 1970s. The disease has been spreading across
the U.S. and is known to occur in Illinois.
Flowering dogwood saplings less than 4 cm DBH are often killed, leaving no young trees to
replace older ones when they die. Dogwood anthracnose spreads quickly during cool, wet
weather.
Although little can be done at present to prevent the spread of the disease in a forest, it is
important to monitor its presence in forests around the state and document the change in
composition of forest trees as the flowering dogwoods become less common.
Gypsy Moth
The gypsy moth, an insect native to Europe, was accidentally introduced in the U.S. around
1869. It has spread mostly by hitch-hiking on firewood, lawn furniture, and camping and
recreational vehicles. It has become widespread in the northeastern U.S. where it is a major
defoliator in forests. The gypsy moth is also established in Michigan and Wisconsin, and is
present in the northernmost counties in Illinois. Although the Illinois Department of Agriculture
23
is taking measures to slow the spread of gypsy moths, it is likely to eventually become
widespread throughout the state.
Gypsy moth caterpillars feed on many species of trees, but the preferred food plants are oak,
apple, alder, aspen, basswood, hawthorn, and birch. It also will feed on beech, cherry, black
gum, hemlock, hickory, hornbeam, larch, maple, pine, sassafras, and spruce. Trees not normally
fed upon include ash, butternut, black walnut, catalpa, red cedar, dogwood, holly, locust,
sycamore and tulip tree.
When present in large numbers, gypsy moth caterpillars defoliate trees. This process will kill
evergreens, but deciduous trees usually put out new leaves. Successive years of defoliation will
severely weaken the trees and make them susceptible to being killed by other insects and
diseases. By establishing a baseline of tree species, size and abundance before the moth
becomes established, monitoring when the moth moves into a forest, and then monitoring the
forest after establishment, the impact of the gypsy moth on forest composition can be evaluated
over time. This procedure also provides the opportunity to find egg masses and have
professionals remove them, thereby reducing the risk of colonization.
Materials (for one transect):
ForestWatch Monitoring Manual
10-m rope marked at 5 m
1 meter stick
pencils
clipboard
Dogwood Anthracnose/Gypsy Moth data sheet
Procedure:
The following two procedures can be done on the same trip down the transect line to minimize
trampling.
1. Dogwood Anthracnose
Damage caused by dogwood anthracnose can be recognized and distinguished from other
diseases by the numerous “water sprouts” on the trunk and lower limbs of the tree. Water
sprouts are small, abundant, succulent stems, often produced along the main trunk and larger
branches of a tree. The tree may have large areas of dead, curled leaves that do not drop from
the tree (Figure 9).
Infected branches are likely to appear on the lower parts of the tree first. Leaves develop tan
spots with purple borders. On the underside of the infected leaves there are pinhead-sized tan to
brown dots which further distinguish this infection from other diseases. Be careful not to report
normal fall leaf drop as anthracnose.
24
Figure 9. Dogwood anthracnose can be recognized by (a) dead branches on the lower portions
of the tree, (b) dead leaves remaining on the branches, and by (c) the presence of water sprouts
on the trunk and main branches of the tree.
2. Gypsy Moths
Walk along the transect from 50 to 100 m, and carefully observe the trunks of all trees within 5
m of the transect and with a DBH ≥ 5 cm for signs of gypsy moth egg masses.
Note:
If you find any gypsy moth egg masses, you should place a wire flag next to the tree and call
the IDNR and report it. Do not try to remove the egg masses; they will be verified by
professional entomologists.
Gypsy moth egg masses contain from 100 to 1000 eggs. The mass is about 1 ½ inches long and
about ¾ inches wide. It is covered with buff or yellow hairs from the female moth. If the masses
are white or gray instead of yellow, they are not gypsy moth eggs. The egg masses can appear
anywhere on the tree. On each tree, search the entire trunk for gypsy moth egg masses.
3. Repeat steps one and two on the remaining two transects.
4. Upland/Bottomland
Based on the topography, tree species composition, and other factors of your site, record
whether the site is upland, bottomland, or if you are unsure.
25
Figure 10. Gypsy moth egg masses are buff or yellow colored and can appear anywhere on the
tree.
Procedure Summary: Fall Forest Conditions
• Check each individual dogwood found for evidence of dogwood anthracnose. Record the
number of trees with anthracnose by transect interval.
• Walk along the transect from 50 to 100 m, and carefully observe the trunks of all trees within
5 m of the transect and with a DBH ≥ 5 cm for signs of gypsy moth egg masses. For each tree
on which a gypsy moth egg mass is found:
• Record tree code, exact DBH in cm, and exact location of the tree on the data sheet.
Ground Cover Survey - Spring Session
Purpose:
Monitor the presence and percent cover of both native and non-native plant species found in the
ground cover of the forest. The measurement of percent cover is a standard method used by
botanists and plant ecologists to estimate the abundance of ground layer species. Native plant
species are those that were historically present in Illinois prior to European settlement, while
non-native species are those that did not originally grow in Illinois and probably dispersed here
after Europeans settled the area. “Disturbance-sensitive” native plant species are important
indicators of the relative ecological integrity of the forest, as these species are known to be
particularly sensitive to human disturbance, and their presence generally indicates that the forest
is of high quality. Tracking the presence and coverage of these plants is one good way to
monitor changes in the ecological condition of Illinois’ forests.
Monitor presence and percent cover for several additional native ground cover species which are
not generally disturbance-sensitive, but which may provide useful information regarding the
composition of the ground layer in your forest. Most of these are relatively common wildflowers
in Illinois forests. As with the disturbance-sensitive species, the reason that these plants must be
monitored in spring is that most of them are “spring ephemerals,” so-called because they are in
bloom only for a short period in spring, before the tree canopy fills in and blocks out the
sunlight.
26
A third group of ground layer plants you will look for is non-native, or “exotic,” plant species.
At present, over 25 percent of the plant species in Illinois are not native to the state. A small
number of exotics are particularly aggressive and often crowd out a variety of native plants that
would otherwise grow in the area, reducing biodiversity in the process. For example, garlic
mustard (Alliaria petiolata), a plant that is originally from Eurasia, now grows in many of
Illinois’ forests where it outcompetes native ground cover species. Tracking the presence and
coverage of non-native ground cover species will indicate the extent to which Illinois forests are
undergoing ecological degradation in the ground layer.
Materials (for one transect):
ForestWatch Monitoring Manual
two 10-m ropes marked at 5 m
1 meter stick
1 PVC or wood quadrat (½ m by ½ m, or ¼ m2 in size)
wildflower field guide
pencils
clipboard
Percent Cover data sheet
Procedure:
On each transect, you will identify and estimate percent cover for selected species of native and
non-native ground cover plants in ten ¼ m2 quadrats.
You will also determine presence/absence for several disturbance-sensitive and non-native
species over a 10-m wide area along each transect. The presence/absence survey is not designed
to characterize dominance, but some of these species are rarely encountered in the quadrat
sampling, and looking for them over a larger area increases the probability that they will be
found if present on your site. The procedure also helps document the spread of invasives. To
minimize the risk of trampling in the quadrats, always complete your quadrat monitoring
on a given transect before doing the presence/absence monitoring over the larger area!
What is a Quadrat?
A quadrat is a small square frame used to mark the plot for measuring ground vegetation.
The procedures described in this manual use ¼ m2 quadrats, which measure ½ m on each
side. They can be made of either ½-inch PVC or 1- to 1½-inch wide pieces of wood.
Be on the lookout for poison ivy when conducting the ground cover survey, and try to avoid
touching the plant. If you find some where you are placing your quadrat, carefully place the
frame around the plants without touching them. Also, if you are monitoring a bottomland forest,
learn what stinging nettle looks like, so that you will be able to avoid contact with this plant.
27
1. Set up the first ¼ m2 quadrat.
Quadrats must be set at precise locations along the transect, 1 m off of the transect and on
alternating sides. The first two quadrats are always placed to the left of the transect, the second
two quadrats are always placed to the right, the third two to the left again, and so on along the
50- to 100-m section of the transect.
Gather all equipment for this procedure and go to the 50-m point of the first transect. Locate the
first quadrat by going to the 55.0-m mark, which should be marked red. Measure out 1 m on the
left-hand side of the transect (when facing toward 60 m), and place the quadrat precisely in the
area bounded by 55.0 m and 55.5 m along the transect, and bounded by 1 and 1.5 m out from
the transect, as show in Figure 11.
If a large tree or shrub is located within the ¼ m2 area in which you are to place your quadrat
frame, detach one side of the frame and place it around the tree or shrub, but in the specified
area. Any tree or shrub which exceeds 1 m in height will not be counted as part of this
procedure. If a large tree trunk or shrub stem is in the quadrat area, you will still make your
percent cover estimates based on the entire ¼ m2 area.
Figure 11. Place the first ¼ m2 quadrat at the 55-m point along the transect line. It must be 1 m
away from the left side of the transect line and placed precisely between the 55-m and 55.5-m
points.
28
2. Identify selected ground cover species and estimate percent cover in first ¼ m2 quadrat.
To estimate percent cover for a plant species or category, stand directly over (but not in) the
quadrat. Carefully locate all individuals of the plant, then estimate the percentage of the area
inside the square that is “covered” by the vegetation (leaves, flowers, or stems) associated with
that plant (Figure 12). Record your estimate, and then repeat the procedure for the next species
or category. Only consider plants that are rooted in the square. Enter code “A” if none are
present.
Percent cover estimates are recorded within the following percent cover classes:
A
0%
B
<1%
C
1-5%
D
6-25%
E
26-50%
F
51-75%
G
76-95%
H
96-100%
Herbaceous plants are those in which the aerial portion is relatively short-lived, and the tissues are
relatively soft, i.e. non-woody.
Woody plants have bark, stems, and roots which increase in diameter from year-to-year. The tissues
that build up tend to be hard, i.e. woody. Examples include trees, shrubs, and most vines.
If your best estimate of percent cover for a species is “borderline” between two cover classes,
just use your best judgment as to which cover class best represents that plant’s percent cover.
First, record:
a) total percent cover for all herbaceous (non-woody) plants; and
b) total percent cover for all woody plants < 1 m tall (tree seedlings, shrubs, and woody vines.)
While a percent cover estimate is somewhat subjective in nature, some amount of
subjectivity is unavoidable in any scientific study. Fortunately, you are only estimating
what cover class plants fall into, hence the estimate is sufficiently accurate. In addition,
you can make reliable estimates by taking your time and by working in small groups to
compare estimates, and then average them if they differ. After practice, you will become
more confident in your ability to estimate percent cover. One trick that helps is to imagine
that all the plants of given species are in one part of the frame, e.g. in one-half or onefourth of the area; then consider whether the plant coverage would be greater or less than
that area.
29
Figure 12. To determine percent cover of a type of plant, look straight down and estimate the
percent of the ground within the quadrat that is covered by that plant. Include only plants that
are rooted in the quadrat. Do not include dead plants, although brown areas of living plants
should be included.
a) Plant not rooted in transect. Do not include. b) Plants are all one species. Add percent of area
covered by all plants. c) Low-growing plants have other plants towering over them. Include the
total area they cover, including areas where other plants are above them. d) Plant hangs out of
quadrat but is rooted within it. Include the area that the plant covers within the quadrat only. e)
Plants overhang other plants. Include the entire area the plants cover, even where they overhang
other plants. f) Irregular-shaped plant. Include only area plant covers, not gaps between plant
parts. Exact % cover is not needed—simply determine which cover class interval the plant is in.
30
Second, take a few minutes to carefully scan the quadrat for the presence of any of the
following native and non-native ground cover species.
Common Name:
Scientific Name:
Disturbance-Sensitive Species:
blue cohosh
Caulophyllum thalictroides
white trillium (all white species)
Trillium spp.
doll’s eyes
Actaea pachypoda and A. rubra
large-flowered bellwort
Uvularia grandiflora
bleeding hearts (both species)
Dicentra canadensis and
Dicentra cucullaria
maidenhair fern
Adaintum pedatum
Virginia spiderwort
Tradescantia virginiana
hepatica (both species)
sharp-lobed hepatica
round-lobed hepatica
Hepatica nobilis v. acuta (H. acutiloba)
H. nobilis v. obtusa (H. americana)
Common Native Species
Virginia bluebells
Mertensia virginica
wild columbine
Aquilegia canadensis
blue phlox
Phlox divaricata
red trillium
Trillium recurvatum
blue-eyed Mary
Collinsia verna
wild geranium
Geranium maculatum
swamp buttercup
Ranunculus septentrionalis
sensitive fern
Onoclea sensiblis
Non-Native Species:
garlic mustard
Alliaria petiolata
dame’s rocket
Hesperis matronalis
moneywort
Lysimachia nummularia
ground ivy
Glechoma hederacea
gooseberry
Ribes missouriense
Japanese honeysuckle
Lonicera japonica
31
Third, for each of the above species found (i.e., rooted) within the quadrat, estimate and record
the percentage of vegetation cover. If a species is not present, enter code “A.”
Fourth, for tree seedlings < 1 m tall and rooted inside the quadrat, identify all seedlings present.
Seedlings are identified to genus only. Then for each type of tree seedling record the percent
cover.
3. Repeat steps one and two for all remaining quadrats on the transect.
Go to the 60.0 m point and locate the next quadrat again on the left side of the transect, between
60.0 and 60.5 m, and 1.0 m to the left of the transect line. Collect ground cover data as above,
record, then move to the next quadrat location, which is at 65.0 m on the right side, 1.0 m off of
the transect. Collect ground cover data, record, then move on to the next quadrat location at 70.0
m, right-hand side again. Quadrat placement always begins at each 5-m point and is always
exactly 1 m off of the transect, alternating each pair of quadrat locations to the left and right as
shown in Figure 13.
Figure 13. Ten quadrats in total should be set on alternating sides of the transect line.
32
4. Determine presence (+) or absence (-) of disturbance-sensitive and non-native species.
Now backtrack along the transect and carefully note the presence (+) or absence (-) of each of
the above disturbance-sensitive and non-native species in each transect interval, working on one
side of the transect at a time. Do not look for the common native species in this procedure.
Note that the left and right sides of each transect are determined when you are standing at 50 m
and facing 100 m! So when backtracking from 100 to 50 m, the left side of the transect will be
on your right, and the right side will be on your left.
Figure 14. Ten 5 m x 10 m intervals should be surveyed for disturbance-sensitive and nonnative species.
To make sure that you are looking only in the area 5 m to both sides of the line, place the 10-m
segment ropes perpendicular to the transect line at the start and end of each segment. (See
Figure 15.) You will have to move the 10-m ropes from transect interval to transect interval as
you proceed back to the 50-m point. To help you keep track of the intervals, it is helpful to place
wire flags at the corners of each 5 x 10 plot.
33
5. Repeat steps one through four for the remaining two transects at your site.
Figure 15. Use the 10-m ropes as guides to mark the sampling area. The ropes can be moved as
successive intervals are sampled.
Procedure Summary: Ground Cover Survey
On each of three transects between 50 and 100 m you will:
1.
Set up ¼ m2 quadrats at 55, 60, 65, 70, 75, 80, 85, 90, 95, and 100 m.
•
Quadrats must be placed at precise locations 1 m off of transect.
• Place each paired sequence of quadrats on alternate sides: 55 and 60 go on left, 65 and
70 on right, 75 and 80 on left, etc.
• First quadrat is bounded by 55.0 m, 55.5 m, and by 1.0 and 1.5 m from the transect line
(to left of line).
2. Estimate total percent cover in each ¼ m2 quadrat for:
•
All herbaceous plants; and
•
All woody plants < 1 m tall.
34
Use percent cover classes listed on data sheet. To be counted, a plant must be rooted in the
square.
3. Identify and estimate percent cover for selected disturbance-sensitive, common native, and
non-native ground cover species in each ¼ m2 quadrat. (Use percent cover classes: plants
must be rooted in square.)
4. Identify and estimate percent cover for tree seedlings < 1 m tall in each ¼ m2 quadrat.
5. Record presence (+) or absence (-) of selected disturbance-sensitive and non-native
species in each of ten 5- by 10-m areas along transect.
Human Use and Topography - Spring Session
Purpose:
In this procedure, information is collected on general forest conditions. You will look for signs
of human use and characterize the topography of the site.
Signs of Human Use
People use forests for a variety of reasons. Many uses of forests by humans have resulted in
some type of disturbance, or habitat disruption, to the forest. Looking for signs of how people
have used the forest in the past, up through the present, may provide clues which help explain
current forest conditions.
One important human use of forests has been that of timber harvesting. At one time or another,
almost all of Illinois’ forests were logged. Today, many forestry projects are underway in
Illinois, including not only harvesting, but tree planting and other activities related to forest
resource management.
A large number of forest habitat restoration projects are underway across the state to restore
forests to their natural condition. Restoration activities can include the removal of exotic plants,
planting native plants, using fire as a management tool, and others.
Topography
One important factor that has a direct influence on vegetation is that of topography, which is
the variation in elevation of the land surface. A hilly area will offer more variable conditions,
and thus more variable habitat for plants, than a flat area. In addition, the aspect, or direction of
the slope of the land from uphill to downhill, is also important because south- and west-facing
exposures result in drier conditions than north- and east-facing exposures. Some species of
plants prefer dry, exposed conditions while some prefer more shaded, protected areas.
Materials (for one transect):
pencils
clipboard
Human Uses/Topography data sheet (one per site)
35
1. Survey for human uses between 50 and 100 m on each transect.
Carefully look for any signs of human use which you may notice along each transect. Record
any human uses as you observe them.
When looking for signs of human uses, you should look in the general vicinity of your forest
site (both on, and adjacent to, the 10- by 50-m transect areas). Ignore far away signs like
highway noise, an airplane high in the sky, nearby residences, and so on. Do consider things
like deer-hunting stands, seeing other people in the forest, clear evidence of logging (e.g. cleancut tree stumps), restoration activity (cut brush, charred tree trunks, etc.), cattle grazing (e.g.
old barbed wire fencing), or previous agricultural activity, and the like.
2. Note topography along the transects.
After you have finished recording your human use information, note whether the topography
along the transects is flat, gradually but more or less continually sloping, or hilly. If gradually
sloping, indicate the compass bearing of the general direction in which the slope is facing, from
uphill to downhill. The direction of the slope is referred to as the “aspect.”
When you contact the landowner or land manager to inform him/her of your monitoring trip,
ask him/her whether restoration work is being conducted on the site, and if so, what specifically
is being done. Also ask the owner/manager about the general history of the site (e.g. logging,
grazing, etc.). This information will supplement your own knowledge or observations made
Procedure
Summary: Human Use and Topography
when
monitoring.
On each of three transects between 50 and 100 m, you will complete the following steps:
1. Look for any signs of human use which you may notice while walking. Only look in
the general vicinity of the site.
2. Note topography along the transects: flat, gradually sloping, or hilly. Record. If
sloping, record the compass bearing of the general direction slope is facing.
36
Appendix A
FACTORS THAT AFFECT FOREST ECOLOGICAL INTEGRITY
A forest is a complex, dynamic system of organisms, soil, and a variety of other environmental
factors. Given the complexity of forest ecosystems, the introduction of a disturbance into the
forest can significantly alter the delicate balance of factors that control the dynamics of the
forest. If the disturbance is of a sufficient frequency, duration or intensity, the forest will
undergo changes that influence the suitability of the forest as habitat for native organisms.
Illinois Forests
Forests provide many functions that often are unnoticed. Beyond the more obvious benefits
such as recreational uses, wood products, and the unlimited beauty and aesthetic appeal which
forests provide, forests are vital to the maintenance of biodiversity in the state. Forests are
home to over 60 percent of the state’s native plants, and provide 75 percent of the state’s
wildlife habitat. Healthy forests also help to stabilize soils and reduce erosion, they control
stream flow and stabilize water tables, and they reduce global warming.
Illinois has a great diversity of forests, thanks largely to the fact that the state spans
approximately 400 miles from north to south and features a wide range of climate, soils,
topography, and other factors which affect habitat. Forest types vary from open canopy
woodlands to dense forests and from upland to bottomland. Plant species composition will vary
significantly depending on soil moisture, light penetration, and other factors. Despite this
diversity in the composition and ecological characteristics of the state’s forests, all of them are
affected in some way by human-induced disturbances or forest management decisions.
Disturbance
A disturbance is a natural or human-induced event that alters an ecosystem and results in the
mortality of organisms. Examples of natural disturbances include fire caused by lightning,
wind, natural flooding, and drought. Examples of human disturbances include land clearing,
timber harvesting, livestock grazing, prescribed burning, and the introduction of exotic species.
An important distinction between natural and human-induced disturbances is that organisms
have generally developed tolerances or adaptations to natural disturbances, and are often
dependent on them for survival, but are often unable to adapt to the forms or levels of
disturbances caused by humans. (It should be noted that prescribed burning is implemented to
restore a natural fire regime to an ecosystem.)
Plant species have a range of tolerances to various environmental variables, including
disturbance. Many spring wildflowers, or “spring ephemerals,” such as species of Trillium,
Dutchman’s-breeches, blue cohosh, and large-flowered bellwort, are intolerant of humanrelated disturbance. A decline in the presence or abundance of these plants may indicate that
some type of habitat degradation is occurring.
Fire
Fire was once an important part of Midwestern ecosystems, particularly in upland areas.
Midwestern prairies, savannas, and open-canopied woodlands were maintained by the
combination of fire and relatively low levels of moisture as compared with the forests further
east. Fire once swept across the landscape and covered an extensive area. The wind helped
guide the flames which stopped at waterways. Today, this phenomenon is greatly reduced.
There is a concerted effort to stop fires from burning, and those fires that do occur are limited
by fragmentation of forests. This pattern results in a change in composition of the forest as firetolerant species (like oaks) are unable to regenerate, while the fire-intolerant species (like sugar
maple) now can survive and grow into the canopy. Species that survive fires, like oaks, are still
37
around but are on the decline as they need higher light levels than maples to grow and usually
require some type of disturbance to create light gaps to allow them to grow into the canopy.
Thus, oak woodlands are not just fire tolerant, they are actually fire-dependent communities
which become degraded in the absence of fire.
Fire was historically responsible for limiting survival of fire-intolerant sugar maples in exposed
areas more likely to burn. One result of fire suppression is “maple takeover,” a situation in
upland forests where maples begin to dominate the site and replace the oaks, hickories, or other
native species that were formerly dominant. While maple trees are native to Illinois and are
ecologically valuable in their own right, maple takeover is a concern for three primary reasons:
•
•
•
Oak-hickory forests were the predominant type of forest in Illinois prior to European
settlement.
Oaks and hickories provide a great deal of food for wildlife. Many animals feed on
maple seeds, but acorns and hickory nuts are a staple for many species of wildlife.
Many native plant species of the forest understory are adapted to the shade levels
associated with oak-hickory forests. Some cannot survive under the heavy shade
conditions of a maple-dominated forest.
Exotic Plants
Exotics are species not native to this country. Most exotic species come from Europe or Asia.
The majority of exotic plants are ornamentals that have been introduced to this country by
landowners and government agencies for a variety of reasons, including erosion control,
hedgerows, and garden plantings. Once exotics become established in a country or region, they
are considered invasive if they begin to replace native vegetation. Such plants generally are not
invasive in their own native country because there are natural controls present.
Generally, few exotic plants become problematic, but the few that do often become extreme
nuisances. They typically grow quickly and produce many new plants each year. Their spread
may be accelerated by grazing or other human-induced activities around the forest. The result is
that they take over a site and crowd out many native species. Exotic plants have become
established in all vertical layers of the forest; examples include garlic mustard in the ground
layer, multiflora rose and species of buckthorn and honeysuckle in the shrub layer, and trees
such as white mulberry.
Exotic Insects
Many native insects inhabit the forest ecosystem. These generally cause a cyclical amount of
damage each year, which is limited by natural controls. However, some exotic insects, such as
gypsy moths, can cause a significant amount of damage because they have few, if any, natural
controls to limit their spread.
Exotic Diseases
Diseases are another major problem in forests. Two well-known examples of exotic diseases
are chestnut blight, which wiped out the American chestnut, and Dutch elm disease, which has
significantly reduced the American elm population in the state. Because of these two diseases,
few American chestnut and American elm become large trees. The diseases attack and kill the
young trees. Another disease that is relatively new to the U.S. is dogwood anthracnose. This
disease attacks flowering dogwood trees. Dogwood anthracnose has spread from the east and
occurs in Illinois.
38
Deforestation and Fragmentation
Much of the pre-settlement forest in Illinois has been cleared for agriculture or urbanization.
Most of the land suitable for farming is in use as farmland. In recent decades, there has been a
slow increase in total forested area as some farms have been abandoned and replaced with
forest. Urban sprawl still threatens forests in certain areas; however slowing urban sprawl may
help save some of the remaining forests.
Illinois forests have become highly fragmented as they have been dissected by roads and large
areas cleared for agriculture, urbanization, and tree harvesting. The larger forest patches can be
found in the southern portion of the state. Most of the forests in Illinois exist as either small
patches or as strings of trees along a waterway. Many plants and animals require large patches
of forest to survive, whereas small patches tend to be dominated by common species.
As forest fragmentation increases, the amount of edge area also increases, which increases the
condition known as the “edge effect.” This change includes physical factors, like increased
wind and solar radiation, and changes in biotic factors. Many exotic plants establish themselves
at the forest edge and then gradually invade the forest interior, replacing native plants over
time. Certain animals are associated with forest edges and can be detrimental to more interior
forest animals as patch size decreases. Predators like raccoons and feral cats travel along forest
edges and prey on other animals. The brown-headed cowbird is native to Illinois and uses forest
edges for reproduction. These birds are brood parasites, meaning they lay their eggs in the nests
of other birds (host species) which raise the cowbird chicks as their own. Typically, the host’s
young do not survive as the cowbird chick grows quickly and is very aggressive. This situation
results in a reduction in the population size of the host species while cowbird numbers increase.
Pollution
Pollution can have a harmful effect on the organisms in the forest. There are various sources of
pollution, the most common coming from precipitation and run-off. Much of the atmospheric
pollution comes from automobiles and industry. These sources produce greenhouse gases and
the compounds that lead to acid rain. The pollutants enter the atmosphere and then travel away
from the source of pollution. Because of our weather patterns, most of these pollutants move
east and north, resulting in acid rain developing in the New England states and Canada.
However, some atmospheric pollution does remain in the state. An additional source of
pollution is chemicals applied to the ground or vegetation for insect and weed control.
The effects of pollution often go unnoticed until there is extensive mortality. Pollution by itself,
however, rarely kills trees. Pollution stresses a tree, thus making it susceptible to disease and
insect pests which may then kill the tree, affecting light levels in the forest understory.
39
Appendix B
INTERPRETING YOUR DATA
There is much that you can learn about the forest you have monitored by conducting your own
informal analysis of the data for your site. This appendix includes some suggestions as to how
you can interpret your own data using both qualitative, or observational, techniques, as well as
some simple quantitative methods.
Some of the following methods will show you ways in which you can conduct long-term trend
analysis for your site. However, even by looking at one year of data, you can start to answer
such questions as:
What type of forest is it?
How stable is your forest? Are its trees regenerating?
What does the presence of certain indicator plant species suggest about the ecological
integrity of your forest?
The distinction between long-term trend analysis and one-year data analysis is analogous to a
movie versus a picture: one tells a story over time, and the other tells you what things look like
at a given moment. Both are important, but the point is that you can learn much from the data
that you collect in any given year.
What Type of Forest is It?
A very basic question you should ask about your forest is what type of forest it is. Illinois
forests have been classified into seven broad categories based on the dominant tree species
present. Ecological dominance refers to the extent to which a species or group of species is
able to control environmental conditions within a forest through abundance, frequency, and/or
coverage, thereby controlling or influencing the rest of the community. Abundance is simply
the number of individual trees present. (Density is the number of trees in a specified area, e.g.
trees/hectare). Frequency is the percentage of plots in which a tree occurs. Coverage is the
percentage of ground that is covered by the vegetation associated with a plant; for trees, this is
difficult to determine, and it is usually estimated with basal area, which is the cross-sectional
area of a tree’s trunk at breast height. (Basal area is proportional to coverage.)
The seven major forest types in Illinois are:
oak-hickory
oak-pine
maple-beech
loblolly, shortleaf pine
elm-ash-red maple
white, red, jack pine
oak-gum-cypress
The most common type of forest in Illinois is oak-hickory (50.2%), followed by maple-beech
(26.0%), elm-ash-red maple (17.9%), and oak-gum-cypress (3.4%). Together, these four forest
types comprise over 97% of commercial forestland in Illinois (based on 1985 data). Common
associates of oak-hickory forests include tulip tree, elm, maple, black walnut, black locust, and
sassafras. Common associates of maple-beech forests include elm and basswood. For elm-ashred maple forests, common associates are cottonwood, box elder, willow, sycamore, and beech.
In oak-gum-cypress forests, dominant species include tupelo gum, sour gum, sweet gum, oak
and cypress, and common associates include cottonwood, willow, ash, elm, hackberry and
maple.
40
In some cases, you may be able to tell just by looking at your data which type of forest you
have. Make a list of tree species found, organized from most to least numerous. Look at the
species on top; if one or more taxa are numerically dominant, and these relate to one of the
above forest types, then your forest would probably be classified as that type of forest.
However, often a forest will contain species representing more than one forest type. In addition,
as indicated above, abundance is not the only factor which determines species dominance;
frequency and coverage (as measured by basal area of trees) also influence the relative
dominance of a given species in the community. For this reason, ecologists often calculate an
“importance value,” which provides an overall estimate of the ecological influence or
importance of a species in the community based on abundance, frequency and coverage, or any
two of the three. Tree taxa can then be ranked according to their importance values, with the
highest-ranked trees representing the dominant species. The importance values for the trees can
also be compared from year to year to see how dominance is changing in the forest.
Instructions are provided on how you can calculate a simple importance value for the trees in
your forest. This procedure will require the calculation of relative abundance and relative
coverage. Relative abundance of a species is the total number of individuals of that species
divided by the total number of individuals of all species. Relative coverage of a species is the
proportion of the coverage (for trees, total basal area) for that species divided by the total
coverage for all species present.
41
How Stable is Your Forest?
The next thing you can look at is forest stability. Look again at your tree data and determine
whether the younger trees in the understory (seedlings and saplings) are the same species as the
mature canopy trees. If so, this is an indication that the trees in your forest are successfully
regenerating, and that the forest is stable. If the seedlings and saplings are different than the
canopy trees, this is an indication that the species composition of the trees in your forest is
changing.
Sugar maples are slowly replacing oak and hickory trees in Illinois forests. This process is a
concern because of the ecological value of oak and hickory trees. You can easily assess the
extent of maple takeover in your forest by calculating the following ratio separately for
seedlings, saplings, and canopy trees.
# of sugar maples
# oaks and hickories
Seedlings are trees < 1 m tall. Saplings will be defined as all trees > 1 m tall and less than 10
cm DBH. Canopy trees are assumed to be anything larger than 10 cm DBH. You can get a
quick idea of the extent of maple takeover in your forest by looking at these ratios for any given
year; if the ratios are much greater for seedlings and saplings than for canopy trees, this is an
indication that maple takeover is occurring. You can also track these ratios over time to see
how they are changing.
You might also conduct a more detailed analysis by comparing the abundance of oaks and
maples for each size class. The results can be visually compared using a simple bar chart.
Interpreting the Presence of Indicator Plant Species
One simple but important qualitative assessment you can conduct is to review your shrub and
ground cover data sheets for the presence of disturbance-sensitive and non-native species.
These species are biological indicators, meaning that their presence tells us something about
the condition of the forest.
All of the disturbance-sensitive species included are associated with high-quality forests
because they are known to be intolerant of human disturbance. If the disturbance occurs with
sufficient frequency, intensity, or duration, these species will disappear. As such, their presence
is an important indicator of the ecological integrity of a forest, and if any of these species were
present on your site, this is an indication that your site is in a high-quality forest.
Conversely, the non-native, or exotic, species represent a potential problem with the quality of
a forest, because they are known to be aggressive invasive plants that can crowd out many
native species, and in the process reduce biodiversity of the forest. Unfortunately, most Illinois
forests already have several non-native species present; thus it becomes important to monitor
not only their presence, but also the extent of their presence, as measured through coverage or
density. This information can be used to track the change in non-native species dominance over
time at your site. For shrubs, you can calculate the average percent of non-native stems to total
stems for your site; for ground cover, you can calculate the total percent cover of all non-native
species, averaged across all 30 quadrats on your site.
42
A simple quantitative assessment that you can conduct for indicator species in the ground layer
is to construct a ratio of the total percent cover of all disturbance-sensitive species divided by
the total percent cover of all non-native species, averaged across all 30 quadrats on your site.
(Use the midpoints of each size class to calculate the ratio.) The result will give an indication as
to the relative dominance of the disturbance-sensitive species versus the non-native species in
the ground layer, and how the balance may be changing between the two over time.
A more detailed analysis of the percent cover data from the quadrats can also be calculated for
individual taxa as follows. You will need to use the midpoint of the cover classes. Look at the
following hypothetical data from a site and the results generated.
Number of Quadrats:
Species
hepatica
bleeding hearts
Virginia bluebells
garlic mustard
Cover Class C
2
3
1
3
Cover Class D
2
3
5
Cover Class E
4
Cover Class F
1
Total coverage for each species (numbers in parentheses are midpoints of each cover class):
hepatica - 2 x (2.5) = 5
bleeding hearts - [3 x (2.5)] + [2 x (15.5)] = 38.5
Virginia bluebells - [1 x (2.5)] + [3 x (15.5)] = 49
garlic mustard - [3 x (2.5)] + [5 x (15.5)] + [4 x (38)] + [1 x (63)] = 300
Divide the resulting number by the total number of quadrats. In this case, we had 30 (the
number for a site), giving the mean cover per quadrat:
Hepatica = 0.17%
bleeding hearts = 1.28%
Virginia bluebells = 1.63%
garlic mustard = 10%
Here are some questions you can answer to help you assess the presence and/or influence of
indicator species:
1.
2.
3.
4.
Are any disturbance-sensitive species present?
Are any non-native species present?
If present, how dominant are the non-native species?
Calculate the ratio of average cover for all disturbance-sensitive species to average
cover for all non-native species, for the ground layer.
5. Track all of the above factors over time at your site.
43
How to Calculate an Ecological Importance Value for the Trees on Your Site
The following calculations will be demonstrated using actual data collected from a forest in
northern Illinois.
1.
Use all of the tree data from all three transects.
2.
Make a copy of Table 1- Ecological Importance Value. List the common names of all tree
taxa that you recorded on the tree survey data sheets, in the first column. (See Table 2 for
example using actual data collected from a northern Illinois forest.)
3.
List the number of individual trees for each taxon in the second column.
4.
Calculate the relative abundance of each taxon and enter in column 3. Relative abundance
(RAi) is calculated as the abundance (# of individuals) of species i divided by total abundance
for all species:
RAi = Ai ÷ TA
Using the data from Table 2 for black walnut:
RAbw = 2 ÷ 29 = .069 = 6.9%
5.
Using Table 3, Coverage Chart for Individual Trees, sum up the basal areas for individual
trees for each taxon, and enter result in column 4 of Table 1. Table 4 shows how the basal areas
of the trees in our example data set were summed to derive coverage totals for each tree taxon.
6.
Calculate the relative coverage of each taxon and enter in column 5. Relative coverage
(RCi) is calculated as the coverage of species i divided by total coverage for all species
RCi = Ci ÷ TC
Using the sample data again for black walnut:
RCbw = .2552 ÷ 5.209 = .049 = 4.9%
7.
Calculate the importance value for each taxon and enter into the last column (6).
Importance value is simply the sum of columns 3 (RAi) and 5 (RCi):
IVi = SUM (RAi +RCi)
For our black walnut example:
IVi = 6.9 + 4.9 = 11.8
As a check on your math, column 6 should total exactly 200.
8.
When you have completed Table 1, you can rank the tree taxa from highest to lowest IV
scores and use this information to determine what type of forest you have.
44
Table 1. Ecological Importance Value
1
2
3
4
Tree Species Abundance % Relative Abundance Coverage
(A)
(RAi)
(m2)
(i)
5
6
% Relative Coverage Importance Value
(RCi)
(IV)
TOTALS
Table 2. Ecological Importance Value
Northern Illinois Forest Example
1
Tree Species
(i)
2
Abundance
(A)
3
% Relative
Abundance
(RAi)
4
Coverage
(m2)
5
% Relative
Coverage
(RCi)
6
Importance
Value (IV)
4.9%
16.5%
16.9%
61.7%
11.8
33.7
44.5
110.0
100.0%
200
black walnut
red oak
sugar Maple
white oak
2
5
8
14
6.9%
17.2%
27.6%
48.3%
.2552
.8581
.8797
3.216
TOTALS
29
100.0%
5.209
45
Table 3. Coverage Chart for Individual Trees
DBH Interval
(cm)
0-5
5-10
10-20
20-30
30-40
40-50
50-60
DBH Midpoint
(cm)
2.5
7.5
15
25
35
45
55
Basal Area
(m2)
0.0005
0.0044
0.0177
0.0491
0.0962
0.159
0.2376
For trees with a DBH > 60 cm, calculate basal area using the following formula and the exact
DBH measurement:
Basal Area (Area of a Circle) = π r 2, where
π = 3.14
r = radius = ½ DBH
Then divide the result by 10,000 to convert cm2 to m2.
Example for a tree with a DBH of 65 cm:
Basal Area = 3.14 (1/2 x 65)2
= 3.14 (32.5)2
= 3.14 (1056.25)
= 3316.625 cm2 ÷ 10,000 = .3317 m2
46
Table 4. Calculation of Coverage by Species
Northern Illinois Forest Example
Species:
black walnut
red oak
Tree #:
1
2
DBH Midpoint:
35
45
Basal Area:
0.0962
0.1590
0.2552
1
2
3
4
5
55
55
25
55
35
0.2376
0.2376
0.0491
0.2376
0.0962
0.8581
sugar maple
1
2
3
4
5
6
7
8
75
25
35
25
35
25
25
25
0.4418
0.0491
0.0962
0.0491
0.0962
0.0491
0.0491
0.0491
0.8797
white oak
1
2
3
4
5
6
7
8
9
10
11
12
13
14
45
55
45
65
35
65
35
35
35
65
35
55
55
95
0.1590
0.2376
0.1590
0.3318
0.0962
0.3318
0.0962
0.0962
0.0962
0.3318
0.0962
0.2376
0.2376
0.7088
3.216
47
Appendix C
TREE IDENTIFICATION BASICS
In order to identify trees to species, you will need to use a recognized tree key. Tree Finder by
May Watts is strongly recommended. Binoculars and a hand lens are also useful for identifying
trees. Binoculars are very helpful when all of a tree’s leaves are high in the canopy, a common
problem in mature forests.
Before you try to “key out” a tree, you should always begin by carefully observing the basic
features of the tree, paying particular attention to the leaves and branches. Look at several
different leaves and branches, to avoid being misled by atypical leaves or branches where
leaves are missing. Once you have a good idea of what the tree looks like, start at the beginning
of your key, and proceed step by step. Each step will give you two choices. Based on how well
the tree fits one of the choices, you choose that one. When you have worked through the key to
your final choice, compare your tree with the description of the tree that you have identified in
the key to see if they match. If they do not match, you will have to backtrack in the key and see
where you might have gone wrong. If you are unable to identify a tree with confidence, record
it as “unidentified sp. #x.”
Important Tree Features
Some of the tree features that you will need to know include:
Leaf - has a bud at its base. Sometimes when you are looking at a “leaf” you may be looking at
only a small portion of the leaf. You can tell if you have a whole leaf by looking at where the
“leaf” joins the “twig.” If there is a little bud where the two meet, then you have a true leaf. If
not, then you are looking at one leaflet of a compound leaf that is made up of many leaflets.
Look father down the twig until you find a bud.
Figure 16. A leaf has a bud at its base where it joins the twig. It may have a single blade (a) or
it may be made up of many leaflets (b).
48
Compound leaves - are made up of many leaflets. Leaflets do not have a
bud at their base.
Palmately compound - leaflets radiate from one point.
Pinnately compound - leaflets are attached to each side of the leaf
stem.
Doubly pinnately compound - leaflets are attached to lateral stems
off of the main stem.
Simple leaves - have only one big blade and have a bud at their base. (Figure 16a.)
Opposite leaves - grow in pairs opposite one another on the twig. (Figure 17a.)
Alternate leaves - grow singly on alternate sides of the twig. (Figure 17b.)
Figure 17. Opposite leaves (a) grow in pairs opposite one another on the twig. Alternate leaves
(b) grow singly on alternate sides of the twig.
49
Whorled leaves - three or more leaves grow in a circle around the twig.
Lobed leaves - the leaf has lobes (where the blade sticks out) and sinuses
(where the blade curves in).
Toothed leaves - the leaf has small teeth along its edge.
Doubly toothed leaves - the leaf has small teeth on larger teeth
along its edge.
Entire leaves - the leaf has a smooth edge, with no lobes or teeth.
Symmetrical leaf - the right and left sides are mirror images of one
another.
Asymmetrical leaf - the right and left sides do not mirror one
another.
50
Appendix D
Data Sheets
DATE:
MONITORS: __________________________
Sketch the site and exact location of all transect stakes, and at least one reasonably permanent
landmark for each stake. Include bearing reading for transect lines and GPS reading if
available.
↑N
Compass bearing of
transect
GPS reading
Latitude
______
Longitude _________
51
Date: ____________________
Transect: __________________
Monitors: __________________
TREE SURVEY
TRANSECT INTERVALS
Use one line for each species encountered along the transect line. Record the letter representing
the size class for each tree in the correct column below. Record the letter G and actual DBH
measurements for trees with DBH > 60 cm.
TREE NAME
50 m - 60 m
*EXAMPLE
Truffula Tree
A, A, B, C, C,
D, G
60 m - 80 m 70 m - 80 m 80 m - 90 m
B
C, C, F, G,
A, A
90 m -100 m
B, B, B, C, C,
D
DBH > 60
cm
61.72
SIZE CLASS TOTALS
Record the sum of each size
class for each tree identified on
the transect.
A
B
C
D
E
F
G
4
5
6
2
0
1
2
SIZE CLASSES:
A= 5 cm - 10 cm
D= 30.1 cm - 40 cm
G= all trees with DBH > 60 cm
B= 10.1 cm - 20 cm E= 40.1 cm - 50 cm
For all trees with DBH > 60 cm, enter G in the correct interval and
C= 20.1 cm - 30 cm F= 50.1 cm - 60 cm
enter the exact measurement in the column titled “DBH > 60 cm.”
REMEMBER!!! TOTAL THE NUMBER OF TREES IDENTIFIED IN EACH SIZE CLASS AFTER YOU HAVE
COMPLETED THE TRANSECT.
52
DATE_______________________
_____
TRANSECT:
MONITORS: _________________
SHRUB LAYER SURVEY
For each transect interval, tally the number of stems for all shrubs, vines, and tree saplings < 5 cm DBH, at least 1 m tall,
and rooted within a 2-m belt centered on the transect. Enter the total number of stems in the TOTAL column. Record 0
for each shrub and vine NOT encountered. Write the actual names of the “other” shrubs at the bottom of the sheet.
YOU DO NOT RECORD SNAGS IN THIS SURVEY.
Shrub/Vine Species
50 m-60 m
60 m-70 m
70 m-80 m
80 m-90 m
90 m-100 m
SUM
TOTAL
Missouri
gooseberry
ALL Other Shrubs
(e.g.: hazelnut, gray
dogwood, sumac,
blackberry, raspberry, black
haw, etc.)
Japanese honeysuckle
(vine)
All Other Vines
TREE SAPLINGS
50 m-60 m
60 m-70 m
70 m-80 m
80 m-90 m
90 m-100 m
TOTAL
honeysuckle shrubs
buckthorn
non-native only
high-bush cranberry
autumn olive
multiflora rose
Did you notice KUDZU or ORIENTAL BITTERSWEET along the transect?
KUDZU □YES □NO
BITTERSWEET □YES □NO
53
DATE: _________________________
TRANSECT: ____________________
MONITORS: ___________________
VEGETATIVE SHADING SURVEY
In the boxes below, indicate the presence (+) or absence (-) of vegetation (leaves, twigs, or branches) seen
through the ocular tube. Measurements are to be taken at 2-meter intervals within each transect interval.
Record the number of + signs for each transect interval in the row marked “HITS.” Record the sum of this
column in the lower right box (“TOTAL HITS”).
50-60 m
+/-
60-70 m
52 m
54 m
56 m
58 m
60 m
+/-
62 m
64 m
66 m
68 m
70 m
70-80 m
+/-
72 m
74 m
76 m
78 m
80 m
80-90 m
82 m
84 m
86 m
88 m
90 m
+/-
90-100 m
+/-
TOTAL
HITS
92 m
94 m
96 m
98 m
100 m
HITS (+)
DOGWOOD ANTHRACNOSE SURVEY
1. Were flowering dogwoods recorded in any of the surveys? They must be flowering dogwood.
YES
NO
If yes, check the survey(s) in which they were detected:
____Tree survey
___
Shrub/sapling survey
2. Record the number of flowering dogwood trees present in each transect interval and the number
of infected trees.
50 m – 60 m
60 m – 70 m
70 m – 80 m
80 m – 90 m
90 m – 100 m
# trees from Tree Survey
# infected trees
# saplings from Shrub Survey
# infected saplings
GYPSY MOTH SURVEY
Observe all the trees in the tree survey area with a DBH ≥ 5cm for signs of gypsy moth egg masses. If you
believe egg masses are present, complete the following information. Otherwise, check “no gypsy moth egg
masses detected.”
_____NO GYPSY MOTH EGG MASSES DETECTED
TREE NAME
EXACT DBH
(cm)
NEAREST 10-m POINT OF
TRANSECT
(50, 60, 70, 80, 90, or 100 m)
DISTANCE AND BEARING
FROM NEAREST 10-m
POINT
DISTANCE (m)
BEARING
Based on the topography, tree species composition, and other factors of the site, do you consider
the site to be:
__UPLAND
BOTTOMLAND
UNSURE?
54
DATE:
TRANSECT:
MONITORS: ________________
PERCENT COVER OF HERBACEOUS PLANTS AND WOODY PLANTS
Determine the % coverage of herbaceous and woody plants within each of the 10 quadrats. Then determine
the % cover for each species listed below. Use the % cover classes provided at the bottom of the page. Be sure
to enter “A” for 0% cover for each species not encountered.
PLANT TYPE/ SPECIES
55 m
left
60 m
left
65 m
right
70 m
right
75 m
left
80 m
left
85 m
right
90 m
right
95 m
left
100 m
left
HERACEOUS
WOODY
DISTURBANCESENSITIVE
BLUE COHOSH
MAIDENHAIR FERN
LARGE-FLOWERED
BELLWORT
WHITE TRILLIUM (ALL
SPECIES)
BLEEDING HEARTS
(BOTH)
DOLL’S EYES (BOTH
SPECIES)
VIRGINIA SPIDERWORT
HEPATICA (BOTH
VARIETIES)
COMMON NATIVE
VIRGINIA BLUEBELLS
WILD COLUMBINE
BLUE PHLOX
RED TRILLIUM
BLUE-EYED MARY
WILD GERANIUM
SENSITIVE FERN
SWAMP BUTTERCUP
NON-NATIVE/NATIVE
INVASIVE
GARLIC MUSTARD
DAME’S ROCKET
MONEYWORT
GROUND IVY
JAPANESE
HONEYSUCKLE
MISSOURI
GOOSEBERRY
TREE SEEDLING SURVEY
Identify tree seedlings < 1 m tall to genus and determine the % cover of each seedling rooted within the quadrat. Use
the % cover classes provided.
TREE
55 m
60 m 65 m
70 m
75 m
80 m
85 m
90 m
95 m 100 m
left
left
right right
left
left
right
right
left
left
A = 0%
B = < 1%
C = 1% - 5%
% COVER CLASSES
D = 6% - 25%
G = 76% - 95%
E = 26% - 50%
H = 96% - 100%
F = 51% - 75%
55
DATE:
TRANSECT: __________________________
MONITOR: ___________________________
PRESENCE/ABSENCE OF DISTURBANCE-SENSITIVE AND NON-NATIVE SPECIES
Determine the presence (+) and absence (-) of the following species within 5 meters on the left and right sides of
each transect interval. Each box must be filled in with either “+” or “-.”
SPECIES
50 m – 60 m
LEFT RIGHT
60 m – 70 m
70 m – 80 m
80 m- 90 m
90 m – 100 m
LEFT RIGHT LEFT RIGHT LEFT RIGHT LEFT
RIGHT
DISTURBANCESENSITIVE
BLUE COHOSH
MAIDENHAIR FERN
LARGE-FLOWERED
BELLWORT
WHITE TRILLIUM
(ALL SPECIES)
DOLL’S EYES
(BOTH SPECIES)
BLEEDING HEARTS
(BOTH SPECIES)
HEPATICA
(BOTH VARIETIES)
VIRGINIA
SPIDERWORT
INVASIVE
GARLIC MUSTARD
DAME’S ROCKET
MONEYWORT
GROUND IVY
MISSOURI
GOOSEBERRY
JAPANESE
HONEYSUCKLE
NOTES:
56
DATE: _______________________
MONITORS:__________________
HUMAN USE AND TOPOGRAPHY
COMPLETE ONLY ONE SHEET FOR THIS ENTIRE SITE
Part I.
Check off each human disturbance feature you find along ALL THREE TRANSECTS. Check the box if no
features are present.
 No features present
_____A. Cut Tree Stumps
____B. Other People
____C. Hiking Trail
____D. Vehicle Trail
E. Collected Garbage ____F. Strewn Garbage ____G. Grazing (evidence of grazing by domestic livestock)
_____H. Human Structure(s): List ___________________________________________________________
_____I. OTHER: _________________________________________________________________________
Part II.
Did you notice any signs of deer browse in the monitoring area? (Please circle one of the following.)
YES
NO
UNSURE
Are there any timber harvest activities presently occurring in the forest? (Please circle one of the following.)
YES
NO
UNSURE
Are there any restoration activities presently occurring in the forest? (Please circle one of the following.)
YES
NO
UNSURE
• If YES, how long has the restoration been underway? ______________________________________
• If YES, place an “X” in the blank next to the appropriate restoration activity listed below. If an activity listed
below is not occurring in the forest, then leave the line blank. If there is a restoration activity occurring in the
forest, and it is not listed below, please provide this activity in the blank titled OTHER.
_____TREE PLANTING
_____LIVE TREE REMOVAL
_____DISEASED TREE REMOVAL
_____PRESCRIBED BURNING
_____HERBICIDE USE
_____OTHER PLANTING
_____DEAD TREE REMOVAL
_____REMOVAL OF EXOTIC PLANTS
_____PRESCRIBED FLOODING
_
____TREE GIRDLING/SNAG CREATION
_____ OTHER:
_____OTHER:
Part III.
Based on clear signs that you have observed or on information from the landowner or land manager, does the site
have a history of:
livestock grazing
crop planting
timber harvesting
YES
YES
YES
NO
NO
NO
UNSURE
UNSURE
UNSURE
(Please circle one.)
(Please circle one.)
(Please circle one.)
TOPOGRAPHY OF YOUR SITE
Indicate the general topography of the three transects by checking one selection below. If the site is gradually
sloping, indicate the general direction the slope is facing (the ASPECT) in degrees (e.g., a north-facing slope
would have 0° for aspect of slope.)
GRADUALLY SLOPING
FLAT
HILLY
➜
Aspect of slope (in degrees)
57
Appendix E
Equipment
Ocular Tube
The ocular tube can be constructed of PVC pipe with a 1 ½ inch diameter. The tube should be
about 18 cm long (approximately seven inches) and have crosshairs at the end. Crosshairs can
be made of sewing thread or dental floss taped to the end of the tube. A hand saw can be used
to cut the PVC. An ocular tube could be constructed of other materials, for example a toilet
paper tube, but sturdier materials are recommended.
58


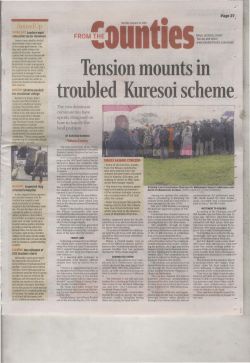


© Copyright 2026