
Inquiry-Based Science Instruction—What Is It and Does It Matter?
JOURNAL OF RESEARCH IN SCIENCE TEACHING
Inquiry-Based Science Instruction—What Is It and Does It Matter?
Results from a Research Synthesis Years 1984 to 2002
Daphne D. Minner,1 Abigail Jurist Levy,1 Jeanne Century2
1
Education Development Center, Inc., 55 Chapel Street, Newton, Massachusetts 02458
2
Center for Elementary Mathematics and Science Education, University of Chicago,
5640 S. Ellis EFI Box 15, Chicago, Illinois 60637
Received 6 January 2009; Accepted 21 September 2009
Abstract: The goal of the Inquiry Synthesis Project was to synthesize findings from research conducted between
1984 and 2002 to address the research question, What is the impact of inquiry science instruction on K–12 student
outcomes? The timeframe of 1984 to 2002 was selected to continue a line of synthesis work last completed in 1983 by
Bredderman [Bredderman [1983] Review of Educational Research 53: 499–518] and Shymansky, Kyle, and Alport
[Shymansky et al. [1983] Journal of Research in Science Teaching 20: 387–404], and to accommodate a practicable cutoff date given the research project timeline, which ran from 2001 to 2006. The research question for the project was
addressed by developing a conceptual framework that clarifies and specifies what is meant by ‘‘inquiry-based science
instruction,’’ and by using a mixed-methodology approach to analyze both numerical and text data describing the impact
of instruction on K–12 student science conceptual learning. Various findings across 138 analyzed studies indicate a clear,
positive trend favoring inquiry-based instructional practices, particularly instruction that emphasizes student active
thinking and drawing conclusions from data. Teaching strategies that actively engage students in the learning process
through scientific investigations are more likely to increase conceptual understanding than are strategies that rely on more
passive techniques, which are often necessary in the current standardized-assessment laden educational environment.
ß 2009 Wiley Periodicals, Inc. J Res Sci Teach
Keywords: general science; inquiry; science education
The interest in and commitment to science instruction spans many years and constituents. In the past two
decades, organizations such as the National Science Foundation (NSF), the National Research Council
(NRC), and the American Association for the Advancement of Science (AAAS) have made significant
commitments to improving science education. They have invested millions of dollars in activities such as
developing innovative K–12 curricula, building teachers’ skills, and reforming the systems that support
science teaching and learning at the school, district, and state levels. Similar investments have also been made
in countries such as Australia (Goodrum & Rennie, 2007) and England (Department for Education and
Employment, 1992) along with several international efforts (European Commission, 2007; Inter Academies
Panel, 2006). One common goal among these efforts is to encourage teachers to use scientific inquiry in their
instruction as a means to advance students’ understanding of scientific concepts and procedures.
Within this policy context, researchers both in the United States and abroad have continued to
investigate the effects of scientific inquiry instruction. For example, recent studies have looked at the effect of
inquiry instruction on standardized achievement tests with historically underserved students (Geier et al.,
2008) as well as the potential of this instructional approach to moderate the effect of prior inequities on
college students’ achievement (Lewis & Lewis, 2008). However, the interest in the effect of instruction using
scientific inquiry is not limited to conceptual understanding. Australian researchers have explored the effect
on short-term motivation during science instruction in 14- to 15-year-olds (Palmer, 2009) while researchers in
Contract grant sponsor: National Science Foundation; Contract grant number: 0101766.
Correspondence to: D.D. Minner; E-mail: [email protected]
DOI 10.1002/tea.20347
Published online in Wiley InterScience (www.interscience.wiley.com).
ß 2009 Wiley Periodicals, Inc.
2
MINNER, LEVY, AND CENTURY
the United States have looked at the influence of inquiry instruction on kindergarten students’ perceived
science competence and motivational beliefs about science (Patrick, Mantzicopoulos, & Samarapungavan,
2009). In Israel, researchers have investigated the influence of open versus guided inquiry instruction on
procedural and epistemological scientific understanding among high school students (Sadeh & Zion, 2009).
Increasingly, the effect of scientific inquiry instruction on achievement, as well as other educationally
relevant outcomes explored by researchers, is of great interest to policy makers around the world.
Given the increased attention to student performance on high-stakes tests in many countries due to
government-established standards or national curricula, the need for evidence about effective educational
practices is pressing. This is particularly true for science in the United States, as the No Child Left Behind Act
of 2001 (2002) required testing to begin in the 2007–2008 school year. However, despite these investments
and heightened emphasis on science achievement, few large-scale studies have been done that aggregate
research findings across individual studies investigating aspects of science instruction and resulting student
outcomes (Bredderman, 1983; Shymansky, Kyle, & Alport, 1983). With this need in mind, Education
Development Center, Inc. (EDC), with funding from the NSF, undertook a 4-year study to address the
research question, What is the impact of inquiry science instruction on K–12 student outcomes? The research
team on the Inquiry Synthesis Project conducted a synthesis of research on inquiry science teaching spanning
the years of 1984–2002. This timeframe was selected to expand on syntheses conducted by Bredderman
(1983) and Shymansky et al. (1983). These earlier syntheses were quantitative meta-analyses, restricted to
examinations of use of what they called ‘‘innovative curricula.’’ In contrast, this project included studies with
a variety of research designs and foci on inquiry science teaching strategies in general rather than on studies
that were restricted to use of a particular curriculum. Given the broad initial inclusion criteria of this study,
research reports had to be available by 2002 to be considered for this synthesis. This was deemed a practicable
cut-off given the project timeline—from 2001 to 2006—therefore, searching for studies was stopped in 2004
so that coding and analysis of the large number of studies located could be accomplished within the grant
timeframe.
This study was complex due to several factors. First, studies were included with a range of research
methods and design types that also varied with regard to their methodological rigor. To incorporate this
variation in the analysis, it was necessary to develop methods for capturing and synthesizing data in a variety
of forms, as well as an approach to operationalizing methodological integrity across qualitative, quantitative,
and mixed-method studies. Second, the study examined the impact of inquiry science instruction; however,
the field has yet to develop a specific and well-accepted definition of what is meant by that term. Therefore, a
key part of this synthesis was developing an operational coding framework that could be used to describe and
compare the science instruction that was the subject of the research articles reviewed. This framework is
discussed in detail under the subsection Classifying Inquiry Science Instruction. Finally, the studies included
in the synthesis examined instruction across a range of science disciplines and grades, took place in different
instructional contexts, and employed a variety of instructional materials and curricula.
In light of this complexity, we have prepared seven technical reports that provide significant detail
regarding these and other methodological aspects of the Inquiry Synthesis Project. Therefore, only the
essential aspects of the methodology necessary to understand the main findings presented in this article will
be provided here, and the appropriate technical reports will be referenced for further detail. All of the
technical reports may be found on the EDC Web site, http:/ /cse.edc.org/products/inquirysynth/. However,
since the conceptual underpinning of this work depends on how ‘‘inquiry science instruction’’ is defined, a
brief review of pertinent literature is in order.
Defining Inquiry Science Instruction
It is difficult to exactly trace the first appearance of inquiry instruction, but it was born out of the
longstanding dialogue about the nature of learning and teaching, in particular from the work of Jean Piaget,
Lev Vygotsky, and David Ausubel. The work of these theorists was blended into the philosophy of learning
known as constructivism (Cakir, 2008), which was then used to shape instructional materials. These kinds of
constructivism-based materials are commonly classified under the moniker of inquiry-based and include
hands-on activities as a way to motivate and engage students while concretizing science concepts.
Constructivist approaches emphasize that knowledge is constructed by an individual through active thinking,
Journal of Research in Science Teaching
INQUIRY-BASED SCIENCE INSTRUCTION
3
defined as selective attention, organization of information, and integration with or replacement of existing
knowledge; and that social interaction is necessary to create shared meaning, therefore, an individual needs to
be actively engaged both behaviorally and mentally in the learning process for learning to take place (Cakir,
2008; Mayer, 2004). As constructivist approaches permeated much of educational practice in the 1970s, it
became particularly prominent in science education through the focus on inquiry.
The term inquiry has figured prominently in science education, yet it refers to at least three distinct
categories of activities—what scientists do (e.g., conducting investigations using scientific methods), how
students learn (e.g., actively inquiring through thinking and doing into a phenomenon or problem, often
mirroring the processes used by scientists), and a pedagogical approach that teachers employ (e.g., designing
or using curricula that allow for extended investigations). However, whether it is the scientist, student, or
teacher who is doing or supporting inquiry, the act itself has some core components. The NRC describes these
core components from the learner’s perspective as ‘‘essential features of classroom inquiry’’ (NRC, 2000, p.
25) including:
(1) Learners are engaged by scientifically oriented questions.
(2) Learners give priority to evidence, which allows them to develop and evaluate explanations that
address scientifically oriented questions.
(3) Learners formulate explanations from evidence to address scientifically oriented questions.
(4) Learners evaluate their explanations in light of alternative explanations, particularly those reflecting
scientific understanding.
(5) Learners communicate and justify their proposed explanations.
The National Science Education Standards would add one more to this list: learners design and conduct
investigations (NRC, 1996). There is more consensus regarding what students should learn about scientific
inquiry than how teachers should instruct students (Anderson, 2007). For example, within each of the features
of classroom inquiry listed above, there can be varying degrees of direction from the teacher. The amount of
direction and decision-making done by the teacher versus the student has produced distinctions such as open
and guided inquiry (NRC, 2000). However, these distinctions are often poorly articulated by scholars and
practitioners alike. For example, the way in which ‘‘minimally guided instruction’’—said to be synonymous
with constructivist, discovery, problem-based, experiential, and inquiry-based instruction—was defined by
Kirschner, Sweller, and Clark (2006) is not the way that most inquiry-oriented practitioners or researchers
would describe these kinds of instructional approaches—which do have instructional guidance throughout
the learning process (Hmelo-Silver, Duncan, & Chinn, 2007). However, it is precisely the lack of a shared
understanding of the defining features of various instructional approaches that has hindered significant
advancement in the research community on determining effects of distinct pedagogical practices. Therefore,
in the Classifying Inquiry Science Instruction subsection, we will present a conceptual framework and
definition of inquiry instruction used in this research. This framework was built upon the findings from
reviewing several resources (The Inquiry Synthesis Project, 2006b), one of which was the National Science
Education Standards. A diversity of resources were necessary since there was not consensus in the literature
about the specific components of inquiry science instruction; therefore, looking for similarities across
existing ‘‘definitions’’ of inquiry was necessary to develop the operational definition articulated in our
framework. This framework integrates all of the aspects of inquiry noted above but is more functionally
specified.
In this examination of the literature, we will describe the overarching research approach used in
the synthesis, the study inclusion and exclusion criteria, and basic approaches to analysis. The findings
begin by describing the nature of the variability in research on the impact of inquiry science instruction
on students’ understanding of science concepts, conducted over 18 years, from 1984 to 2002. We then
present effectiveness findings related to the whole data set of 138 included studies, and a subset of studies
with a common research design to more fully articulate the relationship between instruction and student
outcomes. The article concludes with a discussion of the limitations of this study and implications for future
research.
Journal of Research in Science Teaching
4
MINNER, LEVY, AND CENTURY
Methods
The Phases of the Project and Associated Procedures
This project included three broad phases: Phase I—Report Collection, Phase II—Study Coding, and
Phase III—Analysis and Dissemination. During Phase I, a search was conducted for research completed
between 1984 and 2002, conducted with K–12 students, having at least one student instructional intervention
in science, and having assessed student outcomes. For the purposes of this study, an instructional intervention
is defined as a science activity conducted, administered, or initiated by a teacher (or researcher or other
instructor) for, to, or with students in a K–12 setting. Studies had a variety of types of instructional
interventions, ranging from regular classroom instruction to one-on-one interactions with students. Regular
classroom instruction, for example, had no specific prescribed intervention program or strategy that was
added to or that replaced the ‘‘typical’’ instruction. In these studies, researchers documented and described
practices in the classroom and their related outcomes. Other interventions entailed a prescribed intervention
program or curriculum or pedagogical innovation that was introduced into the classroom for the purposes of
the research and then studied to determine the effect on student outcomes.
The search for studies was shaped by the objective of casting a broad net in order to identify and retrieve
all reports that could potentially be part of the synthesis. Part of this strategy was to include published and
unpublished studies as long as they met our specific inclusion criteria. In a number of research areas, effect
sizes have been found to be larger in published studies than unpublished ones, therefore, ‘‘excluding
unpublished studies is quite likely to introduce an upward bias into the size of effects that will be found’’
(Lipsey & Wilson, 2001, p. 19). A more conservative approach is to independently assess methodological
rigor and adherence to inclusion criteria that are based on an individual synthesis project’s research question
and design, which was the route selected here. To generate the data set of studies, exhaustive electronic
searches were conducted of databases and search engines using a total of 123 search terms to capture studies
that fell under the general description of inquiry-based science instruction. Additionally, a call for research
was posted in a variety of publications and reference lists of retrieved documents were searched.
Of the 1,027 documents obtained, 443 research reports met the general inclusion criteria identified
above. Technical Report 1: Generating the Synthesis Sample of Studies (The Inquiry Synthesis Project,
2006a) describes Phase I activities in more detail. The initially retrieved reports were then examined so that
multiple reports associated with a single study were identified and grouped such that studies could function as
the unit of analysis for the synthesis. For a discussion of this process, see Technical Report 4: Report-Study
Reconciliation Process (The Inquiry Synthesis Project, 2006d).
Phase II—Study Coding comprised three stages. In Stage 1, each report was carefully screened to
determine if the following additional inclusion criteria were met: at least one research question was about the
effect of an instructional intervention in science on student outcomes, and the student instructional
intervention was described sufficiently to code in Stage 2. Technical Report 3: Operationalizing the
Inclusion/Exclusion Coding Process (The Inquiry Synthesis Project, 2006c) further describes the Stage 1
coding process. If a study had more than one report, then across all the reports these two additional criteria had
to be met in order for the study to move into Stage 2. The Stage 2 coding applied a detailed schema for
describing the instructional intervention, which is the subject of Technical Report 5: Operationalizing the
Inquiry Science Instruction Coding Process (The Inquiry Synthesis Project, 2006e). Technical Report 2:
Conceptualizing Inquiry Science Instruction (The Inquiry Synthesis Project, 2006b) articulates the
theoretical underpinnings of the coding protocol used in Stage 2. Stage 3 coding involved capturing all other
relevant information about the methodological integrity of the research, the context of the study, covariates,
comparison treatments, and study findings. The third stage of coding is described in Technical Report 6:
Operationalizing the Coding of Research Rigor, Context, and Study Findings (The Inquiry Synthesis Project,
2009a). Each stage of Phase II afforded an opportunity to exclude a study due to misalignment with the data
requirements of the synthesis.
Although the content of the coding varied across the stages, the general process remained the same. This
included the development of codebooks with coding items, definitions, and supporting material; followed
by the testing and revision of the codebooks until they were determined by the research team to be sufficiently
stable and understood by all coders. Study coding for Stages 1 and 2 followed a process whereby each study
Journal of Research in Science Teaching
INQUIRY-BASED SCIENCE INSTRUCTION
5
was independently coded by both members of a coding team, after which the coding team met to come to
agreement on the final codes for each study, resulting in 100% inter-rater agreement. When agreement was
reached, reconciled data were entered into the computer archive. For Stage 3, 82 studies were coded
by teams of coders in the manner described above. The remaining 56 studies were coded independently by
coders who had reached an inter-rater agreement rate of 85%; however, to maintain this level of consistency,
every fifth study was coded by two coders and the coding compared.
Phase III—Analysis and Dissemination included using a variety of techniques and models based on
the conceptualization and description of inquiry science instruction, which are described in more
detail below. To have a final data set that had some similarities among studies, additional exclusion criteria
were applied for the analysis phase. Studies that were included in the analyses had the following
characteristics:
Had sufficient information to clearly determine the presence or absence of inquiry-based science
instruction, as operationally defined for this project (see Table 1).
Had student understanding or retention of science facts, concepts, or principles and theories in
physical science, life science, or earth/space science as a dependent variable for the study.
Had explicit instruction in either physical, life, or earth/space science.
If multiple treatments were compared, one of them could be distinguished from others as exhibiting
more inquiry-based instruction based on our coding protocols (i.e., a treatment of interest).
Were not conducted in museum contexts.
Were not case studies of individual students.
The full list of studies can be found in Technical Report 7: Bibliography of Studies Included in Final
Inquiry Synthesis Project Analyses (The Inquiry Synthesis Project, 2009b).
Frameworks for Operationalizing Inquiry Science Instruction and Methodological Rigor
To understand the analyses presented later in this article, it is worth summarizing here the manner in
which inquiry science instruction and methodological rigor were operationalized.
Classifying Inquiry Science Instruction. Developing a framework for describing inquiry-based
instruction included reviewing literature that had been written over the course of the past 30 years to arrive at a
set of descriptive characteristics that was parsimonious yet inclusive of the essential characteristics of inquiry
science instruction. Additionally, the project team sought the input of project advisors who reinforced the
importance of several characteristics of inquiry science instruction that could be considered emblematic, such
as students experience personal engagement with phenomena; students focus on key science concepts; and
students have some level of ownership in the learning experience. Through these efforts, the team arrived at
the framework depicted in Table 1, which guided the codebook development and analysis.
In this framework, inquiry science instruction can be characterized as having three aspects: (1) the
presence of science content, (2) student engagement with science content, and (3) student responsibility for
learning, student active thinking, or student motivation within at least one component of instruction—
question, design, data, conclusion, or communication. The categories and descriptions of Science Content
used in the conceptual framework are among those articulated in the National Science Education Standards
(NRC, 1996). For this project, the content categories were limited to four (physical science, life science,
earth/space science, scientific inquiry as content) of the seven that appear in the Standards, primarily for
pragmatic reasons. The Types of Student Engagement include all of the various ways in which students could
engage with phenomena.
Student responsibility for learning relates to the students’ role as learner; therefore, inquiry instruction
that embodies this element demonstrates the expectation that students will participate in making decisions
about how and what they learn, identify where they and others need help in the learning process and ask for
that help, and/or contribute to the advancement of group knowledge. Student active thinking refers to how
students engage with the content itself. Thus, inquiry instruction that exemplifies this element demonstrates
the expectation that students will use logic, think creatively, build on prior knowledge, and/or make
deductions. Finally, student motivation is about students’ personal investment in the learning process; inquiry
Journal of Research in Science Teaching
6
MINNER, LEVY, AND CENTURY
Table 1
Inquiry science instruction conceptual framework
instruction within this element intentionally builds on and develops students’ curiosity, enthusiasm, and
concentration.
A study was considered inquiry-based and included in the synthesis if at least one of the instructional
treatments was about life, earth, or physical science; engaged students with scientific phenomena; instructed
them via some part of the investigation cycle (question, design, data, conclusion, communication); and used
pedagogical practices that emphasized to some extent student responsibility for learning or active thinking.
Journal of Research in Science Teaching
INQUIRY-BASED SCIENCE INSTRUCTION
7
The degree to which each instructional intervention in a study emphasized student responsibility for
learning, student active thinking, and student motivation was rated by coders as ‘‘no emphasis’’ (only a token
or minimal emphasis, scored as 0), ‘‘some emphasis’’ (some emphasis but does not dominate instruction,
scored as 2), or ‘‘a lot of emphasis’’ (significant and predominant emphasis, scored as 4 to indicate
substantially more weight). Student motivation, however, was unique in that it was more difficult to align with
a single component of an intervention. As a result, the emphasis given to it is coded for the instruction as a
whole.
To illustrate, the following excerpt is from a study that received a ‘‘some emphasis’’ rating for student
responsibility and active thinking within the design, data, and conclusion components of instruction:
A laboratory sheet was prepared for each experiment: it presented problems related to the topics
mentioned above. The students proposed their own hypotheses individually, and presented a procedure
for solving given problems. They were required to design and carry out the experiments on their own
with the materials and equipment provided, guided by the instructor whenever needed. They gathered
data and recorded observations individually; they identified relevant relationships by interpreting
related data; and they were then asked to draw conclusions and make generalizations (Ertepinar and
Geban, 1996, p. 337).
In contrast, the following study received ‘‘a lot of emphasis’’ on student responsibility and active
thinking within the question and design components of instruction. It also received ‘‘a lot of emphasis’’ on
active thinking for conclusions, but received a ‘‘no emphasis’’ rating on student responsibility for conclusions
because the computer simulation drew the growth curves for the students.
CAL software allowed students to decide for themselves the range of temperatures within which they
would like to perform the simulated experiments, the levels of nutrient concentrations for the
experiment, and the number of cells they wished to use to start a population growth. It was up to them
to decide which independent variables were kept constant and which variable was changed and
investigated in each experiment. . .. Students were required to find a solution to the problem, they were
able to use their previous knowledge on solutions and dilutions to come up with a method for diluting
the culture. . .. In these activities students were required to use a large number of inquiry skills, such as
interpreting data, controlling variables, designing experiments, selecting useful data, and evaluating
hypotheses. . .. Students were asked to apply the growth rate pattern to other microorganism
populations and to hypothesize about the impact of external factors on population growth rate
(Lazarowitz & Huppert, 1993, pp. 370–374).
Once all of the components of instruction were rated for student active thinking, responsibility for
learning, and motivation, the ratings were summed to reflect the overall level of inquiry saturation within
each instructional treatment. The maximum possible score for inquiry saturation was 44 points. Each
instructional treatment present in a study was coded and if there was more than one instructional intervention
in a study, the one with the highest inquiry saturation was designated as the ‘‘treatment of interest.’’ Several
other variables were also calculated, including the amount of emphasis in each component of instruction and
the amount of emphasis in each element of the inquiry domain (see Table 1).
These different metrics indicating emphasis on inquiry instruction were used in the analyses discussed
later in this article. For the treatment of interest in each study, the inquiry saturation score and the total sum
score for each component of instruction, and each element of the inquiry domain, were standardized into zscores. A z-score is a standardized score representing a relative location in a distribution (Vogt, 1999). They
are expressed in standard deviation units where the mean of the distribution is 0 and the standard deviation is
1, so a z-score of 1.33 is one and a third standard deviations above the mean for the distribution of all the
scores. Natural groupings can then be derived from the standardized distribution. For this study, we used the
following categories: ‘‘low’’ (more than 0.50 standard deviations below the mean), ‘‘moderate’’ (0.50
standard deviations from the mean), or ‘‘high’’ (more than 0.50 standard deviations above the mean). Studies
within the low inquiry saturation category had sums ranging from 2 to 6 (out of 44), indicating that there was
‘‘some emphasis’’ on student active thinking or responsibility for learning in one of the components of
Journal of Research in Science Teaching
8
MINNER, LEVY, AND CENTURY
instruction. Studies in the moderate category had sums that ranged from 8 to 16, reflecting at least ‘‘some
emphasis’’ on student active thinking or responsibility for learning in more than one component of
instruction. Studies in the high inquiry saturation category had sums that ranged from 18 to 42, reflecting
‘‘a lot of emphasis’’ on student active thinking or responsibility for learning for at least one of the components
of instruction and ‘‘some emphasis’’ on a number of other components.
Classifying Student Outcomes. In addition to coding the inquiry characteristics of instruction, we
developed a coding scheme to capture the effect of that instruction on students. Six different finding types
were coded: student understanding of science concepts, facts, and principles or theories; and student retention
(a minimum of 2 weeks after treatment) of their understanding of science concepts, facts, and principles or
theories. Each study had at least one of these finding types, and many had more than one. The studies with
each finding type (e.g., understanding science concepts, retention of science principles) were placed in
separate data sets so that each study would be represented only once for each analysis of effects on a given
finding type. However, if a study had multiple finding types, that study would be represented in each separate
data set. Each finding type had a range of learning outcome categories that reflected the authors’ findings
depending on the research design of the study. For example, the choices for non-experimental studies with
qualitative data were ‘‘students show a negative response to the instruction,’’ ‘‘students did not show a
response to the instruction,’’ ‘‘students show a mixed response to instruction—some improved and some did
not,’’ and ‘‘students show a positive response to instruction’’; and for experimental studies with quantitative
data, the options were ‘‘outcomes for treatment group ‘x’ were statistically significantly better than outcomes
for treatment group ‘y’,’’ and ‘‘no statistically significant difference between treatment groups.’’ In addition, a
learning outcome categorization for each of the 138 studies was also coded by manually inspecting the
learning outcome scores across all of the finding types in a study and making a global rating of negative, no,
mixed, or positive impact on student learning. This finding is referred to as ‘‘student content learning and
retention.’’
Finally, a framework was needed to capture a number of different aspects of methodological rigor of the
qualitative, quantitative, and mixed-method studies in the data set. Following are details about the key
variables used to describe the studies’ research designs and rigor relevant to the results presented in this
article.
Classifying Research Design. Three research design categories (experimental, quasi-experimental, and
non-experimental) were used to capture the diversity across the studies in the data set. Some of the specific
design types within these broader categories are not typically addressed in classification schemes (Pedhazur
& Schmelkin, 1991) because they are considered to be confounded. However, to be inclusive, the designs
encountered in the studies were described and assessed on the basis of the methodological rigor appropriate
for each study’s design type. This provided the most complete picture of the state of research relevant to our
research question. The general scheme used to discriminate research designs was the customary distinction
between the presence (or absence) of random assignment to treatment groups. An experimental design was
defined as a study that entails manipulation of an instruction-related independent variable and has random
assignment of students, schools, or classes to the different levels or categories of the manipulated variable,
thus constituting at least one experimental group and at least one comparison/control group. Within the
synthesis data set, there are three specific types of experimental designs: (1) equivalent control group
design—pre-post measurement (also includes more than one post-test measurement); (2) equivalent control
group design—post-only measurement; and (3) within subject cross-over design—subjects in the different
treatment groups are randomly assigned the order in which they receive the treatments and, thus, serve as their
own matched comparison.
A quasi-experimental design entails manipulation of an instruction-related independent variable, and a
comparison/control group is present, but randomization is absent at all levels. Within the synthesis data
set, there are three specific types of quasi-experimental designs: (1) non-equivalent control group design—
pre-post measurement; (2) non-equivalent control group design—post-only measurement; and (3) qualitative
time-series design—multiple pre-treatment and post-treatment measures of the dependent variable
were made across multiple students in different classrooms. The different classrooms constituted a
multiple treatment group comparison, thus categorizing this as quasi-experimental.
Journal of Research in Science Teaching
INQUIRY-BASED SCIENCE INSTRUCTION
9
A non-experimental design was defined as a study that does not have a comparison group, and the type or
amount of instruction as the independent variable is documented but may not be formally manipulated.
Within the synthesis data set there are four specific types of non-experimental designs, all with a single
treatment group: (1) pre-post measurement, (2) post-only measurement, (3) multiple measurement points
(e.g., reports of outcomes across a number of students), and (4) one measurement point during the
intervention.
Classifying Methodological Rigor. Since the synthesis database contains a wide range of research
designs and types of data, a universally applicable coding protocol was essential to allow for between-study
concurrent analysis (Onwuegbuzie & Daniel, 2003). In developing the methodological rigor items, a number
of resources were referenced (see The Inquiry Synthesis Project, 2009a). A set of items describing three
aspects of methodological rigor—descriptive clarity, data quality, and analytic integrity—were developed to
enable quantitative calculation of a study’s level of methodological rigor. In general, the descriptive clarity
items captured the amount and clarity of information that was provided to allow for independent assessment
of the research question, research site, sample, sampling strategy, data collection methods, analysis strategies,
inquiry treatment, and comparison treatment if there is one. The data quality items addressed the technical
aspects of the methodology—attrition, treatment contamination, instrument reliability and validity, and pretreatment differences in students. The analytic integrity items addressed the appropriateness and systematic
analysis of data analysis strategies, threats to internal validity, and bias in reporting of findings.
Not all of the items in the rigor framework were appropriate for every design type; but there were items
for each aspect of rigor that were appropriate for comparative and non-comparative treatment designs as well
as for both qualitative and quantitative methods. This allowed for each aspect of rigor to be rated for every
study in the data set, keeping in mind that the rating options could not be identical for each item in the rigor
framework. The way each item in the rigor framework was operationalized is indicated in the tables in
Technical Report 6 (The Inquiry Synthesis Project, 2009a). Even though the specifics of each aspect of
methodological rigor were considered in the coding of the items, the coding options were all fitted to the same
quality scale: 1 (very poor rigor because no information provided by the authors); 0 (poor rigor); 1
(marginal rigor); and 2 (good rigor).
To collapse the data contained in the rigor matrix, a composite score (i.e., mathematical average) was
generated for each aspect of rigor (i.e., descriptive clarity, data quality, and analytic integrity). The
denominator used to calculate the composite score within a rigor aspect depended on the number of eligible
items given each study’s methodology. Then the three composite scores were averaged to generate a rigor
grand mean for each study. The rigor grand mean and composite scores for a study could be categorized
through mathematical rounding as ‘‘very poor,’’ ‘‘poor,’’ ‘‘marginal,’’ or ‘‘good.’’ The rigor grand mean was
also standardized to indicate the relative strength of a study’s rigor compared with the other studies in this
sample, as was described above with the inquiry saturation score. The z-score of the rigor grand mean,
referred to as methodological rigor score, was used to categorize the studies in our sample as relatively ‘‘low’’
(more than 0.50 standard deviations below the mean), ‘‘moderate’’ (0.50 standard deviations from the
mean), or ‘‘high’’ rigor (more than 0.50 standard deviations above the mean). Studies with a low
methodological rigor score (on a scale of 1 to 2) had grand means ranging from 0.54 to 0.40 and generally
had ‘‘very poor’’ or ‘‘poor’’ average composite scores on two out of the three aspects of rigor; studies with
moderate rigor score had grand means ranging from 0.45 to 0.94 and ‘‘marginal’’ average composite scores
on two aspects of rigor; and studies with high rigor scores had grand means ranging from 0.96 to 1.96 and
‘‘good’’ average composite scores on one of the three aspects of rigor.
Analysis Strategy
The goals of the analysis strategy were to describe the landscape of studies that addressed the synthesis
research question, determine if there was an association between the nature or amount of inquiry science
instruction and student learning outcomes, and determine if methodological rigor had a moderating effect on
studies’ findings.
Initial analyses included descriptive statistics, such as frequencies, means, standard deviations, and
cross-tabulations, to understand the types of students studied, the types of findings the studies generated, and
Journal of Research in Science Teaching
10
MINNER, LEVY, AND CENTURY
the methodological rigor with which these studies were conducted. Then, the relationship between the inquiry
instruction and student outcomes was explored. The dependent variable (learning outcome category) was
constructed as a categorical variable as follows: negative, no, mixed (some students showed improvement to
instruction and some did not), or positive impact on student learning as determined by the original author’s
analyses. The independent variables of interest were:
the emphasis on inquiry science instruction reflected as standardized inquiry saturation scores
(ordinal variables),
the distribution of inquiry emphasis in the instruction across the three inquiry domain elements
(student responsibility for learning, student motivation, student active thinking) expressed in
standardized z-scores,
the distribution of inquiry emphasis across the five components of instruction (questioning, design,
data collection, conclusion, communication) expressed in standardized z-scores, and
the standardized rigor categories (ordinal variable) for each research study.
The general analysis strategy was one of increasing precision with which the relationship between the
inquiry science instruction in these studies and the learning impacts that students exhibited was investigated.
First, we present a description of the landscape of the 138 studies with regard to the instruction and research
methodology. Second, we describe the impact of instruction on the global learning outcome category—
‘‘student content learning and retention.’’ For this analysis, the relationship between the dependent and
independent variables of interest were examined across studies using chi square tests. Lastly, we continue to
explore the impact of instruction within the most common finding type—student understanding of science
concepts. One hundred four studies had this type of finding. In this set of studies, we used multinomial logistic
regression to test the degree to which any of the independent variables has the power to predict the likelihood
of positive student learning outcomes. However, because of the constraints on the cell size for this type of
analysis, the three studies with ‘‘negative impact’’ were not included in these models therefore the n ¼ 101.
These studies were deleted from the analysis because logistic regression uses maximum likelihood
estimation to derive parameters (Garson, 2008). Therefore, the reliability of the estimates decline when there
are few cases for each category of the independent variables. In small samples, high standard errors are likely
and very high parameter estimates may signal inadequate sample size, which was the case when all four
outcome categories were included initially in the model. Therefore, the dependent outcome was reduced for
the final models to three categories: positive, mixed, and no response to instruction.
We then turn to examining impact within studies of similar research design—experimental or quasiexperimental comparison group designs with quantitative assessments of student understanding of science
concepts. Within this set of 42 studies, we describe the general types of instructional interventions that produced
student-learning gains. This analysis utilized a combination of qualitative data from the coding on the nature of
the treatment of interest and the comparison treatment within each study, and the quantitative data on student
learning outcomes associated with each treatment. A qualitative-data-matrix approach was used to determine
emergent patterns in the nature of the instruction and to categorize the student learning outcomes that the authors
found into five categories: (1) Students in the treatment with higher amounts of inquiry saturation did
statistically significantly better than those in treatments with lower amounts of inquiry; (2) the two (or more)
treatments in the study had the same inquiry saturation, and all groups did statistically significantly better on the
post-test than the pre-test; (3) findings were inconclusive regarding the effect of inquiry saturation on student
learning; (4) there was no statistically significant difference found in student conceptual learning even when
there was one treatment with more inquiry saturation than the other treatments in the study; and (5) the treatment
with higher inquiry saturation did statistically worse than the treatment with lower inquiry saturation. A chi
square analysis of the qualitatively generated data matrix concludes the results section.
Results
Describing the Landscape of Studies in the Sample
Educational Context. The 138 studies in this synthesis were primarily conducted in the United States
(105, 76%). Though we included studies that were conducted outside of the United States (as long as they
Journal of Research in Science Teaching
INQUIRY-BASED SCIENCE INSTRUCTION
11
were reported in English), we did not intentionally search international journals or solicit work from non-U.S.
professional networks, which could explain the low representation of international studies in this data set.
Table 2 provides the frequencies of studies by various demographic and educational indicators. As much
information as possible was collected about the amount of instruction to which the students were exposed—
the number of sessions of instruction; the total amount in minutes of instruction; and the number of days,
weeks, months, or years that the instruction covered. If the appropriate information was provided, the number
of minutes of instruction was calculated using stated conversions. However, there were still 26 (19%) studies
that did not report any kind of dosage information about the treatment of interest or any comparison
treatments. For 49 (36%) of the studies, the number of minutes of inquiry science instruction under study
could be calculated and the range was from 17 to 6,480 minutes with a mode of 480 minutes. Using a standard
conversion of 40 minutes per class period, this equals a mode of 12 class periods for each treatment of interest.
Twenty-eight (20%) of the studies only reported the number of weeks of instruction in the study, resulting in a
mode of 10 weeks, and 16 (12%) studies reported number of sessions or classes with a mode of one session in
the treatment of interest.
In this collection of studies, the researched instruction can be characterized as predominantly taking
place in typical K–12 classroom settings with a regular classroom teacher, about whom little is known in
terms of training and pedagogical practices prior to the research reported in the reviewed studies. The overall
amount of instruction delivered in these interventions varied widely.
Research Context. Though information about the educational context was spotty, the research context
was somewhat more elucidating. Table 3 provides the frequencies of studies by a number of methodological
descriptors. The two prominent design types were experimental or quasi-experimental pre-post designs
generating quantitative data (n ¼ 43, 31%) and non-experimental studies in which qualitative data were
collected over multiple data points for multiple subjects (n ¼ 50, 36%). Slightly more than half of all
the studies in this synthesis had one treatment group, while almost 30% had two treatment groups. The
most frequent sample size for quasi-experimental studies was 151–250 students, for experimental studies
Table 2
Frequencies of studies by educational descriptors
Educational Descriptors for Sample of Studies
Community context
Urban
Suburban
Rural
Multiple settings
Not reported
Educational setting
Science classrooms
Regular classroomsa
Artificial research setting
Informal education setting
Not reported
Instructional provider
Regular classroom teacher
Researcher
Other type of providerb
Not reported
Provider’s experience
Over 3 years
Few than 3 years
Multiple providers with mix of experience
Not applicable
Not reported
Number of Studies (n ¼ 138)
%
50
28
13
8
39
36
20
9
6
28
52
48
18
6
14
38
35
13
4
10
82
23
30
3
59
17
22
2
22
25
3
17
71
16
18
2
12
51
a
Not having designated science equipment, usually elementary grades.
Computer, textbook, informal science instructor, graduate student.
b
Journal of Research in Science Teaching
12
MINNER, LEVY, AND CENTURY
Table 3
Frequencies of studies by methodological descriptors
Methodological Descriptors for Sample of
Studies
Year of publication
1984–1988
1989–1993
1994–1998
1999–2002
Design
Non-experimental
Quasi-experimental
Experimental
Predominant methodology
Quantitative
Qualitative
Mixed
Data sources
Criterion-referenced test
Interview protocols
Student work
Transcripts of classroom discourse
Unstructured observation and field notes
Video observations and notes
Teacher notes
Interview transcripts
Observation protocol
Survey
Other
Norm-referenced test
Number of Studies (n ¼ 138)
%
11
35
49
43
8
25
36
31
73
35
30
53
25
22
62
61
15
45
44
11
81
46
37
24
24
16
9
8
7
6
10
1
59
33
27
17
17
12
7
6
5
4
7
—
51–100 students, and for non-experimental studies 11–30 students. There were 13 studies where sample size
was not reported.
Information on the data sources used in the studies indicates that 51% (n ¼ 71) of the 138 studies relied
on only one data source. Criterion-referenced tests were the most frequently used data source in experimental
and quasi-experimental studies, and interview protocols were the most commonly used data source in nonexperimental studies. The most common statistical test used to generate the quantitative findings included in
the synthesis was the F-test generated from analysis of variance procedures in the experimental and quasiexperimental designs and the t-tests for non-experimental designs. The distribution of statistics by rigor
category shows another interesting pattern. Studies in the low rigor category most commonly used t-tests; in
the moderate category, F-tests; and in the high rigor category, modeling coefficients associated with complex
analytic techniques such as MANOVA.
The majority of studies in the sample were done by researchers (n ¼ 106, 77%). However, within
education research, there is particular interest in teachers doing research on their classes. There were 17
(12%) studies in which research was conducted primarily by teachers. These kinds of studies are interesting
because the research produced by classroom teachers generally offers vivid descriptions of students and
instruction. However, in this sample, they were found to be fairly weak methodologically. Eighty-eight
percent (n ¼ 15) of these 17 teacher-conducted studies were in the low rigor category compared with 23%
(n ¼ 24) of the 106 researcher-conducted studies (w2 (8, N ¼ 138) ¼ 37.93, p < 0.001). This body of
practitioner research offers great promise; however, the systematic nature of the data collection and analysis
could be improved.
Overall in this synthesis, the two prominent types of studies represented were those conducted by
researchers during the years 1994–2002 and that had either experimental or quasi-experimental pre-post
designs with two treatment groups generating quantitative data, or non-experimental designs where
Journal of Research in Science Teaching
INQUIRY-BASED SCIENCE INSTRUCTION
13
Table 4
Frequencies (%) of studies by rigor quality categories (grand mean)
Very Poor
Descriptive clarity average
Data quality average
Analytic integrity average
Rigor grand mean
0
20 (14)
9 (7)
2 (1)
Poor
a
32 (23 )
46 (33)
32 (23)
43 (31)
Marginal
Good
84 (61)
62 (45)
71 (51)
85 (62)
22 (16)
10 (7)
26 (19)
8 (6)
a
Percent of row total (138 studies).
qualitative data were collected over multiple data points for multiple subjects. In looking more closely at
specific aspects of methodological rigor, some interesting trends in how these studies were conducted begin to
emerge from an analysis of the composite scores for descriptive clarity, data quality, analytic integrity, and the
rigor grand mean. Most studies in the synthesis were coded as having marginal methodological rigor due to
weaknesses in descriptive clarity, data quality, and/or analytic integrity (see Table 4).
Additional chi square analyses indicate that there were significantly fewer experimental and quasiexperimental design studies than expected by chance with very poor methodological rigor (w2 (6,
N ¼ 138) ¼ 11.2, p ¼ 0.08) (see Table 5). Experimental studies did better than expected by chance
in addressing descriptive clarity (w2 (4, N ¼ 138) ¼ 10.5, p ¼ 0.03) and analytic integrity (w2 (6,
N ¼ 138) ¼ 14.4, p ¼ 0.03). Proportionally speaking, a far greater percentage of experimental studies
(86%) in the synthesis had methods with marginal or good rigor compared with the quasi-experimental (69%)
or non-experimental studies (59%).
Exploration of the individual items that contributed to the rigor composite scores indicates the areas of
the methodology that were particularly weak in this sample of studies. In regards to descriptive clarity, the
aspects of the studies that were most poorly described include the sample characteristics, comparison
treatments, and sampling strategy used to obtain the sample under study—with 71% of the studies providing
no or poor information about the strategy. The data quality for most studies were undermined by a lack of
information or inappropriate handling of issues, such as attrition, treatment contamination due to having the
same instructor provide all the instructional treatments in comparative design studies, and poor instrument
quality.
The psychometric properties of the instruments and data sources used were sparsely reported. Most
studies (56%) did not report if the instruments used were newly developed or existing. Of those that did report
this information, 20% used new instruments but did not pilot test them, 13% developed new instruments and
pilot tested them, and only 11% (16 studies) used established instruments. Sixty-two percent of the studies
(n ¼ 71) did not report whether or not the researchers determined the reliability of the instruments they were
using for the sample being studied. Only 26% of the 119 applicable studies demonstrated any kind of
measurement validity, and it was exclusively content validity.
Regarding analytic integrity, the majority of the studies in the synthesis had information that
demonstrated the appropriate and systematic analysis of quantitative data, addressed existing internal validity
threats so that the study’s findings were not fatally compromised (within the limits of the specific research
design), reported and accounted for the value of statistically non-significant results in their interpretation of
study findings, and provided clear evidence of systematic analysis of qualitative data. Addressing or reporting
on missing data were an issue in 80% of quantitative studies, and the lack of clear identification of data as
exemplars or unique exceptions to the findings was an issue for a number of qualitative studies.
Table 5
Frequencies (%) of studies by rigor quality categories (grand mean) and design type
Experimental
Quasi-experimental
Non-experimental
Very Poor
Poor
Marginal
Good
0
0
2 (3)
4 (13)
11 (31)
28 (38)
22 (73)
22 (63)
41 (56)
4 (13)
2 (6)
2 (3)
Journal of Research in Science Teaching
14
MINNER, LEVY, AND CENTURY
Table 6
Linear regressions of date of publication (independent variable) onto rigor scores
Rigor Scores
Rigor grand mean
Descriptive clarity composite
Data quality composite
Analytic integrity composite
R2
Unstandardized
Beta
F
t
p-Value
0.066
0.018
0.079
0.030
0.031
0.016
0.045
0.031
9.662
2.433
11.651
4.143
3.108
1.560
3.413
2.035
0.002
0.121
0.001
0.041
Note: n ¼ 138.
The historical trends in the rigor over this 18-year time span of the synthesis studies indicate a small but
statistically significant trend toward a decrease in the methodological rigor with which the studies were
conducted, particularly in the data quality items assessed (see Table 6). There was however no statistically
significant association between overall rigor, data quality, or analytic integrity by publication status
(published vs. unpublished). There was a significant decrease in descriptive clarity for those studies that were
published, most likely due to limitations on space imposed by publishers (see Table 7). With this backdrop
established, it is time to turn to the findings related to impact on student learning.
Inquiry Science Instructional Impact
The first analyses were conducted to determine if there was an impact on student science content
learning and retention as a result of experiencing some level of inquiry science instruction. These analyses
combined all study designs, levels of methodological rigor and inquiry saturation, and finding type, that is,
understanding of science concepts, retention of facts/vocabulary, etc., to look at impact most broadly defined.
A note on the terminology used is warranted here. ‘‘Student content learning and retention’’ refers to the
combined effect across specific finding types, whereas ‘‘understanding science concepts’’ is a specific finding
type that was analyzed in isolation in the next section.
Impact of Inquiry Instruction on Student Content Learning and Retention in General. We found that
the majority of the studies in the synthesis (n ¼ 71, 51%) showed positive impacts of some level of inquiry
science instruction on student content learning and retention. Forty-five (33%) studies showed mixed impact
of inquiry instruction, 19 (14%) showed no impact, and 3 (2%) showed negative impact (2%) (see Table 8).
Because Table 8 combines experimental, quasi-experimental, and non-experimental designs; and qualitative,
quantitative, and mixed methods, the designation ‘‘positive outcome’’ means something different to clusters
of studies within design types. However, they share the common, broad assessment that students in these
studies who received inquiry science instruction had outcomes that were improved either compared with their
understanding prior to instruction or compared with the outcomes of students who received different
instruction that had a lower saturation of inquiry. Studies in the low methodological rigor category more
frequently found positive impact than was the case in the moderate or high rigor categories, though not
statistically more than would be expected by chance (w2 (6, N ¼ 138) ¼ 9.09, p ¼ 0.17).
Recall that in addition to having the main synthesis data set, separate data sets were constructed so that
independent analyses could be completed for each finding type: student understanding of science concepts,
Table 7
Linear regressions of publication status (independent variable) onto rigor scores
Rigor Scores
Rigor grand mean
Descriptive clarity composite
Data quality composite
Analytic integrity composite
R2
Unstandardized
Beta
F
t
p-Value
0.021
0.041
0.001
0.023
0.182
0.261
0.001
0.283
2.950
5.886
0.000
3.146
1.718
2.426
0.008
1.774
0.09
0.02
0.99
0.08
Note: n ¼ 138.
Journal of Research in Science Teaching
INQUIRY-BASED SCIENCE INSTRUCTION
15
Table 8
Frequency and percent of studies distributed across global learning outcome category by science content area, grade
level, and methodological rigor
Science content area
Physical
Life
Earth/space
Physical and life
Physical and life and earth/space
Grade level
Elementary
Middle
High
Methodological rigor
Low rigor
Moderate rigor
High rigor
Total
Percent of outcomes
Positive Impact
(Row %)
Mixed Impact
No Impact
Negative
Impact
Total
42 (51)
18 (51)
7 (44)
3 (100)
1 (100)
32 (39)
9 (26)
4 (25)
—
—
7 (8)
7 (20)
5 (31)
—
—
2 (2)
1 (3)
—
—
—
83
35
16
3
1
23 (56)
22 (46)
26 (53)
16 (39)
15 (31)
14 (29)
2 (5)
10 (21)
7 (14)
—
1 (2)
2 (4)
41
48
49
27 (66)
22 (44)
22 (47)
71
51
8 (20)
19 (38)
18 (38)
45
33
4 (10)
9 (18)
6 (13)
19
14
2 (5)
—
1 (2)
3
2
41
50
47
138
facts, principles or theories; and student retention of their understanding of science concepts, facts, principles
or theories. Though 138 studies were included in the synthesis, when these studies were divided into subsets
by finding type, the numbers of studies in each became rather small (see Table 9). However, for each finding
type, the majority of studies in that subset indicated a positive impact on learning associated with inquiry
science instruction. Since the number of studies is fairly small for each of these subsets, further exploration
was only warranted for the studies within the largest of these subsets—studies that had findings about the
impact of inquiry science instruction on student understanding of science concepts (n ¼ 104).
Impact of Inquiry Instruction Specifically on Student Understanding of Science Concepts. The initial
analyses included testing multinomial logistic regression models to determine whether the amount of inquiry
(inquiry emphasis) was a predictor of the likelihood of students’ achieving a particular response to instruction
determined by the authors’ research. The dependent variable for these models was the type of effect on
learning: positive response to instruction, mixed response, or no response. To meet the data specifications of
the regression models (i.e., no cells with ‘‘0’’ frequencies), the three studies with ‘‘negative impact’’ were not
included in these models; therefore, the number of studies was 101. Model A tested whether the amount of
inquiry (inquiry saturation) was a predictor of the likelihood of students’ achieving a particular response to
instruction. Model B tested whether emphasis on any of the elements of inquiry (i.e., active thinking,
responsibility for learning, motivation) predicted the likelihood of students’ achieving a particular response
Table 9
Frequency and percent of studies by impact on student learning for each finding type
Finding Type
Understanding science concepts
Understanding science facts
Understanding science principles
and theories
Retaining science concepts
Retaining science facts
Retaining science principles and
theories
Positive Impact
(Row %)
Mixed
Impact
No Impact
Negative
Impact
Total Number
of Studies
54 (52)
18 (64)
11 (58)
34 (33)
3 (11)
7 (37)
13 (13)
7 (25)
1 (5)
3 (3)
0
0
104
28
19
5 (46)
6 (67)
2 (67)
2 (18)
0
1 (33)
4 (36)
3 (33)
0
0
0
0
11
9
3
Journal of Research in Science Teaching
16
MINNER, LEVY, AND CENTURY
Table 10
Summary of model fit information from multinomial logistic regression
Model
A
B
C
B1
C1
2LL
(Intercept Only)
2LL
(Intercept þ Variables)
df
w2
Probability
56.319
122.465
158.706
30.291
28.015
50.116
103.826
135.926
19.946
20.116
8
14
20
4
4
6.203
18.639
22.780
10.345
7.899
0.625
0.179
0.300
0.035
0.095
Note: N ¼ 101.
to instruction. Model C tested whether emphasis on any of the components of instruction (i.e., questioning,
designing, data, conclusion, communication) predicted the likelihood of students’ achieving a particular
response to instruction. Methodological rigor was also included in each model. For the independent variables
in the models, the standardized z-scores of the variable were converted into categorical variables with the
following options: more than half a standard deviation below the mean, within half a standard deviation of
the mean, or more than half a standard deviation above the mean.
The findings indicate that the a priori models tested did not significantly predict students’ response to
instruction any better than could be done by chance (see Table 10). This means that when treatments with the
most inquiry saturation in these 101 studies were compared across studies, there was no greater likelihood
than would be expected by chance that treatments with higher saturation of inquiry would produce positive
student learning of science concepts as was hypothesized (Model A). Additionally, when the total inquiry
saturation was deconstructed into the elements of inquiry (Model B) or into the components of instruction
(Model C), these models did not effectively discriminate among studies. However, in further examination of
the likelihood ratio tests for Model B’s and Model C’s independent variables, it was found that for Model B,
instruction that emphasized ‘‘active thinking’’ was a significant predictor [2LL ¼ 116.977; w2 (4,
N ¼ 101) ¼ 13.15, p ¼ 0.011)], and for Model C, instruction that emphasized ‘‘drawing and thinking about
conclusions from data’’ was a marginally significant predictor [2LL ¼ 144.586; w2 (4, N ¼ 101) ¼ 8.66,
p ¼ 0.070)]. Therefore, post hoc, parsimonious models were run with these two independent variables
represented as Models B1 and C1 in Table 10.
Model B1 indicates that active thinking was a significant predictor of student outcomes
[2LL ¼ 19.946; w2 (4, N ¼ 101) ¼ 10.345, p ¼ 0.035)]. In examining the parameter estimates of this
model, we see that in studies where instruction was found to increase students’ understanding of science
concepts, the odds that the amount of the active thinking in their instruction was relatively high is seven times
the odds of it being relatively low (b ¼ 1.885, p ¼ 0.092) (see Table 11). In studies where the instruction was
found to produce mixed effects on students’ understanding of science concepts, the odds that the amount of
the active thinking in their instruction was relatively high is 19 times the odds of it being relatively low
(b ¼ 2.927, p ¼ 0.012). Additionally, the odds that the amount of the active thinking in their instruction was
moderate is five times the odds of it being relatively low (b ¼ 1.540, p ¼ 0.049).
Table 11
Summary of parameter estimates from multinomial logistic regression for model B1
Effect on Student
Understanding
Science Conceptsa
Positive
Mixed
Level of Active
Thinkingb
High
Moderate
High
Moderate
a
‘‘No response’’ ¼ reference group.
‘‘Low’’ ¼ reference group.
b
Journal of Research in Science Teaching
b
Std. Error
df
Sig.
Exp(b)
1.885
0.995
2.927
1.540
1.120
0.691
1.168
0.783
1
1
1
1
0.092
0.150
0.012
0.049
6.588
2.706
18.667
4.667
INQUIRY-BASED SCIENCE INSTRUCTION
17
Table 12
Summary of parameter estimates from multinomial logistic regression for model C1
Effect on Student
Understanding
Science Conceptsa
Positive
Mixed
Level of Drawing
Conclusionsb
High
Moderate
High
Moderate
b
1.560
0.397
2.351
0.231
Std. Error
df
Sig.
Exp(b)
1.114
0.683
1.144
0.744
1
1
1
1
0.161
0.560
0.040
0.756
4.760
0.672
10.500
1.260
a
‘‘No response’’ ¼ reference group.
‘‘Low’’ ¼ reference group.
b
Model C1 indicates that drawing and thinking about conclusions from data were still only a marginally
significant predictor of student outcomes [2LL ¼ 20.116; w2 (4, N ¼ 101) ¼ 7.899, p ¼ 0.095)]. The
parameter estimates indicate that only in studies that produced mixed effects on students’ understanding of
science concepts, the odds that emphasis on drawing and thinking about conclusions from data were
relatively high, 11 times the odds of it being relatively low (b ¼ 2.351, p ¼ 0.040) (see Table 12).
The analyses thus far have focused on comparisons across studies of the treatments that have the highest
amount of inquiry emphasis in the instruction for each study. However, within the subset of 104 studies, there
were 42 studies that had multiple treatment groups within the same study. These studies provided an
opportunity for investigating whether researchers found differences in student conceptual understanding
(i.e., student understanding of science concepts) when instructional treatments were directly compared in a
given research study. This set of studies also provided more nuanced information in the form of statistical
significance tests conducted as part of the analysis by the original authors. For example, the student learning
outcomes could be categorized as follows: (1) students in the treatment with higher amounts of inquiry
saturation did statistically significantly better than those in treatments with lower amounts of inquiry; (2) the
two (or more) treatments in the study had the same inquiry saturation, and all groups did statistically
significantly better on the post-test than the pre-test; (3) findings were mixed regarding the effect of inquiry
saturation on student learning; (4) there was no statistically significant difference found in student conceptual
learning even when there was one treatment with more inquiry saturation than the other treatments in the
study; and (5) the treatment with higher inquiry saturation did statistically worse than the treatment with
lower inquiry saturation.
Within these 42 comparative studies, 34 (81%) were in the moderate or high methodological rigor
standardized categories and 8 were in the low rigor category. There were 23 (55%) studies in which students in
the treatment with higher amounts of inquiry saturation did statistically significantly better than those in
treatments with lower amounts of inquiry saturation, and 4 (10%) studies where the 2 (or more) treatments in
the study had the same inquiry saturation; all groups did statistically significantly better on the post-test than
the pre-test. The remaining studies were distributed as follows: five (12%) of the studies had findings that
were inconclusive regarding the effect of inquiry saturation on student learning; 9 (21%) studies had no
statistically significant difference in student conceptual learning even when there was one treatment with
more inquiry saturation than the other treatments in the study; and 1 (2%) study found that the treatment with
higher inquiry saturation did statistically worse than the treatment with lower inquiry saturation.
Further exploration of the 34 moderate to high rigor category studies indicated that 19 (56%)
demonstrated a statistically significant increase in student conceptual understanding for instruction with
higher amounts of inquiry saturation compared with instruction with lower amounts of inquiry (see Table 13).
Eight studies (23%) showed no statistically significant difference in student understanding of science
concepts even when there was one treatment with more inquiry saturation than the other treatments in the
study. The distribution of studies in Table 13 was significantly different than expected by chance (w2 (12,
N ¼ 34) ¼ 23.79, p ¼ 0.022). In looking at the independent variables across these 34 studies, some
commonalities among the instructional interventions most closely aligned with aspects of the inquiry
framework are worth noting.
Journal of Research in Science Teaching
18
MINNER, LEVY, AND CENTURY
Table 13
Frequency and percent of moderate to high methodological rigor studies by impact on student conceptual learning across
different types of inquiry instruction
Instructional Independent Variable
Category Aa
(row %)
Active engagement with phenomena
Student responsibility for learning
Computer assisted instruction
Computer simulations in instruction
Use of text in instruction
Total
5
6
4
4
(83)
(67)
(80)
(50)
0
19 (56)
Category Bb
Category Cc
Category Dd
Total Number
of Studies
0
0
0
1 (12)
2 (33)
3 (9)
0
0
1 (20)
0
3 (50)
4 (12)
1 (17)
3 (33)
0
3 (38)
1 (17)
8 (23)
6
9
5
8
6
34
a
Instructional treatments with higher inquiry saturation produced significantly better student conceptual learning than treatments with lower
inquiry saturation.
b
Instructional treatments with equal inquiry saturation both produced significant post-test improvement on learning.
c
Findings were mixed regarding the effect of inquiry saturation on student learning.
d
No statistically significant difference found in student conceptual learning even when there was one treatment with more inquiry saturation
than the other treatments in the study.
Effect of Active Engagement with Phenomena. Hands-on or active engagement with science
phenomena is considered a key aspect of inquiry-based science instruction. Therefore, it is helpful to look
at the six comparative studies in this synthesis that isolated this kind of practice and compared it with other
types of instruction such as readings, worksheets, teacher demonstrations, video, as well as hands-on
manipulation with and without instructional conversation (Bay, Staver, Bryan, & Hale, 1990, 1992; Butts,
Hofman, & Anderson, 1993; Dalton, Morocco, Tivnan, & Mead, 1997; Ertepinar & Geban, 1996; Mastropieri
et al., 1998; McDavitt, 1994). Five of the six studies showed a statistically significant improvement in student
conceptual learning from instruction that had hands-on activities with more inquiry saturation when
compared with treatments with less emphasis on inquiry-based practices. Dalton et al. (1997) directly
compared two hands-on curricula to determine if it was the manipulation of materials or the conceptual
change principles embedded in the curricula that made the difference in student learning of physics concepts.
They found that the hands-on activities alone were not sufficient for conceptual change. Students also needed
an opportunity to process for meaning through class discussion of the reasons behind what they observed in
their independent design activities. The students with learning disabilities in this study demonstrated less
conceptual growth than their peers when measured on a written assessment for conceptual understanding, but
performed comparably to their low- and average-achievement peers on a diagram test, indicating the need to
carefully consider the influence of testing modality on the determination of students’ conceptual knowledge
growth.
One study (Bay et al., 1990, 1992) in this subset found no significant difference between direct
instruction (teacher demonstration and worksheets) and discovery instruction (active engagement with
physical science phenomena and experimentation) on students’ understanding of concepts related to
controlling variables in experiments immediately following the instruction. However, in a 2-week follow-up
assessment, the retention of concepts related to controlling variables in experiments was better for students
who received the discovery teaching (higher inquiry saturation). Additionally, the learning-disabled students
who received discovery teaching outperformed their learning-disabled peers who received direct instruction
in the 2-week performance-based assessment of their ability to generalize their learning. Overall, there seems
to be consistent evidence from this subset of studies that hands-on experience with science phenomena is
important for student conceptual learning, especially when coupled with teacher-guided hypothesis testing
and debate.
Effect of Level of Student Responsibility for Learning. Another key aspect of inquiry-based science
instruction is the level of student- versus teacher-direction of the learning process. In our inquiry-based
science conceptual framework (see Table 1), we termed this ‘‘student responsibility for learning,’’ but the
specific manifestation of how this has been studied was quite varied. There were nine studies with
Journal of Research in Science Teaching
INQUIRY-BASED SCIENCE INSTRUCTION
19
comparative designs that looked at some contrasting aspects of student responsibility for learning. Of these,
six studies found a statistically significant increase in student conceptual learning when there was more
student responsibility in the instruction (and higher inquiry saturation) compared with instruction where there
was more teacher-directed learning goals and activities (lower inquiry saturation) (Chang & Barufaldi, 1997,
1999; Chang & Mao, 1998; Lumpe & Staver, 1995; Marinopoulos & Stavridou, 2002; Smith, Maclin,
Grosslight, & Davis, 1997). Two of these studies specifically demonstrated that collaborative work with peers
increased conceptual learning compared with working independently (Lumpe & Staver, 1995; Marinopoulos
& Stavridou, 2002). There were also three studies that did not find a statistically significant effect of increased
student directedness in the instruction on conceptual learning (Dana, 2001; Myers, 1988; Sinclair, 1994;
Yager, Myers, Blunck, & McComas, 1992). However, all of these studies noted issues with teacher effects,
confounding the intervention treatments under investigation (i.e., poor implementation of the instructional
conditions that could have contributed to the nature of the findings).
Research Limitations
The analytic approach that was undertaken in this synthesis was atypical—traditional effect sizes were
not calculated, nor were analyses based exclusively on qualitative themes typical to meta-syntheses. The
mixed-method approach was an explicit decision on the investigators’ part, to allow for between-study
concurrent analysis of the widest range of studies relevant to the research question being investigated.
However, the inclusion of such a wide range of study types required the development of new mixed-method
research tools to extract the data for the synthesis that necessarily focused on the independent variables
relevant to answering the synthesis research question. This meant that our instruments were sometimes
insensitive to capturing meaningful differences in the original research, such as treatment group differences
on various permutations of real-time graphing or effects of varying the number of students in work groups.
Efforts were made to point this out in the analysis of comparative studies, but the broad-based nature of this
synthesis precludes drawing conclusions about specific types of interventions and teaching strategies.
Researchers interested in specific types of instructional interventions would need to do more
tailored literature searches or syntheses. One such study was completed since this synthesis by
Schroeder, Scott, Tolson, Huang, and Lee (2007). They investigated through traditional meta-analytic
techniques the effect of different teaching methodologies on student achievement. Their results concur
with what was found here, that inquiry strategies demonstrated a statistically significant positive
influence when compared with the traditional teaching methods used in instruction of the control groups.
They defined inquiry strategies as ‘‘Teachers use student-centered instruction that is less step-by-step
and teacher-directed than traditional instruction; students answer scientific research questions by
analyzing data (e.g., using guided or facilitated inquiry activities, laboratory inquiries)’’ (p. 1446). They
noted that though they had eight teaching strategy categories; these categories were not discrete and often
overlapped.
A second limitation relates to methodological rigor. Overall, 30% of the studies included in our synthesis
were rated as having relatively low methodological rigor, 36% moderate rigor, and 34% high rigor relative to
the overall distribution of average-rigor scores of the studies in this synthesis. The issues regarding
methodological rigor of the studies in this synthesis could raise concerns about the trustworthiness of the
findings that these studies generated; however, in the statistical models looking at the relationship between
inquiry saturation and student outcomes, methodological rigor was not a significant predictor. Yet, to err on
the side of caution, the qualitative analysis of findings of the comparative studies was constrained to those
studies with moderate or high relative rigor.
Though this work focused on content learning—conceptual understanding in particular—there were
many other dependent variables investigated in this sample of studies, for example, science process skills,
understanding of the scientific process, science attitudes, participation in instruction, science career choices,
and school attendance. Due to the inherent limitations of any grant, further analyses of these different types of
findings were not possible within this current synthesis, but would greatly add to the collective understanding
of the full effect of inquiry instruction on students.
Journal of Research in Science Teaching
20
MINNER, LEVY, AND CENTURY
Summary and Discussion
Fifty-one percent of the 138 studies in the synthesis showed positive impacts of some level of inquiry
science instruction on student content learning and retention. In looking more specifically at the 101 studies of
student science conceptual understanding, we found that there was no statistically significant association
between amount of inquiry saturation and increased student science conceptual learning. However,
subsequent model refinement indicated that the amount of active thinking, and emphasis on drawing
conclusions from data, were in some instances significant predictors of the increased likelihood of student
understanding of science content. In the 42 comparative studies, more than half found that students in
treatments with higher amounts of inquiry saturation (especially hands-on engagement with science
phenomena and emphasis on student responsibility for learning) did statistically significantly better than
those in treatments with lower amounts of inquiry.
The evidence of effects of inquiry-based instruction from this synthesis is not overwhelmingly positive,
but there is a clear and consistent trend indicating that instruction within the investigation cycle (i.e.,
generating questions, designing experiments, collecting data, drawing conclusion, and communicating
findings), which has some emphasis on student active thinking or responsibility for learning, has been
associated with improved student content learning, especially learning scientific concepts. This overall
finding indicates that having students actively think about and participate in the investigation process
increases their science conceptual learning. Additionally, hands-on experiences with scientific or natural
phenomena also were found to be associated with increased conceptual learning. Both of these findings are
consistent with what constructivist learning theories would predict—active construction of knowledge is
necessary for understanding; in this case, the active construction takes place through the investigation cycle,
and the knowledge is science concepts.
The implications of these findings are somewhat at odds with current educational policy, which
encourages coverage of a large number of scientific concepts to be tested at various stages in a child’s
educational experience. Since the assessments used by states largely test knowledge or recall of discrete
science facts, concepts, and theories, teachers are constrained by the need for wide topical coverage within an
already crowded daily schedule. They often resort to using less demanding (both for them and students)
teaching strategies, such as call-and-respond formative assessment, which focuses on factual level
information, and verification labs rather than investigations that have some opportunities for student
responsibility and decision-making integrated. Ironically, the findings from this synthesis indicate that
teaching strategies that actively engage students in the learning process through scientific investigations are
more likely to increase conceptual understanding than are strategies that rely on more passive techniques.
We did not find, however, that overall high levels of inquiry saturation in instruction were associated with
more positive learning outcomes for students. The only learning associations we found with the amount of
inquiry saturation were modest. However, future research may be able to further explore these associations
both in terms of conceptual learning as well as other kinds of student outcomes that were not addressed in this
synthesis.
Throughout the project, the research team was very conscious of the potential positive bias that we may
bring to this study. Therefore, we relied heavily on developing coding protocols that drew from specific,
auditable evidence from the studies, rather than relying on vague definitions and coding schemes that required
a great deal of inference. This conceptual work was necessary in order to operationalize both the dependent
and independent variables for this study, one of which was ‘‘inquiry-based instruction.’’ This term has come
to mean many different things, and future research is needed in order to further operationalize this prevalent
construct. One way in which this term should be further clarified is by distinguishing it from constructivist
teaching practices, which can be applied across disciplinary boundaries, such as questioning strategies that
encourage active student thinking and knowledge construction. In the current inquiry framework, we have
embedded these practices within the investigation cycle, which is how we defined inquiry-based practice.
However, further work should be done to determine when these practices occur outside the investigative
context and how they compare to the student learning that takes place within the investigation context. This
kind of work could significantly help practitioners with limited time and resources determine when to
Journal of Research in Science Teaching
INQUIRY-BASED SCIENCE INSTRUCTION
21
increase the emphasis on active thinking or responsibility for learning (decision-making) in their science
teaching.
In addition, to allow for comparability across studies of science education interventions, other key
research tools are needed to quantify how much of these components of instruction are present. The
Inquiry Science Instruction Conceptual Framework was one attempt to undertake this need for conducting
syntheses. Additional instrument development has been undertaken at EDC to provide a tool to capture
and quantify instruction in the classroom via the Inquiry Science Instruction Observation Protocol (ISIOP).
This will allow for the collection of comparable data in the primary research conducted in schools,
thus enabling easier cross-site and cross-study comparison of specific aspects of science instructional
practices.
As is always the case with research, this synthesis raises more questions than it answers. However, it has
articulated those questions more precisely and generated researchable hypotheses about the amount of
inquiry saturation and its distribution that can now be tested. Moreover, it has challenged the qualitative and
quantitative paradigms equally to consider what it means to do research of high quality that recognizes a
commonly shared set of high standards and responsibilities. Lastly, this synthesis has initiated a process for
enabling these two paradigms to inform each other so that together they can influence policy more
productively by providing a knowledge base that has integrity by virtue of its rigor and diversity of
perspectives.
This article is based upon work supported by the National Science Foundation (Grant No. 0101766).
Any opinions, findings, and conclusions or recommendations expressed in this article are those of the
authors and do not necessarily reflect the views of the National Science Foundation. The authors
would like to thank Erica Jablonski and Erica Fields for their contribution to the work of the project,
and Karen Worth and Judith Opert Sandler for their ongoing advice throughout. Additional
publications from this study include seven technical reports describing the methodological aspects of
each phase of this study, which can be found at http:/ /cse.edc.org/products/inquirysynth/
technicalReports.asp.
References
Anderson, R. (2007). Inquiry as an organizing theme for science curricula. In: S. Abell & N. Lederman
(Eds.), Handbook of research on science education (pp. 807–830). Mahwah, NJ: Lawrence Erlbaum
Associates.
Bay, M., Staver, J., Bryan, T., & Hale, J. (1990, April). Science instruction for the mildly handicapped:
Direct instruction versus discovery teaching. Paper presented at the annual meeting of the National
Association for Research in Science Teaching, Atlanta, GA.
Bay, M., Staver, J., Bryan, T., & Hale, J. (1992). Science instruction for the mildly handicapped: Direct
instruction versus discovery teaching. Journal of Research in Science Teaching, 29, 555–570.
Bredderman, T. (1983). Effects of activity-based elementary science on student outcomes: A
quantitative synthesis. Review of Educational Research, 53(4), 499–518.
Butts, D., Hofman, H., & Anderson, M. (1993). Is hands-on experience enough? A study of young
children’s views of sinking and floating objects. Journal of Elementary Science Education, 5, 50–64.
Cakir, M. (2008). Constructivist approaches to learning in science and their implication for science
pedagogy: A literature review. International Journal of Environmental and Science Education, 3(4), 193–
206.
Chang, C.-Y., & Barufaldi, J. (1997, March). Initiating change in students’ achievement and alternative
frameworks through a problem solving based instructional model. Paper presented at the annual meeting of
the National Association for Research in Science Teaching, Oak Brook, IL.
Chang, C.-Y., & Barufaldi, J. (1999). The use of a problem-solving-based instructional model in
initiating change in students’ achievement and alternative frameworks. International Journal of Science
Education, 21, 373–388.
Journal of Research in Science Teaching
22
MINNER, LEVY, AND CENTURY
Chang, C.-Y., & Mao, S.-L. (1998). The effects of an inquiry-based instructional method on earth
science students’ achievement. Paper presented at the annual meeting of the National Association for
Research in Science Teaching, San Diego, CA.
Dalton, B., Morocco, C., Tivnan, T., & Mead, P. (1997). Supported inquiry science: Teaching for
conceptual change in urban and suburban science classrooms. Journal of Learning Disabilities, 30, 670–684.
Dana, L. (2001). The effects of the level of inquiry of situated secondary science laboratory activities on
students’ understanding of concepts and the nature of science, ability to use process skills and attitudes
toward problem solving. Unpublished doctoral dissertation, University of Massachusetts-Lowell.
Department for Education and Employment. (1992). The national curriculum for England London:
Department for Education and Employment. Retrieved from http:/ /curriculum.qcda.gov.uk/
Ertepinar, H., & Geban, O. (1996). Effect of instruction supplied with the investigative-oriented
laboratory approach on achievement in a science course. Educational Research, 38, 333–341.
European Commission. (2007). Science education now: A renewed pedagogy for the future of
Europe. Brussels: European Commission. Retrieved from http:/ /ec.europa.eu/research/science-society/
document__library/pdf_06/report-rocard-on-science-education_en.pdf
Garson, G.D. (2008). Logistic regression Statnotes: Topics in multivariate analysis. Retrieved from
http:/ /faculty.chass.ncsu.edu/garson/PA765/logistic.htm#assume
Geier, R., Blumenfeld, P., Marx, R., Krajcik, J., Fishman, B., & Soloway, E., et al. (2008). Standardized
test outcomes for students engaged in inquiry-based science curricula in the context of urban reform. Journal
of Research in Science Teaching, 45(8), 922–939.
Goodrum, D., & Rennie, L., Commonwealth of Australia. (2007). Australian school science education
national action plan 2008–2012: Volume 1. Retrieved from http:/ /www.innovation.gov.au/Science
AndResearch/publications/Documents/Volume1final_28August2008.pdf
Hmelo-Silver, C., Duncan, R., & Chinn, C. (2007). Scaffolding and achievement in problem-based and
inquiry learning: A response to Kirschner, Sweller, and Clark (2006). Educational Psychologist, 42(2), 99–
107.
Inter Academies Panel. (2006). Report of the working group on international collaboration in the
evaluation of inquiry-based science education programs. Santiago, Chile: Fundacion para Estudios
Biomedicos Avanzados. Retrieved from http:/ /www.ianas.org/santiago_SE2006_en.html
Kirschner, P., Sweller, J., & Clark, R. (2006). Why minimal guidance during instruction does not work:
An analysis of the failure of constructivist, discovery, problem-based, experiential, and inquiry-based
teaching. Educational Psychologist, 41(2), 75–86.
Lazarowitz, R., & Huppert, J. (1993). Science process skills of 10th-grade biology students in a
computer-assisted learning setting. Journal of Research on Computing in Education, 25, 366–382.
Lewis, S., & Lewis, J. (2008). Seeking effectiveness and equity in a large college chemistry course: An
HLM investigation of peer-led guided inquiry. Journal of Research in Science Teaching, 45(7), 794–811.
Lipsey, M., & Wilson, D. (2001). Practical meta-analysis. Applied Social Research Methods Series, 49.
Thousand Oaks, CA: Sage Publications.
Lumpe, A., & Staver, J. (1995). Peer collaboration and concept development: Learning about
photosynthesis. Journal of Research in Science Teaching, 32, 71–98.
Marinopoulos, D., & Stavridou, H. (2002). The influence of a collaborative learning environment on
primary students’ conceptions about acid rain. Journal of Biological Education, 37, 18–25.
Mastropieri, M., Scruggs, T., Mantzicopoulos, P., Sturgeon, A., Goodwin, L., & Chung, S. (1998). A
place where living things affect and depend on each other: Qualitative and quantitative outcomes associated
with inclusive science teaching. Science Education, 82, 163–179.
Mayer, R. (2004). Should there be a three-strikes rule against pure discovery learning? The case for
guided methods of instruction. American Psychologist, 59(1), 14–19.
McDavitt, D. (1994). Teaching for understanding: Attaining higher order learning and increased
achievement through experiential instruction. Unpublished manuscript, Curry School of Education,
University of Virginia.
Journal of Research in Science Teaching
INQUIRY-BASED SCIENCE INSTRUCTION
23
Myers, L. (1988). Analysis of student outcomes in ninth-grade physical science taught with a science/
technology/society focus versus one taught with a textbook orientation. Unpublished doctoral dissertation,
University of Iowa.
National Research Council. (1996). National Science Education Standards. Washington, DC: The
National Academies Press.
National Research Council. (2000). Inquiry and the National Science Education Standards. Washington,
DC: The National Academies Press.
No Child Left Behind Act of 2001, P.L.107-110. (2002).
Onwuegbuzie, A., & Daniel, L. (2003, February 19). Typology of analytical and interpretational errors
in quantitative and qualitative educational research. Current Issues in Education [on-line], 6,2. Available:
http://cic.ed.asu.edu/volume6/number2/
Palmer, D. (2009). Student interest generated during an inquiry skills lesson. Journal of Research in
Science Teaching, 46(2), 147–165.
Patrick, H., Manizicopoulos, P., & Samarapungavan, A. (2009). Motivation for learning science in
kindergarten: Is there a gender gap and does integrated inquiry and literacy instruction make a difference.
Journal of Research in Science Teaching, 46(2), 166–191.
Pedhazur, E., & Schmelkin, L. (1991). Measurement, design, and analysis: An integrated approach.
Hillsdale, NJ: Lawrence Erlbaum Associates, Inc.
Sadeh, I., & Zion, M. (2009). The development of dynamic inquiry performances within an open inquiry
setting: A comparison to guided inquiry setting. Journal of Research in Science Teaching, Retrieved from
http:/ /www.interscience.wiley.com. EPub August 5, 2009.
Schroeder, C., Scott, T., Tolson, H., Huang, T., & Lee, Y. (2007). A meta-analysis of national research:
Effects of teaching strategies on student achievement in science in the United States. Journal of Research in
Science Teaching, 44(10), 1436–1460.
Shymansky, J., Kyle, W., & Alport, J. (1983). The effects of new science curricula on student
performance. Journal of Research in Science Teaching, 20(5), 387–404.
Sinclair, A. (1994). Prediction making as an instructional strategy: Implications of teacher effects on
learning, attitude toward science, and classroom participation. Journal of Research and Development in
Education, 27, 153–161.
Smith, C., Maclin, D., Grosslight, L., & Davis, H. (1997). Teaching for understanding: A study of
students’ preinstruction theories of matter and a comparison of the effectiveness of two approaches to
teaching about matter and density. Cognition and Instruction, 15, 317–393.
The Inquiry Synthesis Project, Center for Science Education, Education Development Center, Inc,
(April, 2006a). Technical report 1: Generating the synthesis sample of studies. Retrieved from http:/ /
cse.edc.org/products/inquirysynth/pdfs/technicalReport1.pdf
The Inquiry Synthesis Project, Center for Science Education, Education Development Center, Inc.
(April, 2006b). Technical Report 2: Conceptualizing inquiry science instruction. Retrieved from http:/ /
cse.edc.org/products/inquirysynth/pdfs/technicalReport2.pdf.
The Inquiry Synthesis Project, Center for Science Education, Education Development Center, Inc.
(April, 2006c). Technical Report 3: Operationalizing the inclusion/exclusion coding process. Retrieved from
http:/ /cse.edc.org/products/inquirysynth/pdfs/technicalReport3.pdf.
The Inquiry Synthesis Project, Center for Science Education, Education Development Center, Inc,
(April, 2006d). Technical Report 4: Report-study reconciliation process. Retrieved from http:/ /cse.edc.org/
products/inquirysynth/pdfs/technicalReport4.pdf.
The Inquiry Synthesis Project, Center for Science Education, Education Development Center, Inc,
(April, 2006e). Technical Report 5: Operationalizing the inquiry science instruction coding process.
Retrieved from http:/ /cse.edc.org/products/inquirysynth/pdfs/technicalReport5.pdf.
The Inquiry Synthesis Project, Center for Science Education, Education Development Center, Inc,
(June, 2009a). Technical report 6: Operationalizing the coding of research rigor, context, and study findings.
Retrieved from http:/ /cse.edc.org/products/inquirysynth/pdfs/technicalReport6.pdf
Journal of Research in Science Teaching
24
MINNER, LEVY, AND CENTURY
The Inquiry Synthesis Project, Center for Science Education, Education Development Center, Inc,
(June, 2009b). Technical Report 7: Bibliography of Studies Included in Final Inquiry Synthesis Project
Analyses. Retrieved from http:/ /cse.edc.org/products/inquirysynth/pdfs/technicalReport7.pdf.
Vogt, W.P. (1999). Dictionary of statistics & methodology: A nontechnical guide for the social sciences.
(2nd edn.) Thousand Oaks: Sage Publications.
Yager, R., Myers, L., Blunck, S., & McComas, W. (1992). The Iowa Chatauqua program: What
assessment results indicate about STS instruction. Bulletin of Science, Technology and Society, 12, 26–38.
Journal of Research in Science Teaching
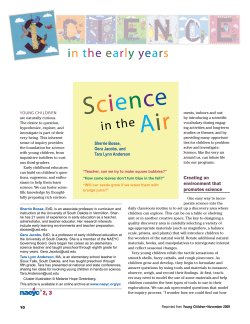
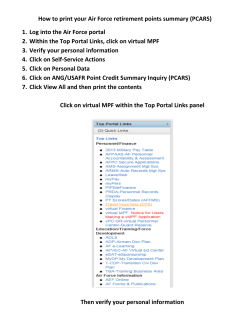


© Copyright 2026