
Understanding what is happening in ICT in South Africa
Evidence for ICT Policy Action
Policy Paper 7, 2012
Understanding
what is happening in ICT
in South Africa
A supply- and demandside analysis of the
ICT sector
Alison Gillwald, Mpho Moyo
and Christoph Stork
Research ICT Africa
Research ICT Africa (RIA) is an information and communication technology (ICT) policy and regulation research
network based in Cape Town, South Africa, under the directorship of Dr. Alison Gillwald. As a public interest think tank,
RIA fills a strategic gap in the development of a sustainable information society and knowledge economy. The network
builds the ICT policy and regulatory research capacity needed to inform effective ICT governance in Africa. RIA was
launched ten years ago and has extended its activities through national, regional and continental partnerships. The
network emanates from the growing demand for data and analysis necessary for appropriate but visionary policy
required to catapult the continent into the information age. Through development of its research network, RIA seeks
to build an African knowledge base in support of sound ICT policy and regulatory design, transparent implementation
processes, and monitoring and review of policy and regulatory developments on the continent. The research, arising
from a public interest agenda, is made available in the public domain, and individuals and entities from the public
sector, private sector and civil society are encouraged to use it for purposes of teaching and further research or to
enable them to participate more effectively in national, regional and global ICT policymaking and governance.
Series Editor: Alison Gillwald
Editorial assistance: Broc Rademan
Copy-editing: Chris Armstrong
Evidence for ICT Policy Action
Acknowledgements
This research is made possible by significant funding received from the International Development Research Centre
(IDRC), Ottawa, Canada, and RIA network members express their gratitude to the IDRC for its support.
The network consists of members in 18 African countries, and RIA researchers in 12 of these countries were able to
participate in the 2012 supply- and demand-side reviews of their national ICT sectors (as detailed in this and other
country reports). The 2012 national studies were led by the following RIA network members: Dr. Patricia Makepe
(Botswana); Prof. Olivier Nana Nzèpa (Cameroon); Dr. Lishan Adam (Ethiopia); Dr. Godfred Frempong (Ghana); Prof.
Tim Waema (Kenya); Francisco Mabila (Mozambique); Dr. Christoph Stork (Namibia); Fola Odufuwa (Nigeria); Louise
Karamage (Rwanda); Dr. Alison Gillwald (South Africa); Mary Materu-Behitsa (Tanzania); and Ali Ndiwalana (Uganda).
RIA’s 2012 Household and Individual ICT Access and Use Surveys, and Informal Sector ICT Access and Use Surveys
in 12 countries were led by Dr. Christoph Stork who, together with Mariama Deen-Swarray, was responsible for the
preparation of the statistical data and data analysis for the 12 sets of national findings and the comparative analyses
across the 12 countries. The 2012 Telecom Regulatory Environment (TRE) assessments, the compilation of supply-side
indicators, and the collection and presentation of the pricing data, were coordinated across the 12 study countries by
Enrico Calandro and Mpho Moyo. Additional peer-reviewing to that done amongst partners was undertaken by Steve
Esselaar and Enrico Calandro.
Authors
Alison Gillwald (PhD) is Executive Director of Research ICT Africa, an ICT policy and regulatory think-tank based in
Cape Town, South Africa, which hosts an African-wide research network. She also holds an adjunct professorship at
the Management of Infrastructure Reform and Regulation Programme at the University of Cape Town Graduate School
of Business where she convenes an ICT policy and regulatory executive training programme for regulators, policymakers and parliamentarians, and supervises doctoral students in this area. She served on the founding Council of
the South African Telecommunications Regulatory Authority (SATRA) and the first Independent Broadcasting Authority
prior to that. She is widely published in the areas of telecommunications and broadcasting policy and regulation,
global governance, gender and politics more broadly. She has advised regional bodies, governments, regulators and
competitions commissions on the continent, and has been commissioned by multilateral agencies including the African
Union, infoDev, the Commonwealth Telecommunication Organisation and the International Telecommunications Union.
Mpho Moyo is a researcher in the information and communication technologies (ICT) sector. Mpho is passionate
about development on the African continent, particularly the telecommunications sector, and has gained extensive
experience in the sub-Saharan African ICT market. She is engaged in building up an ICT pricing database in Africa
as well as several other collaborative projects such as a cloud computing paper. She has conducted collaborative
research on the telecommunications sector in 16 African countries, on ICT access and use in the informal sector,
mobile money, gender as well as entrepreneurship. She has also completed a study on next-generation backbone
infrastructure and a regulatory assessment of universal access strategies in selected African countries. Before joining
Research ICT Africa, Mpho worked for Frost & Sullivan as an ICT analyst.
Christoph Stork (PhD) is Senior Researcher at the Research ICT Africa. He holds a PhD in financial economics from
London Guildhall University, UK, a Diplom Kaufmann (MA) from the University of Paderborn, Germany, and a BA
Economics from the Nottingham Trent University, UK. He has more than 10 years research experience in Africa and has
led continent-wide household and small business surveys, providing the only multi-country demand-side data and
analysis of ICT access and use on the continent, for use by regulators, policymakers and multilateral agencies such as the
OECD and the ITU. His research has informed policies, laws and regulations in the ICT field, specifically in Namibia where
he has provided technical advice to the Namibian Communications Commission and Namibian Government on ICT
policy and regulation, including a ground-breaking benchmark study on interconnection termination rates.
Understanding what is happening in ICT in South Africa
Executive summary
While the South African information and communication technology (ICT) sector continues to demonstrate dynamic
growth, particularly as driven by the mobile sector, the growth has not met the national objective of affordable access
to the full range of communication services. Access to mobile services continues to grow, however, broadband access
(particularly access to fixed broadband) remains very low in comparison to other lower-middle-income countries, and
the prices of all communication services remain high by both African and global standards.
Sector growth continues to rise at (at least) double the national growth rate, and is now contributing around 6% to
national GDP. This growth is largely despite the sector’s policy, however, than because of it. The policy environment
has not created an environment conducive to investment, nor institutional arrangements likely to result in effective
competition - resulting in a number of regulatory bottlenecks that constrain sector expansion.
Regulatory
bottlenecks hamper
market expansion
in South Africa
Fixed-line access continued to decline, to 18% of households, in 2012, with only 24% of households in urban areas, and
5.8% of households in rural areas, having a working fixed line. Fixed-to-mobile substitution has been extensive, with
over 86% of respondents to the RIA South Africa 2012 Household and Individual ICT Access and Use Survey indicating
that they use mobile phones instead of fixed. Over 42% stated that fixed lines are not available where they live, and
51.5% stated that they cannot afford one.
Ownership of mobile phones continues to grow. Claims by mobile operators of penetration rates of over 100% reflect
the number of SIMs in the market, a significant portion of which are duplicates, in addition to the SIMs used for nonhuman activities such as satellite tracking. Individual mobile phone ownership stands at 86% of the adult population
(15 years or older). There are now few differences, in use of basic voice and SMS services, between mobile phone users
in urban and rural areas, or between those at the top of the pyramid (ToP) and those at the base of the pyramid (BoP).
The continued uptake and increased use of mobile phones have been stimulated by the availability of smarter devices
at lower cost and by reductions in the cost of services. Mobile prices have dropped via a mobile termination rate
(MTR) reduction glide path established by the regulator, the Independent Communications Authority of South Africa
(ICASA), with the final MTR reduction taking place in March 2013. However, the MTR is still far from cost, and the
cheapest mobile prices in South Africa still lag behind countries where the regulator has enabled competitive pricing
pressure by enforcing a cost-based MTR.
The mobile
termination rate
glide path led to
a decline in voice
tariffs
The two small mobile players, Cell C and Telkom Mobile, have finally been able to put pressure on incumbents Vodacom
and MTN, forcing down prices and stimulating innovative product and price offerings. However, while South Africa’s
ranking on the RIA Pricing Transparency Index: Prepaid Mobile improved from 30th in 2012 to 22nd in 2013 (out of 46
African countries indexed), the cheapest mobile prepaid product in South Africa is still nearly 7.5 times more expensive
than the African continent’s cheapest similar product, and still three times more expensive than the cheapest product
available from a dominant operator in Africa.
Although South African voice prices are finally coming down (largely via the MTR reductions), a declining use of
voice services and growth in data use are having a significant impact on the development of the mobile market.
The competitiveness of the ICT market can no longer be understood in terms of distinct voice and data segments.
Voice and data services need to be understood in relation to each other if one is to understand the changing nature
of business and impacts on consumer welfare. It is becoming increasingly difficult to distinguish between voice and
data subscribers: airtime is increasingly converted for data use; data services are increasingly used to make voice calls,
through voice over IP (VoIP); and paid-for SMSs are giving way almost entirely to free instant-messaging services.
As voice revenue
declines, data
services become
a priority for
operators
Evidence for ICT Policy Action
South Africa’s low
user uncapped
mobile prepaid
broadband pricing
is higher than in
other countries
There is evidence of dynamism and pricing pressure in the mobile broadband market segment. Unlike in more
mature markets where fixed-line broadband is the dominant and least expensive form of broadband access, in South
Africa it is wireless mobile broadband that is predominant and cheapest. Comparisons between South African price
baskets for fixed-line broadband (ADSL) and mobile broadband reveal that fixed-line packages are far more expensive
than comparable mobile packages. And within the mobile broadband market segment, postpaid prices are more
favourable than prepaid, as mobile operators compete for the lucrative postpaid broadband market.
Broadband
penetration in
South Africa is
sub-optimal in
comparison to
other middleincome countries
While South African consumers with access to broadband services are benefitting from stiff price competition between
mobile operators seeking to attract and retain data customers, it should not be assumed that the uptake of mobile
broadband services – and the price competitiveness of these services in this more liberalised segment of the market
– means that issues of affordable access have been fully addressed. Despite the take-off of mobile broadband, South
Africa’s broadband penetration remains poor compared to that of other lower-middle-income countries, including
some such countries in Africa (e.g. North African and African island states). Fixed-broadband penetration is particularly
low in South Africa, and South African enterprises dependent on stable, high-speed broadband frequently identify
broadband as a major input cost in their businesses. And the total number of internet users in South Africa is still only
around 34% of the adult population, according to the results of the 2012 RIA ICT Survey. Affordability and quality will
be critical factors in generating faster diffusion of internet.
When compared to other African countries, South African prices for prepaid and postpaid mobile 5GB baskets, and
postpaid 1GB baskets, rated well for affordability in April 2013, while prepaid 1GB baskets rated less favourably,
coming fourth in affordability behind Ghana, Kenya and Tanzania – as per the RIA Africa Broadband Pricing Index
(see RIA, 2013).
The high price of broadband in South Africa remains a serious challenge. High broadband pricing is a barrier to the
exponential growth in broadband required for South Africa to catch up to the rest of the world and, for enterprises
which must make use of it regardless of its price (because of the need for stable connectivity), broadband represents
a high input cost with negative consequences for growth, development and global competitiveness of these
enterprises. International bandwidth prices (once the major factor in South African data prices) have plummeted, and
it is now domestic terrestrial and IP transit prices which are the major cost drivers.
Affordability
is critical to
accelerating
diffusion of the
Internet
The impact of the current broadband realities on the cost of communications in South Africa requires regulatory
assessment. Policy and regulatory bottlenecks that constrain operators and potential players from responding
dynamically to the changing nature of communication require policy and regulatory attention. Major policy challenges
thus remain for South Africa if it is to create the conditions for large-scale investment (in backbone and backhaul
networks) to deal with demand for stable, high-speed broadband. Such investments will require more capital than
government alone can be expected to provide. The South African Government needs to create an environment
conducive to investment, through credible commitments and a predictable regulatory environment. And it is not
only capital that is required. The creation of an integrated information infrastructure requires a clear delivery strategy,
including, inter alia: demand-stimulation strategies in the areas of education and e-literacy; discounted entry-level
prices for devices and services; and removal of taxes, or tax deductions, for internet-enabled devices (e.g. when part
of education initiatives).
Table of contents
Part one
1
Introduction
1
Market overview
3
Policy and legal framework
5
ICT Vision 2020
6
National Development Plan:
Vision for 2030
8
ICT Policy Review Panel and
Draft Broadband Policy
Policy outcome 1:
poor institutional arrangements
8
10
ICASA
10
USAASA
10
Policy outcome 2:
ineffectual regulatory environment
12
Policy outcome 3:
limited infrastructure extension and
bottlenecks
16
Undersea cables
Infrastructure sharing and
inter-agency coordination
Policy outcome 4:
high wholesale pricing
16
18
19
Facilities-leasing
19
Termination rates
20
Policy outcome 5:
Policy outcome 6:
Policy outcome 7:
mobile broadband speeds faster
than ADSL
spectrum allocation bottlenecks
Digital migration
34
Auctions
36
Policy outcome 9:
incumbent operators strong
but Telkom weak
39
Fixed-line market
39
Mobile market
42
MTN
42
Vodacom
45
Telkom Mobile
47
Cell C
48
Conclusions
Part two
48
49
Policy outcome 10:
unaffordable access and suboptimal use 49
Household indicators
50
Television and radio ownership and use
50
Fixed lines
55
End of payphones?
56
Broadband internet
59
Mobile ownership
60
Safety
62
Affordability
62
Computer use
66
Gender
67
Informal businesses
70
Conclusions and recommendations
31
33
74
Evidence for ICT Policy Action
Acronyms and abbreviations
ADSL
asymmetric digital subscriber line
MUX
multiplex
ARPU
average revenue per user
MTR
mobile termination rate
BoP
base of the pyramid
MVNO
mobile virtual network operator
BBBEE
Broad-Based Black Economic Empowerment
NGN
next-generation networking
BTS
base transceiver station
NPC
National Planning Commission
CA
conditional access
NRI
Network Readiness Index
CAPEX
capital expenditure
OECD
CCC
Complaints and Compliance Committee
Organisation for Economic Co-operation
and Development
DBAB
Digital Broadcasting Advisory Body
PICC
DoC
Department of Communications
Presidential Infrastructure Coordinating
Commission
DTT
digital terrestrial television
PSTN
public switched telephone network
EBIDTA
earnings before interest, depreciation, taxes
and amortisation
QoS
quality of service
RIA
Research ICT Africa
ECA
Electronic Communications Act
SACF
South African Communications Forum
ECNS
electronic communications network service
SADC
Southern African Development Community
ECS
electronic communications service
SIP
Strategic Integrated Project
EPG
electronic programme guide
SMEs
small and medium enterprises
GDP
gross domestic product
Stats SA
Statistics South Africa
GSMA
GSM Association
STB
set-top box
ICASA
Independent Communications Authority of
South Africa
ToP
top of the pyramid
TRE
Telecom Regulatory Environment
ICT
information and communication technology
USA
Universal Service Agency
IP
internet protocol
ISP
internet service provider
USAASA Universal Service and Access Agency of
South Africa
ITU
International Telecommunication Union
USAF
Universal Service and Access Fund
LLU
local loop unbundling
USF
Universal Service Fund
LTE
long-term evolution
VANS
value-added network service providers
MDDA
Media Development and Diversity Agency
WEF
World Economic Forum
MLCS
mobile land communications systems
WiMAX
a technical standard for fixed wireless
MOU
minutes of use
Understanding what is happening in ICT in South Africa
Part one
Introduction
South Africa has characteristics of both an advanced and a developing economy. It has access to technology, it has
sophisticated institutions including research bodies and universities, and it has a strong private sector and fiscal resources.
At the same time, half of the 50million people in South Africa live below the poverty line, and a large proportion of
South Africans have weak educational qualifications. These apparent anomalies play themselves out in the ICT sector.
South Africa is characterised by early adoption of leading-edge technologies by high-income users (both individuals and
corporations) that were in parallel with developed economies; while at the same time the majority of the population, the
public sector, and most small and micro enterprises reflect the slower adoption patterns typical of developing countries.
Despite having
a sophisticated
ICT market, South
Africa lags behind
comparator
countries
The levels of economic and social development in South Africa make it significantly different from other sub-Saharan
African countries. Electrification is widespread, even into informal settlements and rural areas, and the basic education
and health systems are extensive. The economy is relatively industrialised, with a sophisticated financial system. Levels
of urbanisation are high at over 50% and increasing (Stats SA, 2011). With a population of 50million and a GDP of
US$357billion (Wikipedia, n.d.), South Africa has, by most measures, the largest and most advanced market on the
continent. Despite the economic inequalities that persist in the country (it has amongst the highest Gini coefficients
in the world), there is an extensive social grant system in place – providing poor households with some cash income
which enables, inter alia, some low-use access to communications services.
These combined factors make for a different context for ICT development in South Africa than in most other African
countries with which it is compared in this report. Comparisons are thus often made between South Africa and other
lower-middle-income countries or other emerging economies. That being said, and despite South Africa’s apparent
advantages over other African nations, in a number of areas which impact on the key policy objective of affordable
access to communication services, South Africa is not the top performer on the continent.
A relatively sophisticated ICT sector has emerged in South Africa over two decades of telecommunications reform since
the mid-1990s, with there currently being two national fixed-line operators (Telkom and Neotel), five mobile operators
(Vodacom, MTN, Cell C, Telkom Mobile and mobile virtual network operator [MVNO] Virgin Mobile), and hundreds of
internet service providers (ISPs) and value-added network service providers (VANS). In its first ICT Satellite Account, as
drawn from the National Accounts, Statistics South Africa reports that in 2005, the ICT total output was valued at more
than ZAR153billion, and calculates the value of the ICT sector’s contribution to GDP (i.e. the ICT gross value-add to
GDP) at 4.3% (Stats SA, 2013). Because the ICT sector has grown significantly since the year 2005 on which the Stats
SA ICT Satellite Account data are currently based (while other major sectors have slowed), it is believed that the figure
for the ICT sector’s contribution to South African GDP is now closer to 6%. The Department of Communications (DoC)
reported in 2010 that the total South African telecommunications market had grown from ZAR131billion in 2007 to
ZAR179billion in 2010 (DoC, 2010, p. 18).
Affordable internet
access has still not
been achieved
Growth in South Africa’s ICT sector has not, however, been accompanied by a realisation of the primary policy objective
of affordable access, for all, to the full range of communications services that characterise modern economies. South
Africa has lost its status as continental leader in internet and voice connectivity, and its place on global ICT indices
has been usurped by former comparator countries such as Malaysia, Turkey and South Korea. Where South Korea and
South Africa were comparatively placed on International Telecommunication Union (ITU) ratings 20 years ago, South
Korea is now a top global performer (Gillwald, 2011), while South Africa’s ranking on the ITU ICT Development Index
South Africa ranks
poorly in global ICT
indices
1
Evidence for ICT Policy Action
has slipped from 72nd in 2002 to 90 in 2010 (ITU, 2002, 2012). South Africa has also fallen steadily down other global
indices (WEF, 2013). In Africa, South Africa ranks fifth after Mauritius (69), Seychelles (71), Tunisia (84), Morocco (90), and
Egypt (91) in the ITU Index (ITU, 2012). In terms of the World Economic Forum (WEF) 2013 Network Readiness Index
(NRI), South Africa ranks 70th in the world (see Table 1).
Table 1: Comparative table - World Economic Forum data
NRI ranking
Environment
Readiness
Argentina
99
126
Botswana
96
Brazil
Overall
Government
Business
Individual
97
74
117
90
60
56
107
99
91
96
98
60
107
74
44
48
34
58
124
119
131
119
101
98
130
China
58
71
66
58
38
35
83
Chile
34
30
49
40
29
44
53
128
104
140
130
83
140
143
Ghana
95
64
101
102
89
103
102
India
68
85
68
81
40
45
121
Kenya
93
98
110
84
44
53
115
Korea
11
32
23
4
3
11
7
Malaysia
30
18
57
29
7
26
46
Mozambique
133
120
143
128
106
125
141
Namibia
111
58
115
101
116
76
99
Nigeria
113
94
123
108
113
68
111
Poland
49
55
37
50
107
74
33
Russia
54
102
32
56
74
95
45
Rwanda
88
29
116
107
59
67
139
South Africa
70
33
95
72
102
33
81
127
108
135
120
99
102
127
Turkey
45
46
36
62
60
48
68
Uganda
110
88
104
117
84
106
131
Cameroon
Ethiopia
Tanzania
2
Use
Source: WEF (2013)
Understanding what is happening in ICT in South Africa
The WEF NRI measures countries’ propensity for exploitation of the opportunities offered by ICT, and the impact of
ICT on the competitiveness of nations. South Africa’s 2013 NRI ranking of 70th globally was up from 72 in 2012, but
South Africa continues to trail other comparator countries with similarly-sized economies and similar levels of sector
development, such as Turkey, Poland and Chile. South Africa also lags behind its fellow BRICS countries, with India
(68th), Brazil (60th), China (58th), and Russia (54th) outstripping it. Although 70th position is higher than the WEF NRI
rankings given to the other 11 African countries studied by RIA in 2012, it is still low in terms of global rankings and in
terms of some other African states not covered by the latest RIA country reports, for example the African island state
of Mauritius, which ranks 55th in the WEF NRI (WEF, 2013).
Despite South Africa’s sub-optimal ICT policy and regulatory environment, its ICT sector continues to grow year-onyear. In the aforementioned landmark ICT Satellite Account generated off the National Accounts by Stats SA in 2013,
Stats SA established that ICT capital formation as a portion of total capital formation in the country was 7% in 2005
(Stats SA, 2013) (see Table 2).
Table 2: ICT Satellite Account base year 2005
ZAR(m)
ICT share of gross domestic product
%
153 691
4.3
18 530
7
Percentage of ICT exports against total exports
2 179
3
Percentage of ICT imports against total imports
47 575
10.9
Household final consumption expenditure of ICT
42 918
4.3
ICT capital formation as a proportion of total
Source: Stats SA (2013)
Market overview
Characterised by duopoly and effective duopoly, the South African fixed and mobile markets have in recent years
featured price-matching, poor service quality, and anti-competitive behaviour, making competitive pressure from
new entrants in both the fixed and mobile markets very difficult to exert. Although a horizontal licensing regime was
introduced through the Electronic Communications Act (ECA) of 2005 in order to deal with convergence within the
ICT sector, the market remains structured around a number of vertically integrated operators. In terms of the ECA, old
public switched telephone network (PSTN), mobile land communications systems (MLCS), VANS and broadcasting
signal distribution licences, and public, commercial, and community broadcast licences, were converted into network,
service, and content licences. However, the incumbents have tended to simply acquire multiple licences, thus
preserving the vertically integrated entities they operated before the ECA of 2005.
The market
continues to
be structured
around vertically
integrated entities
There is a duopoly in the fixed-line market with incumbent Telkom claiming the lion’s share of the market over Neotel.
Telkom maintains dominance over the backbone and competes downstream with its competitors (formerly licensed
as VANS and ISPs) in the electronic communications service (ECS) and electronic communications network service
(ECNS) licence categories. The services market includes both managed data network providers and first-tier internet
access providers such as Internet Solutions, MTN Business Solutions, MWEB, and Telkom. This market also includes
hundreds of smaller ISPs who hold class licences only.
Incumbent
operator Telkom’s
dominance remains
unchallenged
3
Evidence for ICT Policy Action
Neotel, the second PSTN operator, only became operational in 2006, following licensing delays. The company,
which primarily offers fixed-wireless solutions, has targeted corporates, and has won over some large clients and
small and medium enterprises (SMEs) from Telkom. But Neotel has made few inroads into the residential market.
The fibre optic networks of the parastatal railway network run by Transnet, and the parastatal power network run
by Eskom – which were originally set aside for the second network operator (the eventual Neotel) – were reclaimed
by the state (as the Neotel licence was being finalised) and were subsequently transferred into a state-owned
broadband company, Broadband Infraco.
Initially, there was some concern that Infraco would squeeze out private sector investment, but having fallen
victim to the lack of coordination between its shareholder the Department of Public Enterprises and the DoC –
which was responsible for locating Infraco’s licence in the liberalised competitive market into which it was being
inserted – Infraco’s entry was delayed and it could not keep the interest of its target clients, the network operators.
These delays in the entry of an Infraco low-cost-access carrier network resulted in MTN, Neotel, and Vodacom cobuilding an alternative national infrastructure network, undermining the viability of the Infraco business model.
Neotel also faces competition from unlicensed Dark Fibre Africa, which, starting in 2007, installed a carrier-neutral,
open access ducting infrastructure in South Africa. Through this underground infrastructure, any operator with a
communications licence can run a fibre optic network.
Some provincial governments, such as those in Gauteng and the Western Cape, have instituted broadband
plans and proceeded with metropolitan networks and government e-services services, as have the major metros
Johannesburg, Cape Town, and eThekwini municipality (greater Durban). The result has been significant duplication
in metropolitan areas (where multiple cables, including that of Dark Fibre Africa and Fibreco, have been laid); some
duplication on the main intercity routes; and very little extension of the network off of the main routes to smaller
towns and villages.
The mobile market, though it has four operators and one MVNO, is dominated by the two incumbents, MTN
and Vodacom, who jointly command a market share of more than 80%. With the belated reduction in mobile
termination rates, the market has become more competitive as the smaller operators have slashed prices in an
attempt to gain market share. Incumbents have responded by offering various airtime promotions, including
successful dynamic pricing discounts (where prices are determined on the basis of real-time traffic assessment
within a particular cell), bundled services, and flat rates on regional roaming. They also provide airtime promotions
and sales of smart phones. However, market dynamics in the mobile market did not change significantly with
Telkom Mobile’s entrance into the market in 2010.
Mobile termination
rate reductions
have spurred
market competition
4
Earlier entrant Cell C, meanwhile, got a foothold in the market by targeting lower-income subscribers, though
more recently it has adopted a more aggressive pricing strategy and tried to erode the share of the incumbents’
contract market. In 2006, Cell C entered into a partnership with Virgin (as an MVNO). Virgin has focussed its efforts
on the high-end youth market, hoping to capitalise on its international brand positioning. But after operating in
South Africa for more than six years, Virgin has managed to sign up only 400 000 customers despite its strong brand
position internationally. The most recent entrant, Telkom Mobile, has signed up 1.4million customers in less than
two years of operation.1
1 Virgin announced in mid-2012 that it would reduce its franchise-owned stores in South Africa from 38 to eight as part of its new
strategy to align its business processes with that of its new major shareholder, FRiENDi Group, and in the hope that taking the
management of the remaining stores in-house would help it attract new clients (Mochika, 2012).
Understanding what is happening in ICT in South Africa
2%
17%
44%
37%
Vodacom
MTN
Cell C
Dominant
operators MTN and
Vodacom remain
entrenched in the
market
Telkom Mobile
Figure 1: Estimated market share based on annual reports and Cell C statement
Source: Vodacom Integrated report for the year ended 31 March 2013. MTN, Intergrated Business Report for the year ended 31 December 2012. Cell
C, IT Web July 2012. Telkom Mobile, Telkom Annual report for the year ended March 2013.
In 2009, Telkom sold its share of Vodacom to Vodacom’s parent Vodafone. Prior to the Vodafone transaction, the South
African Government owned 37.7% of Telkom, which in turn owned 50% of Vodacom. As a result of the transaction,
the government now has a 14% direct shareholding in Vodacom (Vodacom, 2009). Telkom’s rationale for selling off
its stake in this cash cow (Vodacom) was initially unclear, but in October 2010, Telkom launched its 100%-owned
mobile subsidiary, Telkom Mobile. Despite the advantages of access to the physical and retail network of its parent the
incumbent fixed-line operator Telkom, and some highly competitive data offerings, Telkom Mobile has not priced its
voice calls competitively enough for long enough, and has thus only managed to secure a fraction of this market still
dominated by Vodacom and MTN.
Policy and legal framework
While South Africa led telecommunications reform initiatives on the continent in the mid-1990s – with the introduction
of mobile competition to the (subsequently partially privatised) fixed-line incumbent Telkom, followed by further
liberalisation of the fixed and mobile markets at the turn of century – these early reform efforts were undermined by
lack of effective policy implementation and follow-up. The result, today, is an uncompetitive market structure, weak
institutional arrangements and compromised regulatory effectiveness, which have resulted, as indicated above, in
South Africa plummeting down international ICT indices.
Little progress has been made to reverse this trend under the current administration, led by President Jacob Zuma
since his election in 2009. The ICT sector has suffered from leadership discontinuity at Executive government level,
with no fewer than five different Ministers of Communications serving since 2009 and also flux in the office of the DoC
Director-General. Whether the instability in the Ministry and DoC is a cause, or result, of the lack of prioritisation of ICTs
on the national agenda, is debatable. What is certain is that unlike in countries as diverse as the USA and Australia,
as Singapore and Mauritius, the transformative potential of ICTs (and broadband in particular) to drive productivity,
stimulate growth and employment, and enable democracy appears largely to have been ignored in South Africa.
Ineffective policy
implementation
hinders the reform
process
5
Evidence for ICT Policy Action
From the two-line reference to telecommunications in the Government’s New Growth Path, to the limited focus
on broadband in the Presidential Infrastructure Coordinating Commission (PICC) established in 2011 to coordinate
infrastructure projects across all spheres of government and state-owned enterprises, there is little to suggest that ICTs
are considered a priority for the country.
In December 2012, the PICC finally launched the Strategic Integrated Project (SIP) 15: Expanding Access to
Communication Technology. SIP 15 aims “to ensure universal service and access to reliable, affordable and secure
broadband services by all South Africans, prioritising rural and under-serviced areas and stimulating economic growth”
(PICC, 2012). SIP 15 includes prioritisation of national migration from analogue to digital transmission of terrestrial
television broadcasting by June 2015, and expansion of access to communication technology through broadband
infrastructure rollout. To this end, a national backbone infrastructure will be established which will inter alia include
“establishing core Points of Presence (POPs) in district municipalities, extend[ing] new Infraco fibre networks across
provinces linking districts, establish POPs and fibre connectivity at local level, and further penetrate the network into
deep rural areas” (PICC, 2012, p. 23). But while the state, in SIP 15, does emphasise the need for “coordination and
integration of communications infrastructure activities within state-owned enterprises, private entities, provinces and
local government” as being critical, there is no indication as to how this will be achieved in the wake of the previous
lack of development on such initiatives. State-owned companies are identified as the agents of SIP 15, and although
mention is made of public-private collaboration, no clear funding or delivery mechanism is indicated. And initiatives
to connect schools, which SIP 15 specifically targets, are not highlighted beyond reference to a broad informational
and human development programme.
There is little to
suggest that ICT
policy documents
get priority
treatment
Even in the 2011 National Development Plan: Vision for 2030, which provides some vision for the sector, ICT is only
conceived within the context of economic infrastructure. The Plan fails to thread ICTs throughout the document in
acknowledgment of the cross-cutting nature of ICTs. Practically, and in terms of current implementation, there is thus
no clarity on, or coherence in, South Africa’s ICT policy or strategy, in spite of government’s pledge, as far back as 2009,
to undertake a policy process referred to as ICT Vision 2020.
ICT Vision 2020
With the arrival of a new administration following the 2009 elections, the appointment of new leadership in the
Ministry and DoC was heralded by the ICT industry association, the South African Communications Forum (SACF),
as “a new era of co-operation and dialogue between government, industry and civil society, to set clear targets and
goals for bridging the widening digital divide in South Africa and creating sustainable jobs through the development
of the ICT industry” (SACF, 2009). In his Budget Vote Speech of June 2009, then-Minister Siphiwe Nyanda launched the
ICT Vision 2020 process, announcing his intention to develop an Integrated National ICT Policy Framework. Under the
direction of the Minister and the DoC, the ICT Vision 2020 was to:
provide a roadmap for the ICT industry’s long-term development and growth and for South Africa to become
a leading country in the information era,
entail the development by industry, in partnership with government, of a unified vision and strategy towards
clearly defined goals and an aspirational vision of the industry to be achieved by 2020, and
6
include research on: various components of the sector; local and international factors to affect it in future; and
best options to be followed for future development.
Understanding what is happening in ICT in South Africa
In providing support for this initiative, the SACF cited several reasons for the decline of the ICT sector in South Africa,
including: “low levels of trust and co-operation between government and the private sector ICT industry, which has
often been marked by courtroom skirmishes. Now, government has committed to joining hands with industry and
civil society to overcome these challenges” (SACF, 2009).
However, progress on the initiative was stalled following the departure of the DoC Director-General, Mamodupi
Mohlala, and subsequently Minister Nyanda himself, following a Cabinet reshuffle less than two years after Nyanda’s
appointment. The new Minister, Roy Padayachie, picked up the reigns on this policy project by bringing together the
largest communications companies into an industry forum in 2011, with the aim of finding ways, through ICT Vision
2020, to achieve 100% broadband penetration and 1million jobs. In 2012, as the Minister began to formulate a plan
to move the sector forward, and less than a year after his appointment, Padayachie was, however, transferred to the
Ministry of Public Service and Administration, and a new Minister, Dina Pule, was installed. The new Minister used
the existing industry forum (the SACF) as a basis for the national policy review, with the intention of developing an
integrated e-strategy for the country (as proposed by the 2011 National Development Plan) by the end of 2013.
To this end, the Department of Communications held an ICT Policy Colloquium in April 2012, which brought together
an unprecedented number of stakeholders (over 600) eager to finally be part of a new policy initiative. The colloquium
was presented with a background paper largely sketching the status of the sector to date, with no policy proposals
for discussion by subcommittees. And despite the colloquium coming five years after the passing of the ECA of 2005
(the objective of which was to enable a converged environment in South Africa), the colloquium subcommittees were
broken down according to industrial age communications silos (broadcasting, telecommunications, and postal), with
only a few cross-cutting committees on content and investment matters. The subcommittees were primarily chaired
by industry representatives, with only one committee having a representative from civil society. The opening plenary
panel of the colloquium included CEOs of the commercial national networks only. Neither the regulator, nor the public
broadcaster, nor a union or civil society representative contributed to the scene-setting of the opening session. There
has been no formal output from this colloquium, which took place over a year ago. Late in 2012, the Minister appointed
an ICT Policy Review Panel, but this body, too, has been siloed into committees on the basis of traditional broadcasting,
telecommunications, and postal focus areas. These silos suggest absence of the converged framework, integrated
value chain and ecosystem approach which are informing current ICT policy thinking across the globe.
The siloed
approach in the ICT
policy colloquium
is not reflective of
a converged policy
framework
The lack of policy direction and inconsistency in Executive decision-making have impacted negatively on state-owned
enterprises. And the ramifications of the parlous state of majority-state-owned Telkom, as the primary backbone of
the country, are significant for the entire sector. Poor decisions by Telkom Boards and Cabinet about the sale and
acquisition of assets, not least of which was the sale of its cash cow Vodacom to Vodafone – only to invest in the
same highly entrenched, effectively duopoly market in which it had owned half of the dominant operator – have
steadily eroded its surpluses and share value. Also damaging Telkom have been its abortive foray into South Africa’s
subscription TV market and into the telecommunications market in Nigeria, the two of which have cost the company
hundreds of millions of Rands (ZAR), and resulted in the company sustaining significant losses over the last few years.
State enterprises
have been
negatively affected
by inconsistencies
in decision-making
and the lack of
policy direction
Since 2007, Telkom’s share price has lost 70% of its value, predominantly driven by an average 9% annual drop
in fixed-line voice traffic, while per-unit-pricing remained more or less stable. By early 2013, the company’s
market capitalisation was only ZAR8.8billion against a net asset value of ZAR30billion. Attempts by the Board and
management to salvage its dismal performance, most recently through the attempted sale of 20% of the company
to Korea Telecom, have, however, been thwarted by government, resulting in the resignation in late 2012 of Telkom’s
fifth CEO in seven years.
7
Evidence for ICT Policy Action
National Development Plan: Vision for 2030
The National
Development Plan
sets a strategic
redirection for the
ICT sector
The National Planning Commission’s (NPC’s) National Development Plan, which followed the release of the NPC’s
Diagnostic Report in 2011, was presented and accepted by Parliament in 2012. In the Plan’s chapter on economic
infrastructure, the vision for the ICT sector is stated as follows: “[...] by 2030 ICT is expected to underpin the development
of an inclusive dynamic information society and knowledge economy” (NPC, 2011). In the short term, from 2012 to
2015, realisation of this vision will entail development of a “comprehensive and integrated e-strategy that reflects the
cross-cutting nature of ICTs” (NPC, 2011). For these goals to be achieved, the Plan refers to new ways to allocate the
spectrum that will be available following the migration from analogue to digital transmission for terrestrial television
broadcasting and sets out a strategy for universal access, including targets, monitoring, and evaluation indicators.
Also, the Plan identifies the need for demand-side stimulation strategies such as e-literacy, skills development and
institutional development, and other strategies to promote ICT diffusion that provide inter-governmental as well as
private and public coordination – things which were missing from the DoC broadband policy (RSA, 2009) gazetted
three years earlier but not implemented. Another key focal point, according to the Plan, is building affordable access
to a number of services through effective regulation of competitive markets (NPC, 2011).
For the medium term, the period from 2015 to 2020, the Plan endorses the target, proposed by the DoC, of achieving
100% broadband penetration by 2020, including expansion of the definition of broadband from 256 kbps to at least 2
mbps (NPC, 2011). For the long term, in the period from 2020 to 2030, the state is envisioned as making extensive use
of ICTs in delivery of services to citizens, including entertainment, information, and education. And the Plan suggests
greater collaboration between the state, industry, and academia as critical to the success of any e-strategy (NPC, 2011).
ICT Policy Review Panel and Draft Broadband Policy
Then-Minister Pule’s April 2012 national ICT colloquium involved a review of regulation and policies regarding
telecommunications, broadcasting, postal services, and e-commerce services – a review intended to lead to the
adoption of a White Paper outlining an integrated ICT policy framework. The DoC was due to release a Green Paper
in 2013, but this ideal was pushed out, and instead, the Minister appointed the aforementioned ICT Policy Review
Panel. One of the outputs of the Review Panel has been a draft National Broadband Policy (DoC, 2013), published for
consultation in April 2013. This draft Policy states the following objectives:
ensuring universal service and access to affordable and secure broadband services by all citizens, with a special
focus on rural areas and under-serviced areas;
re-articulating government’s commitment to inclusion of all citizens in the information society;
ensuring an integrated approach towards the deployment of broadband services;
ensuring the continued expansion and availability of broadband capacity to meet the economic and social
goals of the country;
reducing the cost of broadband services; and
clarifying the roles of government, state-owned companies, and private companies in the development of
broadband infrastructure.
8
(Minister Pule was, as mentioned above, replaced as Minister in July 2013 by Yunus Carrim.)
Understanding what is happening in ICT in South Africa
While some of the blame for the disjuncture between policy and implementation can be attributed to the ongoing crises and flux within the Ministry and Department, some of the blame for the stalling of critical regulatory
interventions to support market entry and competitor viability – such as cost-based interconnection, local loop
unbundling (LLU), regulation of essential facilities, and spectrum allocations – needs to be attributed to the onerous
demands the ECA of 2005 places on the regulator ICASA. With ICASA not having even fulfilled its mandate under the
previous Telecommunications Amendment Act (No. 64) of 2001, the ECA required the regulator to re-license the entire
sector on horizontal lines to reflect convergence in the sector; to unbundle the local loop; to declare essential facilities;
to conduct spectrum valuation; and to engage in interconnection pricing – all on the basis of market definitions and
determinations of dominance in the market. Devoid of any supporting policy document, the poorly drafted ECA,
together with ICASA’s lack of capacity and expertise to implement, has produced a series of bottlenecks in the path
towards a fair and competitive ICT environment. The sector is characterised by relatively constrained growth of new
services, relatively constrained extension of infrastructure, accompanied by high wholesale and retail prices. Together
these factors have inhibited optimal use of services, and particularly new data services.
The sub-sections below assess some of the major policy outcomes illustrated by the existing state of South Africa’s ICT
sector. Part Two of this report then explores the degree to which the core policy objective – affordable access to the
full range of communications services - is being realised in people’s everyday lives. As is explored in the demand-side
analysis in Part Two of this report, affordability and access are critical factors for ensuring a faster diffusion of internet
use in South Africa. It has been estimated that the cost of meeting South Africa’s broadband needs is US$80billion,
but modelling for the ICT Vision 2020 process by the Human Sciences Research Council (HSRC) indicates that it could
be done for half of that. The HSRC modelling contends that only US$40billion is required to expand current networks
as part of the path to achieving 100% broadband, via a combination of mobile and fixed-line access (Gillwald et al.,
2012). However, to attract this kind of capital or even a significant private sector input, the South African Government
needs to create an environment conducive to investment, through credible commitments and a certain regulatory
environment. And capital is not all that is required. The creation of an integrated information structure will require a
clear delivery strategy, including demand-stimulation strategies. The significance of this for improving broadband
access for the economy and polity is evident in the findings of the RIA South Africa Household and Individual ICT
Survey, and in the RIA South Africa Informal Sector ICT Survey (the findings of which are presented in the final section
of Part Two of this report).
Critical regulatory
interventions have
been stalled by the
onerous demands
of the 2005 EC Act
ICASA’s lack of
capacity and
expertise hinders
the regulatory
process
9
Evidence for ICT Policy Action
Policy outcome 1: poor institutional arrangements
Weak leadership
and institutional
incapacity limits
the development of
a comprehensive
ICT strategy
The leadership challenges and lack of institutional capacity in the Ministry and DoC have undermined state intentions
to develop a vision and appropriate policy for the ICT sector and to provide strategic direction on key issues. The
unnecessarily protracted broadcast digital migration process and the failure to develop an integrated e-strategy over
the past decade are two of the more striking examples of this lack of vision and capacity. Weak political appointments,
poor cadre deployment, and lack of leadership have consistently plagued the DoC, ICASA, and the Universal Service
and Access Agency of South Africa (USAASA).
ICASA
Highly Ineffective
regulation is
a result of the
politicisation and
juniorisation of
ICASA
The authority and autonomy of the regulator ICASA to implement national policy have been undermined through
structural conflicts of interest in the institutional arrangements; political constraints; lack of competencies; and the
politicisation and “juniorisation” of the organisation. The outcome has been highly ineffectual regulation of the sector
with consequent absence of competitive outcomes or protection of consumer welfare (see the TRE assessment
findings below). While part of the problem relates to the lack of ICASA autonomy from the Department – and, indeed,
lack of autonomy from certain elements of industry – also contributing to the problem are ICASA’s low levels of
experience and competence, absence of leadership, and appointments on the basis of political or personal allegiance
rather than technical competence (making individuals accountable to their political principals, rather than to the
principles of the law and Parliament). Without sufficient accountability accompanying the autonomy that does legally
pertain to ICASA, decision-making processes and systems are compromised. The structural conflicts of interest that
pertain to the continued ownership – indeed concentration of ownership – by the state in the sector, and the Ministry
being responsible both for the safeguarding of still-significant assets in the sector and for policy that determines
the well-being of state entities’ competitors, creates an environment of regulatory uncertainty and undermines the
credibility of the country as a secure investment destination.
Some of the problems in the institutional arrangements could have been addressed to some degree by the proposals
for the sector contained in the 2007 Report from Parliament’s Review of Chapter 9 and Associated Institutions, led by
Kadar Asmal, but these proposals were never publicly aired, adopted or implemented (Parliament, 2007). The existing
negative perceptions of the telecommunications regulatory environment are discussed in more detail below in
relation to the findings of the RIA 2012 TRE assessment exercise.
USAASA
The USAASA has
failed to fulfil its
mandate
10
USAASA has perpetually been kept alive, in each new round of legislation over the last two decades, despite its failure to
(ever) deliver on its mandate. USAASA was again plunged into disarray in the period under review, with its management
and Board removed from office in 2012 based on accusations of financial maladministration. Some of the Agency’s
problems can, to an extent, be explained by the historical evolution of the sector’s institutional arrangements over the
past 20 years. The Agency was originally intended, in the Telecommunications Green Paper and White Paper processes
of the mid-1990s, to be part of the independent regulator or accountable to it, but the Agency’s accountability was
shifted to the DoC by the 1996 Telecommunications Act which established the Agency with its original name, the
Universal Service Agency (USA). Based on a five-year sunset clause attached to the USA’s existence by the 1996 Act,
a review of the Agency was conducted for the DoC in 2000. That review indicated that the Agency had not achieved
much of its intended mandate and was already showing signs of institutional and leadership failure (that would later
Understanding what is happening in ICT in South Africa
appear to be intractable). Given that the project of universal service had made little progress and there was much yet
to be done, it was proposed that the lifespan of the agency be extended (Stavrou and Benjamin, 2000). The review
report acknowledged that political pressure put on the Agency (e.g. for the questionable use of funds for projects
of the DoC) had drawn the Agency into the delivery of services (e.g. community access centres and Public Internet
Terminals) rather than focussing on administering funds (in the Universal Service Fund [USF] generated by levies on
operators) for use by operators and service providers. In the 2003 Telecommunications Amendment Act (the legislation
that extended the Agency’s existence), an Agency Board was introduced, to buffer the organisation from the DoC. But
because the Minister was given responsibility for appointing the Board, DoC pressure continued, if less directly.
By the time the sector’s law was being reviewed again in 2005, there had been little improvement in the leadership
and management crises at the Agency, but the Agency was maintained by the ECA of 2005. The ECA changed the
Agency’s name from the USA to USAASA, but did not provide an opportunity for the fresh start the Agency so sorely
needed. The Agency’s Fund, now to be called the Universal Service and Access Fund (USAF), was renewed under the
ECA to fund projects and programmes that “strive to achieve universal service and access to ICTs by all South African
citizens” (RSA, 2005).
The ECA requires all licence-holders to contribute to the USAF in accordance with the instructions of the Minister.
ICASA, however, is the body responsible for prescribing the basis and manner of contributions, which may not exceed
1% of a licensee’s annual turnover. (The Minister is responsible for determining the exact percentage of turnover.)
Neither ICASA nor the Minister has to date made the necessary determinations, leaving the existing regulations, which
require all licensees to contribute 0.2% of annual turnover, in force (despite the repeal of the 1996 Telecommunications
Act under which the regulations were prescribed). The ECA extends contribution to the Fund to broadcasting licensees,
who may now also access the Fund. However, those broadcasters already contributing to the Media Development
and Diversity Agency (MDDA) can have their MDDA contributions offset against any USAF levies owing. Despite the
administrative challenges posed by the requirements of the 1996 Telecommunications Act in order for Fund levies to
be determined and to be disbursed, the ECA continues the 1996 Act’s requirement that all levies paid into the Fund
be transferred to the National Revenue Fund. The funds can then only be accessed by USAASA through Parliamentary
appropriation. The ECA allows the Minister to issue policy directions to the USAASA Board in carrying out its oversight
functions. Meanwhile, the Act requires USAASA to make recommendations to the Minister as to what constitutes
universal service and access, but it is the Minister who is required to make determinations in this regard and publish
them in the Government Gazette.
The requirements of the Act in relation to USAASA require it to coordinate efforts towards universal service and access.
To do so, USAASA may undertake investigations, conduct research, and survey and evaluate the extent to which
universal service and access have been achieved. The Agency is also required, when requested to do so, to advise
ICASA on universal service.
In 2011, USAASA reported to Parliament that it had failed to meet targets in many of its projects, including “set-top box
distribution; broadband infrastructure projects; the development of public access centres; the creation of an access
and service strategy”, (Mahlong, 2011) and that the Agency had not yet developed ICT access and impact indicators. In
addition, a clearly defined universal access and service strategy was still lacking, as well as guidelines for the application
of the Fund’s manual and standard operating procedures .
A clearly defined
universal access
strategy is still
absent
11
Evidence for ICT Policy Action
Policy outcome 2: ineffectual regulatory environment
The desired objective of telecom policy reform and regulation is improved sector performance. Performance can be
assessed in terms of indicators for connectivity, price, quality of service (QoS), and choice, each of which is dealt with
in the policy outcome sub-sections that follow this one. This sub-section focuses on regulatory frameworks, within
which all the other elements play themselves out. It uses the Telecom Regulatory Environment (TRE) assessment
method, which assesses the effectiveness of sector regulation through stakeholder perceptions of seven regulatory
dimensions: market entry, QoS, anti-competitive practices, universal service obligations (USO), access to scarce
resources, interconnection, and tariff regulation.2 A TRE assessment probes the perceptions of stakeholders of the
entire policy and regulatory environment, not the regulator per se. The analysis of the TRE data is then performed by
triangulating the TRE findings with data on the performance of the sector (the supply-side) and with the results of the
RIA Household and Individual ICT Access and Use Survey (the demand-side).
(In cases where sector performance indicators show performance that can be considered satisfactory but TRE
scores are low for that market segment, it may be possible that the problem is the communication of the regulatory
actions, or that other factors at national level are tainting the stakeholders’ perceptions on the issue. If the latter
conclusion is reached, an appropriate recommendation could be improvement of the way the regulatory authority
communicates its actions.)
Rwanda
Namibia
There are generally
negative views
about the
effectiveness of
the regulatory
environments in
Africa
Tanzania
Kenya
Ghana
Nigeria
Uganda
Botswana
Cameroon
Mozambique
South Africa
Ethiopia
-2
-1
0
1
2
Figure 2: Overall RIA TRE rankings, 2012
Source: RIA TRE assessment data 2011-12
Even within the context of the generally negative views of the effectiveness of national regulatory environments
on the continent, the perceptions of South African stakeholders of their national telecommunications regulatory
environment is notably poor. In comparison to the 11 other countries surveyed in the RIA 2012 TRE assessments,
12
2 The TRE assessment is a diagnostic instrument for assessing the performance of policy and laws affecting the telecommunications sector and
the various government entities responsible for their implementation. This methodology was developed by LIRNEasia (see LIRNEasia, 2008).
Understanding what is happening in ICT in South Africa
South Africa scores only slightly better than one of the other 11 countries, Ethiopia (which has undergone the least
market and regulatory reform on the continent).
All 12 of the countries assessed by RIA received negative overall scores, with Rwanda getting the least negative
score, i.e. the Rwandan regulatory environment is perceived less negatively by its stakeholders than the regulatory
environments of the other 11 countries assessed. Rwanda’s assessment seems likely to reflect the “halo effect” produced
by its government’s commitment to the country becoming an ICT hub in Africa - with ICT development driven from
the Rwandan Presidency - rather than the country’s provision of an environment particularly conducive to investment
and development of the sector. The institutional arrangements in Rwanda do not enable autonomous regulatory
decision-making and this is reflected in sub-optimal performance indicators in relation to access (even access to basic
voice services, but particularly internet) despite several state-led initiatives to improve the access situation. Prices in
Rwanda are, however, showing the effectiveness of competition in the market and of enforced MTR reductions.
Meanwhile, although still negative, the less-negative (than Ethiopia and South Africa) rankings of Ghana, Kenya,
and even Tanzania (despite its underdeveloped economy) reflect somewhat positive performance in these markets.
Ghana is a highly competitive market with five mobile competitors. The Kenyan ICT market, although characterised by
extreme dominance by the incumbent mobile provider Safaricom, has seen critical regulatory intervention levelling
the playing field and generating positive outcomes. For its part, Tanzania continues to move systematically through
its regulatory reform programme, with the Tanzanian regulator working on reduction of MTRs and seeking to reach
decisions that will make spectrum available.
The factors contributing to South Africa’s poor TRE position (compared to 10 of the other 11 RIA countries assessed)
are now discussed below in more detail.
Market entry
QoS
Anti-competitive practices
USO
Access to scarce resources
Interconnection
Tariff regulation
-2
-1
2006
0
2009
1
2011
Figure 3: Shifts in perception of the efficiency of the regulatory environment in South Africa
Source: RIA TRE assessment data 2011-12
2
13
Evidence for ICT Policy Action
The management
liberalisation
approach hampers
the competitiveness
of new market
entrants
The regulator has
failed to address
the dominance
of incumbent
operators and
create a level
playing field
The negative South African stakeholder perception regarding the first-listed TRE criterion, market entry (see Figure 3),
while less negative than in previous RIA TRE assessments, relates to the policy of managed liberalisation, which has
been pursued in South Africa since the 1996 Telecommunications Act. The managed liberalisation approach has made
it impossible for new market entrants to compete effectively with an entrenched incumbent operator (Telkom) within
the fixed-line market and with two dominant operators (Vodacom and MTN) in the mobile market.
With pressure from the Ministry, which identified unbundling of the local loop as a key intervention that might improve
South Africa’s sluggish competitive environment, LLU was on the top of the agenda of the regulator ICASA during 2010.
Despite ICASA having identified four possible options for the unbundling, there are as of yet no regulations in place
but draft regulations for public comment were released on the 7 August 2013 (ICASA, 2013). The first option suggested
by ICASA is “bitstream”, or wholesale access. Under this option, Telkom would not be required to unbundle its physical
copper cable infrastructure; instead, it would provide access to the infrastructure to other operators on a wholesale
basis. The second option proposed is shared access to Telkom’s local loop. Under the second option, operators seeking
local loop access would provide different services on the same line (i.e. both data and voice services). The third option
suggested is full local-loop, or full access. This would entail the assigning of the local loop to rival operators who would
be responsible for the running of the entire local loop. The final option would entail Telkom’s competitors getting
access to its “primary connection point” at street level (Gedye, 2011; Mail and Guardian, 2011).
The increased focus on LLU was reinforced by a complaint lodged by Neotel with ICASA’s Complaints and Compliance
Committee (CCC) in 2011, over Telkom’s refusal to lease its last mile (i.e. local loop) and telephone exchanges to
Neotel. The CCC ruled in Neotel’s favour, stating that Neotel’s request was valid in terms of the new facilities leasing
regulations issued by ICASA. Telkom, on the other hand, argued that the imminent local loop regulations (non-existent
at the time of the CCC ruling) should govern Telkom’s copper infrastructure, and not the facilities leasing regulations
(MyBroadband, 2012b).
Although the market has been liberalised by the ECA – and by the Altech ruling3 on the migration of licensees to the
converged horizontal licensing regime envisage by the Act – the lack of effective regulation of access to wholesale
voice and data has meant that new entrants are unable to compete effectively in these market segments and by
and large have been unable to push down the cost of communications. Pricing provides the best indicator of the
competitiveness of a market, and is itself an indicator of the effectiveness of the market structure and regulation of the
sector. Price indicators are dealt with in detail later in this report.
14
3 Delays by ICASA in issuing ECA-compliant licences, as a result of Ministerial intervention in who was eligible for licences and
which of them could provide their own facilities, resulted in Altech bringing a case against the Minister, ICASA, and the group
of preferred licensees among the existing VANS licensees. Reneging on its earlier policy interpretation of a Ministerial directive
that licensees would be permitted to self-provide, ICASA indicated that only those selected VANS who received the new licences
from the regulator following the 2007 Ministerial policy direction, but with no clear criteria for their award, would be entitled to
self-provide. Altech, a VANS provider, challenged the decision to limit the number of converted ECNS licences. It also sought relief
from the contested prohibition on VANS being able to provide their own network facilities instead of having to obtain these from
incumbent licensed telecommunications network operators such as Telkom or Neotel. The court, in granting the relief sought by
Altech, declared that the prohibition on self-provisioning was in direct conflict with the enabling legislation and ordered that all
VANS operators licensed before the start of the conversion process be allowed to self-provide, in accordance with the initial policy
direction and the initial interpretation offered by ICASA in 2005 (See Gillwald, 2007 for fuller account.)
Understanding what is happening in ICT in South Africa
The settlement between the Competition Tribunal and Telkom in 2013 after the decade-long anti-competitive practice
dispute lodged by VANS providers against Telkom first with ICASA and then with the Competition Commission
provides evidence of the chilling effect that the dominance of a vertically integrated fixed-line operator can have
on creation of fair competitive markets, even where markets are liberalised. Telkom’s dominance in the market, and
the regulator ICASA’s inability to create a fair competitive regime for new entrants (an inability confirmed by the
Competition Commission ruling), show that ICASA needs to be vigilant within the mobile market to ensure that
vertically integrated mobile operators currently dominant in that market (which has thus far not seen any wholesale
access regulation) do not limit fair competition in the mobile broadband market (which in South Africa currently
provides the dominant means of internet access) in the same way that Telkom succeeded for many years in limiting
competition in the fixed-line market segment.
15
Evidence for ICT Policy Action
Policy outcome 3: limited infrastructure extension and
bottlenecks
Undersea cables
International
bandwidth
capacity had
increased
significantly in
terms of quality
and pricing
Until 2009, South Africa had amongst the highest international bandwidth prices in the world, because the bandwidth
was via satellite and a single undersea cable, South Atlantic 3 (SAT-3), whose sole South African owner was the
incumbent Telkom. Today, South Africa enjoys services from four new submarine cable systems, causing prices to drop
significantly. The privately held, open access SEACOM cable was the first competing cable to land, in 2009. SEACOM
is 17 000 km long and had an initial capacity of 1.2 tbps, which is being upgraded to 4.2 tbps (Gadget, 2013). The
SEACOM cable is the only cable servicing the eastern seaboard of the continent and links South Africa, Mozambique,
Madagascar, Tanzania, and Kenya with India and Europe. The Eastern Africa Submarine Cable System (EASSy) landed
in South Africa in 2010 and is 10 000 km long with a capacity of 4.72 tbps (EASSy, 2013). The MainOne cable landed
in 2010, and the West Africa Cable System (WACS) become operational in late-2011. WACS is 17 200 km long, with
an initial capacity of 500 gbps, upgradable to a mammoth 5.12 tbps (WACS, 2013). The African Coast to Europe (ACE)
cable came online in South Africa in 2012, with a capacity of 5.12 tbps and a length of 17 000 km (ACE, 2013).
The landing of these cables has led to an improvement in international bandwidth capacity, both in terms of quality
and pricing (via competitive sales to all carriers). The wholesale cost savings have not, however, always been passed
on from the operators to customers to any great extent, with the norm being either additional bandwidth offered for
the same price or modest reductions in retail prices (see pricing discussion below).
Late entrants have
failed to compete
with incumbents
due to the lack of
regulatory support
While growing bandwidth demand is increasingly being met at the international level, this has highlighted the
shortfalls in the national backbone and high-speed local access networks. The ICT policy paralysis witnessed in South
Africa over the past decade and a half has had extremely negative policy outcomes with regard to infrastructure
extension. The aforementioned policy of managed liberalisation, as adopted by the South African Government in the
first years of sector reform in the late 1990s, allowed incumbents to become highly entrenched before competition
was introduced. The absence or slowness of regulatory support for new entrants in their early years – e.g. via wholesale
access regulation and regulatory forbearance – has meant that none of the later entrants has been able to compete
with the incumbents. (The ultimate casualty of the absence of fair competitive ICT markets has been consumer
welfare. Both the cost and quality of services, as discussed in Part Two of this report, compare poorly with other lowermiddle-income countries, including such countries elsewhere in Africa.)
The policy failures and implementation problems with regard to introduction and extension of fixed broadband
networks in South Africa resulted in the Department of Public Enterprises (DPE) embarking on the process to establish
a state-owned broadband infrastructure company, Broadband Infraco. The fibre optic networks of Transnet and
Eskom, which were to have been set aside for the second network operator, were taken from Neotel by the DPE (just
as Neotel was signing its final licence agreements) and transferred to the wholly state-owned Infraco in 2007. The
company was licensed for the provision of wholesale services and became operational in 2009 following licensing
delays relating to determination of the kinds of services it would be entitled to offer. Infraco has since invested in
national and international backbone communications networks, and is one of the main investors in WACS.
16
But state coordination has been weak and arguably there has not been sufficient investment in Infraco even to build
out the roughly 12 000 km of backbone planned (not a great distance for a national backbone for a country the size
Understanding what is happening in ICT in South Africa
of South Africa). Neotel was granted an exclusive three-year roaming agreement on the Infraco network. Although
the argument has been made that the introduction of Infraco squeezed out private sector investment, the mobile
operators (able to self-provide their own backhaul from 2003 onwards) were also happy at the prospect of not having
to invest in their own networks and to have an alternative to Telkom. But any potential for an open access broadband
operating model in South Africa was scuppered by a lack of state coordination and the subsequent delay in the
licensing of Infraco. In 2009, unable to wait any longer, MTN, Neotel and Vodacom started co-building an alternative
intercity infrastructure network, having already started cabling the metros. With the deluge of increased data on
mobile networks, which provide the overwhelming bulk of internet access to non-corporate and non-government
users, backhaul networks remain a major concern for operators, resulting in commercially driven infrastructure-sharing.
Within the local access network, the possibility of handing over heavy data users from expensive 3G and 4G networks
to WiFi networks (common in some markets with high levels of mobile penetration and use) has not been possible in
South Africa because of the limited availability of WiFi in the country.
The aforementioned Dark Fibre Africa is a carrier-neutral open access ducting infrastructure provider that started
rolling out its network in October 2007. To date, Dark Firbre has rolled out 7 300 km of infrastructure. Dark Fibre
funds infrastructure rollout and leases the ready-made infrastructure to licensed operators, on which they can provide
different converged services (ITWeb, 2013). This model is believed to significantly improve operators’ go-to-market
strategies and significantly reduce their capital expenditure costs. Dark Fibre’s clients include Vodacom, Telkom, and
MTN, amongst others. Figure 4 shows that while significant progress has been made in metropolitan areas and in intercity routes, broadband coverage across the country remains extremely uneven (ITWeb, 2013).
Figure 4: Broadband coverage map in South Africa
Source: Ministry of Communications (2012)
Insufficient
investment has
been made into
the rollout of open
access broadband
infrastructure
The state company
Broadband Infraco
is underfinanced
17
Evidence for ICT Policy Action
Infrastructure sharing and inter-agency coordination
There is no coordinated plan for
the rollout of fibre
technology
Regulatory and way-leave approval bottlenecks have also hampered efficient rollout of services. Despite the
identification of the need for an integrated national rights-of-way plan for fibre rollout – to be agreed between the
regulator, the metros, and the National Roads Agency – no progress has been made in this regard, and operators are
required to get individual way-leave permissions from the Roads Agency and municipalities. This permissions process
appears to be entirely uncoordinated, even at the individual institutional level, such that pavements and streets are
constantly being pulled up and put back as operators go in one after another.
The need for infrastructure-sharing to overcome duplication – and bring down costs and reduce environmental
impact – is something regularly referred to, but, as with other important sector matters, little has been done to formally
coordinate the process. Private infrastructure-sharing company Dark Fibre has privately coordinated the building of
ducts into which it lays dark fibre, which can then be lit by licensed operators. Dark Fibre claims that civil engineering
of infrastructure and ducting accounts for 70% to 80% of total fibre rollout costs, and these processes generally confer
no strategic advantage.
The absence of
mobile operators’
facilities regulation
handicaps the
competitiveness
of new market
entrants
18
Key issues for successful competitive entry into markets are the ability to interconnect with, and to lease facilities from,
incumbent operators already in the market. All operators need to interconnect with each other in order to seamlessly
exchange traffic. New entrants are typically entitled to roam on the networks of existing operators while they build
out their networks, but due to the high costs of doing so, and the inability to control the network they are roaming on,
the longer a new entrant does this the more likely it is to compete ineffectively with an incumbent. Service providers,
virtual operators, and even some networkers, on the other hand, may decide to never self-provide their network
facilities or other elements, and will thus be perpetually dependent on receiving timely and cost-based access to
facilities from wholesale service providers. In the fixed arena, facilities generally take the form of different types of
leased lines (which can also be provided as retail services to large users such as corporates, either by incumbents
or resellers and services providers), but also include interconnection, and resale through various forms of LLU. With
mobile data becoming the major form of access to the internet, wholesale access to mobile operators’ networks
has also become a key competitive issue and yet, like fixed facilities, these mobile operator facilities have not been
regulated so as to ensure they are provided to the myriad of service providers in the liberalised environment (thus
limiting new entrants’ opportunities to compete fairly in South Africa’s highly entrenched mobile market dominated
by incumbents Vodacom and MTN).
Understanding what is happening in ICT in South Africa
Policy outcome 4: high wholesale pricing
Facilities-leasing
Leased lines remain the major facility required to build high-capacity ICT links between and within dispersed enterprises,
and are a major input cost for the services sector. Although leased-line prices have come down via some competition
from Neotel in the corporate market, Neotel’s product offerings are not all substitutable and the incumbent Telkom
has the advantage of being able to offer turnkey solutions. The leased-line pricing structure has also been affected by
the introduction of Telkom’s ADSL service, which smaller-usage businesses have shifted to from more expensive leased
lines. South Africa has high leased-line prices in comparison to most OECD countries for 2011 (see Figure 5 below).
(And it must be noted, in analysing the data in figure 5, that the high cost of a 34 mbps leased-line in a country such
as Korea is largely a result of declining demand for that relatively low level of bandwidth.)
23553
Mexico
20818
Korea
19580
South Africa
17196
Ireland
14552
Canada
13808
United Kingdom
12760
Portugal
11574
France
11191
Japan
10699
Italy
7931
Turkey
Greece
7597
United States
7453
7430
Austria
7008
Belgium
5345
Germany
5184
Australia
4014
Denmark
3531
Luxembourg
2016
Norway
Iceland
Leased line pricing
remains high in
comparison to
other middleincome countries
954
Figure 5: National leased line pricing (per month) basket 34 mbps (USD PPP)
Source: Compiled by RIA from OECD (2011) and Telkom (2012) data
19
Evidence for ICT Policy Action
Termination rates
A cost-based
mobile termination
rate encourages
competition and
affordable pricing
The mobile termination rate (MTR) – the rate that operators charge each other to terminate calls on each other’s
networks – was first regulated in South Africa in March 2011. The rationale for regulatory intervention in MTR pricing is
that call termination is a monopoly: while call origination can be made competitive in numerous ways, there is simply
no alternative to terminating a call on the network of the operator which owns the number a caller is trying to reach.
Termination rates above the cost of an efficient operator distort the market and produce anti-competitive effects.
Given that mobile termination is an inherent monopoly, regulators have no alternative mechanism besides adjusting
termination rates in line with costs – if such adjustments are not made by operators. Determining costs can be done
by a regulator through a benchmarking exercise of termination costs, such as was undertaken in Namibia in 2009, or
through detailed cost studies such as those undertaken in Botswana, Kenya, Nigeria, Tanzania, and Uganda.4 There is
now overwhelming international evidence from across the world that cost-based MTRs encourage competition and
more affordable pricing.5
In October 2010, ICASA gazetted its MTR regulations, effective from March 2011. From a peak rate of ZAR0.73, the
October 2010 regulation introduced a glide path towards a peak and off-peak termination rate of ZAR0.40, achieved in
March 2013. But this MTR of ZAR0.40, now in place, is still well above that of many other African countries and above
what is globally considered to be the cost of an efficient operator. In Namibia, the MTR has been cut from ZAR1.06
(a similar price to that of South Africa in 2010) to ZAR0.30 in less than two years. Other countries such as Kenya and
Uganda now have MTRs below US$0.02 (approximately ZAR0.20 at the August 2013 exchange rate.)
Table 3: Mobile termination glide path in ZAR
Peak
Off-peak
March 2011
0.73
0.65
March 2012
0.56
0.52
March 2013
0.40
0.40
Asymmetrical termination rates may apply, whereby operators with less than 25% market share could charge up
to 20% more for calls they carried on their networks between 1 March 2011 and 28 February 2012. Thereafter, the
maximum premium they could charge fell to 15%, and finally, in March 2013, it will fall to 10%. Only Vodacom
and MTN have more than 25% of the mobile market, and only Telkom has more than 25% of the fixed market.
Source: ICASA (2010, 2011)
Cost-based MTRs remove market distortions and provide efficient investment incentives. The net effect of fairer
competition is lower costs of communication, better services, and more equitable returns on investment for all
operators (Stork, 2011, 2012). In support of retaining high MTRs, dominant mobile operators have argued that lowering
MTRs leads to increases in access and use prices,6 resulting in fewer people being able to afford communication
20
4 The regulators concerned would do well to share the results of these studies with other regulators, because in vastly different
environments the results have tended to be very similar.
5 See, for example, Stork (2012) for OECD countries.
6 This is often linked to the waterbed effect and the two-sided market argument (Vodafone, 2007).
Understanding what is happening in ICT in South Africa
services and lower profits (which would limit operators’ capacity to invest in network extension and upgrading). RIA
has been unable to find evidence of this dynamic in any jurisdiction examined by RIA in Africa (see Gillwald and Stork,
2012), and this dynamic is not present in South Africa.
Incumbent operators are quick to point out, and the media to report, the loss in revenue suffered due to termination
rate cuts, while generally omitting to report on incumbent operators’ cost savings from reduced termination
payments. Operators receive termination revenues from, and pay termination fees to, other operators. The question
is thus not whether an operator has less revenue from termination after MTR cuts but rather, how the net profit or
net loss from termination has changed and how this affects the operator’s overall performance. For example, the
annual net profit from termination of South Africa’s largest mobile operator, Vodacom, increased by ZAR66million,
despite a reduction in its incoming termination revenue, after MTRs were cut by ICASA (see Table 3). Strangely,
the incumbent fixed-line operator Telkom, which has been at the wrong end of asymmetrical termination rates
for nearly two decades, also complained about a loss in termination rate revenue through MTR cuts.7 In reality,
Telkom’s total interconnection revenues increased in the 2011-12 financial year.8 As one would expect with there
being over 60million SIM cards active across South Africa’s mobile networks, Telkom is a net termination rate payer.
Accordingly, Telkom’s net termination payments decreased, largely due to the MTR reductions, from ZAR5billion (in
the 2009-10 financial year) to ZAR3.1billion in 2011-12. The logic behind Telkom’s complaints about the MTR rate
cuts thus remains unclear, unless the operator was asking for greater mobile-fixed symmetry (an argument Telkom
has not made explicitly).
Lower termination rates mean only that net payers pay less and net receivers receive less. MTN, for example, is
a net receiver. Its net profit from call termination (revenues in excess of expenses) for South Africa decreased
from ZAR1.085billion (in its financial year ending December 2010) to ZAR741million (in its financial year ending
December 2011), a decrease of ZAR644million and not a loss of ZAR2.5billion as claimed in May 2011. Its termination
revenue decreased by ZAR644million in 2011, while its termination expenses dropped by ZAR300million, leading to
a net reduction in termination revenue of only ZAR344million in 2011.9 MTN’s Capex, revenue, and EBITDA margins
all increased in its financial year ending December 2011 compared to the previous financial year. MTN’s implied
per-minute price (ARPU/MOU) decreased by ZAR0.20, becoming similar to Vodacom’s implied price. The estimate
for MTN is based, however, on blended ARPUs (because prepaid ARPU and MOU are not reported separately from
postpaid APRU/MOU by MTN).
7 Telkom SA Limited (2011).
8 Telkom SA Limited (2012). At this time, Telkom had sold its lucrative shareholding in Vodacom (which had enjoyed significant
revenues for years from some of the highest (asymmetrical) termination rates in the world), and now had its new mobile service
Telkom Mobile. Telkom Mobile did manage to secure, from the regulator, an asymmetrical termination rate, together with Cell C, for
its terminations with the dominant operators Vodacom and MTN.
9 See MTN (2011)
Operator EBIDTA’s
margins increased
despite the
introduction of the
mobile termination
rate glide path
21
Evidence for ICT Policy Action
Table 4: Mobile termination rates in RIA Countries - 2013 update
Mobile termination rate
Currency
specified by
regulation
Kenya
Mauritius
Ghana
US$
exchange
rate
Value
in US$
cents
1.44
KES
83.21
1.7
0.9
MUR
28.9
3.1
Comments
1 July 2012: 1.15 and 1 July 2013: 0.99
Source
CCK (2010)
ICTA (2008)
NCA set glide path to 4.50 Ghana
pesewa in 2013 and 4 Ghana pesewa
for 2014, SMS on all mobile networks
0.7 from 2012, then 0.6 and 0.5 in
2013 and 2014.
0.045
GHS
1.84
2.4
NCA (2010)
Namibia
0.3
NAD
8.20
3.7
Zambia
0.05
ZMK
5 066.37
0.0
further reductions to 5 US cents by 1
Jan. 2012
ZICTA (2010)
Nigeria
8.2
NGN
157.5
5.2
for existing operators
NCC (2009)
Uganda
131
UGX
2 469.6
5.3
Rwanda
28
RWF
598.98
4.7
RWF 35 to RWF 33 in January 2012,
RWF 28 in January 2013 and RWF 22
in January 2014
RURA
(2011))
Botswana
0.40
BWP
7.49
5.3
glide path to 0.3 Pula by 2014
BTA (2011)
Tanzania
7.16
TZS
1 562.44
0.0
South Africa
0.4
ZAR
8.20
4.9
March 2013
ICASA (2010)
Mozambique
2.59
MZN
27.9
9.3
Symmetric MTR since 2010
INCM (2010)
CRAN (2009)
Businge
(2011)
TCRA (2007)
* Average interbank rate for 2011
Source: Oanda.com (n.d.)
Because they are private, unlisted companies and non-dominant players, no public information is available for Neotel
and Cell C in relation to the impact of MTR cuts. These operators were not willing to divulge such information – even in
generalised form without actual figures. With Vodacom and MTN being net receivers (Vodacom even receiving more
in 2012 than in 2011), and Telkom being a net payer but paying less in 2012 than in 2011 and 2010, one can assume
that Neotel is a net payer.10
22
10 This highlights the need for ICASA to collect actual figures for all interconnection revenues and payments from operators, for
standardised time periods, in order to determine exactly the impact of termination rate cuts.
Understanding what is happening in ICT in South Africa
The negative South African stakeholder perception relating to interconnection, as reflected in the TRE assessment
outlined above, stems from the belated and insubstantial nature of the termination rate reductions in South Africa via
its recent glide path. Until the cuts of March 2013, the reductions were insufficient to produce the positive competitive
outcomes on retail rates witnessed in other countries. Before 2013, dominant operators Vodacom and MTN were able
to withstand short-term pressure on retail prices as the marginal smaller players were unable to leverage the small
increments by which termination rates had been reduced to significantly undercut Vodacom’s and MTN’s prices. (More
is said below about mobile operators’ responses to the MTR glide path, particularly the March 2013 MTR cut.)
Table 5: Fixed termination rate reductions
Peak (ZAR)
Off Peak (ZAR)
2006
0.29
0.16
2007
0.29
0.16
2008
0.29
0.16
2009
0.29
0.16
2010
0.28
0.16
2011
0.2
0.12
2012
0.15
0.12
2013
0.15
0.12
Source: ICASA (2010, 2011)
On the fixed side, termination rates have remained asymmetrical, with very little reduction in the rate between 2006
and 2013. A flat termination rate across both fixed and mobile would improve the viability of the fixed network
operators, who also face the challenges of building out next-generation networks.
23
Evidence for ICT Policy Action
Competitive pricing
pressure followed
the MTR reduction
in March 2013
South Africans are only now, with the last termination rate reduction in the current glide path (in March 2013),
beginning to see the benefits of competitive pricing pressure in the prepaid mobile market. Yet, prices for prepaid
mobile, the service used by the majority of citizens and particularly the poor, still remain high in comparison with other
African countries, as discussed below.
As a result of the second reduction of the MTR in March 2012, Cell C was able to cut its prices to ZAR0.99 per minute –
below the psychological ZAR1.00 barrier – and this was followed by Vodacom briefly, but Vodacom’s cheapest price went
back up. Following the third wholesale termination rate cut in March 2013, Telkom Mobile lowered its tariff to ZAR0.95
per minute (through a service bundled with Telkom fixed-line provision), becoming the lowest-priced product offering
in the country. The price cuts put pressure on the tariffs of the two dominant operators, as they were losing market share.
MTN, having resisted price cuts throughout 2012, and after losing almost half a million subscribers in March 2013 due
to the migration of users towards cheaper operators (despite the popularity of its dynamically priced offering MTN
Zone), was forced finally to reduce its tariffs and introduced MTN One4All, a new flat tariff set at ZAR1.20 per minute
with per-second billing. Similarly, Vodacom introduced Anytime per Second, set at the same price as its competitor
MTN. However, the incumbents, while matching each other’s price, did not go down to Cell C’s lowest price offering of
ZAR0.99 per minute, which last entrant Telkom Mobile did (as we saw above) match and even go lower than.
170
127.5
85
42.5
8ta
Cell C
MTN South Africa
Virgin Mobile
Q1 2013
Q4 2012
Q3 2012
Q2 2012
Q1 2012
Q4 2011
Q3 2011
Q2 2011
Q1 2011
Q4 2010
0
Vodacom South Africa
Figure 6: Cheapest prepaid mobile product by operator in South Africa, based on OECD lower-user basket of
2010, in ZAR
11
Source: RIA Pricing Transparency Index: Prepaid Mobile data 2013
24
11 In order to overcome comparative price complexities at least practically, the Organisation for Economic Co-operation and
Development has developed a “price benchmarking baskets” methodology. This methodology is based on 40 calls in a month and
distribution of calls across time and off-net and on-net. Although the overall basket volumes and destination distribution in the
original OECD basket also include voicemail, RIA has removed voicemail from the basket and redistributed throughout the amount
of on-net and off-net calls because voicemail is free of charge with the majority of African operators. See OECD (2010).
Understanding what is happening in ICT in South Africa
These pricing moves demonstrate that the dominant operators MTN and Vodacom, which have historically been
entrenched in the market, are finally being affected by the price-cutting efforts of late entrants Cell C and, more
recently, Telkom Mobile. The dominant operators are now reacting to price pressure, as price-sensitive users migrate
towards smaller operators.
MTN has consistently had the highest price in South Africa for its cheapest prepaid product in terms of the Organisation
for Economic Co-operation and Development (OECD) 2010 prepaid low-user mobile basket (40 calls per month
prepaid), with its 2012 cheapest lower-user basket cost sitting at ZAR167, while Vodacom’s cheapest prepaid pricing
has been constant and marginally lower, sitting at ZAR138 in 2012 for the OECD monthly lower-user basket (OECD,
2010). In the first quarter of 2013, following price pressures from smaller operators and the enforcement of the third
reduction of MTRs, both MTN and Vodacom reduced prices to the equivalent of ZAR122 for the OECD lower-user
basket, still higher than the cheapest tariffs of the small operators. Cell C’s low-user basket cost is now at ZAR10,
while Telkom Mobile’s is at ZAR103. Telkom Mobile in 2013 announced a promotion that would see its on-net price
at ZAR0.95 per minute and its off-net price at ZAR0.95, the lowest mobile prices ever offered in South Africa. Whether
Telkom Mobile keeps its prices this low, and is able to pressure other operators to reduce prices, remains to be seen.
Sudan
Guinea
Kenya
Ghana
Egypt
Mauritius
Ethiopia
Tanzania
Nigeria
MTN and Vodacom
have been affected
by price-cutting
pressure from late
entrants Cell C and
Telkom Mobile
1.7
2.4
2.6
South Africa’s
pricing remains
high on the
continent despite a
tariff dive
3.9
4
4.1
4.3
5
5.8
Seirra Leone
South Africa
6.3
12.6
Figure 7: South African prepaid mobile prices in relation to the 10 cheapest countries in Africa, based on OECD
lower-user basket of 2010
Source: RIA Pricing Transparency Index: Prepaid Mobile data
When comparing South Africa with other African countries in terms of the OECD 2010 lower-user prepaid mobile
basket, South Africa is seven times more expensive than the cheapest country (Sudan) surveyed by RIA in Africa and
twice as expensive as Sierra Leone, which is only the 10th cheapest country in the RIA Pricing Transparency Index:
Prepaid Mobile. This comparison with other African countries studied by RIA shows that although the enforced
reduction of MTRs, and price pressures, have brought about a reduction of tariffs, South Africa’s prepaid prices
continue to be very expensive in comparison to many other African countries. In Table 6 below, South Africa comes
23rd out of 46 operators measured across Africa in the RIA Prepaid Mobile Price Index in terms of the cheapest prepaid
mobile product in the country, and 26th in terms of the cheapest prepaid mobile product in the country from a
dominant operator.
25
Evidence for ICT Policy Action
While prices are high across all services in South Africa, South Africa’s high prepaid mobile prices, and poor showing
on this measure compared to other African countries, is of particular concern as a policy outcome, as prepaid mobile
services are the communication services most used by the poor.
Table 6: March 2013 prepaid mobile costs based on OECD lower-user basket of 2010
Cheapest product from
dominant operator
US$
US$
% cheaper than
dominant
Rank
Ghana
3.9
1
3.9
4
Dominant is cheapest
Egypt
4.01
2
4.01
5
Dominant is cheapest
Mauritius
4.13
3
4.13
6
Dominant is cheapest
Ethiopia
4.3
4
4.3
7
N/A
Kenya
4.37
5
2.58
3
41.0%
Sudan
4.56
6
1.72
1
62.3%
Guinea
6.26
7
2.41
2
61.5%
Tunisia
6.36
8
6.36
12
Dominant is cheapest
Algeria
6.48
9
6.48
14
Dominant is cheapest
Libya
6.88
10
6.88
16
Dominant is cheapest
Congo Brazzaville
7.82
11
7.82
17
Dominant is cheapest
Tanzania
8.32
12
5.01
8
39.8%
Uganda
9.17
13
6.32
11
31.1%
Rwanda
9.19
14
6.37
13
30.7%
Nigeria
9.48
15
5.77
9
39.1%
Namibia
12.2
16
12.2
19
Dominant is cheapest
12.33
17
12.33
20
Dominant is cheapest
12.4
18
12.4
21
Dominant is cheapest
Cote d'Ivoire
12.75
19
12.75
24
Dominant is cheapest
Senegal
12.76
20
12.76
25
Dominant is cheapest
Benin
13.16
21
12.45
22
5.4%
Central African Republic
13.16
22
13.16
26
Dominant is cheapest
Mauritania
Liberia
26
Rank
Cheapest product
in country
Understanding what is happening in ICT in South Africa
Sierra Leone
13.59
23
6.28
10
53.8%
Mozambique
14.02
24
14.02
28
Dominant is cheapest
Botswana
14.66
25
11.75
18
19.8%
South Africa
14.91
26
12.57
23
15.7%
Burkina Faso
14.95
27
14.72
29
1.5%
Mali
14.97
28
14.97
30
Dominant is cheapest
Togo
15.52
29
15.52
31
Dominant is cheapest
Chad
16.8
30
16.8
34
Dominant is cheapest
16.91
31
16.91
35
Dominant is cheapest
D.R. Congo
17.1
32
17.1
36
Dominant is cheapest
Cameroon
17.32
33
17.13
37
1.1%
Seychelles
18.13
34
18.13
38
Dominant is cheapest
Zambia
19.07
35
18.57
39
2.6%
Niger
19.35
36
16.34
32
15.6%
Angola
22.55
37
19.41
41
13.9%
Zimbabwe
22.75
38
21.57
43
5.2%
Morocco
22.92
39
22.92
44
Dominant is cheapest
Madagascar
23.06
40
19.63
42
14.9%
Lesotho
23.74
41
19.28
40
18.8%
Swaziland
26.01
42
26.01
45
Dominant is cheapest
Cape Verde
29.82
43
29.82
46
Dominant is cheapest
Malawi
Source: RIA Pricing Transparency Index: Prepaid Mobile data 2013
27
Evidence for ICT Policy Action
Mobile broadband
is cheaper and
faster than fixed
line broadband
While prices for South Africa’s prepaid mobile voice services continue to be very high by continental and
global standards, the country’s mobile data market, which is becoming a significant revenue stream for mobile
operators, is highly competitive. From analyses of prepaid and postpaid mobile and ADSL (fixed) broadband RIA
price categories, it is clear that fixed-line packages are (surprisingly) far more expensive than comparable mobile
packages. Also boosting mobile data’s appeal compared to fixed in South Africa, particularly for low data use and
uneven consumption, are mobile data’s lower setup costs (e.g. no monthly line rental charges and installation fees)
and its more convenient prepaid charging options. For these reasons, it is unsurprising that many South African
home users opt to use a 3G dongle modem or mobile handset to access the internet instead of setting up an ADSL
connection. With mobile operators offering different broadband data options and packages for different market
segments, the mobile broadband market is where pricing pressure is occurring, as operators compete to attract
and retain broadband customers. As a result, where fixed operators have moved into mobile with the intention of
benefiting from bundled service offerings of fixed and mobile, the danger exists of their mobile offering, driven by
competition in the mobile market, cannibalising their fixed-line offering. This is evident in South Africa, which has
the most extensive (though still very limited) fixed network in sub-Saharan Africa. Mobile operators, particularly the
late entrant Telkom mobile arm Telkom Mobile, offer cheaper and faster internet plans than the service offered by
the fixed incumbent Telkom.
In the assessment of broadband pricing below, prices are compared for categories of 1GB and 5GB. The monthly
cost is established by dividing the total cost of use for a 24-month period, including installation costs, dongle
purchases, line rental and out-of-bundle MB costs. Only the cheapest product available from an operator is
displayed in Tables 7 and 8.
28
Understanding what is happening in ICT in South Africa
Table 7: 1GB RIA price categories, prepaid and postpaid mobile broadband, in ZAR per month
up to 7.2 mbps
Prepaid mobile
Postpaid mobile
ADSL
Fixed wireless
at 7.2 mbps
up to 21.6 mbps
above 21.6 mbps
257.29
Telkom Mobile
165.63
165.63
178.17
Cell C
176.04
176.04
190.63
MTN
303.54
303.54
311.88
Vodacom
295.63
295.63
308.13
345.63
Cheapest
165.63
165.63
178.17
257.29
Telkom Mobile
85.63
85.63
98.17
177.29
Cell C
100.79
100.79
115.38
MTN
79.00
79.00
79.00
89.00
Vodacom
85.63
85.63
98.13
135.63
Cheapest
79.00
79.00
79.00
89.00
iBurst
409.54
409.54
669.54
MWEB
364.13
544.13
1 314.13
Telkom
423.71
423.71
931.71
WebAfrica
367.46
617.46
667.46
Cheapest
364.13
409.54
667.46
Neotel
189.25
519.83
1 519.83
Prices for
broadband
contracts are
lower than prepaid
broadband
packages
Source: RIA broadband pricing calculations 2013
Telkom Mobile has the cheapest prepaid product for a user requiring 1GB of use per month, while MTN has the
cheapest postpaid 1GB product. Both Vodacom and Telkom Mobile offer prepaid LTE products in all four speed
categories, while MTN only offers LTE speeds postpaid. ADSL prices for any of the providers covered cannot compete
on price for 1GB use per month for the lower three speed categories and there is no ADSL product offering beyond
21.6 mbps. Fixed wireless is also only available for the lower three speed categories. Neotel products cannot compete
with mobile and only beat ADSL in the speed category below 7.2 mbps
29
Evidence for ICT Policy Action
Table 8: 5GB RIA price categories, prepaid and postpaid mobile broadband, in ZAR per month
up to 7.2 mbps
Prepaid mobile
Postpaid mobile
ADSL
Fixed wireless
at 7.2 mbps
up to 21.6 mbps
above 21.6 mbps
408.29
Telkom Mobile
316.63
316.63
329.17
Cell C
235.29
235.29
249.88
MTN
1 081.54
1 081.54
1 089.88
Vodacom
845.63
845.63
858.13
895.63
Cheapest
235.29
235.29
249.88
408.29
Telkom Mobile
265.63
265.63
278.17
357.29
Cell C
216.04
216.04
230.63
MTN
269.00
269.00
269.00
269.00
Vodacom
275.63
275.63
288.13
325.63
Cheapest
216.04
216.04
230.63
269.00
iBurst
499.54
499.54
759.54
MWEB
424.13
544.13
1 314.13
Telkom
423.71
432.71
758.71
WebAfrica
417.46
417.46
667.46
Cheapest
417.46
417.46
667.46
Neotel
189.25
519.83
1 519.83
Source: RIA broadband pricing calculations 2013
The picture changes for the 5GB per month category, where Cell C is the cheapest mobile prepaid and postpaid
provider. The cheapest ADSL product costs twice as much as the cheapest mobile product. Neotel’s fixed wireless is
the cheapest for below 7.2 mbps broadband products, but cannot compete at any of the faster speeds.
ADSL is the only broadband product that offers uncapped access, the only remaining advantage of fixed-broadband.
Together with some reliability advantages raised in the quality of service discussion below, this is really Telkom’s only
competitive advantage. As seen above, it is strategically important for Telkom not to focus on mobile broadband at the
expense of its fixed broadband business. Telkom would need to invest in faster technologies such as VDSL2 or fibre-tothe-home if it wants to remain significant with wired broadband offerings.
30
Understanding what is happening in ICT in South Africa
Policy outcome 7: mobile broadband speeds faster than ADSL
Operators have argued that it is flawed to compare pricing in different countries without also comparing quality
and coverage, arguing that South Africa has some of the most advanced networks in the world and extremely high
population coverage. While these assertions are true, it is also true that other countries with much lower prices are
enjoying extensive national coverage and latest-generation networks with the help of proactive regulators, engaged
governments, and booming economies. Movicel of Angola and MTC of Namibia were the first operators in Africa
to deploy LTE, in April/May 2012, followed by Mauritius’s second-largest mobile operator, Emtel, which launched its
commercial LTE service at the end of May 2012, and Smile Communications in Tanzania, which launched a commercial
LTE service in June 2012.
Mobile broadband
offerings are
preferred to fixed
ones
QoS regulation was absent in South Africa until 2013, hence the negative TRE perception seen above for this criterion.
But in May 2013, the South African regulator ICASA published QoS reports covering Vodacom, MTN and Cell C’s
networks and services in Gauteng, Eastern Cape, Western Cape, and KwaZulu-Natal Provinces. The reports showed that
the operators were falling short in meeting call set-up success rate (CSSR) targets in a number of provinces. Despite the
QoS reports being a positive step towards addressing the level of QoS, operators have questioned methodology used
by ICASA-drive-testing, using the TEMS investigation tool. Operators have previously questioned the reliability of drivetesting as the testing quality was believed to be too limited (ITWeb, 2013). Meanwhile, according to the latest report
of Ookla, an international broadband testing
company, South Africans are on average only
getting 74% of the speeds they sign up for,
which is lower than the global average of 85%.
Ookla’s (n.d.) Household Promise Index ranks
South Africa number 55 out of 64 countries.
The Ookla findings are supported by a
broadband QoS pilot study conducted by RIA
in South Africa in all nine provinces. The study
found that consumers in South Africa are not
getting advertised speeds. The study also
demonstrated that mobile 3G and LTE services
outperform fixed broadband. Using host-based
measurements from MyBroadband, Figure 9
shows that no matter where the measurements
are taken (i.e. to a local or international server),
mobile speeds are faster than fixed-line
speeds. The median downstream throughputs
of the LTE connections are the highest, at
around 25 mbps. The 3G connections also
generally experience higher download
throughput than the fixed-line service plans.
The download speed of mobile broadband is
far outperforming fixed-line broadband speed
in South Africa.
Consumers are not
getting advertised
connection speeds
Figure 8: African broadband download speeds
Source: Google (2011)
31
Evidence for ICT Policy Action
Mobile broadband
throughput is
better than that
of fixed
However, speed is not the only limiting factor on performance. Although the mobile broadband service throughput is
better than fixed at all points throughout the country, it is unlikely to become a substitute for fixed-lined connectivity
where that is already available because, although fixed-line throughput is poor, the reliability of ADSL over time is more
constant and thus is preferable for users requiring consistently high quality levels (Chetty et al., 2013).
9 227
4 753
2 716
863
586
216
Download speed (kbps)
156
Upload speed (kbps)
Fixed
Mobile
135
262
Latency (ms)
Fixed wireless
Figure 9: South African broadband speeds
Source: MyBroadband (2013), based on measurements from 75 000 point
Unlike in more developed nations, in South Africa – according to the RIA pricing data and pilot study of broadband
performance – mobile broadband is thus both cheaper and faster than fixed broadband. However, because of its
variability, mobile is unlikely to replace fixed-line connectivity, particularly for consumers needing a stable and reliable
internet connection. To encourage widespread broadband adoption and use in the country, South Africa has to invest
in next-generation fixed-line infrastructure (VDSL and fibre-to-home) and bring fixed broadband prices down across
the board.
32
Understanding what is happening in ICT in South Africa
With wireless the major driver of individual broadband uptake in South Africa, the release of critical spectrum (in the
prime spectrum around the 700MHz and 800MHz bands) by the migration from analogue to digital transmission of
terrestrial TV has been a major area of policy focus and industry pressure. Efficient assignment of spectrum in these
frequencies, which are particularly suited to the deployment of high-speed wireless broadband services using 4G
technologies such as LTE, is seen as crucial to delivering next-generation broadband services to South Africans and to
overcoming the so-called “digital divide” between broadband-connected urban citizens and those living in rural areas
with inferior connectivity. Yet spectrum remains a critical regulatory bottleneck.
Spectrum
limitations remain
a critical regulatory
bottleneck
Frequency spectrum in the 800MHz band was allocated by ICASA to Neotel, South Africa’s first infrastructure-based
fixed-line competitor, in 2010. Access to this spectrum had been earmarked by Neotel as key to rolling out costeffective voice and internet services for individual and SME customers across South Africa. The CDMA2000 mobile
technology has been used globally in the 800MHz spectrum to provide larger coverage for both voice and highspeed internet services at lower costs, thus providing optimal economies of scale. This automatically translates
into improved affordability of telecommunications services to consumers for whom telecommunications have
previously been unaffordable12 (Burger, 2013). (Telkom also deploys WiMAX to meet broadband demand where it
is unable to deploy ADSL.)
Most wireless access providers in South Africa currently make use of licence-exempt frequencies in accordance with
the ICASA Frequency Licence Exemption Regulations of 2008 (ICASA, 2008). The industry is growing exponentially
to meet the massive, pent-up demand for cost-effective, quality broadband across the country – from high-density
suburbs to remote rural communities. However, it is recognised that use of licence-exempt frequencies is not a
sustainable solution, due to the number of new entrants seeking access to spectrum and the congestion of these
allocated bands. Late in 2012, ICASA announced its intention to review the National Radio Frequency Plan to ensure
that that it corresponds to the decisions of ITU World Radio Conference of 2012 (WRC-12) and the latest ITU Radio
Regulations; and that it aligns with the Southern African Development Community Frequency Allocation Plan (SADC
FAP). On 24 December 2012, ICASA published the second Draft Frequency Migration Plan, following consideration
of comments made in initial submissions, public hearings and supplementary submissions (ICASA, 2012). The Plan
includes a framework for development of a Spectrum Assignment Plan for bands earmarked for migration and those
identified in the future National Radio Frequency Plan. Comment on the Draft Frequency Migration Plan was due in
February 2013, but at the time of the completion of this report in August 2013, nothing had yet been made public
regarding the inputs received.
12 See EEpublishers (2013) for a more detailed account of the rationale for allocation.
33
Evidence for ICT Policy Action
Figure 10: 2.6GHz band – comparison between ITU options and possible ICASA allocation
Source: Compiled by Calandro (2011)
Digital migration
Little progress has
been made towards
digital terrestrial
television
34
The policy process for migration of terrestrial TV from the current analogue frequencies to digital terrestrial television
(DTT) frequencies started over a decade ago with appointment of the first Digital Broadcasting Advisory Body (DBAB). The
migration will result in an increase in the number of TV channels available, and thus increased programming and content.
Another advantage of digital migration is that it allows for more efficient use of frequency spectrum, some of which can be
channelled away from TV for alternative uses, including wireless broadband. The digital migration process was originally
planned for completion in November 2011, but has been delayed by a number of factors, including: appointment of a
series of specialist bodies whose findings were not implemented; arbitrary reconsideration of the agreed DTT transmission
standard by the Ministry; and contestation over set-top box (STB) standards and conditional access (CA) systems.
The political dimensions of migrating broadcast channels off valuable spectrum are compounded in South Africa
by the fact that, as in many other developing countries, most people still do not have broadband internet access (or
any internet access at all). However, at the same time, unlike many other developing countries, South Africa has a
sophisticated television environment with a constitutionally protected public broadcaster (as opposed to the state
broadcasters in many other African countries) and community, private free-to-air, and subscription broadcasters,
which together represent significant and vocal interests. TV and radio thus remain primary modes of information and
education, posing challenges to state efforts to move free-to-air television channels off their existing frequencies to
make way for broadband internet services which, it has been argued, would initially only be affordable to a relatively
small elite class with computer access and connectivity. But with the changes to broadband access brought about by
mobile connectivity, this case may be more difficult to make, though the nature of content use on a mobile phone and
TV screen or computer are of course quite different.
Understanding what is happening in ICT in South Africa
On the demand side of broadband internet (as is discussed in Part Two of this report), there is little doubt that in the
short term, demand will be met through mobile phone services and devices. Although large numbers of people
are currently unable to afford smartphones, South Africa does have a relatively high penetration of feature phones
and smartphones with internet capability, a penetration likely to increase rapidly as people become more internetdependent. However, if broadcast digital migration is correctly managed, it has potential to deliver long-term
broadband internet penetration benefits by generating spectrum dividends for broadband rollout, including rollout
to underserved areas.
Like with so many other ICT matters, South Africa was initially ahead of the curve on broadcast digital migration.
In 2001, an amendment to the Telecommunications Act required the establishment of the aforementioned DBAB
by then-Minister of Communications Ivy Matsepe-Casaburri. A mixed task team of operators and academia was
appointed to DBAB, and within a year DBAB reported to Cabinet on proposed digital broadcast standards, migration
priorities, STB development and spectrum and multiplex (MUX) arrangements. DBAB proposed a market-led pilot,
with a significant role for the public broadcaster. The proposals, based on global experience following the first round
of unsuccessful digital terrestrial broadcasting experiences in countries such as the UK and Spain, were never formally
published or adopted.
Without reference to DBAB or its report, the same Minister Matsepe-Casaburri in 2006 appointed a new body, the
Digital Migration Working Group, which reported back to the Minister in 2006, and then a Digital Dzonga multistakeholder body to take the migration forward. The Digital Dzonga worked closely with the Southern African Digital
Broadcasting Association (SADIBA) industry body to pilot terrestrial services and ensure that trials could take place
from 2008 onwards. But having made significant progress in implementation of the migration plan, the Digital Dzonga
body was disbanded in 2010 by minister Siphiwe Nyanda. In addition, issues around DTT standards were unnecessarily
thrown into confusion by political interference when Minister Nyanda and his Director-General in the DoC, Mamodupi
Mohlala, unilaterally decided to review the choice of DVB-T as the standard for DTT transmission, so as to give
consideration to a Japanese-developed standard that had been adopted (and was being lobbied for) by Brazil. The
Minister’s decision to review DVB-T (the standard which had been approved by Cabinet in 2007) followed an official
DoC visit to Brazil by invitation of Brazil’s then-President Lula, whose industrial policy entailed the local production of
STBs using the rival Japanese-developed standard.
Controversy over
the DTT standard
has slowed
progress towards
DTT adoption
With DVB-T pilots well advanced in South Africa, and basic specifications for equipment already agreed upon,
the industry spun into turmoil during this state reconsideration of the DVB-T standard, bringing progress towards
migration to a hault. Minister Nyanda, however, served for less than two years, and after the appointment of a new
Minister, Roy Padayachie, the DVB-T standard was reaffirmed (in its next generation, DVB-T2, which provides greater
spectrum efficiency) via an announcement in early 2012, and the migration process was put back on track.
The DTT STB’s CA and electronic programme guide (EPG) specifications have also been major points of contention,
and South Africa’s industrial policy, requiring local production of STBs (with the intention of being able to supply these
throughout the continent) has also been fraught. Among other things, the decision on whether the development of
the STB should be optimised to enable internet access, requiring a more costly return path, delayed agreement on the
STB specifications.
Controversy did not end there. Commercial free-to-air broadcaster e.tv brought a case against the next Minister of
Communications, Dina Pule (the third minister in rapid succession), who had backtracked on a decision that the
broadcasters operate their own DTT multiplexes (MUXs) and had instead centralised the operation of the MUXs in
35
Evidence for ICT Policy Action
the hands of state-owned signal distributor Sentech. The case was decided in e.tv’s favour, and the Minister withdrew
her appeal against the decision. Matters were delayed further by issues around allocation of MUXs and the number of
public channels necessary to cater to issues of language and diversity.
The decision was then taken to use the significant unspent USAF funds intended for disbursement by USAASA to
subsidise mid-level STBs for the poor. About 5million of the poorest TV-owning households will qualify for a 70%
subsidy from USAASA for their DTT STBs, which are expected to retail for between ZAR400 and ZAR700. The total
subsidy to be provided via USAASA for STBs currently stands at an estimated ZAR2.7billion (excluding distribution
costs). In 2012, around ZAR950million was allocated to USAASA from USAF funds (Odendaal, 2012). Also in 2012, the
DoC allocated ZAR1.8billion to Sentech for DTT transmission infrastructure rollout and for the costs of dual illumination
(analogue-digital simulcasting) of broadcaster signals during the migration period before analogue switch-off. Dual
illumination is expected to cost Sentech ZAR95million in 2012, ZAR106million in 2013 and in 2014, and ZAR107million
in 2015. The analogue switch-off date has repeatedly been postponed. Initially, in 2008, DoC policy called for switch-off
to be in November 2011. That deadline was then pushed to 2012, and then 2013, and now there is doubt that South
Africa will even be able to meet the June 2015 switch-off date it committed itself to.
Auctions
Although officially committed to technological neutrality, the regulator has been caught in a struggle between those
wishing to see the “digital dividend” spectrum – spectrum that becomes available at the conclusion of broadcast
digital migration – allocated in a way that would be optimal for WiMAX and those who believe a more efficient use
of the spectrum would be for LTE use. The broadcast digital migration processes have been so protracted that the
initial policy preference for WiMAX - in the belief that it would best be able to meet the needs of underserved rural
and remote communities – has now been overtaken by the claims for efficient use of spectrum and accessing of the
internet through mobile phones offered by the LTE fourth generation GSM technology. The spectrum in the 2.6GHz
band is ideal for high-density urban areas and would enable the next generation of broadband network based on LTE
to be rolled out. The 800MHz band can also be used for the rollout of an LTE network but, unlike the 2.6GHz band, it is
better suited to rural areas and this is clearly what ICASA is targetting (Gedye, 2012). Operators have been chomping
at the bit to launch LTE services since 2010, but the delays and about-turns by ICASA have prevented release of the
necessary spectrum. Until LTE, South African operators had led adoption of each generation of GSM on the continent,
and even in the world, from the initial introduction of first generation GSM services in 1993; but now they lag not only
more mature jurisdictions but also in many other African countries. LTE services are now offered in several African
countries, including Kenya and Namibia, well in advance of South Africa.
ICASA sought to respond early to the pressure to release spectrum for broadband services. ICASA initially published
regulations for spectrum-on-demand in November 2006, and South Africa took an important first step by announcing
plans to release 60MHz of spectrum at 800MHz and 190MHz of spectrum at 2600MHz (the new spectrum) for
broadband use. But the process stalled, and it was only two years later that ICASA called for comments, following
publication of its decisions on licensing of the remaining radio frequency spectrum in the 2.6GHz and 3.5GHz bands
in June 2008 (ICASA, 2008).
36
In 2009, ICASA put out an invitation to apply (ITA) for the 2.6GHz and 3.5GHz spectrum. The ITA outlined the process and
licensing framework and ICASA at the same time issued a Position Paper and draft regulations (ICASA, 2009). Hearings
took place in October 2009, and in May 2010, ICASA published the Regulations and issued a call for applications by 30
July 2010 (ICASA, 2010). The intention was to run an auction, but with a qualified requirement of 30% BEE ownership
Understanding what is happening in ICT in South Africa
as part of Broad-Based Black Economic Empowerment (B-BBEE) policy. However, timelines and details of the process
were excluded from the ITA. The Regulations were then challenged by operators and ICASA efforts came to naught.
After operators warned ICASA that it was opening itself up to possible legal action if it went ahead with its plans to
license the spectrum without waiting for the Minister’s policy direction, ICASA announced a delay in the licensing of
the high demand spectrum bands
Finally, in December 2011, ICASA unveiled its spectrum assignment plans, which signalled its intention to bundle
800MHz and 2.6GHz spectrum and to assign spectrum specifically for two wholesale networks. But these network
operators would not be allowed to re-sell these services in the retail market. Following criticism of the regulation, and
following the extensive lobbying of the DoC, the entire auction process was again withdrawn in 2012, six years after
the process first started.
In December 2012, ICASA reopened the issue of spectrum allocation in the bands, announcing a timetable that would
see new entrants being licensed for the new spectrum by the end of April 2013. However, the 800MHz spectrum
will be freed up only once the migration from analogue to digital television is complete – a completion which, as
mentioned in the preceding sub-section, is likely to occur in 2015 at the soonest.
The ongoing lack of direction on USO strategies may also have unintended consequences in the area of spectrum
allocation. In an attempt to fulfil its USO mandate, ICASA has included rollout obligations for licensees that require
a 70% geographic coverage within five years for licensees in both spectrum bands, 50% of which must be outside
of the main metropolitan centres of Gauteng, Cape Town, and Durban (where users, including high-end users, are
concentrated). Those players licensed for the 2.6GHz band will have to meet a 50% geographical coverage target
within four years (ICASA, 2012). ICASA proposes a mix of direct assessment and beauty contests rather than competitive
auctions - which are widely perceived as an efficient way to allocate spectrum. requires prospective licensees to cover
50% of the population of their district (in 3.5GHz) or the country (in 2.6GHz) within two years of their being awarded
the spectrum – failing which, the licensees would risk losing their spectrum. However, accompanying regulations state
clearly that ICASA will take away spectrum licences only if companies fail to achieve 50% of that target, i.e. just 25% of
the population. Critics have pointed out that this is likely to result in yet another failed USO intervention, as operators
will simply cover the more lucrative markets of Gauteng, Cape Town, Durban, and Port Elizabeth, which are already
well-served by infrastructure, to achieve the 25% target. This would mean that ICASA would not achieve its objective
of broadening coverage outside the metropolitan areas, nor achieve the more efficient allocative outcomes possible
through clearer-cut auction allocation methods.
The regulations have been criticised for failing to comply with international best practice. Dominic Cull from Ellipses,
and BMI-TechKnowledge’s Martin Roetter, in their submissions to ICASA, have argued that the fundamental problem
is the way ICASA has provisioned the spectrum (Cull, 2012; Roetter, 2012). The regulator had indicated its intention to
auction the spectrum off in single, 30MHz chunks, an approach which is well-suited to companies wanting to build
networks using WiMAX, but not those wishing to deploy LTE. Cull argues that what ICASA should have done with
the spectrum was shift the existing holdings in the 2.6GHz band, especially iBurst’s, so that the band could be used
for both WiMAX and LTE (Cull, 2012). The rules governing the 3.5GHz spectrum auction also only permit companies
with so-called “class” network licences — i.e. municipal licensees – to bid for 3.5GHz spectrum. Cull has pointed out
that there are 52 districts in South Africa, with two licences on offer per district, for a total of 104 licences. However,
there are only about 50 class network licensees in the country (Cull, 2012). In the wake of Altech’s 2008 court victory
against the Communications Minister, many of the smaller ISPs secured individual licences rather than class licences.
Spectrum
allocation has
been stalled by the
regulator ICASA
The latest spectrum
regulations have
been criticised
by the GSM
Association for not
being in line with
international best
practice
37
Evidence for ICT Policy Action
Few of these licensees have the resources for the ZAR70 000 non-refundable deposit and the refundable ZAR250 000
auction fee required to participate in the auction. With no guidelines from ICASA, there is considerable uncertainty
around the auction.
Based on recent studies linking the extension of broadband to economic growth, the GSMA concludes that the ICASA
proposals for assigning the new spectrum would lower the net present value of GDP by between ZAR450billion and
ZAR510billion over the period 2014 to 2025, when compared with assignment of the spectrum to existing operators
(which is what the GSMA bases its case on). The GSMA argues the ICASA proposals would reduce the net present
value of government tax revenues by between ZAR95billion and ZAR110billion, when compared with the base case.
The GSMA also argues for the economic benefits of moving from the ICASA proposals to the base case assignment
is equivalent to 500 000 additional jobs, at current South African wages (McLeod, 2012). Although the actual figures
can be contested on different base cases, they are indicative of the high opportunity costs of delaying the allocation
of high band spectrum which, arguably, with sufficient latitude in the licence for market self-correction (spectrumtrading), it would be less costly to allocate now even if not done in optimal fashion.
38
Understanding what is happening in ICT in South Africa
operators strong but Telkom weak
Fixed-line market
The instability within the sector has been caused, to a great extent, by the precarious position the incumbent, Telkom,
finds itself in as a result of government’s indecision about its future. Telkom’s share price has been in free fall since
selling off its stake in Vodacom, the liquidity from which was surprisingly not put into building out Telkom’s backbone
but, rather, into starting a new mobile operator in this highly entrenched market and attempting an expensive and
failed detour into subscription television – an attempt which accrued losses of over ZAR80million (Telkom,2010).
Telkom has also had to cover a ZAR7billion loss arising from its seemingly severely over-priced investment in Multilinks
in Nigeria.13
13 This figure was provided by the late Minister Roy Padayachie in response to questions in Parliament and a report from TechCentral
in July 2011. See TechCentral (2011).
39
Evidence for ICT Policy Action
Table 9: Telkom FY ending 31 March
FY2009
Subscribers
(thousands)
FY2010
FY2011
548
647
752
827
871
Internet all access subscribers
423
512
543
523
527
WiMAX subscribers
2.60
3.00
3.20
3.38
3.22
Fixed access lines
4 451
4 273
4 152
3 995
3 800
Postpaid – PSTN
2 769
2 625
2 552
2 499
2 427
Postpaid – ISDN channels
781
784
772
767
756
Prepaid
766
744
703
623
522
Payphones
135
120
125
106
95
17 668
16 818
7 643
7 743
9 501
8 591
10 237
10 801
Leased line facilities
2 051
1 963
Managed data network services
899
1 005
Data connectivity
5 339
5 595
Fixed subscriptions and connections
6 762
Fixed-line use
Key financial
indictors
40
FY2013
ADSL subscribers
Voice incl. Telkom Mobile
Revenues
(ZARm)
FY2012
Data incl. Telkom Mobile
10 699
EBITDA margin
32.9
30.3
26.9
20
Total revenue (ZARm)
36 433
38 305
33 879
33 668
33 119
Net profit (ZARm)
4 496
37 585
1 342
-90
-11 499
Total assets (ZARm)
85 771
56 819
54 347
52 568
41 636
Total liabilities (ZARm)
50 276
26 555
24 325
22 427
23 397
Shareholders equity (ZARm)
35 495
30 264
30 022
30 141
18 239
Return on equity
0.13
1.24
0.04
-0.00
-0.63
Share price end of March (end of day)
48.53
34.1
34.61
24.34
14.68
Market capitalisation (ZARm)
25 274
17 759
18 024
12 676
7 645
Number of ordinary shares in million
520.78
520.78
520.78
520.78
520.78
Shareholders equity divided by MC
1.40
1.70
1.67
2.38
2.39
Source: Telkom (2013) and previous annual reports
Understanding what is happening in ICT in South Africa
Telkom’s biggest drop in value came following the decision by Cabinet not to authorise a deal that would have seen
Korean Telecom (KT) buy out 20% of the ailing company for ZAR2.6billion. Telkom’s stock fell 12%, to ZAR20.20, after the
KT deal was rejected, wiping ZAR1.4billion off its market capitalisation. The share price dropped significantly again, 3.4%
to ZAR17.43, in August 2012, on news following the imposition of a ZAR449million fine by the Competition Tribunal for
Telkom’s abuse of its dominance in the telecommunications market between 1999 and 2004 (a period in which Telkom
was a monopoly provider of telecommunications facilities).14 Telkom’s share price fell a further 3%, and was trading
below ZAR16, after CEO Nombulelo Moholi’s resignation following the Minister withdrawing Ministerial proxy votes (in
the Telkom AGM) for reappointment of Telkom Board members. (This prompted the resignation of the Board chairman
and was followed by the announcement of the CEO’s resignation a few days later in November 2012.)
Telkom was fined
R449million for
the abuse of
its dominance
between 1999
and 2004
Telkom’s fixed-line results over the last five years reflect a service in decline. The number of residential users has continued
to decline due to mobile substitution. While postpaid fixed-line declined by 3.7% in 2010-11, prepaid declined by 3%
and public pay phones by 5.7% to 125 000 (compared to 158 000 public payphones in 2007) (Telkom, 2011).
2.38
35.5
30.3
25.3
30.1
30
1.70
2.39
1.67
Fixed mobile
substitution is
underway
1.40
18.2
18
17.8
12.7
7.6
FY Mar 09
FY Mar 10
Shareholders equity / MC
FY Mar 11
Shareholders equity ZARbillion
FY Mar 12
FY Mar 13
Market Capitalisation ZARbillion
Figure 11: Telkom shareholders equity (net assets) compared to market capitalisation
Source: RIA calculations based on Telkom (2013) and previous annual reports
Telkom’s fixed-voice revenue decline is affecting local, long distance, fixed-to-mobile and international call revenues.
Telkom increased fixed-line prices in August 2013, which will obviously not lead to higher revenues but only to a faster
fixed-to-mobile substitution and further decline of fixed traffic revenues.
14 The Competition Tribunal concluded that Telkom leveraged its upstream monopoly in the facilities market to advantage its own
subsidiary in the competitive VANS market. Telkom’s conduct caused harm to both competitors and consumers alike and impeded
competition and innovation in the dynamic VANS market. The Competition Commission had originally asked the Tribunal for the
maximum penalty of 10% of revenues which came to ZAR3.5billion, and which Telkom appealed and lost. In the meantime the
Commission had added further complaints against Telkom to its docket, but the Tribunal finally reached agreement with Telkom
(whose financial situation had become dire) on behavioural remedies and set in place the functional separation of Telkom with a
fine of only ZAR450million.
41
Evidence for ICT Policy Action
988
986
933
910
7,646
7,557
2,731
4,832
2007
725
7,409
6,452
5,181
495
5,121
2,252
2,030
1,805
1,588
4,076
3,634
1,365
3,205
2,836
2,409
2011
2012
2008
Local
2008
Long distance
2010
Fixed-to-mobile
International outgoing
Figure 12: Telkom fixed-line traffic revenues (ZARmillions)
Source: Telkom (2012) and previous reports
Neotel has been
running at a loss
since it officially
launched in 2006
Neotel has been running at a loss since it officially launched in 2006. However, the extent of the loss is unclear as
the company does not have a separate reporting system from its parent company Tata Communications. According
to reports by TechCentral and ITWeb, the company’s loss was an estimated ZAR1billion in 2010 and an estimated
ZAR1.9billion in 2011 (Brainstorm, 2012).
Mobile market
It is significant that none of the dire warnings from South Africa’s dominant operators about the negative impact of
reductions in MTRs have come true. The current key performance indicators of dominant mobile operators Vodacom
and MTN look better than those for previous years. In line with their pioneering role and market leadership in the
industry, these two operators have found new productive revenue streams through growing their data businesses
and their value-added services. For both companies, revenues and subscriber numbers increased in their most recent
financial reports.
MTN
MTN’s performance
has been positive
MTN South Africa’s prepaid and postpaid subscriber numbers increased in the eight quarters to the end of the financial
year ending March 2012 (FY2012). Postpaid average revenue per user (ARPU) figures declined while prepaid ARPU’s
were constant over the previous eight quarters – somewhat unexpected given the increased demand for data.
MTN revenues increased by 7% and EBITDA by 6.5% for FY2012 compared to 2011, while the EBITDA margin remained
constant at a high 35.2%. Data and SMS revenues increased 38% and 58% respectively. With evidence15 of significant
free message data service substitution for SMS, one would have thought that revenues from SMS would be in
decline. A possible explanation for the SMS revenue increase could be increased SMS use for machine-to-machine
communications and bulk SMSing. MTN reported 13.4million data users for FY2012.
42
15 RIA ICT Survey data 2011-12
Understanding what is happening in ICT in South Africa
MTN also increased its capital expenditure (CAPEX) in FY2012 to 15.5% of revenues, up from 10.6% in the previous
year. The CAPEX per subscriber increased from ZAR186 to ZAR253, indicating MTN’s confidence in the South African
telecommunications market and its expected returns from the market. The higher CAPEX is mostly attributable to
network extension and upgrading to 4G. Interestingly, MTN did not report on interconnection revenues and expenses
in its annual report for FY2012, something it had done for the previous seven financial years. MTN’s last reported
interconnection net revenues were positive.
17.3
15.8
16.2
3.4
3.6
3.7
Q12011
Q22011
Q32011
20.2
20.9
4.2
4.4
4.5
Q22012
Q32012
Q42012
18.2
18.7
19.3
3.8
4
Q42011
Q12012
Prepaid
Postpaid
Figure 13: MTN South Africa subscriber numbers in millions
Source: MTN (2012) and previous report
293.6
101.5
98.1
99.8
105.9
Q4 2011
Postpaid
Figure 14: MTN South Africa ARPU (ZAR)
Source: MTN (2012) and previous report
Prepaid
237.4
124
122
121
120
93.2
91.3
95.2
95.2
Q4 2012
135
241.6
Q3 2012
134
261.3
Q2 2012
131
267.2
Q1 2012
137
Q3 2011
273.2
Q2 2011
282.1
Q1 2011
299.4
Blended
43
Evidence for ICT Policy Action
Table 10: MTN South Africa for FY ending December
FY2009
Subscribers
(SIMs) in million
ARPU (ZAR)
MOU
FY2010
FY2011
FY2012
Prepaid
13.0
15.5
18.20
20.90
Postpaid
3.0
3.4
3.8
4.50
Total
16.1
18.8
22
25.4
Prepaid
100
112
106
95
Postpaid
365
329
273
237
Blended
145
152
134
122
Outgoing
64
71
69
70
Total (ZARm)
6 034
3 908
4 105
6 416
% of revenue
18.2%
10.9%
10.6%
15.5%
376
208
186
253
33 149
35 822
38 597
41 349
Data
2 475
3 638
4 646
6 409
SMS
2 021
2 490
2 641
4 176
Data incl SMS
4 496
6 128
7 287
10 585
Total (ZARm)
10 410
12 188
13 591
14 476
Margin
31.4%
34.1%
35.2%
35.2%
EBITDA / Subscribers (ZAR)
647.9
648.3
616.8
569.9
Interconnection revenue
7 271
6 568
5 924
Interconnection and roaming expenses
6 400
5 483
5 183
871
1 085
741
1 481
1 182
Implied minute prices ARPU/MOU (ZAR)
Capital
expenditure
per subscriber (ZAR)
Total (ZARm)
Revenues
EBITDA
Interconnection
(ZARm)
Net cash flow from interconnection incl. roaming
Net interconnect
Source: MTN (2012) and previous annual reports
44
Understanding what is happening in ICT in South Africa
Vodacom
Vodacom South Africa’s performance has been solid for the financial years ending in March 2010, 2011, 2012, and 2013.
Revenues have consistently grown, to ZAR58.6billion in the financial year ending March 2013 (FY2013). Its EBITDA
margin slightly improved by nearly one percentage point, while operating profits increased from ZAR16.7billion to
ZAR17.4billion in FY2013. Prepaid and postpaid subscriber numbers increased, as did traffic in terms of outgoing
minutes. Active16 SIM card numbers increased from 19.7 to 30.3million between 2010 and 2013. Vodacom’s voice traffic
increased while SMS traffic decreased, a trend that was to be expected given the availability of alternative forms of
texting via data services such as Whatsapp, Viber, Facebook, and Skype. Vodacom’s decreased prepaid and postpaid
MOU, lower voice revenues, and higher data revenues also indicate a clear trend – from voice to data connections – for
South Africa’s telecommunications sector.
Vodacom’s
performance has
been consistent for
the financial years
ending March 2010,
2011 and 2012
Vodacom has seen its profit increase while prices decreased in the more competitive environment created by the
reductions in MTRs - as reflected in the price benchmarks of the previous sections of this report and also in Vodacom’s
audited financial statements. Voice revenue divided by outgoing minutes declined from ZAR1.46 in 2010 to ZAR1.03
in 2013. Also, the implied price (ARPU divided by MOU) decreased overall despite an increase for postpaid subscribers.
(ARPU takes all revenue together, including interconnection and data revenue, and divides it by subscribers.) Vodacom’s
postpaid subscriber implied price increase is due to high data use.
Interconnect expenses for FY2013 were not published by Vodacom, with only the interconnect revenues made public.
The net impact of MTR reductions can thus not be assessed, as is also the case for MTN.
16 These are customers who had used services in the previous three months.
45
Evidence for ICT Policy Action
Table 11: Vodacom South Africa financials and key performance indicators FY ending in March
FY2010
Mobile voice
FY2012
FY2013
27 422
28 584
29 395
29 151
Mobile interconnect
8 075
6 755
6 062
4 916
Mobile messaging
2 716
2 962
3 143
3 027
Mobile data
4 614
6 180
7 639
8 882
50 431
53 371
56 932
58 607
Interconnect revenue as % of total revenue
16.0%
12.7%
10.6%
8.4%
Interconnect expenses ZARm
6 324
5 682
4 923
Net interconnect ZARm
1 751
1 073
1 139
Operating profit ZARm
14 763
15 522
16 671
17 640
EBITDA margin
36.8%
36.8%
37.3%
38.2%
Total
19.7
22.9
28.9
30.3
Prepaid
15.2
17.8
23.3
24.4
Contract
4.5
5.1
5.6
5.9
18 792
22 160
26 341
28 349
5 949
6 509
6 650
6 071
Mobile voice revenue / outgoing traffic
1.46
1.29
1.12
1.03
All
111
119
114
102
Prepaid
82
95
97
90
Postpaid
220
202
177
154
All
184
183
157
129
Prepaid
105
106
91
76
Postpaid
447
404
362
328
All
1.66
1.54
1.38
1.26
Prepaid
1.28
1.12
0.94
0.84
Postpaid
2.03
2.00
2.05
2.13
Revenue ZARm
Revenue total
Subscribers
(million)
Outgoing minutes (millions)
Messaging (millions)
Monthly MOU
Monthly ARPU
(ZAR)
Implied minute
prices (ZAR)
46
FY2011
Source: Vodacom (2013) and annual reports
Understanding what is happening in ICT in South Africa
Telkom Mobile
While Vodacom and MTN are improving their performances from year to year, and Cell C seems to finally be making
some gains in the mobile market, Telkom Mobile is struggling to get its business up and running. Telkom Mobile gained
active prepaid subscribers but lost postpaid subscribers in the financial year ending March 2013 (FY2013). At the same
time, postpaid ARPU dropped by 20%. These are clear signs that Telkom Mobile is struggling to gain a foothold.
Telkom Mobile is
struggling to find
sustainable growth
Telkom Mobile managed to expand its number of base stations by 29%, and sites by 45.3%, in FY2013. Of its sites, 651
were upgraded to carry LTE equipment. Currently Telkom Mobile offers amongst the lowest data prices for the highest
throughput in the areas where it is available.
It remains to be seen whether Telkom’s bundling efforts – offering fixed voice together with fixed and mobile data
services, will bear fruit. Fixed-line and fixed broadband access may become more attractive when combined with
mobile broadband at double or more the speed of ADSL (20 mbps compared to 1-10 mbps) and combined with the
convenience of mobility. At the same time, however, Telkom’s 3.8million fixed-line subscribers, many of whom are
business subscribers, and its 870 000 ADSL subscribers, may not provide Telkom Mobile with the leverage necessary
to compete with the dominant mobile players to whom many of its fixed-line and corporate customers are already
tied. Only time will tell whether Telkom Mobile will be able to attract a new customer base through Telkom’s bundled
services (on which Telkom Mobile piggy-backs), but the history of fixed services in South Africa does not bode well.
Table 12: Telkom Mobile financial performance extracted from Telkom SA financial reports
FY2012
Active subscribers
Infrastructure
FY2013
All
1.53
1.48
Prepaid
1.04
1.16
Postpaid
0.44
0.38
BTS
1 782
2 299
Sites
1 348
1 958
LTE sites
ARPU (ZAR)
Revenue (ZARm)
651
Blended
74.16
61.47
Prepaid
20.89
23.96
Postpaid
206.83
166.13
Mobile voice and subscription
524
484
Data
163
364
Mobile handset sales
319
435
1 200
1 283
Total
Source: Telkom (2013) and previous annual report
47
Evidence for ICT Policy Action
Cell C
Cell C’s aggressive
pricing has put
pressure on
dominant
operators
Cell C has in the past made a strong appeal for retention of asymmetrical MTRs in its, and Telkom Mobile’s, favour.
Without any transparency on Cell C’s financial situation, assessment of its viability within the current competitive
environment is impossible. This is something that the regulator will have to assess as it enters into its MTR review
in 2013. Cell C’s aggressive price reductions (outlined earlier) have certainly pressured the dominant operators into
reducing their prices, and the significant investment Cell C received from shareholders Saudi Augar17 suggests it
remains serious about growing the mobile market and eroding some of the market share of the dominant players.
Cell C says it has 11.5million customers, which constitutes about 17% of the market, and it has publicly targeted 25% of
the market as the share necessary for it to become a viable competitor. With Vodacom’s share of the market standing
at 44% (with more than 30million SIMs sold), and MTN at 37% market share (25million SIMs sold), Cell C will require a
supportive regulatory environment and considerable inventiveness.
Conclusions
The current
MTR and mobile
telephony pricing
remains high
in comparison
to other African
countries
Mobile pricing is
unlikely to decrease
without further
mobile termination
rate reductions
The MTR has finally been lowered sufficiently, as of March 2013, to result in pricing pressure on the dominant operators
Vodacom and MTN. While previously these two dominant players were able to ignore newer entrants’ efforts (Cell
C’s efforts in particular) to undercut them, Cell C and Telkom Mobile have more recently been able to attract pricesensitive consumers and force down the prices of the dominant operators. However, the current MTR – and therefore
pricing – remains high in comparison with other African countries surveyed in the RIA Pricing Transparency Index:
Prepaid Mobile. As outlined earlier in this report, South Africa’s cheapest prepaid mobile price from a dominant
operator is several times more expensive than the cheapest identified among dominant operators in the 46 African
countries monitored by the RIA Index, and magnitudes of scale more expensive in terms of the cheapest product from
any operator in a country before (where South Africa ranks 23rd out of 46 countries in the Index).
Amongst the best-performing African countries on mobile pricing are those which have introduced cost-based
MTRs. South Africa’s prepaid prices are unlikely to come down further until the MTR is reduced to the cost of an
efficient operator. Global and African benchmarking suggest that this cost is in the region of US$0.01 or US$0.02
(i.e. around ZAR0.10 to ZAR0.20 at the current exchange rate). This is less than half of the current MTR (ZAR0.40) in
South Africa.
The decline of voice services and the growth of data are having significant impacts on the development of the mobile
market. Voice and data subscribers are becoming increasingly difficult to distinguish between, as airtime is purchased
and converted for data use and, at the same time, data services are used to make voice calls. It will continue to be
necessary to understand and assess the competitiveness of markets, the market shares, and the success of players in
this converged environment. With data becoming the dominant revenue stream, this is where much of the pricing
pressure is occurring, as operators try to attract and retain broadband customers.
With the growing demand for data services, the South African regulator ICASA needs to enable operators to
respond to the changing nature of the business and to innovate and grow new services in response to declining
voice revenue streams.
48
Understanding what is happening in ICT in South Africa
Part two
Policy outcome 10: unaffordable access and suboptimal use
This section draws on the nationally representative RIA South Africa Household and Individual ICT Access and
Use Survey conducted in 2012 (see RIA (2012) for Survey methodology). The only demand-side survey of its
kind, it provides insights into not only the levels of access to ICTs but also the nature of use and the amounts
users are spending on ICTs. Importantly, the RIA 2012 ICT Survey also provides data on those marginalised from
services, the reasons for their non-use, and the willingness of individuals to pay for services they would like to
access. Because the RIA ICT Survey gathered extensive additional household information, including income and
expenditure, through a method that was nationally representative, the findings can be disaggregated into rural and
urban settings, on gender lines, and between users at the top of the pyramid (ToP) and the base of the pyramid
(BoP)17 – information that is simply not available from national supply-side data or demand-side surveys that are
not nationally representative.18
Table 13 : Summary of ICT access in South Africa from Census and RIA ICT Survey data
Census
2006
RIA
2011
2007
2012
Households with fixed line
18.5%
14.5%
18.2%
18.0%
Households with computer
15.6%
21.4%
14.8%
24.5%
Households with radio
76.5%
67.5%
77.7%
62.3%
Households with television
65.5%
74.5%
71.1%
78.2%
35.2%
4.8% (household)
15.0% (individual)
19.7% (household)
33.7% (individual)
88.9%
62.1%
84.2%
Households with internet
Cellphone ownership (household)
72.7%
Source: RIA ICT Survey data 2011-12, StatsSA (2011)
17 The BoP is a concept which draws on then-US President Franklin Delano Roosevelt’s notion that economic reconstruction after
the Great Depression required drawing on the resources of the “forgotten men” in order to develop new models of doing business
– new models that see the economic potential in the billions of people worldwide who live in poverty but are nevertheless
consumers of goods and services. The BoP idea was popularised by C.K. Prahalad in his 1998 book The Fortune at the Bottom of
the Pyramid (Prahalad, 1998) and the 2005 book Capitalism at the Crossroads by Stuart L. Hart (Hart, 2005). Hart focussed on the
capacity of people at the BoP as not only consumers but also producers. Subsequently, Ted London, in his paper “Reinventing
strategies for emerging markets: beyond the transnational model”, constructed a role for people at the BoP as business partners
and innovators.
18 The South African Census only measures household not individual use, so any household with at least one person with a mobile
phone able to access the internet is counted as a household with internet even if the person with mobile access may be out of the
home most of the day.
49
Evidence for ICT Policy Action
BoP here refers to individuals who are living on less than ZAR432 per month, which is in the National Development
Plan as the basic poverty line as defined by Statistics South Africa (NPC, 2011)19.
Household indicators
South Africa is highly electrified by global South standards, with even 85% of households in rural areas accessing
power from the national grid.
National
89.2%
Urban
90%
85.7%
Rural
Figure 15: Households with electricity
Source: RIA ICT Survey data 2011-12
Television and radio ownership and use
As indicated in Figure 16.75% of households surveyed by RIA state that they have a strong television signal and over
80% of households reporting that they receive a strong radio signal.
No reception
Weak
8%
8%
12%
17%
80%
Strong
76%
Radio signal
TV signal
Figure 16: TV/radio reception in South Africa
Source: RIA ICT Survey data 2011-12
Nearly 78% of South Africans 15 years or older surveyed by RIA stated that they watch television, of which 88% said
they are happy with the choice of programmes available. Programmes primarily watched by households include the
news (88.5%), entertainment (87%), and sports (68%). Over 56% of households watch health programmes and 56%
50
19 This figure is less than the US$2.5 per day figure (i.e. roughly ZAR25 per day, which is about ZAR750 per month) used by the
World Bank and other Bretton Woods institutions as the poverty datum line (see Calandro et al., 2012).
Understanding what is happening in ICT in South Africa
watch educational programmes. Despite digital migration being planned for completion by June 2015, only 14.6% of
households that watch television said they have heard about digital television. Thus, from a policy perspective, there
clearly needs to be awareness raised about digital migration and how it will affect consumers.
Table 14: Television access and use
National
Urban
Rural
Watching TV
77.7%
86.6%
63.3%
Happy with the choice of programmes
87.9%
86.9%
89.8%
Entertainment
86.9%
85.3%
90.5%
Educational programmes
56.1%
55.6%
57.2%
News
88.5%
88.1%
89.5%
Sports
67.9%
64.8%
74.5%
Health programmes
56.3%
57%
55%
14.6%
18.4%
6.0%
What do you watch?
Heard about digital migration
Source: RIA ICT Survey data 2011-12
Considering the extensive coverage and high uptake of television, it is not surprising to note, in Figure 17, that most
households watch television in the home and 44% of the households watching television spend more than four hours
per day watching, while 28% watch television between two and four hours per day and 21% between one and two
hours per day.
2%
97%
At home
At friend’s, relative’s, or neighbour’s home
Figure 17: Location where TV is watched
Source: RIA ICT Survey data 2011-12
Public places (bars or community halls)
Other
51
Evidence for ICT Policy Action
4% 4%
21%
44%
28%
Very irregularly
Less than an 1 hour
Between 1 and 2 hours
Between 2 and 4 hours
More than 4 hours
Figure 18: Number of hours spent watching TV per day
Source: RIA ICT Survey data 2011-12
Over 48% of households, when asked which programmes they would like to watch if there were more channels
available, stated that they would prefer more entertainment programming, while 41% stated they would prefer news,
and 37% said they want to watch more sporting programmes.
Entertainment
Entertainment,
sport, and news
programmes are
the most preferred
by TV viewers
27.6%
41.7%
Educational
News
24.3%
31.9%
Sports
Health
48.1%
26%
26.8%
39.3%
Same
41.3%
24.2%
46.4%
36.5%
24.3%
More
32.3%
29.4%
Much more
Figure 19: If there were more channels available, the kinds of programmes you would like to see more of
Source: RIA ICT Survey data 2011-12
52
Table 15 highlights some of the opinions of individuals aged 15 and older who watch television. Over 80% indicated
that television expands their thinking and understanding of the world. Over 70% stated that television connects them
to their country and community, and 72% stated that the content on television should be more relevant to their
community. These findings suggest that although a large number of households watching TV say they are satisfied
with the current choice of programmes, there is still a need to develop policies geared towards development of
programmes with more local content and/or community-based programmes (72% of respondents said content on
television needs to be more relevant to their community).
Understanding what is happening in ICT in South Africa
Table 15: Television viewing and preferences
Do not agree
Not sure
Agree
Television expands my thinking and understanding of the world
10.70%
6.30%
83.00%
I only watch satellite TV (e.g. DStv)
77.10%
2.20%
20.70%
I rely on TV for my education
61.40%
5.00%
33.65
TV connects me to my country and my community
17.50%
11.70%
70.80%
Programmes on TV are all boring and irrelevant to me
77.50%
11.40%
11.10%
I find TV programmes morally offensive sometimes
43.50%
11.90%
44.60%
I keep my TV on all the time and watch whatever is being broadcasted
79.40%
6.10%
14.50%
TV helps to find jobs by keeping me informed
73.20%
8.20%
18.60%
Content on TV should be more relevant to my community
20.10%
7.80%
72.10%
I could not live without TV
68.00%
4.60%
27.30%
I am hooked to soapies (TV series)
51.70%
4.50%
43.80%
I would like to have Pay TV (e.g. DStv) but cannot afford it
48.00%
3.30%
48.80%
Source: RIA ICT Survey data 2011-12
Among respondents without household access to TV, nearly 60% said they do not have access because they cannot
afford a TV set, while 44% stated that they cannot afford a TV licence (which currently costs ZAR265 per annum) and
35% stated that their house has no electricity.
Not interested
17%
House has no electricity
35%
Cannot afford a TV set
Do not have time to watch TV
59%
13%
Cannot afford TV licence
44%
Figure 20: Reasons for not having a television
Source: RIA ICT Survey data 2011-12
More than 55% of individuals aged 15 years and older said they listen to the radio and 73% said they own a
personal radio receiver. Of these radio listeners, 92% said they listen to music, 87% to the news, 65% to religious
programmes, 60% to programmes on local issues, and 59% to sports programmes.
53
Evidence for ICT Policy Action
Table 16: Radio access and use
National
Music, news
and religious
programmes
dominate radio
listening
Urban
Rural
Listening to radio
55.6%
56%
55%
Own personal radio
73.0%
73.9%
71.5%
Music
92.3%
93.5%
90.3%
Politics
40.2%
39.4%
41.5%
Educational
49.4%
52.4%
44.4%
Programmes on local issues
59.8%
57.9%
62.9%
Sports
59.4%
55.2%
66.2%
News
86.5%
86.8%
86%
Business
34.7%
35.2%
34%
Health
49.4%
53.75
57.5%
Religious
64.5%
62.85
67.5%
Main programmes
listened to
Source: RIA ICT Survey data 2011-12
There are similarities between the trends in radio listening and the trends seen above in TV viewing. Around 87% of
radio listener respondents said they listen to radio at home (see Figure 21), and 44% listen to the radio for more than 4
hours per day, 28% between two and four hours per day, and 21% between 1 and 2 hours per day (Figure 22).
2 2 4%
5%
87%
At friend’s/relative’s/neighbour’s
54
Using my mobile phone
Figure 21: Where radio is listened to
Source: RIA ICT Survey data 2011-12
Work 1 and 2 hours
While travelling (car)
At home
Understanding what is happening in ICT in South Africa
4% 4%
21%
44%
28%
Very irregularly
Less than an 1 hour
Between 1 and 2 hours
Between 2 and 4 hours
More than 4 hours
Figure 22: Average hours per day listening to radio
Source: RIA ICT Survey data 2011-12
Again, as was found among TV viewers, radio listeners feel that local content is very important, with 86% stating that
radio in their language is important to them. In addition, 60% stated that radio provides relevant health information,
and 57% mostly listen to music (see Table 17).
Table 17: Reasons for listening to the radio
Do not agree
Not sure
Agree
The radio provides me with relevant health information
28.8%
11.2%
60%
The radio provides me with useful information for farming
61.2%
17.1%
21.7%
Radio content in my language is important for me
11.4%
3%
85.6%
I only listen to news
87.2%
3.3%
9.4%
The radio helps me stay informed/find a job
68.3%
6.8%
24.9%
I mostly listen to music
38.4%
4.3%
57.2%
My radio is always switched on
76.1%
3.5%
20.4%
Source: RIA ICT Survey data 2011-12
Fixed lines
In the 2008 RIA South Africa Survey, 18.2% of households had a working fixed line. In the 2012 Survey, fixed-line access
at household level has declined slightly to 18%, of which 77.7% is prepaid and 22% postpaid, while 10.7% of the
households surveyed in 2012 indicated they had previously owned a fixed-line phone but do not have one at present.
In urban areas, 24% of households have a working fixed line, compared to only 5.8% in rural areas. Among households
55
Evidence for ICT Policy Action
Mobile is becoming
the preferred
method of
communication
without a fixed line, when asked the reasons for not having a fixed connection, 86.7% stated that they use mobile
phones instead (indicating that there is fixed-to-mobile substitution taking place), while 42.6% stated that fixed lines
are not available where they live, 42.4% stated that they do not have a sufficiently regular income, and 51.5% stated
that they simply cannot afford one.
Table 18: Household fixed-line access
National
Households with a working fixed line
Urban
Rural
18%
24%
5.8%
Prepaid
77.7%
38.8%
60%
Postpaid
22.3%
61.2%
40%
Households without a fixed-line phone that previously had one
10.7%
13.4%
6.2%
Source: RIA ICT Survey data 2011-12
Despite the higher penetration rate of fixed-line services in South Africa with other RIA survey countries, it is evident
that affordability remains a key challenge in South Africa. When asked how they would respond to a reduction in fixedline call costs, 47.7% of fixed-line users stated that they would make more calls and 28% stated that they would use
the money saved for something else.
End of payphones?
Public phone use is
dwindling
In countries with high mobile costs and poor fixed-line penetration, public payphones, which are generally cheaper
than other telephony options and can be used with small cash denominations, continue to be used and form a part of
wider communication access strategies by poorer users, even when they do own or can access mobile phone. There
has been a general decline in the number of fixed payphones in South Africa (in line with global trends), though there
was a modest increase in 2011 over 2010. Public phones are being used less and less as mobile penetration increases.
Table 19: Telkom statistics
2007
2009
2010
2011
CAGR
Fixed access lines (thousands)
4 642
4 533
4 451
4 273
4 152
(2.8%)
Postpaid PSTN
2 971
2 893
2 769
2 625
2 552
(3.7%)
Postpaid-ISDN channels
718
754
781
784
772
1.8%
Prepaid
795
743
766
744
703
(3.0%)
Payphones
158
143
135
120
125
(5.7%)
9.8
9.5
9.1
8.7
8.3
(4.1%)
5 275
5 250
5 349
5 345
4 863
(2.0%)
Fixed-line penetration rate (% of population)
Revenue per fixed access line (ZAR)
56
2008
Source: Telkom (2011) and previous annual reports
Understanding what is happening in ICT in South Africa
At the time of the survey in 2012, public payphone use (in the last three months) in South Africa stood at 28.7%. This
is lower than the public payphone use (in the last three months) at the time of the 2008 survey, which stood at 42%.
Despite a significant decline in the use of public payphones, there is evidence of frequent use amongst those who use
them, with 34% of users stating that they use public phones at least once a week, 30% every day or almost every day,
13% at least once a week, and 17% at least once a month.
13%
34%
7%
17%
30%
More than once a day
Less than once a month
At least once a month
Everyday or almost everyday
At least once a week
Figure 23: Frequency of public phone use
Source: RIA ICT Survey data 2011-12
The use of public phones is to some extent determined by their proximity to where people live. Nearly 10% of
respondents stated that the public phones they use are less than 10 minutes’ walk from where they live and 22.2%
stated that the payphone they use is between 10 and 20 minutes walking distance from their home (Figure 24).
6% 2%
22%
70%
Less than 10 minutes
10 to 20 minutes
Figure 24: Distance to public phone from home
Source: RIA ICT Survey data 2011-12
20 to 30 minutes
30 to 60 minutes
57
Evidence for ICT Policy Action
More than 56% of the payphone users said the primary reason for using public phones is that they are cheaper than
other options, and 21% stated that they are easier to use than mobile phones requiring airtime recharges (Figure 25).
Do not have a fixed phone at home
Affordability is a
key factor for public
phone users
6.9%
Do not have a mobile phone
10.5%
Use it because it’s cheaper
56.2%
20.6%
Easier than having to recharge airtime mobile
Difficulties charging the battery of mobile
0.6%
Other
5.3%
Figure 25: Main reason for using a public phone
Source: RIA ICT Survey data 2011-12
In Figure 26, it is shown that 62% of the payphone users stated that they use a telephone kiosk or umbrella operator
(using a mobile operator’s network), while 36% use a telephone booth (provided by a fixed-line operator).
35.9%
Telephone booth (fixed-line operator)
Telephone kiosk, umbrella operator
Other
62.3%
1.8%
Figure 26: The kind of public phone used
Source: RIA ICT Survey data 2011-12
Figure 27 presents the reasons cited by non-payphone users for lack of use of public phones. It is evident from the
reasons cited that mobile phone use is replacing the use of public phones, with 80% of non-payphone users stating
that they do not use public phones because they prefer mobile phones, 60% stating that public phones are not safe
to use at night, 58% saying that payphones are too inconvenient to use, and 57% citing the lack of privacy.
Too inconvenient to use
57.7%
Not safe to use at night
Too expensive
59.8%
17%
Lack of privacy
I prefer to use the household phone
I prefer to use the phone at work or at school
I prefer to use my mobile
58
Figure 27: Reasons for not using a public phone
Source: RIA ICT Survey data 2011-12
57.2%
21.4%
17.5%
79.7%
Understanding what is happening in ICT in South Africa
Broadband internet
The 2012 RIA Survey found that the total number of broadband internet users in South Africa is 34% of the total
population 15 years old or older. Table 20 demonstrates that wireless internet is the main type of broadband
connectivity at household level in South Africa. Almost 20% of South African households surveyed by RIA have internet
access, and of those, 56% get access to the internet via a mobile phone handset and 55% via a mobile modem. Only
22% of households with internet connectivity have a fixed-line ADSL connection. At individual level, 71% of South
African internet users use the mobile phone handset to browse the internet.
Internet use is
going mobile
Table 20: Internet access (household and individual)
Type of internet connection by
household with internet access
(multiple response)
Location for accessing the internet in
the last 12 months
Using mobile phone
56.4%
Mobile modem (3G)
54.8%
Wireless broadband
7.5%
Modem/ISDN dial-up
4.9%
ADSL
22%
Home
42.7%
Work
35.9%
Place of education
20.6%
Community internet access
9.8%
Any place via a mobile phone
70.8%
Any place via another mobile device
18.2%
Source: RIA ICT Survey data 2011-12
These internet penetration figures demonstrate that there is still significant growth opportunity, both in the ADSL and
broadband wireless markets. The number of Telkom ADSL subscribers increased from 751 625 in 2011 to 827 091 in
2012, while new WiMAX (provided by Telkom and Neotel) subscribers increased only marginally from 3 199 in 2011 to
3 381 in 2012 (Telkom, 2012).
548 015
647 462
751 625
827 091
412 190
255 633
2007
2008
2009
Figure 28: Fixed broadband internet (ADSL) subscribers
Source: Telkom (2012c)
2010
2011
2012
59
Evidence for ICT Policy Action
Wireless broadband subscribers exceeded ADSL subscribers by almost nine times in June 2011 (Vodacom, 2011), showing
that mobile internet is the preferred way to go online in South Africa. Although both Vodacom and MTN continue to
increase their postpaid internet customers, due to the high cost of mobile internet data, customers in South Africa rely
to a great extent on prepaid data bundles to go online. In FY2011, Vodacom’s active data customers (both prepaid and
postpaid) grew by 34.6% to 9million customers, and by 35% to 12.2million customers in FY2012 (Vodacom, 2011, 2012).
The total number of customers with active smartphones on the Vodacom network grew by 84% to 2.6million in 2011. In
2012, the number of active smartphones on Vodacom’s network grew by 55% to 5.1million (Vodacom 2011, 2012). The
growth in the use of smartphones has been a key driver of data revenue growth. MTN recorded 10.9million data users
(both prepaid and postpaid) in FY2011 which grew 13.4million by FY2012 (MTN, 2011, 2012).
Mobile ownership
There is a high
level of mobile
phone ownership
amongst the South
African population
Ownership of mobile phones (Table 21) is high in South Africa, with little difference between urban and rural areas
and between those in the general population and those at the BoP. Use patterns are similar between the national level
and the BoP population, except for use of smartphone features such as taking pictures, recording video clips, internet
access, and emailing (Table 22).
Table 21: Mobile ownership and use in South Africa
National
Rural
BoP
Mobile phone ownership
84.2%
86.3%
80.8%
74.8%
More than 1 active SIM card
14.2%
16.2%
10.9%
15.6%
Prepaid
87.5%
83.1%
95.1%
98.5%
Postpaid
12.5%
16.9%
4.9%
1.5%
Home
92.7%
95.0%
88.9%
82.6%
Shop
5.3%
2.3%
10.4%
15%
Work/school
1.0%
1.2%
0.7%
0.2%
Other
0.9%
1.4%
0.0%
2.2%
51.0%
60.3%
35.1%
33.2%
85.7%
86.4%
84.5%
79.1%
Daily
6.8%
6.5%
7.4%
8.1%
Once a week
1.3%
1.4%
1.3%
2%
Several times a week
1.6%
2.0%
0.8%
1.7%
Several times a month
0.2%
0.2%
0.3%
0.5%
Occasionally
4.4%
3.6%
5.7%
8.6%
Mobile phone main SIM card is
Mobile phone mostly charged at
Mobile phone is capable of browsing the internet
No
Do you share your mobile phone
with others?
60
Urban
Source: RIA ICT Survey data 2011-12
Understanding what is happening in ICT in South Africa
Table 22: What mobiles are being used for
National
Urban
Rural
BoP
Making and receiving calls
99.2%
98.9%
99.6%
99.4%
Missed call/please call me etc.
92.3%
90.3%
95.7%
96.8%
Sending and receiving text messages (SMS)
95.8%
94.9%
97.4%
96.6%
Personal organiser/diary/notebook/watch
71.1%
71.0%
71.5%
66.8%
Playing games
43.7%
43.4%
44.2%
42.8%
Listening to music/radio
43.0%
45.3%
39.1%
37.5%
Taking photo/video clips
54.9%
64.0%
39.2%
36.3%
Browsing the internet
27.6%
34.3%
16.1%
13.6%
Facebook/Twitter/Mxit/other social networking
25.4%
30.4%
16.6%
12.8%
Downloading applications to mobile phone
21.9%
26.2%
14.5%
11.1%
Transferring airtime
20.7%
23.9%
15.3%
10.2%
8.9%
9.7%
7.6%
6.1%
Reading and writing emails
16.7%
20.6%
10.0%
5.2%
International calls
13.8%
18.0%
6.6%
4.3%
Sending or receiving money
7.9%
8.6%
6.6%
3.6%
Roaming when abroad
4.6%
6.1%
2.2%
0.8%
Skype/VoIP
2.9%
3.2%
2.4%
0.5%
SMS to radio or TV programmes
Source: RIA ICT Survey data 2011-12
61
Evidence for ICT Policy Action
Safety
The mobile phone
is a key device in
terms of personal
safety and security
The mobile phone is considered an important device in relation to safety and security matters, with 71% of the mobile
owners surveyed saying they feel more secure and safe thanks to the mobile phone. Almost all the individual mobile
owners said they use the mobile phone to check on the safety of their loved ones, and 58% agreed that they use their
mobile to find out about safety issues and to alert people.
Table 23: Do you agree with the following statements based on your experience with having a mobile phone?
National
Do not agree
It makes me feel more secure/safe
Use it to find out about safety
issues and to alert people
Rural
BoP
20.1%
22.1%
16.6%
15.7%
8.7%
8.2%
9.6%
9.9%
71.2%
69.7%
73.9%
74.4%
Do not agree
5.4%
6.2%
4.0%
2.5%
Not sure
2.5%
2.7%
2.2%
4.8%
Agree
92.1%
91.0%
93.8%
92.7%
Do not agree
35.0%
36.3%
32.6%
34.5%
7.0%
6.9%
7.1%
8.7%
58.0%
56.8%
60.2%
56.8%
Not sure
Agree
Use it to check on the safety of
my loved ones and see where
they are
Urban
Not sure
Agree
Source: RIA ICT Survey data 2011-12
Affordability
Affordability
remains a major
obstacle to mobile
phone ownership
62
It was found that 67% of those without a mobile phone say they cannot afford one, and more than half (53%) of the
people who do not own a mobile phone had used a mobile phone in the preceding three months – mostly the
phones of other family members. About 24% of people without a mobile phone intend to get one within a year.
Understanding what is happening in ICT in South Africa
Table 24: Of those that do not have a mobile phone
National
I cannot afford it
Why do you not have a
mobile phone?
Do you plan to get a
mobile phone in the
future? If yes, when?
Rural
BoP
62.8%
59.5%
66.7%
70.4%
No mobile coverage where I live
1.5%
2.8%
0.0%
2.2%
No electricity at home to charge
the mobile phone
8.5%
10.4%
6.3%
12.6%
I don't have anyone to call
5.8%
7.9%
3.4%
4.7%
My phone is broken
28.7%
21.5%
37.0%
29.3%
My phone got stolen
17.5%
16.7%
18.5%
20.3%
53.2%
47.4%
59.8%
48.8%
Family member
65.3%
59.7%
72.0%
64.8%
Friends/colleague
23.1%
19.1%
27.9%
26.1%
Public phone on the roadside
16.5%
21.9%
10.1%
17.2%
No
42.3%
47.4%
36.5%
44.1%
Within the next 6 months
24.2%
25.0%
23.3%
20.3%
Within the next year
23.9%
20.6%
27.7%
26.9%
9.6%
7.0%
12.5%
8.7%
Did you use a mobile phone in the past three months? Yes
Whose mobile did you
use?
Urban
Within the next 2 years
Source: RIA ICT Survey data 2011-12
When asked how they would respond to a reduction in call costs, 43% stated that they would make more calls and
34% stated that they would use the money saved for something else. This suggests that there are further policy
interventions required in order to increase affordability and facilitate access to mobile services. However, it must be
noted that some operators have reduced their prices (as detailed earlier) since the RIA survey was conducted in 2012
and it will be important to see if these price reductions affect future RIA survey results.
Internet use and social networking
There has been a significant growth in the number of households in South Africa that have a working internet
connection. In the RIA Survey of 2008, 4.76% of households had a working internet connection. This has increased
significantly to 20% in the 2012 Survey. In addition, the use of the internet amongst individuals 15 years and older more
than doubled between the RIA Survey of 2008 and the Survey of 2012, from 15% to 34%. This rise in individual internet
use can to some extent be attributed to increased use of computers. As seen in Table 25, 65% of individuals stated
that they first used the internet on a computer. This suggests that there is a correlation between use of computers and
use of the internet. Meanwhile, 35% of households surveyed stated that the household first used the internet on a
mobile phone, and it was found that the mobile phone is the predominant means of household access to the internet,
with 70.8% of households stating that they access the internet via mobile phones. The use of the internet via mobile
devices is expected to increase as access to low-cost, internet-enabled devices increases.
65% of individuals
first used the
internet on a
computer
63
Evidence for ICT Policy Action
The mobile phone
is the predominant
means of internet
access
Unlike in countries with later onsets of widespread internet adoption, in South Africa the majority of individual internet
users (64%), a majority even at the BoP (52%), started using the internet on a desktop computer or laptop (Table 25).
As internet access increases through mobile access, this pattern can be expected to change.
Table 25: Internet access and use
National
Urban
Rural
BoP
Respondents that use the internet
33.7%
41.3%
21.4%
18.4%
Used the internet first on a computer
65.0%
64.2%
67.2%
52.5%
Used the internet first on a mobile
35.0%
35.8%
32.8%
47.5%
Any place via a mobile telephone
70.8%
70.5%
71.8%
70.7%
Home
42.7%
47.0%
27.7%
15.5%
Work
35.9%
37.6%
30.2%
6.5%
Place of education
20.6%
20.2%
22.0%
23.3%
Internet cafe
32.5%
30.2%
40.5%
40.5%
Are you signed up for any online social network (Facebook, Mxit, Twitter etc.)?
74.9%
78.9%
60.8%
52%
Do you have an email address?
65.9%
68.1%
58.4%
29.3%
Every day or almost every day
64.5%
67.0%
56.0%
44.6%
At least once a week
24.4%
23.5%
27.3%
28.3%
At least once a month
9.2%
7.1%
16.7%
27.1%
Less than once a month
1.9%
2.4%
0.0%
0%
20.4%
18.7%
26.2%
30.5%
8.4%
9.0%
6.3%
4.3%
The internet is very slow
24.9%
24.4%
26.4%
20.8%
Too expensive to use
37.8%
35.1%
47.2%
47.9%
Few people to communicate with via the internet
19.0%
20.5%
14.0%
21.8%
7.9%
7.7%
9.0%
7.3%
Somewhat concerned
12.3%
12.4%
11.9%
11.3%
Very concerned
48.5%
49.4%
44.2%
49.3%
Extremely concerned
31.3%
30.5%
34.9%
32.1%
Where did you use the
internet in the last 12
months?
How often on average have
you used the internet in the
last 3 months?
There is no interesting content for me
Lack of local language content
What limits your use of the
internet?
How concerned would
you be about security of
your credit card or banking
information when or if you
ever bought something on
the internet? Would you be?
64
Source: RIA ICT Survey data 2011-12
Not at all concerned
Understanding what is happening in ICT in South Africa
It was found (Table 25) that about 75% of individual internet users are signed up for a social network and 66% have an
email address. It was also found (Table 26) that the internet is mainly used for social networking and communication
purposes, and less for information-gathering, with 52% of individuals stating that they access social networking or
video-sharing websites daily. In addition, 36% stated that they send and receive email daily, and 34% of individuals
stated that they post information and use instant messaging daily.
Table 26: Purposes for which the internet is used on a daily basis
National Urban
Getting information about goods or services
10.2% 10.5%
Rural
BoP
9.0% 11.8%
Getting information related to health or health services
4.2%
5.1%
1.3%
2.6%
Getting information from government organisations
4.9%
4.3%
7.1%
4.1%
Interacting with government organisations
2.9%
3.6% 50.0%
0.0%
35.6% 37.4% 29.3%
9.2%
Sending or receiving email
Telephoning over the internet/VoIP
Posting information or instant messaging
3.3%
3.9%
1.2%
0.0%
33.7% 33.4% 34.6% 22.8%
Purchasing or ordering goods or services
3.2%
3.8%
1.3%
0.0%
Internet banking
3.8%
4.4%
1.6%
0.0%
Education or learning activities (formal)
9.8%
9.6% 10.6%
8.5%
Playing or downloading video games or computer games
12.7% 12.1% 14.7%
2.7%
Downloading movies, images, music, watching TV or video, or listening to radio or music
12.7% 11.6% 16.4%
2.7%
Downloading software
Reading or downloading on-line newspapers or magazines, electronic books
6.1%
10.7%
7.1%
2.7%
1.0%
9.7% 13.8%
4.4%
Participating in distance learning for an academic degree or job training
4.6%
4.3%
5.5%
1.0%
Getting information for school or university related work/Researching a topic
8.8%
8.9%
8.3%
4.6%
Looking for free education content, such as free courses
5.4%
4.9%
7.3%
5.7%
Collaborating online on documents (example Google docs)
8.2%
7.0% 12.4%
2.0%
Social networking or video-sharing websites (e.g. Facebook, Twitter YouTube, Mixit)
51.7% 51.5% 52.4% 35.9%
Finding or checking a fact/looking up a definition of a word
12.0% 10.1% 18.5%
Source: RIA ICT Survey data 2011-12
8.9%
65
Evidence for ICT Policy Action
The primary reason
for individuals not
using the internet is
their lack of access
to a computer
As seen in Table 27, 86% of individuals who do not use the internet stated that the primary reason is that they do not
have access to a computer, while 75% of non-users of the internet stated that they do not know how to use it, and
49% stated that they do not know what the internet is. Meanwhile, 60% of non-users of the internet stated that it is
too expensive, and 56% stated that none of their friends uses it. Among the policy implications is that the need for
targeted initiatives to raise awareness about what the internet is and its uses. (In some instances, it was evident that
there is a lack of understanding that social networking sites like Facebook are accessed via the internet.) From a policy
perspective, the limiting factors for use of the internet relate to affordability, access, speed, and availability of relevant
content. In addition, the price of computers remains prohibitively high, on top of high connectivity costs. The RIA
Survey also found evidence of unmet demand for internet access, with 52% of non-users of the internet, when asked
whether they would be interested in using the internet if it was available close to where they live, stating that they
would be interested.
Table 27: Reasons for not using the internet
National
Urban
Rural
BoP
I don’t know what the internet is
49.2%
38.9%
61.6%
65.2%
No interest/not useful
41.6%
43.6%
39.1%
34.1%
I don’t know how to use it
75.4%
67.3%
85.1%
85.8%
No computer/internet connection
86.2%
79.9%
93.7%
91.2%
Too expensive
60.2%
58.7%
62.1%
60.1%
No time, too busy
21.5%
23.6%
19.0%
20.1%
None of my friends use it
56.1%
47.7%
66.3%
66%
9.8%
9.0%
10.7%
10%
Is too slow, limited bandwidth
Source: RIA ICT Survey data 2011-12
Computer use
Table 28 shows that, in a multiple-response question, 44% of the computer users surveyed own their own desktop
computer and 35% own a laptop. A high number of computer users (61%) use computers at home, followed by 40%
who use computers at work, and 29% who make use of internet cafes. Writing letters and editing documents are the
most common uses of computers, done by 74% of the computer users, while 71% of the computer users stated that
they use computers to browse the internet.
66
The urban areas, as expected, show higher ownership and use of computers. The majority of the population at
the BoP relies on non-household access to use computers, with 43% using computers at internet cafes and 37%
using computers at schools and universities. There were similarities in patterns of use amongst individuals in rural
and urban areas, with the main activities being writing letters, editing documents, browsing the internet, and
playing games.
Understanding what is happening in ICT in South Africa
Table 28: Computer use
National
Urban
Rural
BoP
29.1%
34.5%
20.3%
12.8%
Work
40.2%
46.1%
24.0%
1.7%
School, university
22.8%
16.5%
40.1%
36.7%
6.1%
6.1%
6.2%
5.7%
At home
61.1%
72.3%
30.7%
34.7%
Internet cafe
29.0%
25.8%
37.7%
43.4%
At a friends place
20.7%
18.0%
28.3%
30.3%
Writing letters, editing documents
74.3%
80.7%
56.8%
62.2%
Calculations using spreadsheets such as Excel
53.5%
53.6%
53.3%
53.4%
Browsing the internet
71.4%
71.2%
71.8%
57.4%
Programming
35.3%
40.1%
22.3%
14.1%
Remixing content found online: music, videos
37.2%
39.8%
30.1%
40.7%
Playing games
62.3%
62.1%
62.6%
72.3%
Desktop
44.4%
49.8%
29.3%
20.9%
Laptop
34.6%
40.8%
16.8%
8.9%
31.47
33.01
27.26
24.57
24.8%
17.1%
45.7%
64%
Unpaid house work (e.g. housewife)
2.1%
2.5%
0.7%
1%
Retired
2.6%
3.4%
0.4%
2%
Unemployed
16.0%
15.6%
17.3%
28%
Employed
40.4%
45.9%
25.3%
5%
Respondents using a computer (desktop or laptop)
Where do you use a
computer?
What do you use a
computer for?
Do you own a personal
computer or laptop?
Library
Average age of computer user
Student/pupil
Main activity during past
six month of computer
users
Source: RIA ICT Survey data 2011-12
Gender
In Figure 29, it can been seen that little difference was found between the number of males and females who own
mobile phones, with about 86% of males and 82% of females stating that they own one. However, more males (59%) than
females (44%) stated that they have a mobile phone capable of browsing the internet, and more males use the mobile
phone to browse the internet (33%) and to access Facebook (29%) than women (at 23% and 22% respectively).
67
Evidence for ICT Policy Action
86.3%
82.4%
Own a mobile phone
58.8%
Mobile phone is capable of browsing the internet
Use mobile phone to browse the internet
Use mobile phone to access Facebook
43.5%
33%
22.8%
29%
22.1%
47.1%
40.7%
Use mobile phone to play games
Male
Female
Figure 29: Gender differences in ownership and use of mobile phones
Source: RIA ICT Survey data 2011-12
Figure 30 shows that more females (46%) than males (43%) stated that they own a desktop computer. However, more
males (39%) than females (29%) stated that they own a laptop.
46%
43%
39%
29%
Male
Female
Desktop
Laptop
Figure 30: Gender differences in ownership of a computer (desktop or laptop)
Source: RIA ICT Survey data 2011-12
68
It was found that a higher percentage of males (36%) than females (23%) uses a computer. Meanwhile, among
computer users, females are more likely (64.6%) than males (59%) to use a computer at home, and more females (31%)
than males (28%) use computers at internet cafes. More males (48%) than females (30%), among the computer users,
use a computer at work.
Understanding what is happening in ICT in South Africa
36.2%
Use a computer
23.1%
47.6%
Use computer at work
30.4%
22.3%
23.7%
Use computer at school/university
Use computer at library
3.8%
9.2%
58.5%
64.6%
Use computer at home
27.8%
30.6%
Use computer at internet cafe
Use computer at friend’s place
24.3%
16%
Female
Male
Figure 31: Gender differences in places where computers are used
Source: RIA ICT Survey data 2011-12
More males (40%) than females (29%) stated that they use the internet, as shown in Figure 32. Among internet users,
there are more males (72%) than females (57%) who first used the internet on a computer, while there are more
females (43%) than males (28%) who first used the internet on a mobile phone.
39.7%
Use the internet
28.6%
71.6%
Internet first used on a computer
57.2%
28.4%
Internet first used on a mobile phone
42.8%
Male
Female
Figure 32: Gender differences in use of the internet
Source: RIA ICT Survey data 2011-12
As shown in Figure 33, most males (71%) and most females (70.9%) were found to have primarily accessed the internet
via the mobile phone in the previous 12 months. More males use the internet at work (45%) and at home (46%) than
females (at 38% and 25% respectively). Meanwhile, more females access the internet via a commercial internet access
facility (36%) and place of education (22%) than male (at 30% and 20% respectively).
69
Evidence for ICT Policy Action
70.7%
70.9%
Any place via mobile phone
46.2%
Home
38.4%
44.5%
Work
25.4%
19.6%
21.9%
Place of education
Another person’s home
Community access facility
17.2%
10.8%
12.2%
6.8%
29.5%
Commercial internet access facility
Any place via other mobile device
36.3%
23.7%
11.5%
Male
Female
Figure 33: Gender differences in internet use (in the previous 12 months)
Source: RIA ICT Survey data 2011-12
Income and
education are the
key determinants of
ICT access and use
An analysis by Deen-Swarray et al. (2013) shows that income and education are key determinants of access and use
of ICTs. Accordingly, the gender gap increases as the technologies and services become more sophisticated and
expensive, requiring greater levels of income and education to access and operate. This is because the share of
women who are either unemployed or engaging in unpaid housework is comparatively large (in comparison to men),
which contributes to their comparatively lower earning capacity. The 2012 RIA ICT Survey analysis across the 12 study
countries found that on average, women earn comparatively less than men. On the matter of education, the gender
disaggregation of individuals in the 12 RIA Surveys found a gender gap in attainment at tertiary, secondary, and
primary education levels in most of the study countries. Fewer women than men have tertiary as their highest level of
education in most of the countries, and this difference is widest in Ghana, Kenya, Nigeria, South Africa, and Uganda.
In the secondary and primary school categories, the majority of the countries also have more men than women
completing these levels of education. Previous RIA modelling on education and ICT literacy indicates that the level of
exposure to ICTs required to be competent is typically only attained at tertiary education levels in Africa.
Informal businesses
70
The RIA South Africa Informal Sector ICT Access and Use Survey 2012 is nationally representative for informal businesses
located in residential or semi-residential areas. Commercially zoned areas were not surveyed as they are not covered by
the Stats SA Census sample frame. According to the survey results, very few informal businesses in South Africa maintain a
website (4%) even fewer have employees with email addresses (3%). Mobile phone ownership is slightly higher than that
of other ICT devices among informal businesses, as deduced from focus groups. Focus group participants also indicated
that they use a combination of SMS and voice on their mobile phones for business purposes.
Understanding what is happening in ICT in South Africa
A few of the businesses were found to use the internet to conduct business activities, and these businesses mainly
access the internet through their mobile phones. Most of the informal business people surveyed do not know how to
use a computer, and therefore would rather use the internet on their cell phones as they claim it is more convenient:
“I do everything on my phone and I can take it anywhere,” said one respondent. A challenge for some is availability of
internet-enabled mobile phones.
Table 29: ICT access and banking
Informal businesses
Mobile phone use
Use private mobile phone for business purposes
27.7%
Business has dedicated business mobile phone
5.2%
Business owner has both a private and a business mobile phone.
14.7%
Business sends text messages for business purposes
40.3%
Receive text messages for business purposes
21.4%
Business sends or receives money via mobile phone
Other ICT ownership
Business advertises via
Businesses that have
internet access
Access to bank account
0.8%
Computers
11,6%
Internet access
10.6%
Newspapers
4.4%
Twitter, Facebook
3.7%
Mobile phone SMS
2.6%
Radio
2.2%
Receive orders via internet
21.7%
Purchase products/services via internet
27.1%
Dedicated business account
20.5%
Private account for business purposes
17.8%
Pay myself (in person)
56.1%
Bank
24.4%
Most common means of Send cash with someone
sending and receiving
Western Union/Moneygram
money
13.7%
5%
Post Office
0.5%
Mobile money
0.4%
Source: RIA Informal Sector ICT Survey data 2011-12
Mobile phones are
the primary means
of communication
within the informal
business sector
71
Evidence for ICT Policy Action
Marketing and advertising of their products is mostly done by word-of-mouth or people walking past the business
location. A few of the businesses in the focus group discussions indicated that they use mobile applications, namely
WhatsApp, Mxit, BlackBerry Messaging, Twitter, and Facebook – not only to communicate with their customers and
suppliers but also to advertise their products and services. In fact, advertising is the most common business activity that
businesses use these applications for, and a major area which those not yet using the internet and mobile applications
would like to pursue. One of the participants described the benefits of using the internet: “One can advertise on
places like Facebook where you can put pictures of your designs and have people comment if they like it.” Another
participant, who currently distributes pamphlets as a way of advertising, claimed that “Facebook would also help you
save on the money you would use on pamphlets.” The use of online applications for marketing and advertising was
found to be most common among the participants engaged in hairdressing and in dress design and dressmaking
businesses, as they use these applications as platforms to post photos (e.g. of new hairstyles, or new in dress designs,
created by the business people). A few of the participants make use of Google extensively on their phones to search
for latest trends in relation to their businesses and also to check on prices in factories outside of the province (the
Eastern Cape) where the focus groups where held.
In the informal
business sector,
cash is the
predominant
means of
transaction
It was found that informal businesses conduct most of their financial transactions, with both their customers and
suppliers, through cash. The use of mobile money transfers is very limited. Most informal businesses do not have access
to formal banking and so would rather transact in cash. A small number of the focus group participants said they have
a bank account whilst others said they save money weekly through the Post Office or Shoprite (a supermarket chain),
but these instances were quite limited.
Table 30: Informal businesses’ methods of financial transaction (multiple responses)
With suppliers
Cash
With customers
94.8%
96.8%
Cheque
6.1%
4.4%
Credit card
4.3%
3.4%
Bank account transfer
9.0%
5.5%
Online banking
3.3%
4.2%
Mobile money transfers
1.0%
1.1%
Letter of credit
2.2%
1.2%
Western Union or MoneyGram
0.1%
0.4%
28.1%
25.8%
Business sends money with someone
RIA Informal Sector ICT Survey data 2011-12
72
In communicating with their suppliers and customers, over 90% of informal businesses prefer to do so in person,
face-to-face. Mobile phones are the second most common method used to communicate, with the informal business
owners that participated in the focus group discussions stating that they make use of voice and SMS to keep in contact
with their customers (mainly to make and confirm appointments and to place orders). Owners use voice particularly
when they want to request payment for goods and services rendered on credit, and also to inform a client when a
Understanding what is happening in ICT in South Africa
service has been completed or a product is available. The owners prefer voice in these situations, as it gives them an
immediate response from their customers. However, high cost prevents them from using voice at all times: “SMS is
cheaper during the day, but then at night after 8 it is cheaper to call,” said one participant.
93.7%
91%
34.6%
24.9%
13%
In person
Mobile phone
11.4%
Land line
Suppliers
9.2%
9.7%
6.8%
SMS
5.1%
Fax
5.4%
7.3%
Email
Customers
Figure 34: How informal businesses communicate with suppliers and customers
Source: RIA Informal Sector ICT Survey data 2011-12
Stock-taking and record-keeping are mostly done manually, and some of the participants find this a challenge as there
can sometimes be discrepancies and loss of information. One participant stated that “sometimes books are a problem
because they get rained on and you lose your information”, while another stated that “a small child can play with the
book when placed carelessly, thereby destroying vital information”. The informal business people make use of basic
features such as the calculator on their phones to calculate profit and also to give change to customers. Some of them
also use the document feature in their phones as a back-up to take orders from clients. “When I have orders I place them
in my phone so that if I were to lose my order book, I have a record in my phone,” said one participant. This evidence
suggests that an accounting application would assist informal businesses in generating and managing invoices and
tracking expenses. Another possibly suitable application is the Mcash mobile phone cash register application, which
allows product identities to be programmed into the system and maintains a record of sales. Applications such as
these could positively affect businesses’ efficiency.
It is likely that a few of these informal sector business people will move out of the sector to take up formal employment
and a few informal businesses will grow to become formal businesses. Therefore, there is potential value in finding
ways to enhance the ICT use in these businesses in their current state.
Most of the surveyed businesses would like to source information from the internet to learn how similar businesses
operate and to check and compare prices of products. The relatively low cost (compared to voice or SMS) of using
mobile phone applications – such as WhatsApp or BlackBerry Messaging Services – makes them attractive to informal
businesses: “With ZAR0.30 you can write everything you want to say and still have money left that you can use the
following day,” said one participant. Some of the surveyed business people believe that they can increase their
customer base through the judicious use of mobile applications. While most of the participants prefer to use their
phones, a small number prefer the computer because, as one participant said, “it has a lot [more] information and tools
than a cell phone does”. Though most of the participants are enthusiastic about using their mobile phones and the
internet for business purposes, at least two key challenges remain: a lack of data storage capacity on mobile phones
and the lack of knowledge about the capabilities of mobile phones.
73
Evidence for ICT Policy Action
Conclusions and recommendations
Despite the policy constraints on sector development and the associated regulatory bottlenecks, South Africa’s ICT
sector (in particular its mobile segments) remains dynamic. There has been significant growth in competition within
the broadband internet market, with mobile broadband connections far exceeding those of fixed broadband. This
competition, coupled with massively reduced international bandwidth prices as a result of competing undersea cables
landing in South Africa and breaking the SAT3 monopoly, has resulted in broadband pricing declining significantly.
Nonetheless, the cost of broadband access remains prohibitively high for most South Africans, with prepaid prices,
particularly for low-use bundles, being considerably higher than in other parts of the continent.
Fixed-voice services have continued to decline, but this decline in revenues has been offset by growth in data services.
Mobile services continue to thrive, although there has been a decline in ARPU. Mobile operators have managed to
offset the decline in mobile voice revenue by introducing targeted data offerings for both low- and high-end users. As
a result, data revenue now forms a significant part of overall revenue.
The supply-side data is confirmed by the demand-side data, which shows decline in the use of fixed lines and public
payphones, confirming that fixed-to-mobile substitution is taking place. The mobile phone is the primary method
of communication and, accordingly, there has been a growth in the use of mobile services. However, affordability of
services remains a major limiting factor to further growth of the mobile market. And a gender gap persists (men on
average are more advantaged than women) in access and use of the broad spectrum of ICTs, as a result of inequalities
in education and income.
Operators’ growth has outperformed the national growth rate of 3% and in some cases has doubled national growth,
suggesting that South Africa has a dynamic ICT market. This dynamism is despite a range of regulatory and policy
constraints impacting on the growth of the sector and the creation of competitive market segments. Legacy policy
and regulatory factors, resulting from the policy of managed liberalisation, continue to plague the sector. Despite
subsequent attempts to restructure the market through a horizontal licensing regime more suited to a converged
environment, and liberalisation of the sector by the courts, the market remains structured around vertically integrated
incumbents in the fixed and mobile market segments. These incumbents compete with downstream competitors
which have enjoyed little wholesale regulation to assist them to compete effectively. As a result, wholesale prices
remain high, making it extremely difficult for smaller players to compete and drive down prices or push up quality.
The possible exception is in the area of mobile termination rates. Although the MTR glide path initially seemed to be
too little, too late, the glide path’s completion in March 2013 does seem to have finally had a positive effect on retail
prices. Mobile late entrant Cell C adopted an aggressive pricing strategy and introduction of a flat rate of ZAR0.99 per
minute for national calls (and international calls to select destinations), which led to a subsequent decline in prices
by the incumbent operators in response to the price pressure and losses in subscribers. Nevertheless, the prices of
incumbent operators Vodacom and MTN remain higher than Cell C and newest entrant Telkom Mobile and these two
incumbents remain fully entrenched in the mobile market. Further, South African mobile prices remain high overall by
African standards, with South Africa’s lowest price from a dominant operator ranking only 26th out of 46 countries in
the RIA Pricing Transparency Index: Prepaid Mobile.
74
Network competition, in particular, has been negatively impacted by the Vodacom-MTN dominance of mobile
and by the second network operator Neotel’s difficulty in seeking to compete against Telkom’s dominance of the
fixed-line market. In addition to Neotel’s already-tenuous position being further undermined by the state’s decision
Understanding what is happening in ICT in South Africa
to introduce a state-owned broadband infrastructure company (Infraco), other private network investments also
lost momentum in the wake of the Infraco announcement - as operators awaited access to the promised pricecontrolled national broadband network. Infraco’s business case was, however, also seriously undermined – by the
delays to it being licensed and becoming operational - which led private operators to invest in their own broadband
infrastructure.
Stakeholder perceptions of the South African telecommunications policy and regulatory environment remain negative,
because of the aforementioned challenges and, in addition, delays in policy drivers (e.g. the absence of a comprehensive
broadband strategy); delays in the allocation of much-needed spectrum for advanced long-term evolution of technology
and advanced communication services; and delays in the migration from analogue to digital transmission of terrestrial
television. These policy and regulatory shortcomings have been compounded by the leadership and competency
crises in the Department of Communications and rapid turnover in the portfolio of Minister of Communications (with
five different Ministers serving between 2009 and the finalisation of this report in August 2013).
In addition to the long-term, inter-generational issues of weak education and weak (particularly ICT) skills in the country
(which also need to be addressed to some extent by education entities outside of the sector), demand stimulation
through ICT skills development is a core policy issue for the ICT sector. Likewise, the funding of, and incentivising of,
innovation and entrepreneurship in this sector also needs to be addressed in concert by the DoC and other arms of
government, chiefly the Department of Trade and Industry. The need for the state to coordinate cross-cutting issues,
and matters of ownership of state-owned enterprises, across different overly silo-oriented departments cannot be
emphasised strongly enough.
In addition to cross-sectoral issues, there are a number of policy and regulatory bottlenecks within the ICT sector,
particularly the bottlenecks underlying networks and services, that impact negatively on the growth and evolution
of the entire ICT sector and indeed the national economy as a whole. There is an urgent need for an integrated
strategy to implement the National Development Plan, which has articulated a vision for the ICT sector as a critical
economic infrastructure in South Africa. Specifically, the National Development Plan requires a broadband strategy
that addresses the low levels of broadband penetration and the needed speeds and quality of broadband access
in the longer term. An effective broadband strategy will require a restructuring of the ICT market to promote
competition; coordination of state enterprises and ICT across government; and a targeted universal service
(including e-literacy) strategy to deal not only with the gaps in the broadband market but also to address demandside stimulation of the market.
Likewise, there needs to be a review of the institutional arrangements for the sector, to ensure that the regulator
ICASA has the necessary autonomy and required competencies and resources to: enable effective regulation of the
dominant players in the market; adjust anti-competitive behaviour; and provide the regulatory certainty conducive to
the large investments required for development of ICT networks, services, applications and content.
National data for the ITU’s international ICT indicators, which inform most global ICT indices, need to be gathered
regularly by ICASA and published. The new Stats SA ICT Satellite Account needs to be updated regularly in order to
have current information on the value of the ICT sector in South Africa and its overall contribution to GDP. The DoC
needs to take responsibility for a regular demand-side survey of the sector to understand the real points of policy
intervention in terms of user needs, affordability and emerging trends. The institutional capacity of both the DoC and
ICASA to deliver on their mandates needs to be strengthened.
75
Evidence for ICT Policy Action
Critical outstanding policy issues that are hampering growth of the market include completion and implementation
of the broadcast digital migration strategy; allocation of spectrum to operators; and completion and implementation
of a policy on LLU.
For South Africa’s termination rates and associated retail rates to move up the African ladder of affordability, or even to
be among the top 10 in Africa, ICASA should reduce the MTR to the cost of an efficient operator. ICASA also urgently
needs to competitively allocate high-demand spectrum, so as to enable operators to respond to the changing
demand for mobile services, to build new revenue streams, and to grow new value-added services and applications
which can further drive demand.
The massive growth in mobile internet access, and in uptake of data services more generally, presents massive
challenges for operators with backhaul networks dimensioned for traditional voice traffic. While operators explore
feeding traffic off their networks onto the WiFi networks where available, public access to, at the least, public information
sites should be considered, e.g. sites in municipal buildings. However, the larger needs – a national backbone and
extensive broadband network to meet the demands of corporate and private citizens – require key policy challenges
to be addressed. Central to these challenges is the question of what to do with Telkom. The behavioural remedies
imposed by the Competition Commission on Telkom, through functional separation, are to be welcomed. If rigorously
monitored and complied with, these remedies could be far more beneficial to the sector than the large fine, which was
originally imposed for practices set in place under the previous stewardship of Telkom by SBC and Telekom Malaysia,
both of whom made super-profits and then withdrew.
The massive decline of the primary backbone provider Telkom – its value run into the ground through poor business
decisions and (when there was a possibility of a successful turn-around) political prevarication – does the country
no service. In the absence of effective policy or regulation to drive infrastructure competition or to build a national
champion in Broadband Infraco, a way needs to be found for the Telkom backbone to optimally service the ICT
industry. However, functional separation at Telkom (as required by the Competition Commission) will not, on its own,
achieve the necessary service provision to the sector. If functional separation is comprehensively implemented and
monitored, it will create a fairer competitive wholesale environment for service providers, but what this does is merely
(more rigorously, it is hoped), monitor, through regular reporting to the Competition Commission, the current
separation requirements between Telkom’s wholesale and retail functions. This separation was already required
through account separation and access regulation (which Telkom was found to have breached).
76
If South Africa is to catch up to broadband penetration levels in other lower-middle-income countries or leading
broadband countries in Africa, it will have to do something far more fundamental to the market structure. As policy
has historically constrained real infrastructure competition in order to protect Telkom and then Infraco (and stateowned broadcast signal carrier Sentech), the solution might be to institute a full structural separation of Telkom’s
backbone and retail services – i.e. bundle Infraco into the Telkom wholesale network as an open access network
to which all service providers, including a Telkom retail arm, would have independent access. This would change
the anti-competitive incentives inherent in Telkom as a vertically integrated entity which, despite liberalisation of
facilities provisioning, remains the main supplier to its downstream competitors. To maximise its efficiencies, Telkom
Wholesale would be incentivised to get as many service providers on its network at the same price as it is charging
Telkom Retail (or, if it is necessary for ICASA to intervene, at a regulated price). The competitive implications of this
arrangement for Neotel would obviously need to be carefully considered. But Neotel’s weak market presence, largely
as a result of the state’s failure to provide a pro-competitive licensing and regulatory framework to counter the
Understanding what is happening in ICT in South Africa
advantages of Telkom’s incumbency, is unlikely to change sufficiently through existing mechanisms such as LLU
or carrier pre-selection. Neotel is unlikely to be able, under current conditions, to present a competitive solution to
South Africa’s broadband crisis.
Exploring the option of Neotel’s incorporation into the aforementioned national open access network model, as part
of an ownership model more innovative than a state-owned or public company – e.g. the network could be owned by
those who make use of the facilities (much like undersea cable consortia operate) – might be a way of positively dealing
with the negative broadband policy outcomes confronting South Africa. Such a model could potentially overcome
concerns about the history of inefficiencies and political interference (as opposed to providing an enabling legal
environment and the necessary oversight and performance monitoring) associated with state-owned infrastructure
providers in competitive environments.
Specifically, the following regulatory bottlenecks require urgent attention if the growth of the ICT sector – and
particularly the mobile segment, which is the main conduit for services to the poor – is not to be further stunted.
If backbone competition is not feasible, consolidate state-owned entities, unbundle backbone elements, and
create an open access carrier network.
Enable resale of fixed broadband (ADSL), for it to become cheaper and compete with mobile broadband.
Ensure access to facilities at cost (including reasonable rate of return (ROR)) with favourable terms for co-location.
Coordinate and schedule rights-of-way access at national, provincial, and local levels.
Free up and release critical spectrum for wireless broadband use, through competitive evaluation and allocation
of spectrum, and coordinate spectrum re-farming and migration.
Encourage competition through service-neutral licensing and a cost-based interconnection regime.
Pay particular attention to data wholesale access, e.g. IP connect, peering, and transit fees.
Reduce costs and prevent unnecessary duplication through incentivising infrastructure-sharing.
Remove special taxes and duties on ICT equipment and services, in order to bring down prices, grow services,
and grow the general tax base.
Use existing unused USAF levies to build out network into underserved areas through reverse-bidding to
service areas and in support of demand stimulation strategies including e-skills development.
77
Evidence for ICT Policy Action
References
Coast to Europe (ACE) (2013), “Overview”, available at: tDepartment of Communications (DoC) (2010), webpage:
tAfrica
www.ace-submarinecable.com/ace/default/EN/all/ace_en/
http://www.doc.gov.za/.
the_project.htm (accessed 10 May 2013).
Department of Communications (DoC) (2013a), “Digital
tBarton, J. (2011), “South African spectrum auctions could tMigration Process”, available online: www.doc.gov.za/index.
freeze out major operators with new clause”, available at:
www.developingtelecoms.com/south-african-spectrumauctions-could-freeze-out-major-operators-with-new-clause.
htmlDocument1 (accessed 10 May 2013).
Telecommunications Authority (BTA) (2011),
tBotswana
webpage: http://www.bta.org.bw/.
tBrainstorm (2012). Vol. 11 Issue, 11, July.
S. (2013), “Lack of spectrum, high prices affecting
tBurger,
broadband access”, Engineering News, available at: www.
engineeringnews.co.za/article/lack-of-spectrum-high-pricesaffecting-broadband-access-2012-12-07 (accessed July 2013).
Report (2011), “5 telecoms to bid for prized spectrum”,
tBusiness
available at: www.iol.co.za/business/companies/5-telecos-to-
php?option=com_content&view=article&id=59&Itemid=136
(accessed May 2013).
of Communications (DoC) (2013b), [draft]
tDepartment
National Broadband Policy for South Africa, 3 April, Pretoria.
of Communications (DoC) (n.d.), “Digital
tDepartment
migration process”, available at: www.doc.gov.za/index.
php?option=com_content&view=article&id=59&Itemid=136
(accessed 10 May 2013).
(2013), “About EASSy”, available at: www.eassy.org/
tEASSy
about.html (accessed May 2013).
(2013), “ICASA allocates 800MHz spectrum to
tEEpublishers
Neotel”, available at: www.eepublishers.co.za/article/icasa-
bid-for-prized-spectrum-1.1013630 (accessed 10 October 2012).
allocates-800-mhz-spectrum-to-neotel.html
August 2013).
(accessed
regulatory constraints for broadband backbone rollout in
selected African countries”, in Special Issue: Connectivity and
Convergence: the Uneven Story of Africa. Emerald Publication.
za/article/2011-12-23-icasa-is-key-to-cheaper-broadband
(accessed 10 September 2012).
Research ICT Africa and Intelecon, Cape Town and Vancouver.
za/article/2012-02-24-digital-tv-migration-on-hold-again
(accessed July 2013).
20
J. (2011), “UCC to review interconnection rates”,
tBusinge,
(2013), “SEACOM trebles capacity”, available at: www.
tGadget
available at: www.independent.co.ug/ugandatalks/2011/11/
gadget.co.za/pebble.asp?relid=6081 (accessed May 2013).
ucc-to-review-interconnection-rates/ (accessed 28 July 2013).
L. (2011), “ICASA key to Cheaper Spectrum”, Mail
tCalandro, E. and Moyo, M. (2012), “Investment models and tGedye,
and Guardian, 23 December 2011, available at: www.mg.co.
L. (2012), “Digital TV migration on hold again”, Mail
tGedye,
E., Deen-Swarray, M., Gillwald, A. and Stork, C.
tCalandro,
and Guardian, 24 Februrary 2012, available at: www.mg.co.
(2012), Mobile Use at the BOP, Infodev report prepared by
M., Calandro, E., Sundaresen, S., Muckaden, S. and
tChetty,
Gillwald, A. (2005), “Good Intentions, Poor outcomes: Telecom
Feamster, N. (2013), “Investigating broadband performance tReform in South Africa”, Telecommunications Policy, Vol. 29,
t
78
in South Africa”, available at: www.researchictafrica.net/docs/
QoS_Policy_Paper_Draft_for_comments. pdf (accessed 4
September 2013).
Cloete, N. and Gillwald, A. (forthcoming 2013), “South Africa:
informational development in South Africa”, in Castells, M.
and Hinamen, P. (Eds.), Informational Development and the
Welfare State 2.0, Oxford University Press, London.
Issue 4, Elsevier, Pergamon, Amsterdam.
A. (2007), “Straddled Between Two Stools: Broadband
tGillwald,
development in South Africa”, Southern African Journal of
Information and Communication, LINK Centre, Witwatersrand
University, Johannesburg.
A. (2010), “Lower termination fees may spark telecoms
tGillwald,
turnaround”, Business Day, 17 October 2012, available at:
Commission of Kenya (CCK) (2010),
tCommunications
www.businessday.co.za/Articles/Content.aspx?id=126993
webpage: http://www.cck.go.ke.
(accessed 21 October 2012).
Regulatory Authority of Namibia (CRAN)
tCommunications
A. (2012), “Review of the Department of
tGillwald,
(2009), webpage: http://www.cran.na/.
Communications Colloquium on an Integrated National ICT
policy”, available at: www.researchictafrica.net/docs/ICT_
M. Gillwald, A. and Morrell A. (2013), “Lifting the
tDeen-Swarray,
colloquium_SA.pdf (accessed 21 August 2013).
gender veil on ICT indicators in Africa”.
Understanding what is happening in ICT in South Africa
A. and Stork, C. (2012), Mobile wholesale and retail
Communications Authority of South Africa
tGillwald,
tIndependent
price interplay: the somewhat contrary case of South Africa,
(ICASA) (n.d.), “Spectrum licensing framework”, available at:
t
(unpublished).
Gillwald, A., Moyo, M. and Altman, M. (2012), “Cloud computing
in South Africa: Prospects and Challenges”, in Cowey, P. and
Kleeman, M. (Eds.), Special Report on Cloud Computing and
Broadband in Emerging Markets, prepared for ITU (currently
unpublished).
(2011), ”African broadband download performance”,
tGoogle
available at: www.google.com.\publicdata (accessed 23
www.icasa.org.za/LegislationRegulations/
RegulationsUnderWay/WorkingdocumentsPendingProcesses/
Spectrumlicensingframework/tabid/261/Default.aspx
(accessed 29 August 2013).
Telecommunications Union (ITU) (2002), Measuring
tInternational
the Information Society, Geneva (accessed 10 August 2012).
Telecommunications Union (ITU) (2012),
tInternational
Measuring the Information Society, Geneva (accessed 10
August 2013)
August 2012).
problems, Prentice Hall, New Jersey.
south-africa-gazettes-ict-sector-code-for-bee/ (accessed 15
September 2012).
2013).
content&view=article&id=63737 (accessed 10 August 2013).
Call%20Termination/Regulations/Call%20Termination%20
Regulations%2033698.pdf (accessed 12 March 2012).
targets-2/ (accessed 15 September 2012).
S. L. (2005), Capitalism at the Crossroads: the unlimited tITnews Africa, (2012), “South Africa gazettes ICT sector
tHart,
code for BEE”, available at: www.itnewsafrica.com/2012/06/
business opportunities in solving the world’s most difficult
(2012), “ICASA reviews national frequency plan”,
tHumanipo
available at: www.humanipo.com/news/3014/ICASA- tITWeb (2013), “ICASA finally issues call quality report”,
available at: www.itweb.co.za/index.php?option=com_
reviews-National-Radio-Frequency-Plan/ (accessed August
(2008), “Manual of Instructions for conducting the
and Communication Technologies Authority
tLIRNEasia
tInformation
Telecom Regulatory Environment (TRE) Assessment”, available
(ICTA) (2008), webpage: http://www.icta.mu/home/.
at:
www.lirneasia.net/wp-content/uploads/2008/04/
Communications Authority of South Africa
lirneasia_tremanual_v21.pdf (accessed 1 September 2012).
tIndependent
(ICASA) (2009), webpage: https://www.icasa.org.za/.
T. (2004), “Reinventing strategies for emerging
tLondon,
Communications Authority of South Africa
markets: beyond the transnational model”, Journal of
tIndependent
(ICASA) (2010), “Independent Communications Authority
International Business Studies, Vol. 35, pp. 350–370.
of South Africa, Call Termination Regulations”, available
at:
www.icasa.org.za/Portals/0/Regulations/Regulations/ tMahlong, A. (2011), “USAASA misses targets”, SAITnews,
available at: http://saitnews.co.za/broadband/usaasa-missesCommunications Authority of South Africa tMail and Guardian (2011), “ICASA mulls four options for the
tIndependent
unbundling of the local loop”, available at: http://mg.co.za/
(ICASA) (2011), “ICASA provides clarity on Interconnection
Regulations”, (Practice note, 2 February), available at: www.
sabinetlaw.co.za/communications/articles/icasa-providesclarity-interconnection-regulations (accessed July 2013).
Communications Authority
tIndependent
Africa (ICASA) (2012), “Draft regulations
of South
on Digital
Terrestrial Broadcasting”, available at: www.icasa.org.
za/LegislationRegulations/RegulationsUnderway/
DigitalTerrestrial TelevisionDTT/tabid/567/ctl/ItemDetails/
mid/2174/ItemID/1318/Default.aspx (accessed 10 August
2013).
Communications Authority
tIndependent
Africa (ICASA) (2013), “Bitstream and
of South
shared/Full
loop access regulations”, available at: www.icasa.org.
za/LegislationRegulations/RegulationsUnderway/
LocalLoopUnbundlingLLU/tabid/540/ctl/ItemDetails/
mid/1753/ItemID/1686/Default.aspx (accessed: September
2013).
article/2011-06-22-icasa-mulls-four-options-for-unbundlingthe-local-loop (accessed 1 September 2012).
N. (2011), “Two more years of interconnect pain”,
tMawson,
ITWeb, 17 May 2011, available at: www.itweb.co.za/index.
php?option=com_content&view=article&id=43718:twomore-years-of-interconnect-pain&catid=118 (accessed 20
November 2012).
D. (2012), “How to fix SA broadband, Tech
tMcLeod,
Central” available at: www.techcentral.co.za/how-to-fix-sabroadband/33090/ (accessed 21 July 2013).
of Communications (2012), Presentation to South
tMinistry
African Communications Forum, 6 November, Johannesburg.
(2009), “Final audited results for the year ended 31
tMTN
December 2008”, pp. 14-15, available at: www.mtn.com/
Investors/Notices/Presentations/AR_presentation_2008.pdf
(accessed 20 November 2012).
79
Evidence for ICT Policy Action
(2010b), ”Integrated Business Report for the year ended
N. (2012), “Digital migration may lay platform
tMTN
tOdendaal,
31 December 2010”, available at: www.mtn.com/Investors/
for new content-rich broadcasting era”, Engineering News,
Financials/Documents/ar_integrated_report2010.pdf
(accessed 15 September 2012).
Annual Report (2011a), “Integrated Business Report
tMTN
for the year ended 31 December 2011”, available at: www.
mtn.com/Investors/Financials/Documents/ar_integrated_
report2011.pdf (accessed 15 September 2012).
(2012), “Final results for the year ended 31 December
tMTN
2011”, pp. 12-13, available at: www.mtn.com/Investors/
Notices/Presentations/presentation.pdf
November 2012).
(accessed
20
(2010), “ICASA commits to spectrum allocation
tMyBroadband
date”, available at: http://mybroadband.co.za/news/
wireless/11404-icasa-commits-to-spectrum-allocation-date.
html (accessed October 2012).
September 2012, available at: www.engineeringnews.co.za/
article/digital-migration-may-lay-platform-for-new-contentrich-broadcasting-era-2012-09-21 (accessed June 2013).
(n.d.), “Household promise index”, available at: www.
tOokla
netindex.com/promise/ (accessed 6 August 2013).
for Economic Co-operation and Development
tOrganisation
(OECD) (2006), “Revised OECD price benchmarking baskets
2006”, OECD, Paris.
for Economic Co-operation and Development
tOrganisation
(OECD) (2010), “Revision of the Methodology for Constructing
Telecommunication Price Baskets”, available at: www.oecd.
org/sti/broadband/48242089.pdf (accessed 1 September
2012).
for Economic Co-operation and Development
tOrganisation
(2012a), “Vodacom promo ended quietly”,
tMyBroadband
(OECD) (2011), OECD Communications Outlook, available
available at: http://mybroadband.co.za/news/cellular/57265vodacom-99c-promo-ended-quietly.html
November 2012).
(accessed
20
at:
http://dwmw.files.wordpress.com/2011/06/oecdcommoutlook-2011.pdf (accessed 20 August 2012).
of the Republic of South Africa (Parliament) (2007),
tParliament
(2012b), “LLU battle: Neotel prevails in the
tMybroadband
“Report of the ad hoc Committee on the Review of Chapter 9
first round”, available at: http://mybroadband.co.za/news/
adsl/50639-llu-battle-neotel-prevails-in-first-round.html
(accessed August 2013).
and Associated Institutions”, report to the National Assembly
31 July, Cape Town, available at: www.parliament.gov.za/
content/chapter_9_report.pdf (accessed 10 May 2013).
(2013), “New Telkom Prices kick in”, available
tMyBroadband
Infrastructure Coordinating Commission
tPresidential
at: http://mybroadband.co.za/news/telecoms/83273-new(PICC) (2012), “A summary of the South African national
telkom-prices-kick-in.html (accessed 4 September 2013).
Communication Authority (NCA) (2010), “NCA
tNational
announces New Interconnection Rate Regime For The
Period 2012-2014”, available at: www.nca.org.gh/73/34/News.
html?item=233 (accessed August 2013).
Development Plan (2011), “Vision 2030”, available at:
tNational
www.npconline.co.za/medialib/downloads/home/NPC%20
National%20Development%20Plan%20Vision%202030%20
-lo-res.pdf (accessed June 2012).
infrastructure plan”, available at: http://www.info.gov.
za/speeches/docs/2012/picc-presentation_120413.pdf
(accessed 23 August 2013).
C. K. (1998), The Fortune at the bottom of the pyramid,
tPrahalad,
Prentice Hall, New Jersey.
of South Africa (RSA) (n.d.), webpage: http://www.
tRepublic
gov.za/.
ICT Africa (n.d.), “Fair Mobile”, available at: www.
tResearch
researchictafrica.net/prices/Fair_Mobile.php (accessed 20
Institute of Communications in Mozambique (INCM)
tNational
August 2013).
(2010), webpage: http://www.incm.gov.mz/.
ICT Africa (RIA) (2012), Household and Small
tResearch
Planning Commission (NPC) (2011), “National
tNational
Business Access & Usage Survey, RIA Survey Methodology Brief,
Development Plan: Vision for 2030”, available at: www.
npconline.co.za/medialib/downloads/home/NPC%20
National%20Development%20Plan%20Vision%202030%20
-lo-res.pdf (accessed June 2012).
80
January, available at: www.researchictafrica.net/publications/
Research_ICT_Africa_Policy_Briefs/2012_Stork_-_ICT_
Survey_Methodology.pdf (accessed 15 December 2012).
ICT Africa (RIA) (2013), How do mobile and fixed
tResearch
Communications Commmission (NCC) (2009),
tNigerian
broadband stack up in SA? RIA Policy Brief South Africa No. 2,
webpage: http://www.ncc.gov.ng/.
July, available at: www.researchictafrica.net/docs/SA_Policy_
(n.d.), “Currency Converter”, available at: www.oanda.
Brief_2013_No_2_%20July2013%20final%20webversion.pdf
tOanda
com/currency/converter/ (accessed August 2013).
(accessed 20 August 2013).
Understanding what is happening in ICT in South Africa
(2011), “Rwanda to cut interconnection rates further”,
(2009), “annual”, “Vodacom Group Limited Annual
tRURA
tVodacom
available at: www.telecompaper.com/news/rwanda-to-cutReport for the year ended 31 March 2009”, available at: www.
t
interconnection-rates-further--827589 (accessed July 2012).
Song, S. (2010), “Open Spectrum for Development. South Africa
Case Study”, Association for Progressive Communications
(APC), October 2010, available at: www.apc.org/en/pubs/
research/open-spectrum-development-south-africa-casestudy (accessed March 2012).
vodacom.com/pdf/annual_reports/ar_2009.pdf (accessed 1
September 2012).
(2010), “annual”, “Group Annual Report for the year
tVodacom
ended 31 March 2010”, available at: www.vodacom.com/pdf/
annual_reports/ar_2010.pdf (accessed 1 September 2012).
(2011), “annual”, “Vodacom Integrated Report
tVodacom
for the year ended 31 March 2011”, available at: www.
African Communications Forum (SACF) (2009),
tSouth
vodacom.com/pdf/annual_reports/ar_2011.pdf (accessed 1
webpage: http://www.sacomforum.org.za/.
September 2012).
South Africa (StatsSA) (2011), Census 2011, Pretoria,
tStatistics
available at: http://www.statssa.gov.za/Publications/P03014/ tVodacom (2012), “annual”, “Vodacom Annual audited
financial statement for the financial year ending in March
P030142011.pdf (accessed 21 August 2012).
2012”, available at: www.vodacom.com/pdf/annual_results/
South Africa (Stats SA) (2013), webpage: http://
presentation_2012.pdf (accessed 7 June 2012).
tStatistics
beta2.statssa.gov.za/.
(2013), “annual”, “Integrated report for the year
tVodacom
A., & Benjamin, P. (2000), “Review of Universal Service
ended 31 March 2013“‘, available at: http://vodacom.
tStavrou,
Agency: Department of Communication”, unpublished report.
onlinereport.co.za/vodacom_ir_2013/wp-content/themes/
Stork,
C.
(2011),
“Mobile
termination
benchmarking:
the
case
tof Namibia”, Emerald Group Publishing Limited, Vol. 13, No. 3, vodacom/downloads/Full_online_financials_Vodacom_
IR_2013.pdf(accessed 19 August 2013).
pp. 5–31.
Group Plc (2007), “The economics of mobile prices“,
tVodafone
available at: www.vodafone.com/content/dam/vodafone/
C. (2012), “The Mobile Termination Rate Debate in
tStork,
about/public_policy/policy_papers/public_policy_series_7.
Africa”, Emerald Group Publishing Limited, Volume 14 Issue
t
4, ISSN: 1463-6697, available at: www.emeraldinsight.com/
journals.htm?issn=1463-6697 (accessed September 2012).
Tanzania Communications Regulatory Authority (TCRA) (2007),
Determination on Review of Telecommunications Network
Interconnection Rates in the United Republic of Tanzania, issued
in 2007, Interconnection Determination No. 2 Issued in 2007,
available at: http://www.tcra.go.tz/images/Press%20Release/
determination2_of_07_1.pdf (accessed 19 August 2012).
(2011), “Telkom lost R7bn from Multi-Links –
tTechCentral
Padayachie”, available at: www.techcentral.co.za/telkom-lost-
pdf (accessed 20 November 2012).
(n.d.), “List of African countries by GDP (nominal)”,
tWikipedia
available at: http://en.wikipedia.org/wiki/List_of_African_
countries_by_GDP_%28nominal%29 (accessed 10 May 2013).
Economic Forum (WEF) (2013), “Global Information
tWorld
Technology Report”, available at: www3.weforum.org/docs/
WEF_GITR_Report_2013.pdf (accessed 20 June 2013).
Information and Communications Technology
tZambia
Authority (ZICTA) (2010), webpage: http://www.zicta.zm/.
r7bn-from-multi-links-padayachie/24825/ (accessed on 4
September 2013).
(2011), “South African regulator reintroduces
tTelecoms.com
controversial
spectrum
allocation
requirements”,
available
at:
www.telecoms.com/26155/south-africanregulator-reintroduces-controversial-spectrum-allocationrequirements/ (accessed October 2012).
(2011), “Integrated annual report 2011”, available at:
tTelkom
https://secure1.telkom.co.za/apps_static/ir/pdf/financial/
pdf/TelkomAR_2011.pdf (accessed 20 November 2012).
(2012), “Telkom annual audited financial statement for
tTelkom
the financial year ending in March 2012”, available at: https://
secure1.telkom.co.za/apps_static/ir/pdf/financial/pdf/Annual_
Results_Presentation_2012.pdf, (accessed 7 September 2012).
81
ISSN: 2310-1156
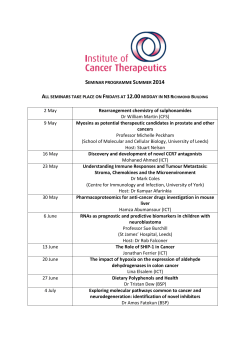


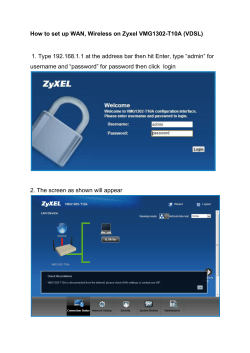
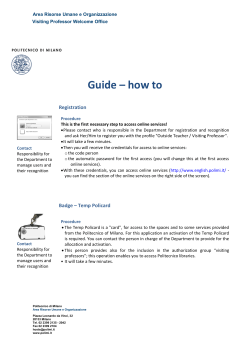
© Copyright 2026