
Urban-rural Income Disparity and Urbanization: What is the Role of... Distribution of Ethnic Groups? A Case Study of Xinjiang Uygur...
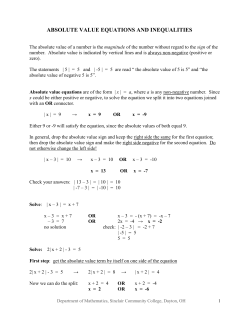
Urban-rural Income Disparity and Urbanization: What is the Role of Spatial
Distribution of Ethnic Groups? A Case Study of Xinjiang Uygur Autonomous
Region in Western China
Huhua Cao
Department of Geography,
University of Ottawa, Canada
60 University St. (030)
Ottawa, Ontario
Canada K1N 6N5
[email protected]
Tel: (613) 562-5800 ext. 1043
Fax: (613) 562-5145
Anwaer Maimaitiming
Life and Environmental Sciences Institute,
Xinjiang Normal University, China
Abstract: Since the end of the 1970s, economic reforms in China have revamped the
urban economy, which brought about a considerable increase in urbanization levels
across China.
In addition to this spectacular urban development, China has
simultaneously faced dramatic increases in regional inequality, particularly with respect
to urban-rural income disparity. China is indeed becoming a polarized society – a
phenomenon which is at the heart of a multitude of serious problems that are threatening
sustainable development in the country, as well as social cohesion. This threat is of
particular importance to the regions where minorities represent a considerable proportion
of the population, such as in Western China. Using the example of the Xinjiang Uygur
Autonomous Region in Western China, our research clearly demonstrates the dominant
role of the spatial distribution of minorities in explaining urban-rural income disparity, an
issue which has not been well documented in the existing literature on the subject. The
spatial distribution of ethnic minorities reflects not only their spatial segregation, but also
the degree of their socioeconomic exclusion from the majority. As the income gap
between the minority and majority population increases, the inclusion of minorities in the
country’s economic reforms is becoming increasingly critical for the future development
of China.
Keywords: urban-rural income disparity, urbanization, spatial distribution, ethnic groups,
Xinjiang, Western China
Urban-rural Disparity and Urbanization in Xinjiang
1
INTRODUCTION
Since the end of the 1970s, economic reforms in China have revamped the urban
economy, which brought about a considerable increase in urbanization levels across
China (Perkins 2002). The urban population in China rose from 18% in 1978 to over
36% in 2000. In addition to this spectacular urban development, China has
simultaneously faced dramatic increases in regional inequality. Continuously growing
coastal-inland and urban-rural gaps have been particularly worrisome (Tsui 1991; Chen
and Fleisher. 1996; Jian, Sachs and Warner 1996; Tsui 1996). These coastal-inland,
urban-rural gaps reflect the two dimensions of societal polarization in China, as is usually
the case in any typical core-periphery spatial organization (Li and Li 1996; Cao, Zhao
and Losier 2000; Ma 2003; Zhang and Kanbur 2005). Of these two dimensions, the
urban-rural gap is the primary cause of increasing regional inequality, and the gap has
been broadening, particularly during the last decade (Chang 2002). In 1978, the national
urban-rural income ratio was 2.57. It decreased to 1.82 in 1983, then increased rapidly to
2.79 in 2000 (Figure 1). This polarized development is at the heart of a multitude of
serious problems that are threatening sustainable development in China, as well as social
cohesion in Chinese society (Cole 1987; West and Wong 1995). In fact, the increasing
gap in social development has the potential to reduce the trickle-down effect of economic
growth. The gap can also lead to greater social instability, which in turn could have
negative impacts on economic growth (Zhang and Kanbur 2001).
Current inequality and poverty levels within China are among the most significant social
and economic issues currently threatening social stability in the country, and undermining
the effects of an astounding economic growth (Wang 2006) which alone cannot guarantee
equal distribution of wealth among the population (World Bank 2001, 2003, 2004).
Although the widening inequality gap has attracted a great deal of attention (Kanbur and
Zhang 2005; Park, Wang and Cai 2006), there continues to be a lack of analytical
research focussing on the sources and causes of this rising inequality. Among the
potential factors contributing to the rising inequality, the literature has suggested
globalization, decentralization, policy biases, urbanization, and factors pertaining to
geographical or other resources.
In China, urban studies have only begun in the last decades, but have already been well
documented in the literature (Goldstein 1990; Fan 1999; Lin 1999, 2002; Chung and Lam
2005). Urbanization, generally defined by the proportion of the population living in
urban areas, is closely related to regional productivity and infrastructure availability,
which vary greatly from region to region, and which affect regional per capita income,
and consequently urban-rural inequality. The relationship between the urbanization
process and income disparity has been emphasized by a number of studies based mainly
on the Kuznets model. Kuznets (1955) proposed an inverted U-shaped relationship (also
called a Kuznets curve) between urbanization and income levels measured by the average
income between urban and rural sectors. He concluded that urban-rural disparity would
generally increase at the beginning of the urbanization process, as the population moved
away from the rural sector to the urban sector in search of higher urban incomes;
Urban-rural Disparity and Urbanization in Xinjiang
2
gradually the income disparity would decrease as the population, receiving higher
incomes, settled down in the urban sector.
Source: Xinjiang Statistical Yearbook 2001, China Statistical Yearbook 2001(Xinjiang Tongji Ju
(Xinjiang Statistics Bureau) 2001; Zhongguo TongjiJu(China Statistical Bureau) 2001)
Figure 1 Difference in urban-rural income ratios between Xinjiang and the national average
in China, 1978-2000.
Theoretically, as the experience of developed countries has shown, urbanization results in
the narrowing of urban-rural inequality. It does so by generating a labour flow geared by
urban-rural wage differences, as argued by Todaro (1969), who suggested that the rate of
migration flow is determined by the difference between expected (not actual) urban
wages and rural wages. Todaro’s model, which has a “forward-looking” aspect in the
anticipation of expected future income (Seeborg, Jin and Zhu 2000), explains rural-urban
migration even in cases where the real urban wage is actually lower than the rural real
wage. Since its formulation Todaro’s rural-urban population migration model has
become a foundation of urbanization models in developing countries, revealing the
causes and characteristics of human migration (Brueckner and Zenou 1999).
Unlike other developed countries, China has not followed Kuznets’ principles. The
Hukou policy indeed restricted the mobility of rural labour. According to Adelman and
Sundings (1987), the pattern of economic inequality from 1952 to 1978 was, in fact, an
inverted-U curve. Xue (1997) has since found that economic reform following that
period, from 1978 to 1995, reversed the trend, forming a U-shaped curve. Lu, Chen and
Qin (2004) suggest that urbanization in China might have two opposite effects on urbanrural inequality. The inverted U-shape effect is true for China only when the three largest
cities, Beijing, Tianjin and Shanghai, are excluded from the analysis; urbanization does
not, otherwise, have any significant effect on the income gap. This might be explained
by the findings of Henderson (2003), who argued that any deviance from optimal
Urban-rural Disparity and Urbanization in Xinjiang
3
primacy (percentage of the total urban population of a country that corresponds to the
largest city of that country) particularly overconcentration, has a significant cost in terms
of economic growth and equality (Lanaspa, Pueyo and Sanz 2003). Lu, Chen and Qin
(2004) suggest additional reasons as to why China has not followed the Kuznets curve:
richer rural areas are the first to become urbanized, and their residents are more likely to
be able to pay for urban Hukou (urban registration), afford higher education for their
children, and have a greater chance of finding formal jobs in cities. Xue (1997) also
notes that high per capita income of urban workers and the availability of multiple
subsidies, coupled with restrictions on migration from rural to urban areas, explain most
of the differentials in urbanization effects.
Wu and Perloff (2004) indicate that China, even after two decades of accelerated
urbanization, could still maintain a high level of income inequality for an extended period
of time because the urban sector may not be able to absorb the large surplus of rural
workers. Therefore, the Kuznets curve will not be fully observed in China. Similar
results were obtained in the study of influential inequality factors in China by Wang
(2006), who has concluded that urban and rural functions only mathematically follow the
characteristics of the Kuznets curve, with the decreasing phase of the curve evading firm
estimation. He also noted that both labour migration and urbanization ratios were
insignificant, speculating that it could have been due to their opposite short- and longterm effects on inequality, as hypothesized by Kuznets.
Chen (2002) examined the correlation among the following variables: per capita GDP,
urbanization levels, and the urban-rural income gap, using Chinese provincial data from
the year 2000. He observed a negative correlation between the income ratio and the level
of urbanization among China'
s provinces, a result also documented by Wu and Perloff
(2004). Chen’s study confirmed several tendencies in the urbanization-disparity
relationship: 1) the regions with a higher per capita GDP and with higher levels of
urbanization, such as Jiangsu, Zhejiang, Liaoning, Shanghai, Beijing and Tianjin, have a
narrower urban-rural income gap; 2) provinces and autonomous regions with a lower
urbanization level, such as Tibet, Yunnan, Guizhou, Shaanxi, Qinghai and Gansu, usually
have higher urban-rural income disparities. It can be understood, consequently, that
urbanization contributes to the reduction of the urban-rural income gap.
The findings of available literature on the subject however, are not applicable to Xinjiang.
As shown in Table 1, Xinjiang in 2000 ranked 13th in GDP growth and 17th in
urbanization rate respectively of the 31 provinces in China, but it ranks 4th in terms of the
urban-rural income gap. In 1978, the ratio of urban-rural income in Xinjiang was 2.68,
slightly higher (4%) than the national average (Figure 1). Since the beginning of the
1990s, the difference between national and Xinjiang income ratios has been increasing
substantially. In 2000, the urban-rural income gap reached 3.6 in Xinjiang – nearly 30%
higher than the national average. This unexplained particularity of Xinjiang raises a
question: what makes Xinjiang an exception, especially considering other provinces in
Western China such as Tibet, Qinghai and Gansu, which have similar natural
environmental and socioeconomic conditions? In other words, why does Xinjiang have
such a high level of urban-rural disparity, while it enjoys relatively high urbanization?
Urban-rural Disparity and Urbanization in Xinjiang
4
Table 1 Income and development disparities among China's provinces, 2000.
Provinces
Rank
Urbanization
rate (%)
36.22
Rank
GDP per capita
(yuan)
7039
Rank
China
Urban-rural
income ratio
2.79
Tibet
4.84
1
18.93
31
4483
29
Yunnan
4.28
2
23.36
29
4559
27
Guizhou
3.73
3
23.87
28
2818
31
Xinjiang
3.6
4
33.82
17
7087
13
Shaanxi
3.55
5
32.26
20
4607
26
Qinghai
3.47
6
34.76
16
5088
20
Gansu
3.44
7
24.01
27
3838
30
Chongqing
3.32
8
33.09
18
5143
19
Guangxi
3.13
9
28.15
22
4500
28
Sichuan
3.1
10
26.69
25
4814
24
Ningxia
2.85
11
32.43
19
4725
25
Hunan
2.83
12
29.75
21
5732
17
Anhui
2.74
13
27.81
23
5075
21
Gaungdong
2.67
14
55
4
11180
7
Inner Mong.
2.51
15
42.68
9
5896
16
Shanxi
2.48
16
34.91
15
4985
22
Hainan
2.46
17
40.11
13
6587
15
Shandong
2.44
18
38
14
9409
9
Hubei
2.43
19
40.22
12
7757
11
Henan
2.4
20
23.2
30
5550
18
Jiangxi
2.39
21
27.67
24
4838
23
Jilin
2.38
22
49.68
7
6675
14
Fujian
2.3
23
41.57
10
11293
6
Heilongjiang
2.29
24
51.54
6
8818
10
Hebei
2.28
25
26.08
26
7545
12
Liaoning
2.27
26
54.24
5
11017
8
Beijing
2.25
27
77.54
2
17936
2
Tianjin
2.25
28
71.99
3
16277
3
Zhejiang
2.18
29
48.67
8
12906
4
Shanghai
2.09
30
88.34
1
27187
1
Jiangsu
1.89
31
Source: adapted from Chen, 2002, p.408.
41.49
11
11539
5
To date, still little is known about the relative importance of potential factors contributing
to urban-rural inequality (Wan 2007). Few of the assertions stated above have been
substantiated by empirical evidence. Nevertheless, it is clear that urban-rural disparity is
considerably higher in Western China, where the proportion of minority populations is
the highest in the country (Xue 1997). Ethnic inequality is of great concern, because of
the impact it could have on China’s economic development and societal stability.
Urban-rural Disparity and Urbanization in Xinjiang
5
Most of the existing research on income disparity has focused primarily on the coastal
regions of China and has generally received attention from economists and political
scientists. Both types of social scientists have argued that income disparity between urban
and rural areas have followed ethnic patterns in Xinjiang. That is, the Han Chinese,
among whom a greater proportion of households are economically privileged, tend to be
located in the most economically well-off areas of the province, namely the northeastern
part of Xinjiang. Ethnic minorities, on the other hand, among whom a greater proportion
of individuals are socio-economically poor, are located in the economically backward
areas, namely the southwestern part of the province. From an economic perspective,
urban-rural disparities are closely linked to the ethnic division of labour that characterize
Xinjiang. While ethnic minorities tend to have control over the primary sector of the
province’s economy, the Han Chinese are predominantly involved in the secondary and
tertiary sectors. Oil and gas production for instance, has been managed by PetroChina
(Wiener, 2004), that is a company owned by Han Chinese. Moreover, tertiary industries
such as telecommunications and transport have been managed by the state or the private
sector, mostly composed the latter ethnic group (Wiener, 2004). From a political
perspective, scholars have argued that urban-rural inequalities that take ethnic forms have
increased as a result of attempts by the state to ensure stability in the area. In encouraging
the Han Chinese to migrate to and settle down in Xinjiang for business or economic
development purposes, the central authorities were also trying to change the demographic
balance of the area, and protect the autonomous region from any socio-political
instability caused by some ethnic minority groups mobilizing for greater autonomy
(Mackerras, 2003).
While income disparity in Xinjiang has been studied from an economic and a political
perspective, it has rarely been studied from socio-cultural and geographic perspectives,
even less so in Western China. The socio-cultural and geographic contexts are, however,
extremely important because culture, environment and identity are all closely interlinked
(van de Walle 2003). These contexts manifest themselves very differently across China
due to the highly concentrated nature of spatial distribution of minority populations in
China’s western region. Minorities constitute only a small fraction (approximately 8%)
of the Chinese population, but in some autonomous regions of the west, including
Xinjiang, minorities are numerically predominant.
Minorities tend to live in disadvantaged and physically unfavourable regions of high
altitudes. These regions often lack infrastructure and human resources in the agricultural
sector – a situation that affects the human capital and household characteristics of
minorities, and results in their slow economic development (Borooah, Gustafsson and Shi
2006). Gustafsson and Shi (2003) found that the national minority-majority gap in
average per capita income in China almost doubled as a result of the coastal preferential
policies implemented between 1988 and 1995, reaching an alarming value of 35.9% in
the latter year. Borooah, Gustafsson, and Shi (2006) note that in 1995 the estimated
probability of being poor in the western region was 5 to 7 points higher for ethnic
minorities than for the Han majority. The association between minority status,
geographic location and income cannot be denied, but the extent to which the cultural and
Urban-rural Disparity and Urbanization in Xinjiang
6
geographic context of Xinjiang has contributed to the urban-rural income gap remains
unclear and requires clarification.
Applying the geographic approach, this paper examines the possible links between the
spatial patterns of ethnic group distribution (mainly Han vs. minorities in Xinjiang) and
the high urban-rural income disparity in the context of urbanization. It also explores the
possible determinants of the high urban-rural income disparity in Xinjiang. The paper is
divided into four sections. The paper first traces the alarming situation of urban-rural
income disparity in Xinjiang over the last decade. Second, it presents the data and
variables of the analysis method used. Third, it discusses the regression results. Finally,
it offers a brief conclusion, including a summary of the main findings and suggestions for
further research.
THE DISQUIETING SITUATION OF URBAN-RURAL DISPARITY DURING THE LAST DECADE
Located in Northwest China, Xinjiang has been defined as the Uygur Autonomous
Region since 1955. It is one of five provincial-level administrative minority autonomous
regions in China1. Both Mandarin and Uyghur are the official languages of the province.
Xinjiang is bounded on the west and northwest by Tajikistan, Kyrgyzstan, and
Kazakhstan; on the north by Russia; on the northeast by Mongolia; on the east by the
provinces of Gansu and Qinghai; on the south by Tibet; and on the southwest by
Afghanistan, Pakistan and India. Based on historic migration, the total population of
Xinjiang has grown from 2.1 million in 1900 to nearly 20 million in 2000.
Numerous ethnic groups make up 60% of the total population in Xinjiang. Concentrated
mainly in the southwest, the largest ethnic group, the Uygur, represents 46% of the
population. Members of the Han nationality, which accounts for only 40% of the total
population, reside mostly in the northern part of the province. Other ethnic minority
groups – Kazak (7.03%), Hui (4.44%), Kirgiz (0.85%), Mongolian (0.85%), Tajik
(0.22%), Xibe (0.21%), Manchu (0.12%), Uzbek (0.08%), Russian (0.06%), Daur (0.03%)
and Tatar (0.02%) – spread north and south from the northern and western border region
(Figure 2). The cohabitation of these multiple ethnic groups in Xinjiang gives the region
a very rich cultural heritage and creates a unique landscape.
It is important to note that ‘ethnic minorities’ in the context of China are defined as
nationality groups. Stalin’s definition of a ‘nation’ is used as the main reference to define
a ‘nationality’ in China. His interpretation is based on the ‘four commons’ characterizing
a nation: “community of language”, “community of territory”, “community of economic
life, economic cohesion”, and “community of psychological make-up” (Stalin 1942).
The definition of a ‘nationality’, according to Stalin’s definition of a ‘nation’, can be
interpreted accordingly: a “historically constituted, stable community of people, formed
on the basis of a common language, territory, economic life, and psychological make-up
manifested in a common culture” (Mackerras 2003).
1
The other four minority autonomous regions are Guangxi Zhuangzu, Ningxia Huizu, Tibet and Inner
Mongolia.
Urban-rural Disparity and Urbanization in Xinjiang
7
Legend
Xinjiang
Xinjiang
Northern
Uygur
Eastern
Other Minority
Southern
Beijing
Han
Lanzhou
Western China
Kazak
Uygur/Han/Kazak
MONGOLIA
Kazak/Han
Kirgiz
Urumqi
Uygur/Han/Kazak
> 50%
> 80%
Han
Tajik
Uygur
> 90%
Gansu
> 50%
INDIA
0
100
200 Km
Projection: Regional Conformal Projection (China)
Software: ArcGIS 9.0
Source: Xinjiang Census 2000
Tibet
Qinghai
Jing Feng
Department of Geography
University of Ottawa
May 25, 2007
Figure 2 Spatial distribution of different ethnic groups in Xinjiang, Western China2.
After more than twenty years of impressive economic growth, Xinjiang faced increasing
urban-rural disparity, particularly after the beginning of the 1990s. The rapid increase in
disparity continued until the mid-1990s, when the urban-rural income ratio reached its
peak. This intensification phase was followed by a period of relative stability. The
average ratio in 1990 was only 1.98, while in 2000, it was nearly two times higher: 3.61
(Xinjiang Tongji Ju (Xinjiang Statistics Bureau) 1991, 2001). The growth of urban-rural
disparities characterized by geographical variations is illustrated in Table 2 and Figure 3.
In 1990, only 4 southwest counties representing 5% of the total counties in Xinjiang were
in the highest category of urban-rural income ratio (> 3.61); by 2000 the number of
counties in this ratio range had increased to 27, representing more than 30% of the total
counties in Xinjiang. Twenty-six of those counties were located in the poor southwest
minority region, particularly Uygur, Kirgiz and Tajik ethnic communities (see the bottom
left corner of Figure 3a). The 27th county is located in the east, but is also an Uygur
community. The polarization of Xinjiang’s urban-rural disparity is clearly manifested in
these regions.
2
Notes: The region with an Uygur population proportion greater than 50% is considered the Uygur Region;
the region with a Han population proportion greater than 50% is considered the Han Region; other specific
regions are shown on the map.
Urban-rural Disparity and Urbanization in Xinjiang
8
Table 2 County-by-county classification of urban-rural income ratio
in Xinjiang, 1990 and 2000.
Urban-rural income Ratio
1990
2000
Difference
> 3.61
4
27
+ 23
2.80 ~ 3.60
13
10
-3
< 2.79
70
50
- 20
Source: adapted from the Xinjiang Statistical Yearbook 1991 and 2001(Xinjiang Tongji Ju (Xinjiang
Statistics Bureau) 1991, 2001).
Note: 2.79 is the national average urban-rural income ratio: and 3.61 is the average ratio for Xinjiang in 2000.
In 1990, 11 of the 13 counties in the middle income gap range (2.80 to 3.60) were located
in the southwest part of Xinjiang, and only the remaining two in the north (Figure 3b). In
2000, however, 7 of the 10 county rankings in the middle category were located in the
southwest of Xinjiang, and three in the north. In 1990, nearly 70 counties (including 13
county-level cities) were classified in the lowest income gap range (<2.79). More than
half were concentrated in the northern part of Xinjiang, six in the east, and 26 in the south.
By 2000, the number of counties in the lowest range of income disparity had decreased
by nearly 30% to 50. Compared to 1990, 20 counties (including 3 cities) moved up into
middle and higher income gap disparity ratio ranges, with 17 of them located in
southwest, two in the east, and only one in the north.
Overall, larger income gap counties were concentrated in the southwest, while smaller
income gaps were found mainly in the northern part of Xinjiang, especially in the
economic belt on the northern slope of Tianshan Mountain 3 (Figure 3c). Due to its
superior geographical location, healthier natural conditions, and better infrastructure, this
region includes nearly half of Xinjiang’s cities and has the highest level of economic
development in the province. The education level of the population in the economic belt
is also higher than in any other part of Xinjiang.
Most of counties in the southern region differ greatly from the rest of Xinjiang in terms of
socio-economic environment. Their economy is almost exclusively based on agriculture,
with employment concentrated mainly in the primary sector. It is important to highlight
that, despite a 47% share of the total population of Xinjiang, only 19.76% of the total
urban population is located in this region. Located in a remote border area, the south also
accounts for most of the minority counties and key poverty-stricken regions. Until very
recently, this region had only one quarter of the total number of cities in Xinjiang. In
these counties and cities, minorities account for more than 90% of the total population.
Twenty of its 25 counties, the prevailing majority, are designated by the government as
“poverty-stricken counties”.4
3
The northern economic belt includes Urumqi city (Capital of the province), Urumqi county, Changji city,
Miquan city, Fukang city, Karamay city, Shihezi city, Kuytun city, Wusu city, Shawan county, Hutubu
county and Manas county.
4
In order to use poverty relief funds in a planned and organized way, and to effectively aid the poor, the
Chinese government has formulated a standard for key poverty-stricken counties to be aided by the state,
and has identified a number of such ‘poverty-stricken’ counties. The standard for the key poverty-stricken
Urban-rural Disparity and Urbanization in Xinjiang
9
2000
c
Difference of Urban-rural Income Ratio between 2000 and 1990
Northern Tianshan
Economic Belt
Northern Xinjiang
Urumqi
Income Ratio
<= 2.79
2.80 - 3.60
a
Eastern
Xinjiang
1990
>= 3.61
Southern Xinjiang
Ratio Difference
<= 0.00
0.01 - 2.79
b
0
150
Projection: Regional Conformal Projection (China)
Software: ArcGIS 9.0
Source: Xinjiang Statistical Yearbook 1991, 2001
300 Km
>= 2.80
Jing Feng
Department of Geography
University of Ottawa
May 25, 2007
Figure 3 Spatial distribution of the urban-rural income disparities in Xinjiang, 1990 and 2000.
It seems as though counties with substantial concentrations of ethnic minority groups are
more affected by urban-rural income inequality than those populated primarily by the
Han nationality. What is the exact role of spatial distribution of minorities in Xinjiang’s
urban-rural disparity? Taking into account the new minority concentration explanation
variable, what are the roles of other independent variables such as government
investment, illiteracy rate, urbanization level and migration rate? A multiple regression
analysis was applied to answer these questions.
DATA MEASUREMENT AND METHODS
Tsui (1993) concluded that rural-urban inequality is the major component of county-level
regional inequality in China. We therefore chose the small geographical unit of the
county for this study. The county is a basic administrative unit in China. In Xinjiang
there are 87 counties, including 19 county-level cities5. Cities usually have both urban
and rural populations, and counties have both towns and small cities, as well as a rural
population. The data utilized for this research was obtained from the Xinjiang Census
1990 and 2000 (Xinjiang Renkou Pucha Weiyuanhui (Xinjiang Census Committee) 1992,
counties, defined in 1986, identified counties with a yearly net income of less than 150 yuan per peasant in
1985 as belonging to this group. The standard was subsequently adjusted over the years in accordance with
economic development and the constant improvement of economic conditions of the poverty-stricken
(State Council, 1994).
5
There were 19 cities in Xinjiang in 2000. Two of them were district-level cities, while 17 were countylevel cities. For reader convenience, we refer to all 19 as county-level cities in this paper.
Urban-rural Disparity and Urbanization in Xinjiang
10
2001) and from the Xinjiang Statistical Yearbook 2001 and 2003 (Xinjiang Tongji Ju
(Xinjiang Statistics Bureau) 2001, 2003). These two data sources are the largest and
most exhaustive statistical sources available for the provinces in China.
In order to examine the individual effect of each of the different variables on urban-rural
income disparity in Xinjiang, a multiple regression analysis was carried out. Multiple
regression analysis has been widely employed to study the relationship between several
independent variables (or predictors) and a dependent variable, as well as to identify the
contribution of each predictor to the dependent variable. In multiple regression analysis,
we are interested in predicting a criterion variable from a set of predictors. The
regression procedure provides five methods to select predictor variables, stepwise being
one of them. In a multi-variable problem, the regression equation is arrived at through a
sequence of multiple linear regression equations, in a stepwise manner. At each step of
the sequence, one variable is added to the regression equation. The variable added is the
one that generates the greatest reduction in the error sum of squares of the sample data.
Equivalently, it is the variable that, when added, provides the greatest increase in the F
value. Variables not having a significant correlation with the dependent variable are
those whose addition does not increase the F value; these are not featured in the
regression equation.
In this study, we define the urban-rural income ratio in Xinjiang in the year 2000 as a
dependent variable. Since we want to know the role of spatial distribution of ethnic
groups in the urban-rural disparity, it becomes our first-choice independent variable.
Since the literature review of income distribution studies suggests that other independent
variables such as government investment, illiteracy rate, urbanization level and migration
rate, should be taken into account, these are also included in our stepwise multiple
regression analysis. The following equation emerged:
Id (u / r ) i = C + InMci + InGii + InIpi + InUri + InMgi
Dependent variable: Id (u / r )i =
urban income of i country
rural income of i country
1
2
where the dependent variable Id(u/r) represents the urban-rural income disparity (the
ratio of urban resident income6 to rural resident income) of each county, with i indicating
a specific country and C being a constant; coefficients , , , , are estimation
parameters representing the beta weights. The rest of the letters are the independent
variables potentially influencing urban-rural disparity.
The first independent variable Mc is the degree of minority population concentration in
a county, which is measured by the location quotient. The location quotient (LQ) is the
measure most frequently used in economic geography and locational analysis. In this
study, LQ estimates the relative significance of the concentration of an ethnic group in a
6
Urban resident income is calculated as follows: urban resident income = average salary*(provincial
average urban income / provincial average salary).
Urban-rural Disparity and Urbanization in Xinjiang
11
particular county compared with its concentration significance in a larger region
(Xinjiang as a whole). The equation is as follows:
Mci =
Mi /
Pi /
n
i =1
n
Mi
P
i −1 i
3
where Mi and Pi represent the minority population and total population of the ith county in
Xinjiang respectively, and n represents the number of counties in Xinjiang.
The aim of introducing the Mc variable is to measure the level of influence of the degree
of ethnic minority group concentration on the group’s urban-rural income disparity.
There is no evidence in the empirical research showing whether high minority
concentration contributes positively or negatively to the disparity. However, according to
the literature review on minorities that we presented in the introduction, and the alarming
situation of urban-rural income disparity in Xinjiang during the last decade as described
in the previous section, we suppose that the higher concentration of minority populations
is favourable to the disparity, and thus the regression coefficient “ ” should be positive.
The second independent variable Gi represents government investment. It signifies the
total investment in fixed assets in a country, referring to the level of activity in
construction and the purchase of fixed assets and related fees, as expressed in monetary
terms (Xinjiang Tongji Ju (Xinjiang Statistics Bureau) 2001). Yang (1998) attributes the
rise in urban-rural disparity after 1990 to what he calls “urban-biased policy”, which
includes augmented urban subsidies, investments, and banking credits that have brought
about higher inflationary taxes on rural earnings. Johnson (2000) also demonstrates
urban-biased allocation of investment and credit to be one of three major policy areas that
have adversely affected rural incomes. Fu (2004) confirms this idea by specifying that
regional disparities in China are intimately related to government investment. Urbanbiased policy, therefore, “in the short run may further widen the measured income gap”
(Wu and Perloff 2004). Based on this literature, “Gi” is expected to have a positive
impact on the disparity, and its regression coefficient “ ” should be positive.
The third independent variable Ip is the illiteracy rate of the population over 15 years
of age in each county. Following the development of Human Capital Theory in the early
sixties, education level became a popular independent variable in income distribution
studies (Psacharopoulos 1988). Some empirical studies (West and Wong 1995; de
Gregorio and Lee 2002) demonstrate that greater income inequality hinders access to
schooling because it is simply unaffordable for poor families, while lower income
inequality facilitates access to education and thus contributes to a reduced education
inequality. According to Johnson (2000) less accessible education in rural areas means
Urban-rural Disparity and Urbanization in Xinjiang
12
lower are rural incomes. Cameron (2000) similarly suggests that poverty reduction is
largely associated with increased educational attainment, higher incomes for less
educated workers, and income gains for workers outside the agricultural sector. We
therefore expect Ip and the disparity to have a positive relationship, and its regression
coefficient “ ” to be a positive number.
The fourth independent variable Ur represents the urbanization rate of each county,
which is the proportion of urban population 7 of the total population in the county.
Although there is still considerable debate on whether the urbanization process reduces or
increases urban-rural income disparity, as presented in the introduction, a number of
studies confirm that the pace of urbanization in China contributes mostly to reducing the
income gap. Chen’s research (2002) based on China'
s provinces (Figure 4a) is one of the
examples. For our case study of Xinjiang, the bivariate correlation analysis shows a
similar tendency: there is a significant negative association between the rate of
urbanization and the income gap (Figure 4b). So, what is the role of the urbanization rate
in the multiple regression analysis? We expect urbanization to diminish the income gap,
and the regression coefficient “ ” to be negative as a consequence.
Source: Xinjiang Statistical Yearbook 2001, China Statistaical Yearbook 2001 (Xinjiang Tongji Ju (Xinjiang Statistics
Bureau) 2001; Zhongguo TongjiJu(China Statistical Bureau) 2001).
Figure 4 Simple correlation between the rate of urbanization
and the urban-rural income ratio in Xinjiang and in China, 2000.
The fifth independent variable Mg represents the migrant population, which is
calculated by the population that immigrated, from January 1, 1995 to December 31,
2000, into each county, divided by its total population. Intra- and inter-provincial
migration could play an important role in reducing income disparity. Labour mobility
has, in fact, been associated with large urban-rural disparities (Lu 2002). Fu (2004)
asserts, for example, that migration and income inequalities are related in a long, linear
7
Urban population is the sum of “city population” and “town population”.
Urban-rural Disparity and Urbanization in Xinjiang
13
relationship. However, there is still a great deal of debate over whether the migration
process reduces or increases urban-rural income disparity, as presented in the
introduction. So, we suppose that a higher migrant population is favourable to reducing
income disparity, and that the regression coefficient “ ” should, therefore, be negative;
otherwise, “ ” is positive.
RESULTS AND DISCUSSION
The regression analysis demonstrates that there is a very strong association between the
urban-rural income ratio and the predictors8. In addition, the “Stepwise” method selected
three out of five predictors, according to the degree of influence, which have significantly
contributed to this relationship. From table 3, we can see that the concentration of
minority populations, government investment, and illiteracy rate are all positively
correlated with the urban-rural income ratio. Conversely, the level of urbanization and
the rate of migration do not have a significant relationship with urban-rural disparity.
Range
Table 3 Results of the Stepwise multiple regression analyses of urban-rural
income disparity in Xinjiang, 2000.
Std. Coefficients
F
Variables
R
R2
Beta
Constant
Sig.
1.225
0.224
1
InMc (Minority concentration)
0.725
0.526
0.744
9.774
0.000
2
InGi (Government investment)
0.748
0.560
0.224
2.986
0.004
3
InIp (Illiteracy of population)
0.770
0.593
0.194
2.630
0.010
Concentration of minority populations
From table 3, we can see that the standardized coefficient of minority concentration
(InMc) is positive at the highest level of significance of 0%. The value of the InMc
coefficient is 0.744, which is also the highest value among the three independent
variables remaining in the regression analysis. It is worth highlighting that compared to
the coefficient values of the other two independent variables (InGi and InIp), the value of
InMc is three times higher. If other variables are constant, once the minority proportion
in a county increases by 1%, its income gap will rise by approximately 0.74%. This
indicates that the concentration of minorities is the primary factor explaining the increase
in urban-rural income inequality in Xinjiang.
Government investment
Just as expected, the coefficient of InGi is positively correlated with inequality and is
significant at a level of 1 %. Its value is 0.224, and it is a second variable explaining
most of the urban-rural income gap. This coefficient value, however, is very small
compared with the value of the first independent variable InMc. This indicates that there
8
In order to respect a normal distribution of the dependent variable, log10 transformation was performed.
Urban-rural Disparity and Urbanization in Xinjiang
14
is a positive but relatively weak correlation between government investment and the
income gap. The statistics (Xinjiang Tongji Ju (Xinjiang Statistics Bureau) 2003)
demonstrate that, in recent years, government investment in rural areas and the primary
sector has been decreasing considerably because of the urban-biased policy. In 1978, for
example, the total investment in fixed assets for the primary sector accounted for nearly
16% of the total investment, while in 1995 it was less than 3%, and 5% in 2002.
According to the Xinjiang Statistical Yearbook 2001, only 7.7% of the total fixed asset
investment has been allocated to the primary sector, which accounts for 60% of total
employment in Xinxiang. However, inequality of the government investment policy
among the different sectors of the economy is not the only problem. In Xinjiang,
government investment differs from region to region, which creates an extremely uneven
pattern of development that consequently affects urban-rural income disparity. In 2000,
for instance, nearly 70% of the total fixed asset investments were allocated to northern
Xinjiang. The Tianshan Mountain economic belt alone received almost 50% of the total
investments in 2000. Only certain regions, such as a few eastern and southern counties
along the railway line, enjoyed the privileges of government investment.
Uneducated population
In any society, education is a foundation of development (Wang 2001). In the regression
analysis, the illiteracy rate coefficient is significant above a level of 1%, with a value of
0.194. The rate of illiteracy has a very weak positive impact on income disparity, even
though it is the third factor contributing to the urban-rural income gap increase. The
ethnic minority communities in the south generally have the highest illiteracy rates in the
province, ranging from 8.7% to 14.2%. For example, the Tajik and Uygur communities
in southern Xinjiang have illiteracy rates of 13.05% and 10% respectively. The east
ranks second highest, with illiteracy levels of 6.5% to 8.7%. The northernmost part of
Xinjiang has the lowest illiteracy rates: 2.2% to 6.5%. However, counties located on the
northern slope of Tianshan Mountain have a very high illiteracy rate (above 10%) and
very low rates of income inequality. The illiteracy rates are high mainly because of the
concentration of intra- and inter-provincial immigrants (60 and 50 % respectively)
attracted to these regions of great economic opportunities in search of higher paying jobs
(Xinjiang Tongji Ju (Xinjiang Statistics Bureau 2001).
Spatial distribution of ethnic minority groups in Xinjiang
Figure 5 shows that urban-rural income disparity is more prevalent in the counties where
minority populations outweigh the Han majority. The minority population concentration
(InMc) is not just a simple variable; in fact, it represents particular socioeconomic,
cultural and geographic contexts which define minority areas (counties). In other words,
the spatial distribution of ethnic minorities reflects not only their spatial segregation, but
also the degree of their socioeconomic exclusion from the majority. Why are minority
counties always associated with high income inequalities?
Urban-rural Disparity and Urbanization in Xinjiang
15
Ratio
Location Quotient
Urban-rural Income Gap in 2000
<= 2.79
0.080 - 0.89
2.80 - 3.60
0.90 - 1.19
>= 3.61
1.20 - 1.49
Minority Concentration
1.50 - 1.72
Urumqi
Urumqi
0
150
Projection: Regional Conformal Projection (China)
Software: ArcGIS 9.0
Source: Xinjiang Statistical Yearbook 2001
Xinjiang Census 2000
300 Km
Jing Feng
Department of Geography
University of Ottawa
May 25, 2007
Figure 5 Urban-rural income disparity and spatial distribution of ethnic minority populations.
Several factors contribute to this reality. First of all, the geographic location plays an
important role in defining the context of minority areas. Minority communities,
particularly rural minority communities, are usually situated in relatively cohesive,
distinctive and isolated locations. In Xinjiang, where minority populations constitute
over 60% of the total provincial population, minorities inhabit mainly rural areas located
in remote border regions, particularly in the south of the province. This disadvantaged
geographical location creates a considerable obstacle for the socioeconomic development
of these minority communities. Per capita GDP and rural incomes in these areas are, for
instance, much lower than in non-minority regions. In 2000, the average rural income in
the 22 southern minority counties was 934.5 yuan, which is only half of the average
provincial rural income (Xinjiang Tongji Ju (Xinjiang Statistics Bureau) 2001).
Moreover, 80% of the total poverty designated counties in the province consist of
minority communities where, in most cases, minority populations represent over 90% of
the total population. Substantially lower income levels are a distinctive characteristic of
minority areas, even when compared to rural populations in non-minority regions. As
illustrated in figure 6, the correlation between minority concentrations and rural income
is negative.
For a few minorities located in the pastoral areas in northern Xinjiang, however, (Figure
2), such as the Kazak minority group in the Ili Kazak prefecture (a typical pastoral area in
the north), life conditions are much better. Owing to favourable geographical conditions
and to engagement primarily in the animal husbandry sector, the rural income of the
Kazak minority is much higher than that of minorities involved mainly in other
agricultural sectors. In 2000, for instance, the average rural income in the Ili Kazak
prefecture was 2,165 yuan, while in the Hotan district (a typical agricultural area in the
South) it was only 794 yuan (Xinjiang Tongji Ju (Xinjiang Statistics Bureau 2001). Thus,
Urban-rural Disparity and Urbanization in Xinjiang
16
the difference between rural and urban income is less evident in northern minority
communities.
Source: Xinjiang Statistical Yearbook 2001 (Xinjiang Tongji Ju (Xinjiang Statistics Bureau) 2001).
Figure 6 Correlation between minority concentrations and rural income in Xinjiang, 2000.
Another possible cause for a high urban-rural income gap is the dominance of traditional
employment structures in minority regions. As Cameron (2000) points out, populations
with a high proportion of agricultural households generally experience higher poverty
rates. In 2000, nearly 80% of minority employment opportunities in Xinjiang were
concentrated in the agricultural sector associated with a low income (Xinjiang Tongji Ju
(Xinjiang Statistics Bureau 2001). Lewis’s Dual Economy Model (Lewis 1954) and
Todaro’s Rural-Urban Migration Model (1969) indicate that in the process of a traditional
rural economy becoming industrialized and modernized, the surplus rural labour forces
could progressively move from the low-productivity and low-income traditional
agricultural sector to the high-productivity modern industrial urban sector. Fu (2004)
also highlights that flows of immigrants from rural to urban areas might help to reduce
urban-rural income disparity in two ways: first, an urban wage is generally higher than a
rural one. In an idealized labour market, rural labour would flow into an urban area in
search of higher paying jobs; the excess of labour supply would then lower urban wage
rates, while the reduced labour supply in rural labour markets would simultaneously
increase rural wages. Theoretically, this would continue until rural and urban wages
equalizes. Second, incomes of rural households depend heavily on money transfers from
rural-urban migrants. Labour mobility, therefore, has the potential to decrease income
disparity.
Due to cultural reasons, rural-urban migration can be very difficult for minority
populations. As Kindle and Herrick (1977) point out, if a minority is highly concentrated
in a region (mostly in rural areas), similar background, and common language and culture
Urban-rural Disparity and Urbanization in Xinjiang
17
lead to lower costs of acquaintance and communication. When residents of minority
areas decide to relocate to urban sectors, the psychological and socio-cultural costs of
acquaintance and communication rise considerably. This constraint on mobility reflects
on the pace of urbanization among minority groups. In 2000, the average urbanization
rate of ethnic groups in Xinjiang was nearly 34%, while in minority groups it was 24%,
and particularly low for the Uygur group, where it was as low as 19%. In contrast, the
overall urbanization level in the Han nationality group was 54%, which is twice the rate
of minority groups (Xinjiang Tongji Ju (Xinjiang Statistics Bureau 2001).
Finally, labour quality is very poor in remote minority areas due to insufficient and
inadequate educational resources. High-income jobs are inaccessible to low quality
labour (Psacharopoulos 1988) – another important explanation for high urban-rural
income disparity. The accessibility of education is, in fact, always problematic in the
minority counties of Xinjiang. The geographical features of the isolated, frontier regions
where minority populations generally live create insurmountable difficulties with respect
to access to education (Wang 1998). Increased distance from schools increases both the
opportunity cost of acquiring education and gender disparities in the attendance rate. In
addition to geographical constraints, many teachers in remote areas do not have the
necessary qualifications and lack opportunities for in-service training. A number of
studies have revealed that popularizing minority languages in public education benefits
the development of children’s mental abilities and improves the quality of education (Ma
2003), but this approach is rarely implemented and is very underdeveloped due to the
lack of curricula, teaching materials, and trained bilingual teachers. In addition, teachers’
salaries are often delayed because education is locally funded, with limited resources. As
a result, staff turnover is high, most of the newly appointed teachers are young and
inexperienced, and appointed teachers do not settle down, and rarely stay for long, in
these underdeveloped remote areas (Bai 2003). These particular circumstances lead to
high illiteracy rates in minority communities. Table 4 illustrates that the proportion of
minority populations with education is significantly lower than that of the Han population
in Xinjiang.
Table 4 Comparison of education levels between minority
and Han populations in Xinjiang, 2000.
Illiterate population
8.33%
5.87%
Xinjiang
(average)
7.31%
Literacy Courses
2.44%
0.89%
1.80%
Primary school
51.44%
27.79%
41.63%
Junior high school
25.75%
36.62%
30.26%
Senior high school
5.04%
13.20%
8.42%
Specialized Secondary Schools
Junior college
3.95%
2.07%
6.37%
7.14%
4.95%
4.17%
University
0.98%
2.06%
1.42%
Graduate
0.01%
0.07%
0.04%
Subject
Minority
Han
Source: adapted from the Xinjiang Census 2000 (Xinjiang Renkou Pucha Weiyuanhui (Xinjiang Census
Committee) 2001).
Urban-rural Disparity and Urbanization in Xinjiang
18
Spatial Pattern of the urbanization process in Xinjiang
It is surprising that with the multiple regression analysis, we are unable to confirm a
significant impact of the level of urbanization on the urban-rural income gap. Due to the
extremely strong impact of minority concentrations on the income gap, as well as the
effect of the other two variables – government investment and rate of illiteracy – the rate
of urbanization, in fact, becomes less important and does not appear to be a significant
contributor to income inequality. So, why is the level of urbanization so weak in our case
study of Xinjiang?
Let us look at the factors which determine the level of urbanization in Xinjiang. To do so,
we employ four explanatory variables, as we did in the first regression analysis of income
disparity: InMc, InGi, InIp and InMg. These have also been commonly used in the
studies of urbanization processes (Wan, Lu and Chen 2007) for carrying out a second
stepwise multiple regression analysis. Our particular regression analysis showed that
three out of four variables contributed significantly to the urbanization rate in Xinjiang.
InGi and InMg positively impact the urbanization rate, and InMc is negatively correlated
with it. We notice also that the main explanatory variable for the level of urbanization is
government investment. Its coefficient value is 0.617, nearly three times higher than the
coefficient values of the other two independent variables (InMc and InMg) (see Table 5
in the appendix). The urban-biased investment policy in the last decade, in fact, favoured
only a few specific urban regions in Xinjiang, mostly the big cities, and was beneficial to
only a part of the population, particularly to the Han nationality.
Table 5 Results of the Stepwise multiple regression analyses
of the level of urbanization in Xinjiang, 2000.
Std. Coefficients
Variables
R
R2
Beta
Range
Constant
F
Sig.
6.019
0.000
1
InGi (Government investment)
0.712
0.508
0.617
8.776
0.000
2
InMc (Minority concentration)
0.777
0.604
-0,267
3.620
0.001
3
InMg (Migrant of population)
0.798
0.637
0.190
2.725
0.008
The polarization of urban development has consequently become increasingly apparent in
Xinjiang (Liu 2000; Wei 2000; Li 2001). As Duan (2000) indicates, the development of
cities and towns in Xinjiang is unbalanced, but it does have some observable patterns.
First, the urbanization process occurred mainly in northern Xinjiang. This region has
more operational advantages in terms of urban development than eastern and southern
Xinjiang. It is always leading the pace of urbanization in the province. In 2002, more
than half of the nineteen cities in the province were located in the north. Their share of
the total urban population of Xinjiang was as high as 64.92%, compared to only 7.42% in
the east and 27.66% in the south. Moreover, the density of cities in the north is 3.06 per
100,000 km2, more than double the provincial average of 1.44, while in the east it is 0.95,
and in the south only 0.54. Town density is 28.3 per 100,000 km2 for the north, while in
the east it is 9.5, and in the south 10.6 (Figure 7) (Xinjiang Tongji Ju (Xinjiang Statistics
Bureau) 2003).
Urban-rural Disparity and Urbanization in Xinjiang
19
The second observable pattern is the concentration of a significant number of cities,
towns, and urban dwellers in the Tianshan economic belt, which contributes to the
clustering of cities in the province. In 2002, 9 of 19 cities and 48 of 229 towns were
located in this belt, which represented 65.70% of the urban population despite the fact
that it has only a 25% share of the total population of Xinjiang. The city density in this
economic belt was 9.6 per 100,000 km2, three times higher than in northern Xinjiang, 10
times higher than in the southern region, and seven times higher than the provincial
average. Regions with higher urbanization levels also have a greater concentration of the
Han nationality. For example, nearly 62% of the Han nationality and 38% of the
minority population lives in northern Xinjiang, with the Uygur minority group accounting
for only 12%. Similarly, in the Tianshan economic belt, the Han nationality also
predominates (73.15%). Consequently, due to the geographic inequality of urban
development in Xinjiang, and the uneven distribution of cities and towns, as well as the
urban population, the effects of urbanization are not as evident as we expected.
City Density
(per 100,000 Km2)
< 2.00
2.00 - 5.00
> 5.00
Town Density
City
(per 100,000 Km2)
< 12.00
12.00 - 28.00
> 28.00
Northern Tianshan
Economic Belt
Town
Northern Tianshan
Economic Belt
Urumqi
0
Urumqi
150
300 Km
Projection: Regional Conformal Projection (China)
Software: ArcGIS 9.0
Source: Xinjiang Statistical Yearbook 2003
Jing Feng
Department of Geography
University of Ottawa
May 25, 2007
Figure 7 Density of cities and towns in Xinjiang, 2002.
CONCLUSION
Our study clearly demonstrates the dominant role of the spatial distribution of minorities
in the explanation of urban-rural income disparity, which has not yet been well
documented in the existing literature on the subject. Moreover, the spatial distribution of
ethnic groups is not a simple variable; in fact, it represents the social context of the region
in question. This context is extremely important, particularly where minorities account
for a considerable proportion of the total population, as in our case study of Xinjiang.
The concentration of ethnic minorities reflects not only their spatial segregation, but also
the degree of their socioeconomic exclusion from the majority. Research on
development since World War II shows that economic progress alone does not achieve
either the social equity or the multi-sectoral dynamism essential for the long term
advancement of human welfare (Jones 2004). Development cannot be successful and
Urban-rural Disparity and Urbanization in Xinjiang
20
sustainable if minorities are not taken into account, because economic growth cannot
guarantee vulnerable populations the freedom to exploit their abilities, or to achieve
social and political rights regardless of their identity or place in society. The inclusion of
minorities becomes more and more important for sustainable development as the income
gap increases between minority and majority populations.
We are unable to confirm that the urbanization process contributes significantly to the
reduction of urban-rural income disparity in Xinjiang. The main reason why our findings
do not confirm conclusions found in the existing literature on the subject has to do with
our consideration of government intervention, namely the policy biased in favour of
urban areas, which stimulates urban development only in a few regions, which are for the
most part dominated by the Han majority. However, in these few regions, urban-rural
income disparity is indeed lower than in our case study of Xinjiang. For instance, the
average income gap in 19 country-level cities was only 2.43 in 2000, compared to 3.51 in
the rest of the 69 counties (Xinjiang Tongji Ju (Xinjiang Statistics Bureau) 2001). In
China, cities usually have both urban and rural populations. Consequently, with an
adjustment of government intervention based on an equitable urban development policy
that would focus not only on cities, but also on other regions, particularly on minority
regions, urbanization could expand in all of Xinjiang, and eventually contribute to
reducing current income disparities. Future research is needed to confirm the efficiency
of government policy in minority areas.
It remains difficult to make the findings of our study travel, since among all of the
existent ethnic groups in the region of study, only two are dominant: the Uygurs,
accounting for 46% of the total Xinjiang population, and the Han accounting for 40%. In
addition, the spatial distribution of these two ethnic groups is clearly segregated, with the
Uygur minority occupying mainly the agricultural, less developed part of southern
Xinjiang, and the Han nationality concentrated in the modernized and development north,
particularly in the urban centers of the province. It is necessary to continue exploring the
role of spatial distribution of ethnic minorities in areas co-inhabited by multiple minority
groups – in other western Chinese provinces, for example, or even in other parts of the
world. This future research will help us to understand more thoroughly and more
systematically the role of spatial distribution with regard to income disparity.
Literature Cited
Adelman, I. and D. Sundings. 1987. Economic policy and income distribution in China. Journal
of Comparative Economics 11, 444-461.
Bai, J. 2003. Development of education and Well-being. Gansu Jiaoyu (Gansu Province
Education) 10, 3-7.
Borooah, V. K., B. Gustafsson and L. Shi. 2006. China and India: Income inequality and poverty
North and South of the Himalayas. Journal of Asian Economics 17, 797-817.
Brueckner, J. K. and Y. Zenou. 1999. Harris-Todaro models with a land market. Regional Science
and Urban Economics 29, 317-339.
Cameron, L. A. 2000. Poverty and inequality in Java: Examining the impact of the changing age,
educational and industrial structure. Journal of Development Economics 62, 149-180.
Cao, H., Y. Zhao and S. Losier. 2000. Le projet urbain de Pudong Shanghai : Offre-t-il un
développement durable pour la globalisation de la Chine? (Does the Pudong urban
Urban-rural Disparity and Urbanization in Xinjiang
21
project in Shanghai have a sustainable future?). Les Annales de la recherche urbaine
(Annals Urban Research), 92-100.
Chang, G. H. 2002. The cause and cure of China'
s widening income disparity. China Economic
Review 13, 335-340.
Chen, A. 2002. Urbanization and disparities in China: Challenges of growth and development.
China Economic Review 13, 407-411.
Chen, J. and B. M. Fleisher. 1996. Regional income inequality and economic growth in China.
Journal of Comparative Economics 22.
Chung, J. H. and T. Lam. 2005. China'
s "City System" in flux: Explaining Post-Mao
administrative changes. The China Quarterly 180, 945-964.
Cole, J. P. 1987. Regional inequalities in the People'
s Republic of China. Tijdschrift voor
Economische en Sociale Geografie 78, 201-13.
de Gregorio, J. and J. W. Lee. 2002. Education and income inequality: New evidence from crosscountry data. Review of Income and Wealth 48.
Duan, H. 2000. Urban development strategies of Xinjiang Autonomous Region in the West China
Development. Urban Development Study, 11-14.
Fan, C. C. 1999. The vertical and horizontal expansions of China’s city system. Urban
Geography 20, 493-515.
Fu, X. 2004. Limited linkages from growth engines and regional disparities in China. Journal of
Comparative Economics 32, 1-196.
Goldstein, S. 1990. Urbanization in China, 1982-1987: Effect of migration and reclassification.
Population and Development Review 16, 673-701.
Gustafsson, B. and L. Shi. 2003. The ethnic minority-majority income gap in rural China during
transition. Economic Development and Cultural Change 51, 805-822.
Henderson, V. 2003. The urbanization process and economic growth: The so-what question.
Journal of Economic Growth 8, 47-71.
Jian, T., J. D. Sachs and A. M. Warner. 1996. Trends in regional inequality in China. China
Economic Review 7, 1-21.
Johnson, D. G. 2000. Reducing the urban–rural income disparity. Paper no. 00-07 Office of
Agricultural Economics Research, The University of Chicago.
Jones, M. E. 2004. Forging an ASEAN identity: The challenge to construct a shared destiny.
Contemporary Southeast Asia 26, 140-155.
Kanbur, R. and X. Zhang. 2005. Fifty years of regional inequality in China: a journey through
central planning, reform, and openness. Review of Development Economics 9, 87-106.
Kindle, B. C. H. and B. Herrick. 1977. Economic Development (3rd edition). New York:
McGraw-Hill Book Company.
Kuznets, S. 1955. Economic growth and income inequality. The American Economic Review 45,
1-28.
Lanaspa, L., F. Pueyo and F. Sanz. 2003. Urbanization patterns and level of development: An
empirical assessment. Working Paper.
Lewis, A. W. 1954. Economic development with unlimted supplies of labour. The Manchester
School of Economic and Social Studies 22, 139-191.
Li, N. and S. Li. 1996. Regional Population Urbanization Research. Shanghai: Shanghai
Huadong Normal Univeristy Press.
Li, Q. 2001. A preliminary survey on urbanization in Xinjiang. Xinjiang Shifan Daxue Xuebao
Shehui Kexueban (Journal of Xinjiang Normal University-Social Science) 22, 1-5.
Lin, G. C. S. 1999. Transportation and metropolitan development in China'
s Pearl River Delta:
The Experience of Panyu. Habitat International 23, 249-270.
---. 2002. The growth and structural change of Chinese cities: A contextual and geographic
analysis. Cities 19, 299-316.
Liu, J. 2000. The urbanization way and its conceptions of Xinjiang. Development Studies, 43-46.
Urban-rural Disparity and Urbanization in Xinjiang
22
Lu, D. 2002. Rural-urban income disparity: impact of growth, allocative efficiency, and local
growth welfare. China Economic Review 13, 419-429.
Lu, M., Z. Chen and B. Qin. 2004. Economic reform and urban-rural inequality in China.
Working Paper.
Ma, X. H. 2003. Analysis of the current income disparity. Red Flag 16, 24-34.
Mackerras, C. 2003. China's Ethnic Minorities and Globalisation. London: Routledge (U.K.).
Park, A., D. Wang and F. Cai. 2006. Migration and urban poverty and inequality in China.
Working Paper.
Perkins, D. H. 2002. The challenge of China'
s economy on Chinese economists. IN An Analysis
of Urbanization in China, ed. Y. Chen and A. Chen, 1-6. Xiamen: Xiamen University
Press.
Psacharopoulos, G. 1988. Education and development: A review. The World Bank Research
Observer 3, 99.
Seeborg, M. C., Z. Jin and Y. Zhu. 2000. The new rural-urban labor mobility in China: Causes
and implications. The Journal of Socioeconomics 29, 39-56.
Stalin, J. 1942. Marxism and the National Question: Selected Writings and Speeches. New York:
International Publishers.
State Council. 1994. Guojia Baqi Fupin Gongjian Jihua (State's Anti-Poverty Program). Chinese
Central Government.
Todaro, M. P. 1969. A model of labor migration and urban unemployment in less developed
countries. The American Economic Review 59, 138-148.
Tsui, K. 1991. China'
s regional inequality, 1952-1985. Journal of Comparative Economics 15, 121.
---. 1993. Decomposition of China'
s regional inequalities. Journal of Comparative Economics 17,
600-627.
---. 1996. Economic reform and interprovincial inequalities in China. Journal of Comparative
Economics 50, 353-368.
van de Walle, D. 2003. Are returns to investment lower for the poor? Human and physical capital
interactions in rural Viet Nam. Review of Development Economics 7.
Wan, G. 2007. Trends in China: Methodological issues and empirical findings. Review of Income
and Wealth 53, 25-34.
Wan, G., M. Lu and Z. Chen. 2007. Globalization and regional income inequality: Empirical
evidence from within China. Review of Income and Wealth 53, 35-59.
Wang, G. 1998. Revision and countermeasures to girls'education for the Tibetan Nationality in
Qinghai Province. Qinghai Shehui Kexue (Qinghai Social Science) 2, 52-57.
Wang, Q. 2001. The contributing factors in the damage to girls’ education right in Chinese rural
areas. Jiujiang Shifan Daxue Xuebao Shehui Kexueban (Journal of Jiujiang Normal
College-Social Science) 2, 73-77.
Wang, X. 2006. Income inequality in China and its influential factors. Research Paper No.
2006/126 UNU-WIDER 2006.
Wei, Z. H. 2000. Urbanization is the key to develop Xinjiang. Xinjiang Caijing (Xinjiang Finance)
240, 14-18.
West, L. A. and C. P. W. Wong. 1995. Fiscal decentralization and growing regional disparities in
rural China: Some evidence in the provision of social services. Oxford Review of
Economic Policy 11, 70.
World Bank. 2001. World Development Report 2000/2001: Attacking poverty. Washingtong, DC:
World Bank Publication.
---. 2003. World Development Indicators Washington: World Bank Publication.
---. 2004. A Better Investment Climate for Everyone: World Development Report 2005.
Washingtong, DC: Oxford University Press.
Urban-rural Disparity and Urbanization in Xinjiang
23
Wu, X. and J. M. Perloff. 2004. China'
s income distribution over time: Reasons for rising
inequality. Department of Agriculture and Resource Economics, University of California,
Berkeley. Working paper.
Xinjiang Renkou Pucha Weiyuanhui (Xinjiang Census Committee). 1992. Xinjiang Renkou
Pucha 1990 (Xinjiang Census 1990). Urumqi: Xinjiang Peoples Press.
---. 2001. Xinjiang Renkou Pucha 2000 (Xinjiang Census 2000). Urumqi: Xinjiang Peoples Press.
Xinjiang Tongji Ju (Xinjiang Statistics Bureau). 1991. Xinjiang Tongji Nianjian (Xinjiang
Statistical Yearbook 1991). Beijing: China Statistics Press.
---. 2001. Xinjiang Tongji Nianjian (Xinjiang Statistical Yearbook 2001). Beijing: China Statistics
Press.
---. 2003. Xinjiang Tongji Nianjian (Xinjiang Statistical Yearbook 2003). Beijing: China Statistics
Press.
Xue, J. 1997. Urban–rural income disparity and its significance in China. Hitotsubashi J. Econ.
38, 45-49.
Yang, R. M. 1998. Relevance analysis for China urbanization and non-agriculturalization. Areal
Research and Development 17, 17-19.
Zhang, X. and R. Kanbur. 2001. What difference do polarisation measures make? An application
to China. The Journal of Development Studies 37, 85-98.
---. 2005. Spatial inequality in education and health care in China. China Economic Review 16,
189-204.
Zhongguo TongjiJu(China Statistical Bureau). 2001. China Statistical Yearbook 2001. Beijing:
China Statistics Press.
Urban-rural Disparity and Urbanization in Xinjiang
24


© Copyright 2026