
Why the Difference? A Closer Look at Higher Education Minority Ethnic
R ESEARCH
Why the Difference?
A Closer Look at Higher
Education Minority Ethnic
Students and Graduates
Helen Connor, Claire Tyers (IES),
Tariq Modood: (Dept of Sociology, Univerisity of Bristol) and
Jim Hillage (IES)
Research Report RR552
Research Report
No. 552
Why the Difference?
A Closer Look at
Higher Education
Minority Ethnic Students
and Graduates
Helen Connor, Claire Tyers (IES),
Tariq Modood: (Dept of Sociology, Univerisity of Bristol) and
Jim Hillage (IES)
The views expressed in this report are the authors’ and do not necessarily reflect those of the Department for Education and Skills.
© Institute for Employment Studies 2004
ISBN 1 84478 266 2
Acknowledgements
The authors would like to thank the many people and
organisations who gave assistance in the project, especially: Claire
Simm, Adel Varnai and staff at MORI Social Research; Geoff Pike
and his staff at Employment Research; the students at the
University of Bristol who undertook interviews with parents; our
colleagues at IES, in particular Sara Davis, Nii Djan Tackey, Jane
Aston, Linda Barber, Rob Barkworth, Emma Hart, Andy Davidson
and Rachel Jordan; members of the Steering Group; DFES and
HEFCE statisticians; the students, their parents, employers and
university staff who took part in the research; and lastly, but not
least of all, Stella Mascarenhas-Keyes, the project manager at the
DfES for her help and support throughout the project.
iii
iv
Contents
Glossary
xi
Executive Summary
1. Introduction
1.1
1.2
1.3
1.4
1.5
1
The research
Scope
Methods
This report
Background and context
2. Routes to Higher Education
2.1
2.2
2.3
2.4
2.5
2.6
2.7
2.8
GCSE qualifications
Staying on post-16
Different post-16 education choices
Delaying HE entry
Entry qualifications for higher education
Highest entry qualification of current students
School or college previously attended
Summary
3. Influences on Decision Making and Choice of HE
3.1
3.2
3.3
3.4
3.5
3.6
Decisions about applying to HE
Family and parental influence
Expectations of career and financial gain from HE
Financial barriers
Effect of socio-economic class
Summary
4. Patterns of Participation in HE
4.1
4.2
4.3
4.4
4.5
1
2
4
8
8
12
12
14
16
17
17
19
21
22
25
26
28
31
32
34
36
40
Minority ethnic participation in HE
40
Diversity across HE
44
Gender differences
48
Causes of differences in minority ethnic representation
within HE
49
Summary
56
5. Student Progress and Experiences
5.1
5.2
xiii
Early leaving and non-completion
Reasons for non-completion of degree study
v
59
59
60
5.3
5.4
5.5
5.6
5.7
Difficulties affecting academic performance
Student finance
Impact of student finance and term time working
Institutional racism
Summary
6. Output and Attainment
6.1
6.2
6.3
6.4
Qualifications achieved
Differences in class of degree
Students views on achievements
Summary
7. Transitions to the Labour Market: Student Perspective
7.1
7.2
7.3
7.4
7.5
7.6
7.7
7.8
Context
Final year students’ views
Initial destinations
Factors of influence on degree graduate outcomes
HND and DipHE qualifiers
Initial jobs of degree graduates
Opting for further study
Summary
8. Employer Perspective
8.1
8.2
8.3
8.4
8.5
Context
Under-representation of minority ethnic graduate
recruits
Factors affecting under-representation
Improving representation
Summary
9. Summary and Conclusions
9.1
9.2
9.3
9.4
9.5
9.6
Diversity and complexity
Entry to HE
HE Participation and choices
Student progress and experiences in HE
Graduate transitions
And finally …
63
65
67
69
71
73
73
75
79
81
82
82
85
88
91
96
97
101
103
105
105
109
112
119
122
125
125
127
132
136
139
143
Bibliography
144
Appendix A: Additional Tables
149
Appendix B: Technical Notes
163
B.1
B.2
B.3
B.4
B.5
B.6
B.7
Research design and management
The student survey
The graduate survey
Parents of students
Potential student survey
Employer interviews
Questionnaires and discussion guides
vi
163
165
175
179
183
190
192
Index of Tables and Figures
Table 2.1: Main reasons students (now in Year 13) gave for staying
in education at age 16, by ethnic group (mean scores)1
15
Figure 2.1: Minority ethnic and White undergraduate students by
age on entry, England, 2001/02 (includes part-time and
full-time)
19
Figure 2.2: Percentage of minority ethnic and White degree
students with ‘A’ levels as highest qualification, England,
2001/02
20
Table 3.1: Factors affecting decisions by potential HE entrants to go
on to higher education by ethnic group (mean scores1)
27
Figure 3.1: Likelihood of students being born in the UK, by ethnic
group
31
Figure 3.2: Socio-economic profile of minority ethnic and White
accepted applicants to degree courses, 2002
36
Table 4.1: Minority ethnic groups (UK domiciled) in
undergraduate study in England (HEIs, Open University
and FE colleges combined), 2001/02
41
Table 4.2: Higher Education Initial Participation Rates (HEIPRs)
for English domiciled first-time entrants (full- and parttime) to HE courses (in universities and colleges), by broad
ethnic/gender group, 2001/02
43
Figure 4.1: Minority ethnic undergraduate students as a
percentage of all students (home domiciled only) at
individual universities, 2000/01
45
Figure 4.2: Minority ethnic students as percentage of total degree
students in each subject, England, at universities
(excluding OU), 2000/01
47
Table 4.3: Factors affecting choices of university by ethnic group
(mean scores1), potential students views
52
Table 4.4: Selected statistics summarising contrasts between some
minority ethnic/gender groups
57
Figure 5.1: Balance between paid work and study. Mean number
of hours per week in each reported activity, by ethnic
group
68
Figure 6.1: Main qualifications of qualifiers (undergraduate level)
from English universities, 2001/02
74
Table 6.1: Class of degree obtained by degree graduates at
universities, England, full-time and part-time study,
including OU, 2001/02
75
Figure 6.2: Effect of entry qualifications on class of degree:
percentage of degree graduates gaining first or upper
second class, 2001/02
77
Figure 7.1: Student plans after completing course, by ethnicity
(full-time final year students)
86
Table 7.1: First destinations of full-time degree (home domiciled)
graduates from English universities, 2001/02 (percentages
are based on known destinations)
89
vii
Figure 7.2: Labour market success indicator: male and female fulltime first degree graduates from English universities, by
ethnicity, 2001/02
90
Figure 7.3: Unemployment rates (%) for graduates with 1st or 2.1
degree class, compared with all graduates (fulltime first
degree graduates from English universities, by ethnicity,
2001/02)
94
Figure 7.4: Level of job: percentage of first degree graduates from
English universities going into each occupational
grouping (SOC), by ethnicity, 2001/02
99
Figure 7.5: Sector of employment: distribution of minority ethnic
and White graduates between sectors, (first degree
graduates from English universities), 2001/02
99
Table 7.2: Types of further study or training undertaken by first
degree full-time graduates (2001/02 from English HEIs
(percentages in each ethnic group), 2001/02
101
Table 8.1: Company graduate recruitment profiles and minority
ethnic graduate ‘success’ rates (mostly for 2002 graduate
entry)
111
Table A1: Higher Education Initial Participation Rates (HEIPRs)
for English domiciled first-time entrants (full- and parttime) to HE courses (in universities and colleges), by
individual ethnic/gender group, 2001/02
150
Table A2: Undergraduate White and minority ethnic students by
type of institution, in England, 2001/02 ( percentages)
151
Table A3: Undergraduate White and minority ethnic students by
qualification aim and mode, in England, 2001/02, HE
institutions only, excluding Open University (percentages)
152
Table A4: Distribution in undergraduate study of male and female
minority ethnic and White groups, in England,
(percentages), and comparative population distribution
153
Table A5: White and minority ethnic full-time and part-time
degree students by highest entry qualification, in England,
2001/02 (percentages)
154
Table A6: Previous educational establishment of minority ethnic
and White accepted home applicants to full-time degree
courses, in England, 2002 entry (percentages)
155
Table A7: Socio-economic class (NS-SEC) of minority ethnic and
White accepted home applicants to full-time degree
courses, in England, 2002 entry (percentages)
156
Table A8: Students who had, or had not seriously considered,
dropping out by men and women in each ethnic group
(percentages)
157
Table A9: Main problems or difficulties students reported by
ethnic group (which they felt had affected their
performance), 2nd and later years, unprompted question
(percentages)
158
viii
Table A10: First destinations of full-time first degree (home
domiciled) male and female graduates (with known
destination) from English universities, by ethnicity,
2001/02 (percentages)
159
Table A11: Unemployment rates for full-time first degree home
graduates (with known destination) from different
subjects, from English universities, by ethnicity, 2001/02
(percentages)
160
Table A12: First destinations of HND and DipHE (home) qualifiers
(with known destination) from English university,
2001/02 (percentages)
161
Table A13: Further study or training undertaken by first degree
full-time graduates from English universities, by gender,
2001/02 (percentages of male and female graduates taking
each type of study, ie row percentages)
162
Table B1: Sample of institutions
168
Table B2: Representative sample: ethnic breakdown
171
Table B3: Representative sample: personal characteristics of White
and minority ethnic groups
171
Table B4: Representative sample: educational characteristics of
White and minority ethnic groups
172
Table B5: Minority ethnic sample: Personal characteristics of each
minority ethnic group
173
Table B6: Educational characteristics of minority ethnic sample
174
Table B7: Graduate survey response
177
Table B8: Graduate sample by main ethnic group
178
Table B9: Graduate sample by personal characteristics and broad
ethnic group
178
Table B10: Ethnic origin of parents
180
Table B11: Higher education experience of parents, by ethnicity
181
Table B12: Occupation of parents, by ethnicity
182
Table B13: Characteristics of the students whose parents were
interviewed (20 minority ethnic and 52 White current
students)
183
Table B14: Sample profile by ethnic group
186
Table B15: Potential HE student sample profile: Total number of
respondents by ethnic group, and each ethnic group
analysed by gender, age, father’s occupation and type of
institution
187
Table B16: Ethnicity and religion percentages by ethnicity
189
Table B17: GCSE attainment and whether or not studying for ‘A’
levels
189
ix
x
Glossary
Below is a list of general terms and acronyms used in this report:
1. The focus is undergraduate level study rather than all Higher
Education (HE). It covers students and graduates on courses
leading to first degrees, as well as a range of other
undergraduate qualifications (DipHE, HND, HNC, see
paragraph 6 below, and other professional and technical
studies above ‘A’ level/Scottish Higher/ONC/OND levels).
These are referred to as Level 4 in the current national
qualifications framework (NQF).
2. For brevity, where students on honours first degree courses are
referred to in this report, the term degree students is used, and
those on all other undergraduate programmes are referred to
as sub-degree. The latter includes students taking
undergraduate modules at the Open University which count as
credits towards honours degrees, and also includes the new
Foundation Degree courses (though few would be included in
the statistics shown in report).
3. Full and part-time undergraduate level study, at universities
(including the Open University), HE colleges and FE colleges,
is covered by the report. However, the main coverage is
universities. For ease of reading, the word ‘university’ is used
as a substitute for Higher Education Institution or HEI (so
intended to cover HE colleges too) unless otherwise stated.
4. The geographical coverage is undergraduate study in England,
and UK (ie home) domiciled students (ie excludes foreign
students from minority ethnic groups, from either the EC or
overseas, who are classed as foreign for fee-paying purposes).
However, in a few places, UK-wide information is shown and
the coverage stated.
5. The study focused on the main visible minority ethnic groups
in Britain today, sometimes referred to for brevity as MEGs.
They are the non-White groups in the ethnic origin
classification used by the Government in data collection (in
Census, Labour Force Survey, and by HESA and UCAS, see
below). This is a self-classification system, and since 2001, the
following two-stage category system has become standard.
xi
z
Black or Black British: Black Caribbean, Black African, Black Other
z
Asian or Asian British: Indian, Pakistani, Bangladeshi, Asian Other
z
Chinese or other: Chinese, Other
z
White: White British, Irish, White Other
z
Mixed: White/Black Caribbean, White/Black African, White/Asian,
Other Mixed.
As this study began prior to 2001, use had to be made in its
early stages of an earlier classification, used in the 1991 Census
and most official statistical sources prior to 2001. The minority
ethnic categories were: Black Caribbean, Black African, Black
Other, Indian, Pakistani, Bangladeshi, Chinese, Asian Other
and Other (and one White category).
Where there are small numbers in some minority ethnic
categories, we have had to combine them together in the
research into five groupings: Black Caribbean+Black Other;
Black African; Indian; Pakistani+Bangladeshi and Chinese+
Asian Other+Other. Further discussion of the scope of the
research is given in Chapter 1.
6. Finally, a number of acronyms are used in the report, which are
associated with higher education:
DipHE: Diploma in Higher Education
FEC: Further education college
FDS: First Destination Survey of graduates
HEFCE: Higher Education Funding Council for England
HEI: Higher Education Institution
HESA: Higher Education Statistics Agency
HNC/HND: Higher National Certificate/Diploma
LEA: Local Education Authority
LSC: Learning and Skills Council
OU: Open University
UCAS: University and Colleges Admissions Service
UUK: Universities UK (formerly CVCP).
xii
Executive Summary
This report is about the influences on participation in higher
education (HE) of minority ethnic students, and their
achievements and transitions to the labour market. It presents
findings from a multi-stranded study undertaken for the
Department for Education and Skills (DfES).
The scope of the research was broad, covering flows into, through,
and out of undergraduate study in England. Much of the analysis
focuses on differences between individual minority ethnic groups
(using the Census ethnicity categories in standard use in
university, college and employment statistics).
The principal elements of the study were: a review of recent
research literature, secondary analysis of national statistics, and
new research involving surveys of, and interviews with, a number
of target groups — potential, current and past students, parents,
employers and others. It was undertaken in 2002-03, by a team
based at the Institute for Employment Studies (IES) and included
Professor Tariq Modood from Bristol University.
Key messages
A large number of detailed and complex messages emerge which
can, in general terms, be summarised by the following:
z Minority ethnic people are more likely to take HE
qualifications than White people. The higher education initial
participation rate (HEIPR) for minority ethnic groups in
aggregate is considerably higher than the average, and they
represent a higher proportion of the graduate output
compared to their share of the working population.
z However, the minority ethnic population does not
participate in HE in a uniform way. The individual minority
ethnic group participation rates vary considerably overall, and
their representation varies between universities, subjects,
geographic regions, and courses. Also, the minority ethnic
undergraduate student body is highly heterogeneous.
Minority ethnic student groups have distinctly different
personal profiles (in terms of gender balance, average age at
entry, highest entry qualification, socio-economic class profile
and other personal characteristics).
xiii
z A range of factors affect HE entry, but aspirations and
expectations of the value of, and benefits from, higher
qualifications is a more significant positive ‘driver’ for
minority ethnic than for White students, especially most
Asian groups. This combines with greater parental and family
influence to play a more significant role in encouraging HE
participation among minority ethnic than White young
people, and also in choices of what and where to study in HE.
z Though their HE initial participation rates are higher, all
minority ethnic groups do not do as well in degree
performance as White students on average. Even when
background and other variables known to affect class of
degree are taken account of, they still do less well overall.
z Significantly, they also do less well in the labour market,
initially at least, than White graduates. They face more
problems securing their preferred choice of jobs or careers.
They are more likely to go on from degrees to further study
or training. All minority ethnic groups have higher initial
unemployment levels than White graduates. Minority ethnic
graduates continue to be underrepresented in the graduate
intakes of many large organisations.
Main findings
High participation
Minority ethnic groups comprise a higher share of the
undergraduate population in England (16 per cent) than of the
working population (nine per cent). Their Higher Education Initial
Participation Rates (HEIPRs) vary from 39 to over 70 per cent, and
all minority ethnic groups have a higher HEIPR than the White
group (38 per cent). But when gender is also taken into account, it
is only the female Bangladeshi participation rate that drops below
that of both the White male and female groups, though the male
Black Caribbean participation rate is only slightly higher than the
male White participation rate. These participation rates should be
treated with caution, however, as there are some uncertainties
with the data used in the calculation that require further
investigation (section 4.1). It is recommended that the Department
undertakes more statistical analysis work here and takes the
opportunity to use the newly released Census data to improve the
assessment of the relative representation in HE of the various
minority ethnic groups.
Very uneven distribution
Minority ethnic students are clustered at certain universities,
mostly post-92 universities in London. Their representation is
very high at a few, but very low at others (under ten per cent at
around half of the total) and mostly low in pre-92 universities
xiv
(section 4.2.1). This pattern relates to locality (high representation
of minority ethnic population in the London area and many
students stay locally) and also the different entry requirements of
universities and different types of courses/subjects on offer (and
minority ethnic groups have different prior attainment, see
below). There is also some evidence of racial bias in admissions
processes to degree courses at some universities, which may affect
minority ethnic representation levels (section 4.5).
There is a skewed subject distribution also in degree study (section
4.2.3), eg twice as high a minority ethnic representation in
computer science, law and medicine, and also higher than average
in business studies, engineering and mathematical sciences degree
courses, but below average representation in education and
humanities degrees. There are also differences by ethnicity and
gender in subjects studied.
Minority ethnic students have slightly higher representation on
full-time sub-degree courses, than full-time or part-time degree or
part-time sub-degree courses (section 4.2.2). This pattern is subject
related. Gender differences between minority ethnic groups are
evident here too (section 4.3), and also age differences (section 2.6).
Different trajectories
Minority ethnic young people are equally as likely as White
people to gain entry qualifications to go to university by age 19
(which contrasts with the situation at 16, at GCSE level), but the
type of highest qualification held and their schooling post-16
varies significantly (sections 2.3 to 2.5). Overall, minority ethnic
degree entrants have lower entry qualifications on average, fewer
take the traditional ‘A’ level route, and are more likely to come
into HE from FE colleges, than White entrants. However, these
overall results mask divergences between groups of minority
ethnic students in their HE entry route and prior qualifications. In
summary:
z Indian and Chinese groups are the most likely to take the
traditional ‘A’ level highway’ to HE and are better qualified as
HE entrants; they are also more likely to have been at an
independent or grammar school.
z Pakistani and Bangladeshi groups do not gain as high ‘A’
level qualifications as Indian or Chinese, though do better than
Black students.
z Black groups, and Black Caribbean in particular, are
generally older on entry, with a wider range of entry
qualifications than the average; more progress to HE via the
FE college and work routes, and more are likely to have
vocational entry qualifications.
xv
These are generalisations, and there are further variations to be
seen in the entry patterns which are shown in more detail in the
report. But they serve to illustrate the distinct trajectories prior to
HE, which influence HE participation levels and patterns, and can
continue to have an effect on subsequent progress in HE and on
employment outcomes.
Other factors influencing HE entry
Prior attainment and entry route is not the only determinant of
HE entry or choice of study, though it is a significant one. Other
key influencing factors are:
z Influence of parents and families: a stronger push is given to
minority ethnic groups to succeed through gaining higher
qualifications, part of a ‘drive for qualification’ associated with
much of the minority ethnic population (section 3.2). Parental
influence also has a greater effect on minority ethnic young
people (section 4.4) in steering them towards certain courses,
especially the professional/vocational subjects (such as
medicine, law, business, IT).
z Expectations on economic gain/career advantage: individual
minority ethnic potential students hold more positive attitudes
about outcomes and benefits of HE than White students on
average (linked to above, parental views) (section 3.3), and
z Concerns about student finance: however, this was not acting
as a significantly greater disincentive to go on to HE for
minority ethnic than White potential students as a whole
(though differences within ethnic groups help shape views on
financial issues, eg likelihood of living at home, age, socioeconomic class, parental support) (section 3.4).
The effect of family social background, specifically parental
socio-economic status and parental experience of HE (section 3.2)
is also evident.
An important conclusion from the research is that the influence of
ethnicity on decisions about HE entry is a powerful one, but not
equally so for all minority ethnic groups. Being a member of a
particular ethnic group is one of a variety of factors affecting
decision-making about going onto HE. Some of the factors interact
with each other. In particular, it is likely that the strong positive
‘parental support/commitment to education’ effect is mitigating
some negative effects, such as being in a lower socio-economic
class (section 3.5). This would explain why, despite having lower
socio-economic class profiles on average, minority ethnic groups
are more likely to enter full-time degree courses.
xvi
Progression
Minority ethnic degree students are more likely to leave early
from degree courses than White students, and Black more likely
than Asians (section 5.1). But, once allowances are made for the
main factors which cause early leaving (in particular entry
qualification and entry route), and also controlling for other
differences (like subject, gender, age), the apparent ethnic
disadvantage reduces considerably, and younger minority
students actually do better than their ‘benchmark’ would suggest
(but older still do worse).
While there was no satisfactory reason found for this, other than
the likely continuation of the parental/family positive influence
factor noted earlier among young people, there were several
issues found to be of more concern to some minority ethnic than
White students on the whole, which may contribute to early
leaving. These related to staff support, feelings of isolation and
cultural diversity. Also, different patterns of term-time working
and different financial situations of minority ethnic and White
students may be affecting their progress in degree study (section
5.3), (and also degree performance, see below). This would benefit
from further investigating.
Degree performance
Fewer minority ethnic students gain first or upper second class
degrees overall (and also fewer in each minority ethnic group)
than White students. In particular, Black students are much more
likely to get a third or lower class of degree (section 6.2). However,
smaller differences exist between White and some minority ethnic
groups (especially Chinese) in first class degree attainment.
The degree performance gap reduces when controls for other
background variables are brought in (mainly entry qualification
and previous schooling), but does not disappear. There is also a
gender gap in degree performance: females do better than males
generally, but among minority ethnic degree students the gender
gap is smaller.
Feel good factor
A number of aspects of the student experience are also likely to
affect degree performance of students (eg extent of term time
working, financial issues), and also the extent to which students
experience difficulties in their degree study, which vary by
ethnicity (and also by other variables) (sections 5.4-5.6). But, on the
whole, final year students surveyed were highly satisfied with
outcomes so far, and there was no evidence of any greater
disadvantage felt by minority ethnic students on average at this
stage (section 6.3). Few race relations issues at institutions were
reported.
xvii
However, one year on, some (and particularly Black and Asian
graduates) when reflecting back, were less than satisfied with
their institutional and course choices. This is likely to relate to the
greater difficulties many face moving into the labour market on
graduation.
Transitions to the labour market
Minority ethnic degree graduates have higher initial average
unemployment rates compared with White graduates, with the
highest unemployment among male Pakistani and Chinese (over
twice the average). Female unemployment is generally lower than
male, and lowest among Chinese, Indian, Asian Other and Black
Caribbean than other female groups, though all of these are higher
than for female White graduates. The range of employment taken
up by degree graduates from different minority ethnic and White
groups varies. Although fewer minority ethnic than White
graduates are likely to be in jobs initially, the research evidence
suggests that they are in ‘better’ jobs than White graduates
(though this is a tentative conclusion as data are limited) (section
7.6).
There is a greater tendency for minority ethnic degree graduates
to seek further qualifications than White students, in particular
Chinese and most of the other Asian groups, rather than Black
graduates. There is also a divergence in qualifications being taken,
with Black Caribbean/Black Other graduates more likely to
pursue career-related study or training, while other minority
groups are more likely to be seeking further academic
qualifications. Thus, the pattern seen earlier continues — a greater
interest by some groups, some Asians in particular, to acquire
more qualifications, while others are more vocationally driven in
their education aims (section 7.3).
Net of any general ethnicity labour market effect which is likely to
make a contribution, an individual’s background and choice of
study (eg taking subjects such as IT which has lower employer
demand at present), prior education, degree performance,
career/job search attitude/behaviour and personal attributes can
all contribute to experiencing relative disadvantage in the graduate
labour market (section 7.4). The increasing diversity of the
graduate output, and also the variety of graduate opportunities
(along with limited statistical analysis of graduate destinations by
ethnic sub-groups), makes it difficult to draw firm conclusions.
Ethnicity is certainly making a contribution to many individuals’
experiences, but how much being a member of a particular
minority ethnic group adversely affects them directly, rather than
indirectly (ie through the other factors mentioned above), has not
been shown conclusively, and needs further investigation.
A number of programmes of positive action at universities are
designed to help improve employability of minority ethnic
xviii
students. While such activities are generally viewed positively,
and appear to be growing in number, there is a lack of evaluative
evidence to help employers, institutions, students or others to
judge which of them are most effective and for whom.
Under-representation in graduate intakes
A greater commitment to ethnic diversity in the workplace has
filtered into graduate recruitment programmes, especially in most
public sector organisations and some of the larger private ones
(section 8.1). Though there are some exceptions, on the whole,
minority ethnic graduates continue to be under-represented in
graduate intakes of large firms (section 8.2). There are a number of
explanations for this but the main ones are:
z the policies of some large employers’ of targeting their
marketing on certain institutions (usually those with high ‘A’
level intakes, from the pre-92 group and so with lower
densities of minority ethnic students)
z the lack of minority ethnic role models, especially at middle/
senior management level
z indirect or (but less likely) direct discriminatory practices in
selection methods (eg in competency frameworks, testing, use
of ‘A’ level scores, interviewer bias, assessment centre formats)
z work permit issues, and eligibility to work in the UK (students
may be classed as UK domiciled by universities, but do not
have a UK work permit) (section 8.3).
The research has shown that the recruitment process is a key area
to be addressed: minority ethnic graduates usually have less
chance of getting through each of the stages in the graduate
recruitment process of large organisations than White graduates;
and Black graduates appear to do the worst on average, while
Indians and Chinese fare better.
The more committed employers are actively engaged with
universities in a number of ways: improving their image; more
pre-recruitment activities with universities, eg offering
internships/vacation work placements, diversity mentoring for
students; and by also undertaking more diversity awareness
training of staff (section 8.4). However, these represent a very
small proportion of the total number of employers, especially in
the private sector, recruiting graduates these days.
Implications for policy and further research
This report has shown considerable diversity in the HE
participation of minority ethnic students, which means that a
detailed understanding of minority ethnic patterns and their
various causes is important in developing future policy. Various
xix
recommendations are made (see Chapter 9) on the need to be more
focused in approaches and in further research, a ‘stripping down
of the layers’ in order to identify issues clearly and also the groups
most likely to be helped most by specific policies.
In order to improve access to HE and choice, we highlight in
particular that:
z More needs to be done to raise earlier attainment and to close
the ‘A’ level gap, especially for some Black students. This
could be done through various current community and
school-based initiatives, many involving universities. More
evaluation is needed of current access initiatives, about their
ethnic dimension and outcomes for minority ethnic groups.
z There is also the need to better understand the influences
(both positive and negative) of parents in the decision-making
process about HE, their interaction with other interventions (eg
careers guidance). Any differences in the quality of careers
guidance for HE potential students on different entry routes
(via college, school, workplace) need to be identified and
action taken.
z Although student finance was not any greater deterrent for
minority ethnic than White students overall, it is important to
keep this under review and to monitor the possible effects of
the proposed changes to student finance, in particular likely
variable fees on student choice, and also take-up of Student
Loans.
z We also recommend that monitoring and evaluation of the
new Foundation Degree qualification includes racial equality
(along with gender, age and socio-economic class).
In order to improve performance and the student experience:
z Further investigations into retention, through research and
analysis, are needed and also into degree performance of
minority ethnic student groups on different programmes in
HE. Further research is also needed into the significance of the
various contributing factors which might explain differences.
Problems and issues in academic study which are likely to be
more associated with minority ethnic groups also need to be
better understood (eg through the new National Student
Survey, institutional monitoring and reporting systems) and
appropriate action taken at institutional and sectoral levels.
The role, and extent of family/parental support to students
needs investigating more.
And to help labour market transitions:
z Further research on graduate choices especially on why more
minority ethnic students choose further study.
xx
z A greater understanding of the effectiveness of different
career/employment support programmes in HE and
employing organisations (where minority ethnic groups are a
main target group) is required, and also of measures designed
to improve graduate employability (eg in the curriculum,
work-based projects). There is a need to ensure there are no
indirect causes of racial discrimination in these programmes
(eg in work placement allocation).
z More private sector employers should undertake ethnic
monitoring of all their graduate recruitment, (not just
corporate schemes) and make better use of such monitoring
statistics. More sharing of good practice and experiences
would be beneficial.
And, finally, there is a tendency in this area to focus mostly on the
least successful, and on difficulties, rather than on successes. Some
minority ethnic students are doing much better than comparative
White groups as illustrated in various places in this report. This
should be given greater recognition, along with the success
‘drivers’.
xxi
xxii
1. Introduction
The participation and achievement in education and employment,
of the minority ethnic population in the UK, is of current policy
interest.1 So too is the need to ensure that everyone who has the
potential to benefit from education at higher levels can access it,
and that certain groups do not face disproportionate barriers to
achievement.2 This report combines both these policy concerns —
it is about research on the factors influencing participation,
retention and progression in higher education (HE) of minority
ethnic groups, and their transition to the labour market.
1.1 The research
The research was commissioned by the Department for Education
and Skills (DfES) at the end of 2001, and undertaken by a team of
researchers based at the Institute for Employment Studies (IES).3 It
set out to update the current state of knowledge in this area to
help inform policy development.
1.1.1 Background
Over the last decade and more, the minority ethnic population in
the UK has been growing and becoming more diverse. Their
experiences and attainment in education, training and the
workplace have been changing. At the same time, there have been
increased opportunities for people from a wider range of
backgrounds to access universities and higher level qualifications
Demand for graduates in the UK economy has also been growing,
Why the Difference?
1
Ethnic Minorities and the Labour Market, cross-departmental Taskforce
arising from Cabinet Office Strategy Unit report (2002), whose aim is
to ensure that minority ethnic groups do not face disproportionate
barriers to accessing education and employment.
2
The future of higher education, DfES White Paper, January 2003.
3
The research was a multi-stage project, undertaken and managed by
the Institute for Employment Studies; some stages were undertaken
in partnership with MORI Social Research, Professor Tariq Modood
and research students at Bristol University, and the survey house,
Employment Research.
1
and graduates nowadays enter a much broader range of jobs and
careers than in the past.
It has been known for some time that minority ethnic groups are
comparatively well-represented in aggregate in HE study,1 though
their representation across the sector is variable. There are also
known to be variations in the participation in HE, and in the
subsequent achievement in the labour market, of different
minority ethnic student groups. These have been shown by earlier
research, which has also highlighted factors of influence on HE
participation, and achievements relating to institutional and
subject choices of study, and social and educational backgrounds
of students as well as factors related to ethnicity.2
This current research aimed to take a closer look at the differences
between ethnic groups, and their causes. It aimed to provide a
more up-to-date perspective, taking account of the various wider
changes in HE and the graduate labour market in recent years,
and also the changing nature of the UK’s minority ethnic
population.
1.1.2 Objectives
The specific objectives of the research were to:
z identify the various factors which encourage and inhibit the
participation, retention and progression in HE of minority
ethnic students, and their transition to the labour market
z assess the relative importance of these factors for various subgroups of minority ethnic students, including sub-groups
within, as well as between, minority ethnic groups. The subgroups of interest included, eg gender, age, family
background, geographical location, entry qualification, subject
and mode of study, type of institution and other personal
circumstances
z draw out appropriate policy implications.
1.2 Scope
1.2.1 Defining minority ethnic groups
The study focused on the main visible minority ethnic groups in
Britain today, that is those mainly from Britain’s Black and Asian
communities. Students are asked when enrolling at universities
2
1
See Modood and Shiner (1994) on differential rates of entry to HE.
2
See various research: IES report 309 by Connor et al. (1996) on ethnic
minority graduate outcomes; CHERI report to HEFCE Access to What?
(2002); and also papers in Modood and Acland (1998) on various
aspects of race and higher education.
Why the Difference?
and colleges (for their HESA student record) to categorise
themselves to an ethnic origin group (using the ethnicity
classification based on the Census, which has come into standard
use (see further details in Glossary at front of this report) and also
see Technical notes (Appendix B).
It was recognised throughout the study, however, that there are
complicated issues in defining ‘ethnicity’ and ‘minority ethnic’
and also the use of the standard ethnic groups. Ethnicity is a
multi-faceted phenomenon, subject to different individual
interpretations (eg physical appearance, cultural heritage, family
origin, etc.). British society has become increasingly ethnically
diverse, not only in terms of the origins of its minority ethnic
population, but also their languages, religions, socio-economic
status and lifestyles, which means that the data on the minority
ethnic population can be ‘cut’ in different ways. The ethnic groups
in standard use are intended to help in analysis, by distinguishing
between communities with common characteristics relating to
origin and cultural norms. But as there is generally little direction
given to help individuals know what aspects of their ethnicity
they should consider when deciding which group they are in,
inevitably they have some drawbacks and are subject to some
statistical error.1
We found significant differences both between, and within, the
minority ethnic groups of students and graduates surveyed in the
research, where factors such as generation of immigration (ie UK
born, first or second generation immigrant), country of family
origin, religion, socio-economic status, gender and geographical
location were important distinguishing variables.
In addition, the boundaries of the minority ethnic population, as
defined by the standard ethnic groups, are not static: there are
new immigrant groups, including recent asylum seekers and
refugees (eg from eastern Europe, Kurds, Somalis), some of whom
may not be captured by the standard non-White groups. Mainly
for this reason, and also because of their relatively small numbers,
it was not possible to consider them separately in this research,
but we recommend that they are given further research attention,
as they are likely to face some particular problems.
A further complication in data collection and analysis of different
ethnic groups, has been the change made in the ethnic origin
categories 2001 (adopted in the 2001 Census of Population, and
also in HESA student data from 2001 onwards, see Glossary). This
has meant that some of the earlier years’ data on students by
ethnic group are not directly comparable with those for 2001
onwards.
1
Why the Difference?
Discussed further in introduction to the fourth national survey of
Ethnic Minorities in Britain: Diversity and Disadvantage, Modood et al.,
(1997), and also the Cabinet Office Strategy Unit Report, op. cit.).
3
Though we have recognised the complexities in defining ethnicity
in this research study, and the diversity of the minority ethnic
groups in Britain today, one of the main given objectives of our
research was to identify the differences between the individual
minority ethnic groups in undergraduate study, and the reasons
for them (using the Census categories of ethnic origin). Where
data are felt to be sufficiently reliable, groups have been
disaggregated by other variables (eg by gender, age) to identify
sub-groups of interest, but small numbers in many places has
limited this, or made it possible only by combining some groups
together (as shown in the Glossary and also in Appendix B).
1.2.2 Higher education
In terms of higher education coverage, the research was confined
to home (ie UK-domiciled)1 undergraduate students, and so
excludes postgraduate students. Its geographical coverage was
England, or English institutions, rather than the whole of the UK.
It covers all undergraduates, full- and part-time, on degree and
other courses (which we refer to for brevity as sub-degree), at
universities and FE colleges, though most of the data relates to
universities rather than HE in the FE sector (now known as the
Learning and Skills sector). Where there is any divergence from
these definitions of scope, it is explained in the text.
1.3 Methods
The research comprised a relatively complex, multi-stage project
with linked stages, undertaken over the last two years. It consisted
of a literature and data review to assess the existing available
evidence, plus surveys and interviews with key targeted groups.
These comprised:
z A national survey of just over 1,300 current undergraduate
students in both FE and HE institutions, in Spring 2002. In
addition, a small number of survey respondents (30) were
interviewed in more depth to explore issues further, and
interviews were also undertaken at each of the 29 HE
institutions participating in the survey.
z A national survey of almost 1,000 potential HE entrants,
currently in Year 13 (or equivalent) in schools and colleges,
plus in-depth interviews with a subset of 42 of them, between
October 2002 and February 2003.
z A survey of 80 parents of current students, and in-depth
interviews with 13 of them including ten from minority ethnic
groups, undertaken between December 2002 and February
2003.
1
4
‘UK-domiciled’ excludes students coming to study in UK from overseas, who are classified as foreign students for fee-paying purposes.
Why the Difference?
z A follow-up survey of 103 graduates, in July 2003. The sample
was generated from final year students participating in the
first phase of the research. An additional six qualitative
interviews with minority ethnic graduates were undertaken.
z Interviews with 20 graduate recruiting employers, and also a
number of careers advisers and others involved in HE
diversity programmes, in Summer 2003. The employers
interviewed were mainly large organisations, with graduate
intakes of variable sizes.
Each stage is discussed further in the Technical Notes in
Appendix B, and is outlined below:
1.3.1 Literature and data review
Initially, the intention was to use the literature and data review to
draw out key themes of relevance to the study, and guide its
design, but some of the statistical sources were used in a more
direct way than had been initially envisaged. In particular,
analysis of the HESA data on the undergraduate student
population by ethnicity turned out to need more extensive
analysis work, as little of the detail required was available from
published sources. The HESA student dataset proved to be a
better source for examining small ethnic groups than other
sample-based data generated, due to its comprehensive coverage
of the student population. In addition, other large scale surveys
were found to be useful, in particular the First Destinations of
Graduates (FDS, also from HESA).
1.3.2 The student survey and interviews
The main purpose of undertaking a student survey was to
supplement the existing data available on students (from the
national HESA student record system) on motivations for entering
HE, factors influencing choices made, experiences within HE to
date, and job and career plans, and also to expand the range of
personal data available on minority ethnic students. The survey
was undertaken by face-to-face interviews by MORI researchers at
33 campuses. The sample included a representative sub-set of
White and minority ethnic students (465 and 70 respectively), plus
a sub-set of only minority ethnic students (715), needed to ‘boost’
the survey sample for undertaking analysis by individual
minority ethnic group.
1.3.3 The potential entrant survey and interviews
This part of the study investigated intentions regarding HE entry,
factors affecting entry decisions, and choices on what and where
to study, and experiences of the HE application process. It had a
quantitative and a qualitative element.
Why the Difference?
5
The quantitative part comprised a self-completion survey of a
sample of almost 1,000 Year 13 (or equivalent) students at 18 state
schools and colleges in England, all taking courses leading to HE
entry (mainly ‘A’ or ‘AS’ levels, but also GNVQ and HE Access
courses), and so could be considered as ‘potential HE students’.
All of the schools and colleges selected had above average
representations of minority ethnic pupils, and so the sample was
able to generate sufficient numbers of potential entrants from
different ethnic groups for comparative purposes. (Approximately
70 per cent of the 957 in the achieved sample had a minority
ethnic origin.) It should be noted, however, that this was not a
representative sample of all minority ethnic potential HE students,
and especially not a representative sample of all White potential
HE students. But, in many ways, the sample was similar to the
undergraduate intake of English universities. It had a bias
towards FE colleges in order to capture data specifically from that
entry route, and no independent school was included. The survey
was administered and analysed by the survey organisation,
Employment Research.
In addition, 20 minority ethnic potential students who had
completed questionnaires were also interviewed by telephone and
a further 22 interviewed face-to-face at their school or college, to
explore some of the issues raised in more depth. They were
selected to cover a range of ethnic and biographical characteristics.
1.3.4 The parent survey and interviews
This focused on a sample of 80 parents identified from the student
survey, who were interviewed by telephone, of which 13 were
interviewed a second time in more depth. Its purpose was to
explore their influence on decisions made by their offspring to go
on to HE study, including the extent to which parental attitudes to
education are also influenced by their own experiences of higher
education, and the support being given to their student sons and
daughters. Thirty per cent of the telephone interview sample were
from a minority ethnic background, and the majority of the latter
were first generation immigrants to the UK. The majority of both
White and minority ethnic parents in the sample had completed a
formal period of compulsory education, with around half having
been to higher education themselves. The social class profile of the
White parents was slightly higher than for minority ethnic parents
(just over half were in a professional/managerial occupation,
compared with just under half of the minority ethnic parents in
the sample).
1.3.5 Graduate survey
The sample of past students, ie graduates, was generated from the
database held by MORI of final year students, interviewed in May
2002, who had said they were willing to participate in a follow-up
6
Why the Difference?
survey. In total, 262 agreed to be contacted and gave details, and
telephone interviews were achieved with 103 of them one-year
later, an unadjusted response of 39 per cent. Fifty-three of these
were of minority ethnic origin. Interviews covered their
qualification details, activities since graduation, financial
situation, experiences of applying for jobs, reflections on their
undergraduate studies, and future plans.
A further six in-depth interviews were also undertaken with
recent graduates. In addition, an analysis of 91 minority ethnic
graduates in Wave 3, the IES ‘Student Choice’1 survey, was
undertaken (with a sample of 1,300 graduates) to generate
additional data.
1.3.6 Interviews with graduate recruiters
The employers interviewed included graduate recruitment
managers, HR managers and diversity/equality managers in a
sample of 20, mainly large, organisations. A great deal more
organisations of varying sizes were contacted by telephone, but
refused to take part. Those who did gave details of the
representation of minority ethnic groups in their graduate intakes,
and their policies and practices relating to encouraging ethnic
diversity in graduate recruitment. In addition, a seminar was
organised by the Association of Graduate Recruiters (AGR) in July
2003 and a number of careers advisers, professional bodies and
individuals engaged in related activities were also interviewed.
1.3.7 Interim report
An interim report on the research was published in July 2003.2
This presented the results of the project at around the halfway
stage. It mainly presented an analysis of student data, which
showed the participation patterns of minority ethnic students in
HE and possible explanations from the existing research evidence,
and also the full results of the student survey (see section 1.2.2
above).
In addition, five internal working papers have been produced
during the course of the project, presenting initial findings to the
DfES from each of the fieldwork stages, and conference papers
given to the DfES Research Conference in November 2002, the
Society of Research in Higher Education Annual Conference in
December 2002 and a CRAC conference in November 2003.
Why the Difference?
1
See Connor et al. (2001). In 2003, IES undertook a follow-up to the
‘Making the Right Choice’ study, which was the third time the
original sample of 1998 university applicants had been surveyed; and
most had left university/college in 2001/02.
2
See Connor et al. (2003) DfES Research Paper 448.
7
1.4 This report
This is the main final report on the project. It is a synthesis of all
the research findings, from all the stages of the project, and draws
conclusions and policy implications.
This main report has nine chapters:
Chapters 2 and 3 explore entry into HE, highlighting the different
entry routes taken, and the various factors which can effect entry
patterns. Chapter 4 presents a statistical picture of the distribution
of different ethnic groups in undergraduate study, and the factors
which shape this.
Chapters 5 and 6 focus on the progress and experiences, within
HE, of minority ethnic and White students, and discuss the range
of factors influencing outcome and attainment.
Chapters 7 and 8 then look at output — at the flows out from HE
to the labour market; Chapter 7 presents the transition stage from
the student perspective while Chapter 8 gives an employer and
employment perspective.
Finally, Chapter 9 presents our conclusions.
Appendix A includes some additional tables and Appendix B
provides further details of the research methodology and other
technical issues. The set of questionnaires used in the various
stages are available electronically, on request to IES.
1.5 Background and context
Before presenting the research findings in more detail, a few
introductory points are made here, to help set the research in
context and interpret the research results.
1.5.1 Minority ethnic population trends
Although Britain has always been populated with groups which
have different ethnic and cultural backgrounds, today’s minority
ethnic population (as referred to generally) is largely a result of
waves of immigration during the 1950s and 1960s, from the ‘New
Commonwealth’ (Indian subcontinent, South East Asia, Caribbean
and Africa). In addition, more recent flows of immigrants have
continued to come from there and from other parts of the world
(but in smaller numbers, mainly Chinese, Black Africans, and
Asian Others), as well as, even more recently, asylum seekers and
refugees predominantly from the Middle East, Africa and eastern
Europe.
Thus, different migrant groups have entered the UK at different
periods of time. They settled in different locations, and although
8
Why the Difference?
there has been some dispersion over time, today’s minority ethnic
population distribution in Britain largely reflects earlier settlement
concentrations, mainly in London, the Midlands and a number of
northern industrial towns and cities. However, as already pointed
out above (see section 1.2.1), they have become an increasingly
diverse population. Although the main minority ethnic groups,
which were the focus of this study, have some distinctive
characteristics, in terms of, eg their experiences of the migration
/assimilation process, family and age structures, religions,
languages spoken and employment patterns,1 the groups
themselves also display a degree of heterogeneity. Additionally,
there are increased numbers of people who class themselves as in
a ‘mixed ethnic’ group, especially the young population.
By 2001, the latest Census recording of the population, the UK’s
minority ethnic (ie non-White groups combined, including mixed
ethnic origin) population had grown to approximately 4.6 million,
or just under eight per cent of the total population. This was up
from 5.5 per cent in 1991, and represented a growth of 48 per cent.
The population figure for England only is approximately 4.5
million, representing a higher figure than for the UK as a whole, at
just over nine per cent.
But, unlike the situation a few decades ago, the majority of today’s
minority ethnic population are British born. Also, it is important
to note that they have a comparatively youthful age profile, with
over 40 per cent under the age of 25 years (compared with just
under 30 per cent of White people). This, combined with
comparatively high birth rates and some continuing immigration,
is expected to lead to a continued expansion in the UK’s minority
ethnic population over the next decade.
1.5.2 Attainment of minority ethnic groups
Although considerable progress has been made over the last two
decades, the overall attainment of the minority ethnic population
overall, in education and the labour market, remains poor in
comparison with the White population. As indicated in the recent
Cabinet Office Report cited above (pp. 24-34), they still experience
a comparative overall disadvantage in several key areas: higher
unemployment rates; lower earnings levels and lower proportions
in higher level occupations. However, this overall picture masks
significant differences between individual minority ethnic groups
with, eg Indian groups having higher employment rates and
occupational achievement than Pakistani and Bangladeshi groups,
while Black Caribbean groups are significantly more
disadvantaged in many respects compared with Black Africans.
There are also differences between first and second generation,
1
Why the Difference?
For further analysis of the minority ethnic population in Britain, see
Interim Report on Ethnic Minorities and the Labour market, Strategy
Unit of Cabinet Office, 2002.
9
between men and women, and between geographical locations,
for different minority ethnic groups. This can produce a complex
situation to analyse, more complex than existed in the 1980s,
because of the population changes.
The causes of labour market underachievement are many and
varied, but a key determinant is human capital — defined as the
sum of the skills, knowledge, experience and educational levels a
person possesses. Significantly, human capital levels have been
found to vary between ethnic groups.1 Generation is an important
factor in educational attainment of minority ethnic groups: second
generation males and females have better educational outcomes
than first generation (seen at GCSE level and in terms of having a
qualification or not, though often from a fairly low first generation
starting point). Other factors, including cultural or religious
attributes, and fluency in English, also influence minority ethnic
educational attainment and their labour market achievements, but
accounting for them is difficult due to a lack of good quantitative
measures (see discussion in Cabinet Office report cited above).
These issues are discussed further in the report in relation to
factors influencing higher education entry and outcomes.
1.5.3 Trends in higher education and graduate
employment
Turning to the higher education context, and also graduate
employment trends, there have been a number of changes over
the last two decades which are likely to have an influence on
minority ethnic participation in HE and achievement/transition to
the labour market, including:
z considerable expansion in undergraduate places, especially in
the early 1990s, and also a broadening of the HE sector (in
terms of subjects, type of study, etc.) and of the student body
(widening access in terms of entry qualifications and personal
characteristics)
z various changes to the student financial support system and to
the contribution students make to the cost of their courses
(and further change proposed in recent legislation). This has
led to more concerns about students’ expectation of, and
management of, debt.2 There is also a growth in term-time
working by students, mainly to supplement their income
z a continuing strong employer demand for graduates, which
has kept their initial unemployment relatively low overall, and
10
1
See Interim analysis report on Ethnic Minorities and the Labour Market,
Cabinet Office Strategy Unit, pp. 71-78.
2
See recent Callender (2003), Attitudes to Debt of School Leavers and FE
Students.
Why the Difference?
average economic returns to HE good (and contributed to the
continuing high student demand for HE)
z however, graduate demand varies by subject, university,
background, etc. and also job/career outcomes. The graduate
marketplace has become more differentiated, with some
employers seeking particular types of graduates, along fairly
traditional lines to graduate schemes (eg selecting on the basis
of ‘A’ level grades, by targeting universities),1 while also
taking graduates into a wider-range of jobs, where they may
be applying alongside non-graduates.
Change has not happened equally across the sector. In particular,
universities have developed in different ways, with different
strengths and roles, and appeal to students differently.
Also, there have been a range of policy initiatives to widen access
and improve social equality of access to HE, which have been
aimed primarily at tackling differences in participation by socioeconomic class groups. Some minority ethnic groups have been
included in projects under widening access initiatives to raise
aspirations and attainment (eg Excellence Challenge now renamed
Aimhigher), which target particular socio-economic groups or
disadvantaged areas, though in general minority ethnic groups
are not seen as an ‘under-represented’ group.2
These and other mainstream issues relating to HE and university
access are discussed further in the report.
Why the Difference?
1
See various reports, but most recently, Morey et al., HE Careers
Services & Diversity (2003), report to HECSU and AGCAS.
2
Stated in National Audit Office report on Widening Participation in
Higher Education in England (2002).
11
2. Routes to Higher Education
Educational attainment is generally recognised as being central to
the progression to HE for young people.1 So it is very likely that
any differences between minority ethnic and White students in
attainment, at school and in post-16 education will be reflected in
their likelihood of proceeding to higher education. We start our
report, therefore, by focusing on prior attainment and routes into
HE study. As will be seen later, these are not only key factors
influencing minority ethnic entry to HE but also affect their
pattern of participation within HE, their subsequent progress and
achievement, and their graduate outcomes too. In this chapter we
show how some minority ethnic groups are more associated with
particular routes taken post-16 that can lead to HE entry. It also
identifies a range of factors in addition to ethnicity, which impact
on prior attainment, and may affect HE decision making, which
are discussed further in the next chapter.
2.1 GCSE qualifications
Although options about careers, including going on to HE, are
often considered before the age of 16, and many policy initiatives
to raise aspirations and attainment of potential HE entrants from
more socially and economically disadvantaged groups is focused
at an earlier age (eg Aimhigher, Excellence Challenge, Partnership
for Progression), we start our discussion at around the GCSE stage
and Year 11 of school. This is because this is where we have the
earliest good statistical evidence on attainment, which has a direct
link with likelihood of HE participation.
It has been established that, in general, GCSE attainment at the
end of Year 11 significantly influences entry to degrees in HE by
aged 19. According to analysis of Youth Cohort Survey, Sweep 3,2
96 per cent of 18-19 year olds studying for a degree attained five
12
1
See various reports, such as The Dearing Report, NICHE, 1997, NAO
report on Widening Participation in Higher Education in England (2002)
and research studies, such as Hogarth et al. (1997); Hodgkinson and
Spours (2000).
2
In Gayle, Berridge and Davies (2003), Econometric Analysis of the
Demand for Higher Education.
Why the Difference?
plus GCSEs in Year 11; also the more GCSEs held, the greater
likelihood of being in degree level study.
Our survey of potential entrants (ie Year 13 students or equivalent,
mostly under 21 years of age, see survey discussion in section
1.3.3 and Appendix B, Section. B.5 for more details) supports this.
Of all the biographical and educational variables analysed, as
likely influences on minority ethnic student intentions, it was the
number of GCSEs they had attained so far which had the greatest
effect. Both White and minority ethnic students with fewer GCSEs
(less than eight) were more likely to have decided not to apply to
university in the current year, and this lower attaining group were
also more likely to be unsure about doing so, again for both White
and minority ethnic students, than the higher attaining students.
Other research has shown variations in attainment between ethnic
groups at various stages of schooling. Overall, the disparities
increase over the course of schooling: at GCSE, Black Caribbean
and Pakistani are the worst performing groups (with below 40 per
cent of pupils obtaining five or more GCSEs in grades A*-C, 19992002, England and Wales); Bangladeshis do slightly better, but not
as well as White pupils (just over 50 per cent); and Indians
perform the best (around 60 per cent).1
There are a complex set of reasons for the differences between
ethnic groups at GCSE level,2 in particular, the higher
performance of Indians, and lower performance of Black
Caribbean, and Pakistani pupils. Some of the factors — many
relating to socio-economic class — which may hinder educational
achievement, apply more to some minority ethnic groups than to
others. For example, the effect of relative economic disadvantage
is evident in the much lower attainment at GCSE of children
eligible for free school meals (FSM), compared with children from
same ethnic group who are not. But there are also other socioeconomic factors (eg local area deprivation) not captured by the
FSM index (and not all children from FSM groups have low
attainment, eg the Chinese group are an exception to the general
rule). Gender can also be an important variable (girls generally
perform better than boys at GCSE, and this is especially evident in
the Black Caribbean group). Another factor, likely to be
influencing minority ethnic groups in different ways, is school
environment and location: most minority ethnic pupils go to
school in the major conurbations, and two in five go to school in
Why the Difference?
1
See Figure 4, p. 9, DfES Research Topic paper RTP01-03, by
Bhattachayya et al., (2003). Chinese also perform well but the number
is too small to be shown separately from this data source, YCS, 16
year olds.
2
See DfES report cited above and also the various reasons are
discussed in our Interim report, p. 35, drawing on earlier research
evidence.
13
London.1 Many minority ethnic pupils go to schools where the
majority, or even the overwhelming majority of pupils, are White,
and such schools may be less well-equipped to meet the needs of
some minority ethnic pupils, than those where they form the
majority. School experiences (eg teachers’ low expectations, racial
abuse or harassment, lack of role models, peer pressures), parental
education, parental occupation levels, parental level of engagement
in their children’s education, and parental aspirations for their
children have all also been shown to influence attainment of
minority ethnic pupils.
There is no consensus about the relative significance of the effect
of these different factors on attainment. The recent Cabinet Office
report (see earlier, section 1.6), showed a complex interaction of
relationships between ethnicity and attainment of young people.
Actions taken in recent years to raise minority ethnic attainment
in schools have been successful in various areas, though the
statistics show that there is still room for improvement. Much of
this positive action has focused on schools and LEAs (eg better
LEA monitoring of ethnicity, leading to better targeting of
additional resources; additional mentoring support to learners, in
particular Black Caribbean boys; and staff development to raise
awareness in mainstream teaching). OFSTED reports show that
improvements have also been made in combating racism in
schools, though not all schools have adequate procedures in
place.2 There are also a number of projects aimed specifically at
raising the awareness and aspirations of the more able students
from minority ethnic groups (potential HE entrants), especially
Black boys, often involving out-of-school activities (eg Saturday
schools and sports run by LEAs, Windsor Fellowship, universities
etc.) and so to close the attainment gap and encourage more of
them to continue in education beyond compulsory school leaving
age.
2.2 Staying on post-16
As well as GCSE attainment, another factor shown to affect HE
entry is ‘staying-on rates at 16’. Staying-on in full-time education
at 16 is higher among minority ethnic groups as a whole than
Whites, but lower among Black than Asian groups in aggregate,
while higher for Chinese and Indian groups (YCS, 2001). There is
also variation by gender within ethnic groups which shows a
different pattern: higher staying-on rates for Black and Chinese
girls than Indian, Pakistani or Bangladeshi girls.
But, as shown in the next section, the pattern of staying-on varies:
minority ethnic groups as a whole are more likely than White
14
1
Analysis of the Youth Cohort Study in Gayle et al. (2003) Econometric
Analysis of the Demand for Higher Education, DfES.
2
See Bhattachayya et al., 2003 cited above.
Why the Difference?
Table 2.1: Main reasons students (now in Year 13) gave for staying in education at age 16, by
ethnic group (mean scores)1
Black
Caribbean
Black
/Black
Pakistani/
African
Other
Bangladeshi
Indian
Chinese/
Asian
Other
All
minority
groups
White
Wanted higher level
qualifications
4.7
4.7
4.7
4.7
4.5
4.7
4.5
To go to university
4.7
4.4
4.6
4.8
4.7
4.7
4.1
To get better job or career
4.6
4.7
4.4
4.6
4.6
4.6
4.5
To study specific subjects
4.2
4.3
4.2
4.2
3.9
4.2
4.1
86
58
117
160
62
534
208
Base number
1
Mean scores range between 1 = ‘Not important’ and 5 = ‘Very important’, with 3 being a mid-point score. Other
reasons (not shown), such as ‘to retake qualifications’, ‘friends staying-on’, ‘didn’t know what else to do’ had much
lower average scores (under 3.0). Only those who opted to stay on at age 16 were asked this question.
Source: IES survey of potential entrants to higher education, 2002/3
students to go on to further education or sixth form college at 16,
than stay on at school.
Various explanations have been put forward in the research
literature for this higher staying on pattern for most minority
ethnic groups. They include: higher motivations to continue in
education and gain higher qualifications than enter relatively low
lower-skilled jobs or work-related training (expressed often as a
greater ‘drive for qualification’1 or ‘higher aspirations’ among the
minority ethnic population); taking re-sits to improve
performance; and linked to both of these, the expectation that
better qualifications will reduce the effect of possible future racial
discrimination in the labour market.2
Our survey of potential HE students (ie with a sample of Year 13
students likely to be qualified to enter HE the following year) puts
more emphasis on the positive factors: a stronger drive for
qualifications was evident among minority ethnic than White
students. When the sample of potential HE students (in Year 13)
were asked their reasons for staying in formal education beyond
compulsory leaving age (age 16), four reasons were given much
greater significance by both minority ethnic and White students:
to get higher level qualifications, to go to university, to get a better
job/career and to study specific subjects. But minority ethnic
students gave more importance to ‘to go to university’ than White
students did. It was seen as slightly more important for Indians
than for most other minority ethnic groups, but less important for
Black Caribbean/Black Other (Table 2.1).
Why the Difference?
1
See Modood et al. (1997), Ethnic Minorities in Britain, Diversity and
Disadvantage.
2
See further discussion of staying-on at 16 and choices in Payne (2003),
Choice at the end of compulsory schooling: A research review.
15
2.3 Different post-16 education choices
Minority ethnic students disproportionately leave school to attend
FE colleges, even to study subjects that are available at school.
Black Caribbean students, in particular, are more likely to study
for their HE entry qualification within a non-school environment
and may drop out of school at age 16, picking up study at a later
date.1 A likely related issue is that Black Caribbean pupils,
particularly young men, are up to four times more likely to be
permanently excluded from school. However, the reasons why
individuals opt for school or college study post-16 are varied and
complex. For some minority ethnic pupils, it may relate to more
difficult relationships with schoolteachers (for instance, some tend
to see Black young men as ‘less able’ and ‘more threatening’ than
Asians).2 Other issues include the development of a ‘street’, or
anti-school subculture amongst young Black men, in which being
popular and academically successful are seen as mutually
exclusive.3 More general issues affecting post-16 education choices
relating to attainment, subject preferences in post-16
qualifications, and also geography may come in to play. The
profile of courses taken by students in schools and sixth form
colleges is largely similar, but FE colleges have a higher
proportion of students on vocational courses; and Year 12
students at FE colleges have poorer GCSE results than those in
schools and sixth form colleges (Payne J, 2003 op. cit.). The pattern
of post-16 provision differs across the country, as does the choice
of subjects. In some localities, especially in inner London
boroughs, there is no school sixth form option available. Overall,
FE colleges draw half of their intake at age 16 or 17, from schools
without sixth forms.
Choice of post-16 educational route is important in relation to HE
entry, for a number of reasons. Firstly, as already highlighted,
education provision varies between the school and college sectors.
Likely opportunities and educational experiences for young
people also vary, in particular those that build personal
confidence.4 Secondly, there is a difference in careers guidance
provision available to young people. Thirdly, there are widely
differing outcomes of students going into colleges at 16 than
staying in the school sector, with much higher drop-out rates in
colleges (and wide variations between colleges also). Fourthly, the
qualification, age and social class profiles of HE entrants from
16
1
Evidence presented by Modood, ‘Ethnic Differentials in Educational
Performance’ (Chapter 4, Mason, 2003).
2
Evidence presented in Payne J (2003), Choice at the end of compulsory
schooling: A research review.
3
Evidence presented in Aymer and Okitikpi (2001), Young Black Men
and the Connexions Service.
4
See NAO (2002), Widening Participation in Higher Education in England.
Why the Difference?
colleges are different from schools: FE colleges provide half of all
places for young people in full-time education at 16, but an even
larger proportion of those from lower socio-economic class
backgrounds (and from minority ethnic groups, as highlighted
above); and students at colleges, are more likely to take vocational
level qualifications (on their own or with ‘A’ levels) than ‘A’ levels
only.
2.4 Delaying HE entry
Our survey of potential entrants (Year 13), found that some
minority ethnic groups were more likely to be planning to take
time out of education (a gap year or two) before entering HE.
These were more likely to be Black Africans, and less likely to be
Indian or Chinese students. They were also more likely to be older
students. As shown below (section 2.6), Black undergraduate
students tend to be older on average at entry to HE, and more
enter via the Access qualification route from colleges. Our student
survey also showed that more older students had already taken
‘time out’ from full-time post-16 education than younger students
(as might be expected), but here it was the Black Caribbean/Black
Other group who were more likely to have done so. Along with
Black Africans, they were more likely to delay entry to HE in this
way than other ethnic groups.1
From our survey of current students, the main reason given for
delaying HE entry was to work and earn some money first. But
White students were much more likely to have taken time out as a
more typical ‘gap year’ (eg to travel abroad, do voluntary work),
than most minority ethnic groups. The survey also showed that
older people were more likely to have applied for their university
place from an employment situation rather than from school or
college (the traditional way), and so were likely to have got less
formal support with their university application.
2.5 Entry qualifications for higher education
Being qualified to enter HE (ie gaining the normal minimum level, a
level 3 qualification) is clearly central to participation. Minority
ethnic people at aged 18 are slightly less likely to hold a level 3
qualification than White people, but by age 19 there is little
difference.2 By 19, Asian groups are far more likely than White
groups to hold a level 3 qualification (although there is no separate
Why the Difference?
1
See also discussion in Chapter 4 on young HEIPRs (section 4.1.1),
where Black groups have much lower HE participation rates at 17-19
years than Chinese or Asian groups, and the Black Caribbean group
has the lowest (only 17 per cent of the 17-19 age group compared to
the average of 28 per cent).
2
See YCS (2001).
17
data for Black groups shown in the YCS analysis, because of small
numbers, nor breakdown of the Asian group; by deduction it
would seem that Black groups are less likely than Asian groups to
hold a level 3 by 19). However, as highlighted above, Black
students tend to be older on average and so these figures are likely
to underestimate their likely attainment at level 3.
When looking at qualification data for all people of working age
in the UK, the Black group is the least likely group to hold
qualifications at level 3, less so than among White or Asian
groups.1 But when disaggregated further, it is Pakistani and
Bangladeshi groups who are the least qualified (in particular, a
much higher percentage of them hold no qualifications than other
groups), followed by Black Caribbean, but Indian, Chinese and
Asian Other groups are on a par with Whites.
The type of qualification held at level 3 is important in relation to
HE entry. The ‘A’ level route into HE continues to be the primary
entry route taken by young people entering degree courses by age
21, and especially by those going to the more academic, pre-92
universities. Ninety per cent of those with two or more ‘A’ levels
go on to higher education by age 21, compared to around half of
those who achieve vocational level 3 qualifications by aged 18.2
While the vast majority of level 3 holders are ‘A’/’AS’ qualified,
this is far more likely among White than minority ethnic students,
at age 18 or 19 years. However, looking at 19 year olds only,
Indians are more likely than other minority ethnic groups
(combined) or the White group to hold ‘A’ levels (no further
ethnic disaggregation available).
Reasons for these differences by aged 18 and 19, are likely to relate
to the different routes taken post-16, especially the choice of going
to college or staying at school; also some minority ethnic groups,
in particular Black groups, take longer to achieve the same
qualifications.3 Some care, therefore, has to be taken with these
figures on attainment of young people, as qualifications held by
age 19 can under-estimate progression to HE for some minority
ethnic groups.
18
1
See Labour Force Survey, 2002 (and Table 6, p. 26 of Bhattachayya et al.,
2003, cited earlier).
2
See ‘Appendix 1’ in Consultation on Key issues relating to fair admissions
to HE, Admissions to HE Group, DfES, (‘Schwarz Review’), 2003.
3
See research by Berthoud (1999), which showed that Pakistani and
Bangladeshi men took longer than Indian or Black men to achieve the
same qualification, and men generally took longer than women in all
minority ethnic groups except the Pakistani and Bangladeshi groups.
Why the Difference?
2.6 Highest entry qualification of current students
As might be expected from the discussion so far, there are
differences between ethnic groups to be found in the highest entry
qualification of current undergraduate students, especially young
entrants.
Black students are less likely than White or Asian students to
enter HE with ‘A’ level qualifications (or equivalents). In 2001/02,
only around one-third of Black undergraduate students (full and
part-time) at English universities (including just 29 per cent of
Black Africans), compared to 55 per cent of White students and
over two-thirds of Asians (and even more Indians, 72 per cent)
had GCSE ‘A’ level, SCE Higher, GNVQ/GSVQ or NVQ/SVQ
level 3 as their highest qualification on entry to their course. Black
students were more likely to hold Access course qualifications or
other types of qualifications (eg ONC/OND, other higher level
qualifications).
Mature students
Some of this variation in entry qualifications is due to age
differences: older students, in general, are likely to have different
entry qualifications (fewer with traditional ‘A’ levels).
The minority ethnic groups in HE, and especially in university
full-time degree study, have noticeably different age profiles (see
Figure 2.1), Black, especially Black African, undergraduate
Figure 2.1: Minority ethnic and White undergraduate students by age on entry, England,
2001/02 (includes part-time and full-time)
White
Black Caribbean
Black African
Black Other
Indian
Pakistani
Bangladeshi
Chinese
Other Asian
Mixed
Other
All minority ethnic
0%
10%
20%
30%
40%
under 21 years
50%
21-29
60%
70%
80%
90%
100%
30+
Source: HESA
Why the Difference?
19
students are, on average, older than White and Asian students.
Mature students (aged 21 plus) are disproportionately more likely
to be among Black groups in full-time degree study (half of Black
first year students are aged 21 or more, compared with around 20
per cent of White, and even fewer Indian first year students).
Focusing only on younger students (aged under 21 on entry), a
much higher proportion of the total, just over 80 per cent, have ‘A’
level qualifications (or equivalent). But there are relatively small
differences between minority ethnic groups, except among Black
students, where this proportion drops to a little over 70 per cent.
Entry to degree courses
The above figures combine degree and sub-degree courses.
Degree courses tend to have higher entry qualifications than subdegree (though there are a few exceptions). The different entry
profiles of Black students to degree courses (full- and part-time),
compared with other ethnic groups, is particularly noticeable: less
than one-half hold ‘A’ level qualifications (or equivalent) compared
with around three-quarters of Asian and White students (see Figure
2.2, and Appendix Table A5 for further details).
There are also differences in ‘A’ level grade scores between ethnic
groups, though this information has only been obtained from
UCAS admissions statistics and so only for full-time accepted
applicants. Of those qualified with two plus ‘A’ levels, higher
grades are obtained by full-time degree accepted applicants from
White than from minority ethnic groups on average, but the
highest in this respect are Chinese and Asian Other which are on a
Figure 2.2: Percentage of minority ethnic and White degree students with ‘A’ levels as
highest qualification, England, 2001/02
White
All minority ethnic
Black Caribbean
Black African
Black Other
Indian
Pakistani
Bangladeshi
Chinese
Other Asian
Mixed
Other
All (known ethnicity)
0%
10%
20%
30%
40%
50%
60%
70%
80%
90%
100%
Source: HESA (see Table A4, Appendix, for further data on entry qualifications)
20
Why the Difference?
par with White students (similar percentages achieving 21 plus
points). Indians are just behind the White group in this respect,
but considerably ahead of most other minority groups (further
details are given in the Interim report, Table C7, for 2001 entrants).
Since 2002, UCAS has introduced a new Tariff system to enable
equivalencies to be made between the various qualifications,
especially the new ‘AS’ qualifications. In the published statistics,
the vast majority of accepted applicants have a Tariff ‘score’, but
there is more missing data among some ethnic groups than others
(eg only half of Black Africans and around 60 per cent of other
Black students have Tariff scores). Care, therefore, is needed using
these data for comparative purposes, and also it is the first year
that they have been published, so they are still at a trial stage. But
they support points, made above, that minority groups overall
tend to have lower entry qualifications than White students, but
that some groups have much higher entry qualifications than
others. For example, over half of all minority ethnic groups, except
Chinese and the Asian/White mixed ethnic group (at 46 and 41
per cent respectively) fall into the lower Tariff groups (less than
300 points), while the comparative White figure is 49 per cent.
Among Bangladeshi, Pakistani, Black African and Black
Caribbean groups this applies to over 70 per cent of UCAS
acceptances (where a score is given). At the top end of the Tariff
(480 points plus), the Chinese outstrip all other groups (16 per
cent of them are in this category), which compares with ten per
cent of White acceptances, and seven per cent of Indians.
2.7 School or college previously attended
The UCAS admissions data provide evidence on differences in
school backgrounds also by ethnic group. More minority ethnic,
and especially Black, acceptances to full-time degree courses come
via the further education sector, which is what we would expect
from the discussion above on post-16 routes (see section 2.3); also,
slightly more come from a sixth form college, compared with
White entrants. While there are fewer minority ethnic entrants
overall from independent schools, certain groups, notably
Chinese, and to a lesser extent Indians, Asian Other and mixed
ethnic groups, are more likely than White students to follow this
route. As shown above, these tend to be groups more likely to
take the traditional ‘A’ level route. Minority ethnic entrants are
also less likely to have come from a grammar school than White
students on average, with the exception of Chinese and Asian
Other groups. Pakistani and Bangladeshi students are the most
likely groups to have progressed to HE from a sixth form college.
(further details in Table A6).
In general, it has been established, from the recent YCS analysis
cited above, that a much higher percentage of young people who
attend independent rather than state schools (at year 11) go on to
enter higher education (by age 19), and also a higher proportion
Why the Difference?
21
who attended ‘selective’ rather than non-selective’ schools.
Unfortunately there is no similar information available for later
years of schooling, nor any breakdown by ethnicity.
2.8 Summary
This chapter has shown that there are significant differences in
routes into HE, and in the prior attainment of minority ethnic and
White groups. These are likely to be due to a number of factors,
many of which relate to the different economic and social
compositions of the different ethnic groups (see Introduction,
section 1.6), but also due to a range of other factors relating to
school experiences, environment, parental support at school and
parental (and individual) aspirations. GCSE attainment, decisions
to stay-on at 16 and choice of post-16 education all affect
likelihood to progress to HE, and these vary between ethnic
group, and also, importantly, by gender. The various factors of
influence on entry routes to HE have different significance for
different ethnic groups, and they can also interact with ethnicity
in different ways. There is also a time factor to take into
consideration: some groups, in particular Black groups, are likely
to gain entry qualifications (ie at level 3) later, at an older age.
Key points of difference by ethnic group which have been
highlighted here are:
z At GCSE level: Indian groups do better than Whites, and
Black Caribbean, Pakistani and Bangladeshi do worse than
average. Girls outperform boys overall, but especially among
the Black Caribbean group.
z Staying-on rates at 16: Highest among Indian and Chinese
groups, higher than Whites; lowest among Black Caribbean
and Black Other groups.
z Post-16 education choices: Minority ethnic are more likely than
White pupils go on to college than stay at school in Years 12
and 13. Black students are the most likely to take this route into
HE; Indian and Chinese the least likely (similar to Whites).
z Delaying HE entry: Black students are more likely and
Indians and Chinese student less likely to take a gap year, ie
time out of education before entering HE study. Black
students are more likely to apply from an employment
situation, than other groups.
z Gaining HE entry qualifications: Although minority ethnic
groups are slightly less likely than White people overall to
have level 3 (ie normally HE entry requirements) at 18 years of
age, by 19 years they are almost equally likely. However, the
Asian group are more likely to have attained this level than
White people by this age.
22
Why the Difference?
z ‘A’ level route: Fewer minority ethnic groups than White
students aged 18/19 are likely to hold ‘A’/’AS’ qualifications,
but Indian students are the most likely to by 19 years, and
more likely to than White 19 year olds.
z Entry qualifications: Black, and particularly Black African,
students are much less likely to enter undergraduate level
study, especially degree courses, with ‘A’ level qualifications
than White or Asian groups are on average (who are broadly
similar). Black students are more likely to have Access
qualifications (reflecting their older age). Minority ethnic
entrants have lower ‘A’ level scores than White, but Chinese
and some of the mixed ethnic groups, have higher, and
Indians are almost on a par with Whites.
z School or college previously attended: More minority ethnic,
and especially more of the Black, entrants to full-time degree
courses come via the college (FE or sixth form) than school
route. There are also fewer minority entrants coming via
independent schools, but there are some exceptions (Chinese,
Indian, Asian Other and mixed ethnic group).
It is evident from the above that some groups have different
trajectories into HE. In summary:
z Indians, Asian Other, and especially Chinese, are more likely
to be highly qualified at entry to HE, and they are more likely
to take the traditional, ’A’ level highway from school to HE’ as
young people (more similar to the White group in this
respect).
z Black student groups are slightly less well-qualified than the
average, and more likely to have non-traditional (vocational)
entry qualifications and progress to HE via the college route.
But their older age is a key characteristic: they are more likely
to take longer to gain entry qualifications than other groups,
and more likely to gain them at FE colleges and via Access
courses.
z Pakistani and Bangladeshi groups are less likely to be as wellqualified as other members of the Asian group, but do better
than the Black student group. They are more likely to have
vocational qualifications for HE entry than other Asians, and
more likely to have gained them at sixth form college.
While this provides a helpful model, it is an over-simplification.
There are divergences within the Black group, eg between the
Black African and Black Caribbean groups, and also between
Indians and Chinese, which need to be considered. This is because
each ethnic group has distinctive characteristics (as noted earlier)
and is making progress in becoming more qualified at different
rates and from different starting points (as discussed further in
Modood et al., 1997, see Conclusions chapter).
Why the Difference?
23
The differences highlighted here between ethnic groups, and subgroups are significant ones, but there are limitations on the
amount of analysis that we have been able to undertake at a
disaggregated level (eg by age and gender within ethnic group)
because of insufficient reliable data on many of the variables of
interest (also at this level some of the groups become very small).
We recommend that this is kept under discussion, as it may be
possible to do more work in the future, as new data emerge or
new surveys are undertaken.
It is also important from a policy perspective that the differences
between the minority ethnic groups are recognised in actions
taken to raise earlier attainment. For example, the research would
indicate that more measures would help to close the attainment
gap at GCSE and ‘A’ level, especially to improve the position of
Black young men. This could be done through Aimhigher and
other widening access projects, where the differences between
ethnic groups (and sub-groups) need to be recognised in
identifying target groups and in deciding on actions to be taken
that are likely to have the greatest impact (eg more in FE colleges
where Black young people more likely to be, rather than schools).
In addition, we recommend that the long-term effectiveness of the
various programmes currently in place, designed to improve
educational attainment and aspirations of young people, is
evaluated in terms of the impact they are having on minority
ethnic groups.
24
Why the Difference?
3. Influences on Decision Making and
Choice of HE
In this chapter, we focus on the main influences, other than prior
attainment, which affect decision-making of minority ethnic
students to enter HE. It assesses evidence gathered from a number
of sources: HESA and UCAS data on the personal and education
backgrounds of students, our surveys of current students, parents,
of potential entrants still at schools and colleges (Year 13), and
other published research evidence.
We can turn to a great number of research studies over the years,
to identify possible factors affecting the different rates of access to
higher education of various groups. Although these vary
considerably in their scope and purposes, there are a few central
messages of importance that provide context:
z Firstly, that social inequality in access to HE does exist, ie
young people from less advantaged backgrounds are less
likely to gain entry to higher educational levels and so less
likely to close the gap between them and the more advantaged
in society. Effects of socio-economic class also shapes choices
within HE.1
z Secondly, choices about HE are not made in isolation. There is
a complex interplay between factors which affect the decision
making dynamic (including socio-economic class, ethnicity,
and, in particular, gender). These include ‘structural’ influences
ie related to the socio-economic/income/ gender/ethnic
group that an individual belongs to, which can shape early
educational experiences and decisions about HE entry routes.
A second kind are external influences, such as labour market
opportunities at school leaving age and subsequently, careers
guidance at school and college, influence of teachers and
parents/community, geography (the need to/wish to leave or
stay at home), and changes to student finances and funding
(affecting views about being able to afford to go, or the
economic returns from investment in HE).
1
Why the Difference?
See Woodrow (2002), Social class and participation; and NAO report
(2002), op. cit.
25
Little research has focused on ethnic groups in particular, and few
have tried to separate the effect of an individual’s ethnicity to go
on to higher education from other factors of influence. This is
mainly because of the complexity of the relationships between the
various influences, and also a lack of statistical evidence to use in
any modelling. Net of attainment, ethnicity clearly has some effect
(as seen in many studies), but it not likely to be the only effect and
others may be more significant to particular ethnic groups or subgroups. This was explored in a recent DfES sponsored research
study on demand for higher education, which looked at the
relationship between a number of variables that influence young
people’s entry to degree study.1 Making use of several YCS
cohorts (16-19 year olds) it showed that ‘ethnicity’ was not a
significant variable in explaining why they are likely to be in
degree study at 19 years, though its relationship with other
variables (eg gender, family social class, regional effects) was
recognised. ‘Ethnicity’ meant being White or non-White in this
analysis. Interestingly though, it was found that two groups
(young people of Indian and Chinese origin) did have increased
odds of entering degree level higher education by 19 years, all
other things being equal. Care needs to be taken, though, in
interpreting this analysis, because some groups, mainly Black,
take longer to enter HE, as shown in the previous chapter, and so
their entry to HE would not be captured by the YCS. As far as we
are aware, no other modelling work of this type has been done.
3.1 Decisions about applying to HE
Minority ethnic respondents in our survey of potential HE
students (ie the sample of year 13 student at school and colleges
who had applied in 2002 or had not yet applied2) gave more
positive reasons for their decision to apply to HE than White
students did, particularly in relation to the impact of a university
qualification on their future jobs, career and earnings (see Table
3.1). They also reported greater encouragement from family
(though more said they had few family who had been to
university) and were more likely to feel that it was ‘always
assumed I would go’, than White students.3 Financial concerns
had less of an influence (relative to these factors), and there was
little difference between minority ethnic and White potential HE
students, eg about debt concerns and uncertainties about cost.
Minority ethnic students, though, were more uncertain about
26
1
Gayle et al. (2003), op. cit. Note that this looked only at entry to degree
study by 19 years of age, and not all entry to undergraduate study.
2
This was not a representative sample of potential entrants but
included White and minority ethnic students from a group of schools
and colleges, see B.1 (Appendix B).
3
These findings were all statistically significant or near to significance,
at 99 per cent level.
Why the Difference?
what to expect at HE (and the difference was statistically
significant).
On the whole, differences between the individual minority ethnic
groups were small (and not significant). All gave more importance
to the employment/earnings and family encouragement ‘pull’
factors than the White group. However, the Black Caribbean
group were much less likely to say that there was an assumption
that they would go to HE (though this is likely to be age-related,
as this group was older than the average).
Family/parental encouragement and expected employment/
career advantages, which also affect earlier decisions, about
Table 3.1: Factors affecting decisions by potential HE entrants to go on to higher education
by ethnic group (mean scores1)
Issues affecting
decision
Black
African
Black
Caribbean/ Pakistani/
Other
Bangladeshi
Indian
Chinese/
Asian
Other
All
minority
groups
White
To gain qualification
for career
4.6
4.3
4.4
4.5
4.4
4.5
4.2
Improve future
earnings potential
4.4
4.3
4.4
4.6
4.4
4.4
4.1
Interest in subject area
4.4
4.2
4.3
4.2
4.1
4.3
4.2
Difficult to get good job
without higher
qualifications
4.4
4.0
4.3
4.3
4.2
4.3
3.9
Personal development
4.2
3.9
4.0
4.2
4.1
4.1
3.9
Encouragement from
family
4.0
4.0
4.0
4.0
3.8
4.0
3.4
Always assumed
would go to HE
4.0
3.2
4.0
4.1
3.9
3.9
3.1
To help career options
3.5
3.5
3.5
3.7
3.6
3.6
3.3
Uncertainty about
getting
necessary qualifications
2.7
3.0
3.1
3.3
3.0
3.1
2.9
Uncertainty about cost
3.0
3.2
2.8
3.1
3.1
3.0
2.9
Few family been to
university
2.8
2.9
2.8
3.1
3.0
3.0
2.5
Concerns about debt
2.9
3.2
2.7
3.0
2.9
3.0
3.0
Being able to
visit universities
3.0
2.7
3.0
3.2
3.0
3.0
2.7
Uncertainty about what
to expect
2.7
2.9
2.8
2.9
2.9
2.9
2.5
Taking part in access
activity
2.7
2.6
2.4
2.6
2.6
2.5
2.1
Base number
94
68
117
166
68
567
217
1
In this table, scores again range from one to five, where one represents ‘Does not apply/no effect’ to five ‘Applies
strongly/big effect’.
Source: IES survey of potential entrants to higher education, 2002/3, see footnote 2 at previous page
Why the Difference?
27
staying-on at 16 and attainment (as highlighted in previous
chapter), are discussed further below. Also, although financial
issues were less of a concern, these are also discussed further
below because of their greater policy interest at the present time.
3.2 Family and parental influence
The extent to which education is valued by family, peers and
other influencers is an important part of the complex picture of
decision making about HE for most students. But in particular, it
is valued highly within most minority ethnic groups, so it is likely
to play a more important role in HE decisions. Previous research
has shown that there is a stronger drive for qualification amongst
ethnic minorities, and once individuals begin to acquire
qualifications they seek more. In particular, education is seen as
having an important role in upwards social mobility.1
Additionally, succeeding generations have shown a greater
tendency to obtain HE qualifications than their parents, resulting
in a second generation of minority ethnic groups that are more
qualified than the first, for all ethnic groups and both genders.2
This ‘qualification drive’ can be seen in the fact that, despite lower
GCSE results at age 16, and much lower for some groups (eg Black,
see section 2.5), minority ethnic groups are more likely to persevere
with their education, some by re-sitting exams for better grades.
Evidence specifically suggests that Pakistani and Bangladeshi
students are more likely than other groups to be still at school or
in a sixth form college in their third post-compulsory year.3 But, as
pointed out in sections 2.1 and 2.2, Black Caribbean groups
perform worst at GCSE, and are also less likely to stay on at 16.
Parental influence is extremely important in shaping decisions
about HE for many young people. Research has shown that
parental encouragement to go to university increases the chances
of going.4 As shown above, individuals from minority ethnic
groups are more likely to believe that there is an expectation that
they go to university and that their families are encouraging them
to do so. There also appears to be more certainty amongst the
young minority ethnic population that they are going to go on to
HE in the future.5
28
1
See Connor et al. (2002), and Connor and Dewson (2001) for more
discussion of social class and pre-HE attainment.
2
See Modood Ch3, in Modood et al. (1997), Ethnic Minorities in Britain:
Diversity and Disadvantage.
3
Evidence presented in Payne J (2003) Choice at the end of compulsory
schooling: A research review.
4
See Gilchrist et al., (2003).
5
MORI (2002), Schools Omnibus 2001-2002 (Wave 8).
Why the Difference?
In our discussions with potential entrants, various examples of
parental influences were seen:
‘I was pushed by my parents to stay in education and get my ‘A’ levels.
They told me, “if you want to do anything with your life then go to
college”.’ (Black African male, aged 19, studying ‘A’ levels at
college)
‘My family was very keen for me to return to education. I have older
siblings who have all gone to university and been very successful; one
is a lawyer, the other a doctor and the third a pharmacist. There is an
expectation from my family to be successful and, so there is a pressure
for me to do well.’ (Asian Other male, aged 19, studying ‘A’ levels
at college)
‘My parents were encouraging me to go into HE but I made the
decision. They had a small part to play. In Asian culture, studying is
really important and can make you more marriageable — you’re more
respected if you have a degree.’ (Indian female, aged 17)
Our HE potential entrant survey also showed that parents are
rated as the most influential source of help in making HE
decisions by all ethnic groups, but particularly so by Black
African, Pakistani/Bangladeshi and Indian students. They were
seen as more important for all minority ethnic groups than the
White group. Also, Careers teachers, and the Careers Service,
were viewed as more influential among all minority ethnic than
White students. Previous research has suggested that traditional
guidance is unhelpful for some minority ethnic groups,1 so these
findings may provide tentative evidence that the new Connexions
arrangements are working better for minority ethnic groups, or
possibly that they are getting a better service now in relation to
HE advice. Whichever, it is an area that could be examined
further, as it has been suggested in the past that the often weaker
positions of minority ethnic families in the labour market make
formal careers education and guidance more important for young
people from minority ethnic communities.2
Our survey of parents of minority ethnic students provided
further evidence of their influence on young people’s career
decisions. Interviews were undertaken with parents of current
students (see Chapter 1, section 1.3 and B.4 in Appendix B, for
further details of the parent survey) and all of them had a clear
ambition for their children to stay on and do well at school. They
therefore had provided support to them in their schoolwork, and
in some cases had paid for extra tuition. There seemed an almost
unspoken assumption that their children would progress to a
university education (which mirrored the views of many of the
students themselves). This assumption was to not only fulfil their
academic potential, but also improve their chances of
Why the Difference?
1
MORI (2002).
2
Presented in Payne (2003).
29
employment. For a proportion of the interviewees, it represented
a desire for their children to take an opportunity which had not
been open to themselves — in other words they did not want
them to have to struggle in lower-skilled jobs because they lacked
qualifications.
Degree of parental influence in the final decision about where and
what to study varied, but appeared limited in most cases.
However, many were actively involved in the choice process,
often accompanying children on visits to universities, and
discussing options with them and other relatives (this is discussed
further using other evidence, see section 4.7).
Information about parents was also obtained from our student
survey, which provided further insight into how parental
background might shape views and influences on decisions about
HE for particular groups. This showed that:
z The majority of minority ethnic undergraduate students were
born in the UK (60 per cent), ie were second generation
immigrants. However, only a very small proportion of them
had both parents who were born here (ie third generation),
with the majority having at least one born outside the UK
(generation 2.5), which is lower than we expected.
z Certain student groups were much more likely to be first
generation, ie they were born here but neither parents were —
Black African and Chinese/Asian Other (each over 50 per
cent) — while others were much more likely to be second
generation — Indians and Black Caribbean/Black Other (78
and 76 per cent), and Pakistani/Bangladeshi students (almost
70 per cent). Also, it is worth noting that 23 per cent of
minority ethnic students entered the UK after age 16, ie they
got most of their school education abroad (as did their parents
also). This figure rose to 43 per cent among the Black African
group and 38 per cent for Chinese/Asian Other (Figure 3.1).
z In contrast to White students, most parents of minority ethnic
students were not (school) educated in the UK (there was little
variation between minority ethnic groups in this though).
Those parents born overseas came from a wide-range of
countries (too small numbers in each to compare).
z An individual’s assessment of their ‘family origin’ matched
their ethnic group in most cases. It was evident that some subgroups existed, but were relatively small in size, eg only
around eight per cent of Indian and seven per cent of
Chinese/Asian Other students felt that their family origin was
African Asian or African.
30
Why the Difference?
Figure 3.1: Likelihood of students being born in the UK, by ethnic group
White
Indian
Black Caribbean/Other
Pakistani/Bangladeshi
Other ethnic group
Chinese/Asian Other
Black African
0%
20%
40%
Born UK
60%
Entered before 16
80%
100%
Entered after 16
Source: IES/MORI students survey (see section 1.3) 2002
3.3 Expectations of career and financial gain from HE
Although there are a number of reasons usually given by surveys
of students about why they have come into HE study, the most
frequently mentioned are associated with improving their labour
market prospects, be it to follow a specific career or more general
improvements — eg ‘a better job, a better kind of job, a better paid
job.’1 Our survey of potential entrants confirmed this (as shown in
Table 3.1), and also showed that minority ethnic students overall
were more likely to be influenced by this than White students. The
survey did not show much difference between minority ethnic
groups, but other research highlights some difference. For
example, a survey of undergraduates in 20002 showed that Asian
students from a range of social backgrounds, and Black students
from lower (but not higher) social classes, have been found to put
more emphasis than White students (from all social classes) on
improved employment outcomes as the main encouraging factor
for going on to HE. Other research3 also suggests that Asian
students in particular believe that education will enable them to
get a job and there is a related desire to stay within the education
system.
Our survey of potential HE entrants also gave evidence about
expected financial gain, in particular from pursuing a higher
education. More than six out of ten minority ethnic potential HE
students thought that they would benefit ‘a lot’ financially in the
Why the Difference?
1
See Connor (2003), and also Callender (2003) op. cit., also Leslie and
Drinkwater (1999) in Payne (2003).
2
Connor and Dewson (2001).
3
Described in Payne (2003), op. cit.
31
long term from going on to higher education; and a further one in
four thought that they would benefit ‘a little’, but these results
were similar to those of White potential students. Little difference
was also evident between individual ethnic group. We also tested
for differences by religion, gender and social class, but little
difference was found here either. However, it is worth noting that
most students had little firm idea of what they could hope to earn
as their starting salary following graduation, suggesting that their
expectations of financial gain are only based on limited actual
labour market information.
Greater importance is given to improving labour market outcomes
by minority ethnic groups. This may be due to a combination of
more negative impressions of the labour market for minority
ethnic young people without qualifications than White young
people without higher qualifications, and the more positive views
held by minority ethnic than White people of the future benefits of
gaining qualifications generally. The suggestion is that nonWhites have a higher endowment of these factors than Whites,
influencing their decision to go on to higher education. It is also
important to note that the more generally very positive views of
higher education amongst minority ethnic groups will be
operating alongside views about any costs or financial factors
relating to participating, ie some may be giving more attention
than others to the net expected financial gain. In the next section
we examine the extent to which worry about finances acts as a
disincentive to participation in higher education.
3.4 Financial barriers
The issue of financial barriers has been studied by several
researchers, especially in relation to widening access to HE to
encourage more applications from lower income and lower social
class groups. They show that young people from lower socioeconomic groups are less likely to go to HE in general, and that
financial barriers are more likely to act as a deterrent for them,
compared with higher groups.1 However, the evidence on the
direct effect of student finance and funding on specific groups is
not clear cut. The cost of studying in HE is usually seen together
with other concerns, such as having to work while studying,
getting into debt and managing on a low income. There is little
research on how student finance specifically affects the
progression to HE for minority ethnic groups, or those from lower
socio-economic and minority ethnic groups in particular. But, in a
recent study of school leavers and further education students
(who were working towards HE entry qualifications) about their
attitudes to debt, it was found that minority ethnic groups were
among a number of identified prospective entrant groups
1
32
See Connor and Dewson (2001), and most recently Callender (2003).
Why the Difference?
identified as being the most debt averse, and also Muslims,
especially Pakistanis.1
Our survey of potential HE entrants showed that the majority
(around 60 per cent in total) were put off attending university in
some way, by the costs involved, but that the sample of minority
ethnic students were less likely to be put off than White students
(57 versus 68 per cent).2 Cost was even less of a potential deterrent
for Pakistani and Indian applicants than others, but this may
relate to their age. Older applicants were more likely to feel put
off, and Pakistani and Indian students tend to be the younger
groups. Additionally, around 40 per cent of individuals felt that
they had been put off attending a particular institution because of
the costs involved (presumably mainly transport and/or
accommodation costs). This figure was more or less the same for
all ethnic groups including Whites, but Chinese/Asian Other
were the most likely to have their institutional choice influenced
by potential costs (see further discussion below in section 4.7, on
other factors influencing choices of institutions).
As mentioned above, getting into debt is a major concern about
the student experience. A recent small update of the student
income and expenditure study (but focused on young students on
full-time courses only) shows that in 2002/3, minority ethnic
students are a student group least likely to take out a loan (76 per
cent compared to 89 per cent amongst the overall population).3
Other ways in which the patterns of minority ethnic student
income and expenditure differ include having a lower overall
income than White students, being more likely to live at home and
having a greater reliance on paid work as a source of income.
They were also shown in that study to be more likely to come
from lower socio-economic groups than White students on
average. Living with parents affects the amount of student loan
which individuals are eligible to take out. The greater availability
of work in the London area is an important factor to consider
when looking at effects of finance on HE decisions by minority
ethnic groups, as a large number of them study in the capital
(almost half, over twice as many as White students).
Financial disincentives work alongside other factors, such as
attitudes to the labour market, awareness and knowledge of
student financial arrangements, and funding and family support.
The different financial situation of many individuals from
minority ethnic groups compared to White students undoubtedly
means that their attitudes towards debt and the costs of studying
Why the Difference?
1
Callender (2003).
2
This is different from the Callender research (but samples and
questions asked in the surveys were different).
3
Callender and Wilkinson (2003) on 2002/03 Student Income and
Expenditure Survey.
33
are different. Then there is the aspect of ‘social debt’ to consider.
Although we have no specific evidence from our research to
expand upon this, some people have suggested that as minority
ethnic students are more likely to be funded through university
by parental contributions (from their own savings) than White
students (see later discussion on financial support, section 5.4),
they may feel they will owe more of ‘a social debt’ to their parents.
They may feel they should pay something back to their parents in
kind, rather than financially (eg helping younger siblings get to
university, looking after older relatives), or feel they have to live
up to family expectations.
One can only speculate at this stage about what the effect of the
proposed changes to student finance will be on minority ethnic
groups in particular, as there is little in the way of good research
evidence on which to base a view. Entry to HE, and the costs of
studying, are clearly affected by socio-economic class status, and,
overall, minority ethnic student groups are more likely to come
from lower socio-economic class backgrounds. But it is sometimes
hard to separate factors of influence associated with lower class,
from those associated with particular ethnic groups and, as shown
below, there are problems applying the conventional measures of
socio-economic class to the minority ethnic population. All in all,
though, it does not appear from the research evidence about
student finance available to date, that the likely increased debt
students will have in the future will, by itself, have a significantly
greater negative effect on decisions to take part in higher
education by minority ethnic than White students. However, the
role of ‘social debt’ in this equation needs to be fully considered,
and we would recommend that issues around the effect of the
changes in student finance are carefully monitored by ethnic
group.
3.5 Effect of socio-economic class
At various times, we have touched on the significance of socioeconomic class, family or social background in exploring
influences on entry to HE for minority ethnic students. In the
general research literature, it is recognised that ‘social class’
(defined in various ways) plays a significant part in educational
attainment, and specifically, in accessing higher education.
Improving participation from lower socio-economic class groups
is seen as a priority area to tackle in widening access, and
increasing young people’s HE participation rates. Research has
shown that its effects are significant in terms of entry to the ‘A’
level entry route into HE study for young people.1 Also, those
groups who do better at GCSE (eg Indian) are more likely to be in
higher socio-economic classes. Vice versa, some of those who do
1
34
Most recently confirmed in Gayle et al., (2003) as ‘the highway to
degree level education’, p. 77.
Why the Difference?
less well (Pakistani, Bangladeshi, Black Caribbean) are more likely
to be in lower groups (though the patterns are more complex than
this).
We do not, as yet, have data relating to the socio-economic class of
minority ethnic groups from the 2001 Census, though we
understand that data using the National Statistics Socio-Economic
Classification (the NS-SEC, also used by UCAS from 2002-03) is
being derived, so further analysis will be possible in the future.
But, from other evidence (eg General Household Survey), a
pattern of social inequality between minority ethnic groups can be
seen. However, this is changing over time, and can be complicated
for some groups by other factors, related to migration and
culture.1 Because of this, basing a socio-economic class measure on
parental occupation information (which is done by UCAS) may
have less meaning for some minority student groups, especially
recent immigrant groups where their labour market position is
likely to be depressed, or may link more to pre-migration
patterns. Care therefore needs to be taken in looking at socioeconomic class differences among minority ethnic applicants to
HE, see Figure 3.2 (which shows socio-economic class [NS-SEC] as
used by UCAS). The main points are:
z Overall, minority ethnic students on full-time degree courses
are more likely to be the children of parents from lower socioeconomic classes, compared with all students. This would
indicate that they are doing better on average in accessing HE
than their socio-economic class would suggest.
z Most minority ethnic groups, with the exception of Asian
Other, Mixed Ethnic and Other groups have a minority in the
top two classes (higher and lower managerial and
professional), and some with a small minority (the lowest
being Bangladeshi, 22 per cent). This is in contrast to White
entrants, where they form the majority (58 per cent).
z Indian full-time degree accepted applicants have a higher
socio-economic profile than Pakistani and Bangladeshi groups,
but not as high as those of other Asian or Black groups (see
Table A7, Appendix).
z It is worth noting that the minority ethnic groups with the
highest socio-economic profiles are not all of the groups most
likely to enter HE via the ‘A’ level route (the Black groups are
the least likely, see previous chapter). However, the higher
socio-economic group/’A’ level route link holds to a large
extent within the Asian group:
•
1
Why the Difference?
Chinese, Asian Other and Indian young students are more
likely to come via the ‘A’ level route than Pakistanis and
Bangladeshis, and also are more likely to be higher ‘A’
level achievers.
See Modood, in Mason, (2003).
35
Figure 3.2: Socio-economic profile of minority ethnic and White accepted applicants to
degree courses, 2002 year of entry
White
All minority ethnic
Black Caribbean
Black African
Black Other
Indian
Pakistani
Bangladeshi
Chinese
Asian Other
Other
Mixed
Total
0%
10%
20%
30%
40%
50%
60%
70%
80%
90%
100%
Socio-economic class:
1-2
3-4
5 and below
Source: UCAS (see data in Table A7, Appendix)
•
The Chinese, who are the most likely to come to HE via
independent schools, have a similar socio-economic profile
to the Indian group, but lower than the Black student
group.
These findings add weight to the view that there are other factors
of significance to minority ethnic groups that are interacting with
these standard socio-economic measures, and they seem to have a
mitigating effect on the ‘social class effect’ for some minority
ethnic groups, in relation to entry to HE. The most likely set of
factors, from the evidence presented above, is the ‘drive for
qualification’ (highlighted earlier in section 2.2), arising from the
greater economic motivation among recent immigrants and the
greater desire to do better, and ensure their offspring do better
too.1 The strong academic orientation of most Asian groups has
been seen, in various parts of our research, in different ways. It is
recommended that this is an area which should be investigated
further.
3.6 Summary
Various factors of influence in decision making about HE have
been explored in this chapter. It has shown that there is an
interaction between ethnicity and these various factors, but that
1
36
See Modood (2003), and also our research among parents.
Why the Difference?
this is likely to vary between minority ethnic groups. There is a
complex interplay between a number of factors of influence;
decisions about HE are not made by individuals in isolation.
Ethnicity has been shown not to be significant overall, when
analysed with a variety of factors affecting young people’s entry
to degree study (by 19 years), but being a member of a particular
group (Indian or Chinese) was. But there are limitations on this
analysis (about young entry to degree study only) and it is
recommended that when more data becomes available, especially
on progress to undergraduate courses beyond age 19, then further
analysis of this kind is undertaken. As in the previous chapter, we
recommend that future work is done, where possible, at a
disaggregated level, though we recognise the problems with likely
small numbers in some groups.
There are a number of reasons why people decide to go on to HE
(if likely to be qualified to do so), and why some apply more to
minority ethnic groups:
z Minority ethnic potential students are more likely than Whites
to be influenced about going to HE for positive reasons,
especially expected economic gain/career advantages, but
there is little variation here between minority ethnic groups.
z Minority ethnic potential students are, on the whole, more
influenced than Whites by the expected better labour market
opportunities that HE qualifications would bring, but they are
both equally likely to expect it to bring considerable financial
benefits.
z Parental, and other family, encouragement plays a greater role
for minority ethnic than White potential entrants, and more
for Black African, Pakistani and Indian than other minority
ethnic students. Significant support and encouragement is
given to many individual minority ethnic students from their
parents, at various stages in their educational route into HE.
There is a greater valuing of education within most minority
ethnic groups. Parents are also a key influential source of
information about universities, more so than for White
potential entrants. This is despite the fact that many parents of
minority ethnic students are likely to be first generation
immigrants and not educated in the UK, nor have experience
of higher education themselves.
z Minority ethnic potential students, with the exception of Black
Caribbean, are more likely than White students overall to have
always had an expectation about going to HE.
Financial disincentives (cost of studying, getting into debt etc.) are
an influence on decisions about HE entry, but have less of an
effect than other factors, and little separates minority ethnic and
White students in this regard. Minority ethnic potential students
and Pakistani and Indian students in particular, are less likely
than White students, to be discouraged from going to HE by the
Why the Difference?
37
cost (which is different from other research). However, it was
clear that other factors also had an influence on attitudes to cost of
studying and likely student debt — eg age, whether going to live
at home or not, living in London, social class — and these
interacted with ethnicity in different ways. This is an area that
needs future monitoring, including the effect of social class and
region, as well as ethnic group.
Socio-economic class, in particular, needs to be taken account of in
future research on entry to HE of minority ethnic groups.
z There is a lower socio-economic profile overall of minority
ethnic than White undergraduate entrants to full-time degrees
(no data on part-time entrants).
z The Bangladeshi group has the lowest socio-economic profile,
while Indian, Asian Other and Black groups have the highest.
z But all minority ethnic groups are doing better in gaining
access to HE than their socio-economic profile suggests, and
some are doing much better than others.
It seems likely that other factors are likely to be mitigating the
effect of socio-economic status, for minority ethnic groups on HE
entry. The most likely of these is the influence of parents and
families, and the greater ‘drive for qualification’ among the
minority ethnic population. But the standard socio-economic or
social class measures used may be more problematic when
applied to ethnic groups, and this needs to be considered when
interpreting the results, and when monitoring HE entry trends by
social class and ethnicity.
The previous chapter set out a simplified typology of groups
relating to attainment and routes into HE. We continue to see a
flavour of this divergence here also, when looking at other
influences in decisions, though it is generally less pronounced. In
summary, distinctive features of each grouping are:
z Indians and Chinese — net of attainment, being a member of
either of these groups is a significant variable in predicting
progression to degree study by age 19 years; Indians are less
put off HE by the likely costs.
z Black groups — Black African is among the groups more
likely to have parental encouragement, but less so for Black
Caribbean. Also, fewer Black Caribbean’s had an expectation
about going on to HE.
z Pakistani and Bangladeshi — more likely to have parental
encouragement than many other groups; Pakistani group is
less put off HE by likely costs; Bangladeshi and Pakistani
entrants have a lower socio-economic profile.
Several policy implications are evident from the findings in this
chapter:
38
Why the Difference?
z Understanding better the effect of parental encouragement
and ‘qualification drive’ and how this is working in practice,
and ways of harnessing this ‘positive force’, as effectively as
possible, in widening access projects (and also what lessons
can be gained for helping other [White] groups).
z In careers service/careers work, understanding how formal
versus informal (including parent/family) influences on
decisions and choices (especially in non-school environments)
operate:
•
what improvements can be made to careers advice/
guidance provision?
•
how can the various ‘influencers’ work better together?
Are there good models of successful practice?
Also, a number of areas of further research and analysis have been
highlighted:
z into the progress of older students (19 years plus) to HE and
factors influencing their entry
z into the effect of socio-economic class on HE entry of minority
ethnic group
z and into the interaction between various factors (socioeconomic class, religion, age, living at home, living in London
and ethnicity) in any monitoring of the impact of proposed
changes in student finance by different minority ethnic groups
is undertaken.
Why the Difference?
39
4. Patterns of Participation in HE
We now move on to presenting the key features of the
participation of minority ethnic groups in HE, and in particular,
the ways in which minority ethnic groups have distinct patterns of
participation across the HE sector.
The chapter first shows how HE participation rates vary between
minority ethnic groups, and then goes on to show the
participation in more detail, by institution, type of course and
subject. Gender differences are also identified. In the second part
of the chapter, the main factors influencing the observed minority
ethnic participation patterns are discussed.
The main focus is undergraduate study in England (which is the
scope of the research, see section 1.2). Readers who wish a fuller
discussion of the participation pattern of different minority ethnic
groups in undergraduate study may also be interested in the
research’s Interim report1 (but note this report contains some
older data than shown here).
4.1 Minority ethnic participation in HE
In total, 182,000 minority ethnic (UK-domiciled) students were
enrolled on undergraduate programmes (full- and part-time) in
English universities (including the Open University) in 2001/02.
This represented 16.4 per cent of the total with known ethnicity
(12 per cent of the total did not give their ethnicity and so are
excluded from base totals when calculating percentages). In
addition, there were some 14,000 minority ethnic students taking
level 4+/HE courses in FE colleges (and not included in the HESA
return by HE institutions), representing 11.9 per cent of the total
with known ethnicity.
Because there is some uncertainty when combining data from FE
colleges and HE institutions (data are collected separately in two
different systems), care has to be taken in deriving an aggregate
undergraduate population figure. Bearing this in mind, the
estimate of the minority ethnic undergraduate student population
(UK-domiciled studying in institutions in England) was
1
40
See chapter 2 pp. 8-28, and also its Appendix C.
Why the Difference?
approximately 196,000 in 2001/02, which is 16 per cent of the total.
This is nearly twice the minority ethnic proportion in the whole
population of England (just over nine per cent). However, students
can come from other parts of the UK to attend university in
England, and the minority ethnic distribution varies geographically
(see section 1.5.1). If the coverage is extended to all undergraduate
study in the UK, minority ethnic students account for 14 per cent
of the total student population, which compares with a UK
population figure of just under eight per cent.
The figure of 14 per cent for 2001/02 is higher than the 12 per cent
estimate in 1994/95 (all UK coverage). However, there are
problems in looking at trends over time because of changes to the
ethnic origin categories in 2001/02, and also changes from year to
year in student data collection by HESA. But in broad terms, the
trend is likely to be upwards, as the figures suggest.
Looking at individual minority ethnic groups:
z The largest group in undergraduate study is Indian (4.1 per
cent, making up just over one-quarter of all minority ethnic
undergraduate students at English universities in 2001/02),
followed by Black African (2.5 per cent) and Pakistani (2.2 per
cent).
z The smallest are the Chinese and Bangladeshi (and some of
the Other and mixed ethnic groups), representing one per cent
or fewer (Table 4.1).
Table 4.1: Minority ethnic groups (UK domiciled) in undergraduate study in England (HEIs,
Open University and FE colleges combined), 2001/02
Ethnic group
White
No, of students
% of students
1,030,385
84.0
All minority ethnic
196,083
16.0
- Back Caribbean
18,821
1.5
- Black African
30,971
2.5
- Black Other
7,874
0.6
- Indian
50,406
4.1
- Pakistani
26,631
2.2
8,081
0.7
- Chinese
11,775
1.0
- Asian Other
16,322
1.3
- Mixed ethnic
8,848
0.7
16,354
1.3
1,226,468
100
- Bangladeshi
- Other
Total (known ethnicity)
Source: HESA, 2001/02 and ILR, 2001/02
Why the Difference?
41
4.1.1 HE Participation rates
Comparing student and general population figures to indicate
relative HE participation of minority ethnic groups (as done above,
and also shown in the Interim Report) can produce distortions, as
it uses student counts rather than entrants (and students can be on
different lengths of courses, retaking courses, etc.). Also, there are
differences by age and gender which can be masked by the overall
figures (in particular the minority ethnic population has a
younger age profile, representing a higher proportion, 12 per cent,
of the 18-29 age group; and also there are differences in the
proportions of males and females in each age group). A better
measure is the HE Initial Participation Rate (HEIPR). The HEIPR
is a published measure, in general use by the Government.1 It is
calculated by summing the percentages of people domiciled in
England at each age (between 17 and 30) who enter HE in the UK
(HEIs and FECs) for the first time in any one year.
There are no separately published HEIPRs for minority ethnic
groups, mainly because of the difficulties in obtaining accurate
estimates of the population groups (only recently has the 2001
Census data been available to help with this though there are still
uncertainties in accurately estimating ethnic/gender/age breakdowns, especially for the 18-30 age group). A major issue arises
from combining the population estimate (from Census returns)
with the student estimate (from HESA and ILR returns), as these
sources involve different respondents who may identify the
people involved differently (ie in the given ethnic classification).
Despite these weaknesses, we believe it is an improved way of
presenting HE participation for minority ethnic groups, and
separate ethnic/gender HEIPRs have been calculated for 2001/02
as part of this research.2 As shown in Table 4.2, they confirm the
higher than average HE participation by minority ethnic groups in
aggregate. They also highlight the extent of variation between the
broad ethnic/gender groups.
z The highest participation rates are among the female Black or
Black British group and male Asian or Asian British group
(over 60 per cent).
z These compare with an average for all minority ethnic groups
of 56 per cent, an average overall figure (excluding ethnicity
unknowns) of 40 per cent,3 and an average White group figure
42
1
The HEIPR is the redefined IER, and was recently published in
Statistical First Release SFR 07/2004, April 2004, DFES, where further
details on its calculation are discussed.
2
We are grateful for assistance provided by HEFCE and DFES
statisticians in the calculation of the ethnic/gender specific HEIPRs.
3
The overall published HEIPR (ie with unknown ethnicity included) is a
higher figure, 43.5 per cent for 2001/02, which is due to the higher nonresponse in the HE figures than the population estimate; see also notes
in Appendix Table A1 on the calculation of the ethnic specific HEIPRs.
Why the Difference?
Table 4.2: Higher Education Initial Participation Rates (HEIPRs) for English domiciled firsttime entrants (full- and part-time) to HE courses (in universities and colleges), by broad
ethnic/gender group, 2001/02
Ethnic group
Male
Female
All
White
34
41
38
All Minority ethnic
55
58
56
- Asian or Asian British
62
59
60
- Black or Black British
55
66
61
- Chinese or Other Ethnic
47
50
49
- Mixed Ethnic
35
44
40
All (with known ethnicity)
37
43
40
Note: The student coverage here is different from Table 4.1. It is based on number of entrants to HE (not
undergraduate study only, though most will be) in 2002/02, domiciled in England but studying anywhere in UK. For
further details of how the HEIPR is calculated, see Appendix Table A1 and SFR 07/2004, DfES.
Source: HEFCE and DFES
of 38 per cent (nb the White group is, of course, very much
larger and diverse in composition).
Disaggregating more, to individual minority ethnic groups, shows
greater contrasts (but also probably introduces greater
uncertainties with the figures calculated, see discussion below and
also in Notes in Table A1 in Appendix A):
z Black African and Indian groups have
participation rates (each over 70 per cent).
the
highest
z Bangladeshi and Black Caribbean have the lowest (39 and 45
per cent respectively).
All minority ethnic groups have a higher HEIPR than the White
group (see Appendix Table A1). However, when gender is also
considered, for one group only, female Bangladeshi, the
participation rate (33 per cent) drops to below that of the female
White group (41 per cent). In the male figures, the male Black
Caribbean figure (the lowest at 36 per cent) is only slightly higher
than the male White figure (34 per cent). These figures are subject
to a number of uncertainties, as discussed below, and should be
treated as provisional.
Differences between ethnic groups are also evident in the HE
participation rates of the young part of the age group (which have
been calculated for the 17-19 group separately, and called the
Young HEIPR), but numbers are small in places, so even more
caution is needed. The overall minority ethnic figure is also higher
here than the White figure (39 versus 29 per cent). Interestingly,
the relative position of the Chinese improves in the Young HEIPR
(37 per cent participation figure) while the Black group’s position
drops (to 28 per cent) below the White figure (29 per cent) and
also below the average (30 per cent). Within the Black group, it is
Why the Difference?
43
the Black Caribbean which has the lowest participation in this age
group (just 17 per cent). This confirms points made earlier (in
Chapter 2) about the ‘delayed’ participation in HE of Black
groups. It also highlights how different conclusions can be drawn
from participation data if different age cohorts are looked at.
There are a number of likely effects which produce these different
HEIPRs and Young HEIPRs, some of which we cannot currently
explain from the analysis undertaken to date. Some may be due to
weaknesses in Census estimates which have not yet been fully
investigated, some to the problems highlighted above in using
two sources to make the calculation and definitional problems
(see further explanations in notes to Table A1). That is why the
individual ethnic/gender HEIPRs produced here need to be
treated with caution and viewed as provisional. We understand
that the Department is looking into the feasibility of developing
HEIPRs for sub-groups of the population, including minority
ethnic groups, which we welcome. We also look forward to
obtaining, in the near future, further output from the 2001 Census
which will give another measure of HE participation, one which
uses Census data alone.
4.2 Diversity across HE
Just looking at the overall figures, though, misses an important
feature of minority ethnic participation in HE. This is their very
uneven distribution across the HE sector, both in aggregate, and
at individual group level. This is seen in institutional and subject
distributions, and also, though to a lesser extent, by mode of study
and qualification aim.
4.2.1 Institution
It is very evident that minority ethnic students are much more
likely to be found at certain universities, and less so at others.
Minority ethnic students are:
z more likely to be studying in a post-92 than a pre-92
university: 22 per cent of the total undergraduates at post-92
universities compared with 15 per cent at pre-92 universities
z less likely to be at an FE colleges (representing almost 12 per
cent of total), and even less likely to be at a HE college or the
Open University (9.5 per cent and five per cent respectively).
At individual ethnic group level, there is also an uneven
distribution by type of institution (Further details are shown
in Appendix A, Table A2):
•
44
all (including White) ethnic groups except Chinese, are
more likely to be studying at a post-92 than a pre-92
university. Overall, the balance is 54:46 (but for Chinese it
is 49:51)
Why the Difference?
z in terms of the percentage share of students, most minority
ethnic groups, except Chinese and Asian Other, account for a
higher share of post-92 than of pre-92 university students. The
difference between the two university sectors is much greater
for Black students:
•
Black or Black British account for 7.2 per cent at post-92
universities compared with just 2.9 per cent at pre-92
universities (and the gap is similarly large for each of the
Black groups: Caribbean, African and Other)
•
the representation of Black students is also higher in FE
colleges and HE colleges than at pre-92 universities, but
not as high as at post-92 universities
•
all minority ethnic groups account for lower percentages
in HE colleges than universities, the exceptions being the
Other group.
This categorisation, especially the pre-92 and post-92 split is an
over-simplification of the institutional distribution. In a small
number of universities, minority ethnic students comprise over
one-half of the home-domiciled undergraduate population (ie
excluding foreign students), and at the other end, there is a
relatively large number of universities, where it is less than ten
per cent. This is illustrated by the shape of the curve in Figure 4.1.
There is a regional dimension to this distribution, as most of the
institutions with the highest minority ethnic representation are
post-92 universities in Greater London. This is not surprising
when one considers that almost one-half of all home-domiciled
minority ethnic undergraduate students studying in England are
Figure 4.1: Minority ethnic undergraduate students as a percentage of all students (home
domiciled only) at individual universities, 2000/01
70%
60%
50%
40%
30%
20%
10%
0%
1
individual universities ranked in order*
* Excludes around 30 with small numbers (under 1,000 undergraduates in total) and the OU
Source: HESA, 2002
Why the Difference?
45
at institutions in Greater London (compared with one-fifth of all
undergraduate students). Much higher proportions of all minority
ethnic groups are found in London universities, compared with
England overall, but especially Black students.
Further discussion of the reasons which lie behind the minority
ethnic institutional distribution are given later in section 4.4.
4.2.2 Type of course
Overall, minority ethnic groups are slightly more likely than
Whites to take degree than other undergraduate courses (referred
to in this report in aggregate as ‘sub-degree’), 80 versus 72 per
cent. They both mostly study degrees by full than part-time study.
At sub-degree level, however, minority ethnic students are much
less likely to be taking a part-time sub-degree course. Only 12 per
cent of them do so, compared with 21 per cent of the White total
(though it is worth noting that the percentage of unknown
ethnicity is higher here, which may be lead to some
undercounting). This is likely to be one of the main reasons for the
lower representation of minority ethnic students studying at HE
level in FE colleges, where the majority of HE is delivered at subdegree and part-time, and also for the lower representation at the
Open University (see 4.2.1).
These differences can be expressed another way — in percentage
terms:
z the highest representation of minority ethnic undergraduate
students is in sub-degree full-time study (22 per cent)
z which compares with 18-19 per cent studying full- and parttime degrees
z and just 11 per cent in part-time sub-degree courses (see
Appendix Table A3).
By individual ethnic group, some points of particular note are:
z Indian, Pakistani, Bangladeshi, Chinese and Mixed ethnic
students are represented better in full-time, rather than parttime, degree courses, when compared with White students
(who are fairly equally divided between the two).
z Others, especially Black groups, are better represented in parttime than full-time degree study. The latter is likely to be
associated with their much higher representation in post-92
than pre-92 universities, where there is more part-time degree
provision.
z Black Africans are much more likely to take full-time subdegree courses than other modes/qualifications (they represent
6.7 per cent of the total on these types of courses, the highest
percentage of any minority ethnic group). This is thought to be
46
Why the Difference?
mostly due to the popularity of nursing Higher Diplomas with
this ethnic group, which tend to dominate this group.
4.2.3 Subject
When subject of first degree is analysed, there is also a distinctive
pattern of participation by minority ethnic students. Considerably
higher representations of minority ethnic students at universities
are in medicine/dentistry, computer science and law (over 30 per
cent in each, double the average). This contrasts with under ten
per cent in physical sciences, languages, art and design,
humanities, education, veterinary science and agriculture (Figure
4.2). In general, it is Asian students, and especially Indians, who
make up the majority of minority ethnic students in those subjects
which are the most popular with minority ethnic students. It is
also worth noting that some subjects, such as law and medicine,
are among the most competitive on entry to universities, and up
until recently, medicine/dentistry could only be taken at a small
number of pre-92 universities (and is also mainly entered via high
‘A’ level scores).
Figure 4.2: Minority ethnic students as percentage of total degree students in each subject,
England, at universities (excluding OU), 2000/01
(46,400)
Computer Science
(19,600)
Medicine & Dentistry
Law
(28,100)
Business and Admin Studies
(75,700)
Engineering & Technology
(48,900)
(11,800)
Mathematical Sciences
Subjects Allied to Medicine
(56,800)
Librarianship & Information Science
(13,600)
Social, Economic & Political Science
(58,600)
Biological Science
(47,200)
Architecture, Building & Planning
(15,900)
Physical Sciences
(34,600)
Creative Arts & Design
(62,500)
Languages
(44,000)
Education
(35,700)
Humanities
(25,100)
0%
5%
10%
15%
20%
25%
30%
35%
40%
45%
Figures in brackets are total numbers of students of known ethnicity in each subject (small subjects with very low
representation are omitted (for further details, see Interim report, Table C1).
Source: HESA
Why the Difference?
47
The subject profile at sub-degree level at universities is different
(so not included with the degree profile above), with a greater
emphasis on more vocationally orientated subjects. Here, the
highest percentage of minority ethnic students are in computer
science (29 per cent) and business studies (23 per cent). Further
details of the subject distribution at degree and sub-degree level at
universities can be seen in Tables C1 and C2, in the earlier Interim
report.
4.3 Gender differences
Gender differences in achievements of girls and boys, in education
prior to HE, have already been highlighted in Chapter 2. There
also different cultural/family attitudes in ethnic groups towards
women, education and employment, though some appear to be
changing over time.1 It is not surprising, then, to find gender
differences in the participation of minority ethnic groups in HE, as
shown earlier in section 4.1.1. The student data shows:
z minority ethnic groups, in aggregate, are less well-represented,
in percentage terms, among female undergraduate students
overall, than among male undergraduate students (15.5 per
cent of female versus 18.9 per cent of male totals) see Table A4
z but women outnumber men among minority ethnic undergraduates (54 per cent female versus 46 per cent male), which
is also the case in the undergraduate student population as a
whole.
As might be expected, this average figure, of 54 per cent, masks
wide variations, ranging from:
z around 44-45 per cent among Pakistani and Bangladeshi
students to
z a high of 70 per cent among the Black Caribbean group (ie over
twice the number of women as men in this group).
As section 4.1.1 indicated, there are differences by both gender
and ethnicity when participation rates (HEIPRs) are calculated:
z White, mixed ethnic, female Pakistani and especially
Bangladeshi groups have the lowest female participation rates
of any ethnic group (33-44 per cent range).
z By contrast, female Black African, Asian other and Black other
have the highest participation rates (over 70 per cent).
z The lowest male participation rates are among Black
Caribbean, White and mixed ethnic groups (34-36 per cent).
1
48
For more detailed discussion of gender differences see Mirza in
Mason (2003), Ahmad et al. (2003) and also the Cabinet Office final
report, cited earlier.
Why the Difference?
z While the highest male participation rates are among male
Black African, Indian and Asian other groups (over 20 per
cent) (see Appendix Table A.1).
z Care needs to be taken in interpretation of these results, as
some of the groups are relatively small, and as already
highlighted there are uncertainties in calculating gender/
ethnic HEIPRs (see end of Section 4.1.1).
Why does HE participation vary between men and women in
different ethnic groups? There are various likely explanations:
some lie in the distinctive demographic characteristics of different
minority ethnic groups (eg a female gender imbalance in the
Bangladeshi young population, and also higher proportions of
Pakistani and Bangladeshi women married in early 20s and with
children); others relate to gender differences in prior education
achievement (especially in the Black Caribbean group) and
different ethnic group attitudes towards education and
employment for women.
Another explanation may relate to subjects studied. The familiar
gender segregation with, eg computer science and engineering
being more popular with men, while law and ‘subjects allied to
medicine’ are more popular with women, is also evident in the
minority ethnic student population. But there are some particular
points worth noting:
z Law is more popular with female Pakistani students, and also
female Indians and Black Africans, than other groups (though
popular among women generally).
z Medicine, a very popular subject with minority ethnic groups,
but more so with Asians than Black students (see Figure 4.2),
has fewer female than male minority ethnic students,
including fewer Indian women than Indian men. This is
despite medicine having more female than male students
overall.
z Business and admin studies, where the gender balance is fairly
equal overall, has higher representations of women among the
Indians and Chinese taking it.
4.4 Causes of differences in minority ethnic
representation within HE
We now turn to look more closely at likely causes of variations in
representation of minority ethnic students, in different parts of the
HE sector (highlighted in section 4.2). An important one, yet
again, is prior attainment, and in particular entry route and entry
qualification. This particularly affects the institutional pattern of
minority ethnic groups. As we have seen, Chinese are more likely
to be at a pre-92 than a post-92 university, and as shown earlier,
are one of the groups more likely to be on the ‘A’ level entry route
Why the Difference?
49
into HE (and also more likely to have high ‘A’ level points and
come via an independent school), and pre-92 universities
predominantly select on ‘A’ levels. By contrast, Black Caribbeans
are more likely to be older on entry, much less likely to have ‘A’
level qualifications, more likely to come to HE via the college
route and are more likely to be at post-92 universities, where
selection criteria tend to be broader. However, the influence of
prior attainment on the institutional pattern seems to vary
between ethnic groups, and the picture is more complex than
these two examples suggest. A third example is Indians, also more
likely to have ‘A’ level entry qualifications on entry, and relatively
high ‘A’ levels, but are more likely to be found in the post-92
sector.
A number of other factors are likely to be shaping the institutional
pattern in addition to entry qualification, and also subject/course
choice. These often interact with each other — a student’s choice
of a particular course is often the main reason why he or she
chooses to go to a particular institution. Other factors include
attractive location/nearness to home, an institution’s reputation,
its graduate employment record, and its policies on widening
access towards non-traditional students. Subject choices can be
influenced by prior qualification (eg studying vocational subjects
post-16), particular career plans, interest/ability in particular
subjects, or influence of family, parents and teachers (eg being
steered towards certain subjects, like law or medicine).1
Once individuals have taken the decision to go on to HE there are
various influences on their decisions about what and where to
study, and these can often be quite difficult ones to make. We can
turn to our surveys of potential and current students to provide
insights into these, and other factors, which shape individual
choices of minority ethnic groups. These also give further
explanation for the much higher and lower representations, of
minority ethnic students, in certain institutions and disciplines.
4.4.1 Course and subject choice
Our survey of potential students investigated the course and
subject preferences. Firstly, it revealed a number of differences in
the ways in which they were considering different types of
courses. This was similar in many ways to the pattern of actual
student entry:
z The majority of Year 13 students were considering full-time
BA/BSc courses at the time of the survey (82 per cent of
minority ethnic students), and this figure was even higher for
minority ethnic students studying for ‘A’/’AS’ levels only (88
per cent).
1
50
See general literature on student choice and decision making about
HE, such as Connor et al. (1998).
Why the Difference?
z Those currently on courses leading to vocational qualifications
were more likely to be considering HND courses (27 per cent
compared to six per cent of those studying ‘A’/’AS’ levels).
Pakistani/Bangladeshi students were the group most likely to
be considering HND courses (20 per cent, twice the proportion
of White respondents). Black Caribbean students were more
likely than other groups to be considering full-time nondegree courses (eg DipHE).
z Asian students, and in particular, Indian students, were much
more likely to be looking at sandwich courses than the Black
groups.
The most important influence when it came to choosing subjects
for minority ethnic potential students was their prior attainment,
and this had a greater effect than any other personal variables.
Gender and age also had substantial effects on some subject
choices. This was particularly noticeable in IT, chosen by 30 per
cent of males and only five per cent of females, among minority
ethnic groups. By contrast, women were almost twice as likely as
men to opt for health studies and social sciences, which were also
more popular with older students.
We found that the influence of family on subject choice was more
marked amongst minority ethnic than White potential students,
confirming previous research which suggests that minority ethnic
parents often favour traditional professional areas for their
children. Our results found that Asian groups were more likely to
report that their families had a lot of influence on their choices than
other minority ethnic groups (24 per cent compared to only nine
per cent of White students and just six per cent of Black Caribbean
students). This is a main explanation for why medicine and law
are such popular subject choices with Asian students, even though
they may expect to get the grades to get into other courses.
The student survey also investigated reasons for choosing
particular subjects (though as this was undertaken with the
benefit of hindsight, views about subject preferences may be
coloured by subsequent experiences). Personal liking or interest
tended to be cited more than any other reason as important in
subject choice, which is similar to other research generally of this
kind. This was followed, in order of importance, by the relevance
the subject choice had to a particular career and good employment
prospects. Minority ethnic students were less likely than White
students to choose subjects for personal interest reasons and more
for employment/career-related reasons on the whole.1 Very little
differences could be seen between minority ethnic groups (in
support for these two main reasons), the only exception being a
higher proportion of Black Africans, than others, choosing subjects
with particular career or job outcomes in mind.
1
Why the Difference?
Statistically significant difference, or near to significance, at 99% level.
51
Table 4.3: Factors affecting choices of university by ethnic group (mean scores1), potential
students’ views
Issues affecting
decision
Black
Black Caribbean/ Pakistani/
African
Other
Bangladeshi
Indian
Chinese/
Asian
Other
All
minority
groups
White
Offered subjects wanted
4.6
4.8
4.6
4.6
4.3
4.6
4.5
Offered type of
course wanted
4.0
4.3
4.0
4.3
4.0
4.2
3.9
Good academic reputation
4.4
4.1
4.2
4.2
4.1
4.2
3.9
Good employment
prospects/good reputation
with employers
4.2
3.9
4.1
4.2
3.8
4.0
3.7
Good social life
3.3
3.2
3.3
3.7
3.1
3.4
3.3
Close to home/not far
away
2.9
3.1
3.6
3.3
3.2
3.2
3.2
Could keep/easily get
part-time job
3.1
3.2
2.9
3.3
3.1
3.1
3.0
In ethnically mixed area
3.1
3.1
3.3
3.0
2.7
3.1
1.9
Family has studied there
2.3
1.9
2.9
2.8
2.3
2.5
2.0
Some students/staff
similar ethnic group to me
2.4
2.3
2.5
2.6
2.2
2.4
1.5
Base number
95
68
111
170
65
567
206
1
In this table, scores again range from one to five, where one represents ‘Does not apply’, and five ‘Applies
strongly/big effect’
Source: IES survey of potential entrants to higher education, 2002/3
4.4.2 Institutional choice
Our surveys also examined the factors influencing student
institutional choice. In line with other studies on this issue,1 the
most important factor for potential students was that the
institution offers the type of course, and range of subjects,
preferred by the student (Table 4.3). This might include one that
had a sandwich element, or one that they could take part-time, or
offered particular options they liked. White students were much
less concerned about choosing an institution in an ethnically
mixed area than minority ethnic students. Ethnic minority
students were slightly more concerned about the academic and
employment reputation of the institution than White students,2
particularly Black African entrants.
Some influences were more associated with specific religions,
genders and age groups. Hindu, Sikh or Buddhist religious
groups were all more likely to see ethnic or family ties as applying
than other religious groups and/or those without a specified
religion. Female Muslim students perceived being in an ethnically
52
1
See Connor et al. (1998), and Perryman et al. (2003).
2
Statistically significant difference, or near to significance, at 99% level.
Why the Difference?
mixed area, and having family experience of studying at an
institution, as more important than other groups, as well as being
close to home.1 Overall, minority ethnic groups, however, were
actually slightly less likely than Whites to have a first choice
institution in their home region. However, the most significant
determinant, on whether or not a minority ethnic student selected
a home region institution, was their age (ten per cent of students
aged 21 and over had their first choice outside their home region,
compared to 36 per cent of those aged under 21).
Potential students were asked specifically about the influence of
their parents, partner or other members of their family on subject
and institution choice. It was over institution that this influence
was strongest for minority ethnic students, and more so than
among White students.
The way potential students weigh up the various factors in
deciding about institutions is illustrated in these three examples:
‘My first choice is Bristol because it’s third in the league tables for
maths ... its not too far from home and it would be possible to come
home at weekends … I think Bristol is vibrant and has a good
atmosphere.’ (Black male, aged 19 years, taking ‘A’ levels at
college)
‘My first choice is Kingston because the course is linked to St George’s
hospital and medical school … the medical school has a good
reputation, and I have worked in the hospital and would like to work
there again.’ (Black Caribbean woman, aged 33, taking an Access
course at college)
‘De Montfort because it’s in Leicester and my parents want me to stay
at home, and its well recognised by employers ... Aston because of the
course structure and graduate employment rate … Location most
important, reputation, graduate employment rate second.’ (Indian
female, Hindu, aged 18 years)
Turning to the student survey, preference for the type of course or
subject it offered was the main influence on institutional choice
(same as in the potential students survey, and also in line with
other research on student choice generally). This reason was more
evident though among Black than other students, which is likely
to link to their greater likelihood of them being on part-time
courses. Students at the group of pre-92 universities, both White
and minority ethnic, were far more likely to have gone there
because of its academic reputation, than students at other
universities or colleges. Although ‘being able to fit in better’ was
mentioned more by minority ethnic than White students, it was a
second order factor, and there was no evidence that this was more
likely to be chosen as a reason for choosing an institution by any
particular minority ethnic group.
1
Why the Difference?
Gender and religious breakdowns are based on small numbers and
can be seen as indicative only.
53
Family influence was greater on choice of institution for students
interviewed, than for the choice of course. The majority of
minority ethnic students (61 per cent) had been influenced in their
institution choice by their family in some way (compared to 47 per
cent of Whites). This pattern mirrors the potential students’ views.
z Asian students were influenced more by their family than
other ethnic groups, and particularly Pakistani and
Bangladeshi students (70 per cent of them combined reported
a family influence on institution).
z Religion and gender also played a role: the influence of
families on female Muslim students was greatest of all (44 per
cent felt their family influenced their choice of institution ‘a
lot’ compared to just 18 per cent of Muslim males). Figures
were also higher for female Hindu/Sikh/Buddhist (combined
group) students (42 per cent for females compared to 19 per
cent for males.
z Staying at home or with family, the distance from home, and
the particular town or city of the institution were all factors of
more importance to families of female Pakistani and
Bangladeshi potential students (but not families of males).
z Choosing an institution with a high academic reputation was
of more importance to families of Indian and Black African
potential students, in the way they influenced their choice
(and mainly for males, rather than females for Black Africans,
but more females than males for Indians).
The in-depth interviews with students and parents suggested that
some families prefer their daughters to stay close to home, but
there was also contradictory views. There was evidence (also in
the work of others1) that challenges the stereotypical view of
Muslim families being in opposition to the participation of their
daughters in education. A recent survey2 also found that young
minority ethnic full-time degree students are more likely to live
with their parents than White students are (44 per cent compared
to 19 per cent). Although whether this varies by gender within
ethnicity is not known.
Thus, we can see here too (as noted in the previous chapter) the
ethnic minority family ‘drive for qualification’. It appears very
much rooted in the belief that participation in HE will lead on to
greater things for their sons and daughters, particularly if they take
certain courses, or attend particular institutions. In the future, the
relative costs of higher education for many students (and for many,
their parents) will increase. Students are increasingly taking on a
‘consumer’ culture, in terms of purchasing an HE ‘experience’ and
54
1
See discussion in Payne (2003), p. 40.
2
Callender and Wilkinson (2003), 2002/3 Student Income and Expenditure
Survey.
Why the Difference?
qualification. How they (and their families) expect HE
participation to benefit them, both now and in the future, are
clearly very important, and this aspect is particularly important to
explore and monitor in the future for minority ethnic groups.
4.4.3 Admissions process
Another factor, likely to influence the institutional distribution of
minority ethnic students, is racial discrimination in the applications
and admissions process. At first sight, the different acceptance
rates of minority ethnic students to universities and colleges (via
UCAS), which vary from a high of 80 per cent for Chinese, to a
low of 64 per cent for Black Africans, with the comparable figure
for White applicants at 78 per cent,1 suggest a bias in admissions.
However, much of the reasons for these differences are likely to
relate to differences in the qualifications of applicants in relation
to the entry requirements of courses. As already pointed out (in
Chapters 2 and 3), attainment is a key factor in gaining entry to
particular institutions, and there are substantial differences in
entry qualifications, school backgrounds, and in particular, ‘A’
level scores, of applicants from different ethnic groups. Also,
admissions rates are not simply the number of accepted applicants
to total applications across the sector. Applicants can withdraw
from the application process, retake their examinations, and reapply the following year (and there is some evidence that this
differs according to minority ethnic group). Also, not being an
‘accepted applicant’ at one institution does not mean that an
applicant has not taken up a place elsewhere.
It is much better to look at applications, offers and acceptances on
an individual basis, and also try to take account of the skewed
institutional distribution of minority ethnic students and their
varied entry qualifications, and personal backgrounds in
investigating admissions bias. This has been done in one
important research study.2 It showed that when entry qualifications
and other socio-demographic characteristics were controlled for in
analysis of UCAS application and acceptance statistics, minority
ethnic candidates had less chance of success in gaining a place at
an old (ie pre-92 group), but not a post-92, university. In particular,
Black Caribbean and Pakistani groups were much less likely than
White students to have gained admission to a pre-92 university,
but Chinese and other Asian groups were more likely to have
done so. Minority ethnic candidates were one and a half to two
and a half times more likely than White students to gain
admission to university through Clearing.
It seems likely, therefore, that that there exists some ethnic
disadvantage built into the process of admitting students, from
Why the Difference?
1
See Leslie, Abbott and Blackaby, 2003.
2
Shiner and Modood (2002).
55
some minority ethnic groups, at some universities (especially pre92 ones). This is reinforced by the amount of discretion given to
admissions staff in offering places, and also from other studies on
student selection criteria.1
However, our research with current students failed to provide any
direct evidence of this. When first year students were asked their
experiences of applying and the admissions process, in a question
designed to identify whether or not they had experienced any
discrimination of any kind, very few mentioned any (only two
said yes, they had experienced some ‘racial discrimination’, four
some religious, and three some age, discrimination). However, it
needs to be noted that few will have been interviewed, or had
much personal contact in the offer decision making process, and
so this is not really a fair indication.
Our interviews did, however, show a range of experiences by
individuals of the university and college application and
admissions process. Those who applied for a university place
from school or college found the process relatively straightforward on the whole, more so than those who were outside of an
educational establishment at the time of applying (eg in work,
looking after families), who were more likely to find the
application process more problematic or more bewildering
(though not all of the latter found it difficult). However, this may
be more about access to support, rather than any discrimination
encountered, as when asked about the support they got, it was
teachers, careers tutors and/or family members with experience
of the HE system who were mentioned mainly.
There is a need to undertake further research on the offer decision
making process, especially by course subject/type at different
institutions, to enable firmer conclusions to be drawn here. It is
likely that improved monitoring of admissions and student
throughput, resulting from the recent race relations legislation,
will help in this, especially in assessing the scale of any racial
discrimination. Also, the current consultations on key issues,
relating to fair admissions to HE (the Schwarz group), will
provide a focus for further discussions. It has been suggested, eg
that withholding names on UCAS forms till after the offer stage
may help, but it has not yet been tested out, and may not be
practical.
4.5 Summary
Minority ethnic groups have higher participation rates in HE than
the White group, but some groups have considerably higher
participation than others, in particular Indian and Black African
groups. The lowest participation is among female Bangladeshi,
1
56
See Fair Enough? study, UUK, 2003.
Why the Difference?
lower than the White figure (male and female). However, there
are some uncertainties lying behind these participation measures.
Differences are due to their different prior attainment and pre-HE
entry routes and choices and also to a combination of other social,
geographical and cultural factors discussed in the previous
chapter (see Chapter 3).
The overall HE participation figures mask important differences
in the participation pattern of minority ethnic groups in HE study,
especially in their relative representation in different institutions,
subjects and courses (degree/sub-degree, full-time/part-time). This
is not simply an Asian/Black/White split, though certain patterns
can be seen that way, but a more complex ethnic group
distribution. Some of the patterns of participation are linked to HE
entry route, and in particular the attainment levels of different
groups, which combine to varying degrees for different minority
ethnic groups with other personal factors (eg gender, age,
geographical location, religion) and also views of other influencers
(eg views of parents, family, career plans) to produce specific, and
somewhat complex, patterns (see Table 4.4 which illustrates this
with some contrasting examples combining ethnicity and gender).
There has also been shown to be some disadvantage for minority
ethnic groups in the process of admissions at some universities (in
the pre-92 sector), which may also affect the institutional
distribution of minority ethnic students.
Some of the policy implications arising from the findings in this
chapter relate to the work which is currently being done in HE, in
relation to the new race relations legislation (eg on monitoring
admissions) and to HEFCE’s Race Equality scheme and
Table 4.4: Selected statistics summarising contrasts between some minority ethnic/gender
groups
Total number of undergraduate
students (approx.)
Male
Indians
Female Black
Caribbeans
Male Black
Africans
Female
Bangladeshis
Male
Pakistanis
Female
Chinese
23,000
11,000
12,000
3,000
13,000
5,000
% of total undergraduates
2.2
1.0
1.1
0.3
1.2
0.5
% of total full-time degree
students
2.7
0.9
1.2
0.4
1.5
0.6
% of total full-time sub-degree
students (mostly HNDs, DipHEs)
2.4
1.6
2.3
0.3
1.8
0.4
a) medicine/dentistry
8.4
0.2
0.7
0.7
2.5
1.0
b) business/admin studies
3.6
1.0
0.5
0.5
1.7
1.2
a) aged 21+
20.6
71.3
72.0
23.4
33.3
32.7
b) with ‘A’ levels
74.0
31.1
32.1
71.5
68.7
62.6
% of first degree students
taking:
% of each group entering
undergraduate courses
Source: HESA, 2001/2
Why the Difference?
57
institutions’ own race equality policies. It is important that
information on admissions monitoring is made public so that any
problems, specifically any of racial bias, are identified, and
encourage actions to be taken. We also recommend that further
research is undertaken on the offer/acceptance/entry process to
explore where opportunities for racial discrimination may occur.
Improving processes through more training of admissions and
academic staff, and also sharing practice, is also recommended.
The second set of policy implications relate to information and
guidance to help make students make good choices. It is
important that all students, especially from families without
experience of UK HE, are given appropriate help and guidance to
make the right choices about which courses to take and which
universities and colleges to go to. It is also important that the
diversity of the minority ethnic student population, and also the
ways they are influenced differently by the factors highlighted in
this chapter, is recognised in local projects that aim to help in
student decision making.
A third area of policy relates to the new Office for Fair Access
(OFFA), which will have a racial equality duty, and therefore
needs to include this dimension in its work, for instance when
approving access agreements with universities and providing
guidance.
A fourth is directed at the Department, and the need to explore
further, through statistical analysis work, likely explanations for
the different HE participation rates (ethnic/gender HEIPRs).
There will be an opportunity to use the soon to be released, more
detailed, Census 2001 data to develop an improved estimate of
participation rates for different groups, and also undertake some
cross-checking of assumptions behind the derived HEIPR figures
shown in this report.
58
Why the Difference?
5. Student Progress and Experiences
We now move on to the student experience in HE, and the factors
which affect the progress of minority ethnic groups of students.
We examine the extent to which minority ethnic students have
different experiences from White students, and how much these
differences can be associated with their ethnicity or other factors.
This is made somewhat difficult because, in general, student
progress and student perceptions of their time at university have
been the subject of less research and analysis than issues of
participation (ie access and entry) in HE. This is particularly the
case for minority ethnic groups, and there is a lack of up-to-date
research evidence which differentiates by ethnicity. Much of it is
based on small scale qualitative work. However, drawing on that
and our own survey of current students, we have aimed to draw
out some key points to help establish an evidence base, and
inform policy.
5.1 Early leaving and non-completion
Taking a wider context first, the graduation rates of HE students
in the UK appear higher than many other countries.1 Only around
one-tenth of full-time first degree students do not continue
studying after their first year of study, whilst more than threequarters are projected to achieve a degree at the institution that
they started at.2
Most analysis of non-continuation in UK universities shows that
the main factor of influence is prior entry qualifications, in
particular ‘A’ level grades. Institutions with greater proportions of
students with lower entry qualifications have lower overall
retention rates, although the subject and course mix on offer (in
addition to other factors such as student age) also contributes (as
Why the Difference?
1
See NAO report, 2002b, based on OECD figures (but caution needed
in making comparisons between countries).
2
These figures are taken from HEFCE PI publications, and relate to
students in universities only. It is worth noting that there are a
number of difficulties in accurately estimating retention rates. We
have not been able to obtain comparable reliable data for other HE
students (ie at FE colleges, or taking part-time degree or other
undergraduate courses).
59
recognised in calculation of institutions’ benchmark PI figures
discussed later). Many of the institutions with high early leaving
rates are institutions with high representation of minority ethnic
students (including many in London).
HEFCE has undertaken systematic analysis of HESA student
records, as part of the development of Performance Indicators
(PIs). This has considerably improved the statistical evidence on
achievement and outcomes, particularly our understanding of the
relationships between variables, including ethnicity (though this
has been mainly limited to broad, rather than individual, ethnic
groups). Some of this work is still in progress and only preliminary
results can be presented here.1 However, this analysis shows that
non-continuation figures are higher for Asian and Black than
White students, but when allowances are made for differences by
subject, entry qualifications, and age (ie the usual HEFCE
‘benchmark’ variables), young minority ethnic students on fulltime degree courses appear to do slightly better (continuationwise) than expected (ie have higher benchmark than raw figures),
but mature students do less well.
This indicates, therefore, that differences in progress do exist by
ethnicity. But it also shows that there are other factors (outside of
prior academic attainment), and other variables captured in the
HESA student record dataset (both positive and negative), that
have an impact on the likelihood of students from different
minority ethnic groups completing their degree studies. It is likely
that family support and expectations (identified in earlier
chapters), have a positive part to play, while negative reasons are
those related to academic difficulties, financial pressures or
dissatisfaction with choice of course or institution. These were
explored in our research.
5.2 Reasons for non-completion of degree study
Wider research on student retention has identified a number of
factors that can contribute to non-completion of degree study. The
most influential of these are: unmet expectations about the HE
experience; making the ‘wrong’ choice of course; and a lack of
commitment to the subject chosen. Other, although apparently
lesser, factors include: financial difficulties; poor teaching quality;
the feeling of isolation or hostility in academic culture; work
demands and personal commitments; and a lack of preparedness
for the style of learning in HE.2 These factors generally work in
combination to increase the likelihood of an individual leaving
their chosen course. However, this research provides little specific
1
2
60
HEFCE, Internal paper, (2002).
See Yorke (1999); NAO (2002b); Education and Employment Select
Committee Report (2001); and most recently, Davies and Elias, (2003)
IER.
Why the Difference?
information on how these factors affect individuals from different
minority ethnic groups, or sub-groups (female/male, mature/
young). What can be seen from it though, is that certain student
characteristics are associated with particular reasons for noncompletion. Some of these are more significant in some minority
ethnic groups than others (see differences in participation
patterns, Chapters 2 and 3), and so some implications can be
drawn on how they may differentially affect ethnic groups.
z Financial problems are likely to differentially affect older
students, and individuals from lower socio-economic class
groups, for example.
z Older students, particularly older women, are also more likely
to leave due to family commitments or difficulties.
z Younger students more often feel that they have made the
wrong choice of course, or that their experience does not live
up to expectations, either academically, or in terms of their
environment.
z Dissatisfaction with the academic aspects of study (either the
standard expected for them, or a lack of study skills) are more
likely to be reported by men.1
However, these do not provide any real explanation as to why
young minority ethnic students do slightly better than expected,
and older ones do worse (as indicated above).
Similarly, from the small amount of research literature, which
examines the experiences of minority ethnic students separately, a
number of points can be taken, but all suggest greater problems
for some groups:
z Black students who choose to leave their courses early, appear
to experience greater problems in relation to their finances,
and in their relationships with both staff and students within
HE2 than other ethnic groups.
z There is a suggestion that the experiences of minority ethnic
students can involve more isolation and difficulties in
adjusting to life within a group, which has many, considerably
different, social backgrounds.
z Another study also found that Black students3 were more
likely to have problems initially in establishing relationships
and in getting support from tutors. Also that they were more
likely to have confidence issues about coping with their new
life within HE, although this was specifically focussed on
access students.
Why the Difference?
1
See Yorke (1999); and Davies and Elias, (2003) (op. cit.).
2
Yorke (1999).
3
Rosen (1993).
61
z One small scale study suggests that minority ethnic students
are more likely to experience difficulties with the transition
between school and HE than White students.1
Care needs to be taken in drawing conclusions from these studies,
as they are generally based on small samples, or cover only part of
the population. Causal relationships between these factors
highlighted and non-completion are as yet generally unproven.
We believe that there is a likelihood (from the earlier evidence
presented) that family expectations and support have a positive
effect on minority ethnic students once in HE, especially young
students living at home, and we found some evidence to support
this in our research, as shown below, though much of the
comment was on issues to do with academic support and
university life.
5.2.1 Current students: our survey evidence
As part of our research programme, we sought to explore the
experiences of first year students (see student survey and
interviews, Chapter 1) and some of the difficulties involved in
adjusting to university life. A flavour of this is given from these
examples:
‘I felt a bit alienated by the university, and the course and the teaching
were very impersonal.’ (Pakistani man, aged 21, first year)
‘The first term was below what I expected, you only have time to do one
thing at a time, and it all seemed very confusing. It was a bit
intimidating to be honest.’ (Asian Other man, aged under 21, first
year)
‘The tutors were quite helpful if you made an appointment with them,
but basically there aren’t enough tutors to go round all the students.’
(Pakistani woman, aged under 21, first year)
However, our research was conducted with current students and
therefore does not provide additional evidence of how these
problems relate to those who had already left.
But we did explore the extent to which individuals in their second
year and above had considered leaving, and the reasons behind
this. This showed that there were some, albeit small, differences
between ethnic groups, the largest of which was between Indian
students (26 per cent of whom had considered leaving early) and
Black African students (38 per cent). Overall, Black students were
more likely than Asian students to have considered leaving.
Further analysis by gender and ethnicity found that male minority
ethnic students were more likely than female minority ethnic
students to have considered early leaving. Despite this, the groups
most likely to have considered leaving were Black African women
1
62
Adia et al., survey (1996).
Why the Difference?
(48 per cent), and Black Caribbean men (43 per cent), suggesting
that these groups may have experienced particular difficulties.
This may be because they were older on average, or may have felt
less family/parental pressure or support to stay, than other
groups. However, this evidence is based on relatively small
numbers and may be a result of some sample bias (the survey data
are shown in Appendix Table A8) and we can offer no further
explanation for the data. Only tentative conclusions can be drawn.
Further research, on a larger sample, would be needed to establish
more conclusively if they were particularly disadvantaged, and
also the likely reasons behind it.1
When all those, who had considered leaving at some stage during
their studies, were asked their reasons, these turned out to be
varied, and the numbers involved are really too small to analyse
sensibly by individual ethnic group. Overall, the main reason
given was financial difficulties, followed by academic pressure,
and a dislike of the course they were on. Slightly more minority
ethnic respondents gave financial reasons and problems with
family/childcare.
Our survey evidence, albeit on those who had considered leaving
but decided to stay rather than those who left, therefore confirms
that a range of factors, both personal and academic-related,
usually lie behind decisions to leave courses before completion,
many acting in combination, and affecting some minority ethnic
groups more than others. It is a multi-faceted decision making
process, and as the recent research at IES2 concluded:
‘No two situations are the same…Individuals can encounter problems,
which makes things difficult for them in their studies, and these lead on
to other problems. So for many, a vicious circle develops, and the final
decision to leave has been affected by a number of compounding
factors.’
This subject remains one requiring further investigation, and
where the evidence base for ethnic groups is inconclusive. In
particular, more research is needed on parental positive influences
on certain groups of students.
5.3 Difficulties affecting academic performance
The actual achievement of different ethnic groups within HE varies,
and this is discussed further in Chapter 6. Here we are focusing on
academic performance during studies, particularly in relation to
any specific difficulties students encountered during their studies,
and whether there are differences by ethnic group.
Why the Difference?
1
Course choices, both level and subject, can be different by gender,
and may play a role in addition to personal factors.
2
Pollard E, Pearson R, Willison R, Next Choices: Career Choices Beyond
University, IES Report 405.
63
In our survey, current students were asked to outline any problems
or difficulties they had experienced personally, which they felt had
affected their performance (ie stopped them from doing better than
they would have liked or from achieving more in exams/a higher
class of degree).1 Students gave their answers without prompting or
the use of a list of pre-coded options, and were free to outline as
many difficulties/problems as they felt applied to them. The main
ones reported were:
z financial difficulties, again (discussed further in section 5.5)
z problems with balancing part-time working and study
(discussed in section 5.5)
z and problems with facilities and getting sufficient support
from staff.
Among minority ethnic groups, there were comparatively few
incidents of racial discrimination or harassment that came up
when this question was asked.
Exploring any differences by ethnic group, more (around threequarters to more than four-fifths) of each minority ethnic group
gave a problem or difficulty of some kind, than White students
(just under a quarter). Black Africans were the most likely to have
experienced problems, and Indians and Chinese/Asian Other the
least likely.
The kinds of problems experienced varied markedly in their
relative significance for different groups:
z Fewer Indian students mentioned part-time working
problems (makes me miss lectures, makes me tired), only six
per cent, compared to any other group (mostly 15 per cent or
more).
z Indians were also more likely than any other minority ethnic
group to find academic work too hard, and almost equally
likely to report this as to report financial difficulties. This was
unlike other groups, where financial difficulties emerged as by
far the main type of difficulty reported.
z Insufficient academic staff support emerged from the survey
as the main problem for Chinese/Asian Other students.
z Pakistani/Bangladeshi students were more likely than other
groups to feel that they did not get enough encouragement
from lecturers (see survey data in Appendix Table A9).
Our qualitative work allowed us to explore further how minority
ethnic students felt about their achievements to date. Most of the
students were fairly satisfied with the way that they had
1
64
First years were excluded, as they had not yet had their first round of
end of year exams.
Why the Difference?
performed during their studies, although some felt they could
have done a little better. In some cases, students mentioned
personal circumstances, such as periods of illness or family
problems, as having had a negative influence on their academic
performance. Others felt that the disorganised nature of the course
(arising from institutional problems) had affected them adversely.
A lack of one-to-one support available from personal tutors etc.
was also highlighted as an issue of concern for some. Complaints
included that the lecturers and tutors often seemed to have too
many students to deal with, and too little time to give each
student adequate time and attention. The extent to which this, and
also other negative comments relating to course organisation and
quality of teaching, is a particular problem for minority ethnic
students is unclear from this data. However, other research (see
section 5.2) suggests that some minority groups are less likely to
seek support when they experience problems.
A few of the students interviewed also pointed out that there was
not always very much mixing between the ethnic groups, people
tended to stick with people very similar to themselves. Others
said that they themselves found it hard to mix with people from
different ethnic or cultural backgrounds. As highlighted above,
feelings of isolation in an academic culture is an issue raised in
research on retention (see section 5.2):
‘There is a bit of natural segregation between students by ethnic groups
— they all hang out with each other.’ (Pakistani man, aged under
21, first year)
‘Many of the Asians I come into contact with here are ‘down to earth’
Asians — more traditional than I am, and they expect me to be as
traditional as they are, so that can be difficult.’ (Pakistani woman,
aged under 21, first year)
The conclusions we draw from this analysis is that a range of
difficulties can form part of a students’ experience. Some, such as
financial issues, are applicable to all ethnic groups, to a greater or
lesser extent, whilst others (eg a lack of individuals from the same
cultural background) affect minority ethnic groups in particular.
However, it would appear that, on the whole, minority ethnic
students do experience more difficulties whilst in HE, which can
contribute to poorer academic performance, and may affect their
degree outcome (as discussed further in Chapter 6) although
further work is required to confirm this.
5.4 Student finance
In Chapter 3 we discussed the role of finances in the decision to
attend HE. This showed that financial barriers exist, but were not
a significantly greater disincentive for minority ethnic than White
groups (though the effect of financial factors is likely to vary
within groups). The financial situation of being a student has been
Why the Difference?
65
given more attention in the light of the changes in student finance,
growth in term-time working and concerns about growing
student debt. In particular, there are concerns about how finance
impacts on the overall student experience. We have already
highlighted, above, that financial difficulties were the most
frequently mentioned type of problem overall, but that there were
differences according to ethnic group. White, Black and
Pakistani/Bangladeshi students cited financial difficulties most
frequently, more so than Indian or Chinese/Asian Other students.
Financial difficulty was particularly a problem area for Black
African students, and this group was the most likely to mention
this issue as a problem affecting their academic performance.
The ways students finance their studies at university vary by
ethnic group. This has been shown by other studies1 (though the
amount of analysis undertaken by ethnicity is limited because of
small sample number problems in most cases). Our student
survey provided a fuller and more up-to-date perspective. Key
points of note are:
z Student loans and other borrowing are less likely to be one of
the main sources of income for minority ethnic than White
students in aggregate. Minority ethnic students are more likely
to get parental contributions, and rely on income from termtime working.
z However, as with much of the analysis in this report, the
overall student income pattern is very diverse. It varies
between minority ethnic groups — Asian groups in particular
are more likely to get parental contributions than White or
Black groups, and Black Caribbean groups by far the least
likely. This is likely to be partly age-related (younger than the
average), and also associated with a greater likelihood of some
in Asian groups to be living at home during term-time. There
are likely to be differences in the way that individuals get
support from their families (eg some parents are more
committed to supporting their children’s education, some may
have larger families to support).
z Though the Muslim group of students in our sample were less
likely to report a Student Loan being a main source of income
than other religious groups, nevertheless almost two-thirds of
them did so.
z The extent of being ‘in debt’ varied also: White students
seemed to have accumulated more debt than minority ethnic
students as a whole, but the Black Caribbean/Black Other
(combined) and White group were the most likely of any
individual ethnic group to be in debt. Indians were the least
likely. Again, this is likely to be partly age and gender-related
(more females than males overall had debt), and is also
1
66
See Callender (2003).
Why the Difference?
affected by the different socio-economic profiles of the groups
(the Black Caribbean group tends to be older and of a lower
socio-economic status), in addition to any direct ethnicity
effects.
z Contrary to general expectations, the Muslim group of fulltime students were not any less likely to be ‘in debt’ than other
groups, and there was also little difference between first and
second generation minority ethnic students.
5.5 Impact of student finance and term time working
In order to improve their financial situation, many students find
term-time working an essential part of university life. A link has
been shown between those experiencing financial difficulties and
term-time working. Women, and particularly minority ethnic
women, are more likely to be working during term-time than
male students on average are.1 Several research studies have
suggested a negative link between term-time working and
academic attainment.2 On the other hand, studies have shown
some positive benefits in students getting work experience and
developing work-relevant skills.3
The main negative impact of term-time working from other
research appears to be on non-specific study time and on time
spent doing projects or assignments. Our survey of current
students explored this further, by looking at the balance of time
between paid work and formal and informal study, offering new
analysis by individual ethnic group. This showed that:
z The balance of hours (mean number per week) spent in
independent study and paid work varied between minority
ethnic groups, more so than the average amount of time in
formal study (ie lectures/tutorials) per week (Figure 5.1).
z Black full-time students have the longest working week on
average (around 45 hours), and spend the most time in paid
work (13 hours).
z White and Indian students have the shortest working week
(38-39 hours), and spend the least hours in paid work on
average (under ten hours).
z Black African students spend the most time in independent
study, and Pakistani/Bangladeshi the least.
z However, there are a range of factors which, when analysed
alongside ethnicity, appear also to influence the amount of
time spent in paid work.
Why the Difference?
1
Metcalf (2001).
2
Van Dyke et al. (forthcoming).
3
Elias et al. (1999) Moving On Survey.
67
Figure 5.1: Balance between paid work and study. Mean number of hours per week in each
reported activity, by ethnic group
Black Caribbean/Other
Pakistani/Bangladeshi
Black African
Chinese/Asian other
Indian
Other
White
0
5
10
15
Lectures/tutorials
20
25
30
Independent study
35
40
45
50
Paid work
Source: IES/MORI, 2002
Some examples of these variations include:
z Age: for most ethnic groups, those in the oldest age group (25
plus) were the least likely to be working, but amongst Indian
students this pattern was reversed.
z Subject: although the numbers were too small to report, there
was considerable variation by subject within minority ethnic
groups in how students spend their time. Overall, engineering
and technology students had the longest (mean) working
week, and, along with business studies students, spent the most
time in paid work.
z Institution type: students in old universities (pre-92) were
much less likely to be working long hours, and there was little
difference in the percentages between the White and minority
ethnic group working 15 hours or more at these types of
institutions (both around 13 per cent). By contrast, the figure
was much higher for students at new universities, and a
difference opened up between White students (37 per cent
working 15 plus hours) and minority ethnic students (55 per
cent).
Unfortunately, this analysis is unable to control for differences in
socio-economic class of students, which would be expected to be
an important explanation. However, despite this, it does show
that minority ethnic full-time students in paid work were almost
twice as likely to be working for 15 hours or more per week than
White students (a level that other studies suggest starts to have a
serious effect on academic study).1 In our case study interviews,
part-time working was mentioned as a factor perceived to impact
on academic performance, for example.
1
68
See Dyke et al. (forthcoming).
Why the Difference?
‘I probably haven’t done that well, I wasn’t very motivated in my final
year, and this wasn’t helped as my employers wouldn’t give me time off
work in the run up to my exams to revise.’ (Black Caribbean/Black
other man, aged 21, final year)
Our evidence, therefore, would suggest that if term-time working
negatively impacts on academic performance (as the forthcoming
research sponsored by UUK and HEFCE indicates overall), some
ethnic groups are more likely than others to suffer, due to their
greater reliance on this as a source of income. Minority ethnic
students are more likely than White students to feel the impact of
longer hours in paid work, although it is not clear how much of
this could be explained simply by differences in socio-economic
profiles.
5.6 Institutional racism
As with entry to HE, it is important to consider the role that
institutional attitudes and practices have in the differing
experiences of minority ethnic students. A number of studies have
highlighted that some ethnic groups can suffer from particular
assumptions and behaviour by staff (eg stereotypes leading to
different treatment, like ‘not very bright’, ‘hardworking’ etc.1).
Universities have been given specific responsibilities under the
recent Race Relations legislation to develop equality of
opportunity policies. It is probably too soon to evaluate how
attitudes and practices are changing.
We explored the issue of possible racism or racist attitudes in both
the survey of current students and follow-up interview work.
Students were more likely to experience discrimination whilst at
university than they were at the application stage, although the
numbers reporting discrimination of any kind were small. This
does not necessarily mean that racial discrimination is less
prevalent in the admissions process; the different levels reported
may simply be because most students have little personal contact
with HE institutions and staff in the admissions process (eg few
are interviewed). Racial discrimination was more common than
other kinds of discrimination (eg disability, gender, age) whilst at
university or college, but it was still relatively low (seven per cent
of the minority ethnic sample reported experiencing any racial
discrimination on their course). Black Caribbean/Black Other
students (11 per cent) and Indian students (nine per cent) were the
most likely to report experience of racial discrimination.
Care needs to be taken in drawing too much from this — ethnic
group sample numbers are very small to generalise from. Also we
would expect some under-reporting in a survey of this kind,
because of the sensitive nature of the issues concerning
individuals. Again, as mentioned earlier in Chapter 4, there are
1
Why the Difference?
See Carter, Fenton and Modood (1999).
69
likely to be pockets within HE where racial problems are much
more of an issue to be tackled, and need to be identified and
addressed by the institutions concerned.
When we explored these student experiences in more detail
through our in-depth interviewing, experience of direct
discrimination by university staff did not emerge as an issue
(although these data are based on a relatively small number of
interviews). It was more common for experiences to be associated
with a lack of cultural diversity amongst the student population
and/or racist behaviour amongst students, and amongst people in
the towns in which they were situated (all of these instances were
outside London). There was also, for some students, a feeling that
academic departments could have done more to include everyone
(eg an example of a cheese and wine party being given was not
seen as appropriate for all) and that ‘there was no big effort made to
get people from different cultural backgrounds to mix’. Other examples
were:
‘Don’t come here — I like multicultural cities and (this location) is
White and rich. No one has the same taste as me. I sometimes feel I
can’t say anything because everyone is laughing at me.’ (Black
woman, aged 26, final year)
‘I’m Muslim — so I don’t share in the pubs and clubs culture of a lot
of the students — that made it hard. I had to say no to social
invitations as I don’t drink alcohol… (however, he was able to meet
some people with similar religious/cultural beliefs) … we did other
things, like playing pool and going to the cinema.’ (Asian Other man,
aged under 21, first year)
This raises an important issue about indirect discrimination,
particularly within those institutions which lack an obviously
culturally diverse population (ie many of the pre-92 universities).
The low levels of minority ethnic staff in many institutions1 may
contribute to feelings of isolation amongst minority ethnic
students. The extent to which cultural diversity is reflected in
course syllabuses may also be an issue, and the concept of ‘Whitecentrism’ has been identified by researchers2 as a possible cause of
alienation. It has been suggested that minority ethnic students are
also less likely to use formal channels of advice if they experience
problems.3 This would suggest that, where they do experience
difficulties, with some aspect of their work or social experience,
they are less likely to be given impartial advice or to have a clear
understanding of the options open to them. This may in turn link
back to continuation rates.
70
1
See Carter, Fenton and Modood (1999).
2
Allen, 1998 (HEIST Survey).
3
Adia et al., 1996 (HEIST Survey).
Why the Difference?
5.7 Summary
This chapter has shown that student experiences vary, and that a
range of issues can affect them. It is an area where there is
relatively little research.
Taking account of a range of personal and background factors
which can affect retention in HE, young minority ethnic students
do better than expected, and older ones do worse (ie more likely to
leave before completion). Minority ethnic groups are more likely
to be at universities with relatively high dropout rates, but this is
because these universities take a wider range of student intakes.
From our survey work, it was evident that minority ethnic
students experience a number of difficulties which can have an
effect on their progression and performance. However, it was
unclear how much they had hindered their progress to date, in
comparison to White students in our sample. (In the next chapter
we focus more on how they may have affected final degree
performance and outcomes). The extent to which minority ethnic
students experience specific difficulties can be due to a number of
personal factors (especially age, educational background and
socio-economic class), in addition to those associated with aspects
of their ethnicity. These can have different significances for
different ethnic groups. Specific issues identified which concerned
minority ethnic students, more than White students, were:
z staff support: lack of, or not as much, as they would like or
expected
z isolation/lack of cultural diversity: both lack of staff as
role models/mentors and lack of others with similar
cultural/economic backgrounds.
There were no negative issues identified in the survey of more
significance to White than minority ethnic students. Also no
reasons were found to explain satisfactorily why younger
minority ethnic students overall appear to do better in terms of
progression. The earlier positive influences from their families
(seen in earlier chapters) are likely to have continued, especially
for those living at home (and more Asian female students live at
home), and this may be the explanation. This would need to be
confirmed by further research.
Finance is a key variable in the student experience today, and
financial difficulties can be a cause of early dropout and poorer
than expected performance. We found financial difficulties to be
less of a problem for Indian, Chinese and Asian Other groups, but
more so for Black Africans.
The ways students finance their studies, and their overall state of
financial health, varies by ethnic group. In particular, their
reliance on parental contribution, living at home, term-time
Why the Difference?
71
working and extent of student debt. Minority ethnic students, and
Asian groups especially, are more likely than White students to
get parental contributions, have less debt, and be living at home.
Female Asian students, in particular, are more likely to live at
home while at university. Black students tend to work the longest
hours during term-time (in jobs). But, yet again, we see a fairly
complex relationship between ethnicity and other variables,
especially socio-economic status, which also influence the way
students finance their studies. The impact of the proposed new
financial support arrangements is likely to vary between ethnic
groups, but this will require a relatively large database to explore
fully, to take account of all the variables likely to be of significance
eg by age, socio-economic class, living at home, extent of parental
support, and subject (eg much higher numbers on long courses
like medicine). There is also the attitudes of students towards
repaying ‘family support’ to be considered in future research.
There was some evidence of possible institutional racism
encountered by students, where racial awareness and race
relations at some universities were poor, though rarely were
problems of direct discrimination encountered (eg teaching or
assessment, as highlighted by other research).
This part of the research has highlighted a number of issues
related to student support policies, at sectoral and institutional
levels, where ethnicity is likely to be an important dimension (for
example in financial support, course completion). It is
recommended that further research is undertaken into factors
influencing retention for different sub-groups of students, and
also on concerns and issues likely to be associated more with
minority ethnic students. We also recommend that the impact of
changes to student financial support on minority ethnic groups is
monitored.
72
Why the Difference?
6. Output and Attainment
Here we focus on the output phase of higher education, and
discuss the evidence on qualifications gained and the
achievements of minority ethnic and White students.
6.1 Qualifications achieved
As shown in the previous chapter, not all who enter HE study,
complete and gain their qualification aim (though the vast
majority do, only around one in five discontinue studying or
switch to another qualification). Of the total of 272,000 qualifiers
from English universities with degrees or other undergraduate
qualifications in 2001/02, approximately 36,000 were from a
minority ethnic group (excluding unknowns), that is a little over
13 per cent.
The minority ethnic qualifiers’ data includes just over 28,000
degree students (just over 15 per cent of total) and around 2,000
each of DipHE/CertHE, HND/HNC and other qualifiers (other
diplomas and certificates, including professional qualifications).
In this sub-degree output, representation of minority ethnic
groups was: around 16 per cent among DipHE/CertHE, 21 per
cent among HND/HNCs but only nine per cent among other
diploma and certificate qualifiers. As Figure 6.1 illustrates:
z Among degree graduates, the ‘Asian or Asian British’ group
account for almost half of the minority ethnic total, with the
largest group, Indians, alone accounting for one-third.
z Among HND/HNCs, Asian or Asian British also tend to
dominate (53 per cent of the total).
z By contrast, among DipHE/CertHE holders, the Black or Black
British group forms the dominant minority ethnic group
(almost 58 per cent of the total), and the largest individual
group of them is Black African (almost 40 per cent).
z But among other sub-degree qualifications, the minority
groups are more evenly represented, though Black or Black
British are more numerous than any other group.
To a large extent, these variations are a function of the different
subject patterns, and also relationships to particular occupations
Why the Difference?
73
Figure 6.1: Main qualifications of qualifiers (undergraduate level) from English universities,
2001/02
Degree N=28,202
HND/HNC N=2,522
Asian/Asian
British
De g re e N=2 8 2
, 02
Black/Black
British
DipHE/CertHE N=2,943
Chinese or other
Asian
other N=2,092
mixed/other
Source: HESA
of the various qualifications (ie there is a diversity of purpose in
the range of vocational qualifications at undergraduate level.1 For
example, DipHEs are dominated by health-related subjects,
especially nursing (which has a high Black African female intake),
while in the case of HNDs, the focus is on business studies, IT,
engineering and creative art & design (which are more popular
with male Asian groups, and especially Indian). These
qualifications are mainly taken by full-time study. By contrast, the
other diploma and certificate qualifications cover a wide range of
professional areas (eg management, accountancy, education, social
care, hospitality, health occupations), and are mainly taken parttime. As shown earlier (and also in Appendix Table A3), minority
ethnic students are much less likely to be taking part-time subdegree qualifications overall. There is also likely to be gender and
age differences, as well as ethnicity, between the various
qualifications.
In addition to the output from universities, a total of 67,000
students who were enrolled at level 4/5/HE in FE Colleges
‘completed the learning activity according to the qualification aim’
in 2001/02 in England. (This is taken from the ILR database and is
1
74
See Little et al., LSDA, 2004
Why the Difference?
the nearest we can get to an overall estimate of higher level
qualifications awarded at FE colleges, see LSDA report cited
above, for further details of data issues across the HEI and FEC
sectors). The vast majority were sub-degree qualifiers, taken via a
part-time route (only 5,500 degree graduates in this total), but
covering a very diverse set of qualifications (HNC, HND, NVQ,
professional titles). It is estimated that around 8,000 of these were
minority ethnic students, including a very small number (fewer
than 1,000) of degree graduates.
6.2 Differences in class of degree
The only statistical indicator of academic achievement available to
analyse, other than gaining the qualification itself, is class of
degree (nothing further is known about sub-degree qualifiers).
This shows that, overall, minority ethnic degree graduates are less
likely to gain a first or upper second class of degree than White
graduates (Table 6.1). All minority ethnic groups, except the small
mixed ethnic group and the Other group, have less than half
gaining first or upper second class degree results. Black groups
appear to be the least successful in class of degree, with only
around a third gaining a first or upper second, compared with 60
per cent of White students and around 45 per cent of Indian and
Chinese. The differences are apparent in each class.
This situation has not changed in the last few years (see similar
data for 1999/2000 graduates in the Interim report, Table 5.3).
Table 6.1: Class of degree obtained by degree graduates at universities, England, full-time
and part-time study, including OU, 2001/02
First
class
Upper
second
Lower second,
undivided second
White
10.7
48.9
31.0
9.4
157,741
All minority ethnic
6.0
36.2
40.1
17.8
28,292
Black Caribbean
2.9
32.0
48.6
16.5
2,016
Black African
3.3
27.5
45.6
23.5
3,275
Black Other
4.7
34.2
43.2
17.9
1,092
Indian
6.6
38.5
38.7
16.2
8,837
Pakistani
4.5
34.5
41.9
19.0
3,813
Bangladeshi
3.7
35.6
42.2
18.5
1,183
Chinese
8.9
37.6
36.1
17.5
2,127
Asian Other
7.2
36.5
34.7
21.5
2,349
Mixed ethnic
9.4
47.0
35.5
8.1
330
Other
8.5
41.5
35.9
14.1
3,270
10.0
47.0
32.4
10.7
186,033
All (known ethnicity)
Third or lower,
unclassified
Total
(n)
Ethnic group
Source: HESA
Why the Difference?
75
However, if only first class degrees are looked at, the achievement
gap is smaller: Chinese and the ‘mixed ethnic’ groups are more
likely than other minority ethnic groups to get a first class degree
(nine per cent), much closer to the nearly 11 per cent for White
students. Indians are also more likely to get a first (nearly seven
per cent), compared to the six per cent average.
Overall, female students are more likely to achieve higher classes
of degrees, and this also holds true for female minority ethnic
students, but the ‘achievement’ gap for White/minority ethnic
students appears wider among female than male graduates: 63 per
cent of female White graduates compared to 44 per cent of female
minority ethnic graduates achieved firsts or upper seconds,
compared with 55 per cent and 40 per cent of White and minority
ethnic male graduates respectively. The difference between the
male and female sets of figures varies in size between minority
ethnic groups, from around three percentage points for Indians to
almost eight for Black African and the Asian Other group.
Overall, there are also differences in degree achievement of
students by age, which need to be taken into account: younger
students are more likely generally to get a higher class of degree.
This holds true for both White and minority ethnic groups: 61 per
cent of White students aged under 21 years on entry gained a first
or upper second class degree, compared with 46 per cent of
minority ethnic students, and these figures compare with 54 and
32 per cent respectively for the 21-29 year age group. As those
with the lower achievement levels in Table 6.1 (ie the Black
groups) have an older age profile, and conversely, the Asian
groups, have a much younger age profile, then the different ages
at entry to HE would seem to help explain some of the ethnic
differences. It is also relevant when looking at achievement of first
class degrees by younger students in particular ethnic groups,
such as Indians and Chinese, who make up a higher proportion of
first class graduates in the younger age group, than in all
graduates.
Another relevant factor is prior education. The 2002 data on
degree outcomes shows that those who entered with traditional
qualifications — ie ‘A’ levels or Highers — were more likely to
achieve a higher class of degree than those with other
qualifications. The way this ‘lifts’ achievement is more
pronounced for minority ethnic than White graduates, and
especially the lower achieving Black groups (see Figure 6.2). This
relates back to the different entry routes/ qualifications of
different groups shown in Chapter 2.
Linked to all these factors are a number of other effects, including
choice of subject and course type and institution. We have not
been able to undertake analysis by subject and course, as numbers
become too small in some subjects, but we have seen differences
by university type. Overall, graduates from pre-92 universities are
76
Why the Difference?
Figure 6.2: Effect of entry qualifications on class of degree: percentage of degree graduates
gaining first or upper second class, 2001/02
White
Minority ethnic
Black Caribbean.
Black African.
Black other
Indian
Pakistani
Bangladeshi.
Chinese
Other Asian
Mixed
Other
Total known
0%
10%
20%
30%
All
40%
50%
60%
70%
'A' level entry
Source: HESA
more likely to gain a first or upper second (67 per cent do) than
those at post-92 universities or other colleges of HE (around 50
per cent of graduates). In the pre-92 university total (where a
much higher proportion of degree students are young and enter
with traditional qualifications, but where minority ethnic groups
have below average representation), 69 per cent of White
compared to 52 per cent of minority ethnic graduates gained a
first or upper second class of degree. But this varied from 44 per
cent among Black African and Black Caribbean graduates to 54
and 55 per cent among Indians and Chinese and 61 per cent
among the Other group. In the post-92 university group, the
difference between White and minority ethnic achievement was
54 per cent and 35 per cent respectively (gaining first or upper
seconds).
This analysis has shown, therefore, that much of the apparent
relative under-achievement of minority ethnic, compared with
White graduates, comes from indirect causes. Many arise from the
differences between ethnic groups in their personal characteristics
— by age, gender, subject and institutions, and especially, entry
Why the Difference?
77
qualifications. It has also shown that some ethnic sub-groups are
performing considerably better than others. There are likely to be
other explanations of the different degree performance, such as
the extent of term-time working, financial and personal
circumstances, commitment to their choice of courses and parental
support and encouragement. As with the discussion earlier
relating to entry to HE, these have multiple effects and interact
with each other in different ways for different ethnic groups.
It was not possible, within the remit of this study, to undertake
more complex analysis on the data than that shown above (eg
using multivariate techniques) and it may not be fruitful anyway
to do so for some groups because of the small numbers once
disaggregated in several dimensions. However, we do recommend
that this is looked into further to establish more clearly the effect
of ethnicity on achievement and identify which ethnic sub-groups
of graduates are performing both or worse than expected.
As far as we are aware no work has been published of this nature,
though HEFCE has undertaken some preliminary analysis of
degree outcomes by broad ethnic groups (Asians, Black, White,
Other). After allowing for age, subject mix, and entry
qualifications, it was found that minority ethnic students still
significantly under-performed compared to White students. Three
possible explanations were put forward for this. Firstly, there
could be an effect from other attributes of minority ethnic students
(eg more likely to re-take ‘A’ levels); secondly, an effect from
attributes of institutions where minority ethnic groups tend to
study (eg concentrations in institutions with lower than expected
good degrees); and thirdly, particular interactions between
minority ethnic students and HE (eg students choosing particular
modules, or systematic discrimination, direct or indirect). HEFCE
expect to have a clearer idea when it has developed a model
taking into account a wide range of factors.
Earlier research1 supports the conclusion from our research about
differences in prior attainment being a key factor, and also
different student experiences, including some institutional racism
or lack of racial awareness in some institutions. A number of small
studies in the 1990s show up institutional racial issues, such as
that focused on medical degrees which found racial bias in
assessment2, and more widely across a London university.3 It is
likely that the situation has improved but we are not aware of any
further up-to-date evidence.
Our survey and interviews revealed a small amount of evidence
of incidences of racial discrimination or harassment. However, we
78
1
Eg Connor et al. (1996).
2
McManus et al. (1995); Esmail and Dewart (1998).
3
Van Dyke (1998).
Why the Difference?
did not expect much, since there is likely to be a certain amount of
under-reporting in a survey of this kind, due to the sensitivity of
the subject. Seven per cent of minority ethnic students
interviewed felt they had experienced some discrimination or
harassment due to their ethnicity during their course, slightly
more Indians (nine per cent) and Black Caribbean/Black Other (11
per cent), and this covered students from both universities and
colleges. The figure is low, accounting for about one in fourteen of
the total, but it is likely to be an underestimate, and seems large
enough to warrant concern, especially considering the evidence
on under-performance of minority ethnic groups in degrees
(shown above).
One aspect of student life, which is suggested as having an
increasingly negative effect on academic performance of students,
is the extent to which they have term-time jobs. A recent study
(but not yet published) sponsored by HEFCE and UUK shows
that, overall, students who worked felt pressures on their
academic studies, and that minority ethnic students were more
likely to work term-time than White students (60 per cent
compared to 53 per cent). Among those in our graduate follow-up
survey who worked, over half felt it had affected their studies,
and Black students, who were the most likely to have worked
term-time, were more likely to feel this.
The main ways it had affected their academic studies was on the
standard of their course work and feeling too tired to work.
There is not really sufficient evidence from here or other studies to
show how much of a negative effect working has on degree class,
and for whom in particular (and it also has some positive effects
on ‘employability’ of graduates), but it is an aspect of today’s
student life which needs to be continued to be monitored and
researched.
6.3 Students views on achievements
We have one other indicator of achievement to look at — how
students themselves felt about their outcomes. While mostly this
relates to the next stage, moving into the labour market and
achieving job/career goals (and discussed later in Chapter 7),
there are some insights from interviews with students and recent
graduates about how they view their achievements.
Students interviewed in their final year were asked about their
academic performance and most were satisfied with it, though, as
might be expected, there was a feeling from some that they could
have done a little better. A range of factors that may have had a
negative influence on achievements were mentioned (including
some of those discussed above), including personal circumstances
(health, family problems), quality of course (disorganised,
inconsistent quality of lecturers, not enough personal support
Why the Difference?
79
available), study/IT facilities, working part-time and financial
problems. For example:
‘Some of the staff are very good, and you can go and ask for help any
time … others have office hours once a week and you need to make an
appointment, but they get booked up … have to wait too long, not
enough.’ (Black African female, aged under 21)
However, there was no consistent message from our student
survey that any group of minority ethnic students felt more
disadvantaged than White students, as most of the views
expressed were very much part and parcel of university life at
many institutions.
The graduates in the follow-up survey were also asked to reflect
on their undergraduate education as a whole, and what they
valued most from it. The main benefit given was that it helped
improve the skills and qualities which employers are seeking (just
over one-third of respondents), followed by the social aspects (eg
meeting new friends, better social network). Again, though, we
found very little difference between the main ethnic groups, in the
support given to these identified benefits.
Had they achieved what they had hoped for? This is covered
more in the next section as the graduates had a firm eye on the
labour market by this time, and their experience in finding work
tended to affect their views on the benefits of HE study.
Interestingly, the extent to which they were satisfied that they
made the right choice of HE course and institution in the first
place varied between groups. While the majority of White
graduates were satisfied with both course and institutions they
had chosen to study at (ie they would do the same again), this
applied to less than one-third of Asian, and less than a quarter of
Black, graduates. This suggests greater regret/more wrong
choices made, possibly due to greater disillusionment with
outcomes to date.
The first follow-up of the ‘student choice’ study (final year
students)1 also found that ethnicity was a factor in perceptions
about ‘right/wrong choice’, and that Black students were less
likely to believe they had made the right choice of institution than
White students. And again, two years later, in the second followup of this cohort2, Black students were much less likely than
White or other students to feel they had made the right choice of
institution or subject.
These different views about outcomes are discussed further in the
next chapter.
80
1
Connor et al., (2001), UUK and IES.
2
Pollard et al., (2004), IES Report 405.
Why the Difference?
6.4 Summary
The graduate output contains a substantial number from the
minority ethnic population, almost one in six of the total with
degrees from universities (some 28,000 in 2002), plus (8,000) those
with DipHE, HND and other qualifications. Representation of
minority ethnic groups among HND holders is even higher (one
in five, though a much smaller number than degree graduates).
Overall, despite the higher levels of participation in HE compared
to White people, minority ethnic students are less likely to achieve
as high a class of degree; and Black graduates, and Black Africans
in particular, achieve the lowest degree outcomes. This overall
situation does not appear to have improved in recent years.
However, when various factors, like age and entry qualifications
are taken into account, the performance gap reduces. If first class
degree achievement only is looked at, the gap between White and
minority ethnic students is less than when first and upper second
classes are combined, and some — Chinese and ‘mixed ethnic’
groups in particular — are close to the White graduate position in
achieving first class degrees, with Indians and the Asian Other
group not far behind.
There is a gender achievement gap (females outperforming males)
and this varies between ethnic groups. It appears as a smaller gap
for White than minority ethnic graduates as a whole.
A number of other causes of poorer degree performance are likely
to be associated with students experiences (discussed in the
previous chapter, eg term-time working, quality of learning).
There is also some race relations issues in institutions (though
actually very little evidence found in our student survey, see
previous chapter). Family encouragement, and personal
commitment to their choice of course, are likely to be influences
also. Although most of our students were satisfied with academic
outcomes to date, there was a suggestion that some had regretted
the choices about HE institution and subject they had made
earlier, and these views about ‘wrong choice’ (though a minority
view) were more likely among minority ethnic than White
students overall.
The research has indicated a number of areas for further inquiry.
Research is needed to provide better evidence of influences on
degree performance of particular groups (eg young and mature
graduates, at different kinds of institutions taking different
subjects, with different levels of parental support).
Why the Difference?
81
7. Transitions to the Labour Market:
Student Perspective
As several research studies have indicated, there are various
possible benefits from going on to higher education, but
employment and economic benefits tend to be the most important
ones to potential HE entrants.1 In this, and the next chapter, we
turn our attention to the final stage of the journey through HE for
minority ethnic students — their transition to the labour market
— looking at initial employment outcomes and factors of
influence. In this chapter, we discuss:
z final year students’ attitudes towards jobs and careers, from
our student survey and other research
z initial destinations and employment of graduates, drawing
mainly off the First Destinations Survey (FDS) of graduates, to
give the broad statistical picture
z the factors which influence graduate employability, as shown
by our follow-up survey of graduates and interviews (2002
and 2003 output), and other research
z and some views of graduates’ future plans (drawing mainly
off our graduate survey).
The next chapter provides an employer perspective.
7.1 Context
It is often said that today’s graduates are more ‘consumerist’
towards their university education than earlier generations. Not
only are many more likely to go to university for instrumental
reasons (ie to improve their labour market prospects and/or fulfil
career ambitions) but they appear to be less interested in the
intellectual content of their course, and more concerned with
vocational aspects of studying and their grades, or class of degree
and outcomes.2 Student demand for, and expectation of, higher
education are likely to be changing for a number of reasons:
82
1
See for example Connor and Dewson (2001); Callender et al., (2003).
2
See Rolfe (2001).
Why the Difference?
z the students themselves are changing (there is a greater
participation in HE by people from a wider range of ages and
socio-economic backgrounds)
z there is greater emphasis in the curriculum on developing
employability and more vocational orientation to some
undergraduate study
z there are greater personal costs involved in studying in HE,
including higher levels of debt on graduation
z and there are changes in the labour market: continuing high
demand for graduates, but jobs taken up by graduates cover a
broader range, and earnings and career paths are much more
varied than in the past.
As with many aspects of today’s HE system, there is considerable
diversity in the views and career aspirations of students. Research
has found a mixed model of job searching and career aspirations
among students. Some have much clearer ideas at the entry stage
(eg those choosing medicine, engineering or other vocationallyorientated subjects), while others are relatively vague about
careers.1 While at university, students are more likely to work
during term-time, but for many this is mainly for economic
reasons than to gain specific types of work experience to help with
a particular career aim.2 Also, a significant proportion of final year
students delay decisions about job applications until after their
final exams or even later, perhaps when degree outcomes are
known; while others have made numerous applications by this
time. Some engage with employers to help improve their labour
market success (eg through industrial placements, summer
internships, by visiting recruitment fairs); while others pay little
attention to improving their employability until the final year or
later.3
As we have already seen in this report, on the whole minority
ethnic students are influenced by ‘employment/career’ factors
more than White students, in decisions to go to HE study in the
first place (eg getting a qualification for a particular career, helping
with career options, see earlier discussion in Chapter 3, and Table
3.1 in particular). Also, traditional professional areas are a more
popular subject option for many of them (eg law, medicine) (see
Figure 4.2). They are more likely to expect economic gains from
their HE investment, particularly if from a lower socio-economic
group, and these views are shared with their parents in many
instances. The perceived employment prospects of certain
institutions and courses, while not usually the main reason for
minority ethnic students choosing to go to them, tend to be more
important as secondary reasons than for White students (as
Why the Difference?
1
See Connor et al. (1999).
2
See Van Dyke, Little and Callender (forthcoming).
3
See Perryman et al. (2003).
83
confirmed by our potential student survey, see Chapter 4, Table
4.3).1 However, as has already been pointed out on several
occasions, generalisations can be misleading because of the
diversity within the minority ethnic student population —
diversity between (and within) minority ethnic groups in their
subject, institution and course choices, and also diversity in their
motivations for taking HE study. It is important to bear in mind in
this chapter that, although the expectations of economic gain is
strong across all the minority ethnic groups, students of the same
ethnic groups often:
z are of different social classes/family economic status
z have different prior attainment
z go to different kinds of universities
z study different subjects
z have different employment destinations on graduation
z have different career goals in mind.
It is also very likely that minority ethnic students’ attitudes
towards their job search, and making the transition from HE to the
labour market, will be influenced by their awareness of the
general disadvantage that the minority ethnic population
experience in the labour market in comparison with White people
(see section 1.5.2). Therefore, there will likely be an expectation of
greater difficulties. This was highlighted in a 2001 survey of
students and graduates, where one-third of the total sample, but
almost twice as many (60 per cent) of the minority ethnic
students/graduates, believed that employment prospects for
minority ethnic students were less good than for others.2
Furthermore, ethnicity and educational background were seen as
the main contributing factors to barriers to getting a job. Careers
advisers at universities also generally acknowledge that minority
ethnic students face the hardest time in the job market,3 though
their relative disadvantage is also seen as being connected to class
background. As a result, a number of initiatives have been taken
at universities, targeted on minority ethnic students, to help
improve their prospects (eg diversity mentoring, career
workshops, work placements, discussed further below).
It is worth noting that disadvantage in the labour market is
generally greater for some groups (Pakistani, Bangladeshi and
Black men and women) than others (eg Indian men). It is seen in
the much higher unemployment levels4 among minority ethnic
84
1
Also in earlier research on student choice, see Connor et al. (1990).
2
See Park HR Survey (2001).
3
See AGCAS/HECSU study (2003).
4
Summer 2002, LFS.
Why the Difference?
people than White people (12 versus five per cent), and
Bangladeshi and Black Africans in particular (21 and 19 per cent
respectively). By contrast, Indian men and women have the lowest
(six and eight per cent respectively). Also, minority ethnic groups
(with the exception of Indian men and Black Caribbean women)
tend still to be under-represented among men and women at
managerial/professional levels (jobs many graduates will be
aiming for). There is a concentration of minority ethnic people
working in the services sectors, especially retail and restaurant
businesses, rather than industrial firms; and they are also underrepresented in large, private sector firms as a whole. There may be
a tendency for minority ethnic graduates to focus more on certain
sectors because they perceive them to be more ethnically mixed
than others.
Having done some general scene setting, we now turn to look at
how some of these issues feature in our research findings. We
start with final year students, and their job search behaviour and
views, and then look at actual graduate employment outcomes.
7.2 Final year students’ views
Our survey of final year students lends itself to previous studies,
see above, in finding wide variations in the career plans and job
search behaviour of final year students. Some of those interviewed
were much more ahead (in timing) in their job search activities
than others. They were looking for a variety of types of
employment, and they were using sources of information about
likely jobs/employers/vacancies in a variety of ways. These
variations were between, and also within, ethnic groups. In
addition, many students were still very undecided about jobs and
careers at this stage (just before final exams), and were deferring
any decisions until after completion of their degree studies and
outcomes known.
The following were particular points arising from the student
survey and interviews are that:1
z Taking up paid employment was the most popular intention of
all final year students (in 2002), but it was more likely among
most minority ethnic than White students (see Figure 7.1). It
was most likely among Chinese/Asian Other groups (almost
80 per cent) and Indian (65 per cent), and least likely among
the Pakistani/Bangladeshi group, who, along with the Black
African group, were more likely to be planning further study
at that stage.
1
Why the Difference?
The survey included face-to-face interviews with 530 final year
students, 52 cent of which were from a minority ethnic group, plus
some 15 case study interviews, see Chapter 1, section 1.3.2 for more
details of survey, and also Appendix B.
85
Figure 7.1: Student plans after completing course, by ethnicity (full-time final year students)
Chinese/Asian Other
Indian
Black Caribbean/Other
Black African
White
Pakistani/Bangladeshi
0%
10%
20%
Start/remain in a paid job with an employer
30%
40%
Take a year out/travel
50%
60%
70%
80%
90%
Take a postgraduate course/further study
100%
Other
Source: IES/MORI, 2002
z A minority actually had a job offer at this stage (only around
one-fifth). Of those who did not, around two-fifths had started
seriously looking for a job (ie only around one-half of the total
sample had either got or sought employment by this stage).
Pakistani/Bangladeshi (combined) full-time students were
more likely to say that they had secured a job offer by this time
than any other group (one-third had, despite them being one
of the least likely groups to be intending to take up paid
employment). They were more likely than White students or
Black Caribbean/Other (just over 20 per cent), or Chinese/
Asian Other (13 per cent). But it was the Chinese/Asian Other
groups who were more likely to have started looking by then
(just over 50 per cent had), followed by the White group (43
per cent). Whereas the Black African, Pakistani/Bangladeshi
and Other (non-White) ethnic groups were the least likely
(around one-third to one-quarter of each).
This would indicate that even at this early stage, some groups of
students were more aware of the need to start their job search
before completing their degrees than others, and also of the
difficulties they were likely to face in finding a job. The findings
also confirm the ‘mixed model’ of job search behaviour,
highlighted above.
Ethnicity is likely to be a factor which impacts on individuals’
career intentions and likelihood of engaging in job search
activities, there are also relevant other factors which interact with
ethnicity in different ways. Subject of degree is likely to be one
that causes considerable variation in students’ career plans, as
other research has indicated. For example, research has shown
that a considerably higher proportion of engineering, maths/
computing and business studies (which includes accounting) than
other graduates, have intentions in their final year to go directly to
jobs on graduation, and are more likely to have a particular job or
86
Why the Difference?
career in mind1 (we also found this in our study for maths/IT
graduates). Another is gender, which is also subject related; male
graduates are more likely to plan to enter jobs than female
graduates, who in turn are more likely to choose further study.
Type of institution may be a third factor (more large employers
have links with certain institutions, mainly the pre-92 group). A
fourth is likely to be locality preference, and a London bias in
particular; minority ethnic groups in our survey were more likely
to be looking locally than nationally for jobs, and Black Africans
the most likely (and as seen earlier, see Chapter 4, most likely to
be in London area).
Our survey data was not sufficient in size to enable analysis to be
undertaken at sub-group level, to help assess the relative
significance of these various factors. However, it highlighted the
diversity of the final year student population and the way they
went about their job search. There are likely to be multiple
influences, not operating in isolation from each other (see section
7.4, where we discuss further the influences on employment
outcomes).
Another finding of our survey was that most students had already
used a variety of information sources to find out about jobs or
careers, though again there were considerable variations in which
type, and in the number of different sources used. In a multiresponse question, the most popular sources overall were ITbased/Internet/webpages (each used by at least half of the final
year students). But a majority said they had used a non-IT based
source (eg friends/family advice, university careers office, careers
publications).
Indian students were the most likely ethnic group to have used
the Internet to look for company information or organisations’
vacancies. While minority ethnic students, as a whole, were
equally as likely to have visited the careers office at their
university or college, they were less likely to have had an
interview with a careers adviser. Again, subject differences
between ethnic groups, and also their institutional distributions,
are likely to be factors influencing the use of different sources of
information.
All in all, the survey evidence indicated that more students these
days prefer to take a more independent approach (eg using the
internet, asking family or friends) than making use of the
professional careers advisory facilities provided. However, this
varies considerably between students, and some of our
interviewees would have welcomed more help from their
universities earlier in ‘firming up’ their career plans, for example:
1
Why the Difference?
Purcell and Pitcher (1996) study.
87
‘You get to the final year and you don’t know what to do – it would
have been helpful to get careers information earlier on in our course.’
Black African, male, 25-29 years, final year
Chinese/Asian Other, Black African and Indian students were
more likely to prefer to take a more independent approach than
other minority ethnic groups. However, it was not certain from
the survey evidence whether minority ethnic students in aggregate
were more or less likely to prefer this than White students.
There were few examples reported of any direct racial
discrimination encountered while job hunting (more by Black
Caribbean/Other female students but very small numbers). A
small number of students, including more White students,
reported some form of age discrimination.
There is some existing research evidence of racial discrimination
in the graduate recruitment market, though relatively sparse and
not particularly reliable. A survey of students in 2002 (op. cit.
above) showed that 25 per cent of minority ethnic students felt
they had experienced discrimination, compared with 18 per cent
overall. Ethnicity and gender were the most common basis for it.1
7.3 Initial destinations
Moving on to actual employment outcomes, data from HESA’s
First Destinations Survey (FDS) of students leaving higher
education, shows that initial employment outcomes are poorer
overall for minority ethnic (in aggregate) than for White
undergraduate students. This applies to each minority ethnic
group, but there is variation between minority ethnic groups, and
also by gender.2
Table 7.1 shows the higher initial unemployment rates for fulltime degree students from all minority ethnic groups. The
minority ethnic average was just over 11 per cent compared to
nearly half of that, just over six per cent, for White graduates.3
z Pakistanis had the highest unemployment (almost 14 per
cent), but Bangladeshi, Black African and Chinese figures were
also high (each 12 per cent)
88
1
This was an online survey and care needs to be taken with results:
though large in size, 1,305 sample, it could have attracted a larger
number of students to respond who had encountered more
employment problems than the average student.
2
See also Interim report for earlier years data and report by Owen et al.
(2000).
3
These figures cover home full-time degree students only, leaving
English HEIs, 2001/02.
Why the Difference?
UK paid work
Overseas work
UK self-employed
Study or training
Unemployed
Other
Not available for
employment or training
Total number
Table 7.1: First destinations of full-time degree (home domiciled) graduates from English
universities, 2001/02 (percentages are based on known destinations)
White
63.4
2.2
1.6
17.4
6.1
2.8
6.5
118,069
All minority ethnic groups
55.3
1.0
1.1
22.4
11.1
4.2
5.1
19,851
Black Caribbean
63.8
0.4
1.3
14.3
9.8
4.8
5.7
1,200
Black African
54.3
0.4
1.2
21.6
12.2
5.9
4.4
1,950
Black Other
60.1
1.5
1.5
17.4
10.8
3.3
5.4
666
Indian
58.9
0.5
0.7
22.5
10.2
3.3
3.9
6,762
Pakistani
51.5
0.4
1.4
24.0
13.9
3.8
5.1
2,722
Bangladeshi
53.0
0.2
0.6
23.2
12.4
4.4
6.1
862
Chinese
47.7
2.8
1.1
26.7
11.6
5.1
5.1
1,485
Asian Other
52.7
1.2
1.5
23.9
9.7
4.8
6.1
1,631
Mixed ethnic
46.7
2.9
2.9
26.4
8.3
5.4
7.4
242
Other
52.6
2.3
1.7
21.6
10.3
4.4
7.1
2,331
All (known ethnicity)
62.2
2.0
1.5
18.1
6.9
3.0
6.3
137,920
Source: HESA (FDS)
z higher percentages of White than minority ethnic degree
graduates in aggregate enter UK paid work (63 versus 55 per
cent), but Black Caribbean graduates are the most likely group
to do so (64 per cent)
z higher percentages of minority ethnic than White degree
graduates go on to further training or study (22 versus 17 per
cent), and highest of all is the Chinese (27 per cent) and mixed
ethnic groups (26 per cent)
z there are very low percentages of self-employment (under two
per cent), but slightly higher percentages for White than
minority ethnic degree graduates (which is the opposite of the
situation in the general working population).
An alternative way of looking at successful degree outcomes is to
calculate a ratio of the total in employment, or further study, to
the total of those likely to be seeking employment or training for
each ethnic group.1 This shows that the Black African group have
1
Why the Difference?
There is some debate as to whether ‘further study’ is a successful
outcome of a first degree course but as it is included as one of
HEFCE’s Performance Indicators for institutions, it is included here.
89
Figure 7.2: Labour market success indicator: male and female full-time first degree graduates
from English universities, by ethnicity, 2001/02
White
Black Caribbean
Black African
Other Black
Indian
Pakistani
Bangladeshi
Chinese
Other Asian
Mixed
Other Ethnic
All minority ethnic
Total (all known ethnicity)
75
80
85
90
Female
95
100
Male
Indicator = 100x (employed + study)/(employed + study + unemployed)
Source: HESA (FDS)
the least success (a ‘score’ of 84.3) and Indian, Black Caribbean,
Black Other and Other ethnic groups the most (90-91 per cent
range). These compare with a 94 per cent score for White
graduates, and an aggregate minority ethnic score of 88.8.
Female minority ethnic degree graduates have more success than
their male counterparts and they score better for all ethnic groups,
but not as highly as female White students (see Figure 7.2). Also,
looking at the unemployment rates, there are higher
unemployment rates for male than female minority ethnic degree
graduates (almost 14 per cent versus nine per cent). A similar gap
is seen among White degree graduates (eight versus 4.5 per cent).
The highest unemployment of all was among male Chinese and
Pakistani (each nearly 16 per cent), while the lowest was female
White and female Chinese (eight per cent) (see Appendix Table
A10 for more details).
Although little gender difference is apparent in the proportions of
minority ethnic degree graduates, as a whole, who go on to
further study, the pattern is more varied by individual ethnic
group. Higher percentages of male than female Chinese,
Bangladeshi, Black African and mixed ethnic groups go on to
further study or training, but in other minority groups (and
White) there are higher percentages of female than male.
The FDS has been used here to highlight ethnic differences
because it provides the best source of evidence for our purposes. It
90
Why the Difference?
covers a very high proportion of all undergraduate students
completing full-time study (over 80 per cent) and has a very low
ethnicity non-disclosure (less than five per cent). Thus, it allows
more reliable analysis at a disaggregated level (by individual
ethnic group and other variables), than our follow-up survey of
graduates could do, which is based only on a small sample. Most
sample surveys of graduates provide too little data on minority
ethnic groups to allow any detailed analysis (such as the Moving
On research).1 However, the timing of the FDS is just six months
after most students obtain their qualifications (recording date in
early January), so it is still only a ‘snapshot’ of the initial
employment situation; many do not start looking for employment
until after obtaining their qualification and so take longer than six
months to settle into a career of their choice. Therefore, surveys
that take a longer-term view, like the Moving on studies, are of
more value here. Another drawback to the FDS is that it is limited
in the amount of information it provides about jobs and only
covers graduates from full-time study at HE institutions (though it
is being extended this year to include part-time study). There are
no available statistics on part-time students’ employment
outcomes, but anecdotal evidence suggests that many are likely to
stay working with their existing employers, while some of those
on part-time sub-degree programmes transfer to degree study.
7.4 Factors of influence on degree graduate outcomes
NB The data analysed in this section relate to students obtaining
degree qualifications. (For discussion on students obtaining subdegree qualifications see section 7.5).
It is not possible to make direct comparisons over time for
different minority ethnic groups because of changes to the
ethnicity classifications in 2002, but the overall pattern indicated
above has been around for some time. However, overall graduate
prospects have got slightly worse in the last year or two;
unemployment is on the increase again, and the percentage in
paid UK work has gone down slightly. Also, slightly more degree
graduates are going into study or training this year than last year.
There also appears to have been a change in the ‘worse off’
minority ethnic groups. Previously (ie in late 1990s), the
unemployment rate for the Black African group was higher than
for the Pakistani and Bangladeshi groups, but in 2002, their
positions were reversed. This may be simply due to the
classification change, or due to a real change in their labour
market prospects. If the latter, this may relate to their subject
distribution, for it is noticeable that different subject choices for
1
Why the Difference?
Elias P et al. (1999) Moving on: Graduate Careers Three Years after
Graduation. Higher Education Careers Services Unit.
91
male and female minority ethnic students produce different
employment outcomes, for example:
z unemployment is considerably higher overall (at 14.2 per cent)
for all degree graduates from computer science, followed by
engineering and technology (ten per cent), and lowest
(virtually zero) for medicine/dentistry graduates, and subjects
allied to medicine (two per cent)
z the unemployment figures in every subject are higher for
minority ethnic than White degree graduates, and the gap is
wide both in subjects with high unemployment rates overall eg
engineering and technology (nearly 17 per cent versus eight
per cent), computer science (19 versus 12 per cent), as well as
those with relatively low unemployment rates eg subjects
allied to medicine (five versus two per cent) and law (six
versus three per cent).
Additionally (see Table A11 for unemployment rates for each
subject), the unemployment rates vary considerably between
individual minority ethnic groups by subject.1 Substantially
higher unemployment is found among Black African and Asian
Other graduates who have taken librarian and information science
(which includes media studies). Also, very high unemployment
rates are evident for Pakistani graduates from computer science
and engineering (both 21 per cent); it is even higher for Black
Caribbean engineering graduates (26 per cent), and also high for
Bangladeshi engineering graduates (22 per cent), and Black Other
computer science graduates (23 per cent), but numbers are much
smaller there.
It is possible that these ethnic groups with very high
unemployment rates have been affected disproportionately by
downturns in demand in the sectors which recruit them — the IT,
software and electronics sectors during 2002 is a case in point.
Computer science and engineering are popular subjects with male
Pakistanis in particular (see earlier, Chapter 4).
It is also noticeable that unemployment generally is lower among
graduates with higher classes of degree, and so the lower degree
performance of minority ethnic students (highlighted in the
previous chapter) may be having an important effect on their
labour market success. As shown earlier, all minority ethnic
groups have a lower average class of degree than White
graduates, and Black groups, especially Black Africans, have the
lowest. If outcomes of first or upper second class minority ethnic
graduates are looked at separately, the unemployment rate is
lower than for all graduates, but still twice as high among the
minority ethnic overall, (ten per cent versus five per cent for
1
92
In some cases care needs to be taken with subject comparisons
because numbers are relatively small, and it may be that differences
are an effect of a particular course or locality.
Why the Difference?
White graduates) (see Figure 7.3). Class of degree appears to have
a mitigating effect on most ethnic groups, with the exception of
Bangladeshi and Asian Other groups where it is the other way
round, higher unemployment among those with higher than
lower classes of degrees. Having a higher class of degree is more
beneficial to Black and Pakistani graduates than Indian graduates.
Thus, it would seem that having a higher degree class can reduce
the likelihood of being unemployed at the sixth month stage, but
it makes only a relatively small difference in closing the gap
between the White and minority ethnic groups in aggregate.
There are clearly other factors likely to have an influence on
degree graduate outcomes generally (but which we have not been
able to analyse further in the FDS data for minority ethnic groups
in particular). These are type of institution attended, age, entry
qualification to degree course, entry route and socio-economic
background, which along with subject and class of degree, have
been confirmed by HEFCE in its work on developing Performance
Measures to be associated with employment outcomes. However,
allowing for these effects does not explain fully the difference in
employment outcomes of different ethnic groups of graduates,
and in some cases the underlying differences are greater than
observed when these factors are not taken into account.
Other work, for example by Brennan et al., using an earlier
dataset, the 1995 FDS, to match with other survey data, also found
that education and social background effects played a major role
in explaining ethnic differences in unemployment rates. In that
analysis, White and minority ethnic degree graduates with similar
educational and socio-demographic characteristics were
compared, and the latter were found to be disadvantaged. This
relative disadvantage varied between subjects, other things being
equal, and there were also gender/ethnic differences within
subjects. The Brennan study suggested that other student life
factors can also influence degree graduate outcomes generally (eg
work experience and term-time working, extra-curricular
activities, job search activities). However, they had insufficient
evidence in their data on ethnic minority groups to test how
significant they were for explaining ethnic differences. Recent
research commissioned at a multi-ethnic university, London
Metropolitan, has been exploring likely barriers to taking up work
placements (where optional on courses). Initial findings suggest
take up is low among non-traditional students, but that
experience and skills gained in periods of work experience are
valued generally as an aid to accessing employment on
graduation. Another set of factors relates to the employer
graduate recruitment policies and their selection processes (see
Chapter 8).
Why the Difference?
93
Figure 7.3: Unemployment rates (%) for graduates with 1st or 2.1 degree class, compared with
all graduates (fulltime first degree graduates from English universities, by ethnicity, 2001/02)
16
14
12
10
8
6
4
2
ic
O
th
er
Et
As
O
th
er
in
Ch
hn
ia
es
n
e
i
sh
de
la
ng
Ba
Pa
ki
st
an
i
an
di
In
k
ac
Bl
er
th
k
ac
Bl
Bl
Ca
k
ac
O
Af
ric
be
rib
et
ity
or
in
an
an
ic
hn
te
hi
W
lm
Al
Al
l(
kn
ow
n
et
hn
ic)
0
1+2.1
all
Source: HESA (FDS)
Our follow-up survey of students interviewed earlier during their
studies , though relatively small in size (101, half of which were
from a minority ethnic background), shed some further light on
the varying experiences in finding a suitable job after graduation.1
It also supported points made earlier on job search activities
(relating to final year students). It showed that some minority
ethnic graduates were having more difficulties than others in
finding employment after graduation, but that a range of factors
in addition to ethnicity were likely to be affecting individuals. In
particular, work experience emerged as an important factor in
getting a job after graduation, as did specific skills learned in
higher education, and in both cases especially by Asian rather
than Black graduates. It also supported other (including more
anecdotal) evidence that Asian graduates find it easier on the
whole to find jobs than Black graduates, though less easy than
White graduates (the data are not sufficient to enable a more
detailed breakdown). Minority ethnic graduates were more likely
than White graduates to be unemployed for a longer period
during the first year after completion, and Black graduates more
so than Asian graduates.
Although respondents in our survey with a job at the three
months stage after qualifying were more likely to have been more
active in finding work (eg more likely to take advice from family/
friends, looked at careers information websites, and used their
university careers office), these kinds of activities were more likely
to have been undertaken by White than minority ethnic graduates
who were in work by the three months stage.
1
94
The vast majority of our sample had obtained a degree (88 per cent),
but the 13 students with other qualifications are included in the
‘graduate’ totals in the survey.
Why the Difference?
Many in our survey got some work experience, though not
necessarily relevant work experience, through term-time working.
Half of the students we followed up who had experienced termtime working felt that it had adversely affected their studies, and
Black students were more likely to feel that it had (and they were
more likely to have worked, and worked the longest hours). In
most cases this had a negative impact on exam performance, or
left them feeling lacking in energy. But the majority of those who
had worked during term-time also had felt benefits, in terms of
work experience, and this was more likely among the Black
group. The main benefits were that they had gained interpersonal
skills, self-confidence and specific work experiences.
However, although there were more difficulties overall in finding
jobs, minority ethnic graduates in work were more likely to be
earning more than White graduates one year on; Asian graduates
were more likely than White graduates to be in £15,000 plus
bracket, who were more likely to be in this bracket than Black
graduates (84, 40 and 32 per cent respectively). This is in contrast
to young people generally in the labour market where minority
ethnic groups, especially Pakistani and Bangladeshi, and also
Black groups are worse off economically.1 However, these
findings from our survey on graduate earnings need to be treated
with care as they come from a very small sample, and other
research, though also based on small samples, suggest minority
ethnic graduates are not paid as much as White graduates.
Earnings between ethnic graduate groups are difficult to compare
for a number of reasons, but especially because of their
concentrations in London where pay rates can differ from the rest
of the country.
We do not have a satisfactory explanation from the survey data as
to why the minority ethnic graduates were more likely to
experience initial difficulties in the labour market and longer
unemployment but, one year on, they were more likely to be in
jobs with higher salaries. It may be simply a function of the
sample composition (ie it was not a representative sample). But as
shown below (section 7.6) the FDS data also shows that for those
who enter paid work, more minority ethnic than White graduates
are in the highest level jobs (professional/managerial groups),
though there is no salary data available from this source. It could
be a feature of them taking longer to make successful transitions
and waiting longer to secure a better job, or more a feature of their
different subject distributions (eg more in high paying jobs as
doctors, IT, financial services jobs), or simply because there are a
lot more in the London area, whereas earnings on average are
higher.
On the whole, the graduates we surveyed were not seriously in
debt; only around a third said they were very overdrawn/in debt,
1
Why the Difference?
See Berthoud (1999).
95
with most of the rest slightly or rarely in debt, and a quarter not in
debt at all. Asians were less likely to have debt, and Black
graduates almost equally likely as White graduates. However, the
small size of the sample, means that these findings are indicative
only, and care needs to be taken in drawing firm conclusions from
this data. Some of the points though were also echoed in the
interviews, where most had found the job market more
competitive than they had expected, and were generally
disappointed with their experiences. For example:
‘There are too few vacancies for graduates of my calibre and far too
many graduates trying to fill them … employers think they can offer
less ’package’ simply because of the greater supply of graduates in the
last few years, and they get away with it …’. (Indian female, 2.1
maths and statistics degree, 2003 graduate)
‘Early days … keen to hold out for ‘right’ job but do not want to place
too much of a financial burden on my parents … most engineering
firms want graduates with some relevant experience.’ (Asian British
male, 2.2 MEng, 2003 graduate)
Others felt that employers were not fully aware of the variations
in degree content and capability of graduates. Negative comment
about selection tests, and the time needed to prepare for them
came up (see more discussion on the selection practices of
employers in next chapter). Few felt they had been discriminated
against because of their race or ethnic group, it was more that they
felt they had not been selected because of employers’ lack of
understanding of the different degree courses and qualifications
for entry to university (not ‘A’ levels), or due to some problems in
the selection method (eg specific written tests).
From the evidence presented, both from our survey and other
research, it is clearly not possible to assess the relative importance
of all the various factors compared to any direct effects associated
with their ethnicity. It is likely to be a complex interaction
between the known variables of influence, relating to student
characteristics, degree choices etc. (shown by the HEFCE analysis)
and job search attitude and experiences, and also external
environmental factors (in particular employer attitudes). This
would require a much bigger set of data than we had to unravel
here. It is unlikely that this can be achieved only from further
analysis of the FDS, but in combination with other work. More indepth focus on particular groups and various sub-sets of them,
would be useful to resolve some specific queries in the evidence
we have shown. For example, why do the Chinese groups, who
seem to do best of all in degree performance, do much less well in
the labour market?
7.5 HND and DipHE qualifiers
It is important to look if possible at destinations of degree
graduates separately from those of sub-degree qualifiers (ie HND
96
Why the Difference?
and DipHE holders) because their initial destinations patterns are
very different. For some on sub-degrees, it is a training route into
a particular career (eg nursing). For others it can be a stepping
stone to taking a degree (eg business studies, IT). Overall, just over
one-third (36 per cent) of the 2002 HND/DipHE qualifiers from
HE Institutions (with a known destination) went on to further
study or training, but this was much higher for minority ethnic
students (50 per cent), and highest of all for Indians (70 per cent).
By contrast, only a quarter of Black Africans went on to further
study, being much more likely than others to enter UK paid work.
The destination pattern of sub-degree qualifiers is more strongly
subject driven than for degree graduates. One illustration of this is
the high proportion of Black Africans in DipHE study, many on
nursing diplomas going straight into nursing jobs on completion;
another is the higher likelihood of Asians than other minority
ethnic groups taking HNDs in business, IT or other subjects where
the dominant pattern is to progress on to a degree course. Further
details of the destinations pattern of sub-degree qualifiers are
shown in Appendix Table A12.
7.6 Initial jobs of degree graduates
Because of general high demand for graduates these days, it is
relatively easy for most graduates to get a job, as seen by the
relatively low unemployment rates in general, though as we have
seen, this does not apply to some minority ethnic groups as a
whole. For many graduates their initial jobs are of a temporary
nature (some in jobs where their degree is not particularly
relevant) to help get some immediate income to live reasonably
well or pay off debts, or to get some work experience. So it is the
nature of the actual job and the suitability or appropriateness of
the work which is a key issue. The notion of employment success
for graduates today can be complex, bringing in aspects of:
z job level (is it a graduate job?)
z salary (is it a well-paid job?)
z satisfaction and expectations (is it what they were seeking?)
z and development and career prospects (where is it leading?).
Also, there are many different types of early career paths taken by
graduates, as research surveys of graduates’ early career progress
have shown,1 with some graduates spending time in postgraduate
study first, while others take a series of short-term fill-in jobs or
time off to travel, taking a longer time to make the transition from
HE and settle into the labour market. Employers recruit graduates
today for different purposes, and only a proportion of the total
1
Why the Difference?
See Connor and Pollard (1996); Purcell et al. (1999); Elias et al. (1999).
97
output are recruited straight away into graduate entry jobs or
graduate development programmes.
7.6.1 Types of employment
The FDS, which is the best source of data on current graduate
outcomes, shows that:
z The vast majority of degree graduates go into full-time rather
than part-time jobs, but minority ethnic graduates in aggregate
are slightly more likely to take part-time jobs than White
graduates, (13 per cent versus nine per cent of 2001/02
output). However, part-time work is a more likely outcome for
employed Black Caribbean and Bangladeshi graduates (18 and
22 per cent), and more likely among women. This may relate
to higher early childbirth among these groups, though this
would also apply to Pakistani young women. Finding suitable
childcare may be a restricting factor on taking full-time work.
z Slightly more minority ethnic (46 per cent) than White
graduates (just under 43 per cent) who enter employment take
up professional or managerial jobs (ie in either SOC I and II).
Highest percentages of all in higher level occupations are
Pakistani graduates (50 per cent) and Asian Other (52 per
cent), while lowest are Black Caribbean and Black Other (both
39 per cent). The Brennan et al. study, cited earlier, using
‘graduate’ versus non-graduate’ job categories, also found that
minority ethnic graduates were more likely to be in better jobs,
and these differences were shown to be significant, when
other differences (by age, subjects etc.) could be taken account
of in the analysis.
z But, going back to the FDS, if the top three SOC groups are
taken together (ie including Group III, Associate Professional
jobs also), little difference between White and minority ethnic
graduates overall can be seen (both around 65 per cent in SOC
I to III). However, Indians, Asian Other and Chinese are more
likely to be in the top three SOC groups, and Bangladeshi
graduates the least likely (Figure 7.4).
z Then looking at sector of job, again there is considerable
variation. Minority ethnic graduates are less likely than White
graduates to be employed in the manufacturing and other
industrial, education, or community, social and personal
services sectors, but more likely to be in the financial,
retail/wholesale trade and health and social work sectors (see
Figure 7.5). Asians, and especially Indians, are more likely to
be employed in the financial sector than Black groups. Black
groups are more likely to be in public admin sectors than
Indian or Chinese groups, but are similar in this respect to
Bangladeshis.
98
Why the Difference?
Figure 7.4: Level of job: percentage of first degree graduates from English universities going
into each occupational grouping (SOC), by ethnicity, 2001/02
White
Black Caribbean
Black African
Black other
Indian
Pakistani
Bangladeshi
Chinese
Asian other
Other
All minority ethnic
Total known
0%
10%
20%
30%
40%
SOC I+II
50%
60%
SOC III
70%
80%
90%
100%
other SOCs
Source: FDS/HESA, 2002
Figure 7.5: Sector of employment: distribution of minority ethnic and White graduates
between sectors, (first degree graduates from English universities), 2001/02
25%
20%
15%
10%
5%
White
Other
Hotels & Restaurants
Wholesale & Retail Trade
Other Community, Social &
Personal Service Activities
Health & Social Work
Education
Public Admin & Defence
Property Devt, Renting, Business
& Research Activities
Financial Activities
Transport, Storage &
Communication
Other industrial
Manufacturing
0%
Minority ethnic graduates 2000/01
Source: FDS/HESA
Why the Difference?
99
7.6.2 Satisfaction with job
The small graduate follow-up survey and interviews with
individuals gives some insights into job satisfaction one year on,
but did not provide any clear patterns by ethnicity. Overall, just
over two-thirds were very or fairly satisfied with their present job,
and the differences between the minority ethnic groups were
fairly small ones. Those not satisfied tended to feel they were not
using their skills or qualifications sufficiently:
‘Very bad pay, its not my field, my qualifications are wasted.’ Black
female, aged 28, 3rd class degree, biological sciences, from a
post-92 university
‘Everything (dissatisfied with) ... its not the job I wanted, I had no
choice, I need money to pay rent.’ Black male, aged 24, with a 2:2
degree in Law, from a post-92 university
A range of views was expressed as to whether or not they felt
their role was appropriate for their qualifications. Black graduates
were slightly more likely to think so (61 per cent) than others (53
per cent); but this also varied considerably according to other
factors — gender, type of institution, age in particular.
When asked how confident they were about their career to date,
around one-third felt very confident, and half fairly confident. But
Black graduates were more confident than Asian or White
graduates, even although they appeared to be faring worse than
other ethnic groups (in terms of unemployment, levels of job and
earnings), though as noted above were more likely to feel they
were in jobs appropriate to their qualifications/skills.
Little difference was apparent by ethnic group as to how the
current activity of graduates we followed up after one year,
matched their expectations; more differences were apparent
between men and women, and between graduates with different
entry qualifications than by ethnicity. When asked what they were
doing compared to what they had expected by this stage, 39 per
cent were in a job unrelated to their undergraduate course, 23 per
cent expected to be in a better job or better paid, and 11 per cent
expected to be studying. It was noticeable that minority ethnic
graduates were more likely to say they expected be in a better job,
but otherwise no other differences were evident by ethnicity.
Suggestions on what advice or information about graduate
employment or careers would have been useful during their
studies was mainly specific kinds of information — about
companies (Black graduates more than others) and about jobs that
they could apply to that related to their course (White graduates
more than others). Some of our interviewees also mentioned
extra-curricular activities as being important in giving an
advantage (students should be told that academic activities are
not enough), the need to develop more self-awareness, and
knowing the ‘rules of the game’.
100
Why the Difference?
7.7 Opting for further study
As highlighted above, minority ethnic degree graduates are more
likely to take further study or training, and some minority ethnic
male and female groups more likely than others. The pattern of
further study seems to be a continuation of the ‘drive for
qualification’ highlighted earlier. The further study or training
category comprises a range of postgraduate courses and
programmes:
z Overall, the most commonly taken postgraduate qualification
is taught higher degrees, ie mainly masters programmes and
various diplomas and certificates, including PGCE and
professional training (taken by 37 and 41 per cent
respectively). Much smaller numbers go on to higher degrees
by research, or take another first degree, or do private study or
training.
z Differences in choice of further study are evident between
males and females, with a higher proportion of men than
women (42 compared with 33 per cent) taking taught higher
degrees, and the reverse for other diplomas or certificates (29
per cent of men versus 49 per cent of women). This reflects
general differences in careers of men and women, and also
subject differences, eg there is a higher proportion of women
in PGCE, social work training etc.
Minority ethnic students are more likely to be taking taught
higher degrees than other kinds of postgraduate study. In
numerical terms, they represent almost one-quarter of all degree
Table 7.2: Types of further study or training undertaken by first degree full-time graduates
(2001/02 from English HEIs (percentages in each ethnic group), 2001/02
Higher degree
— taught
Diploma, certificate
(inc PGCE) or
prof training
Higher
degree
— research
Other
(inc first
degree)
Number
White
35.2
42.6
13.6
8.6
20,543
All Minority ethnic
46.9
34.2
6.6
12.1
4,437
Black Caribbean/
Black Other
40.2
43.7
5.6
10.4
288
Black African
50.7
30.5
4.5
14.2
422
Indian
48.2
33.9
5.4
12.5
1,522
Pakistani/Bangladeshi
42.0
38.9
6.7
12.3
852
Chinese
57.8
24.2
8.0
9.8
396
Asian Other
43.6
35.1
9.2
12.1
390
Other/mixed
46.4
32.3
9.0
12.3
567
All (known)
37.3
41.1
12.4
9.2
24,980
Note: some groups have had to be combined because of small numbers
Source: HESA/FDS, 2003
Why the Difference?
101
graduates opting to take these courses in any one year. They are
also more likely to take another first degree or private study than
White graduates (but here the total numbers are very small).
A smaller proportion of those going on to other postgraduate
diplomas or certificate courses (including PGCE) are from
minority ethnic backgrounds (15 per cent) and an even smaller
proportion are among those on research higher degrees (just
under ten per cent). The small proportion of minority ethnic
graduates going on to take research higher degrees at this stage is
a concern because it means a small pool from which to recruit
future HE staff.
The FDS data do not distinguish separately those going on to
PGCE from other postgraduate diploma courses. But it is likely to
be a small proportion, as figures from the Teacher Training
Agency (TTA) show that only eight per cent of teacher trainees
recruited in primary and secondary work were from a minority
ethnic background in 2001/02. This figure has been gradually
increasing, and the TTA has various initiatives to encourage
growth so as to increase the ethnic diversity in the teaching
workforce.
z Black African and Chinese degree graduates who go on to
further study or training are the most likely to be taking
taught higher degree courses (over 50 per cent of them do).
Black Caribbean/Black Other groups are the most likely to
take a diploma, certificate or professional training course (44
per cent).
z All of the minority ethnic groups, except Chinese, are more
likely than White graduates to take another first degree. The
most likely of which are Black Caribbean/Black Other and
Pakistani (each eight per cent), though, as said above, actual
numbers doing so are comparatively small.
Gender differences commented on previously are seen here also.
There are higher proportions of male than female graduates
overall taking taught higher degrees and this is also time for most
minority ethnic groups: the highest are male Black Africans and
male Indians (each 56 per cent), but this drops to 35 per cent of
female Pakistani/Bangladeshi (and 31 per cent of female White)
graduates taking further study or training. Conversely, there are
much higher percentages of these two latter groups taking
diploma, certificate or professional training courses (over 50 per
cent), and much lower percentages of male Black African and
most of the male Asian groups (around 23-27 per cent), see
Appendix Table A13.
It is noticeable that research higher degrees are generally less
popular with both male and female minority ethnic than White
graduates, but they are much more popular with Black Caribbean/
Black other males than females (14 versus three per cent).
102
Why the Difference?
7.8 Summary
Minority ethnic young people are well-represented in higher
education in England, relative to their share of the population,
and are more motivated to go to higher education for reasons
associated with improving their career/employment prospects
(see earlier chapters). However, they appear, on the face of it, to
have worse initial labour market outcomes than White degree
graduates overall. The extent of disadvantage varies between
minority ethnic groups, and also by gender, subject, class of
degree and other variables within groups.
It is evident though that some of the pattern of labour market
disadvantage, seen generally in the minority ethnic working
population, is also reflected here. Those groups with the higher
unemployment in the working population (Pakistani, Bangladeshi
and Black men and women) are mostly the same groups with the
higher graduate initial unemployment figures (ie at the six month
stage, Pakistani, Black African and Bangladeshi). However, there
are also differences, eg the Black Caribbean group has one of the
lowest initial graduate unemployment rate of all the minority
ethnic groups, though it is still higher than that of the White
group. This needs to be set against evidence in much of this report
which shows that Black Caribbean students are doing less well
than others in gaining access to HE at a young age and in their
degree performance, and also are likely to face more difficulties in
their studies (though this applies more to older ones). It also
contrasts with the Indian and Chinese groups, which are more
likely to enter HE with higher qualifications, but do not appear to
be doing as well as might be expected in employment outcomes.
Another important feature of the graduate outcome pattern by
ethnic group is that more minority ethnic than White degree
graduates go on to further training or study both from degree and
sub-degree; and it is the Chinese, and also most of the other Asian
groups, who are more likely to do so than the Black groups. In
particular, they are more likely to seek further academic
qualifications rather than professional/vocational qualifications or
training (which are more popular than the Black Caribbean and
Black Other graduates who continue in study following degree
study). This would seem to be a continuation of a drive to gain
(even) higher qualifications, associated more with Asian groups at
an earlier age, something we have commented on in earlier
chapters. It would be useful to find out more about why some
minority ethnic students are more likely to want to take higher
qualifications than others.
It is also noticeable that the ability to secure paid employment
varies considerably between minority ethnic groups by gender
and by subject in particular. The ‘quality’ of the jobs taken by
graduates in different ethnic groups also varies. Overall, minority
ethnic graduates appear to get ‘better’ jobs on average than White
Why the Difference?
103
graduates. This may be mainly subject-driven (ie the
concentrations in medicine, law, IT and business studies) or reflect
different attitudes to getting what constitutes a ‘good’ job. Also,
the job-seeking approaches taken at university vary between
individuals, and some groups are likely to start much earlier,
possibly because they expect to face more difficulties or have
clearer career aims at an earlier stage. This is also an area which
needs further exploration.
A number of evidence sources have been used here to try to
explore how much of the differences in graduate outcomes
between minority ethnic and White graduates is due to ethnicity
and how much to other factors. But the sheer diversity of the
graduate population (and the minority ethnic graduate groups),
and the number of likely intervening factors and variables makes
that task very difficult. Clearly, some of the explanation for the
poorer graduate outcomes lies in the differences in gender, age
and socio-economic profiles, entry routes and entry qualifications,
subjects chosen and institutions attended, and also degree
outcomes, between ethnic groups. Furthermore, these variables
can have different effects on different groups. Other explanations
lie in attitudes to finding employment and career expectations, the
extent to which they have some work experience, and also
employer behaviour. The main conclusion that we can draw is
that ethnicity is almost certainly making a contribution to the
relative labour market disadvantage some individuals experience,
but the causes are more complex than ethnicity alone. It is the way
the various factors interact with ethnicity that are of interest
(which has been shown in earlier chapters to vary between ethnic
groups), and can create distinct patterns of greater disadvantage
for certain groups of students in their transitions to the labour
market. It is a combination of a number of indirect effects, rather
that direct ethnic effects that have the greater significance, though
in different ways for different ethnic groups.
The balance of opinion among staff in HE involved with graduate
employment and careers is that students from ethnic minority
backgrounds face greater problems in the graduate marketplace in
securing their careers of choice. This is the basis for positive action
work in universities, and for employers to help give students and
graduates better skills and work experiences. However as far as
we can ascertain, little systematic evaluation has taken place of
these initiatives. We recommend that this is done, and also that
other employability measures in HE are given an ethnic
dimension in their evaluations.
In the next chapter, we look at the graduate recruitment market
from the employer perspective and the contribution which
employer policies and practices make to the difficulties which
minority ethnic graduates face; and also where they are helping to
overcome these.
104
Why the Difference?
8. Employer Perspective
In this final chapter on the research findings, we provide an
employer perspective on minority ethnic graduate recruitment.
Up to now, we have been mainly concerned with graduates’
attainment (and prior attainment), choices of HE study, their
views, and behaviour as factors effecting their outcomes. But this
is only one side of the equation. We also need to see what factors
in employer demand and their graduate recruitment strategies can
affect the outcomes of minority ethnic graduates. The chapter
draws off a number of sources:
z case study interviews with 20 employers (mainly large ones
with graduate recruitment programmes)
z careers advisers and various other people and organisations
involved with positive action programmes in HE
z in addition to other relevant research studies.
8.1 Context
8.1.1 Graduate marketplace
There are several general trends and issues in graduate demand,
and the graduate marketplace, which have an effect on minority
ethnic graduate recruitment, and provide a context.
Although subject to some fluctuations, the graduate marketplace
has remained fairly steady in the last few years. There is no major
graduate shortage problem at present in the UK, except possibly
in some specialist IT or engineering areas. However, competition
for graduate recruits continues to be high, especially at the top
end (‘high potential’) or in very specialist areas. As a consequence,
many employers invest heavily in graduate recruitment — in
marketing and selling their ‘brand’ to universities and students to
encourage more applications of the kind they want; and in their
selection processes, which can be fairly extensive in many of the
large organisations. One of the main concerns expressed by
employers today is about the variable quality of applicants they
see, especially their lack of preparedness for the workplace and of
relevant skills. This variable quality is frequently put down to the
Why the Difference?
105
expanded graduate supply and growth of new courses at
universities.
Demand for graduates has broadened, to include a wider range of
jobs and types of employers than in the past, and also more
multiple entry routes into companies for graduate recruits. This,
together with the more diverse HE sector and graduate supply,
has led to a more segmented graduate marketplace. Many
employers focus their recruitment activities more on certain kinds
of graduates, and certain types of universities, often for fairly
pragmatic reasons (eg as a way of coping with the vastly
expanded supply and high volume of applications). Not all
graduates therefore have equal access to all of the graduate jobs
available, nor as much opportunity to make direct contact with
graduate recruiters. Targeting is commonplace in most graduate
strategies, especially by large national private sector recruiters.
The main focus of targeting is on pre-92 universities, and young
graduates with traditional entry qualifications (18 plus or even 24
plus ‘A’ level points). One consequence is a tendency for many
organisations to be ‘fishing in the same pool’ (all seeking the more
traditional type of student from similar backgrounds with similar
personality/skill specs), thus giving an impression of high
competition from the major large employers in certain
universities, and their virtual absence in others. The latter are
frequently the new (post-92 group of) universities and colleges. As
highlighted in earlier chapters of this report, these have higher
representations of non-traditional students, including minority
ethnic groups.
The greatly increased use of the Internet and IT in the graduate
recruitment process — in employer marketing, information about
jobs, applying online, in selection, etc. — is a significant recent
change in graduate recruitment methods. The vast majority of
recruiters are using the Internet to post vacancies, taking
applications online from graduates and increasingly undertaking
initial selection also. It has potential to mitigate effects of
institutional targeting (which can disadvantage minority ethnic
and other groups who are not well-represented at many of the
targeted universities), through improving student access to
information about jobs and potential employers. It can also help
put more realism into the employment proposition, and can speed
up the selection process, (via online testing and other automatic
‘filtering’ of applications). However, the full implications of erecruitment have yet to be worked through.
Another area of change is the increased interest in international
recruitment, with employers seeking applicants from overseas, or
looking for graduates with international experience. This is
another area where the greater use of the Internet has had an
impact, by increasing applications to UK employers from foreign
students. It is not clear whether employers are seeking
international students because of shortage problems at home, or
106
Why the Difference?
because they want some specific international experience (can be a
bit of both).
8.1.2
Diversity in graduate recruitment
A second area of context for our research is the greater importance
given to diversity and equality agenda in the workplace. A greater
commitment to ethnic diversity in the workplace has filtered
through into graduate recruitment in many organisations, though
mainly the larger private and public sector ones, and its
significance in practice varies also. Ethnic diversity in the
workplace is being driven by a combination of factors: economic
and social change, legislation on race relations, and a greater
awareness of the business case — ie the benefits from accessing
the widest pool of talent available, or the need to serve an
increasingly diverse customer base (eg in retail, banking, health
services).
We found that graduate recruiters can have mixed feelings about
how much diversity can be achieved in graduate intakes. On the
one hand, they all want to be seen to be fair, and give access to
everyone with the right abilities and skills. In several places we
found a strong commitment from the senior management team to
support ethnic diversity initiatives in HE (eg internship schemes,
diversity mentoring, careers workshops). These initiatives help
improve ethnic representation in their graduate intakes, and thus
help change the ethnic profile of senior management, or specific
functions. On the other hand, the need to match graduates to
particular skills/person needs of jobs, means that it is more likely
that traditional types of graduates (eg young, with high ‘A’ levels,
middle class) continue to be recruited, often because it is easier to
achieve within limited recruitment budgets, and also when there
are pressures to achieve annual intake targets. Also, the central
graduate recruitment person, with more commitment to achieving
ethnic diversity, may have limited influence over local business
managers where graduate recruitment is a very decentralised
function. Various examples were given by our interviewees on
how their workplace diversity policies interacted with their
graduate recruitment policies, in particular the importance of
involving senior and middle management, for example:
z in one organisation, a large transport group, the support from
the top — ie a ‘champion’ — was important in making cultural
change; but a change at the top had meant a shift in business
priorities, leading them to place less emphasis on diversity in
their graduate recruitment strategy
z in another, a financial services organisation, a lack of role
models and ‘invisibility’ of minority ethnic groups, especially
Black people, at senior levels had been identified by the
graduate recruiter herself as she moved up the management
ladder.
Why the Difference?
107
A recent BIC survey was generally positive about progress in
ethnic diversity in UK businesses, but also reported much room
for improvement ‘… especially across middle management strata,
in getting ownership of the issues’. The lack of progress, especially
in getting strategies in place to tackle ethnic issues in the
workplace, was also commented on in a recent report by the
Industrial Society.1
Most large employing organisations in the private sectors, and all
public sector bodies (are now required to), have a diversity policy
or action plan of some kind, which includes ethnic diversity. In
practical terms, this has led to diversity units being set up at a
corporate level, or the appointment of a diversity manager in
many instances. We found various ways in which these
units/people impacted on graduate recruitment. For example, in
one large public sector organisation, the effect of some high
profile tribunal cases (when the Campaign for Racial Equality
[CRE] had been involved) had brought a dramatic cultural shift
with the setting up of a new diversity unit. This had led to:
z increased activity in schools and universities that had high
proportions of minority ethnic students
z such universities being targeted in marketing and publicity
z all staff involved in graduate interviewing receiving diversity
training
z and specific ethnic graduate recruitment targets set and being
met.
But in some others, we found relatively little contact between
graduate recruitment managers and specialist ‘diversity’ or
diversity managers. The latter having just a passive role, to be
consulted if felt needed, eg on publicity or advice about their
graduate monitoring statistics.
Organisations with more minimal approaches to ethnic diversity
included most of the recruiters of technical graduates that we
interviewed. Here, ethnic diversity often had a lower priority
because their main interest was tackling specific skill shortages. In
several, there was also a more pressing need to increase the
proportion of female graduates (which was very low) than ethnic
minorities. For example, in one large IT company, gender had
been monitored for several years but not yet ethnicity, as it was
more difficult to ‘make the business case’:
‘Women make up 50 per cent of our market, so easy to convince Chief
Exec. ... don’t have same info. on buying power for ethnic minorities ...’
1
108
As cited in Kandola (2002).
Why the Difference?
While in another:
‘ … ethnic diversity is a cause of concern, we are being asked by clients
in public and private sectors what our ethnic profile in the workforce is,
and we do no monitoring as yet ... when push comes to shove they just
want the work done … little impetus to do anything … have few
tribunals which are race related … most of our ethnic employees are
2nd or 3rd generation and so there is little difference from you and me.’
One organisation which admitted to us that it did not have a
corporate diversity policy, a young international telecomms
business, cited the reason as:
‘It goes against the cultural norms of the company to set targets for
White and non-White, women, disabled etc. — emphasis is on
competencies to do the job … we have a culture of equality here (jobs
open to all who apply, once in and through the graduate scheme, don’t
even know who has a degree)’.
but also added later in the interview that they had very few nonWhite graduates applying (mainly looking for engineers and
expected to find few there).
Many of our interviewees had introduced diversity policies only
recently, often to replace an older equal opportunity (EO) policy.
This shift represented a move away from an approach driven by
legislation, to one which incorporates the business case and
corporate social responsibility. Growth of global businesses, and
cultural alignments of UK organisations with organisations in
other countries (including mergers with US businesses), has
increased the internationalisation of organisations’ workforces,
including their multi-ethnic mix, which is also acting as a
stimulus.
8.2 Under-representation of minority ethnic graduate
recruits
Despite this increased attention being given to diversity in the
workplace, and the more diverse and broader graduate labour
market, the extent to which organisations are actually recruiting a
more ethnically diverse graduate workforce varies significantly.
This was evident in our case study interviews, which tended to be
with more progressive employers.1 All had recruited graduates
recently, mostly through corporate graduate schemes, and most
had systems in place for collecting information about ethnicity in
the recruitment process. Although they also recruited graduates
outside of this, to other jobs in their organisation, this was done at
a local level and little information was kept corporately on the
ethnic make-up of this wider graduate intake. The statistics we
1
Why the Difference?
We attempted to recruit a broader sample of employers but most of
those contacted preferred not to take part in the interviews.
109
obtained from them, therefore, referred only to graduate intakes
for designated graduate entry jobs or schemes. They varied from
management trainee programmes through to technical/
engineering jobs. Some had set targets for the proportion of
minority ethnic groups they wanted in applications and
acceptances, and were satisfied that they were making steady
improvements year on year. Others had fluctuating annual trends,
often due to consistency or reliability problems with monitoring
caused by, eg image problems in the marketplace, problems with
their graduate website, or business re-organisation/merger. Yet
others had hardly seen much change at all in their proportion of
minority ethnic graduate recruits. Only one actually showed a
decline, but it recruited very large numbers (into pharmacy) so
was not typical, and had been affected by market competition.
The monitoring statistics employers shared with us (some were
not prepared to do so for confidentiality reasons) varied in format
and detail. However, we have been able to put some of them (nine
organisations) into a comparative format for the most recent year
(mostly 2002). These give an indication of how minority ethnic
representation varies through the stages of the recruitment
process, (see Table 8.1). It shows wide variations in minority
ethnic graduate recruitment intakes by organisations, from zero to
over 50 per cent of the total, with most in the five to 20 per cent
range, and generally declining proportions of minority ethnic
candidates getting through each successive stage.
Most organisations we interviewed received large numbers of
applications, including large numbers from minority ethnic
groups, and were not too concerned about the volume of
applications from minority ethnic students in aggregate, either
absolutely or as a proportion of the total; though they would be
happy to see more, especially of some groups (eg Black graduates,
see below). As can be seen above, some dealt with very large
numbers — for example, a financial services group attracted
17,000 applications, of which around 34 per cent, that is over
5,000, came from graduates from minority ethnic backgrounds
(this actually represents about one in six of the total minority
ethnic graduate supply from English universities in one year).
Another example is from a public sector organisation with 25,000
applications in total to two schemes, included around 4,000
graduates from minority ethnic backgrounds (16 per cent). Most
of the minority ethnic percentage figures, in the ‘applying’ column
in Table 8.1, are above the average for minority ethnic
representation in graduate output at English HEIs (around 15 per
cent). The highest we came across were in subject areas of
relatively high minority ethnic participation or career interest (eg
accountancy, pharmacy, IT). However, including overseas
students in their monitoring figures, which we found most
organisations did, may be inflating the numbers (and so may
make the application figures from UK domiciled graduates look
110
Why the Difference?
Table 8.1: Company graduate recruitment profiles and minority ethnic graduate ‘success’
rates (mostly for 2002 graduate entry)
All
Business
activity
A. Financial
Type of
graduates/
intake
Varied: retail,
IT, marketing
B. Public sector Business
No. of
vacancies
50 c.
10
Minority ethnic graduates
No.
applying
% of all
applicants
who are
successful
3,500
1.4
180
% in total
interviewed*
% in total
job offers/
recruited
15
n/a
8
5.5
7
7.5
20
% in total
applications
C. Business
consultancy
Varied (mainly
numerate)
300 c.
5,000
6.0
27
26
17
D. Legal
services
Lawyers
100
2,000
5.0
n/a
n/a
24
E. Healthcare
Pharmacy
330
1,100
45
n/a
55
F. Financial
Varied: retail
banking, IT,
operations
200
17,000
1.2
33
34
n/a
15
G. IT/comms
Electronic/
electrical
engineers (I)
Electronic/
electrical
engineers (II)
6
600
1.0
55
40
20
3
160
1.9
63
54
0
H. Transport
Management
scheme
20
1,500
1.3
35
31
6
I. Public sector
General (I)
General (II)
500
250
14,000
11,000
2.9
2.3
17
15.7
n/a
n/a
10
7.4
* where application got through to at least 1st interview
Source: IES (Employer organisations records)
better than they actually are).1 Though some could at least
separate out the numbers of applicants from UK universities from
those from overseas universities, none were able to accurately
assess how many from UK universities were UK domiciled
students only (as in HESA statistics). It is very likely that some
were not (certainly many did not have UK employment
rights/work permits, see section 8.3).
More concern was expressed by our interviewees about
converting applications to job offers, as the general downward
trend of the monitoring data in Table 8.1 illustrates. In some cases,
the proportion of minority ethnic applicants getting through each
stage declines markedly. The exception, a public sector
organisation (C in the figure) has a very small intake and the 20
per cent shown represents just two minority ethnic graduates; the
other exception (Organisation E) has a very large intake, and a
very well known profile among the minority ethnic (and
predominantly Indian) community.
1
Why the Difference?
This is most likely to be the reason for the high figure in Organisation
G in the table for electrical engineering applicants, 63 per cent, as it is
a well-known international group.
111
It is also important to note, as outlined at the beginning of the
chapter, that there is high competition for many graduate jobs on
offer and this was also the case in many of these organisations.
But it was not those with the highest competition (ie lowest
percentage of successful applications overall) that had necessarily
lower minority ethnic recruitment, or vice versa. The three
organisations where competition was highest (where only around
one per cent of applicants overall got through to taking up a job)
had an overall minority ethnic percentage intake of 15 per cent in
one financial services organisation, six per cent in another
financial services organisation, and six per cent in a third (a
transport organisation’s management scheme). But the one where
competition seemed lowest actually had the highest minority
ethnic recruitment. In this case, the organisation targets its
marketing on a number of Schools of Pharmacy, and only expects
those qualified to apply to do so (also it is an area suffering
generally from shortages worldwide).
Only a small minority of organisations monitor ethnicity in any
more detail (ie by individual groups) in their graduate recruitment
statistics. In some though, the numbers recruited would be too
small to make much sense of such disaggregation. Among the
larger ones we interviewed, where useful comparisons could be
made between minority groups, the main features were:
z Asian groups, especially Indians, were usually the dominant
groups in minority ethnic intakes (and also confirmed in
perceptions of those who did not have the data).
z Black groups were less well-represented than Asian groups,
especially Indians and Chinese at each stage.
z The numbers of some Black groups, especially Black
Caribbeans, applying was very small in some (eg in one, the
pharmacy scheme above (E), there were just three Black
Caribbean applicants among 1,100 in total, and in another, the
large business consultancy, just 38 out of 4,000).
z Indians and Chinese were more likely to outperform the other
minority groups in getting through each of the various stages
of selection (eg application form accepted, online test, first
interview, assessment centre).
8.3 Factors affecting under-representation
Overt racial discrimination in graduate recruitment is very
unlikely to exist nowadays, mainly due to legislation and equal
opportunities policies of employers. But, as highlighted in the
recent Cabinet Office report (2002), problems of indirect
discrimination are likely to remain, particularly in organisations
which have not developed EO policies or professional approaches
to HR management. These are likely to include what seems to be
‘race-neutral’ or colour blind approaches.
112
Why the Difference?
These were seen in a number of different ways, in prerecruitment, application processing, and selection activities.
Setting targets/priorities
All of our interviewees had relatively sophisticated human
resource (HR) policies, which included EO, but we did find some
examples where no special provision to recruit minority ethnic
graduates was evident. These tended to have low minority ethnic
representation in graduate intakes (though often no statistical
monitoring took place, so hard to be sure). For example, one (a
telecom group), felt that setting targets for particular groups went
against the culture of the organisation; while another, a large IT
company, did not feel a need to offer anything special for minority
ethnic groups within its diversity strategy (which covers age,
gender, work-life balance and sexuality as well as ethnicity); and
in a third an electronics group with a very decentralised
organisational structure where EO policies had been in place for
some time, there was no ‘power’ at the centre to push ethnic
diversity issues out to the businesses and so encourage recruiters
to place greater priority on them.
University targeting
A cause of possible disadvantage is from the policies of mainly
large employers which focus marketing and other recruitment
activities on certain universities, frequently those where minority
ethnic groups are less well-represented (ie red-brick traditional
universities and Oxbridge in particular).1 We did find that these
types of universities were the ones mainly found on ‘target’ lists
of the employers we interviewed, and relatively few post-92
universities and colleges featured (where much larger numbers of
minority ethnic graduates are found). Careers advisers also
confirmed this practice, generally among large corporate
recruiters. It is done usually because employers perceive there to
be a higher ‘quality’ of students at certain types of universities.
Focusing activities on a select number of universities has become a
necessary practice in graduate recruitment given the sheer size
and diversity of the HE system nowadays, and limitations on
recruitment budgets.
A few organisations we visited felt that too much targeting of
certain institutions might work against their diversity policies,
and had ensured that their activities with universities included
links with a larger number/wider group, including some post-92
universities. Some companies which did target a select few in
1
Why the Difference?
See Chapter 4, also especially section 4.4.3 which discusses admissions
bias against some minority ethnic groups at some pre-92 universities
(Shiner and Modood, 2002) as a factor in under-representation at
some of these universities.
113
marketing/publicity said they gave no preferential treatment to
applicants from them (because to do so would give bias against
minority ethnic groups). However, a large City law firm recruited
graduates almost exclusively from a small number of leading law
schools, all in the pre-92 university group. Only a few
organisations chose not to target at all, mainly because they were
seeking a broad-based intake (and were prepared to handle the
large number of applications which no-targeting produces). One
of them stressed their ‘culture of equality’, which targeting would
go against. Generally, public sector organisations did not target
universities as much, some not at all.
We found one large, private sector organisation, with a very
committed ethnic diversity employment policy, using targeting in a
different and more sophisticated, positive way, to help increase the
number of applications from certain minority groups. Information
about minority ethnic representation at universities was used to
set diversity targets for each university being targeted, which then
helped decide which kinds of activities would take place at each
(eg sponsoring societies), according to the target set. However, this
tended to be an exception to general practice.
Many organisations are very concerned about distinguishing
themselves to students in the diverse and large graduate market,
and so participate in various HE initiatives (eg diversity mentoring,
recruitment workshops, recruitment fairs) in order to help raise
their profile with non-traditional students. This can give positive
benefits to individual graduates (through gaining skills and
experience), but can also help the company to ‘differentiate its
brand’ from others by often promoting different things — being a
‘cool’ place to work, having different values, or state-of-the-art
technology. This has been found to be successful in attracting
more applicants, from groups they have found hard to reach in
the past, and groups that have had very low representation, such
as some Black groups.
The increased use of the Internet to advertise vacancies was felt by
interviewees as likely have a mitigating effect overall on the ethnic
bias produced by traditional institutional targeting (though this
had not been evaluated by them). Also, employers’ involvement
in specific diversity activities, such as ethnic graduate fairs, was
aimed at helping to provide a better balance of applications. There
were a few where a bias was more obvious, eg the law firm
referred to above, where 80 per cent of offered candidates come
from targeted universities, Oxbridge, and a few other ‘elite’
universities. Many others were not as open about this.
Graduates (regardless of ethnicity) also believe that bias exists in
employer practices, towards Oxbridge and more traditional
universities1 (also some of our interviewees), and the perception
1
114
See Park HR Research (2002).
Why the Difference?
of bias has been shown to be especially strong among minority
ethnic groups.
‘A’ level thresholds
The second aspect of employer targeting in graduate recruitment is
to set requirements in vacancy advertising on a specific educational
level or age group — often young, high ‘A’ level candidates. The
aim is to screen out others from applying (as a form of selfselection). As we have seen already (Chapter 2), those not in this
young/high ‘A’ level category are more likely to be Black students
than White or Asian, especially Indian or Chinese, students.
Most of our interviewees had desired ‘A’ levels as a published
selection criteria. However, in some, if an applicant failed to meet
the ‘A’ level points threshold they could ‘make it up’ in other
areas (eg other qualifications, work experience, evidence of
desired attributes from other questions). This process has been
facilitated by IT and online application screening processes, which
has made the process of making equivalences more systematic,
and so reduces the potential for bias. There were a few examples
of organisations deliberately keeping their ‘A’ level threshold
fairly low, eg a financial services organisation had set it at 14
points, specifically to ensure they did not bias against minority
ethnic students. Only one of our interviewees explicitly stated no
preferred ‘A’ level scores. However, we also found examples of
organisations planning to increase ‘A’ level thresholds, primarily
to reduce the increased volume of applications they receive
online, although they were aware that this action would make it
more difficult for them to meet their diversity targets. One public
sector organisation with two streams of intakes, where one of the
initial sifting criterion was on ability (and ‘A’ level scores
featured), but not the other, saw this as one of the main barriers to
getting more minority ethnic applicants to the former (which was
their upper career stream).
Lack of role models
Another discouraging factor for minority ethnic graduates is the
lack of role models, especially Black people in senior positions in
most large organisations. One of our interviewees, in financial
services, commented that:
‘Although the number of minority ethnic employees in senior
management has grown from 18 to 45 in the last six years, it still only
represents three per cent of senior management … an improvement at
every level is needed.’
Organisations try to address this in their marketing materials, and
by taking ethnically mixed teams to campus presentations, to help
counter a ‘White, male middle class’ image which they recognise
that students have of them, especially Black students. However,
Why the Difference?
115
presenting an image of an organisation as ethnically diverse,
especially at more senior levels, can possibly lead to false
impressions being created. As one interviewee in a large business
consultancy framed it:
‘We have a good proportion of graduates who are from a minority ethnic
group so we can portray this in our brochure, but I would not feel
comfortable presenting our partners as diverse, as this is not the case.’
Besides internal organisational role models many interviewees
were of the opinion that minority ethnic students did not have
role models in their own communities in the form of relatives, or
friends, to help them in their choice of university and career. As
one interviewee put it:
‘I was always expected to do a profession, such as be a lawyer or doctor.
I had never considered accountancy as I has not come into contact with
accountants and it was not regarded as a suitable profession.’
Another interviewee spoke about obstacles to overcome in
changing the image of some industries and occupations with
ethnic groups, eg the perception that banking was merely about
branch banking (which it is not these days), and so not held high
enough in status for some ethnic groups.
Selection
While there are barriers at the ‘front-end’ of graduate recruitment
(image, attraction processes), employers generally felt that it was
in their selection process where more of the main barriers to
improving minority ethnic representation lay. This is supported
by university careers advisers we spoke with, and by graduates.
In a recent survey,1 46 per cent of minority ethnic respondents had
applied to firms advertising vacancies, but only 15 per cent had
made it to the final interview (sample of 134 minority ethnic
graduates).
Several of our interviewees were concerned about their
monitoring statistics, which showed declining percentages of
minority ethnic graduates at each of the stages of selection (eg
application form screening, first interview, assessment centre).
This suggested to them that their selection practices were likely to
be ‘discriminatory’ in some ways, but they were often unsure
about the cause. Some believed it was in the psychometric testing
administered to graduate applicants where the problem mainly
lay, and were working with the test publishers to improve the
‘norms’ they used, while others had dropped some tests
altogether. For example, one organisation had found that minority
ethnic applicants (not just graduates) were persistently failing a
certain psychometric test, but their job performance was not
worse than those who had passed the test, so they removed the
1
116
Undertaken by AGCAS/AGR in 2003.
Why the Difference?
test from the selection process. Several others felt the problem lay
with interviewers, and so were giving attention to the training of
managers on assessment panels, mainly to raise awareness of
diversity issues there.
A survey in 20021 gave evidence of minority ethnic students
feeling more disadvantaged in employer testing than other
students/graduates. Surprisingly, there was little difference when
asked if they found assessment centres problematic (an issue
identified by some of our interviewees, see below), though more
ethnic minorities said that they found it ‘hard to identify with
interviewers’. This reflects the earlier point made about the lack of
good role models.
As mentioned above, the greater use of the Internet in recruitment
has had the effect of increasing the number of applications many
employers receive, and as a consequence, some organisations have
turned to simple methods to screen more out. Some employers are
going back to their past practice of upping their ‘A’ level
thresholds, which as pointed out above, can risk bringing in an
element of indirect racial discrimination. One organisation
though, a large law firm, had found a strong correlation between
academic and job performance and was not prepared to reduce its
very high academic standards (28 plus ‘A’ level points).
Others use screening tests (eg verbal reasoning, literacy), online or
via telephone interview which should be ‘colour blind’, but can
discriminate against those who do not have good language skills,
or are less confident. There were also examples of companies
using other criteria, eg the use of vacation work or preemployment experiences (internships), to help assess candidates
better (this also helps to promote their employer ‘brand’ to the
student community, see above). An increasing number of
organisations recruit their graduate intakes via employment with
them (eg one supermarket chain recruits almost half of their
graduate intake this way).
Several of our interviewees were particularly concerned about
what they saw as under-performance of some well-qualified
minority ethnic applicants at their final stage assessment centres,
and Black Africans were mentioned more often in this respect. The
small group activities, designed to demonstrate desired attributes
such as leadership, communication, team work etc., appeared to
set them at a disadvantage, especially those who were less
familiar with ‘operating’ in this way. It had been noticed that they
tended to talk less quickly or make points more quietly, less
questioning, less assertive — ‘less likely to blow their own trumpet’ as
one recruiter put it — and also lacked some social and
presentational skills. Some of this is rooted in cultural difference,
in terms of collectivism and individualism, between ethnic
1
Why the Difference?
See Park HR, op. cit.
117
groups. One interviewee suggested that as work experience is
more likely to be got by Asian students from their own families,
they were less likely to have had to take their own initiative to
find it, and so had not honed up their presentational skills
(though this is perhaps rather a generalisation, it is part of the
stereotypical image many recruiters hold).
It is difficult for some organisations who are seeking specific
attributes, which they have derived from competency frameworks
(eg the need for high level of presentation skills) to take these
differences into account and alter their procedures, especially if
they do not have a shortage of other apparently good candidates.
However, one organisation, albeit with a relatively small graduate
intake (10-20 per year), and where competition was not
particularly high, had opted to have one-to-one interviews instead
of small group activities to help avoid any possible disadvantage
from this source for those applicants less used to operating well in
a group environment. Others were moving to more role-playing
in assessment centres, so that behaviours were identified more in
selection, and this was thought to be an advantage for minority
ethnic groups. Another recruiter felt all graduates were not
sufficiently prepared and was trying to ‘demystify’ the selection
process by taking part in workshops held by universities.
There is a danger that employers use competencies in selection
systems derived some years ago, and not regularly updated, to
reflect not only business changes but also changes in the type of
graduates more recently recruited. This has the potential to be
anti-diversity.
Eligibility to work in UK
There are also some external factors affecting minority ethnic
recruitment. One is eligibility to work in the UK. This is a basic
employment criteria of most graduate recruiters in the UK, and
most of our interviewees were unable to accept applications from
graduates who had some work restrictions caused by their
nationality, residency or citizenship. This helps to explain the
significant reduction in the number of minority ethnic candidates
from application to first interview stage in some organisations
(shown in Table 8.1). Organisations reported receiving increased
numbers of applications from international students (often via
website) including foreign students at UK universities (but their
monitoring systems usually did not distinguish between UKdomiciled and foreign students at UK universities as in HESA
statistics so this is rather a ‘grey’ area).
Although this eligibility criteria is stated on job information/
vacancy websites, many organisations still get large numbers of
ineligible candidates applying. In one IT firm, for example, it was
the main reason why applications from minority ethnic groups
were rejected (some from overseas, but some also from UK
118
Why the Difference?
universities), and Chinese were mentioned as being a particular
group more noticeably affected by this. We found only a few
organisations prepared to help suitable applicants with work
permits, mainly because they saw it as beneficial in attracting
more applicants from minority ethnic groups (one also, an
engineering company, did it because it experienced shortages of
good applicants generally).
Geographical mobility
A second factor, but mentioned less frequently, was geographical
mobility constraints of some minority ethnic groups. This applied
where some graduates were expected to be fully mobile across the
UK in their jobs (eg in retail banking) and employers had found
some, in particular female Asian, graduates less willing to take
this on. It applied also to a health care organisation recruiting high
numbers of Asian women a number of locations, where they
tended to get a number of refusals after offers had been made. On
the other hand, an engineering company with some far-flung sites
across the UK had not experienced any mobility issues, rather the
reverse with several recent minority ethnic recruits commenting
that they wanted to get away from home or to be more
independent from home (but they recruited mainly male rather
female minority ethnic graduates).
Being unprepared
‘There is a huge chasm between graduate expectations and what
companies are offering/graduates can expect to get.’
Several organisations had concerns that graduates were not
prepared sufficiently for difficulties in job finding and selection.
One example was:
’Minority ethnic students are not switched on to the fact that they need
to have extra curricular activities in support of their applications.’
However, although the remarks were made about minority ethnic
graduates, this could apply equally to White graduates, and may
be more of a lower social class issue, especially if they are the first
generation to go to university. A number of initiatives are being
taken by universities and colleges to help students get a better
awareness of the world of work, and also develop more selfawareness of their skills and attributes several are focused
specifically on Black and other minority ethnic groups (eg Impact
scheme, Diversity Mentoring UK, Windsor Fellowship).
8.4 Improving representation
Employers can take several steps to counter bias in recruitment
and selection processes, and also help to improve graduate
employability. We found a number of examples of this.
Why the Difference?
119
Positive images and marketing
There is more attention being given to marketing and ‘selling the
employer brand’ in graduate recruitment generally, through
various media but, in particular, websites. Employers we
interviewed almost all considered it very important to get over a
positive diversity image in their marketing, to aid the recruitment
of minority ethnic graduates. Showing pictures of people from
different minority ethnic groups in the workforce is standard
procedure, as is making a strong statement of their EO policy.
Company research has indicated that students find such a
statement reassuring, and do have the effect of encouraging
applications from minority ethnic graduates. One employer said
that they used the logo of ‘Race equality for all’ to help emphasise
their commitment to diversity.
Putting out positive messages in this way is intended to focus
employer branding on encouraging positive choices, and, so
‘attracting’ certain types of graduates. Some of our interviewees
made use of a number of specialist agencies to improve their
‘message’ to minority ethnic students, and also advertised in
specialist media, but most found that the mainstream graduate
publications gave them the best results. One public sector
recruiter felt that presenting an image of ‘respectability and welltreated staff’ was particularly attractive to minority ethnic groups,
and gave them an ‘edge’ on competitors. The offer of structured
training and an opportunity to gain a professional business
qualification was also an attractive selling point for them.
Many of our interviewees were involved in the various
publications, websites, recruitment fairs and other initiatives
which specifically target minority ethnic students and aim to
assist them in the labour market (see below). There is a
burgeoning range of different kinds of such initiatives, as more
funding becomes available from within universities (some via
access funds), and from regional and local agencies, as well as
employers. While employers with a diversity commitment were
keen to be seen to be involved in them, or more often the reverse
(not wanting to be seen to be not involved), they did question
some of their effectiveness. We found little evaluative evidence
available to help make judgements about which worked best and
for whom (except some of their own, which was not often shared).
Workforce diversity policies
‘Getting senior managers on side, some of whom have now become the
biggest champions of diversity.’ (Large finance group)
This organisation saw the diversity agenda moving more to senior
management (who were mainly White), to get them more exposed
to minority ethnic graduates, and use then as mentors. Several
others mentioned the need for good mentors for minority ethnic
120
Why the Difference?
recruits in particular. Others were finding their diversity training
being driven by external supply chains, as well as internal
pressures from having a diversity policy.
The importance of setting and monitoring targets was mentioned
by several organisations, and the greater use of the Internet in the
graduate recruitment process helped to provide better tracking
statistics.
Being flexible about religious holidays, and recognising special
requirements, eg food, religious facilities were seen as good aims
to have, but often it was organised in ad hoc ways. One of our
interviewees though (a law firm) had included a prayer room in
their new suite of offices.
Pre-recruitment
As mentioned above, many of the organisations we interviewed
had policies to positively get involved in campus activities to help
promote their ‘brand’ among minority ethnic undergraduates, and
some of these included students in earlier years. This might be
sponsorship of student societies and speaking at events (organised
by SIS/CRAC for example).
There has been an increase in employers offering work experience
placements to students specifically as an aid to their graduate
recruitment and some placement or internship schemes have
targets for minority ethnic students. These are often ‘blue chip’
recruiters and focused at traditional universities. Not only are
these intended to help the individual student gain experience and
skills, but they can give the organisation a better basis for
selection. They also hope that the students go back and act as
‘ambassadors’ for the organisation at their university.
Some of our interviewees were getting more involved in special
initiatives or projects in HE, aimed specifically at helping minority
ethnic groups succeed better in securing their career choices (such
as the national Diversity Mentoring scheme, employer-led job
workshops and programmes run by the Windsor Fellowship).
A focus of some of the work of large organisations is also preuniversity — in schools access programmes. These are intended to
raise aspirations and confidence levels of students from lower
socio-economic groups, including some minority ethnic students
to encourage them to consider applying to universities with a
higher reputation but further away from home (eg the Oxford
Access scheme). Some schools based activities supported by
employers also target parents in order to help influence their
children in making appropriate choices (outside of the more
traditional careers of medicine and law).
Why the Difference?
121
Evaluation
While initiatives to widen access and help individuals gain better
skills and confidence for successful transition to the labour market
are of course welcomed, there is some doubt about how much real
added value is coming from some of the work that is going on.
Are some of the initiatives targeted at HE getting to those in most
need of job seeking skills training, confidence building, help with
career choices? Or are they attracting more of the same kind who
would be more likely to succeed anyway. As recent research (for
example by CHERI on employment/careers initiatives for
disadvantaged student groups) has indicated, many depend on
voluntarism. To come forward the students need to have
recognised that a programme is aimed at them and that they need
help, and are comfortable to take part in positive action type
activities. How students perceive themselves is an important issue
— as a member of a minority ethnic group, or as a student with
similar needs as others with their social lifestyles? We feel the
current evidence base is weak and further research needed on
measuring successful outcomes, not just on inputs as at present (ie
numbers taking part in schemes).
8.5 Summary
This chapter has focused on employers’ perspectives of minority
ethnic graduate recruitment and employment related issues for
minority ethnic graduates.
Though many organisations, especially the larger ones, are
developing greater commitment to diversity and diversity policies
that impact on graduate recruitment, much progress still needs to
be made, and more reliable data systems developed also. Several
of our interviewees had very well-developed diversity strategies,
but there were also some with very little, and some where policies
existed but were not as effective in practice as they could be.
Most large graduate recruiting organisations monitor ethnicity in
their graduate recruitment process, though in a variety of ways,
but it is usually only the designated graduate programmes/
corporate intakes which get such treatment. Very little monitoring
takes place of the ethnic make-up of graduates recruited to other
jobs outside of these (which tends to be the majority in some). We
recommend that ethnic minority of all graduate recruitment is
undertaken more and in systematic ways.
The data available within organisations on graduate recruitment
showed a range of representation levels of minority ethnic
graduates in applications and job offers. But in only a few did the
evidence show that minority ethnic groups had as good, or better,
chance of getting a job offer as White applicants. However, some
care needs to be taken in drawing firm conclusions from this kind
of data because of quality and reliability issues.
122
Why the Difference?
Three key issues were identified:
z a mostly declining trend of minority ethnic representation
through the recruitment process, from application stage to job
offer/acceptance
z a distinct lack of Black graduates in job offers, and also among
applicants in places. Asian, and mostly Indian, were usually
the dominant minority ethnic group
z Indian and Chinese groups were more likely to outperform
others in getting through each of the selection stages.
But there were some noticeable exceptions to these general themes.
It was clear that a number of organisational-related factors affect
the low representation of minority ethnic groups, or certain subgroups:
z indirect discriminatory practices in their selection methods (eg
use of ‘A’ level scores, testing, assessment centre formats/
group exercises, attitudes of interviewees)
z targeting specific institutions in marketing (the more
prestigious, academic ones), though the increased use of the
Internet in job applications was felt to be mitigating the likely
negative effects on minority ethnic groups a little
z lack of role models (especially at senior levels within
organisations, but also in some ethnic communities)
z issues on eligibility to work in the UK (needing a work permit
if not UK/EU).
And also, but less significant:
z geographical mobility — affecting some Asian women in
particular
z being unprepared for work — lack of awareness of the
difficulties they are likely to experience, and/or what
employers are seeking (also applies to some White graduates).
Actions taken by employers to increase their recruitment of
minority ethnic graduates included:
z improvements to marketing (positive images)
z diversity training of all employees (especially managers on
interview panels)
z improving selection practices, and competency frameworks
z recognising particular needs of individuals in the workplace
(eg religious needs)
z positive use of web and other marketing publications/careers
fairs to target minority ethnic groups
Why the Difference?
123
z pre-recruitment activities in HE — getting involved in
students mentoring programmes and job workshops, offering
work experience placements, and positive action schemes
z wider access work — in schools and colleges.
The number of successful businesses who are committed to
increasing ethnic diversity in their graduate recruitment is
growing, albeit slowly. In some, getting involved in the various
activities at universities is an ‘act of faith’, as there is little
evaluative research evidence to show what adds most value for
what kinds of graduates. There is a need for more work to be done
here, especially in measuring ‘added value’ of different types of
initiatives. But these more committed organisations are still
comparatively small in number and form a small proportion of
the very large number of employers recruiting graduates these
days, including more small firms. The challenge is how to engage
a lot more of them in issues of ethnic diversity in graduate
recruitment.
The research points to several areas for further action:
z by employers, to disseminate good practice and share lessons
learned amongst the business community, in development of
policy and practice and the impact of positive measures taken
to improve minority ethnic graduate intakes (eg such as in the
use and identification of role models, selection practices, or
work placements). Also, more, and for some better, systematic
ethnic monitoring of all their graduate recruitment (both via
schemes and other jobs) is needed
z by universities, to be more pro-active in helping students be
better prepared for the realities of job search and employers’
expectations of them, especially students from non-traditional
groups
z by government, to help employers understand the changing
nature of the student population and appreciate better the
value of graduates who have followed different pathways into
and through HE (less traditional routes and institutions); and
also to help universities accommodate the increasingly diverse
needs of students, seeking to make successful transitions to the
labour market.
124
Why the Difference?
9. Summary and Conclusions
Much progress has been made in expanding opportunities to
participate in higher education (HE) study, especially to less
advantaged groups. However, not everyone has equal access to
HE, or to certain parts of it. There is much greater diversity across
HE today and also in outcomes and the graduate labour market.
This study has focused on one group of students in particular,
minority ethnic students (UK domiciled) at universities and
colleges in England. Its focus has been on how and why their
participation in, and progress through and from, HE, are different
from the majority White group. In particular, it has examined
important differences between the various minority ethnic groups.
Unlike previous research, it has benefited from taking a wholeprocess perspective, by looking at the various phases in one study
— pre-entry, entry, progress, qualification and transition to the
labour market.
In this final chapter we draw together the main conclusions from
the research and policy implications.
9.1 Diversity and complexity
This report has presented a complex pattern of minority ethnic
participation in undergraduate study and the transitions of
minority ethnic graduates to the labour market, more diverse than
probably previously realised. A key theme throughout has been
diversity and complexity, and many of the messages in the
research are not simple ones to communicate. The complexity
arises because of the variety of influencing factors, and their
effects, which need to be taken into consideration, many of them
inter-acting with each other. Data limitations then add to
difficulties in analysing their relative importance.
The mechanisms involved in getting to higher education, getting
on once there, and then getting a preferred job are not likely to be
to be the same for all students. They have varied backgrounds (a
broader HE intake nowadays) and different motivations. There
are also considerable differences between institutions and courses
(in entry requirements, attitudes to widening access and ‘nontraditional’ students, graduate labour markets etc.) and ‘life as a
student’ can vary enormously. But when looking at minority
Why the Difference?
125
ethnic students, there are some specific issues to consider also.
The increasing diversity within the minority ethnic population is
important to recognise, in particular the divergences evident
between the main minority ethnic groups, eg differences in their
gender, age and socio-economic profiles, their geographical
distribution, their ‘generation’ profiles (migration to the UK,
length of time here), and qualification levels and views on
education. Direct and indirect effects of racial discrimination also
need to be considered.
We have tried to simplify matters by highlighting three
contrasting groupings of minority ethnic students who appear to
be on different trajectories into HE — Indian and Chinese,
Pakistani and Bangladeshi, and Black students. This finding, in
particular that Black students have a common trajectory, is
important because it helps us see more clearly the link between
HE entry route/attainment and participation patterns, subsequent
progress and attainment, and also employment outcomes. Care
needs to be taken though in searching for too simplistic
approaches in analysis and interpretation. Ethnicity (as defined by
the Census ethnic groups as we have used in this study) is not the
only component of an individual’s identity and, as we have found
here, it is not always the more significant one when analysing
relative advantage or disadvantage in higher education or the
graduate labour market, and causes. One of the difficulties, which
has been highlighted numerous times in the report, has been our
inability to disaggregate the minority ethnic groups, ie to ‘drill
down’ and use more complex analysis techniques to assess the
significance of various effects for different groups, or on subgroups, eg younger/mature, gender, vocational/academic entry
route, London effect etc. Often we have been limited by having too
few cases in our sample surveys to look at, or problems with
representativeness.
Though problems of small numbers can be got over to some
extent by combining years of data, changes to the data collection
systems in HE from year to year (of UCAS and HESA) and
especially the change in ethnicity classification arising from the
Census 2001, can present problems with reliability. Over-sampling
minority ethnic groups in representative sample surveys is a
recommended approach, but the costs of doing so can be very
great and need justification. However, if further progress is to be
made in establishing some of the patterns and combinations of
influencing factors on minority ethnic groups identified in this
research, then greater consideration needs to be given to being
able to disaggregate adequately. Certainly, a minority
ethnic/White split should be avoided, but what the most
appropriate breakdown is to make in different circumstances
needs to be decided with care, and it may cut across the minority
ethnic groups in standard use (eg length of stay in UK, or religion
might be more of an issue to explore). There may be some value in
breaking down the very large ‘White’ group in different ways
126
Why the Difference?
(especially as it is likely to include in the future more from Eastern
European countries). On occasions, it may be more useful to make
more use of individual HESA Student Records than duplicate
some of the information there in new surveys, or to link the HESA
data better with sample survey data (though there are a number
of major issues of confidentiality of information in doing so, with
costs involved).
Thus, when planning future research and formulating policy on HE, it is
recommended that the minority ethnic population is not treated as a
homogenous group, nor even seen in terms of only the individual
(standard) minority ethnic groups. It may be more useful to consider
the larger groupings we have done here at one level of analysis. But
disaggregation into sub-groupings would also provide greater
understanding of specific issues for different student groups and
address specific pockets of possible disadvantage. There is a need also
to disaggregate the White category. However, we do recognise
limitations in data relating to ethnicity, especially when looking at
relatively small groups. More should be done with the new Census
2001 data, some of which has only recently become available. Any
new surveys planned, especially on progress of young people to and
through HE, should have an ethnicity dimension to them which enables
analysis to be undertaken at an appropriate level of disaggregation of
the minority ethnic population.
9.2 Entry to HE
Prior attainment and choices at 16
Staying on in formal education at 16 and following the ‘A’ level or
vocational qualification route post-16, as well as experiences in
earlier education stages and at GCSE, have been shown to be
important in explaining differences in HE entry by young people
generally, and between minority ethnic groups in particular. In
aggregate, minority ethnic students are less likely than the White
group to take the ‘A’ level route to degree study, but Indian and
Chinese groups are more likely to (similar to the White group)
and Black, and Black Caribbean in particular, less likely. Indian
and Chinese groups are also more likely to gain a higher score at
‘A’ level on average than other minority ethnic students, almost
on a par with White students (though some, such as Chinese, gain
higher ‘A’ levels than Whites on average). Another distinctive
feature is the greater likelihood of minority ethnic students to stay
on in education post 16, but go to FE colleges rather than stay on
at school, the latter again a particular feature of Black groups.
Entry to degree study via selective schools (independent or
grammar schools) is more associated with White, Mixed ethnic
groups, Chinese and Indian, and also other Asians (less so
Pakistani, Bangladeshi and Black groups). Gender differences are
also evident in these patterns.
There is also an age factor to consider, as Black students are more
likely to enter HE at an older age, while Asians are more likely to
Why the Difference?
127
do so at the traditional 18/19 age, and have achieved a level 3
qualification (ie normally the minimum entry requirements to HE)
by age 19, the latter more so than White young people. The Indian
group, in particular, are more likely to enter HE by the age of 19
years.
In summary, there are clear divergences between the groups at the
HE entry stage:
z Indians, Asian Other, and especially Chinese, are more likely
to be highly academically qualified at entry to HE (more
similar to the White group).
z Pakistani and Bangladeshi students are less likely to be as
well-qualified as other Asian groups. They are more likely to
have vocational qualifications for HE entry than other Asian
groups, and also more likely to have gained them at sixth form
college than any other ethnic group.
z Black student groups, and Black African in particular, have
lower entry qualifications, and they are more likely to be
older, and have vocational or Access qualifications, taken at
FE college.
These differences relate to the various, relatively well-known
influences on education paths and attainment seen generally for
young people (relative economic advantage, social circumstances,
level of parental education, geography etc.). But, specifically for
minority ethnic students, some of these variables work more
powerfully for some minority ethnic groups, thus helping to
create these different patterns seen in the HE route and entry
qualifications data.
Other factors in HE decision-making
In addition to prior attainment, which is clearly a central influence
on decisions about going on to HE, a number of other factors
affect HE decision-making. These include individual, school,
family and other influences which impact on career choices made
by young people. The influences and influencers vary according
to attainment group and other variables.
Key encouraging factors for minority ethnic groups are:
z Parents and families: ambition for, and support and
encouragement to, young people from their parents and
families has a stronger influence among minority ethnic than
White students, and some Asian groups in particular
(continuing a pattern seen in earlier education). Minority
ethnic people generally hold more positive views on the value
of education than White people. With the exception of Black
Caribbean students, minority ethnic potential students in our
research were more likely than White potential students to
128
Why the Difference?
have always held an expectation that they would go to HE.
Furthermore, they were also all more likely to be helped in
decisions about HE by their parents than White potential
students. This is despite the fact that, in many cases, their
parents were first generation immigrants (especially Black
African and Chinese/Asian Other groups, and many lacked
experience of higher education themselves).
z Expectations about economic gain/career advantages: minority
ethnic students were more likely to go to HE for instrumental
reasons than White students (and there is little difference
between minority ethnic groups). This is associated with the
stronger aspirations and ‘drive for qualification’ to improve
social mobility.
The main discouraging factor is:
z The financial disincentives: (costs of studying, likely debt
etc.), and this applied almost regardless of ethnicity. But we
did not find minority ethnic students, or particular minority
ethnic groups, to be significantly more put off HE by possible
debt than others (as other research has suggested). It is likely
that the greater tendency for young people to stay at home
among some Asian groups, and greater likelihood of getting
parental financial support and doing paid work while
studying, affect views about student finance.
Socio-economic class effect
Minority ethnic students to full-time degree courses are more
likely to enter HE than their socio-economic class profile suggests.
Bangladeshis have the lowest socio-economic class profile,
followed by Pakistanis and Indians, and then Chinese and Black
groups, but all have lower proportions in the top two socioeconomic classes (parents in professional and managerial
occupations) than White degree entrants. Furthermore, minority
ethnic groups with the highest socio-economic class profiles are
not those most likely to enter HE on the ‘A’ level track (which is
the traditional HE entry route and dominated by the higher socioeconomic class groups generally). This would imply that there are
factors mitigating the effects of low socio-economic class, seen
generally as a focus of most recent access to HE development
work. The most likely of these factors relates to aspirations and
commitment, including the positive influence of parents. The
effect of this here is stronger among the Indian and Chinese, than
the Pakistani and Bangladeshi grouping, and least strong for Black
young people.
Why the Difference?
129
Policy implications
There are a number of implications from these results.
There is a need to work more to close the ‘A’ level attainment gap
between groups, especially for Black boys, which would help
considerably in achieving equal access to HE for members of
different minority ethnic groups.
Action is currently taking place at earlier education stages,(from Year
9) in schools, to raise aspirations and attainment at GCSE. This needs
to continue and efforts increased. Such work by schools, LEAS and
others (local community based programmes, or part of wider
programmes such as Aimhigher) should include projects which help
minority ethnic pupils both pre-16 (and earlier at end of primary/start
of secondary) and post-16 (in schools and colleges). Many initiatives
are long-term in expecting positive outcomes on HE entry, but it is
important that they are evaluated, and those which are proving
successful supported and information disseminated relating to successful
outcomes, to see where further support could be given to them, or
directed differently.
There may be a need to look more at the targeting of many existing
‘access to HE’ programmes and also new ones as the Aimhigher
programme moves into new areas, to see how effective they are at
helping young Black men in particular. Minority ethnic people may not
necessarily fall into existing target groups, which focus mainly on lower
social class groups and schools, where much of traditional universities’
reach-out/widening access work is. More attention should be given to
FE colleges where minority ethnic young people are more concentrated.
Universities, under their race equality duties, need to consider if race
equality objectives and outcomes are sufficiently written into their
access policies and agreements, especially pre-92 universities where
access work is focused mainly on potentially high ‘A’ level achievers
(discussed more, later in section 9.3 under diversity of participation).
A second important area of policy is careers advice and guidance,
and HE information. As young people from minority ethnic
groups are taking HE entry qualifications in a variety of
educational settings, the range of formal careers advice and
information and guidance they receive about HE is likely to vary
also, especially between those at schools, colleges, and in the
workplace. The provision of high quality careers education and
guidance is arguably more important for young people from some
minority ethnic/social backgrounds because of the possible effect
of a weaker position in the labour market of their parents; less
parental experience of HE in the UK; and more reliance by young
people from minority ethnic backgrounds on parental advice.
We recommend that any differences in careers advice and guidance
and access to information on HE (from careers specialist or personal
tutors/teachers), designed to help minority ethnic groups on different
HE entry routes make choices, is identified, and action taken to ensure
that no-one suffers any disadvantage in this way. It would be useful to
130
Why the Difference?
identify models of good practice (especially in FE colleges) and
disseminate them.
It is also recommended that further research is undertaken on what
kinds of differences parental support and encouragement can make,
and where and for whom in particular. This would require a focused
qualitative research approach, over a period of time. It is also
important to explore how parents have been involved in widening
access and careers initiatives, and where lessons could be learned and
applied more widely (White and non-White groups).
A third area is in the progression from vocational routes and
vocational post-16 qualifications to HE, and the lack of a general
valuing of vocational qualifications as entry to higher level study.
This is a general issue in the current educational debate but has
particular significance for minority ethnic students, some of
whom tend to favour more vocational options.
We expect the development of the new Foundation degrees to provide
a new pathway to HE for entry with vocational level 3 and work-based
qualifications. We recommend that monitoring and evaluation of this
new qualification includes racial equality (along with gender age and
socio-economic class). The research has shown that some HNDs (in
particular in computer science and business) and DipHE courses (eg
nursing studies) are more popular with certain groups of minority
ethnic than White students, and so the pattern of take-up of FDs,
especially any impact they have on HND/DipHE or other sub-degree
courses, needs monitoring.
The research did not indicate that student finance was likely to be
any more of a deterrent to participation in HE by minority ethnic
students than White students, or to particular groups, though the
net effects might be different as minority ethnic groups tended to
value the investment in HE more than White students. It is likely
to be more of a socio-economic class issue, and it is known from
other research that the prospect of student debt can have a
particularly discouraging effect on lower class groups, which will
include minority ethnic groups. The current changes to student
finance may have a differential effect on minority ethnic group
entry to HE (especially if most universities increase their fee
contributions, and have differential fees for courses), but it is too
uncertain to predict at present.
We recommend that the impact of the proposed changes to student
finance on participation (both on entry and retention) by minority
ethnic students be monitored carefully for any serious impact on
minority ethnic students. This also should include the monitoring of
applications and admissions to particular types of universities and
particular subjects (eg longer courses like medicine which are currently
more popular with Asian students than others), and the take-up of
Student Loans (also see later section 9.3 re effects on admissions, and
also recommendations in 9.4 on student support).
Why the Difference?
131
9.3 HE Participation and choices
Minority ethnic groups in aggregate are more successful in
gaining places on undergraduate study in England than are White
people. This is despite their lower success in earlier stages of
education and their different pattern of post-16 choices, compared
with White young people as a whole. All minority ethnic groups
have a higher HE initial participation rate (HEIPR) than the White
group in the population, and Indian and Black African have the
highest (at over 70 per cent, their HEIPRs well above the 40 per
cent average, and already exceed the Government’s 50 per cent
target figure). Black Caribbean men and Bangladeshi women have
the lowest HEIPRs, but the latter is the only minority ethnic
gender group which falls below that of the White male or female
figure. But there are a number of issues involved in calculating
ethnic specific HEIPRs and so these figures, though shown to
illustrate clearly the diversity within the minority ethnic
population, should be treated as provisional.
We recommend that the Department continues to work on developing
measures of HE participation for groups of the population, and in
particular undertakes further investigations of the issues surrounding
the calculation of participation rates (HEIPRs) for individual ethnic
groups. The reliability of the figures produced here needs further
investigation through statistical analysis, in particular, issues in the
Census data. This may help to explain some of the large differences
between some of the ethnic group figures. We also recommend that
the large White group should be disaggregated further. The
Department should also take the opportunity that the soon to be
available more detailed Census 2001 provides to look into calculating a
new HE participation measure based on it alone, rather than combining
Census and HESA data.
Qualification levels at age 19 are similar between minority ethnic
overall and White groups (though some groups, Black in
particular, gain qualifications for HE entry at an older age, and
Asians are more likely than Whites to have higher qualifications
by age 19). Other factors which explain the higher HE
participation of the minority ethnic population include: their
younger age; higher levels of commitment to education post-16,
and especially greater levels of parental encouragement; and
greater expectations of economic benefits from HE. Unlike in
some other areas of education and employment, there is little in
the way of direct discrimination on ethnic grounds in admissions
overall, but (as shown below), some bias exists in certain parts of
the sector affecting admissions to particular institutions. There are
also gender differences by ethnic group in overall HE
participation rates.
Diversity of participation
These overall participation rates for the minority ethnic
population mask considerable variations in the type of HE study
132
Why the Difference?
taken: there are variation in minority ethnic representation by
institution, type of courses (full-time/part-time, degree/subdegree) and subject, and also by geographical region. Of
particular significance is that minority ethnic groups are:
z More likely to be attending a post-92 than pre-92 institution,
and Black groups more so than others, but Chinese less so (the
most likely minority ethnic group to be at a pre-92 university).
There is a very clustered distribution of universities with higher
than average minority ethnic representation, the highest found
in mostly post-92 universities in the London area.
z More likely to be studying full-time sub-degree, than degree
or part-time sub-degree courses (mode/qualification), and
Black Africans are much more likely to be than others.
z More likely to be studying computer science, medicine/
dentistry and law degrees (over 30 per cent representation on
each), almost twice the average.
z But less likely to be studying in some of the sciences and
education.
Factors shaping HE choices
A variety of explanations for these different participation patterns
exists, including differences between groups in their demographic
characteristics, in attitudes towards education and employment
for women and men, the aspirations and influence of their parents
and, importantly, prior attainment levels and HE entry route.
Prior attainment (and expectations of ‘A’ level attainment) is a key
influencing factor on participation overall, but especially in
choosing and securing a place at the more competitive universities
and courses. It is significant to note though that Black African
groups are one of the high participating groups, but in contrast to
Indian groups (also high), they are more likely to come into HE on
the vocational/college pathway (similar to Black Caribbean who
are a lower HE participation group). We found that prior
attainment had a greater effect on choice of what course to study at
university for our potential students surveyed than any other
background factor. As already highlighted, more minority ethnic
students have qualifications other than ‘A’ levels, and lower ‘A’
level grades, and so this is clearly a main reason why they are more
likely to be found in the post-92 university groups, and on certain
courses with lower requirements (such as the sub-degree group).
But there are also other influencing factors:
z Geography, particularly for mature students or those from
lower socio-economic classes, who are more likely to stay close
to home. It explains the higher concentrations of minority
ethnic groups (and Black students in particular) at institutions
Why the Difference?
133
with higher concentrations of minority ethnic groups in their
vicinities (London and other cities).
z Another influence is family and parents, especially on subject
choice. This can have a greater effect on minority ethnic
potential students in biasing them towards the traditional
professional/vocational subjects, some of which (eg medicine)
are mainly in pre-92 universities. It had a greater institutional
choice influence on female Asian students (to stay at, close to,
home) than on others.
z Other influences, of more importance to minority ethnic than
White students generally, were ‘being able to fit in better’,
social circumstances and employment prospects.
It needs recognising, though, that there is considerable variation
in the way individual applicants weigh up factors in coming to
decisions, and there is a variable effect of these identified factors
on choices for different groups. The following illustrates this:
z While Indian and Chinese groups are the most likely to
follow the ‘A’ level track to degree study, and also more likely
to have been at a ‘selective’ school, it is only the Chinese (not
Indian) who have a higher representation in the generally
more selective universities ie pre-92, rather than post-92.
Indian groups are the most likely though to be on medicine
degrees.
z Pakistani and Bangladeshi are less likely to be on the ‘A’ level
track, which ties in with their higher representation in post-92
than pre-92 universities. But they are equally likely to choose a
full-time degree than a sub-degree on average, suggesting that
other factors, possibly parental influence, have a role.
z Black groups are older on entry and more likely to come via
the vocational/access course, and so much more likely to be at
a post-92 university. A particular feature is the greater
participation of Black Africans on full-time sub-degree
courses, which is likely to be linked to subject interests (eg
nursing studies).
Admissions
Another key factor which helps explain the different pattern of
participation, especially by institution, is racial bias in the
admissions process. The UCAS data show that minority ethnic
students are more likely to apply for a place on undergraduate
courses than White students overall, but as applicants they are
less likely to be accepted on average. However, once a number of
personal characteristics are controlled for, especially qualification,
they are actually more successful in getting a place than White
students overall (as the participation figures above indicate).
However, when type of institution is taken into account, minority
ethnic students (and particularly Black Caribbean, Indian,
134
Why the Difference?
Pakistani and Bangladeshi) are less likely than White students to
be accepted (other things being equal) to an old (ie pre-92)
university than one in the post-92 group (where they are more
successful). Minority ethnic students are also more likely than
Whites to be accepted through Clearing, and institutions/courses
participate in Clearing to varying degrees. The conclusions from
this are that some racial discrimination may be taking place in the
admissions process in some places, in the different ways
institutions and/or courses make offers to applicants.
It needs to be recognised though that the process of admitting
students, through a centralised system (ie UCAS) which seems
straightforward, can be a relatively difficult process for some
students, especially those coming through the non-traditional
routes. Also, the published data from UCAS is on (final)
acceptances and although data can be got from UCAS on offers at
different institutions (with permission from institutions), relatively
little is known about the offer decision making process itself at
institutions, nor how individuals decide about offers made. Some
universities are in a situation of excess demand for places, while
others are not; also some get far greater numbers of applications
from minority ethnic students than others. The opportunity for
discrimination against minority ethnic applicants is greater in
some places than others, though we found little direct evidence of
students experiencing discrimination on ethnic grounds in
admissions from our surveys (though survey respondents were
unlikely to have been interviewed or had much personal contact
with university admissions staff).
Policy implications
There are a number of policy implications identified from the
research, relating to the uneven distribution of minority ethnic
students across HE, and ensuring equality of access to different
parts of the HE sector.
We recommend further research on the offer/acceptance/entry process
is undertaken as a whole and by individual universities in the HE
sector, at institution and subject level, to ensure that the process is
fair. Further research could be on the effect of withholding names from
UCAS forms at initial sifts. Also, admissions staff training is currently
being developed further and race needs to be included in equal
opportunity issues covered. Good practice within and between
universities should be shared more.
Universities need to monitor ethnicity in the admissions process as part
of their specific duties under the recent race relations legislation. Also,
we understand that HEFCE intends to develop means of monitoring
admissions in the future, by using UCAS data. This should help in
identifying better where any serious problems exist in the sector.
Institutions also have a duty to monitor and publish data, and take
appropriate action.
Why the Difference?
135
A further recommendation relates to the new Office for Fair Access
(OFFA). Before they are able to charge higher variable fees from 2006,
institutions will need to have an access agreement approved by OFFA,
which will set out, amongst other things, planned measures to be
taken by the institution to attract under-represented groups. It is
expected that these access agreements will help to address some of
the problems faced by some ethnic minorities, which may include
specific measures to encourage applications from ethnic minorities in
institutional widening access plans, or provision of specific support (will
vary between institutions). It is expected that OFFA, when it is
established, will have a duty to promote racial equality under the Race
Relations Act.
Highlighted above, in the previous section, were recommendations
relating to careers advice on choices of post-16 education, which can
have an effect on HE participation levels by different groups. These
apply here too. It is important that potential students make informed
decisions about institutions and courses, from reliable sources.
Universities have a role to play here, as well as careers specialists and
personal tutors/teachers, and they (and also local access projects)
should be aware of the differences between groups highlighted in this
research, and also how the various factors shape individual choices of
different students. Also, the Department’s new review of gateways to
the professions should take note of the variation currently in subject
choices by minority ethnic groups, especially those with a professional
focus and the concern about lower take-up by some groups in some of
them (eg education).
9.4 Student progress and experiences in HE
Students’ experiences of HE study vary greatly, according to their
background and prior educational experiences, their choice of
course and institution, whether they live at home or not and their
financial circumstances.
Discontinuing study
Universities with the highest early leaving figures for degree
students are mainly ones with lower entry qualifications, and it is
generally recognised that it is ‘marginal’ entrants to HE where the
risk of discontinuing courses, mostly in the first year, is highest.
Many of the institutions with the highest early leaving rates (eg in
London) have the highest densities of minority ethnic, particularly
Black, students. It is not surprising, therefore, to find higher early
leaving among minority ethnic than White students in aggregate,
and more so among Black degree students than Asians. But when
allowances are made for differences between students, (on entry
qualification, age and subject), this gap virtually disappears, and
younger students actually do slightly better than expected. This
again shows the significance of background and entry route
factors.
Other factors can cause early leaving generally (such as choosing
the ‘wrong’ course, financial or domestic pressures), and affect
136
Why the Difference?
both minority ethnic and White students. In our research among
students, a range of difficulties were felt by students to have had
an effect on their progress in HE and made them consider
dropping out (though none had done so). Black students were
identified as likely to be at higher risk of leaving than Asian
students, but this was mainly explained by their older age, and
also (likely) by their different social class and entry profiles. Black
African female and Black Caribbean male students were identified
as being at most risk of leaving, but this is likely to be age-related,
and also due to having less support/encouragement from parents
to stay than younger students.
We found no satisfactory explanation in the research with
students to explain the better retention figures shown by the
overall statistics for young minority ethnic degree students.
However, evidence from other parts of the research suggest
positive parental influence may be having an effect.
Fairly tentative conclusions have been drawn from the research
evidence, and more research is needed to fully explain the differences
in retention by ethnicity, and what specific factors may be having a
particular influence, positive and negative, on some groups (eg staying
at home, or possibly a London effect).
Particular issues which concerned minority ethnic students more
than White students (and likely to have an effect on their studies)
were staff support issues (not enough, or not as much as
expected), and feelings of isolation or lack of cultural diversity.
There was some evidence of poor racial awareness among staff
and poor race relations in places, but rarely any direct racial
discrimination experienced by students.
Minority ethnic students, and Asian groups especially, are more
likely than White students to get parental contributions, have less
debt and to be living at home. Black students tend to work the
longest hours during term-time.
While financial issues are of concern to all students, this varied by
ethnicity. Black Africans were more concerned and Indians and
Chinese and Asian Other less concerned. Again this is likely to be
related to their different ages and socio-economic status, and also
different living and financial arrangements, as well as ethnicity.
Sources of student income were affected here too, by other
personal variables in addition to ethnicity (especially socioeconomic status and also family factors). Further research is
needed, with larger datasets, to investigate this aspect and draw
firmer conclusions.
The proposed review of costs of support to non-traditional students (in
White paper) should give attention to needs of those minority ethnic
students, in particular the older groups identified in the research, who
face greater problems, which can then affect their progress in HE.
Why the Difference?
137
Issues of race relations and equal opportunity relating to the student
experience are for universities, both with high and low numbers of
minority ethnic students, to address in order to see what action might
be needed. They relate directly to race equality duties of universities
under the recent race legislation. We recommend that further research
is undertaken on minority ethnic students’ concerns and issues, to see
how they differ from those of White students, in particular to examine
issues of isolation, cultural diversity, staff attitudes and racial
harassment. It is likely that the new National Student Survey on
Quality will be helpful in showing differences in student feedback by
minority ethnic groups (and sub-groups). It is important that the
survey’s design has an appropriate ethnic dimension so that
institutions and the government can identify trends and issues
affecting minority ethnic groups. The need to look at universities’
strategies for promoting good race relations, including staffing and
senior management support and commitment (not covered by this
research), should be considered, also.
Degree performance
Although more minority ethnic people are participating in degree
study, overall they appear not to achieve as well in terms of class
of degree as White students. Black students are the least
successful, in particular the Black African group, who are most
likely to gain a third or lower class of degree. There seems to have
been little improvement over the last few years in this pattern.
But if the attainment of first class degrees is looked at (rather than
the average class or 1st and 2.1 combined), there are some
different results. The gap between minority ethnic and White
students narrows, and some groups (Chinese, mixed ethnic) are
almost on a par with Whites, while others (Indians, Asian Other)
are not far behind. Considering that the participation in HE
among young people from these groups is considerably higher
than for Whites, it means that there are likely to be more Chinese,
Asian Other and Indian than White young graduates with first
class degrees in the young population, a fact which may not be
recognised by employers.
Female minority ethnic students perform better than male
minority ethnic students in aggregate, and this gender difference
is greater than for male and female White students, though it
varies by individual minority ethnic group. Age, subject and type
of institution all make a difference to attainment generally, but the
greatest effect comes from entry qualification and type of school.
‘A’ level entrants are likely to do better than others, and this
improvement can be seen more for minority ethnic than White
groups, and Black groups in particular (who are less likely
anyway to enter with ‘A’ levels). But even allowing for this, the
performance gap does not disappear. Other research has shown
effects of racial bias in assessment in some places, and also
different experiences within HE having an effect on degree
performance (eg extent of term-time working, commitment to
academic study, ‘quality’ of learning) which we also found in our
138
Why the Difference?
research). As with the discussion earlier on non-completion, these
effects are likely to vary between students and courses, and also
interact with ethnicity in various ways, which needs much larger
scale research to explore further.
We recommend that further research and analysis is undertaken to
provide a better explanation of why some minority ethnic groups
achieve a lower average class of degree than expected (given their
entry qualifications, age, subject, institutional distribution), and also
why their achievement at the very top (of first class degrees) gives a
better picture. The new Student Survey, mentioned above, should help
to give a better understanding of issues related to quality of teaching
which may be relevant. The proposed review of the honours
classification system should help to open up this area more, and
provide evidence of where there is the potential for racial
discrimination around degree classification, if any exists.
Satisfaction with outcomes
Our research also showed that, although experiences within HE
study varied, most of the final year students were satisfied with
their performance to date. Reasons given for doing less well
ranged widely, covering a range of personal and academic issues,
but there was no consistent message that minority ethnic students
felt more dissatisfied than White students overall. But graduates,
one year later, seemed more disillusioned about their HE
experience. Fewer Black and Asian students felt, with hindsight,
that they had made the right choice about course or institution,
compared to White students. Other research also suggests Black
graduates, with hindsight, are less happy about decisions made
earlier about their HE course.
The research implied a greater sense of disillusionment among some
groups of minority ethnic graduates, once out in the labour market,
which would merit further exploration. The new Student Survey will
provide feedback on levels of satisfaction at the end of their final year
(which will be a useful mechanism for identifying problem areas, as
discussed above). But we recommend that further research is also
undertaken on ‘satisfaction’ some time after graduation. In particular,
it would be useful to explore how expectations of ‘economic
benefits/career gain’ have actually worked out. This is relevant for
future HE students, as this aspect is a strong ‘push’ factor for minority
ethnic young people.
9.5 Graduate transitions
Various sources — the statistics on the First Destination Survey of
graduates, the balance of opinion among HE careers advisers, and
our follow-up survey of students after qualifying — all point to
students from minority ethnic backgrounds facing greater problems
in the graduate labour marketplace in securing their career choices
than White students. The statistical evidence on initial employment
success indicators (at the six month stage), in all cases are lower for
Why the Difference?
139
minority ethnic groups than White graduates. In particular, all
minority ethnic groups have higher unemployment rates than
White degree graduates. Highest unemployment is among male
Pakistani and Chinese (over twice the average), while lowest is
female White and Chinese. Higher percentages of minority ethnic
degree graduates, particularly Bangladeshi, Pakistani and Chinese,
go on to further study or training, partly to gain further
qualifications for a particular chosen career, and partly to gain
further academic qualifications.
We suggest that more exploration of the ‘further study’ option is
undertaken, and also more generally the participation of minority
ethnic students in different kinds of postgraduate education, and the
impact of areas of their low participation.
Factors influencing graduate transitions
These greater difficulties in making graduate transitions arise for a
number of reasons, but we have identified four key ones here,
which can act in combination to produce particular disadvantage
for some groups:
z the background characteristics of the individuals and their
choice of study (subject and institution) and also location
(concentration in London area)
z their performance in their degree (ie class of degree)
z their job search
experiences)
behaviour/job
relevant
skills
(work
z and effects of general ethnic disadvantage in the labour
market.
As can be seen, these are mainly indirect effects, and we found
little substantial evidence of direct racial discrimination
experiences by graduates. The research was not able to separate
the different effects (it would need considerably more data to do
so), but some points are worth highlighting by looking at the two
ends of the employment range:
z Unemployment among Black Caribbean students was among
the lowest for minority ethnic graduates overall. This may be a
London effect (more choice of jobs available and higher
proportions of Black Caribbean students at London
universities), or it may be subject driven (higher percentages
take vocational subjects like business or health-related
studies), or because considerably more of them are female
(who have more successful outcomes overall than men).
z By contrast, the Pakistani group had the highest unemployment
overall. This is most likely to be a result of subject choice
(higher percentages take IT and engineering) where
unemployment overall is highest, but it may also be affected
140
Why the Difference?
by their geographical distribution (less likely in London, and
preference to stay more locally), or less active/ later jobseeking behaviour in final year.
Nor could we look longer term, to see if the greater initial labour
market disadvantage is short-term, but evidence from other
surveys does suggest that differences reduce over time. Another
positive finding is that minority ethnic graduates are not less
likely to get lower level jobs than White graduates overall. But
notably Black Caribbeans (who were more likely to be in paid
employment) have the lowest likelihood of being in higher level
jobs (professional/managerial), lower than other minority ethnic
or White graduates. There is some evidence to suggest that
minority ethnic graduates are also in better paid jobs (a function
almost certainly of those who are in jobs are more likely to be in
professions (see subject distribution) or in financial services, also
generally well-paid). But this needs further research.
It was noticeable that job-seeking behaviour and attitudes to
applying for jobs in their final year varied between minority
ethnic groups. Some of the individual graduates were aware of
particular difficulties they and other minority graduates faced,
and some ‘interventions’ in HE were suggested. These included
gaining a period of work experience, developing extra-curricular
activities, better self-promotion and ‘knowing the rules of the
game’ (ie what employers were looking for, being prepared for
interviews, assessment centres etc.). Several initiatives at
universities have been developed specifically to help minority
ethnic undergraduates improve their labour market prospects. We
found, however, little evidence that the outcomes of them were
being evaluated systematically, or information was available to
help employers decide which kinds of initiatives they should try
to get involved in.
We recommend that the various measures to improve graduate
employability be systematically evaluated, to quantify their additional
effect on improving labour market entry for minority ethnic students.
Employer perspective
The employers, and university career advisers, interviewed
provided some insights into employment prospects for minority
ethnic graduates. They showed that while many employers,
especially larger ones and in the public sector, are developing
greater commitment to ethnic diversity policies, which impact on
graduate recruitment, much progress still needs to be made
among the wide-range of graduate recruiters, large and small.
Minority ethnic graduates continue to be under-represented in
most corporate graduate recruitment schemes. In only a few did
we find evidence to show that minority ethnic graduates had as
good, or better, chance of getting a job offer as Whites. However,
Why the Difference?
141
there are some data reliability issues. Ethnic monitoring of the
graduate recruitment process is not kept systematically and,
where it is kept, it is usually only for the designated graduate
programmes/corporate intakes. Rarely is any ethnic monitoring
done on recruitment of graduates to other jobs in various parts of
organisations.
Three key issues were identified in graduate recruitment processes:
z minority ethnic representation reduces through the stages of
the recruitment process, from application to job offer/
acceptance (mostly, some exceptions)
z a distinct lack of Black graduates in job offers, and also among
applicants in many places. Asians, and mostly Indian, were
usually the dominant minority ethnic group
z Indians and Chinese were more likely to outperform other
minority ethnic groups in getting through each of the selection
stages (once they have met the initial UK work eligibility
criteria).
Reasons for the low representation of minority ethnic groups, or
certain sub-groups, varied between employers, but the main ones
were:
z indirect discriminatory practices in their selection methods (eg
use of ‘A’ level scores, testing, assessment centre formats/
group exercises, competence frameworks, attitudes of
interviewees)
z targeting strategies in recruitment and marketing — on
specific institutions (the more prestigious, academic ones) and
traditionally qualified students
z lack of role models — especially at senior levels within
organisations, but also in some ethnic communities
z (in)eligibility to work in the UK (needing a work permit).
Geographical mobility, mainly affecting some Asian women, and
being unprepared for what employers are seeking (but this also
applies to some White graduates) were other reasons.
The more committed employers to ethnic diversity in graduate
recruitment were taking a range of actions to increase their
recruitment of minority ethnic graduates, including improvements
to marketing (positive image, including specific publications/
recruitment fairs); more diversity training for employees
(especially managers who were on assessment panels); improving
selection methods, and use of competency frameworks; and prerecruitment activities in HE (student mentoring programmes and
job workshops, offering work experience placements). But these
‘involved’ employers are still fairly small in number, and many
more need to be convinced of the value of engaging in this way
142
Why the Difference?
with universities and colleges, to see any substantial change
taking place.
We recommend that further research is undertaken to evaluate prerecruitment activities and other HE-business link initiatives (in addition
to those at universities highlighted above), which have minority ethnic
students as part of their objectives. Work experience (eg placements,
internships) in particular could be investigated further, as there may be
differences in the quality provided, and in minority ethnic students’
attitudes towards them.
We recommend that more employers in the private sector undertake
ethnic monitoring of all their graduate recruitment (corporate graduate
schemes and recruitment direct to jobs) and produce regular statistics,
which will help them to better understand where problems lie and also
assess the impact of any measures taken. We recommend more
sharing of data and good practice, and raising awareness among the
large number of graduate recruiters, both large and small.
A further recommendation here is to government to help employers
understand better the changing nature of the student population and
to help employers appreciate the value of the different pathways into
and through HE which now exist.
We also encourage more universities to be more proactive in helping
their students be better prepared for the realities of jobsearch and
employers expectations.
9.6 And finally …
The majority of attention in the research literature is given to
problems and disadvantages in minority ethnic participation in
education and employment, which we have tended to also do in
much of this report. But we have also identified some positive
trends, where minority ethnic groups are doing much better than
the comparative White population (for example, in HE entry). It is
important that these successes are given wider recognition, and
the ‘drivers’ which lead to greater success understood better, for
the benefit of everyone.
Why the Difference?
143
Bibliography
Adia E, Roberts D, Allen A (eds) (1996), Higher Education: The Ethnic
Minority Experience, The Higher Education Information
Services Trust (HEIST)
Admissions to HE Group (2003), Consultation on Key issues relating to
fair admissions to HE, DfES, (‘Schwarz Review’)
Ahmad F, Modood T, Lissenburgh S (2003), South Asian women and
employment in Britain: the interaction of ethnicity and gender,
Policy Studies Institute
Allen A (1998), ‘What are Ethnic Minorities Looking for?’, in Modood
T, Acland T (eds) (1998), Race and Higher Education, Report
841, Policy Studies Institute
Aymer C, Okitikpi T (2001), Young Black Men and the Connexions
Service, DfES Research Report 311, Department for Education
and Skills
Basit T (1997), ‘Eastern Values; Western Milieu: Identities and
Aspirations of Adolescent British Muslim Girls’, Aldershot:
Ashgate, in Payne J (2003), Choice at end of compulsory schooling:
a research review, DfES Research Report 414, Department for
Education and Skills
Berthoud R (1999), Young Caribbean Men and the Labour Market: A
Comparison with Other Groups, JRF Work and Opportunity
Series, No. 16, Joseph Rowntree Foundation
Bhattachayya G, Ison L, Blair M (2003), Minority Ethnic Attainment and
Participation in Education and Training: The Evidence, Research
Topic paper RTP01-03, Department for Education and Skills
Brah A, Shaw S (1992), ‘Working Choices: South Asian Young Muslim
Women and the Labour Market’, Sheffield: Employment
Department Research Paper No. 91, in Payne J (2003), Choice
at end of compulsory schooling: a research review, DfES Research
Report 414, Department for Education and Skills
Brennan J, Blasko Z, Little B, Shah T (2003), Access to What? Analysis of
factors determining graduate employability, CHERI report,
HEFCE
Cabinet Office (2002), Ethnic Minorities and the Labour Market (interim
analytical report), Strategy Unit, February
144
Why the Difference?
Cabinet Office (2003), Ethnic Minorities and the Labour Market (final
report), Strategy Unit, March
Callender C (2003), Attitudes to Student Debt of School Leavers and FE
Students, Universities UK/HEFCE
Callender C, Wilkinson D (2003), 2002/03 Student Income and
Expenditure Survey: students income, expenditure and debt in
2002/03 and changes since 1998/99, DfES Research Report 487,
Department for Education and Skills
Carter J, Fenton S, Modood T (1999), Ethnicity and Employment in HE,
Policy Studies Institute
Connor H, La Valle I, Tackey N, Perryman S (1996), Ethnic Minority
Graduates: Differences by Degrees, IES Report 309
Connor H, Pollard E (1996), What do graduates really do? IES Report 308
Connor H, Burton R, Pearson R, Pollard E, Regan J (1999), Making the
Right Choice: How Students Choose Universities and Colleges,
Universities UK
Connor H, Dewson S (2001), Social Class and HE: Issues Affecting
Decisions on Participation by Low Social Class Groups, DfES
Research Report 267, Department for Education and Skills
Connor H, Pearson R, Pollard E, Tyers C and Williams R (2001), Right
Choice?, Universities UK and IES
Connor H (2003), ‘A good job, a better paid job, and a better choice of
job: the economic benefits of higher education from an
individual perspective’, Journal for Advanced and Continuing
Education, July
Connor H, Hirsh W, Barber L (2003), Your Graduates and You, IES
Report 400
Connor H, Tyers C, Davis S, Tackey N D (2003), Minority Ethnic
Students in Higher Education: Interim Report, DfES Research
Report 448, Department for Education and Skills
Davies R and Elias P (2003), Dropping Out: A Study of Early Leavers
From Higher Education, Institute for Employment Research,
DfES Research Report 386, Department for Education and
Skills
Department for Education and Employment (2001), Youth Cohort
Study: The Activities and Experiences of 18 year olds: England and
Wales 2000, DfEE, SFR 03/2001, January
Department for Education and Employment (2001), Youth Cohort
Study: The Activities and Experiences of 19 year olds: England and
Wales 2000, DfEE, SFR 43/2001, October
Department for Education and Skills (2003), The Future of Higher
Education, HMSO, January
Why the Difference?
145
Department for Education and Skills (2004), Participation Rates in
Higher Education for the Academic Years 1999/2000-2002/2003,
Statistical First Release, SFR 07/2004
Education and Employment Select Committee (2001), Responses from
the Government and from HEFCE to the Sixth Report from the
Committee Higher Education and Student Retention, Select
Committee on Education and Employment Seventh Special
Report
Elias P, McKnight A, Pitcher J, Simm C (1999), Moving on: Graduate
Careers Three Years after Graduation, Higher Education Careers
Services Unit
Gayle V, Berridge D, Davies B (2003), Econometric Analysis of the
Demand for Higher Education, DfES Research Report 472,
Department for Education and Skills
Gilchrist R, Thompson D with Charine J and Akantziliotou K (2003),
Potential Mature Students Recruitment to HE, DfES Research
Report 385, Department for Education and Skills
Hagell A, Shaw C (1996), Opportunity and Disadvantage at 16, Policy
Studies Institute
HESA (2000), First Destinations Supplement (FDS), Higher Education
Statistics Authority
Hodgkinson A, Spours K (2000), ‘Expanding Higher Education in the
UK: From System Slowdown to System Acceleration’, Higher
Education Quarterly, Vol. 54, No. 4, pp. 295-322
Hogarth T, Purcell K, Wilson R (1997), Participation of Non-traditional
Students in Higher Education: Full and Summary Reports,
Institute for Employment Research, for HEFCE
Kandola R (2002), ‘What Drives Diversity?’ in Croner’s Managing
Equality & Diversity Briefing, 18 (4)
Kerrin M, Kettley P (2003), e-Recruitment: Is it Delivering?, IES Report
402
Little B, Connor H et al. (2004), Vocational High Education — Does it
Meet Employers’ Needs?, LSDA Research Report
Mason D (2003), Explaining Ethnic Differences: Changing Patterns of
Disadvantage in Britain, The Policy Press
Metcalf H (2001), Increasing inequality in higher education: the role of
term-time working, National Institute of Economic and Social
Research
Mirza H (1992), ‘Young, Female and Black’, London, Routledge, in
Payne J (2003), Choice at end of compulsory schooling: a research
review, DfES Research Report 414, Department for Education
and Skills
146
Why the Difference?
Mirza H S (2003), ‘All the Women are White, all the Blacks are Men
— but some of us are brave: mapping the consequences of
invisibility of Black and minority ethnic women in Britain’,
Chapter 8, in Mason D (2003), Explaining Ethnic Differences:
Changing Patterns of Disadvantage in Britain, The Policy Press
Modood T (1997), ‘Qualifications and English Language’ Chapter 3 in
Modood T, Berthoud R and others (1997), Ethnic Minorities in
Britain: Diversity and Disadvantage, Policy Studies Institute
Modood T (2003), ‘Ethnic Differentials in Educational Performance’
in Mason D (2003), Explaining Ethnic Differences: Changing
Patterns of Disadvantage in Britain, The Policy Press
Modood T, Acland T (eds) (1998), Race and Higher Education, Report
841, Policy Studies Institute
Modood T, Berthoud R and others (1997), Ethnic Minorities in Britain:
Diversity and Disadvantage, Policy Studies Institute
Modood T, Shiner M (1994), Ethnic Minorities and Higher Education:
Why are There Differential Rates of Entry?, Policy Studies
Institute
Morey A, Harvey L, Williams J, Saldana A, Mena P with Watson S,
MacDonald M (2003), HE Careers Services & Diversity,
HECSU/AGCAS/Centre for Research into Quality
MORI (2002), Schools Omnibus 2001-02 (Wave 8), MORI Social Research
Institute
National Audit Office (2002a), Widening Participation in Higher
Education in England, NAO, Stationery Office, January
National Audit Office (2002b), Improving Student Achievement in
English Higher Education, NAO, Stationery Office, January
NICHE (1997), Higher Education in the learning Society, Report of the
National Committee of Inquiry into Higher Education (The
Dearing Report)
Owen D, Green A, Pitcher J, Maguire M (2000), Ethnic Minority
Achievements in Education, Training and the Labour Market,
DfES Research Report 225, Department for Education and
Skills
Park H R (2001), Diversity in the graduate recruitment marketplace, Park
HR
Payne J (2003), Choice at the end of compulsory schooling: a research
review, DfES Research Report 414, Department for Education
and Skills
Perryman S, Pollard E, Hillage J, Barber L (2003), Choices and
Transitions: a study of the graduate labour market in the South
West, HERDA-SW
Why the Difference?
147
Pollard E, Pearson R, Willison R, (2004), Next Choices: Career Choices
Beyond University, IES Report 405
Purcell J, Pitcher J, Simm C (1999), Working Out? Graduates’ Early
Experiences of the Labour Market, IER/CSU
Purcell K, Morley M, Rowley G (2002), Recruiting from a Wider
Spectrum of Graduates, CIHE
Purcell K, Pitcher J (1996), Great Expectations: the new diversity of
graduate skills and aspirations, CSU, Manchester
Race For Opportunity (2003), The Top 100 Report, RFO
Rolfe H (2001), The effects of tuition fees on students’ demands and
expectations: evidence from case studies of four universities,
Discussion Paper 190, December , NIESR
Rosen V (1993), ‘Black Students in Higher Education’, in Thorpe, M,
Edwards R and Hanson A (eds), Culture and Processes of Adult
Learning, Routledge for Open University Press, pp. 178-193
Shiner M, Modood T (2002), ‘Help or Hindrance? Higher Education
and the Route to Ethnic Equality’, British Journal of Sociology of
Education, June
Universities UK (2002), Social Class and Participation: Good practice in
widening access to higher education, UUK/HECE/SCOP, London
(Follow on from earlier UUK report by Woodrow [1998] From
Elitism to Inclusion)
Van Dyke R, Little B, Callender C (forthcoming), ‘Survey of higher
education students’ attitudes to debt and term-time working and
their impact on attainment’, to be published by UUK
www.statistics.gov.uk/census2001 Report of Census 2001 for England
and Wales
Yorke M (1999), Leaving Early: Undergraduate Non-completion in HE,
Falmer
148
Why the Difference?
Appendix A: Additional Tables
Why the Difference?
149
Table A1: Higher Education Initial Participation Rates (HEIPRs) for English domiciled firsttime entrants (full- and part-time) to HE courses (in universities and colleges), by individual
ethnic/gender group, 2001/02
Ethnic group
Female
Male
All
Est. pop.
HE
entrants
HEIPR
%
Est. pop.
HE
entrants
HEIPR
%
Est. pop.
HE
entrants
HEIPR
%
3,838,120
105,470
41
3,898,230
90,410
34
7,736,360
195,880
38
541,350
22,230
58
524,580
21,120
55
1,065,930
43,360
56
Black Caribbean
52,330
1,870
52
45,210
1,160
36
97,540
3,100
45
Black African
64,020
3,100
75
56,650
2,660
71
120,670
5,800
73
Black Other
11,480
610
72
10,320
440
56
21,800
1,050
64
Indian
131,670
6,470
72
129,630
6,390
70
261,310
12,900
71
Pakistani
102,460
3,330
44
102,020
4,090
54
204,480
7,420
49
Bangladeshi
44,300
1,030
33
39,000
1,220
43
83,300
2,310
39
Chinese
35,700
1,370
50
36,940
1,420
47
72,640
2,840
49
Asian Other
26,710
1,600
94
35,140
1,630
74
60,850
3,230
83
73,700
2,580
44
69,680
2,040
35
143,350
4,610
40
4,379,470
127,700
43
4,422,810
111,530
37
8,802,290
239,240
40
White
All minority
ethnic groups
Mixed ethnic
All (known
ethnicity)
Notes:
1) The ‘estimated population’ and ‘HE entrants’ columns show the total numbers in the relevant populations. The
HEIPR is calculated as a sum of percentages participating in each age group year (17-30).
2) For further discussion of the calculation of the HEIPR see SFR 07/2004 from DFES.
3) The overall HEIPR shown has been adjusted to exclude ethnicity unknowns, so is lower (at 40 per cent) than the
published overall HEIPR (43.5 per cent) for 2001/02.
4) Totals may not add up exactly due to rounding errors.
5) The HEIPR figures for all ethnic groups are shown in Table A1 for completeness but should be treated with
caution, for a number of reasons:
i) they are calculated using more than one data source (Census 2001 for population estimates, and HESA and
ILR 2001/02 for HE entrants). The respondents in each may identify the people being covered by the ethnic
groups differently. This may be more of an issue for some groups, eg mixed ethnic and ‘other’ categories,
than others, but this is not certain.
ii) Some groups are small in number and, generally, the smaller the number, the less robust the HEIPRs.
iii) The number of unknowns in the HE population is higher than in the overall population (in Census), so the
ethnic specific HEIPRs calculated are likely to be lower than the actual figures. The adjusted overall HEIPR is
likely to be around 92 per cent of its true size. We have had to assume that the distribution of unknowns
across ethnic groups is similar in both population and HE figures but this may not be true (the incidence of
refusing to provide information in the HE data collection may vary by ethnic group).
iv) There may be some under-enumeration in the Census of some age/gender/ethnic groups (more likely in
young (in 20s) and male minority ethnic groups, and inner cities). Though the published Census data has
adjusted for this, it still may have an effect on some groups, and inflate the figures.
v) Another complication is that the Census figures relate to April 2001 and the HE student figures to academic
year 2001/02, which does not include April 2001. But 2001/02 academic year has to be used here because it
is the first to give comparable ethnicity classification data. There may be some changes between years in age
structures of some ethnic groups (which vary markedly by age anyway) which affect the figures.
vi) The Census figures cover everyone who is ‘usually resident’ in the population on Census night (in April 2001)
so would include some foreign students; the HE figures include UK domiciled students only (ie domiciled in
UK for previous three years) and excludes foreign nationals coming to the UK to study. This is likely to have a
greater effect on some groups.
Source: Census April 2001, HESA and ILR records 2001/02
150
Why the Difference?
Table A2: Undergraduate White and minority ethnic students by type of institution, in
England, 2001/02 ( percentages)
The Open
University
Pre-92
Universities
Post-92
Universities
HE
Colleges
FE
Colleges
94.7
85.2
78.0
90.5
88.1
All minority ethnic
5.3
14.8
22.0
9.5
11.9
Black Caribbean
0.6
0.8
2.3
1.3
1.8
Black African
0.7
1.7
4.1
1.5
1.8
Black Other
1.0
0.4
0.8
0.5
0.5
Indian
0.4
4.4
5.6
1.9
2.6
Pakistani
0.3
2.0
3.1
1.0
2.0
Bangladeshi
0.1
0.6
1.0
0.3
0.5
Chinese
0.2
1.2
1.0
0.5
0.9
Asian Other
1.2
1.6
1.4
0.7
1.0
Mixed ethnic
0.4
0.7
0.8
0.7
0.8
Other
0.5
1.5
1.8
1.1
n/a
406,000
476,700
Ethnic group
White
N (known ethnicity)
98,700
123,500
121,500
Source: HESA, ILR
Why the Difference?
151
Table A3: Undergraduate White and minority ethnic students by qualification aim and
mode, in England, 2001/02, HE institutions only, excluding Open University (percentages)
First degree
Ethnic group
Sub-degree
Full-time
Part-time
Full-time
Part-time
White
81.9
81.4
78.0
89.2
All minority ethnic groups
18.9
18.6
22.0
10.8
Black Caribbean
1.3
3.0
2.4
1.7
Black African
2.3
4.4
6.7
2.3
Black Other
0.6
1.0
0.9
0.5
Indian
5.8
3.2
4.4
1.6
Pakistani
2.8
1.9
2.8
0.9
Bangladeshi
0.9
0.7
0.8
0.2
Chinese
1.3
0.6
0.8
0.6
Asian Other
1.5
1.4
1.0
1.2
Mixed ethnic
0.9
0.5
0.9
0.5
Other
1.7
1.8
1.3
1.3
N (known ethnicity)
650,278
75,612
84,305
195,949
% of total with known
ethnicity
95.3
90.4
92.2
83.6
Note: Open University students on degree modules are omitted from this table as all are classified as part-time, and
so appear as sub-degree students in HESA dataset
Source: HESA
152
Why the Difference?
Table A4: Distribution in undergraduate study of male and female minority ethnic and
White groups, in England, (percentages), and comparative population distribution
All undergraduates
Population of 18-29
year olds
Ethnic group
Male
Female
Male
White
81.9
84.5
88.0
87.4
All minority ethnic
18.1
15.5
12.0
12.6
Black Caribbean
1.1
1.8
0.9
1.1
Black African
2.7
2.6
1.2
1.4
Black Other
0.6
0.7
0.2
0.2
Indian
5.1
3.8
2.8
2.9
Pakistani
2.9
1.7
2.2
2.3
Bangladeshi
0.9
0.5
0.8
1.0
Chinese
1.1
0.9
0.8
0.8
Asian Other
1.6
1.3
0.8
0.6
Mixed ethnic
0.7
0.7
1.5
1.6
Other
1.5
1.5
0.6
0.8
(N) known ethnicity
440,100
599,500
3,870,400
Female
3,935,900
Note: 1) Universities only included in undergraduate population, not FE colleges
2) Population figures are for England and Wales, as England only figures not available at time of writing
Source: HESA, 2001/02; Census, 2001
Why the Difference?
153
Table A5: White and minority ethnic full-time and part-time degree students by highest
entry qualification, in England, 2001/02 (percentages)
‘A’ levels*
ONC/OND incl.
BTEC/SCOTVEV
HND/HNC
Access
White
78.1
3.1
2.6
2.8
All minority ethnic
69.9
4.0
4.1
4.2
Black Caribbean
49.3
7.6
5.5
13.4
Black African
45.7
6.4
5.7
10.9
Black Other
53.2
6.3
5.8
10.6
Indian
80.7
2.7
3.7
1.0
Pakistani
74.6
3.7
4.3
2.0
Bangladeshi
74.1
4.9
3.9
2.7
Chinese
75.6
2.3
3.2
1.5
Asian Other
72.8
2.8
2.9
3.2
Mixed ethnic
72.8
3.8
2.7
4.3
Other
68.9
3.6
3.7
4.5
All (with
known ethnicity)
75.6
3.3
2.9
3.1
Ethnic group
Note: A range of other qualifications are held but each by very by small numbers (eg other higher level qualifications,
Foundation courses, GCSEs).
*Includes GCSE ‘A’ Level, SCE Higher, GNVQ/GSVQ, NVQ/VQ level 3, but, the vast majority are ‘A’ level qualified
Source: HESA
154
Why the Difference?
Table A6: Previous educational establishment of minority ethnic and White accepted home
applicants to full-time degree courses, in England, 2002 year of entry (percentages)
Accepted
Applicants
Grammar
school
Comp
school
11.4
4.6
26.6
21.8
13.3
191,069
All minority ethnic
9.6
3.4
18.0
28.0
14.8
44,468
Black Caribbean
2.8
1.8
11.6
40.5
14.0
3,114
Black African
4.2
1.0
11.2
36.5
11.3
5,819
Black Other
4.3
1.1
9.8
42.3
14.0
723
Chinese
21.1
5.9
18.7
23.2
12.9
2,677
Indian
12.2
4.3
21.8
22.1
15.7
12,558
Pakistani
5.5
2.1
20.6
27.8
19.8
6,799
Bangladeshi
3.9
2.1
20.4
31.5
23.6
2,162
Asian Other
13.9
5.8
14.8
25.3
11.4
3,327
Mixed ethnic
13.9
4.4
18.7
24.6
12.0
5,420
8.7
2.8
18.1
31.7
10.2
1,869
11.2
4.4
25.0
23.0
13.6
235,537
Ethnic group
White
Other
All
(known ethnicity)
Further
education
Sixth form
college/
Centre
Indep’t
school
Note: A small number came from other types of establishments not shown (eg other maintained schools). Overall,
the previous education establishment was unknown for 16 per cent, but this increased to 32 per cent for Black
African, 24 per cent for Black Caribbean.
Source: UCAS
Why the Difference?
155
Table A7: Socio-economic class (NS-SEC) of minority ethnic and White accepted home
applicants to full-time degree courses, in England, 2002 year of entry (percentages)
Socio-economic class (NS-SEC)
Ethnic group
1-2
3-4
5 and
below
N
(known NS-SEC)
White
58.0
21.8
20.2
172,020
All minority ethnic
42.3
24.6
33.1
33,687
Black Caribbean
41.6
29.1
29.4
2,415
Black African
46.8
22.3
30.9
3,871
Black Other
46.1
25.8
28.0
492
Indian
38.2
25.0
36.8
10,213
Pakistani
30.5
29.6
39.9
4,593
Bangladeshi
21.9
20.6
57.4
1,440
Chinese
37.5
25.6
36.9
2,135
Asian Other
53.5
22.6
23.9
2,544
Mixed ethnic
58.1
21.2
20.8
4,623
Other
54.5
20.4
25.1
1,361
N (known ethnicity)
55.5
22.3
22.3
205,707
Note: Since 2002, data on socio-economic status has been coded by UCAS using the National Statistics Socioeconomic classifications (NS-SEC), which makes use of information on parental occupations. The codes used are:
class 1 = higher managerial and professional, 2 = lower managerial and professional 3 = intermediate occupations,
and so on down to lower skilled groups, Group 7 = routine occupations
Source: UCAS
156
Why the Difference?
Table A8: Students who had, or had not seriously considered, dropping out by men and
women in each ethnic group (percentages)
A: Representative
sample
B: Minority ethnic sample
White
Minority
ethnic
Black Caribbean/
Other
Black
African
Pakistani/
Bangladeshi
Yes
21
36
43
30
33
31
36
No
79
64
57
70
67
69
64
155
22*
37
66
43
58
39
Yes
36
29
30
48
20
23
21
No
64
71
71
52
80
78
79
135
17*
44
50
30
46
28*
Yes
28
33
36
38
27
26
24
No
72
67
64
62
73
74
76
290
39
81
116
73
104
67
Indian
Chinese/
Asian Other
Male
Base
Female
Base
All
Base
Note: Here and Table A9, two sub-sets of sample shown separately, because derived in different ways, and so
cannot be combined (see Appendix B, section B.2).
* = small base (this applies especially to the minority ethnic group in the representative sample)
Source: IES/MORI survey of students 2002
Why the Difference?
157
Table A9: Main problems or difficulties students reported by ethnic group (which they felt
had affected their performance), 2nd and later years, unprompted question (percentages)
A: Representative
sample
B: Minority ethnic sample
Black
Caribbean
/Other
Chinese
/Asian
Other
White
Minority
ethnic
I experienced no problems
27
40
21
17
25
24
25
Financial difficulties
23
14
29
39
25
15
18
Part-time job makes me tired or
miss lectures
15
16
18
19
16
6
17
Problems accessing study
facilities
13
1
11
10
7
14
14
Academic work too hard
10
15
11
12
10
17
10
Not enough academic support
from staff
10
7
6
8
12
14
21
5
11
11
3
13
18
9
290
38
80
118
73
103
68
Difficulty
Not enough encouragement
from lecturers
Base
Black
Pakistani/
African Bangladeshi Indian
See note in Table A8
Source: IES/MORI survey of students, 2002
158
Why the Difference?
Table A10: First destinations of full-time first degree (home domiciled) male and female
graduates (with known destination) from English universities, by ethnicity, 2001/02
(percentages)
UK Paid work
Unemployed
N
Study or training
Male
Female
Male
Female
Male
Female
Male
Female
White
60.5
65.6
8.2
4.5
16.8
17.9
51,344
66,725
All minority ethnic
52.4
57.4
13.6
9.1
22.3
22.4
8,605
11,246
Black Caribbean
62.0
64.6
13.3
8.3
12.1
15.2
347
853
Black African
50.2
57.1
13.3
11.4
24.4
19.7
802
1,148
Black Other
55.4
62.1
13.9
9.5
16.3
17.9
202
464
Indian
56.6
60.7
12.8
8.1
21.2
23.6
3,034
3,728
Pakistani
51.2
51.8
15.5
12.3
22.7
25.2
1,337
1,385
Bangladeshi
49.5
55.9
14.0
11.1
24.4
22.3
386
476
Chinese
43.5
51.7
15.8
7.8
28.2
25.3
713
772
Asian Other
54.2
51.4
11.3
8.4
22.2
25.5
771
860
Mixed ethnic
35.6
52.9
9.2
7.6
34.5
21.9
87
155
Other
46.4
56.6
14.0
7.9
22.4
21.1
926
1,405
Total with known
ethnicity
59.3
64.5
9.0
5.2
17.6
18.5
59,949
77,971
Source: HESA (FDS)
Why the Difference?
159
160
Table A11: Unemployment rates for full-time first degree home graduates (with known destination) from different subjects, from English
universities, by ethnicity, 2001/02 (percentages)
Ethnic group
All
Allied to
med
Biol
sci
Phys
sci
Comp
sci
Eng+
techn
Soc
sci
Law
Bus/
admin
Lib/
info
Lang
Art/
Design
Combined
White
6.1
1.9
5.4
7.4
11.9
8.3
6.2
3.3
5.5
8.9
6.4
8.6
6.5
All minority ethnic
11.1
5.1
10.0
11.4
18.8
16.9
10.6
6.0
10.9
12.6
10.6
13.1
11.9
Black Caribbean
9.8
3.8
6.8
10.0
12.3
25.5
8.1
8.8
9.5
10.2
6.7
14.7
10.1
Black African
12.2
7.4
9.4
8.3
19.7
13.0
9.7
7.5
12.9
23.2
15.6
14.0
10.4
Black Other
10.8
6.3
6.8
8.7
23.4
12.9
12.3
10.8
5.7
6.3
0
10.0
19.1
Indian
10.2
2.8
9.3
13.5
16.9
16.9
11.3
5.2
10.3
7.8
10.7
15.4
11.1
Pakistani
13.9
7.8
16.4
12.6
21.4
20.7
14.0
8.1
13.5
15.4
13.2
14.0
15.3
Bangladeshi
12.4
6.0
12.3
11.4
19.5
22.2
13.7
6.2
7.3
9.1
11.5
22.6
15.6
Chinese
11.6
5.1
11.6
8.6
18.5
14.2
6.8
0
14.2
0
13.8
16.1
13.6
9.7
5.4
5.7
14.1
18.3
15.6
8.3
1.1
10.5
26.5
11.1
9.3
10.7
10.3
4.9
9.5
9.0
24.7
17.0
8.8
5.8
9.0
12.5
11.6
11.0
9.1
6.9
2.5
5.9
7.7
14.2
9.8
6.9
3.9
6.6
9.4
6.7
9.1
7.2
Asian Other
Other
All (known ethnicity)
Note: medicine has not been included as unemployment is very low across all ethnic groups (1 per cent or less), and other subjects with relatively small numbers are excluded
from the table because of space. Also, the mixed ethnic group not shown as very small numbers
Source: HESA(FDS)
Why the Difference?
Table A12: First destinations of HND and DipHE (home) qualifiers (with known destination)
from English university, 2001/02 (percentages)
UK
paid work
Study or
training
Unemployed
(N)
White
59.4
32.1
2.4
13,312
All minority ethnic groups
39.2
50.1
3.0
3,398
Black Caribbean
48.2
40.6
4.4
342
Black African
62.3
26.5
3.8
962
Black Other
44.9
41.2
2.2
136
Indian
22.1
70.2
3.9
796
Pakistani
18.7
69.5
5.3
449
Bangladeshi
34.2
58.3
5.0
120
Chinese
23.6
64.6
3.1
127
Asian Other
38.9
49.1
4.8
167
Other/mixed
38.0
47.7
6.1
299
All (known ethnicity)
55.3
35.8
2.5
16,710
Note: row percentages; not shown are a small percentage with other destinations
Source: HESA (FDS)
Why the Difference?
161
Table A13: Further study or training undertaken by first degree full-time graduates from
English universities, by gender, 2001/02 (percentages of male and female graduates taking
each type of study, ie row percentages)
Higher degree
— taught
Higher degree
— research
Dipl, Cert, prof trg
Other study/trg
Female
Male
Female
Male
Female
Male
Female
Male
White
31
41
9
20
51
31
8
9
All Minority ethnic
43
53
5
8
41
26
11
13
- Black Caribbean/
Black Other
41
39
3
14
47
36
10
12
- Black African
46
56
4
5
35
25
14
15
- Indian
41
56
5
7
41
24
12
13
- Pakistani/Bangladeshi
35
50
6
8
50
27
10
15
- Chinese
57
59
7
9
25
23
11
9
- Asian Other
41
47
9
9
38
31
11
13
- Other/mixed ethnic
44
50
6
13
39
23
11
14
All (known ethnicity)
33
43
9
18
49
30
9
10
Source: HESA/FDS
162
Why the Difference?
Appendix B: Technical Notes
These are technical notes to accompany the main report. They
provide further details of the research and methodologies used.
B.1 Research design and management
The research comprised a number of elements, of both a
quantitative and qualitative nature, focusing on different areas of
the given research objectives and the different target groups. The
research specification required quantitative results to be produced
as much as possible, though the value of qualitative output was
also recognised in providing illustrative case study material. To
facilitate the efficient conduct of the research activity and its
project management, the various research elements were
organised into a number of work packages (WPs). These were
managed separately and reports delivered on each of them during
the course of the project to the DFES. They were:
z a literature and statistical review
z a survey of current students (in a sample of HE and FE
institutions)
z a survey of graduates (follow-up of final year students
surveyed earlier)
z a survey of parents of students (who had been interviewed
earlier)
z a survey of potential students (drawn from schools and
colleges linked to institutions in the student survey)
z case study interviews with employers of graduates.
A number of these work packages were linked.
This overall organisation of the work worked well. It meant that
different elements could run concurrently, helped keep the project
to time, and enabled findings to be delivered to the DfES during
the project. We had initially planned to also post these early
findings on the research project’s website at IES, and thus
disseminate externally and get feedback from other researchers
during the course of the work. However, the time and cost
involved in meeting DfES requirements for publicising research
results in this way were far beyond our agreed budget, and so this
Why the Difference?
163
did not happen. In future, we recommend that the use of the
Internet for dissemination during long projects like this is given
more consideration at the outset.
Further details of each of the survey stages are given in the
following sections of this appendix. But before turning to them, a
number of general points are worth making about the research
focus and data on ethnicity, which had a bearing on the way the
research was conducted and also on the analysis and
interpretation of findings.
z Broad scope: This research was asked to take a very broad
scope, covering flows into, through and out of HE. Each of
these phases could have been research studies in their own
right. Various issues along the ‘journey’ into, through and out
of HE were identified, and important linkages made between
the various stages, which had not been done previously on
this scale. But many issues relating to each stage were not
investigated as fully as we would have liked because of
limitations of the overall size of the project and the amount of
detailed information on ethnicity that could be generated.
z Disaggregating data: By agreement with DfES, the scope was
limited to undergraduate study only (which helped to focus
resources better), but we were requested to ensure that the full
range of undergraduate study was covered, that is: all types of
HE and FE institutions, modes (full-time and part-time) and
levels (degree and other undergraduate study, the latter
referred to in aggregate for brevity as ‘sub-degree’). Factors
affecting different groups of students taking different types of
undergraduate study were important to investigate, but
contrasts between many of these groups could not be explored
as thoroughly as we would have liked because of constraints
imposed by ‘small numbers’ issues. This was a particular
problem when looking outside of the traditional core of
undergraduate study, ie full-time, degree study (which makes
up almost two-thirds of the total) to part-time and sub-degree
study. If each mode/level group is explored separately by
ethnic group, and also say by age and gender, numbers in
most cells become very small, and make conclusions
unreliable. The small size of some minority ethnic groups (eg
Chinese, Bangladeshi) can be particularly problematic.
Resource limitations on sample sizes in several stages of the
research often prohibited investigation of variations at a
detailed level.
z Ethnic Diversity: A related issue is the increasingly diverse
minority ethnic population, in particular by age and gender
profile, education background, social status and culture. This
means that analyses can become very complex. An aggregate
White/non-White breakdown is of much less value nowadays,
and we aimed where we could to use an individual ethnic
group breakdown (but some very small groups needed to be
164
Why the Difference?
aggregated in places). A three-way gender/ethnic/social class
breakdown can provide greater insights but generally was not
feasible because of insufficient data.
z Defining ethnicity: The research focused on the standard
ethnic groups — ie those used in the Census questions on
ethnicity (see Glossary at front of main report and also section
1.2.1). This was decided upon because of the need for
compatibility with other data sources (eg national student
datasets, produced by HESA and UCAS, on which we based
our student survey sample design). It meant though, that we
had to give less attention to other aspects of ethnicity or to
specific ethnic groups who are not defined by these groupings,
eg refugee groups, asylum seekers, or those from countries of
more recent immigration (eg in Eastern Europe, Middle East).
However, we did include questions on religion and country of
birth in our student survey (see section 3.2). A point worth
noting is that changes made to the standard ethnic groups in
the 2001 Census, and adopted by HESA and UCAS from
2001/02, make comparisons over time problematic, and so any
trend data (using old [1991 Census] and new [2001 Census]
categories) should be treated with caution. The main change in
2001 was the introduction of a new category of mixed ethnic
groups (eg Asian/White, Black/White), and recognition of
people of Irish descent within the White category.
z Self-identification: A final point to note is that the method of
reporting ethnic group in the Census, UCAS and HESA
records (and in our surveys) is by self-identification, ie
individuals choosing a group with which they identify the
most from a given list. Self-identification or self-classification
did not appear to be a problem in any of our surveys and nonreporting in the HESA and UCAS home student data is fairly
low overall (though higher in some parts of HE, such as parttime sub-degree study, and higher overall than in the Census
2001). However, problems can arise when combining data
from more than one source, even those that use the same
ethnicity classification system. There are likely to be some
differences in the way the same question is answered, coded,
or presented in analysis, leading to uncertainties with data
validity. In particular, we have highlighted in the text the
difficulties with the calculation of Higher Education Initial
Participation Rates (HEIPRs) for individual ethnic groups,
which combines HESA and Census data (see section 4.1.1).
The respondents in the two surveys are likely to be different
and may identify themselves (and others at their address in
the case of the Census) with the ethnic groups differently.
B.2 The student survey
This was undertaken in partnership with MORI Social Research.
Why the Difference?
165
B.2.1 Survey approach
A quantitative semi-structured approach, based on a face-to-face
interview survey on campus, was chosen as the most appropriate
methodology for this part of the study. From our experience of
undertaking large scale student surveys, we believed it had many
advantages over other methodologies (such as postal surveys,
telephone interviews, or Internet-based surveys). In particular, it
avoided the need to gain co-operation from institutions to select
samples of students from their records, and the confidentiality
issues involved there. This can seriously delay the start of survey
fieldwork, as well as taking up considerable resources. It can also
lead to bias in results if significant numbers of selected institutions
refuse to take part. Instead, we decided to use a short set of
screening questions to individuals selected at random on
campuses (after first seeking permission from institutions to take
part, only two refused), and set quota controls (by ethnic group,
age, etc. see below) to select students for interview. Use of face-toface interviews allowed us to incorporate questions in the
interview where respondents could provide verbatim responses,
and interviewers could probe where relevant. We also believed it
would be able to handle sensitive issues better, in particular any
associated with ethnicity that students had encountered.
However, the main disadvantage of a face-to-face interview
method is its much higher cost per interview, which inevitably
puts limitations on the size of the target sample. But, through
restricting the length of the interview to 15-20 minutes, using
trained interviewers in MORI’s fieldforce, and biasing the sample
selection towards minority ethnic groups, we believed that a
target of 1,250 interviews was achievable within the budget
available, and would provide a sufficient amount of high quality
data for our purposes.
B.2.2 Sample design
The specification for the survey design was that it should produce
robust findings that would be generalisable to the population. It
needed to be representative of its target population — full- and
part-time HE students in institutions within England who are UK
domiciled — and also provide sufficiently robust data about the
different minority ethnic groups to enable comparisons to be
made between them, and also compare sub-groups (eg gender
within ethnic group).
This was not a straightforward task because of the relatively small
proportion of minority ethnic undergraduates overall (only
around 16 per cent) and their very uneven distribution across the
HE sector, especially by institution and geographical location (see
section 4.2 of main report). We had to ensure also that there were
sufficient numbers of final year students in the sample to provide
166
Why the Difference?
a follow-up graduate sample to ‘track’ once they graduated and
started looking for work (see Chapter 7).
To achieve these objectives, there were three elements to the
survey design, a main sample and two booster samples:
z the main sample, designed to be a representative sample of
students in undergraduate study in England, with a target of
500 students. Ethnicity quotas for these interviews were set on
the basis of broad White/non-White categories
z a booster target of 500 minority ethnic students, with ethnicity
quotas set by detailed ethnic categories in order to permit subgroup analysis
z a booster target of 250 final year students, selected along the
same lines.
The sampling strategy consisted of a three-fold process: sampling
institutions, recruiting institutions, and sampling students.
B.2.3 Sampling institutions
First, a random sample of HE institutions (excluding the Open
University) was selected, with probability of selection
proportionate to size (number of students), and stratified by
region and institution type (pre-1992 university, post-1992
university, and ‘other’). The sampling frame comprised all HEIs in
England, including universities and HE colleges (133). We
calculated that a sample of 23 HE institutions, providing 20
interviews at each, was needed to form most of the ‘representative
sample’ of undergraduate students (460). The distribution of
students within the sampled HE institutions was compared to the
national profile by region and type, to ensure that it was
representative.
DfES requested that HE students in FE colleges should be
included as part of the sample. But there are no comparable data
for the FE sector at an institutional level (as there is for HEIs)
which we could obtain for sampling purposes, so instead we
chose four FE colleges, two in the north and two in the south of
England, each with large numbers of HE students (for pragmatic
reasons, so as to make quota selection and interviewing as cost
effective as possible). They each contributed ten (total 40)
interviews, mainly to the ‘representative’ sample.
For the booster of minority ethnic students, an additional six HE
institutions were selected on the basis of their high representation
of minority ethnic students (ie to allow the collection of sufficient
data from minority ethnic students). Institutions with more than
25 per cent minority ethnic representation (not already selected
for inclusion in the ‘representative’ sample) were sampled on a
random basis to provide much of this booster. The minority ethnic
Why the Difference?
167
booster sample also included the ‘representative’ sample
institutions.
The final year booster covered all of the 33 institutions in total
selected for the representative and minority ethnic booster
samples.
B.2.4 Recruiting institutions
Once the sample of 33 institutions was selected, the process of
obtaining permission to conduct on-campus interviewing began.
Letters signed by the Project Manager at IES, explaining the aims
of the research, were sent to institution vice-chancellors or
principals. Fax-back forms were included with these letters, to
enable institutions to ‘opt-in’ and nominate a named contact
person, with whom the research team could liase about
institution-specific issues such as dates to avoid interviewing (eg
exam periods), the best places to stand in order to recruit students,
and the distribution of students doing different degree subjects
around the university. Only two of the selected institutions
refused to participate in the research, and were replaced by
similar institutions, in terms of region, size and institution type.
Table B1 shows the breakdown of the type of institutions
participating in the study by broad region. As can be seen, there
was a higher proportion of new (ie post-92) than old (pre-92)
universities in the sample compared to the population, which is
due to the uneven ethnic student distribution (and a deliberate
part of the sampling strategy). The sample comprised a lower
proportion of HE/FE colleges because the average numbers of
undergraduates there are smaller. The overall regional
distribution of institutions in the sample is similar to the
population, but there is a bias in the sample towards post-92
institutions in London (because of their generally higher minority
ethnic representation).
Table B1: Sample of institutions
Govt region
pre-92
post-92
university university
HE/FE
colleges
Total
% in pop.
(N=133)
London
4
5
1
10
29
Rest of South
3
2
2
7
22
Midlands
2
4
1
7
14
North
3
3
3
9
35
Total
12
14
7
33
100
% of HEIs in
population (N=133)
38
27
34
100
Source: IES/MORI, 2002
168
Why the Difference?
B.2.5 Student sample design
MORI devised a sample design for the number of students to be
interviewed at each institution, and also for the representative and
booster samples:
z Firstly, for the main (ie representative) sample, a minimum of
20 interviews needed to be carried out at each HE institution.
z Next, for the minority ethnic booster, institutions in the main
sample were given additional ethnic booster targets. Around
200 of the overall 500 in the booster came from the institutions
in the representative survey. The remainder came from the
additional institutions (approximately 50 at each). This
method helped to ensure that the booster sample included
minority ethnic students in institutions with both high and
low minority ethnic representations.
z The final year booster sample was made up of students from
all sampled institutions.
Sample targets ranged from 27 to 83 at individual HE institutions.
Quotas were set for interviewers at each institution. The method
of face-to-face interviewing allowed for quotas to be set on a range
of key characteristics, in order to generate a sample of students
that was representative of the institutions participating in the
research. Quotas were set based on institutional profile data
supplied by HESA and covered the following characteristics:
ethnicity, sex, subject of study (broad categories), type of student
(full-time/part-time), year of study (first year/final year/other),
and age on entry to current course (under 21 years, and 21 or
over).
In places, not all the quotas could be met within the time allocated
for fieldwork at each institution, and so some had to be dropped
(dropping down in reverse order of the above).
B.2.6 Achieved sample and weighting
Our target of 1,250 was exceeded and 1,319 interviews were
carried out. For analysis purposes and presentation of results we
had to divide the sample into two main groups, because of the
way it had been designed by MORI and weighted by them:
z Subset A, the representative sample: 535 undergraduate
students (all years), comprising 465 White students and 70
minority ethnic students, drawn from the 23 sampled HE
institutions plus the four colleges. This was checked for
representativeness against the population (but only on HE
Institutions in England, as all that was available, ie not FE
colleges) for a number of variables (gender, age, on entry,
mode of study, year of study, subject and qualification aim). It
Why the Difference?
169
was generally well matched except for age on entry, where it
underrepresented older students (only 34 per cent of the sample
were 21 or older, whereas 57 per cent of the total population are
of this age). Weights (ie multipliers) were given to individual
records to adjust the sample to ‘match’ it to the population for
this variable. There were also slight underrepresentations of
part-time study and other sub-degree students and final years,
where a similar procedure was carried out. The resulting
‘weighted’ sample is shown in Tables B2 to B4.
z Subset B, the minority ethnic sample: This comprised a total
of 715 students, drawn from across all 33 institutions. It
combined the minority ethnic booster with the minority ethnic
students in the final year booster to reach this total. We
followed a similar procedure as above for comparing the
sample with the population, in this case the minority ethnic
student population in the HE sector. We also found a similar
under-representation of younger students, and also part-time
and sub-degree students (nb this is not unexpected from quota
sampling methods, because part-time students are less likely
to be found on campuses and more part-time students are
older, also more are studying on sub-degree programmes).
Again, a ‘weighting’ process was undertaken to address this.
The resulting ‘weighted’ sample is shown in Tables B5 and B6.
Of the 715 students in the minority ethnic sample, the largest
groups were Indian (24 per cent of total) and Black African (23
per cent). Black Caribbean students made up 14 per cent, and
they have been combined in the analysis with the much
smaller group of Black Other (four per cent). Pakistani made
up 14 per cent and they have been combined in the analysis in
the report with the small group of Bangladeshi students
(under four per cent). Chinese students (four per cent) were
combined with those from other Asian backgrounds, eg
Malaysian (8.5 per cent). A further four per cent were grouped
as ‘Other’ (including a range, eg American, Middle Eastern,
Africans and mixed ethnic origins) — nb these groupings were
constructed after taking expert advice, and based on
similarities evident between some groups in the data on
educational participation. Although we aimed to standardise
the research study on the 2001 Census ethnic groups (see
Chapter 1 and Figure 1.1), the student survey sample had to be
based on the earlier 1991 census ethnic classification because
the sample selection had to be based on HESA data for
2000/01 (the latest available at the time of the survey),which
used the 1991 ethnic classification.
Some of the questions were asked only of final year students (on
job/career plans). We had 530 final year students in total, drawn
from across the total sample (ie from main sample and boosters).
Though it is not representative on ethnicity (54 per cent minority
ethnic students) it was checked for representativeness on other
characteristics, and similar small adjustments needed to be made
170
Why the Difference?
Table B2: Representative sample: ethnic breakdown
Ethnic group
%
N
White
87
465
All minority ethnic students
13
70
- Black Caribbean/Black Other
2
11
- Black African
2
12
- Pakistani/Bangladeshi
3
17
- Indian
3
16
- Chinese/Asian Other
2
12
- Other
1
3
100
535
Total
Note: Here and in other tables, percentages may not add to 100
Source: IES/MORI, 2002
as above, by age, mode of study, and qualification aim. Also, some
questions were asked only of first year students, to capture their
initial impressions of adjusting to life within HE.
Table B3: Representative sample: personal characteristics of White and minority ethnic groups
Characteristic
White
All minority ethnic
Total sample
%
N
%
N
%
N
Male
48
224
53
37
49
261
Female
52
241
47
33
51
274
Under 21 yrs
44
203
41
29
44
232
21 to 24 yrs
20
91
29
20
21
111
25 yrs or older
37
171
30
21
36
192
School
16
73
10
7
15
80
Sixth form college
19
85
20
14
19
99
FE/tertiary/other college
15
67
20
14
15
81
Working
35
159
37
26
34
185
Gap year/travel
6
26
4
3
6
29
Unemployed
3
15
6
4
4
19
Caring for child/relative
4
17
—
—
3
17
Other
3
15
3
2
3
17
First year
37
171
46
32
38
203
Final year
33
153
33
23
33
176
Other years
30
141
21
15
29
155
Gender
Age on entry
Activity prior to HE entry
Year of study (within HE)
Note: Here, and in other tables, on some variables there are missing codes, where respondents refused to give a
response, and these are not shown
Source: IES/MORI, 2002
Why the Difference?
171
Table B4: Representative sample: educational characteristics of White and minority ethnic
groups
Characteristic
White
All minority ethnic
Total sample
%
N
%
N
%
N
Academic
53
157
46
17
52
174
Vocational/access/other
48
142
54
20
48
162
15 or less
35
107
38
13
36
120
16 to 25
42
126
44
15
42
141
26 or more
23
70
18
6
22
76
Comprehensive school
18
81
6
4
17
85
FE/tertiary/other college
26
113
42
28
28
141
Grammar school
8
35
3
2
7
37
Private/independent school
8
34
13
9
8
43
Sixth form college
23
102
22
15
23
117
Other
18
78
14
9
17
87
Pre 92 university
33
153
17
12
31
165
Post 92 university/HE college
52
243
63
44
53
290
HE in FE college
15
68
20
14
15
82
Degree
78
363
73
51
77
414
Sub-degree
22
102
27
19
23
121
Highest qualification
‘A’ level points (‘A’ level holders)
Place gained highest qualification
Type of HE institution
Qualification studying for
Source IES/MORI, 2002
172
Why the Difference?
Why the Difference?
Table B5: Minority ethnic sample: Personal characteristics of each minority ethnic group
Characteristic
Black Caribbean/
Black Other
Black African
Pakistani/Bangladeshi
Indian
Chinese/Asian Other
%
N
%
N
%
N
%
N
Male
45
57
56
93
64
82
53
92
Female
55
70
44
74
36
47
47
Under 21 yrs
21
27
24
40
53
69
21 to 24 yrs
21
27
40
60
29
25 yrs or older
58
74
40
67
1
1
6
Sixth form college
13
16
FE/tertiary/other college
22
Working
Other
N
%
N
58
52
30
8
82
42
38
70
19
57
98
47
42
43
12
38
25
43
28
25
11
3
18
23
18
31
26
23
46
13
9
11
13
10
17
9
8
7
2
20
31
37
45
34
57
23
20
33
9
27
23
36
23
28
19
32
20
17
26
7
55
69
39
62
21
25
27
46
30
26
22
6
Gap year/travel
1
1
2
3
3
4
2
4
14
12
7
2
Unemployed
2
3
2
3
—
—
1
2
—
—
—
—
Caring for child/relative
6
7
5
8
—
—
2
4
2
2
4
1
Other
1
1
4
6
5
6
4
6
1
1
—
—
%
Gender
Age on entry
Activity prior to HE entry
School
Year of study (within HE)
First year
36
46
29
48
43
55
38
66
23
21
25
7
Final year
32
41
44
74
34
44
36
62
49
44
50
14
Other years
32
41
27
45
23
30
26
45
28
25
25
7
Source: IES/MORI, 2002
173
174
Table B6: Educational characteristics of minority ethnic sample
Characteristic
Black Caribbean/
Black Other
Black African
Pakistani/Bangladeshi
Indian
Chinese/Asian Other
Other
%
N
%
N
%
N
%
N
%
N
%
N
Academic
35
24
41
39
53
40
54
53
56
34
71
10
Vocational/access/other
65
44
60
57
47
35
47
46
44
27
29
4
15 or less
49
21
26
18
54
37
39
42
33
19
61
11
16 to 25
44
19
63
44
34
23
47
51
51
29
28
5
7
3
11
8
12
8
14
15
16
9
11
2
Highest qualification
‘A’ level points
26 or more
Place gained highest qualification
Comprehensive school
FE/tertiary/other college
Grammar school
7
8
3
4
10
13
9
15
7
6
3
1
47
57
47
77
35
44
37
61
24
21
41
12
1
1
3
5
2
2
6
10
2
2
—
—
1
1
3
4
7
9
5
9
12
10
14
4
Sixth form college
26
32
26
43
37
46
34
57
30
26
38
11
Other
19
23
19
30
10
12
9
15
25
21
3
1
Private/independent school
Type of HE institution
9
11
13
21
16
21
21
37
24
22
15
4
86
11
86
145
62
81
61
106
69
62
82
22
5
6
1
2
20
27
17
30
8
7
3
1
Degree
80
102
83
139
71
92
72
125
79
70
82
23
Sub-degree
20
25
17
29
29
37
28
48
21
19
18
5
Pre-92 university
Post-92 university/college
HE in FE college
Qualification studying for
Source: IES/MORI, 2002
Why the Difference?
B.2.7 Interviews
The student survey took place between March and May 2002.
Interviews with students were conducted by trained MORI
interviewers on campus.
In addition, 30 in-depth interviews were undertaken by IES staff
as case studies, by telephone, during summer 2002. They were all
with minority ethnic students interviewed earlier, chosen to
represent the broad range of such students in undergraduate
study:
z 16 were men, 14 were women
z 15 were aged under 21 at the start of their higher education
course, six were aged 21-24, five were aged 25-29, and four
were 30 years of age or more at that time
z most (28) were studying on a full-time courses, two were parttime
z 18 attended a post-92 university, ten attended a pre-92
university, a further two attended a college of HE
z 26 were on degree courses, one was an HND student, one an
HNC student and two were studying for ‘other’ qualifications,
eg DipHE.
Half of the interviews (15) were with students who had recently
completed their first year of study, and the other half were with
final year students.
Copies of the CAPI transcript questionnaire and follow-up
interview schedule have not been reproduced here, mainly
because of their length, but are available on request from IES.
B.3 The graduate survey
This was a follow-up survey of students interviewed in their final
year in 2002. This phase of the project aimed to investigate the
labour market experiences of new graduates, looking at activities
since graduation, their financial situation, experiences of applying
for jobs or further study, work experience whilst studying, and
looking back, their views on the value of higher education.
B.3.1 The sample
The sample was generated from the first phase of the research, see
above, section B.1. Among the students interviewed by MORI on
campus were 560 final year students. At that time, 284 (51 per
cent) of them agreed that we could contact them for follow-up
research and provided us with a permanent address and
telephone number which we could use to get in touch with them.
Why the Difference?
175
Two intra-survey mailings were undertaken in order to keep
addresses and telephone numbers as up-to-date as possible. In the
course of these, a further 22 final year students either opted out of
being re-contacted or we were otherwise informed (by parents)
that they had gone travelling or moved away, with no forwarding
address provided.
This meant that at the time of the follow-up survey, our sample
comprised 262 graduates.
B.3.2 Telephone interviews
Interviews were conducted by (Computer Aided Telephone
Interviewing), CATI and lasted for 20 minutes each on average. In
the original design, quotas were to be set on broad ethnicity
(white and non-white) but in the event, because of the low
number of contacts available, all were contacted and interviews
sought.
The questionnaire was designed by IES in consultation with the
MORI. It comprised seven sections:
z Course details
z Activities since graduation
z Financial situation
z Experiences of applying for jobs/study
z Work experience whilst studying
z Looking back (views on the value of higher education)
z Additional details (ethnicity, age check, social class).
Copies of the CATI transcript are available on request from IES.
B.3.3 Response rate
One hundred and three graduates participated in the third phase
of the research, representing an unadjusted response rate of 39 per
cent. Fifty-three of these graduates were white and 50 were nonwhite.
The main reasons for non-contact with students were: out-of-date
address and/or telephone details (where the student had moved
and not provided new details); and not being available during the
research, eg because they were travelling abroad. The table below,
Table B7, breaks down the sample outcome in more detail and
indicates an adjusted response rate of 74 per cent.
It can be difficult to follow-up graduates after they have left
university, as they are a very mobile population, particularly
during their first year in the labour market. This is further
176
Why the Difference?
Table B7: Graduate survey response
Issued sample
262
Achieved interviews
103
Unadjusted response rate
39%
Invalid sample (wrong numbers, unobtainable)
101
Not available during fieldwork
22
Adjusted response rate
74%
Refused
23
No contact
13
Source: MORI, 2003
complicated by the increased use of mobile phones amongst this
group, where personal telephone numbers can change frequently.
The number of achieved interviews, and therefore size of graduate
sample, was lower than originally anticipated. The main
implication of this smaller sample was that it was not possible to
undertake the breakdowns by individual minority group that had
been planned at the outset. Also, the sample can in no way be seen
as representative of the graduate population as a whole, or of
particular minority ethnic groups within it. However, the study
still provides a very useful up-to-date insight into the experiences
of a range of ethnic minority groups and allows us to compare
and contrast them. As a result, we could look for any patterns in
the data which could usefully be explored in the future, in
research on a larger scale.
The main ethnic groups used in the analysis of this survey were
the four broad categories: ‘Asian’ (covering Asian/Asian British),
‘Black’ (covering Black/Black British), ‘White’ and ‘Chinese/
mixed/other’ (to include all other ethnic groups).
The main details of the sample are presented in Tables B8 and B9.
z half the sample classified themselves as White, around onefifth were either Asian or Black and only a small number were
Chinese/mixed/other (around six per cent)
z there was a fairly even gender split within the sample, 51 per
cent of each of the White and minority ethnic non-White
groups were female; around three-quarters were under 25
when they started their undergraduate course, slightly higher
among the minority ethnic group; and the majority of the
sample (just over 70 per cent) used an academic rather than a
vocational or access qualification to gain entry to HE, also
higher among the minority ethnic group
z most of our sample were attending or had attended a post-92
institution or college (just under three-quarters). (This would
be expected from the sampling methods employed in the first
Why the Difference?
177
Table B8: Graduate sample by main ethnic group
Number
%
White
53
52
All minority ethnic groups
49
48
Asian or Asian British
22
21
Black or Black British
21
20
Chinese/Mixed/other
6
6
102
100
Overall sample (one refused)
Source: IES/MORI, 2003
survey, over-sampling at institutions with a high ethnic
minority representation
z of those who had gained a degree, just over half had obtained
a 2:1 classification or higher, the remainder gaining a 2:2 or
below.
These very broad ethnic groupings mask, of course, some
individual group differences. The most important of these are:
z Asian graduates were more likely to be under 25 years on
entry to HE than others, especially the Black group. This is
consistent with HESA student data presented in the main
report which shows that Black students are much more likely
to be older on average.
z In relation to degree attainment, Asian graduates were the
group most likely to have achieved a 2:1 or first class honours.
Asian students generally have a higher attainment profile than
their Black counterparts (see main report), but not as high as
White graduates. In our sample, minority ethnic graduates
overall, but particularly Asian students, attained higher
degree classifications on average than indicated by data for the
population.
Table B9: Graduate sample by personal characteristics and broad ethnic group
Gender
Broad
ethnic
group
Male
%
Age on
entry
Female <25 >25
%
%
%
Highest entry
qualification
Institution Type Class of Degree
Academic
%
Vocational
%
Pre-92
%
Post-92
%
1st or
2:1
%
2:2 or
below
%
White
(N=53)
51
49
76
24
68
32
32
68
52
48
All Minority
ethnic groups
(N=49)
51
49
78
22
75
25
22
78
50
50
Source: IES/MORI 2003
178
Why the Difference?
B.4 Parents of students
The main aim of this stage of the research was to obtain views of
the parents of minority ethnic and white students and assess their
influence on decisions by their sons and daughters to participate
in higher education.
B.4.1 Approach
The parents were consulted through a combination of telephone
and face-to-face interviews. It had been planned initially that a
sample of 100 minority ethnic parents of minority ethnic students
and a comparable 100 parents of White students would be
interviewed by telephone. The sample was to be identified from
the interviews with current students (in our student survey
undertaken in Spring 2002, see section B.1 above). However, the
number of students who agreed that their parents could be
contacted was smaller than expected, approximately 200 in total.
A third of them (67 student respondents) were from minority
ethnic groups, and so the vast majority were White. This meant
that we had an effective population of around half the size that
had been originally expected, just 200, from which to draw a
sample for the survey of parents of students.
There was no clear explanation for the lower response than
expected. Informal feedback from the MORI research team (which
interviewed the students) appeared to indicate that some students
were reluctant to agree to their parents being contacted because of
the possibility of linking the family details to the students’ record.
The concern expressed by them led to us changing the wording of
the question eliciting family participation during the interviewing
stage, which improved response a little.
Because of the smaller number of potential parent respondents,
the design of the parents’ survey was changed, in agreement with
DfES, to bring in a greater qualitative dimension. It was decided
to go ahead with a telephone survey, but using a shortened
questionnaire and supplement this with more in-depth face-toface interviews with a subset of respondents in their homes on
particular issues.
Initially, we had considered including family members but
decided to restrict it to parents, because of the smaller numbers
and thus avoid introducing another variable.
Why the Difference?
179
Table B10: Ethnic origin of parents
No.
%
White
57
71.2
Black Caribbean
4
5.0
Black African
5
6.2
Indian
7
8.8
Pakistani
5
6.2
Bangladeshi
—
—
Other Asian
2
2.5
Other
—
—
Total
80
100.0
Source: IES/MORI, 2002
B.4.2 Telephone survey
A total of 80 parents were interviewed by telephone by MORI
Social Research in November 2002.1 Around one-quarter of the
parents (20 out of the 80 from the telephone survey) agreed to be
contacted again for a face-to-face interview. Seven of these parents
subsequently declined to participate further for a variety of
reasons; and 13 parents were interviewed by a team of researchers
from Bristol University.
B.4.3 Parents’ sample characteristics
The ethnic origin of the 80 parents participating in the telephone
survey is shown in Table B10. Just under three-quarters of the
parents were White. The remainder (23 of the 80 parents) said
they belonged to a minority ethnic group.
The 13 parents who participated also in the face-to-face interviews
comprised: three White, three Pakistani, three Indian, three Black
Caribbean and one Black African (their given ethnicity). Seven of
the respondents were mothers and two were fathers; and two
interviews were with both parents.
Parental education and country of birth
In the telephone survey sample, almost all the respondent minority
ethnic parents (19 out of 23) were born outside the UK. A similar
number also said they had completed a formal (compulsory)
education, with only a few (four) with no formal education. Seven
of these 19 minority ethnic parents completed all of their formal
education in another country of origin, ie outside of the UK, a
1
180
We do not know how many students these parents represent. But
from the follow-up interviews, we know that some of the parents had
more than one child at university at the time of the survey.
Why the Difference?
similar number did so in the UK, and the remainder started their
formal education in their country of birth, and completed it in the
UK. Almost all the minority ethnic parents (18 out of 19 who had
completed formal education) attended school to at least 14 years
of age. This was similar to the White parents, with 56 out of the 57
attending school until 14 years of age. However, a higher
proportion of minority ethnic parents continued in school for
longer, compared with the White parents: whilst around half of
the White parents (29 of the 57 respondents) left school at 16 years,
only five of the 19 minority ethnic parents left school at that age.
Another way of looking at this is that the minority ethnic parents
were more likely than the White parents to have finished their
compulsory schooling at an older age; 13 out of the 19 finished
school aged 17 years or older, compared with under half (27 out of
57) of the White parents. This may be explained partly by
differences in school-starting age in the country of origin of the
minority ethnic parents, compared with the UK; and partly by the
fact that it was possible at the time of their compulsory education
for pupils in England and Wales to leave school at the age of 14.
Most of the minority ethnic parents in the telephone survey (17
out of 23) continued in education after their formal, compulsory
education. However, compared with the White parents who
participated in the survey, the minority ethnic parents were more
likely to have attended a higher or further education college than
a university. Around one in six minority ethnic parents attended
university, compared with one in three White parents (Table B11).
Taken together, the information from the survey about their
formal schooling and higher education, as well as other evidence
from the follow-up interviews, suggest that the minority ethnic
parents are more likely to be first than later generation
immigrants. Indeed, they were more likely to describe themselves
as such, by strong reference to their ethnic origin and country of
birth, irrespective of whether they came to the UK as children
themselves or as adults.
Table B11: Higher education experience of parents, by ethnicity
White
N=57
Minority Ethnic
N=19
Total
(%)
Attended university
18
4
27
Attended HE college
9
9
22
Attended Teacher Training
6
–
8
Attended FE college
9
4
16
Did not attend HE/FE education
15
6
26
Source: IES/MORI Survey, 2002
Why the Difference?
181
Table B12: Occupation of parents, by ethnicity
White
N=45
Minority Ethnic
N=17
Total
(%)
Managers and administrators or more senior staff
10
4
23
Professional/technical staff
14
2
26
Associate professional/technical
5
2
11
Clerical/secretarial staff
6
2
13
Craft and other skilled manual workers
2
1
5
Personal and protective services staff
1
–
2
Sales staff
5
1
10
Other unskilled jobs
–
1
2
Other
2
4
10
Source: IES/MORI Survey, 2002
Occupational distribution
Looking at the occupational distribution (Table B12), the minority
ethnic parents in the telephone survey were slightly less likely
than White parents to be in a higher occupational class. Just under
half of minority ethnic parents (eight out of 17) who were working
in paid employment or as self-employed, described their
occupation as managers and other senior staff, or in a professional
or technical capacity, eg professional engineers and scientists. By
comparison, more than half of the White parents (29 out of 45)
worked in such capacity. As occupation is taken generally as a
measure of socio-economic or social class status, this implies that
parents of minority ethnic students were in lower social strata
(consistent with UCAS student entry data, as shown in Chapter 3,
section 3.5).
B.4.4 Characteristics of the student sons/daughters
of parents
The characteristics of the students (ie sons and daughters) of the
parents who responded in the survey are shown in Table B13. Just
over one-quarter of the students classified themselves in a
minority ethnic group (similar proportion to the parent survey,
see Table B10). They were studying predominantly at post-92
universities, and studying a relatively narrow range of subjects,
mostly in professional/vocational areas — medicine, biological
sciences, law, engineering/IT, business studies, social sciences
(each with three or four students). This reflects much of the
pattern of choices made by minority ethnic groups (as shown in
the main report, see Chapter 4).
182
Why the Difference?
Table B13: Characteristics of the students whose parents were interviewed (20 minority
ethnic and 52 White current students)
Type of Institution
Gender
Year of Study
Pre-92
Post92
HE/FE
College
Female
Male
Final
First
Other
Minority ethnic
5
13
2
12
8
10
8
2
White
23
17
12
29
23
24
13
14
Total
28
30
14
41
31
34
21
16
Source: IES/MORI Survey, 2002
B.5 Potential student survey
Work began on this phase of the research in September 2002, in
partnership with the survey organisation, Employment Research.
Its purpose was to investigate the intentions of potential HE
students, factors affecting their decisions about choice of
institution and course, and experiences to date of applying to HE.
B.5.1 Approach
It was agreed at the outset with the DfES that the most costeffective methodology for this stage would be to use mainly selfcompletion questionnaires. This took into account the sample size
needed, question areas and budget. A target survey sample of
approximately 1,000 students from Year 13 (or equivalent) in
schools, sixth forms and further education colleges would be
sought, of whom the majority would be from minority ethnic
backgrounds. This sample size was felt to be the minimum needed
to enable analysis by individual minority ethnic groups to be
undertaken. In addition, a number of interviews and focus groups
would be undertaken to explore issues in more depth. This design
focused on the vast majority of likely entrants to HE in that year,
but, of course, did not include all potential HE students, eg those
in work at that time and not participating in education.
B.5.2 Survey sample design
As minority ethnic students make up a small minority of the total
undergraduate (home-domiciled) intake in England, it was
decided to use a purposeful rather than a truly representative
sample design. This would help achieve a sample comprising
sufficient numbers of minority ethnic groups, within the
limitations of the available resources for this stage. The method
used was to focus the sample on schools and colleges in England
likely to have relatively high proportions of minority ethnic
students on their rolls. Schools and colleges, and contacts for each,
were identified with the assistance of the HE institutions taking
part in earlier phases of the overall study (interviews with staff in
our sampled HEIs). Not only did this help meet our objective of
Why the Difference?
183
having good coverage of all minority ethnic groups, it also helped
integrate this stage of the study with the other stages (as these
colleges and schools were ‘feeders’ into HE institutions in the
sample for the student survey).
It is important to emphasise that the sample was not designed to
be representative of all minority ethnic students who apply to HE.
But it was focused on a proportion of those who do — students
from maintained schools, sixth form colleges and colleges of FE,
from mainly urban areas, and with relatively high proportions of
minority ethnic student populations. Minority ethnic students
from independent schools were excluded, as were schools with a
relatively low representation of minority ethnic groups (and also
potential HE entrants not in education at that time, as highlighted
above).
B.5.3 Sample
An initial sample of approximately 40 schools and colleges was
contacted in October 2002 and invited to participate in the
research (double the number we felt needed to provide sample
size and also spread of students, eg by localities, ethnic group,
social class). These were mostly in urban areas, with relatively
high minority ethnic communities. IES researchers explained that
the school/college role would be used to identify between 50 and
150 students who were in their second year (Year 13 or
equivalent) of post-16 education and who may realistically be
considering pursuing a higher education.
The sample of 40 was narrowed down from the initial contacts to
a working sample of 20 (ten schools with sixth forms and sixth
form colleges, and ten FE colleges). There was a bias towards
colleges rather than schools, to reflect the post-16 participation
pattern of minority ethnic groups. The group of 20 chosen was on
the basis of a variety of factors including: a desire to include
schools and colleges in several different urban areas, the need to
ensure coverage of all of the main minority ethnic groups, and of
course, an agreement from the school/college to participate in the
research. Once agreement had been reached with relevant
personnel, questionnaires were mailed in mid-November,
sufficient to be completed by all of their Year 13 students (or
equivalent in colleges). Approximately 1,200 questionnaires were
sent to the schools and sixth form colleges, and 1,200 to the FE
colleges by the survey house, Employment Research in November
2002. Representatives from the schools and colleges were given
written guidance as to how the survey should be administered.
Ideally we hoped that questionnaires would be completed in class
time but in order to minimise the burden on schools, they were
allowed to distribute the forms to students to complete in their
own time if this was more convenient.
184
Why the Difference?
B.5.4 Response
After several follow ups and mailing additional forms (more than
anticipated from the initial positive response from schools/
colleges were needed), 957 completed questionnaires were
returned by end February 2003 (314 from the schools and sixth
form colleges and 643 from the FE colleges, a better response from
FE colleges than schools). Non-response was partly due to schools
(more so than colleges) failing to administer the forms at all, or
students in receipt of forms not completing them. It was clear,
however, that in some cases schools felt very burdened with the
research requirements and although they had been willing in
principle to help at the outset, could not administer the
questionnaire in the available timescale. In two cases (a school and
a sixth form college) no forms were distributed. The survey was
held open for several weeks longer than was originally planned to
maximise the end response.
It is difficult to estimate an overall response rate because we do
not know precisely how many questionnaires were actually
distributed to students. However, taking out the two institutions
that did not distribute any questionnaires, and assuming the
others handed out all of them (which is optimistic as some will not
have distributed them all), this meant a response rate of at least 47
per cent. It succeeded in almost meeting our initial target of 1,000
completed questionnaires.
B.5.5 Response profile
The resulting 957 completed questionnaires provided substantial
numbers of respondents within all of the main minority ethnic
groups (Table B14), allowing analysis at this level, which was
consistent with the overall aims of the study.
There are no directly comparable population statistics for the
sample to enable an assessment of its representativeness by ethnic
group. The sample coverage is likely to be more broadly based in
some respects than the UCAS applicant population in any one
year ie those who make a UCAS application to HE. The latter only
covers full-time undergraduate courses, and also, not all who
apply via UCAS actually take up a place in HE. A comparison
with the first year undergraduate population (home domiciled) in
England showed the sample to be broadly similar in terms of
ethnic profile, though slightly overrepresentative of Pakistani and
Bangladeshi and slightly underrepresentative of Chinese/Asian
Other groups. These differences are likely to be a reflection mainly
of the institutional profile of the sample, in particular:
a) the exclusion of independent schools from the sample (nb
Chinese and Asian Other groups are the most likely groups to
apply to UCAS from independent schools [see main report,
section 2.7]), and
Why the Difference?
185
Table B14: Sample profile by ethnic group
Number
% of total sample
(known ethnicity)
% of minority
ethnic sample
Black African
109
12.0
17.1
Black Caribbean/other
80
8.8
12.5
Pakistani/Bangladeshi
136
14.9
21.2
Indian
184
20.2
28.8
Chinese/Asian other
71
7.8
11.1
Other
59
6.5
9.2
Ethnic group
All minority ethnic
639
70.1
100
White
272
29.9
–
Ethnicity not given
46
–
–
All respondents
957
911
639
Source: IES Survey of potential entrants to higher education, 2002/3
b) the bias in sample selection towards, and higher survey
response from, FE colleges (nb Pakistani and Bangladeshi
students, along with Black students, are more likely than other
groups to enter HE via the FE college route).
An important point to note is that using this sample design meant
that the sample was not representative of all White potential
applicants either, and it may be that White students at other
schools/colleges are not included (with low representation of
minority ethnic groups) have different attitudes to HE than those
we included here.
Key features to note about the make-up of the sample, and
differences between minority ethnic groups and the White group
are:
z Educational institution: Overall, two out of three students in
the achieved sample were at a FE college, even more of White
(77 per cent) than minority ethnic students in aggregate (62
per cent), but this varied considerably between ethnic group.
The lowest proportion, 25 per cent, at a FE college, was among
the Indian group, see Table B15.
z Gender: Almost two-thirds of the sample was female, with
higher female representation among White students compared
with the minority ethnic group in aggregate, see Table B15.
Within the minority ethnic part of the sample, the highest
male representation was among Indians and the lowest among
Black Caribbean/Black Other. The latter is consistent with the
pattern in the undergraduate student population.
z Age: The vast majority of the sample, 86 per cent, were young
people (under age 21 years). The proportion of older potential
HE students (aged 21 year or more) is lower for minority
ethnic groups in aggregate than White students; but it is
186
Why the Difference?
Table B15: Potential HE student sample profile: Total number of respondents by ethnic
group, and each ethnic group analysed by gender, age, father’s occupation and type of
institution
Ethnic group
% aged 21 % with parent in
plus
higher occupation*
% at a FE
college
N
% female
Black African
109
62
21
64
93
Black Caribbean/other
80
72
27
22
81
Pakistani/Bangladeshi
136
62
7
19
71
Indian
184
55
2
37
25
Chinese/Asian other
71
65
12
48
75
Other
59
78
17
46
66
All minority ethnic groups
639
63
12
39
62
White
272
71
18
44
77
Ethnicity not given
46
All
957
65
14
40
67
(N)
(957)
(908)
(834)
(575)
(911)
*As indicated by father’s occupation (or mother’s if not father), in top three SOC groups: managerial professional or
associate professional. But, almost 40 per cent of sample did not give their father’s occupation and more still did not
give mother’s occupation, so reliability in these data is not high.
Source: IES survey of potential entrants to higher education, 2002/3
higher for Black students and highest of all for Black
Caribbean/Black Other (27 per cent), while very low among
Indian and Pakistani/Bangladeshi groups. These variations by
age are also consistent with the pattern in the undergraduate
student population.
z Socio-economic class: The data on socio-economic class from
the survey has reliability problems because a sizeable minority
of the sample (almost 40 per cent) did not provide information
on parental occupation (nb non-response to a question about
parental occupation, which is one of the traditional ways that
socio-economic class is measured, was also a problem in our
undergraduate student survey). Of those that did provide
details, the proportion whose fathers’ (or mothers’, if no
father) occupation was in a managerial, professional, or
associate professional occupation, ie the top three SOC
(Standard Occupational Codes), was slightly lower among
minority ethnic compared with White respondents, and lowest
of all among Black Caribbean/Black Other and Pakistani/
Bangladeshi groups. By contrast, Black Africans recorded the
highest percentage, see Table B15. The only source of
population data we have for comparative purposes is on
UCAS applicants, which shows a much higher socio-economic
class profile among White compared with minority ethnic
groups as a whole than found in this survey, but it also shows
variations between minority ethnic group. It is likely that our
sample of potential students (even with the higher nonresponse) did in fact have a lower socio-economic class profile
Why the Difference?
187
than the UCAS accepted applicant population, mainly a result
of the way the sample of institutions was selected (ie bias
towards colleges, urban areas, no independent schools
included, see above).
z Main religion: Around one-third of the minority ethnic part of
the sample said their main religion was Islam and a further
third said either Hinduism, Buddhism or Sikhism. Only nine
per cent of the minority ethnic sample indicated ‘no religion’,
which compares with 35 per cent of the White part of the
sample. Our undergraduate survey (in 2002, see above) had
slightly higher proportions of Muslim students than shown
here for minority ethnic students, but just under ten per cent
indicated ‘no religion’, compared to over 40 per cent of White
students, which is a similar pattern to here (no other
comparable statistics on religion are available as far as we
know). However, as can be seen in Table B16, the religious
composition of individual minority ethnic groups in the
potential student sample varied considerably.
z Family education background: a higher proportion of Black
African students (72 per cent), than other minority ethnic
groups (59 per cent overall) had a parent or sibling who was
educated to higher education level (ie been to university,
polytechnic, HE college or teacher training college). This is
consistent with the higher socio-economic class profile of
Black African students in our sample. There was little other
variation between minority ethnic groups, and the minority
ethnic figure overall was only slightly higher than for White
students (53 per cent). (Nb in our undergraduate student
survey, slightly more White than minority ethnic students had
family experience of HE [74 versus 66 per cent], but we found
that most Black Africans did, 87 per cent).
z GCSE qualifications: half of all the survey respondents
(White and minority ethnic) who gave information about
GCSEs (the vast majority did) had at least eight GCSEs, grades
A to C. There was little or no difference between the main
minority ethnic groups: Black African students were slightly
more likely than other groups to hold eight or more GCSEs
grades A to C (55 per cent). The mean number of GCSEs for
minority ethnic students responding to the survey was 7.0,
compared with 7.2 for White students (Table B17). As would
be expected, older students (aged 21 and over) had lower prior
attainment levels, averaging just over four GCSEs. Looking at
other qualifications held (other than GCSE), GNVQs and ‘AS’
levels were most often mentioned, and this was more likely
among the older students.
Comparing our results with national statistics suggests that we
surveyed students in post-16 education with above average
attainment, which is what would be expected when focusing on
likely HE entrants. Other research on educational attainment
188
Why the Difference?
Table B16: Ethnicity and religion percentages by ethnicity
Ethnic group
Islam
Hinduism/
Christian/
Buddhism/Sikhism Judaism
No religion/
Base
don’t know/other N=100%
Black African
15
1
79
5
109
Black Caribbean/other
2
1
79
18
79
Pakistani/Bangladeshi
93
3
3
1
136
Indian
12
84
1
3
184
Chinese/Asian other
23
32
22
24
70
Other
25
12
36
27
59
White
1
3
61
35
271
All minority ethnic groups
31
30
30
9
637
All respondents
22
22
39
17
908
Source: IES Survey of potential entrants to higher education, 2002/3
points to much greater variation in GCSE performance among
minority ethnic groups than seen here.
z ‘A’ levels: Over half of the respondents were currently taking
‘A’ and/or ‘AS’ levels only, and a further seven per cent were
studying a mix of ‘A’/’AS’ levels and GNVQs, making almost
two-thirds likely to be gaining ‘A’ level qualifications. The
remainder (35 per cent) were studying for GNVQs and a range
of other qualifications (including GNVQ at foundation,
intermediate and advanced levels, ACVEs, NVQs and Access
qualifications). Sixty per cent of minority ethnic students in
aggregate were studying ‘A’/’AS’ levels only, and this varied
little by minority ethnic group, except for Black Caribbean/
Black other group who were less likely to be (Table B17).
B.5.6 The questionnaire and analysis
An eight page form was designed following consultation between
IES and the DfES, to glean information from students on a range
of issues pertaining to their career and education decision-making.
This is available from IES on request.
The questionnaire data was analysed using SPSS. Mainly cross
tabulations were used, and where differences in tables were found
Table B17: GCSE attainment and whether or not studying for ‘A’ levels
Black
Caribbean
/other
Pakistani/
Bangladeshi
7.5
7.1
6.9
More than 8 GCSEs (%)
55
48
Doing ‘A’/’AS’ levels only (%)
63
Base N=100%
84
Black
African
Mean no. GCSEs
Indian
Chinese/
Asian
other
All
minority
groups
White
6.8
6.9
7.0
7.2
50
47
48
50
54
53
61
61
59
60
54
69
125
172
60
562
245
Source: IES survey of potential entrants to higher education, 2002/3
Why the Difference?
189
they were tested for statistical significance (at the 99 per cent
level). Most findings highlighted in the main report are
statistically significant ones, or close to being so, but the clustered
nature of the sample meant that it was not always appropriate to
only focus on those that are the most significant, as this may be
misleading. We also worked on factor analysis techniques (eg to
reduce the number of influences on decisions taken) but we did
not find the results to be robust or informative enough to warrant
including in the report. Similarly, we looked into applying
multivariate analysis, but also found this did not add greatly to
the analysis presented.
B.5.7 Interview based research
To complement the survey, qualitative interviews were
undertaken with 42 minority ethnic students. They took part in
two main ways:
z telephone interviews
questionnaires (20)
with
those
who
had
completed
z face-to-face interviews arranged directly through the schools/
colleges (22).
At the end of the survey questionnaire, respondents were asked to
indicate if they would be prepared to participate in a follow-up
telephone interview. Of the total 957 respondents, 212 gave their
agreement and contact details for this purpose. From these, 20
students were interviewed — ten from the schools and ten from
the FE colleges, ensuring a range of ethnic, cultural and
biographical backgrounds. In addition, 22 face-to-face interviews
were carried out with individuals studying at two of the schools
and two of the FE colleges, 11 in each. These were arranged with
the help of the contacts at these institutions with whom we are
grateful for their assistance in our work.
The interview schedule is also available on request from IES.
B.6 Employer interviews
This work package involved interviews with a cross section of
recruiters of minority ethnic graduates, plus interviews with a
range of other people and organisations (including chair of
AGR/AGCAS Task Group for Racial Equality in Graduate
Recruitment, the AGR Chief Executive, professional bodies [eg in
teaching, pharmacy, law], the National Mentoring Consortium,
Impact scheme, HE careers advisers). A lunchtime seminar with a
number of AGR members with an interest in diversity issues was
also held. The fieldwork was undertaken from May to September
2003.
190
Why the Difference?
B.6.1 The sample of employers
In total, interviews were undertaken in 20 employing
organisations. These were with graduate recruitment managers,
equality/diversity managers and HR managers (at least two
people in each organisation). They were mainly large recruiters,
which had some experience of recruiting graduates from minority
ethnic backgrounds and an interest in ethnic diversity issues,
though policies and practices in this regard varied. The sample
was largely self-selective, which is virtually unavoidable in this
kind of work. A great many more were contacted but refused to
take part. Usually the reason was being too busy, which also
included many who did not see the relevance of the research to
their business, eg ‘we’re not bothered about class, ethnicity or
background… people all treated the same here’. A few clearly felt that
their diversity practices were not good enough to discuss and be
open about with us (though we did assure them of anonymity). A
great deal of time and effort was spent on the telephone
encouraging employers in particular sectors to take part,
especially smaller ones as we wanted to include some in our
sample, and it was a more protracted business than anticipated.
The majority of the interviews were undertaken in large
organisations with graduate entry programmes. The size of
graduate intakes varied considerably, from ten to over 300 per
year. Most of them also recruited graduates to other kinds of jobs
(outside corporate graduate programmes), though they had very
little knowledge about the ethnic representation there or
recruitment issues specifically related to graduates recruited. Six
of them were public sector organisations. Our initial plan had
been to focus the majority of our sample on three subject areas
where minority ethnic graduates are more numerous — IT, law
and health/biological sciences — where we anticipated finding
employers who were receiving many applications from minority
ethnic graduates. Within the 18, we interviewed in three
IT/communications companies plus three others with IT graduate
entry, two law firms plus a third in the public sector which
recruited law graduates; and one public and one private health
care organisation; the remainder were organisations with
graduate recruitment programmes designed to meet needs of a
number of professional and business areas (eg retail banking,
marketing, commercial functions, general management, financial
services) and where specific degree subjects were less relevant. All
of the organisations, including those outside of our targeted
subjects, reported receiving applications from minority ethnic
graduates (the issue being more to do with their selection than
application, as discussed in Chapter 8).
The focus of the interviews was on minority ethnic graduate
recruitment: how representative minority ethnic groups are in
graduate intakes, employers’ policies and practices to encourage
ethnic diversity in graduate recruitment, and their views on key
Why the Difference?
191
‘enablers’ and ‘inhibitors’ which affect the successful transition of
minority ethnic students into employment.
B.7 Questionnaires and discussion guides
These are available electronically only as they take up
considerable space on paper, and can be obtained on request from
IES (please contact [email protected] or go
to the IES website www.employment-studies.co.uk). The set
comprises:
1. MORI student
interview)
survey
interview
schedule
(face-to-face
2. Student follow-up discussion guide (telephone)
3. MORI graduate survey questionnaire (telephone)
4. Graduate follow-up discussion guide (telephone)
5. MORI parent survey questionnaire (telephone)
6. Parent interview schedule (face-to-face)
7. Potential HE student survey questionnaire (self-completion)
8. Potential HE student interview schedule (telephone and faceto-face)
9. Employer discussion guide (case studies).
192
Why the Difference?
Copies of this publication can be obtained from:
DfES Publications
P.O. Box 5050
Sherwood Park
Annesley
Nottingham
NG15 0DJ
Tel: 0845 60 222 60
Fax: 0845 60 333 60
Minicom: 0845 60 555 60
Oneline: www.dfespublications.gov.uk
© Institute for Employment Studies 2004
Produced by the Department for Education and Skills
ISBN 1 84478 266 2
Ref No: RR552
www.dfes.go.uk/research
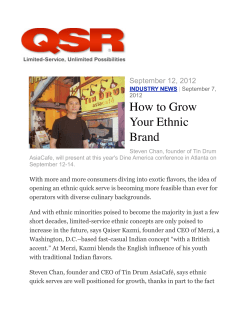


© Copyright 2026