
Document 243070
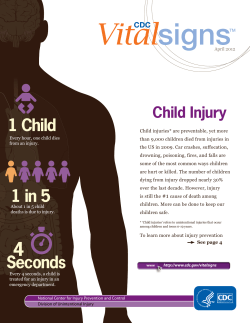
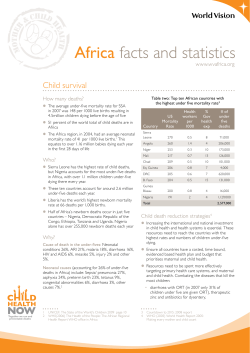
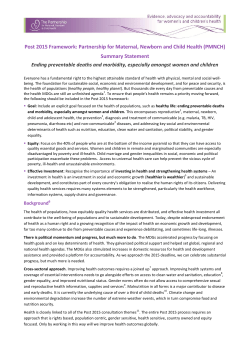
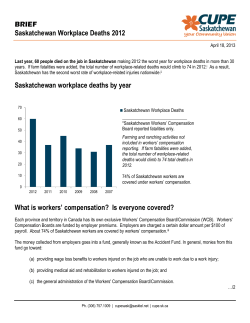
CHILD SURVIVAL I
Child survival I
Where and why are 10 million children dying every year?
Robert E Black, Saul S Morris, Jennifer Bryce
More than 10 million children die each year, most from preventable causes and almost all in poor countries. Six
countries account for 50% of worldwide deaths in children younger than 5 years, and 42 countries for 90%. The causes
of death differ substantially from one country to another, highlighting the need to expand understanding of child health
epidemiology at a country level rather than in geopolitical regions. Other key issues include the importance of
undernutrition as an underlying cause of child deaths associated with infectious diseases, the effects of multiple
concurrent illnesses, and recognition that pneumonia and diarrhoea remain the diseases that are most often
associated with child deaths. A better understanding of child health epidemiology could contribute to more effective
approaches to saving children’s lives.
Substantial reductions in child mortality occurred in lowincome and middle-income countries in the late 20th
century, but more than 10 million children younger than
5 years still die every year.1,2 In this article, the first in a
series of five, we consider reasons for these deaths and
provide recommendations for how they can be prevented.
Rates of decline in worldwide child mortality peaked in
about 1980.1 In 1990–2001, the number of child deaths
fell by 1·1% every year, compared with 2·5% per year
during 1960–90.3 Although this deceleration might be
expected in areas that had already achieved low rates of
mortality, such slowing has also occurred in high-rate
regions. Sub-Saharan Africa had the highest child
mortality in 1970–74, but in the years since has had the
slowest fall in rate.1 South Asia also had a high rate of
child deaths in the 1970s, and despite a 50% drop in
mortality, almost one in ten children in this region still
dies before their fifth birthday.1
Child mortality varies among world regions, and these
differences are large and increasing. In 1990, there were
180 deaths per 1000 livebirths in sub-Saharan Africa and
only 9 per 1000 in industrialised countries—a 20-fold
difference.4 In 2000, this gap had increased to 29-fold
with mortality rates of 175 and 6 per 1000 children in
sub-Saharan Africa and industrialised countries,
respectively.4
The World Summit for Children in 1990 called for a
worldwide reduction in child mortality to below 70 deaths
per 1000 livebirths (or a one-third reduction if this yielded
a lower mortality rate) by the year 2000.4 Unfortunately,
investments in health systems and interventions necessary
to achieve such a reduction in the 1990s were not
Lancet 2003; 361: 2226–34
See Commentary page 2172
Johns Hopkins Bloomberg School of Public Health, Baltimore, MD,
USA (Prof R E Black MD); Department of Epidemiology and
Population Health, London School of Hygiene and Tropical
Medicine, London, UK (S S Morris PhD); and 25 rue du Bugnon,
St Genis-Pouilly, 10630 France (J Bryce EdD)
Correspondence to: Prof Robert E Black, Department of International
Health, Johns Hopkins Bloomberg School of Public Health,
Baltimore, MD 21205, USA
(e-mail: [email protected])
2226
commensurate with needs. The mortality reduction target
was reached for only five of 55 countries with an under-5year mortality rate of 100 or more in 1990.4
In 2002, as part of the millennium development goals
for health, nations pledged to ensure a two-thirds
reduction in child mortality by 2015, from the base year
1990.5 In addition to setting such a goal, the global public
health community must critically assess how it can be
accomplished. A realistic picture of a country’s
epidemiological profile and the capabilities of its health
system is needed before appropriate public health
interventions can be developed and implemented.
Development of these interventions also requires an
understanding of the determinants of child mortality.
These determinants include, at the most distant level,
socioeconomic factors, such as income, social status, and
education, which work through an intermediate level of
environmental and behavioural risk factors.6 These risk
factors, in turn, lead to the proximal causes of death
(nearer in time to the terminal event), such as
undernutrition, infectious diseases, and injury. In this
paper, we will focus on proximal causes of death and on
selected environmental and behavioural risk factors. The
fourth article in this series will address the socioeconomic
determinants of child mortality.
Where do most child deaths occur?
The estimate for global child deaths in 2000 is
10·8 million.7 In this series, data from 2000 will be used
throughout because they are most complete for this
period and little has changed in the past 2 years. About
41% of child deaths occur in sub-Saharan Africa and
another 34% in south Asia.7 Because there is substantial
variation in death rates within these regions, planning
for health interventions should take place at a national
level. The incomplete and unreliable nature of these
Search strategy
The search strategy for the model used to estimate
proportionate causes of death has been described.32
Estimates of the importance of risk factors were taken from
published results.12 For our comorbidity analyses we also
contacted researchers and directors of demographic
surveillance areas in low-income and middle-income countries.
THE LANCET • Vol 361 • June 28, 2003 • www.thelancet.com
For personal use. Only reproduce with permission from The Lancet.
CHILD SURVIVAL I
Countries ranked by total
number of child deaths
Number of
child deaths*
Under-5-year
mortality-rate rank†
Countries ranked by under5-year mortality rate
Under-5-year mortality rate Number of child
(per 1000 births)
deaths rank
India
Nigeria
China
Pakistan
D R Congo
Ethiopia
Bangladesh
Afghanistan
Tanzania
Indonesia
Angola
Niger
Mozambique
Uganda
Myanmar
Mali
Brazil
Kenya
Sudan
Burkina Faso
Iraq
Somalia
Yemen
Côte d’Ivoire
Malawi
Madagascar
Zambia
Cameroon
Philippines
South Africa
Nepal
Egypt
Chad
Iran
Mexico
Sierra Leone
Turkey
Ghana
Cambodia
Viet Nam
Guinea
Rwanda
2 402 000
834 000
784 000
565 000
484 000
472 000
343 000
251 000
223 000
218 000
169 000
156 000
155 000
145 000
132 000
128 000
127 000
125 000
116 000
104 000
104 000
100 000
97 000
97 000
96 000
93 000
88 000
83 000
82 000
77 000
76 000
76 000
73 000
71 000
70 000
69 000
66 000
65 000
63 000
63 000
62 000
54 000
54
17
88
43
9
21
57·5
4
23
76·5
3
2
11·5
36
43
6
92
39
45·5
13
34
7
43
22
15
30·5
10
26
88
66·5
54
80
11·5
82·5
101·5
1
80
49
32
91
20
16
Sierra Leone
Niger
Angola
Afghanistan
Liberia
Mali
Somalia
Guinea-Bissau
D R Congo
Zambia
Chad
Mozambique
Burkina Faso
Burundi
Malawi
Rwanda
Nigeria
Mauritania
Central African Republic
Guinea
Ethiopia
Côte d’Ivoire
Tanzania
Benin
Equatorial Guinea
Cameroon
Djibouti
Swaziland
Togo
Senegal
Madagascar
Cambodia
Lesotho
Iraq
Gambia
Uganda
Haiti
East Timor
Kenya
Zimbabwe
Eritrea
Yemen
316
270
260
257
235
233
225
215
205
202
200
200
198
190
188
187
184
183
180
175
174
173
165
160
156
154
146
142
142
139
139
135
133
130
128
127
125
124
120
117
114
110
36
12
11
8
51
16
22
70
5
27
33
13
20
44
25
42
2
59
54
41
6
24
9
46
89
28
88
85
55
45
26
39
73
21
79
14
52
90
18
43
63
23
*Number of deaths estimated by multiplying the number of livebirths8 by the under-5-year mortality rate7 and by a life-table based adjustment factor that slightly
reduces the number of deaths if the yearly number of births has increased over the previous quinquennium and slightly increases it if births have fallen.9 †Decimal
places indicate that two countries were equally ranked.
Table 1: Countries ranked by total child (under-5-year) deaths or by under-5-year mortality rates in 2000
data in many countries can make this task difficult, so
assessment of the needs and possible interventions
for more homogeneous groups of countries is also
worthwhile.
A few countries account for a very large proportion of
all child deaths. In fact, half of worldwide deaths in
children younger than 5 years occur in only six countries,
and 90% in 42 countries (table 1).7–9 However, the order
of countries differs when ranked by child mortality rate
rather than by number of deaths, in that countries in subSaharan Africa with quite small population sizes dominate
the highest ranks (table 1); thus, the first 42 countries
ranked by mortality rate constitute only 44% of child
deaths worldwide.
Figure 1 shows that deaths are concentrated in some
regions, in particular south Asia and sub-Saharan Africa.
Even within countries, spatial variation in mortality rates
can be large. In India, for example, the 1998–99 national
family health survey found that mortality rates for children
younger than 5 years varied from 18·8 per 1000 births in
Kerala to 137·6 per 1000 in Madhya Pradesh.10
Although most child deaths in these countries occur in
rural areas, urban slum populations can have especially
high child mortality rates. For example, children in the
slums of Nairobi, Kenya, have mortality rates much
higher than rural Kenyan children (150·6 per 1000
livebirths vs 113·0, respectively).11
Risk factors for child mortality
Unhygienic and unsafe environments place children at risk
of death.2,12 Ingestion of unsafe water, inadequate
availability of water for hygiene, and lack of access to
sanitation contribute to about 1·5 million child deaths and
around 88% of deaths from diarrhoea.2,12 Other healthrelated behaviours, such as birth spacing, are also
important risk factors for child mortality.13
Infants aged 0–5 months who are not breastfed have
seven-fold and five-fold increased risks of death from
diarrhoea and pneumonia, respectively, compared with
infants who are exclusively breastfed.14 At the same age,
non-exclusive rather than exclusive breastfeeding results in
more than two-fold increased risks of dying from
diarrhoea or pneumonia.15 6–11-month-old infants who
are not breastfed also have an increased risk of such
deaths.16
Child deaths are commonly the result of several risk
factors. In the future, the joint effects of two or more risk
factors on each underlying or associated cause of death
should be estimated together.17 Thus, the total effect of
interventions to prevent or mitigate the effects of various
sets of risk factors could be established.
Underlying causes of death
WHO’s work on the global burden of disease, consistent
with the International Classification of Diseases (ICD),
THE LANCET • Vol 361 • June 28, 2003 • www.thelancet.com
For personal use. Only reproduce with permission from The Lancet.
2227
O C E A N
Oxford Cartographers 2003
OCEAN
OCEAN
PAC I F I C
ATLANTIC
I N D I A N
OCEAN
PAC I F I C
CHILD SURVIVAL I
Figure 1: Worldwide distribution of child deaths
Each dot represents 5000 deaths.7–9
2228
THE LANCET • Vol 361 • June 28, 2003 • www.thelancet.com
For personal use. Only reproduce with permission from The Lancet.
CHILD SURVIVAL I
interventions. Vital event registration that includes causeof-death data is used to establish the cause structure of
mortality in high-income and some middle-income
countries, but these are generally not available for the
countries where 90% of child deaths take place. Of these
countries, only Mexico records more than 95% of causes
of death.27 Where coverage is incomplete, the poorer
segments of the population, which have higher mortality
and might have different causes of death, are often underrepresented.28 India and China have attempted to
establish sample registration systems, but it is not yet clear
whether they are truly representative and correctly classify
causes of child deaths. Classification of cause of death in
vital registration systems is difficult when large
proportions of child deaths are not medically attended,
and interviews with family members are needed to
establish the cause of death.
Alternatives to the reporting of vital events are use of
data from nationally-representative surveys and special
study populations. With these, ascertainment of death is
usually very complete and post-mortem interviews with
family members are used to establish causes of death.
Although post-mortem interviews have only moderate
sensitivity or specificity for some diagnoses, standard
methods for data collection and analysis can improve
diagnostic accuracy and comparability.29
Neonatal disorders
Of the 10·8 million deaths worldwide of children younger
than 5 years, 3·9 million occur in the first 28 days of life—
ie, the neonatal period. The proportion of deaths that
occur in this age interval varies systematically according to
the overall rate of mortality. For example, our analysis of
results from 44 demographic and health surveys30 showed
that in populations with the highest child mortality rates,
just over 20% of all child deaths occurred in the neonatal
period, but in countries with mortality rates lower than
35 per 1000 livebirths more than 50% of child deaths
were in neonates (figure 2). Regression of the proportion
of deaths in the neonatal period on the proportion of child
deaths due to AIDS in that country showed a strong
association. We used a combination of the natural
logarithm of the rate of deaths in children younger than
5 years and the proportion of such deaths attributable to
AIDS to predict the proportion of deaths in the neonatal
period (r2=0·76). Predicted deaths were deducted from
the neonatal-plus-other category of deaths.
Proportion of neonatal deaths per survey (%)
stipulates one cause of death, which is considered to be
the “disease or injury which initiated the train of morbid
events leading directly to death”.18 This measure ensures
that the sum of deaths from all possible causes will not
exceed the total number of child deaths. However, such a
classification oversimplifies the situation in low-income
and middle-income countries where serious illnesses
commonly occur sequentially or concurrently before
death.
Measles is often complicated by pneumonia or
diarrhoea. In studies in Bangladesh, the Philippines, and
Uganda it was noted that in children with an illness
serious enough to require admission to hospital, 50–79%
of measles cases were followed by pneumonia or
diarrhoea, which were the reasons for admission.19–21
Decreases in the immune and non-immune host defences
as a consequence of measles lead to a high rate of these
subsequent infectious diseases, and also to a higher case
fatality rate when they do occur. Likewise, children with
AIDS have increased susceptibility to diarrhoea,
pneumonia, tuberculosis, and other infections. These
diseases also have a higher case fatality rate in people with
AIDS compared with those without AIDS. In these
examples, measles or AIDS would be judged by ICD rules
to be the underlying cause of death and subsequent
infections would be associated causes of death.
Underweight status (one SD or more below the weight
expected for that age in an international reference
population) and micronutrient deficiencies also cause
decreases in immune and non-immune host defences, and
should be classified as underlying causes of death if
followed by infectious diseases that are the terminal
associated causes.22,23 An analysis of ten longitudinal
community-based studies of children younger than 5 years
showed that being underweight conferred an additional
risk of mortality from infectious diseases.24 The fraction of
disease attributable to being underweight was 61% for
diarrhoea, 57% for malaria, 53% for pneumonia, 45% for
measles, and 53% for other infectious diseases. Fetal
malnutrition, manifested in low birthweight, might
contribute in a similar way to neonatal mortality.24 Relative
risks for mortality in children younger than 5 years derived
from the ten studies assessed have been used to estimate
that 53% of all child deaths could be attributed to being
underweight (L Caulfield, personal communication). Of
these, 35% of all child deaths are due to the effect of
underweight status on diarrhoea, pneumonia, measles,
and malaria and relative risks of low maternal body-mass
index for fetal growth retardation and its risks for selected
neonatal causes of deaths.12,24
In children with vitamin A deficiency, the risk of dying
from diarrhoea, measles, and malaria is increased by
20–24%.25 Likewise, zinc deficiency increases the risk of
mortality from diarrhoea, pneumonia, and malaria by
13–21%.26 The fraction of these infectious-disease deaths
that are attributable to nutritional deficiencies varies with
the prevalence of deficiencies; the highest attributable
fractions are in sub-Saharan Africa, south Asia, and
Andean Latin America.12 Correct classification of
undernutrition and vitamin A and zinc deficiencies as
underlying causes of death will permit a true estimate of
the importance of these conditions and recognition that
interventions can target both the nutritional condition and
the resulting terminal infectious diseases.
70
60
50
40
30
20
10
0
0
50
100
150
200
250
300
Under-5-year mortality rate (per 1000) per survey
Clinical causes of death
Classification
All countries need sound epidemiological information to
prioritise, plan, and implement public health
Figure 2: Relation between under-5-year mortality rate and
percentage of these deaths in neonates
Each dot=one survey.
THE LANCET • Vol 361 • June 28, 2003 • www.thelancet.com
For personal use. Only reproduce with permission from The Lancet.
2229
CHILD SURVIVAL I
40
Distribution of causes of death: comparison of
WHO mortality database and cause-of-death model
35
Proportion of deaths due
to being underweight
Proportion of child deaths (%)
30
25
20
15
10
5
*
0
a
ia
er
al
ria
oe
th
on
la
at rs
h
O
a
r
n
m
o de iar
M
eu
Ne isor
D
Pn
d
Cause of death
s
DS
sle
AI
ea
M
wn
no
k
Un
Figure 3: Distribution of global child deaths by cause
Bars=uncertainty bounds. *Work in progress to establish the causespecific contribution of being underweight to neonatal deaths.
There is a paucity of information about the direct
causes of neonatal deaths in low-income communities,
but it has been estimated that 24% are caused by severe
infections, 29% by birth asphyxia, 24% by complications
of prematurity, and 7% by tetanus.31
Distribution of causes of death globally
We used a prediction model to estimate the distribution
of deaths in children younger than 5 years by cause for
the 42 countries with 90% of all such deaths in 2000.32
Estimates and uncertainty bounds were: 22% of deaths
attributed to diarrhoea (14–30%), 21% to pneumonia
(14–24%), 9% to malaria (6–13%), 1% to measles
(1–9%), 3% to AIDS, 33% to neonatal causes
(29–36%), 9% to other causes, and fewer than 1% to
unknown causes (figure 3). No uncertainty bounds are
available for the AIDS estimate because the model did
not produce these data (country-level estimates from
UNAIDS were used).33 Figure 3 also shows the fraction
of deaths attributed to various causes in which the
underlying cause was being underweight.
Comparison with WHO estimates
Estimates of mortality rates in children younger than
5 years in 2000 by cause are published on the
WHO website,34 and are being revised (C Mathers,
personal communication). Estimates available at the
time of writing attribute 13% of deaths to diarrhoea,
19% to pneumonia, 9% to malaria, 5% to measles,
3% to AIDS, 42% to neonatal causes (birth asphyxia,
low birthweight, and disorders arising in the perinatal
period), and 9% to miscellaneous other causes,
including non-communicable diseases and injury.
Uncertainty bounds for the WHO estimates are not
available.
Our estimates are not comparable with those of WHO,
because WHO’s estimates include all WHO member
states rather than only 42 countries. Nevertheless, both
sets of estimates are generally consistent. WHO and the
prediction model identify pneumonia, diarrhoea, and
malaria as causing the greatest numbers of deaths in
2230
Uniquely, in the 42 countries where 90% of child deaths take
place, Mexico has a vital registration system that is
considered complete.27 Therefore, the coverage of the system
is 95% or more and implies that there is unlikely to be any
substantial selection bias in the proportional distribution of
mortality by cause in children younger than 5 years in the vital
registration data. We are, therefore, able to validate the
predictions of the cause-of-death model using vital
registration-based data from Mexico, provided by the
Department of Evidence and Information for Policy of WHO
(table 2).34 The following points are of note.
● The model classes all deaths from infectious respiratory
illnesses as pneumonia, on the basis that other respiratory
illnesses are very rarely fatal, even in young children.
● The model judges undernutrition to be an underlying cause
of most infectious illness, and rejects the idea that a few
deaths can be singled out as exclusively attributable to
nutritional deficiencies. Those deaths ascribed in the WHO
mortality database to nutritional deficiencies (3·1%) are
therefore reallocated to infectious causes in proportion to
their single disease frequencies.
● The model defines neonatal deaths on the basis of a time
period (first month of life), which is expected to be roughly
equivalent to the sum of deaths from three categories in
WHO data—ie, disorders arising during the perinatal
period, congenital anomalies, and tetanus. Sepsis deaths
in the neonatal period are included in the model but not
the WHO estimates, leading to divergence in these values.
● The WHO mortality database does not include a category of
deaths due to undetermined causes, because these are
reallocated to all causes in proportion to their frequencies.
For the model, 0·1% of deaths were in this category.
In the case of Mexico, the WHO mortality database and the
cause-of-death prediction model lead to almost identical
conclusions about the proportional distribution of deaths by
cause in children younger than 5 years. The model results
suggest slightly more neonatal deaths (in part because of the
difference in definition of this category), and correspondingly
fewer deaths from diarrhoea and pneumonia.
children younger than 5 years. A comparison of
proportional mortality by cause derived from the
prediction model with the proportions available for
Mexico suggests that our model is predicting reasonably
well in this context (panel and table 2).
A careful analysis of the differences between the
estimates produced by the two approaches, and the
reasons for these, will contribute to an understanding of
the relative strengths and weaknesses of different sources
of child mortality data and different methodological
approaches, for all-cause child mortality and for major
causes. Methodological work is underway and is
expected to lead to updated estimates and reproducible
methods that can be applied regularly as new and better
data on the causes of child mortality become available.
Proportion of deaths
Neonatal
Diarrhoea
Respiratory infections
AIDS
Other
WHO
Model
47·9%
17·5%
10·4%
0·1%
24·1%
52·6%
14·1%
8·2%
0·3%
24·7%
Table 2: Distribution of causes of death in WHO database and
cause-of-death model
THE LANCET • Vol 361 • June 28, 2003 • www.thelancet.com
For personal use. Only reproduce with permission from The Lancet.
OCEAN
Oxford Cartographers 2003
Profile 5
Profile 4
Profile 3
Profile 2
Profile 1
OCEAN
OCEAN
PAC I F I C
ATLANTIC
INDIAN
OCEAN
PAC I F I C
CHILD SURVIVAL I
Figure 4: Cause-of-death profiles for 42 countries with 90% of
child deaths
THE LANCET • Vol 361 • June 28, 2003 • www.thelancet.com
For personal use. Only reproduce with permission from The Lancet.
2231
CHILD SURVIVAL I
A review of the various models used to estimate under-5year deaths due to measles is scheduled for later in 2003.
Country typologies by major causes of death
The cause structure of deaths in children younger than
5 years is determined by many environmental and
behavioural factors that are often proxied by broad
geographical groupings—eg, the countries of sub-Saharan
Africa are frequently grouped together. We used the
prediction model to estimate that in sub-Saharan Africa
the distribution of causes of death would be: neonatal
disorders (25%), malaria (22%), pneumonia (21%),
diarrhoea (20%), and AIDS (8%). This aggregation is
misleading because some countries in sub-Saharan Africa
have very little malaria, and others have very few AIDS
deaths; whereas others are severely affected by malaria,
AIDS, or both.
We propose an alternative way to group countries on the
basis of the proportions of death from each major cause. In
the 42 countries we considered, the proportions of deaths
caused by pneumonia and diarrhoea were fairly consistent,
whereas the proportions for malaria, AIDS, and deaths in
the neonatal period differed strikingly between countries.
The method of grouping is based on causes of death and
consists of five profiles.
1. Malaria and AIDS each account for fewer than 10%
of deaths and neonatal causes for fewer than 40%.
2. Malaria accounts for at least 10%, but AIDS
accounts for fewer than 10%.
3. Malaria and AIDS each account for fewer than 10%
and neonatal causes for at least 40%.
4. Both malaria and AIDS account for at least 10%.
5. Malaria accounts for fewer than 10% and AIDS for at
least 10% of deaths.
The 42 countries accounting for 90% of all under-5-year
deaths are represented in each of the five profiles
(figure 4). Countries in profile 1 (average under-5 year
mortality rate 109 per 1000) account for most deaths; in
these countries, 24% of deaths are attributed to each of
diarrhoea and pneumonia and 34% to causes in the
neonatal period (figure 5). In profile 2 countries (181 per
1000) 20–26% of deaths are attributed to each of
diarrhoea, pneumonia, malaria, and neonatal deaths. In
the third largest profile (41 per 1000) diarrhoea and
pneumonia account for 23% and 15% of deaths,
respectively, but 48% of all deaths are in neonates. Profile
4 (169 per 1000) has 17–19% of deaths attributed to each
of diarrhoea and pneumonia and 26% to malaria. In the
smallest group, profile 5 (106 per 1000), diarrhoea and
pneumonia each account for about 20% of deaths, malaria
for 6%, and AIDS for 23%.
Our analysis shows that diarrhoea and pneumonia
account for large proportions of deaths in all profiles, even
as rates of death fall. Together, they do become somewhat
less important at low mortality rates, as in profile 3, in
which nearly half of all deaths are in neonates. As mortality
rates fall, the proportion of deaths in the neonatal period
will increase, which should lead the public health
community to increase and improve interventions to
prevent deaths in newborns.
Comorbidity in child deaths
Synergy in causes of death
An interaction of two health disorders can have a synergistic
effect on mortality—ie, a rate of death that is greater than
the sum of the two individual rates of mortality. This has
been documented most clearly for the relation between
being underweight and infectious diseases.24,35 For example,
children who are mildly underweight (–2⭐z scores<–1)
have about a two-fold higher risk of death than those who
are better nourished. This risk increases to 5–8 fold in
moderately (–3⭐z scores<–2) to severely (<–3 z scores)
underweight children.24
Co-occurrence of infectious diseases
Another form of comorbidity is the co-occurrence of two
infectious diseases, which can occur by chance. More
commonly, however, two diseases occur together because
Profile 1
Profile 2
2·6 million
deaths
(27%)
4·5 million
deaths
(47%)
Diarrhoea
Malaria
AIDS
Other
Pneumonia
Measles
Neonatal
disorders
Profile 4
Profile 3
Profile 5
1·6 million
deaths
(17%)
0·8 million
deaths
(8%)
0·3 million
deaths
(3%)
Figure 5: Distribution of child deaths by cause in five profiles for the 42 countries with 90% of global child deaths in 2000
2232
THE LANCET • Vol 361 • June 28, 2003 • www.thelancet.com
For personal use. Only reproduce with permission from The Lancet.
CHILD SURVIVAL I
they have the same environmental or behavioural risk
factors, such as poor sanitation or no breastfeeding in
infancy, leading to increased exposure to infections. This
comorbidity may also result in synergism, leading to an
increased risk of death.
In the past 10 years, it has become more common for
studies to include multiple-cause classifications such as
diarrhoea plus pneumonia in the causes of death of young
children in low-income countries. We did a systematic
search for all studies of causes of death of children younger
than 5 years in developing countries32 and identified eight
published studies done in Bangladesh, Egypt, the
Philippines, and Guinea.15,36–41 Unpublished studies from
Bangladesh and Haiti were also found (H Perry, personal
communication). In these studies, reported proportions of
deaths attributed to diarrhoea—as a sole cause or in
combination with another cause—varied from 15% to
44%. Deaths from pneumonia varied from 20% to 42%,
and deaths attributed to two causes in combination varied
from 4% to 16%. These proportions can be combined with
the overall risk of a child from the same population dying
before their fifth birthday to obtain risks of dying from
diarrhoea, pneumonia, or both diseases in combination.
To show that comorbidity is an important public health
problem, it needs to be established whether deaths from
causes in combination are greater than would be expected
if each cause acted independently. Multiplication of the
risk of death from diarrhoea by the risk from pneumonia
allows estimation of the risk of death expected from the
random co-occurrence of the two causes, assuming no
shared risk factors and no synergy. In the ten studies we
assessed, co-occurrence was between 2·7 and 34·2
(median 8·7) times greater than that expected if synergy
and risk factors were not present. This finding suggests
either that there are shared risk factors for severe diarrhoea
and severe pneumonia, or that the two disorders together
synergistically provoke death in affected children. Most
likely, both mechanisms operate, because even the most
powerful shared risk factors, such as not breastfeeding,
could not account for such a substantial increase in risk of
death with both causes present.
Conclusions
Child health epidemiology is developing and increasingly
can provide information useful for public health planning,
monitoring, and evaluation. Ideally, information on causes
and determinants of death would be available for planning
at national or subnational levels. Our epidemiological
profiles show the extent of variation between major causes
of death even within commonly used regional groupings,
which highlights the need for disaggregation at regional
and global levels to allow public health intervention efforts
to be focused appropriately. The availability of valid
epidemiological information at country level will be an
important determinant of success in meeting and in
measuring progress toward the millennium development
goal for child survival.5 Expanded efforts to build capacity
and to improve the completeness and accuracy of available
data are needed.
Clearly, pneumonia and diarrhoea will continue to be
important causes of child deaths until mortality falls to
very low rates. Furthermore, nearly two-thirds of deaths in
the 42 countries analysed (and 57% of child deaths
worldwide) occur in just 19 countries where the
predominant causes are pneumonia, diarrhoea, and
neonatal disorders—with very little contribution from
malaria and AIDS. On the other hand, malaria plays an
important part in child mortality in many countries in subSaharan Africa. AIDS accounts for more than 10% of
deaths in just three of the 42 countries; however, in some
smaller countries, such as Botswana and Zimbabwe, AIDS
causes more than half of child deaths.33
Undernutrition is the underlying cause of a substantial
proportion of all child deaths, and better information on
its determinants is needed. The identification of risk
factors, detection of underlying and associated causes of
death, and recognition of comorbidity can lead to
selection of effective and affordable interventions that are
appropriate for national delivery systems.
Contributors
R Black, S Morris, and J Bryce conceived the idea for this article and
wrote the paper.
Conflict of interest statement
None declared.
Acknowledgments
Barbara Ewing provided essential help with the preparation of the figures
and references. Colin Mathers reviewed earlier drafts of the manuscript
and offered useful suggestions on how it could be improved. Members of
the Child Health Epidemiology Reference Group (CHERG) who
contributed systematic reviews and analyses that have been partly used
include Harry Campbell and Igor Rudan (pneumonia);
Cynthia Boschi-Pinto, Claudio Lanata, and Walter Mendoza (diarrhoea);
Rick Steketee and Alex Rowe (malaria); and Joy Lawn and
Zulfiqar Bhutta (neonatal causes). This work was funded by Bill and
Melinda Gates Foundation, WHO Department of Child and Adolescent
Health and Development, and Johns Hopkins Family Health and Child
Survival Cooperative Agreement with the US Agency for International
Development. Substantial work was done during a conference supported
by the Rockefeller Foundation at the Bellagio Study and Conference
Center. The sponsors had no role in these analyses or the preparation of
the manuscript. The views represented in this article are those of the
individual authors and do not represent the views of their institutions.
References
1
2
3
4
5
6
7
8
9
10
11
12
13
14
Ahmad OB, Lopez AD, Inoue M. The decline in child mortality: a
reappraisal. Bull World Health Organ 2000; 78: 1175–91.
WHO. The world health report 2002: reducing risks, promoting
healthy life. Geneva: World Health Organization, 2002.
UNICEF. State of the world’s children 2003. New York: UNICEF,
2002.
UNICEF. Progress since the world summit for children: a statistical
review. New York: UNICEF, 2001. http://www.unicef.org/pubsgen/
wethechildren-stats/sgreport_adapted_stats_eng.pdf (accessed March
24, 2003).
UN. General assembly, 56th session. Road map towards the
implementation of the United Nations millennium declaration: report
of the Secretary-General (UN document no. A/56/326). New York:
United Nations, 2001.
Mosley WH, Chen LC. An analytical framework for the study of child
survival in developing countries. Popul Develop Rev 1984; 10 (suppl):
25–45.
UNICEF. Child mortality statistics. http://www.childinfo.org/cmr/
revis/db2.htm (accessed Feb 20, 2003).
United Nations Population Division. World population prospects,
the 2000 revision. New York: United Nations Population Division,
2001.
Hill K, Pande R, Mahy M, Jones G. Trends in child mortality in the
developing world 1960 to 1996. New York: UNICEF, 1998.
International Institute for Population Sciences and ORC Macro. 2000
national family health survey (NFHS-2), 1998–99: India, Mumbai.
Calverton: ORC Macro, 2000.
African Population and Health Research Center. Population and
health dynamics in Nairobi’s informal settlements. Nairobi, 2002.
http://www.aphrc.org/publication/reports4.html (accessed May 21,
2003).
Ezzati M, Lopez AD, Rodgers A, Vander Hoorn S, Murray CJL, and
the Comparative Risk Assessment Collaborating Group. Selected
major risk factors and global and regional burden of disease. Lancet
2002; 360: 1347–60.
Setty-Venugopal V, Upadhyay UD. Birth spacing: three to five saves
lives. Population Reports, series L, no 13. Baltimore: Johns Hopkins
Bloomberg School of Public Health, Population Information Program,
2002.
Victora CG, Smith PG, Vaughan JP, et al. Infant feeding and deaths
due to diarrhea: a case-control study. Am J Epidemiol 1989; 129:
1032–41.
THE LANCET • Vol 361 • June 28, 2003 • www.thelancet.com
For personal use. Only reproduce with permission from The Lancet.
2233
CHILD SURVIVAL I
15 Arifeen S, Black RE, Antelman G, Baqui A, Caulfield L, Becker S.
Exclusive breastfeeding reduces acute respiratory infection and
diarrhoea deaths among infants in Dhaka slums. Pediatrics 2001; 108:
E 67.
16 WHO Collaborative Study Team on the Role of Breastfeeding on the
Prevention of Infant Mortality. Effect of breastfeeding on infant and
child mortality due to infectious diseases in less developed countries: a
pooled analysis. Lancet 2000; 355: 451–55.
17 Ezzati M, Vander Hoorn V, Rodgers A, Lopez AD, Mathers CD,
Murray CJL, and the Comparative Risk Assessment Collaborating
Group. Potential health gains from reducing multiple major risk
factors: global and regional estimates. Lancet (in press).
18 ICD 9 CM. Millennium edition. Vol 1 and 2. Los Angeles: Practice,
Management Information Corporation [PMIC], 2000.
19 Kalter HD, Schillinger JA, Hossain M, et al. Identifying sick children
requiring referral to hospital in Bangladesh. Bull World Health Organ
1997; 75 (suppl 1): 65–75.
20 Kalter HD, Gray RH, Black RE, Gultiano SA. Validation of
postmortem interviews to ascertain selected causes of death in
children. Int J Epidemiol 1990; 19: 380–86.
21 Kolstad PR, Burnham G, Kalter HD, Kenya-Mugisha N, Black RE.
The integrated management of childhood illness in western Uganda.
Bull World Health Organ 1997; 75 (suppl 1): 77–85.
22 Scrimshaw NS, SanGiovanni JP. Synergism of nutrition, infection,
and immunity: an overview. Am J Clin Nutr 1997; 66 (suppl):
464–77.
23 Shankar AH, Prasad AS, Zinc and immune function: the biological
basis of altered resistance to infection. Am J Clin Nutr 1998; 66
(suppl): 447–463.
24 Fishman S, Caulfield LE, de Onis M, et al. Childhood and maternal
underweight. In: Ezzati M, Lopez AD, Rodgers A, Murray CJL, eds.
Comparative quantification of health risks: global and regional burden
of disease attributable to selected major risk factors. Geneva: World
Health Organization (in press).
25 Rice AL, West KP, Black RE. Vitamin A deficiency. In: Ezzati M,
Lopez AD, Rodgers A, Murray CJL, eds. Comparative quantification
of health risks: global and regional burden of disease attributable to
selected major risk factors. Geneva: World Health Organization (in
press).
26 Caulfield L, Black RE. Zinc deficiency. In: Ezzati M, Lopez AD,
Rodgers A, Murray CJL, eds. Comparative quantification of health
risks: global and regional burden of disease attributable to selected
major risk factors. Geneva: World Health Organization (in press).
27 Lopez AD, Ahmad OB, Guillot M, Inoue M, Ferguson BD,
Salomon JA. Life tables for 191 countries for 2000: data, methods,
2234
28
29
30
31
32
33
34
35
36
37
38
39
40
41
results. GPE discussion paper number 40. Geneva: World Health
Organization, 2001.
Barreto ICHC, Pontes LK, Corrêa L. Vigilância de óbitos infantis em
sistemas locais de saúde: avaliação da autópsia verbal e das
informações de agentes de saúde (Portuguese). Rev Panam Salud
Publica 2000; 7: 303–12.
Anker M, Black RE, Coldham C, et al. A standard verbal autopsy
method for investigating cause of death in infants and children.
Geneva: World Health Organization, 2001.
Demographic and health surveys. STAT compiler.
http://www.measuredhs.com (accessed Feb 26, 2003).
Save the Children. Report of the state of the world’s newborns.
http://www.savethechildren.org/mothers/newborns/ (accessed March
31, 2003).
Morris SS, Black RE, Tomaskovic L. Predicting the distribution of
under-five deaths by cause in countries without vital registration
systems. Int J Epidemiol (in press).
UNAIDS. Global report on HIV/AIDS epidemic. Geneva: UNAIDS,
2002.
Mathers CD, Stein C, Fat DM, et al. Global burden of disease 2000:
version 2, methods and results. http://www.who.int/evidence (accessed
March 14, 2003)
Pelletier DL, Frongillo EA, Habicht JP. Epidemiologic evidence for a
potentiating effect of malnutrition on child mortality. Am J Public
Health 1993; 83: 1130–33.
Baqui AH, Black RE, Arifeen S, Hill K, Mitra SN, Sabir AA.
Causes of childhood death in Bangladesh: results of a nation-wide
verbal autopsy study. Bull World Health Organ 1998; 76:
154–71.
Baqui AH, Sabir AA, Begum N, Arifeen SE, Mitra SN, Black RE.
Causes of childhood deaths in Bangladesh: an update. Acta Paediatr
2001; 90: 682–90.
Becker S, Waheeb Y, El Deeb B, Khallaf N, Black R. Estimating the
completeness of under-5 death registration in Egypt. Demography
1996; 33: 329–39.
Yassin KM. Incidence and sociodemographic determinants of
childhood mortality in rural Upper Egypt. Soc Sci Med 2000; 51:
185–97.
Yoon PW, Black RE, Moulton LH, Becker S. The effect of
malnutrition on the risk of diarrheal and respiratory mortality in
children <2y of age in Cebu, Philippines. Am J Clin Nutr 1997; 65:
1070–77.
Scumacher R, Swedberg E, Diallo MO. Mortality study in Guinea:
investigating the causes of death for children under 5. Arlington:
BASICS II, 2002.
THE LANCET • Vol 361 • June 28, 2003 • www.thelancet.com
For personal use. Only reproduce with permission from The Lancet.


© Copyright 2026