
Why Danes are smug: comparative study of life
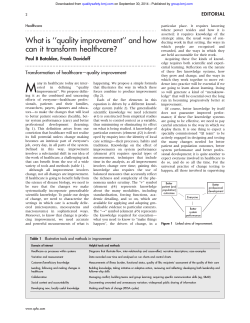
Downloaded from bmj.com on 8 February 2008
Why Danes are smug: comparative study of life
satisfaction in the European Union
Kaare Christensen, Anne Maria Herskind and James W Vaupel
BMJ 2006;333;1289-1291
doi:10.1136/bmj.39028.665602.55
Updated information and services can be found at:
http://bmj.com/cgi/content/full/333/7582/1289
These include:
References
This article cites 9 articles, 3 of which can be accessed free at:
http://bmj.com/cgi/content/full/333/7582/1289#BIBL
1 online articles that cite this article can be accessed at:
http://bmj.com/cgi/content/full/333/7582/1289#otherarticles
Rapid responses
18 rapid responses have been posted to this article, which you can access
for free at:
http://bmj.com/cgi/content/full/333/7582/1289#responses
You can respond to this article at:
http://bmj.com/cgi/eletter-submit/333/7582/1289
Email alerting
service
Topic collections
Receive free email alerts when new articles cite this article - sign up in the
box at the top left of the article
Articles on similar topics can be found in the following collections
Environmental Issues (727 articles)
Culture (376 articles)
Notes
To order reprints follow the "Request Permissions" link in the navigation box
To subscribe to BMJ go to:
http://resources.bmj.com/bmj/subscribers
Downloaded from bmj.com on 8 February 2008
Research
Why Danes are smug: comparative study of life
satisfaction in the European Union
Kaare Christensen, Anne Maria Herskind, James W Vaupel
Danes are unrivalled in satisfaction with life. The University of Leicester recently published the World Map
of Happiness (http://news.bbc.co.uk/2/shared/bsp/
hi/pdfs/28_07_06_happiness_map.pdf) with Denmark as number one. For more than 30 years this
country with five million inhabitants has ranked first in
Eurobarometer
surveys
(europa.eu.int/comm/
public_opinion/index_en.htm). More than two thirds
of Danes are “very satisfied” with their lives according
to these surveys. In no other Eurobarometer country
has this proportion exceeded a half, and for most of
the countries the proportion is less than a third
(figure). To explain Danish contentment we sifted
through literature, statistics, and common knowledge.
Hypotheses, methods, and results
We focused on accounting for why life satisfaction in
Denmark substantially exceeds that in Sweden and
Finland, the two Eurobarometer countries most similar
to Denmark. We have ordered our hypotheses roughly
from most to least implausible.
Hair colour—It may indeed be the case that “blondes
have more fun.” This hypothesis was launched in the
1950s by a commercial slogan for a hair dye and was
cemented in popular culture in 1978 by rock musician
Rod Stewart’s album of the same title. Sweden,
however, has a higher prevalence of blondes than Denmark.1
Genes—Genetic factors might influence differences
in life satisfaction within a country,2 and Danes might
have a special genetic constitution. Genotypes in
Sweden, however, are similar to those in Denmark
because most Swedes were Danes until the 17th
century.
Food—Meals in Denmark can be politely described
as unmemorable. “Danish cuisine” is an oxymoron,
except perhaps the open faced “butter breads” that
accompany the beer and aquavit Danes consume for
lunch. Older Danes satisfy their hunger with potatoes,
gravy, and a bit of pork, and younger ones devour
hotdogs, hamburgers, and Baltic-style pizzas. Danish
cuisine has some similarities with food from
Switzerland and Austria, the second and third
happiest nations according to the World Map of
Happiness; this suggests that the consumption of
comfort foods may be important for life satisfaction.
Climate—Danes bask in a somewhat colder and
cloudier version of the balmy English weather. In 2004
there were 1539 sunshine hours in Copenhagen compared with 1573 in London and 1821 in Stockholm,
not to mention 2538 in Rome (Danish Meteorological
Institute, www.dmi.dk). A remarkable feature is the
oscillation in life satisfaction during the year in
Denmark. The proportion given in the figure is the
average of spring and autumn assessments; satisfaction
BMJ VOLUME 333
23-30 DECEMBER 2006
bmj.com
with life is, for good reason, as much as 38% higher in
spring than autumn.
Native tongue—The Danish word “tilfreds” may
have a subtly different meaning than the English
“satisfied” or the Swedish “nöjd.” A millennium
ago the three languages were close relatives, but today
they differ considerably with English evolving from
the rich merger of Germanic and Latin sources,
Swedish developing into an effeminate sing song,
and Danish faithfully preserving the guttural grunts of
the Vikings. The root meaning of the Danish “tilfreds”
is “at peace” and it can be translated as the English
“contented” as well as “satisfied.” Having considered
the issue at length, the bilingual authors of this article
conclude that it is difficult to be “tilfreds” if you are not
satisfied and that very satisfied people are almost
always very “tilfreds.” Studies of the multilingual
Swiss population show a consistent reporting
level in Switzerland that is different from that in
France, Italy, and Germany and show no cross
border similarity dependent on language group in
Switzerland.3
Alcohol and smoking—High levels of smoking and
drinking are associated with low wellbeing, but Danes
are among those with the highest consumption in
Europe. This is reflected in causes of death and low life
expectancy.4 A reviewer of our paper suggested that
one reason that Danes seem smug may be that they
were drunk when they participated in the Eurobarometer surveys.
Marriage and children—It is well documented that
marriage and having children are both associated with
life satisfaction. Denmark is the number one country in
Europe with regard to marriages, but the divorce rate is
correspondingly high, giving Denmark a leading position in the EU second only to Belgium (Statistics Denmark, www.dst.dk/HomeUK.aspx). When it comes to
children, Denmark is among the EU countries with the
highest
fertility.
Recent
Danish
research, however, suggests that children beyond the first child decrease life
satisfaction, especially for women.5
General health—Good health is associated with life satisfaction. If self
reported health is considered, Danes
do well. When measured objectively,
however, by diagnosed physical conditions and performance, the health of
Danes is mediocre.6 The life expectancy of Denmark falls 13th among the
15 old EU countries (www.cia.gov/cia/
publications/factbook/index.html).
Welfare state—Cross national studies
show that a prosperous economy and a
well functioning democracy are associated with a high level of wellbeing,3 7
although longitudinal studies of life
satisfaction do not indicate any stable
Dane, at peace
Epidemiology,
Institute of Public
Health, University
of Southern
Denmark, JB
Winslowsvej 9B,
DK-5000 Odense
C, Denmark
Kaare Christensen
Professor
Paediatric
Department,
Odense University
Hospital, Denmark
Anne Maria
Herskind
paediatrician
Max Planck
Institute for
Demographic
Research, D-18057
Rostock, Germany
James W Vaupel
director
Correspondence to:
K Christensen
kchristensen@
health.sdu.dk
BMJ 2006;333:1289–91
SIMON BURDY/GETTY SPORT
Introduction
1289
Downloaded from bmj.com on 8 February 2008
Research
GETTY SPORT
changes as a result of a higher income.8
Denmark ranks number one in the
Gini index, which is a measure of
income equality,9 10 but is closely
followed by Sweden, which is second in
Europe. Virtually all historically Protestant societies show relatively high
levels of subjective wellbeing.3 But
again, Denmark does not differ much
from Sweden and Finland in infrequency of church attendance or latent
paganism.
Exercise—There are more than 1.6
million memberships of sports clubs in
a country of 5.4 million inhabitants
(Ministry of Foreign Affairs of Denmark, www.denmark.dk). Furthermore,
Danes use bicycles to a great extent for
transportation, a feature they have in
common with another high ranker in life satisfaction,
the Netherlands.
Prowess in sports—Guidebooks to Denmark correctly assert that winning the 1992 European Championship in football by beating Germany 2-0 in the
final put Danes in such a state of euphoria that the
country has not been the same since. This would
explain the high plateau of life satisfaction in Denmark
after 1992 (figure). Other research supports the plausibility of explanations of this kind. For instance, it has
been shown in England that stock market prices are
positively linked to the performance of English
national football teams (John Whitfield, Football
results kick share prices, Nature News 2003), and death
rates from cardiovascular diseases rise among men
when a local team loses at home or the national team
participates in the European Football championships’
play-off.11 12
Expectations—The Eurobarometer surveys also
contain a question about expectations for improve-
Very satisfied (%)
Happy ever after?
Denmark
Sweden
Austria
Spain
Italy
The Netherlands
Ireland
Finland
Germany
Greece
Luxemburg
United Kingdom
Belgium
France
Portugal
70
60
50
40
30
20
ment in the coming year. It has been argued that
great expectations of favourable life circumstances in
the future should be associated with life satisfaction,13
but if the expectations are unrealistically high they
could also be the basis of disappointment and low life
satisfaction. The Eurobarometer data on expectations
go back to 1980 and show that while Danes are very
satisfied, their expectations for the coming year are
rather low, ranking among the bottom half. In
contrast, Italy and Greece, which rank lowest on life
satisfaction, rank high on expectations for the year to
come; together with Swedes and Finns they rank at the
top.
Comments
The causes of the stolid depth of Danish wellbeing
are undoubtedly multifactorial. We are satisfied,
however, that in the end and against all odds we
have contributed to comprehension of the conundrum of Danish contentment. We doubt that further
research would lead, in the foreseeable future, to
deeper understanding, but decades of effort might
possibly result in some incremental advance. Optimism is unwarranted.
Our analysis points to two explanatory factors.
The Danish football triumph of 1992 has had a lasting
impact. This victory arguably provided the biggest
boost to the Danish psyche since the protracted
history of Danish setbacks began with defeat in
England in 1066, followed by the loss of Sweden,
Norway, Northern Germany, the Danish West Indies,
and Iceland. The satisfaction of the Danes, however,
began well before 1992, albeit at a more moderate
level. The key factor that explains this and that
differentiates Danes from Swedes and Finns seems to
be that Danes have consistently low (and indubitably
realistic) expectations for the year to come. Year
after year they are pleasantly surprised to find that not
everything is getting more rotten in the state of
Denmark.
This finding is supported by Danish news coverage
of the 2005 pronouncement by Ruut Veenhoven,
Dutch Professor of Social Conditions for Happiness
and head of the World Database of Happiness, that
Danes are the world’s happiest people. The headlines
in Denmark ran: We’re the happiest “lige nu.” The
phrase “lige nu,” which can be translated literally as
“just now,” is a quintessentially Danish expression
redolent, indeed reeking, of the sentiment “for the time
being, but probably not for long and don’t have any
expectations it will last.”
In this humbug-bloated holiday season, with an
undoubtedly disappointing New Year approaching, we
do not wish to foster false hopes. Some tepid comfort
might perhaps be taken, however, in the fact that if you
lower your expectations enough you might feel a bit
better next Christmas.
10
0
1975
1980
1985
1990
1995
2000
2005
Year
Proportion who report to be very satisfied in 15 EU countries according to Eurobarometers
(europa.eu.int/comm/public_opinion/index_en.htm)
1290
We thank Inge Petersen, Birgit Wich, Kirsten Pagh, Matt McGue,
and Jeffrey C Murray.
Contributors: KC, AMH, and JWV wrote the paper. KC is guarantor.
Funding: None.
Competing interests: We are very satisfied “lige nu” and have low
expectations for the coming year.
Ethics approval: Not needed.
BMJ VOLUME 333
23-30 DECEMBER 2006
bmj.com
Downloaded from bmj.com on 8 February 2008
Research
1
2
3
4
5
6
7
Suter D. Hair colour in the Faroe and Orkney Islands. Ann Hum Biol
1979;6:89-93.
Lykken D, Tellegen A. Happiness is a stochastic phenomenon. Psychol Sci
1996;6:10-9.
Inglehart R, Klingemann H-D. Genes, culture, democracy, and happiness.
In: Diener E, Suh EM, eds. Culture and subjective well-being. Cambridge,
MA: MIT Press, 2000:165-83.
Jacobsen R, Von Euler M, Osler M, Lynge E, Keiding N. Women’s death in
Scandinavia—what makes Denmark different? Eur J Epidemiol
2004;19:117-21.
Kohler H-P, Behrman JR, Skytthe A. Partner + children = happiness. The
effects of partnerships and fertility on well-being. Popul Dev Rev
2005;31:407-45.
Börsch-Supan A, Brugiavini A, Jürges H, Mackenbach J, Siegrist J, Weber
G, eds. Health, aging and retirement in Europe. First results from the survey of
health, aging and retirement in Europe. Mannheim: Mannheim Research
Institute for the Economics of Aging (MEA), 2005.
Diener E, Diener M, Diener C. Factors predicting the subjective
well-being of nations. J Pers Soc Psychol 1995;69:851-64.
8
9
10
11
12
13
Easterlin RA. Explaining happiness. Proc Natl Acad Sci U S A
2003;100:11176-83.
Gini C. Variabilità e mutabilità (1912). In: Pizetti E, Salvemini T, eds.
Memorie di metodologica statistica. Rome: Libreria Eredi Virgilio Veschi,
1955.
Countries by income inequality metrics based on the Gini coefficient. In:
United Nations Development Programme Report. New York: UNDP
Publications, 2005.
Kirkup W, Merrick DW. A matter of life and death: population mortality
and football results. J Epidemiol Community Health 2003;57:429-32.
Witte DR, Bots ML, Hoes AW, Grobbee DE. Cardiovascular mortality in
Dutch men during 1996 European football championship: longitudinal
population study. BMJ 2000;321:1552-4.
Lyubomirsky S. Why are some people happier than others? The role of
cognitive and motivational process in well-being. Am Psychol
2001;56:239-49.
(Accepted 20 October 2006)
doi 10.1136/bmj.39028.665602.55
Phenotypic differences between male physicians, surgeons,
and film stars: comparative study
Antoni Trilla, Marta Aymerich, Antonio M Lacy, Maria J Bertran
We finished our medical training at the University of
Barcelona more than 25 years ago, and have enjoyed
our work ever since. At medical school we noted
certain differences between male trainees who selected
either surgery or medicine as their specialty. The tallest
and most handsome male students were more likely to
go for surgery, and the shortest (and perhaps not so
good looking) ones were more likely to become physicians (including doctors of internal medicine and its
subspecialties).
Now, after all these years we hypothesise that, on
average, surgeons are taller and better looking than
physicians. We conducted a comparative study to test
this hypothesis.
participants (no further checking of this information
was attempted). We decided to avoid (for the time
being) male observers, because of potential bias.
Observers used the “good looking score” to classify
each participant. This score measures the degree of
handsomeness on a seven point Likert scale (1, ugly; 7,
very good looking).
We discarded the highest and lowest score (outliers)
for each participant and used the six remaining scores
for our study. Mean scores, differences in means with
95% confidence intervals, and standard deviations
were used to compare the three groups. We used the
standard t test to compare age and the non-parametric
(Mann-Whitney U) test to compare height and mean
good looking scores.
Methods
We selected a random sample of senior staff surgeons
and physicians working at the University of Barcelona
Hospital Clinic (a 700 bed public hospital), matched by
age (52 ±7 years) and sex (all men), from the staff payroll of the surgical and medical departments. We contacted all eligible participants by email. If they agreed
to participate, their height (in cm) was recorded and
they were asked to submit a digital picture. Age (in
years) was registered and checked against that
recorded in the payroll database. The external controls
were four well known film stars, mostly in their
50s—Harrison Ford as Dr Richard Kimble (a
neurosurgeon in the film The Fugitive), George
Clooney as Dr Doug Ross (a paediatrician in the television series ER), Patrick Dempsey as Dr Derek
Shepherd (a surgeon in the television series Grey’s
Anatomy), and Hugh Laurie as Dr Gregory House (a
nephrologist and infectious disease specialist in the
television series House).
We randomly organised the pictures of all
surgeons, physicians, and external controls and
showed them to an independent group of eight female
observers—three doctors and five nurses from our hospital. All observers were in the same age group as the
BMJ VOLUME 333
23-30 DECEMBER 2006
bmj.com
Results
We contacted 14 surgeons and 16 physicians (24
surgeons and 38 physicians were eligible). Only two
surgeons and two physicians did not answer the
questionnaire or send a picture (their out of office auto
reply was switched on). Two additional physicians were
dropped from the final analysis because of the poor
quality (technical, of course) of their pictures. The final
analysis therefore comprised 12 physicians and 12
surgeons plus four external controls.
The mean age of physicians was 50.6 years (SD
4.02) and of surgeons 51.1 years (SD 4.11) (P = 0.76).
The mean height of physicians was 172.6 cm (95%
confidence interval 170.2 to 175.4) and of surgeons
179.4 cm (175.1 to 184.0) (P = 0.01).
Film stars (external controls) had significantly
higher good looking scores than surgeons (5.96 v
4.39; difference between means 1.57, 95% confidence
interval 0.69 to 2.45; P = 0.013) and physicians (5.96 v
3.65; 2.31, 1.58 to 3.04; P = 0.003). Surgeons had
statistically significantly higher good looking
scores than physicians (4.39 v 3.65; 0.74, 0.25 to
1.23; P = 0.010). We found small, non-significant
differences between film stars who played either
Hospital Clinic,
University of
Barcelona, 08036
Barcelona, Spain
Antoni Trilla
director of preventive
medicine and
epidemiology unit
Marta Aymerich
consultant,
haemopathology unit
Antonio M Lacy
consultant, general
and digestive tract
surgery unit
Maria J Bertran
specialist, preventive
medicine and
epidemiology unit
Correspondence to:
A Trilla
[email protected]
BMJ 2006;333:1291–3
1291


© Copyright 2026