
Lower limb muscle strength (LLMS): Why sedentary life should never... A review Karin Marie¨lle Volkers , Jorrit Frederik de Kieviet
G Model
AGG-2488; No. of Pages 16
Archives of Gerontology and Geriatrics xxx (2011) xxx–xxx
Contents lists available at ScienceDirect
Archives of Gerontology and Geriatrics
journal homepage: www.elsevier.com/locate/archger
Review
Lower limb muscle strength (LLMS): Why sedentary life should never start?
A review
Karin Marie¨lle Volkers a,*, Jorrit Frederik de Kieviet a, Hans Peter Wittingen b,
Erik Johan Anton Scherder a,b
a
b
VU University, Department of Clinical Neuropsychology, Van der Boechorststraat 1, 1081 BT, Amsterdam, The Netherlands
University of Groningen, Institute of Human Movement Sciences, Antonius Deusinglaan 1, 9713 AV, Groningen, The Netherlands
A R T I C L E I N F O
A B S T R A C T
Article history:
Received 22 October 2010
Received in revised form 15 April 2011
Accepted 19 April 2011
Available online xxx
Aging coincides with a decline in LLMS. Preserving LLMS may be considered a very important
determinant of functional independence in the elderly. To maintain LLMS the question arises whether
habitual physical activities (HPA) can prevent a decline in LLMS. This review aims to determine the
relationship between HPA throughout life and LLMS above age 50. Using relevant databases and
keywords, 70 studies that met the inclusion criteria were reviewed and where possible, a meta-analysis
was performed. The main findings are: (1) the present level of HPA is positively related to LLMS; (2) HPA
in the past has little effect on present LLMS; (3) HPA involving endurance have less influence on LLMS
compared to HPA involving strength; (4) people with a stable habitually physically active life are able to
delay a decline in LLMS. In conclusion, to obtain a high amount of LLMS during aging, it is important to
achieve and maintain a high level of HPA with mainly muscle-strengthening activities.
ß 2011 Elsevier Ireland Ltd. All rights reserved.
Keywords:
Lower limb muscle strength in elderly
Physical activity
Exercise and aging
Systematic review
1. Introduction
The average lifespan of the world population is rising and it is
expected that the number of older people (>65 years) will even
have doubled by 2030 in some countries (Kinsella and Velkoff,
2001). Although a longer lifespan may co-occur with a further
development of wisdom (Le, 2008) and spirituality (Bianchi, 2005),
old age is widely associated with declines in physical functioning
and muscle strength (Hoang et al., 2010; Peiffer et al., 2010).
Muscle strength has been reported to reach peak values between
age 25 and 35, is maintained or is slightly lower between age 40
and 49 and then declines after age 50 (Larsson et al., 1979; Lindle
et al., 1997). Muscle strength provides greater physiologic and
functional reserves that may even protect against mortality
(Rantanen et al., 2000, 2002; Newman et al., 2006). Poor muscle
strength is an indicator for vulnerability and frailty at old age
(Rantanen et al., 2002; Lang et al., 2010) and increases the risk of
falling (De Rekeneire et al., 2003; Oya et al., 2008; MacGilchrist
et al., 2010). As a consequence of falls, people often have to be
transferred to acute care (Przybysz et al., 2009). Moreover,
preserving LLMS may be considered a very important determinant
of functional independence in the elderly (Reid et al., 2008).
* Corresponding author. Tel.: +31 20 598 2715; fax: +31 20 598 8971.
E-mail address: [email protected] (K.M. Volkers).
At a young age, LLMS can be positively influenced by physical
activity (Gergley, 2009). It should be noted that different exercises
have different effects on muscles. Strength exercises mainly
increase muscle mass (for muscle strength), while endurance
exercise mainly increase mitochondrial concentration (for muscle
endurance) (Tseng et al., 1995). Even older people who participate
in a temporary intervention program are still able to increase their
LLMS (Marsh et al., 2009) and can reduce muscle strength decline
during aging (Marini et al., 2008). A gradual increase in workload
produces a time-dependent improvement of strength (Marini
et al., 2008). Therefore, when the intervention stops, studies show
rapid loss of muscle strength (Connelly and Vandervoort, 1997;
Fatouros et al., 2006). Unfortunately, these temporary interventions do not provide much information about how actual levels of
HPA observed in older people affect decline in strength.
Delayed declines in LLMS caused by HPA could occur in two
different ways. First, it might be due to a build-up of ‘muscle
reserve’ resulting from HPA performed in the past; comparable to
what has been suggested for cognition (Dik et al., 2003; Fratiglioni
et al., 2004). Second, irrespective of HPA in the past, only the
present level of HPA could delay the decline in strength;
comparable to what has been suggested for VO2max (Tanaka
and Seals, 2003). VO2max is a measure for maximal aerobic
capacity (Duque et al., 2009) that can decline rapidly when people
cease their present physical activities (Bunyard et al., 1998). The
actual impact of HPA on LLMS above age 50 and whether HPA in the
0167-4943/$ – see front matter ß 2011 Elsevier Ireland Ltd. All rights reserved.
doi:10.1016/j.archger.2011.04.018
Please cite this article in press as: Volkers, K.M., et al., Lower limb muscle strength (LLMS): Why sedentary life should never start? A
review. Arch. Gerontol. Geriatr. (2011), doi:10.1016/j.archger.2011.04.018
G Model
AGG-2488; No. of Pages 16
2
K.M. Volkers et al. / Archives of Gerontology and Geriatrics xxx (2011) xxx–xxx
past or present could delay a decline in LLMS has never been
examined.
The aim of this systematic review and meta-analysis is to clarify
the relationship between HPA and LLMS above age 50. The
following questions will be addressed: (1) does present HPA have a
positive influence on LLMS? (2) Can HPA in the past and present
delay a decline in LLMS? (3) Are the results influenced by age,
gender and type of HPA, i.e., sport physical activities that are
especially focused on strength (for example sprinting, weight
lifting), on endurance (for example marathon running) or the
remaining HPA (for example gymnastics, work and household
activities)?
2. Methods
2.1. Search strategy
We conducted a systematic literature search of MEDLINE,
EMBASE, PsycINFO and Cochrane library on March 1st 2010 in
order to identify studies addressing the amount of LLMS (decline)
in people whose HPA level is known. The search terms were
divided into four groups: ‘muscle status’ (i.e., muscle strength or
power), ‘lower limb muscles’, ‘aging’ and ‘physical activity’. The
search terms included controlled terms, i.e., Mesh, emtree and
thesaurus, but also text words. Studies contained at least one term
of all four groups. The detailed search strategy can be obtained
from the first author. The search resulted in 1679 articles in
MEDLINE, 6374 articles in EMBASE, 121 articles in PsycINFO and
421 articles in Cochrane library.
The bibliographic details of all retrieved articles (n = 8595) were
stored in a Reference Manager file. First, the overlapping articles
that were identified in the literature search of various database
searches were included only once. This resulted in a total of 7797
articles. Second, two of the researchers independently reviewed all
7797 titles, after which abstracts of all studies with relevant titles
were reviewed separately. At this initial screening stage, articles
were deemed to be relevant if the study measured strength of
lower limb muscles and level of HPA in healthy older people. The
full text of any article that either investigator assessed as possibly
relevant was obtained (n = 178). Both researchers independently
assessed these 178 studies using the selection criteria. Disagreements were resolved by consensus and when consensus could not
be reached, a third reviewer was consulted. We contacted authors
for additional data if necessary. In total 70 articles (with 31 articles
in the meta-analysis) were included in this review.
constant in the presence of a force greater than the muscle is
capable of counteracting (Lang et al., 2010). In other words, the
limb is not moving while strength is provided. Isometric muscle
strength includes force in Newton (N) and torque in Newton meter
(N m) (Bertrand et al., 2007). Dynamic muscle strength is the
ability to generate force during movement of the limb. It includes
isokinetic muscle strength, i.e. fibers are shortened or lengthened
while the limb moves at fixed velocity (Lang et al., 2010) in Newton
meter per second (N m/s) (Newton et al., 2008) and kinetic muscle
strength and power, i.e. fibers are shortened or lengthened while
the limb moves at non-constant velocity in N m/s, centimeters
(cm) jumping height (Harris, 2008), or time needed to perform
chair stands (Kuh et al., 2005).
HPA includes occupational and leisure time physical activity
(Rantanen et al., 1993). Occupational physical activity includes
physical activities at work (Muraki et al., 2009). Leisure time
physical activity includes all physical activities performed during
leisure time and can be subdivided into sport physical activity and
other leisure time physical activities like brisk walking and
gardening (Andrews et al., 1996; Kostka et al., 2000b; Uusi-Rasi
et al., 2006). Sport physical activity includes all sports club
activities (including exercise) (Casey et al., 2009). These HPA
domains are not the most important aspects, but are a marker of
the type of activity. Theoretically, it is the total level and type of
activity (strength vs. endurance or other) that influences muscle
strength, but many included studies did not provide enough
detailed information to determine the total level of HPA.
2.4. Nature of the evidence
There are three different types of study design. First there are
cross-sectional studies where people were divided into groups
based upon HPA level and the focus is on between subject
differences in LLMS associated with HPA level. Second, there are
cross-sectional studies that used a measure of HPA and provided a
correlation coefficient between HPA level and LLMS. Finally, there
are longitudinal studies where the focus is on within subject
changes in LLMS over time and to what extent HPA level at baseline
and follow-up affects this change. Studies were included in a metaanalysis only if they assessed knee extensor strength in Newton.
Studies without a measure of knee extensor strength (in Newton)
were qualitatively reviewed to examine whether the results
supported the results of the meta-analysis of studies with a
comparable design.
2.5. Statistical analysis
2.2. Criteria for selecting studies
The following criteria were used to select studies for inclusion
in this review: (1) the study was published in an English or Dutch
language journal; (2) the study measured both LLMS (knee
extension, knee flexion, leg extension, hip abduction, hip adduction, ankle dorsiflexion and ankle plantar flexion) and the HPA level
in people; (3) a comparison was made between strength and the
level of HPA; (4) the study included people with a mean age of 50 or
older, reporting population characteristics including gender and
age. The following exclusion criteria were used to focus only on
healthy people and HPA: (1) studies with patients during
hospitalization or patients with (chronic) diseases; (2) studies
with an exercise intervention.
2.3. Nomenclature
Studies differ in terms of LLMS measurement. Static muscle
strength is the ability to generate force without movement. It is
comparable to isometric muscle strength, i.e. fiber length remains
The meta-analysis was performed using the software Comprehensive Meta-analysis version 2.2 (Borenstein, 1999) and SPSS
version 14.0. To ensure stability of the outcomes, the meta-analysis
was limited to strength variables reported by at least 4 different
studies, which was the case for knee (and leg) extension muscle
strength measured in Newton. An overall effect size for each
dependent variable was computed by weighting each study’s effect
size by the study’s sample size. To answer the first question, a
combined effect size d (Cohen, 1988) was determined for both the
cross-sectional difference in knee extension strength between a
HPA and a sedentary group and the correlation between HPA and
knee extension strength. To answer the second question a effect
sizes were measured for the decline in knee extension strength
within 3 groups, i.e., a group with a stable high or a stable
sedentary level of HPA and a group of people with a decreasing
level of HPA. In order to determine if age, gender and type of HPA
affected the results, the Pearson correlation coefficient was
calculated between age at (baseline) assessment and the studies’
effect size and Q test statistics for gender and type of HPA on
Please cite this article in press as: Volkers, K.M., et al., Lower limb muscle strength (LLMS): Why sedentary life should never start? A
review. Arch. Gerontol. Geriatr. (2011), doi:10.1016/j.archger.2011.04.018
G Model
AGG-2488; No. of Pages 16
K.M. Volkers et al. / Archives of Gerontology and Geriatrics xxx (2011) xxx–xxx
combined effect sizes were assessed. For the interpretation of the
correlation coefficients and effect sizes, Cohen’s (Cohen, 1988)
guidelines were used. To test heterogeneity of the effect sizes, a Q
test was conducted (Cochran, 1954; Gliner et al., 2003).
To study the possibility of publication bias, we used linear
regression methods proposed by Egger et al. (1997) to investigate
the degree of funnel plot asymmetry (1-sided p) and an additional
fail safe N was calculated (Rosenthal, 1995), measuring the
necessary number of studies to nullify the overall effect.
Furthermore, we investigated the correlation between sample
sizes and effect sizes for each dependent variable. The fact that
significant results in small samples tend to be easier to publish in
comparison with non-significant results in small samples, would
become evident by way of a significant negative correlation
between sample size and effect size. Significance testing was 2sided and a set at p < 0.05.
3. Results
Table 1 shows an overview of longitudinal studies and Table 2 of
cross-sectional studies that measured LLMS in people of 50 years
and older in relation to their level of HPA. All studies are sorted in
alphabetic order by first author.
3.1. Does present HPA have a positive influence on LLMS?
3.1.1. Cross-sectional differences
Eighteen studies measured and reported the amount of knee
extension strength (in Newton) in 1475 habitually physically
active and 1379 sedentary people (Rantanen et al., 1992, 1993,
1997; Sipila and Suominen, 1994; Harridge et al., 1997; Rantanen
and Heikkinen, 1998; Leong et al., 1999; Hunter et al., 2001;
Ringsberg et al., 2001; Pearson et al., 2002; Visser et al., 2005;
Dreyer et al., 2006; Karamanidis and Arampatzis, 2006; Tarpenning et al., 2006; Aagaard et al., 2007; Laroche et al., 2007; BrookeWavell and Cooling, 2009; McCrory et al., 2009). Overall knee
extension strength was higher in habitually physically active
people compared to sedentary people, with a combined effect size
of d = 1.89 (95% confidence interval (CI) = 0.95–2.83; p < 0.001)
(Fig. 1). Data were heterogeneously distributed indicating that
findings were not consistent among studies (Q(26) = 1814.50,
p < 0.001). Found effect size did not differ between studies
measuring HPA during the whole of a person’s lifetime (Rantanen
et al., 1992, 1993; Sipila and Suominen, 1994; Pearson et al., 2002;
Dreyer et al., 2006; Aagaard et al., 2007; Laroche et al., 2007;
McCrory et al., 2009) and those only measuring the HPA during the
last year(s) of life (Q(1) = 0.29, p = 0.59) (Harridge et al., 1997;
Rantanen et al., 1997; Rantanen and Heikkinen, 1998; Leong et al.,
1999; Hunter et al., 2001; Ringsberg et al., 2001; Visser et al., 2005;
Karamanidis and Arampatzis, 2006; Tarpenning et al., 2006;
Brooke-Wavell and Cooling, 2009). There was no evidence for
publication bias, as Egger’s degree of funnel plot asymmetry was
not significant (p = 0.32), fail safe N was 6669 and studies with
higher sample sizes showed higher effect sizes (r = 0.69, p < 0.001).
Reviewing comparable literature with other LLMS measurements, 24 studies support the significant difference in LLMS,
irrespective of measuring HPA during an entire lifespan (Kuta et al.,
1970; Grassi et al., 1991; Sipila et al., 1991; Pearson et al., 2002;
Yoshiga et al., 2002; Korhonen et al., 2006; Uusi-Rasi et al., 2006;
McCrory et al., 2009; Buford et al., 2010), or during the last year(s)
of life (Aniansson et al., 1983; Aoyagi and Katsuta, 1990; Klitgaard
et al., 1990; Alway et al., 1996; Rantanen et al., 1997; Rantanen and
Heikkinen, 1998; Hunter et al., 2001; Ringsberg et al., 2001; Visser
et al., 2005; Xu et al., 2008; Aoyagi et al., 2009; Asaka et al., 2009;
Brooke-Wavell and Cooling, 2009; Lindstrom et al., 2009; Miyatake
et al., 2009). In contrast, one study showed no difference in knee
3
extension and flexion strength between people with high and
people with low levels of occupational physical activity (Borges,
1989).
3.1.2. Correlation studies
Nine studies assessed a correlation between HPA and knee
extension strength (in Newton) in 1315 people (Rantanen et al.,
1993, 1997; Sipila and Suominen, 1994; Andrews et al., 1996;
Bohannon, 1997; Neder et al., 1999; Hunter et al., 2001; Low Choy
et al., 2007; Aoyagi et al., 2009). Overall, there was a significant
positive effect of d = 0.25 (95%CI = 0.20–0.30; p < 0.001) and data
were homogeneously distributed (Q(13) = 19.67, p = 0.10) (Fig. 2).
There was a non-significant degree of funnel plot asymmetry
(p = 0.26), fail safe N was 231 and a negative non-significant
relation between effect size and sample size (r = 0.33, p = 0.10),
together indicating no evidence of publication bias.
Reviewing comparable literature with other LLMS and power
measurements, 18 studies support this positive correlation
(Sandler et al., 1991; Era et al., 1992; Andrews et al., 1996;
Bohannon, 1997; Kostka et al., 1997; Rantanen et al., 1997, 1999;
Neder et al., 1999; Hunter et al., 2000; Kostka et al., 2000a,b; Amara
et al., 2003; Gerdhem et al., 2003; Kuh et al., 2005; Visser et al.,
2005; Boussuge et al., 2006; Low Choy et al., 2007; Scott et al.,
2009). Only one study showed a contrasting result with a negative
correlation between occupational physical activities and knee
extension strength (Aniansson et al., 1980).
3.2. Can HPA in the past and present delay a decline in LLMS?
3.2.1. Active people vs. sedentary people vs. people who decrease their
HPA level
People (n = 195) with a stable HPA level show a small, but nonsignificant decline in knee extension strength within 5–11 years, as
indicated by the combined effect size of 0.46 (95%CI = 1.07 to
0.14; p = 0.13) (Fig. 3). In contrast, sedentary people (n = 146) or
people who decrease their level of HPA (n = 40) show a significant
decline in knee extension strength within respectively 5–11 years
(d = 1.35; 95%CI = 2.14 to 0.55; p = 0.001) and 10 days to 12
years (d = 1.12; 95%CI = 0.59 to 0.65; p < 0.001) (Fig. 3). The
HPA and sedentary groups were heterogeneously distributed and
the group of people with a decreasing level of HPA was
homogeneously
distributed
(Q(10) = 74.41,
p < 0.001;
Q(7) = 58.37, p < 0.001; Q(3) = 0.47, p = 0.93, respectively), indicating that findings among HPA and sedentary groups should be
interpreted with caution. Between these three groups, the HPA
group showed a slower decline (trend) in knee extension strength
compared to the sedentary group (Q(1) = 3.02, p = 0.08) and the
group of people with a decreasing level of HPA (Q(1) = 2.82,
p = 0.09). The sedentary group and the group of people with a
decreasing level of HPA showed comparable declines in knee
extension strength (Q(1) = 0.23, p = 0.63). The degree of funnel plot
asymmetry for the HPA group, the sedentary group and the group
of people with a decreasing level of HPA was p = 0.27; p = 0.03;
p = 0.36 respectively, fail safe N was 28; 147; 19 respectively and
the correlation between effect size and sample size was r = 0.07,
p = 0.83; r = 0.31, p = 0.45; r = 0.31, p = 0.70, respectively. This
indicates a possibility for publication bias in the sedentary group
and the group of people with a decreasing level of HPA and the
necessity to interpret these outcomes cautiously.
Reviewing comparable literature with other LLMS measurements, most studies support results from the meta-analysis.
Studies support the result that habitually physically active people
show no decline (Greig et al., 1993; Casale et al., 2003) and that
they can delay (Pollock et al., 1997; Tarpenning et al., 2004) a
decline in LLMS compared to a sedentary group (Kent-Braun and
Ng, 1999). Eight longitudinal studies support a significant decline
Please cite this article in press as: Volkers, K.M., et al., Lower limb muscle strength (LLMS): Why sedentary life should never start? A
review. Arch. Gerontol. Geriatr. (2011), doi:10.1016/j.archger.2011.04.018
Agea
HPA levelb
Subjectsc
Strengthd
Results
p<
Aniansson et al.
(1983)
70 ! 75
Activity only known within last y before measurement:
!B: moderate activities
!S: mainly sitting activities
men 19
wn 21
KE KF
Dyn, isom (N m), isok (N m)
!B men had more isok KE KF strength than !S men
Decline in KE strength in 5 y time
Higher rate of isok KE strength decline than isom strength decline
0.10
69 ! 73
69 ! 80
A ! A walked or participated in moderate activities
4 h/w
A ! B walked or participated in moderate activities
4 h/w, but reduced this level within first 4 y
men 9
KE
Dyn, isom (N m), isok (N m)
Decline in KE strength in 4 and 11 y time
Connelly and
Vandervoort
(1997)
82 ! 83
81 ! 83
A ! S participated 3/w in resistance exercise program
but reduced this level to short walks and sitting
activities
wn 10
wn 4
KE
Dyn, isom (N m), isok (kg)
Decline in KE strength in 1 and 2 y time
0.05
Frontera et al.
(2000)
65 ! 77
B ! S 834 1409 kcal/w and strength
training ! 578 489 kcal/w
men 9
KE KF
Dyn, isok (N m)
Decline in KE KF strength in 12 y time
0.05
Frontera et al.
(2008)
71 ! 80
A ! B 2919 1631 kcal/w ! 2261 1620 kcal/w
men 5
wn 7
KE KF
Dyn, isok (N m, N m/cm2)
Decline in KE strength in 9 y time
No decline in KF strength in 9 y time
0.001
ns
Greig et al.
(1993)
74 ! 82
men 4
wn 10
KE
Dyn, isom (N)
No decline in KE strength in 8 y time
ns
Hughes et al.
(2001)
62 ! 72
Activity based on Grimby scale (1–6):
A ! A 3–5 ! 3–5
A ! S wn nm ! 2 (n = 1)
Activity within last y before both measurements:
A: 500 kcal/w activity
AS: 500 kcal/w activity with at least 40 weeks
strength exercises
S: <500 kcal/w activity
men 52
wn 68
KE KF
CybexII, isok (N m)
Decline in KE KF strength in 10 y time
Older people show higher rate of strength decline
0.001
nm
Kortebein et al.
(2008)
67 ! 67
A ! S healthy participants completed 10 continuous
days of bed rest at a clinical research center
men 5
wn 6
KE KF
Dyn, isom (N), isok (W)
LE power SC (W)
Decline in KE KF strength and LE power in 10 days time
0.05
Rantanen et al.
(1997)
75 ! 80
Activity based on Grimby scale (1–6):
A ! A 4–6 ! 3–6
S ! A 1–3 ! 3–6
A ! S 4–6 ! 1–2
S ! S 1–3 ! 1–2
men 35
wn 110
KE
Dyn, isom (N)
No decline in KE strength in 5 y time
KE strength was related to activity level in men (r = 0.40) and
wn (r = 0.25)
A ! A more KE strength than S ! S
ns
0.001
Activity based on Grimby scale (1–6):
A ! A men 4–6 ! 4–6
A ! A wn 3–6 ! 3–6
Others
men 15
wn 59
Decline in KE strength in 5 y time in wn
A ! A men more KE strength than Others men
Baseline KE strength negatively related to %change in strength
in 5 y time
No difference in rate of strength decline between A ! A and Others
0.01
0.05
A ! A: gymnasts for 34 10 y at least 2/w and current
leisure time activity is 275 149 h/y
wn 217
A ! A more KE strength and LE power than S ! S
A ! A more LE strength than S ! S
No decline in KE strength in A ! A, S ! S
Decline in LE power in A ! A, S ! S
No difference in rate of KE and LE power decline between
A ! A and S ! S
A ! S showed higher rate of KE strength and LE power decline
than A ! A
nm
0.05
ns
0.05
ns
Rantanen and
Heikkinen
(1998)
Uusi-Rasi et al.
(2006)
80 ! 85
62 ! 68
A ! S: gymnasts active at baseline, but not at follow-up
S ! S: referents and current leisure time activity is
182 129 h/y
KE
Dyn, isom (N)
KE
Dyn, isom (kg)LE
STS, SOS, kin (N/kg)
LE power
JH, kin (cm)
0.01
ns
nm
Notes: A: active; AS: active involving strength; B: semi-active; cm: centimeters; dyn: dynamometer; h: hours; isok: isokinetic; isom: isometric; JH: jumping height; kcal: kilocalories; KE: knee extension; KF: knee flexion; kg:
kilogram; kin: kinetic; LE: leg extension; m: meters; N: Newton; nm: not mentioned; ns: not significant; S: sedentary; SC: stair climbing; SOS: step-on-stair test; STS: sit-to-stand; w: week; W: Watt; wn: women; y: years.
a
Age at baseline ! age at follow-up (years).
b
HPA level at baseline ! HPA level at follow-up.
c
Gender and number of participants.
d
Strength measurement.
K.M. Volkers et al. / Archives of Gerontology and Geriatrics xxx (2011) xxx–xxx
Aniansson et al.
(1992)
0.05
0.05
0.05
G Model
Study
AGG-2488; No. of Pages 16
4
Please cite this article in press as: Volkers, K.M., et al., Lower limb muscle strength (LLMS): Why sedentary life should never start? A
review. Arch. Gerontol. Geriatr. (2011), doi:10.1016/j.archger.2011.04.018
Table 1
Summary of the included longitudinal studies.
Aagaard et al.
(2007)
Al-Abdulwahab
(1999)
Agea
HPA levelb
71–74
Activity based on last 50 y:
20–29
AE: 3–4/w running/cycling
AS: 2–3/w track and field athletics
S: no regular activity
S: none were engaged in active sports for more than 2 h/w
Subjectsc
men 24
men 160
30–39
40–49
50–59
60–69
70–79
80–89
25
Activity based on the last 10 y:
men 24
62
AE: 2 runners, 3 tri-athletes, 1 cyclist training 7 h/w
Dyn, isom (N m,
N m/cm2, N m/
cm3),
isok
(N m, N m/cm2,
3
N m/cm )
Amara et al.
(2003)
55–86
S: no regular physical training
Total amount of METs/d in the last y before measurement
Andrews et al.
(1996)
50–59
Alway et al.
(1996)
Aniansson et al.
(1980)
Aoyagi and
Katsuta (1990)
Results
p<
KE
AE and AS had more KE strength than S
0.05
Dyn, isom (N m/kg)
No difference in KE strength between AE and AS
ns
KE
KE strength starts decreasing between age group 20–29 and 30–39
nm
No difference in absolute (N m) PF strength between AE and S
ns
AE have more PF strength per cm2 or cm3 plantar flexor muscles
than S
0.05
Age group 25 had more PF strength than age group 62
Activity positively related to PF strength
0.05
0.05
Some relations between OA and strength (r = 0.03–0.26 not
specified)
0.05
0.05
Dyn, isom (N)
PF
men 188
PF
wn 205
men 77
Dyn, isom (N, N/cm2)
KE KF AD HAb
wn 79
Dyn, isom (N)
60–69
70–79
Activity based on median activity during life (4-point
scale):
OA: occupational activity
LA: leisure activity
70
Occupational activity after age 40:
men 40
KE
Some relations between LA and strength (r = 0.13–0.22 not
specified)
No relation between KE strength and LA
O1: mostly sitting jobs
wn 32
Dyn, isom (N m), isok
(N m)
Inverse relation between isom KE strength and Occupational
activity in men (no analysis could be done in wn)
0.05
Wn show KE strength decline at younger age than men
nm
KE
A26 and A45 have more isom KE strength than B
0.05
Dyn, isom (N m), isok
(N m)
A26 and A56 have more isok KE strength than B
0.05
No differences between A26, A45 and A56 in KE strength
ns
KE strength positively related to activity 1 and 2 in wn
0.05
A1 more KE strength than S1
A2 more KE strength than S2
0.05
0.05
60–68
O2: walking around jobs
O3: walking/climbing and lifting jobs
O4: heavy physical jobs
LA: leisure activity before age 40 (not further specified)
At time of measurement comparable occupational activity:
men 39
A26: active since < age 35
Asaka et al.
(2009)
63–74
A45: active since age 40–49
A56: active since age 50–59
B: moderate active, no systematic training
Activity based on ‘number of steps’ and ‘duration of
activities of >3METs within last y (mean):
A1: >7000 steps/d
A2: >19 min/d activities of >3METs
S1: <6500 steps/d
S2: <14 min/d activities of >3METs
A: rowers, 2–3/w for 8 y
Bischoff et al.
(2001)
80–89
S: untrained, <2/w exercise
Self reported sport activities before age 40
Aoyagi et al.
(2009)
Strengthd
65–84
men 76
KE Dyn, isom (N m/kg)
wn 94
ns
LE power
A had 43% more LE power than S
0.001
men 38
Dyn, kin (W, W/cm2)
KE KF
Sport activities before age 40 had no influence on KE KF strength
ns
wn 96
Pull gauge, isom (kg)
5
men 34
G Model
AGG-2488; No. of Pages 16
Study
K.M. Volkers et al. / Archives of Gerontology and Geriatrics xxx (2011) xxx–xxx
Please cite this article in press as: Volkers, K.M., et al., Lower limb muscle strength (LLMS): Why sedentary life should never start? A
review. Arch. Gerontol. Geriatr. (2011), doi:10.1016/j.archger.2011.04.018
Table 2
Summary of included cross-sectional studies.
Bohannon (1997)
Borges (1989)
Boussuge et al.
(2006)
20–29
30–39
40–49
50–59
60–69
70–79
20–70
57–74
60–75
HPA levelb
Subjectsc
Casale et al. (2003)
Dreyer et al.
(2006)
55–75
20–40
41–59
60–85
60–74
Results
men 106
wn 125
AD KE HAb
Dyn, isom (N)
KE strength decline within age group 40–49
KE (NDom leg) strength positively related to LA
No relation between OA and AD KE Hab strength
nm
0.001
ns
Occupational activity last 5 y:
O1: mostly sitting jobs (no systematic exercise)
men 139
wn 141
KE KF
Dyn, isom (N m), isok
(N m)
No difference in KE KF strength between O4 and O1
ns
wn 23
LE power1
No relation between LE power and habitual or leisure activity
ns
A had more KE strength than S
0.05
KE (power
A had more KE strength than S
0.05
Dyn, isok (N m, N m/kg,
W)
AD
Transducer, isom (kg)
No difference in KE power between A and S
ns
No difference in AD strength between age groups
ns
LE (power)
No difference in LE power per kg leg lean mass between activity
groups
ns
AS more LE strength than S
0.05
AS and AE more LE strength per kg leg lean mass than S
0.05
LA positively related to KE strength in age groups 31–35 and 51–55
0.05
Dyn, isom (Nkg/m )
No relation between OA and KE strength
ns
men 12
KE (power) KF (power)
No difference in KE strength between G groups
!A had more KE KF AD PF strength and KE KF power than !S
ns
0.05
wn 28
AD (power) PF (power)
Dyn, isok (N m, W)
No difference in strength and power between A ! A and S ! A
No difference in strength and power between S ! S and A ! S
ns
ns
wn 938
KE KF Dyn, isom (W)
Activity positively related to KE (r = 0.30) and KF (r = 0.24) strength
0.001
men 151
LE power
AP had more LE power than AE and S until age 70
0.05
JH, kin (W, W/kg, W/l)
Linear decline in absolute LE power and LE power per kg body mass
with increasing age
nm
O4: heavy physical jobs (no systematic exercise)
Activity measured by QUANTAP (does not consider the
frequency and intensity of different activity sessions):
Habitual activity in the past
Leisure activity in the past
Current habitual activity
Current leisure activity
leisure time physical activity:
Cycle Ergometer, kin
(W, N, W/kg, N/kg)
LE power2
JH, kin (cm, cm kg)
wn 74
S: <3 h/w
A: >15 h/month sport activities (mean is 6.20.8 h/
wfor233 y)
S: light walking for daily activity
KE
A framed chair, isom
(N)
men 27
All subjects were (inter)national skiers:
LA based on a regular week did not differ between age
groups
men 37
Activity based on last 30 y:
men 32
Leg press, kin (N, N/kg)
AS: chronic endurance and resistance training, 5 d/w,
39 km/w running; currently at least 1 y 1/w resistance
training
Bassey power rig, kin
(W, W/kg)
Era et al.
(1992)
31–35
51–55
Gauchard et al.
(2003)
Gerdhem et al.
(2003)
Grassi et al.
(1991)
AE: chronic endurance training, 5 d/w, 46 km/w running
S: community dwelling
LA: leisure activity: 3 groups: low, average, high
17–26
OA: occupation activity: 3 groups: manual workers, lower
white collar workers, higher white collar workers
G: gymnastics: 2 groups: <1/w, >1/w
A ! A: more than 40 y active without interruption and still
active
S ! A: sedentary for at least 4 y but now active
A ! S: active during youth and definitely stopped at least 30
y ago
S ! S: were never active during life
Present activity level based on questionnaire Jonsson (scale
1–8)
All athletes were still active for 1–2 h/d for 3–5 d/w:
40–49
AE: endurance athletes
50–59
AP: power athletes
71–75
>60
75
p<
Activity based on median activity during life:
OA: occupational activity
LA: leisure activity
A: >3 h/w (bowlers)
Buford et al.
(2010)
Strengthd
men 350
KE
2
K.M. Volkers et al. / Archives of Gerontology and Geriatrics xxx (2011) xxx–xxx
Brooke-Wavell and
Cooling (2009)
Agea
G Model
Study
AGG-2488; No. of Pages 16
6
Please cite this article in press as: Volkers, K.M., et al., Lower limb muscle strength (LLMS): Why sedentary life should never start? A
review. Arch. Gerontol. Geriatr. (2011), doi:10.1016/j.archger.2011.04.018
Table 2 (Continued )
Harridge et al.
(1997)
Agea
60–69
>70
21–35
HPA levelb
Subjectsc
20–89
AE: Life-long running and at time of measurement walking/
running most d/w for at least 1 h
men 46
B: recreational active
S: no regular activity
Leisure Activity based on last two weeks on 6-point scale:
Kent-Braun and Ng
(1999)
Kettunen et al.
(1999)
No difference in KE and PF strength between AE and S
ns
Dyn, isom (N/kg, N m/
kg)
KE PF strength declined with age
0.05
B 21–35 had more KE and PF strength than all 70–100 age groups
0.05
Leisure Activity positively related to KE PF strength
0.001
A had more KE strength than S
0.001
No difference in KE PF strength between AE and S
ns
Age group 21–32 had more KE PF strength than 60–69
0.05
No age x activity interaction in KE and PF strength
Old men had less AD strength than young men
ns
0.05
KE PF
men 49
Steel-framed
isom (N,
N m, N m/kg)
KE PF
chair,
21–32
S: <mean activity rating within 5-y age groups
AE: last 10 y at least 3/w running and competition
60–69
S: no sport activity except at school
32
Habitual physical activity within 1 week:
men 22
AD
72
All subjects had low levels of physical activity (maximal 2/
w exercise)
Participants were (inter)national sporters between 1920
and 1965 and had comparable activity level in last y before
measurement:
wn 18
Transducer, isom (N, N/
cm2)
LE power
No difference in AD strength between old and young wn
ns
AS had highest JH, B the lowest (without osteoarthritis)
0.05
JH, kin (cm)
No difference in JH between activity groups with osteoarthritis
LE power positively related to hours in team-sport training during
the last 12 months and lifetime participation in power training
ns
0.01
KE
S ! AS had more KE strength than S ! S and S ! A
0.05
Flywheel, isom (N m)
No differences in KE strength between S ! AE, S ! A, and S ! S
No differences in KE strength between S ! AS, S ! AE and a young
control group (age 28)
ns
ns
KE
AS had more KE strength and LE power than S
nm
Overall decline in LE strength and LE power with increasing age
0.05
45–68
Dyn, isom (N m/kg, N/
kg)
men 117
AE: runners
Klitgaard et al.
(1990)
Korhonen et al.
(2006)
Korhonen et al.
(2009)
68–70
18–33
40–49
50–59
60–69
70–84
17–33
40–49
50–59
60–69
AI: interval (soccer) players
AS: weight lifters
B: shooters
Active men trained for last 12–17 y 3/w and were
sedentary before:
S ! A: swimmers
S ! AE: runners
men 26
S ! AS: strength trained
S ! S: sedentary
AS: sprinters with national or international success during
life
S: habitual activity of low intensity
men 91
All participants were good national- or international-level
sprinters:
A ! B a decrease in training hours and sessions/w with
increasing
age
Dyn, isom (N)
LE power
JH, kin (cm)
men 58
66–82
Mean habitual activity (HA) of last week
Mean leisure activity (LA) of last week
LE1
1
LE strength declined 8% per decade
Dyn, isom (N)
70–82
Kostka et al.
(1997)
p<
KE PF
wn 217
A: mean activity rating within 5-y age groups
Karamanidis and
Arampatzis
(2005, 2006)
Results
S: sedentary
70–100
Hunter et al.
(2000, 2001)
Strengthd
wn 29
LE2
Smith machine,
(kg)
LE power
JH, kin (cm)
KE Power
isok
LE2 strength declined 9% per decade
LE power declined 11% per decade
KE power positively related to HA (r = 0.51) and LA (r = 0.58)
0.01
Ergometer, kin (W/kg)
G Model
AGG-2488; No. of Pages 16
Study
K.M. Volkers et al. / Archives of Gerontology and Geriatrics xxx (2011) xxx–xxx
Please cite this article in press as: Volkers, K.M., et al., Lower limb muscle strength (LLMS): Why sedentary life should never start? A
review. Arch. Gerontol. Geriatr. (2011), doi:10.1016/j.archger.2011.04.018
Table 2 (Continued )
7
Kostka et al.
(2000a,b)
Agea
65–84
HPA levelb
Subjectsc
Strengthd
Results
men 25
LE Power
No relation between LE power and MHDEE or LA in men
ns
(1) Mean habitual daily energy expenditure (MHDEE)
wn 29
Dyn, kin (W/kg)
No relation between LE power per kg quadriceps muscle and
MHDEE or LA in wn
LE power per kg body mass positively related to LA (r = 0.41) in wn
LE power per kg body mass positively related to MHDEE (r = 0.35) in
wn
A was faster than B, and B was faster than S
ns
0.05
0.06
(2) Leisure time sports activity (LA)
Kuh et al.
(2005)
Kuta et al.
(1970)
Leong et al.
(1999)
Lindstrom et al.
(2009)
Low Choy et al.
(2007)
McCrory et al.
(2009)
Miyatake et al.
(2009)
Neder et al.
(1999)
53
Leisure activity based on last 4 weeks:
men 1357
LE
wn 1400
10 chair stands, kin (s)
60–69
A: moderately active (5 exercises)
B: mildly active (1–4 exercises)
S: not active (0 exercises)
Activity based on at least 15 y:
men 132
KE KF
A and B of age 60–69 had more KE KF strength than S of age 60–69
0.05
70–79
A: intense physical contest sports
Cable
tensiometer,
isom (kg)
A of age 70–79 had more KE strength than S of age 70–79
0.05
65–84
B: regular recreational sports activities
S: never trained
Activity after age 50:
KE
A had 15% more KE strength than S
0.05
65–80
A: active in competitions; >41 METsh/w
S: no regular activity; <41 METsh/w
Activity based on at least 5 y:
AS had more KE strength than S
0.05
30–69
AS: weight lifters (until time of measurement in strength
training)
S: age-matched controls
Leisure activity within last y:
LE power
LA1 had more LE power than ‘S’
0.01
One-leg squat, kin
LA2 had more LE power than ‘S’
No difference in LE power between LA3 and ‘S’
0.08
ns
20–39
LA1: gym(nastics), aerobics
LA2: nordic walking, swimming
LA3: gardening, household activities
‘S’: sedentary people but also active people of another LA
group
Habitual physical activity (scale 1–6)
KE HAb HAd
Activity positively related to KE strength
0.01
40–49
No further information provided
Activity positively related to HAb HAd strength
0.05
Decline in KE strength in age group 60–69
Decline in KE HAb HAd strength in age group 70–79
Activity declined with increasing age
A had more KE KF strength than S
0.05
0.01
nm
0.001
A had more KE strength than S in both men and wn
0.05
Dyn, isom (N m/kg)
men 12
KE
Force transducer, isom
(N)
wn 316
wn 320
Spring-gauge,
(N m)
isom
50–59
60–69
70–79
65–93
Athletes of the National Senior Games:
men 103
KE KF
wn 64
Chair, isom (N m/kg)
20–69
A: runners, cyclists, swimmers
S: controls (ranging from sedentary to active)
Activity based on last 3 months:
men 3018
KE
wn 6881
Dyn, isom (kg, kg/kg)
men 34
KE
No relation between KE strength and HA in men
ns
wn 37
Dyn, isok (N m)
Positive relation (r = 0.42) between KE strength and HA in wn
0.01
men 108
KE
AS had more KE strength and LE power than S
0.05
20–39
40–59
60–80
Pearson et al.
(2002)
wn 40
0.001
40–89
A: minimum of 2/w at least 30 min per session
S: less than A
HA: habitual physical activity of last two weeks, including
occupation, sport and leisure activity
S: non-trained (most people score <8 on Baecke scale
(1982))
AS: elite master olympic weightlifters
K.M. Volkers et al. / Archives of Gerontology and Geriatrics xxx (2011) xxx–xxx
Laroche et al.
(2007)
p<
Activity based on 1 typical week:
G Model
Study
AGG-2488; No. of Pages 16
8
Please cite this article in press as: Volkers, K.M., et al., Lower limb muscle strength (LLMS): Why sedentary life should never start? A
review. Arch. Gerontol. Geriatr. (2011), doi:10.1016/j.archger.2011.04.018
Table 2 (Continued )
Agea
HPA levelb
Subjectsc
S: untrained
Pollock et al.
(1997)
60–69
All men were track athletes 20 y ago and more than 90% still
trained frequently at an intensity of 60–85% HRmax reserve
Dyn, isom (N)
men 21
70–78
Rantanen et al.
(1992)
Rantanen et al.
(1993)
Rantanen et al.
(1999)
Ringsberg et al.
(2001)
Sandler et al.
(1991)
79–89
90–92
50–60
A University: physical education teachers
>65
65–75
A: moderately active
B: minimally active
S: extremely inactive
A: active for last 20 y at least 1 h/w
76–89
S: random controls from urban (U) and rural (R) community
25–34
Amount of calories expended per week in ADL, walking,
climbing stairs and sports
wn 112
wn 94
wn 755
Scott et al.
(2009)
Sipila et al.
(1991)
70–81
66–85
LE strength declined at age 90–92
0.05
KE
A had more KE strength than S
0.001
Dyn, isom (N)
University had more KE strength than Vocational
0.05
KE
A had more KE strength than S
0.05
Dyn, isom (N)
No relation between work history and KE strength in A and S
ns
KE
Positive relation between activity and KE strength
0.05
LE Power
Dyn, kin (W, W/kg, W/
cm3)
LE
wn 357
KE KF
A had more KE KF strength than SU
0.05
No difference in KE KF strength between A and SR
ns
wn 620
Cybex II (AandSU),
transducer (SR), isom
(N m)
PFHAb
Positive relation between activity and PF HAb strength
0.01
Custom-made devices,
isom (kg, kg/kg)
Amount of ambulatory activity measured with a pedometer
during 5–7 consecutive days
Activity based on last 5 y:
men 481
LE
Positive relation between ambulatory activity and LE strength in wn
0.05
wn 501
Dyn, isom (kg, kg/kg)
0.06
men 139
KE
Positive relation between ambulatory activity and LE strength in
men
AS, A, AE more KE strength than S
Dyn, isom (N, N/kg)
LE power
JH, kin (cm)
AS, A more KE strength than AE
AS, A, AE more KE strength per kg lean body mass than S
A more KE strength per kg lean body mass than AE
0.05
0.01
0.01
KE
AS, A, AE more LE power than S
A more LE power than AS, AE
A had more KE strength than S
0.001
0.05
0.05
AS: weight lifters and throwers
A: sprinters and jumpers
AE: long distance runners, orienteer’s and cross-country
skiers
S: moderate active
Sipila and
Suominen (1994)
p<
ns
Dyn, isom (kg)
35–44
45–54
>55
50–79
Results
Rate of KE strength and LE power decline comparable between AS
and S
leg press machine, kin
(kg)
A Vocational: gymnastics
S University: other teachers
S Vocational: random control group
A: a mean of 50 y habitual activity and 70% still active for at
least 3/w
S: no regular activity
The history of heavy or sedentary manual work within each
group
Activity based on last 1–2 weeks:
66–85
Strengthd
Activity based on last 15–74 y:
wn 36
0.05
Dyn, isom (N, N m, N/
kg, N m/kg, N/cm2)
A: athletes participating in various sports (7 h/w training
within last y)
S: a random sample with mainly walking activities
A had more KE strength per kg body mass than S
2
No difference in KE strength per cm quadriceps muscle between A
and S
0.01
ns
G Model
AGG-2488; No. of Pages 16
Study
K.M. Volkers et al. / Archives of Gerontology and Geriatrics xxx (2011) xxx–xxx
Please cite this article in press as: Volkers, K.M., et al., Lower limb muscle strength (LLMS): Why sedentary life should never start? A
review. Arch. Gerontol. Geriatr. (2011), doi:10.1016/j.archger.2011.04.018
Table 2 (Continued )
9
Slade et al. (2002)
Tarpenning et al.
(2004)
60–85
40–49
50–59
60–69
70–79
80–89
40–49
HPA levelb
AS: participating in strength training >2d/wfor>12 w, and
habitual active for 3 d/w
A: 3 d/w habitual activities for at least 25 min/d
AE: master athletes for at least 5 y and now running 15 km/
w and at least 1/y in organized running competition
AE: master athletes for at least 5 y and now running at least
50–59
60–69
15 km/w
S: run less than 1 mile/w or spend less than 30 min/win
activity
Visser et al. (2005)
70–79
Xu et al. (2008)
>60
Yoshiga et al.
(2002)
65–66
Activity based on last 7 days:
A: 1000 kcal/w physical activity
B: <1000 kcal/w physical activity and >2719 kcal/w total
activity
S: <1000 kcal/w physical activity and <2719 kcal/w total
activity
Walking on last 7 days:
Frequent walkers: >400 kcal/w
Occasional walkers: <400 kcal/w
Never walkers: 0 kcal/w
A1: minimal 4 y only regular Tai Chi exercise
A2: minimal 4 y regular jogging and other exercise, but no
Tai Chi
S: minimal 5 y no regular exercise
Activity based on at least 40 y:
A: rowing more than 2/w
S: untrained (not further specified)
Subjectsc
Strengthd
men 18
LE power
wn 17
Cycle ergometer, kin
(W, W/l, W/kg)
LE
Double leg press, kin
(kg)
KE
men 107
wn 94
Results
p<
AS had more LE strength and LE power per l lean thigh volume than
A
No difference in LE power per kg fat free mass between A and AS
0.05
ns
Dyn, isok (N m/kg)
No difference in KE strength between age groups 40–49, 50–59, 60–
69
KE strength decreased in age group 70–79 and 80–89
0.05
KE
No difference in KE strength between AE and S
ns
Dyn, isok (N m, N m/kg)
AE less KE strength when normalized for kg lean body mass than S
KE strength declined with age
0.05
0.05
ns
men 1443
wn 1544
KE
Dyn, isok (N m)
No decline in KE strength when normalized for kg lean body mass
Physical activity positively related to KE strength
A and B had more KE strength than S
No relation between walking and KE strength in both men and wn
ns
0.001
0.001
ns
men 36
wn 25
KE KF AD PF
Dyn, isok (N m/kg)
A2 had more KE KF strength than S
No difference in KE KF strength between A1 and A2
0.05
ns
men 30
KE power
A1+2 had more AD strength than S
A had more KE power than S
0.05
0.05
Dyn, isok (W)
Notes: A: active; AD: ankle dorsiflexion; ADL: activities of daily living; AE: active involving endurance; AI: active involving interval; AP: active involving power; AS: active involving strength; B: semi-active; cm: centimeters; d: days;
dyn: dynamometer; h: hours; HAb: hip abduction; HAd: hip adduction; HRmax: maximal heart rate; isok: isokinetic; isom: isometric; JH: jumping height; kcal: kilocalories; KE: knee extension; KF: knee flexion; kg: kilogram; kin:
kinetic; km: kilometers; l: liters; LA: leisure activity; LE: leg extension; METs: metabolic equivalent of tasks; min: minutes; N: Newton; NDom: non-dominant; nm: not mentioned; N m: Newton meter; ns: not significant; PF: plantar
flexion; S: sedentary; s: seconds; w: week; W: Watt (N m/s); wn: women; y: years.
a
Age range of groups in years.
b
HPA groups: habitual physical activity level of each group.
c
Gender and number of participants.
d
Strength measurement.
K.M. Volkers et al. / Archives of Gerontology and Geriatrics xxx (2011) xxx–xxx
Tarpenning et al.
(2006)
Agea
G Model
Study
AGG-2488; No. of Pages 16
10
Please cite this article in press as: Volkers, K.M., et al., Lower limb muscle strength (LLMS): Why sedentary life should never start? A
review. Arch. Gerontol. Geriatr. (2011), doi:10.1016/j.archger.2011.04.018
Table 2 (Continued )
G Model
AGG-2488; No. of Pages 16
K.M. Volkers et al. / Archives of Gerontology and Geriatrics xxx (2011) xxx–xxx
in LLMS for people with a decreasing level of HPA (Aniansson et al.,
1992; Connelly and Vandervoort, 1997; Rantanen et al., 1997;
Frontera et al., 2000; Hughes et al., 2001; Uusi-Rasi et al., 2006;
Kortebein et al., 2008), with one study showing a decline only for
knee extension strength, but not for knee flexion strength over 9
years (Frontera et al., 2008). In contrast with results from the metaanalysis, one longitudinal study could not support a decline in knee
extension strength for sedentary people within 6 years (Uusi-Rasi
et al., 2006) and three studies suggest that the decline in LLMS is
faster in a group of people with a decreasing level of HPA than the
decline in a sedentary group (Rantanen et al., 1997; Uusi-Rasi et al.,
2006); people who decrease their level of HPA end up with an
amount of LLMS that is comparable to that of sedentary people
(Gauchard et al., 2003).
Dynamic LLMS and power seems to be more vulnerable to
aging than static LLMS for two reasons. First, no decline in static
knee extension strength within 6–8 years was observed in
habitually physically active people (Greig et al., 1993; Uusi-Rasi
et al., 2006), while dynamic LLMS and power showed a significant
decline within 6–10 years (Hughes et al., 2001; Uusi-Rasi et al.,
2006). Second, some studies with both static and dynamic
strength measurements show that the decline in dynamic
strength is higher than the decline in static strength (Aniansson
et al., 1983; Pearson et al., 2002; Korhonen et al., 2009) and that
dynamic power declines even faster than dynamic strength
(Grassi et al., 1991; Pearson et al., 2002; Korhonen et al., 2009). No
exploratory analysis could be done between the decline in static
and dynamic strength measurements due to the fact that there
were only two longitudinal studies which provided the amount of
dynamic strength in Newton and the level of HPA (Frontera et al.,
2000, 2008).
HPA
Study
Strength
74
Aagaard et al., 2007
65
Dreyer et al., 2006
71
Leong et al., 1999
54
Pearson et al., 2002
64
Pearson et al., 2002
74
Pearson et al., 2002
84
Pearson et al., 2002
Combined Effect Size Strength
Other
Brooke-Wavel et al., 2009
Hunter et al., 2001
Laroche et al., 2007
McCrory et al.,2009
Rantanen et al., 1992
Rantanen et al., 1993
Rantanen et al., 1997a
Rantanen et al., 1997a
Rantanen et al., 1998a
Rantanen et al., 1998a
Ringsberg et al., 2001
Ringsberg et al., 2001
Sipila et al., 1994
Visser et al., 2005
Visser et al., 2005
Combined Effect Size Other
Age
68
53
71
74
55
74
75
75
80
80
71
80
74
73
74
Endurance Aagaard et al., 2007
72
Dreyer et al., 2006
67
Harridge et al., 1997
79
Karamanidis et al., 2006
64
Tarpenning et al., 2006
56
Combined Effect Size Endurance
Gender
HPA in the past (before age 40) are not relevant for the amount
of LLMS (Aniansson et al., 1980; Aoyagi and Katsuta, 1990; Bischoff
et al., 2001; Gauchard et al., 2003) at the age of 60 or older.
Therefore, men with an equal level of HPA in the last year, have
comparable knee extension strength (Aoyagi and Katsuta, 1990)
and leg extension power (Kettunen et al., 1999) irrespective of the
age at which they took on their active lifestyles (i.e., before age 35,
after age 40 or 50). This finding is supported by a non-significant
negative relation between the effect size of the eighteen crosssectional studies, measuring the difference in knee extension
strength between habitually physically active people and sedentary people and the amount of years that the 1475 habitually
physically active people are already active (r = 0.13, p = 0.53).
3.3. Are the results influenced by age, gender and type of HPA?
3.3.1. Age
The mean age of participants showed a non-significant negative
correlation with effect sizes for both cross-sectional differences
(n = 27 studies) (r = 0.11, p = 0.61) and correlation studies (n = 14
studies) (r = 0.25, p = 0.43) and a non-significant positive
correlation with effect size of muscle strength decline (n = 23
studies) (r = 0.23, p = 0.30). This indicates that there is no evidence
of an age effect for all outcomes.
3.3.2. Gender
Exploratory analysis did not show any significant difference
between fourteen studies with only men (n = 627) and twelve
studies with only women (n = 753) for cross-sectional differences
in knee extension strength between HPA and sedentary groups
(Q(1) = 0.16, p = 0.69). Due to the fact that only two correlation
p
Effect size
(95%CI)
1.17 ( 0.07- 2.27)
0.99 ( 0.08- 1.89)
1.11 (-0.12- 2.35)
1.71 ( 0.69- 2.74)
5.35 ( 3.87- 6.83)
3.01 ( 1.88- 4.13)
4.99 ( 2.18- 7.79)
2.41 ( 1.26- 3.55)
0.04
0.03
0.08
0.00
0.00
0.00
0.00
0.00
w
w
w
m,w
w
w
m
w
m
w
w
w
w
w
m
0.74
6.27
0.67
1.28
0.44
0.53
0.30
0.73
1.25
0.39
1.18
1.17
1.00
7.00
7.00
2.05
( 0.27- 1.22)
( 5.62- 6.92)
( 0.03- 1.31)
( 0.95- 1.62)
(-0.12- 0.99)
( 0.11- 0.95)
(-0.42- 1.01)
( 0.20- 1.26)
( 0.12- 2.37)
(-0.18- 0.96)
( 0.87- 1.50)
( 0.70- 1.64)
( 0.27- 1.73)
( 6.59- 7.41)
( 6.62- 7.38)
( 0.56- 3.54)
0.00
0.00
0.04
0.00
0.12
0.01
0.42
0.01
0.03
0.18
0.00
0.00
0.01
0.00
0.00
0.01
m
m
m
m
w
1.33
1.26
0.26
0.49
0.21
0.46
( 0.28- 2.38)
( 0.34- 2.17)
(-0.42- 0.95)
(-0.28- 1.25)
(-0.21- 0.64)
( 0.16- 0.75)
0.01
0.01
0.45
0.22
0.33
0.00
0.89 ( 0.50- 1.28)
0.00
m
m
m
m
m
m
m
Total Combined Effect Size
11
-8.0
-4.0
0.0
4.0
8.0
Cohen d Effect Size (95%CI)
Notes: m: men; w: women.
a longitudinal study (other studies are cross-sectional).
Fig. 1. Effect sizes for the cross-sectional differences in knee extension strength between a HPA group and a sedentary group.
Please cite this article in press as: Volkers, K.M., et al., Lower limb muscle strength (LLMS): Why sedentary life should never start? A
review. Arch. Gerontol. Geriatr. (2011), doi:10.1016/j.archger.2011.04.018
G Model
AGG-2488; No. of Pages 16
K.M. Volkers et al. / Archives of Gerontology and Geriatrics xxx (2011) xxx–xxx
12
studies with men were available; no exploratory analysis for
gender was done for correlation studies. The rate of decline in knee
extension strength was slightly slower in six studies with only
women (n = 134) (d = 0.40; 95%CI = 0.79 to 0.01; p = 0.04)
than fourteen studies with only men (n = 217) (d = 1.04;
95%CI = 1.74 to 0.35; p = 0.003), but this difference was not
significant (Q(1) = 2.51, p = 0.11). This indicates that there is no
evidence of a gender effect for both outcomes.
3.3.3. Type of HPA
When we divide habitually physically active people in three
different groups based on characteristics of their HPA, effect size is
the highest for 68 people who participate in HPA that are mainly
focused on strength (d = 2.41; 95%CI = 1.26–3.55; p < 0.001),
followed by 1217 people who participate in other (no specific)
HPA (d = 2.00; 95%CI = 0.65–3.35; p < 0.01) and 117 people who
participate in HPA that are mainly focused on endurance (d = 0.46;
95%CI = 0.16–0.75; p < 0.01) (Fig. 1). Data of people participating
in strength activities and other (no specific) HPA were heterogeneously distributed (Q(6) = 36.33, p < 0.001 and Q(14) = 1646.39,
p < 0.001, respectively) and data of people participating in
endurance
activities
were
homogeneously
distributed
(Q(4) = 7.17, p = 0.13). The group with endurance activities had
a significant lower effect size compared to the groups with
strength and other (no specific) HPA (Q(1) = 8.64, p = 0.003 and
Q(1) = 3.88, p = 0.05, respectively). The difference in effect size
between the group with strength activities and other (no specific)
HPA was not significant (Q(1) = 0.20, p = 0.65), although it should
be interpreted with caution, because both groups were heterogeneously distributed. For strength activities, other (no specific)
HPA and endurance activities the degree of funnel plot asymmetry
was p = 0.05; p = 0.29; p = 0.03 respectively, fail safe N was 157;
4196; 13 respectively and the relation between effect size and
sample size was r = 0.25, p = 0.59; r = 0.69, p < 0.001; r = 0.64,
p = 0.25, respectively. In terms of endurance activities, this
indicates that there is possible evidence for publication bias
and the necessity to interpret outcomes cautiously, there is some
evidence for publication bias in strength activities and no
evidence for publication bias in other (no specific) HPA.
Exploratory analysis between types of HPA was not possible for
correlation studies and studies measuring the decline in knee
HPA
OA
HPA
HPA
LA
LA
HPA
HPA
HPA
OA
OA
HPA
HPA
SA
Sed
Study
Andrews et al., 1996
Aoyagi et al., 2009
Aoyagi et al., 2009
Bohannon et al., 1997
Hunter et al., 2001
Low Choy et al., 2007
Neder et al., 1999
Neder et al., 1999
Rantanen et al., 1993
Rantanen et al., 1993
Rantanen et al., 1997a
Rantanen et al., 1997a
Sipila et al., 1994
Sipila et al., 1994
Total Combined Effect Size
Age Gender
m,w
64
73
m
w
72
20-79 m,w
w
53
w
55
20-80 m
20-80 w
w
74
w
75
75
m
75
w
74
w
74
w
Effect size
(95%CI)
0.11
0.15
0.25
0.20
0.41
0.28
0.13
0.42
-0.01
0.21
0.40
0.25
0.36
0.01
(-0.05- 0.26)
(-0.08- 0.36)
( 0.05- 0.43)
( 0.08- 0.33)
( 0.29- 0.52)
( 0.07- 0.47)
(-0.22- 0.45)
( 0.11- 0.66)
(-0.29- 0.28)
(-0.14- 0.51)
( 0.21- 0.55)
( 0.11- 0.39)
(-0.11- 0.70)
(-0.53- 0.54)
extension strength due to a small amount of studies with different
types of HPA.
Reviewing comparable literature with other LLMS measurements, one study supports the result from the meta-analysis that a
group with endurance activities has less LLMS and power than a
group with strength activities (Sipila et al., 1991). In contrast with
results from the meta-analysis, six studies found no significant
difference in LLMS between people participating in endurance
activities and sedentary people (Klitgaard et al., 1990; Grassi et al.,
1991; Alway et al., 1996; Harridge et al., 1997; Karamanidis and
Arampatzis, 2005, 2006). In one study, a group with mainly
strength activities had significantly more LLMS and power than a
group with other (no specific) HPA (Slade et al., 2002).
4. Discussion
4.1. Does present HPA have a positive influence on LLMS?
Habitually physically active people have more LLMS than
sedentary people with an effect size of d = 1.89, as indicated by 18
different studies with 1475 habitually physically active and 1379
sedentary people in the meta-analysis and 23 studies in the review.
It should be noted that in the meta-analysis various groups (age or
gender) in one study were separately analyzed which might have
caused less variance in the results. Although detailed information
is lacking, we argue that the heterogeneity of effect in Fig. 1 is due
to the differences in intensity of the HPA level, mainly in the active
groups, because there is less variance in intensity level in the
sedentary groups. Higher levels of physical activity are associated
with higher levels of LLMS in a continuous dose–response manner.
The higher effect sizes are caused by vigorous sport physical
activities and exercise performed most days of the week (like
weight lifting, or burning 8642 kcal/week, which is for a person of
70 kg body weight comparable to climbing hills with 42+-lb load
for almost 2 h every day (Ainsworth et al., 2000)). Medium effect
sizes are observed in moderate physical activities for (at least) 4 h
per week (domestic work such as dusting, making beds, ordinary
gardening) or vigorous physical activities for (at least) 2 h per week
(activities causing breathlessness and sweating). Low effect sizes
are observed in moderate physical activities for maximal 3 h per
week or when people perform only cardiovascular endurance sport
p
0.17
0.20
0.02
0.00
0.00
0.01
0.47
0.01
0.97
0.24
0.00
0.00
0.13
0.98
0.25 ( 0.20- 0.30) 0.00
-1.0
0.0
0.5
1.0
-0.5
Cohen d Effect Size (95%CI)
Notes: LA: leisure physical activity; m: men; OA: occupational physical activity; SA: sport physical activity; Sed: sedentary with mainly
walking activities; w: women.
a longitudinal study (other studies are cross-sectional)
Fig. 2. Effect sizes for the correlation between HPA and knee extension strength.
Please cite this article in press as: Volkers, K.M., et al., Lower limb muscle strength (LLMS): Why sedentary life should never start? A
review. Arch. Gerontol. Geriatr. (2011), doi:10.1016/j.archger.2011.04.018
G Model
AGG-2488; No. of Pages 16
K.M. Volkers et al. / Archives of Gerontology and Geriatrics xxx (2011) xxx–xxx
HPA
Study
Active
Bohannon et al., 1997
Bohannon et al., 1997
Bohannon et al
al., 1997
Bohannon et al., 1997
Pearson et al., 2002
Pearson et al., 2002
Pearson et al., 2002
Rantanen et al., 1997a
Rantanen et al., 1997a
Rantanen et al., 1998a
Rantanen et al., 1998a
Combined Effect Size Active
Age Gender FU
13
p
Effect size
(95%CI)
-0.73 (-1.38- -0.08)
-0.97 (-1.63- -0.31)
-0.96 (-1.63- -0.29)
-0.24 (-0.87- 0.39)
0.91 ( 0.11- 1.72)
-5.21 (-6.74- -3.68)
2.34 ( 0.97- 3.71)
-0.11 (-0.67- 0.46)
0.06 (-0.50- 0.63)
-0.74 (-1.90- 0.44)
-0.28 (-0.85- 0.29)
-0.36 (-0.57- -0.14)
0.03
0.00
00.01
01
0.45
0.03
0.00
0.00
0.71
0.83
0.22
0.33
00.00
00
54
55
65
66
54
64
74
75
75
80
80
w
m
w
m
m
m
m
m
w
m
w
11.0
11.4
8.3
83
6.8
10.0
10.0
5.0
5.0
5.0
5.0
5.0
Sedentary Al-Abdulwahab et al., 1999 59
Al-Abdulwahab et al., 1999 64
Al-Abdulwahab et al., 1999 72
Pearson et al., 2002
53
Pearson et al., 2002
64
75
Pearson et al., 2002
75
Rantanen et al., 1997a
a
Rantanen et al., 1997
75
Com bine d Effectt Size Sedentary
m
m
m
m
m
m
m
w
5.0
8.0
9.0
11.0
11.0
9.0
5.0
5.0
-2.69 (-3.50- -1.87)
-0.99 (-1.65- -0.32)
-1.76 (-2.53- -0.99)
-1.44 (-2.35- -0.53)
-2.52 (-3.50- -1.55)
-1.68 (-2.93- -0.42)
-0.03 (-0.87- 0.80)
0.08 (-0.37- 0.54)
-0.99 (-1.25- -0.72)
0.00
0.00
0.00
0.00
0.00
0.01
0.94
0.73
0.00
Decrease Connelly et al., 1997a
82
Frontera et al., 2000a
65
a
Frontera et al., 2008
71
a
67
Kortebein et al., 2008
Combined Effect Size Decrease
Total Combined Effect Size
w
m,w
m,w
m,w
1.0
13.0
9.0
0.03
-0.99 (-1.92- -0.06)
-0.97 (-1.95- 0.00)
-1.40 (-2.38- -0.42)
-1.12 (-2.02- -0.22)
-1.12 (-1.59- -0.65)
-0.66 (-0.82- -0.51)
0.04
0.05
0.01
0.02
0.00
0.00
-4.0
-2.0
0.0
2.0
4.0
Cohen d Effect Size (95%CI)
Notes: Age: age at baseline (years); FU: follow-up measurement (years); HPA: habitual physical activity between baseline and follow-up measurement;
m: men; w: women.
a
longitudinal study (other studies are cross-sectional)
Fig. 3. Effect Sizes for the decline in knee extension strength of people with a stable active, stable sedentary or a decreasing level of HPA.
activities (running nonstop for at least 15 km or 1 h a day,
regardless of the amount of days per week). The correlation
between HPA and LLMS showed an effect size of d = 0.25 as
indicated by 9 studies with 1315 people in the meta-analysis and
18 studies in the review. Only two studies showed no relation
between occupational physical activity and LLMS (Aniansson et al.,
1980; Borges, 1989), possibly because people who perform highly
physical activities at work tend to engage in less physical activities
during leisure time; literature for adults shows that leisure-time
activity levels tend to increase over time, while occupational
physical activity decreases over time (Knuth and Hallal, 2009).
4.2. Can HPA in the past and present delay a decline in LLMS?
Results from this meta-analysis indicate that people who
maintain a high level of HPA show no decline in static knee
extension strength within 5–11 years (p = 0.13). This result is
supported by two other longitudinal studies (Greig et al., 1993; UusiRasi et al., 2006). There is evidence that dynamic LLMS declines
faster than static LLMS in habitually physically active people
(Pearson et al., 2002; Anton et al., 2004; Korhonen et al., 2009), but
the exact rate of dynamic LLMS decline is not known. One
explanation might be that dynamic muscle strength performance
does not solely depend on strength, but also on range of joint motion
and prolonged reaction time (Gerdhem et al., 2003), both of which
are vulnerable to aging (Grimston et al., 1993; Sturnieks et al., 2008).
In contrast to active people, sedentary people show a significant
decline in static knee extension strength within 5–11 years
(d = 1.35) although findings were wide-ranging. One longitudinal
study showed no support for this significant decline (Uusi-Rasi
et al., 2006). An explanation for this contrasting result is that, in the
latter study, the sedentary group engaged in HPA for 3.5 h per
week; the sedentary groups in all other studies were active for less
than 2 h per week. In combination with the result that sedentary
people have less knee extension strength than habitually
physically active people, a decline in LLMS means that sedentary
people are exposed to a higher risk of severe functional
impairment (Reid et al., 2008; Rodrigues et al., 2009).
People who decrease their level of HPA show a significant
decline in knee extension strength within 10 days to 12 years
(d = 1.12). This result was consistent among studies in the metaanalysis and was supported by six longitudinal studies in the
review (Aniansson et al., 1992; Connelly and Vandervoort, 1997;
Frontera et al., 2000; Hughes et al., 2001; Uusi-Rasi et al., 2006;
Kortebein et al., 2008) and one cross-sectional study (Korhonen
et al., 2009). The majority of the studies show that knee flexion
strength declines in a similar way as knee extension strength
(Frontera et al., 2000; Hughes et al., 2001; Kortebein et al., 2008),
except for one study (Frontera et al., 2008).
The respective declines in LLMS in these three groups (a HPA
group, a sedentary group and a group of people who decrease their
HPA) did not differ significantly from one another in the metaanalysis. The length of follow-up could not explain the heterogeneity in Fig. 3, but it should be noted that in the group of people
who decrease their HPA, half of the studies measured a decline in
knee extension over a much shorter period (10 days and 1 year)
compared to the other studies that showed a decline in knee
extension strength in the habitually physically active group and
the sedentary group (5–13 years). A comparable decline in
strength within a shorter period would suggest a faster decline
Please cite this article in press as: Volkers, K.M., et al., Lower limb muscle strength (LLMS): Why sedentary life should never start? A
review. Arch. Gerontol. Geriatr. (2011), doi:10.1016/j.archger.2011.04.018
G Model
AGG-2488; No. of Pages 16
14
K.M. Volkers et al. / Archives of Gerontology and Geriatrics xxx (2011) xxx–xxx
in strength. Three other studies in this review support a faster
decline in LLMS in the group of people who decrease their HPA
compared to the habitually physically active group and the
sedentary group (Rantanen et al., 1997; Gauchard et al., 2003;
Uusi-Rasi et al., 2006). Together with the result that HPA before the
age of 40 seems to have little effect on LLMS and power after the
age of 60, this finding implies that physical activity in distant
history (e.g., 10 years ago) is less beneficial for present LLMS than
more recent physical activity (e.g., only 1 year ago). This indicates
that a high level of HPA in the present is a prerequisite for
maintaining high levels of LLMS.
Overall, LLMS declines when people cease their HPA. Unfortunately, most people show a decline in level of HPA during aging
(Johannsen et al., 2008; Corder et al., 2009), especially after
retirement (Bryant et al., 2007) or when people move into a
nursing home (Ruuskanen and Parkatti, 1994). These people have
an increased risk of becoming disabled, because both lower
physical activity level and declined muscle strength are significant
predictors of disability (Rantanen et al., 1999). Therefore, older
people should be encouraged to participate regularly in HPA to
delay the decline in LLMS and the associated negative effects on, for
example, health and cognition.
the studies, which may contribute to variations found in the
various studies (Al-Abdulwahab, 1999). However, the correlations
between various strength and power measurements are high
(Davies et al., 1984; Hautier et al., 1996; Boussuge et al., 2006).
Furthermore, some categories show a limited number of studies
involving LLMS measurements, for example for men or women of
different ages. More research is necessary to determine the
difference in decline in LLMS between people with different types
of HPA. In addition, more longitudinal studies covering a longer
period are necessary, because cross-sectional studies can underestimate the changes with age compared to a longitudinal design,
as seen with upper limb strength (Desrosiers et al., 1998).
5. Conclusions
In conclusion, to obtain a high amount of LLMS during aging, it
is important to achieve and maintain a high level of HPA with
mainly muscle-strengthening activities throughout a person’s
lifetime, performing moderate physical activities for (at least) 4 h
per week or vigorous physical activities for (at least) 2 h per week.
Future research should now focus on how age affects the ability
and level of HPA, because during normal aging people decline their
HPA level.
4.3. Are the results influenced by age, gender and type of HPA?
Age does not seem to influence the relation between present
HPA and knee extension strength. At all ages, HPA can increase
LLMS. This result is comparable to a review showing that older
people of all ages are able to increase LLMS by strength training
(Liu and Latham, 2009). At all ages, the loss of knee extension
strength seems to be the same in this meta-analysis. However,
because most people decrease their level of HPA as they grow
older, it is more likely that older people lose more strength, but this
might be caused mainly by a decreasing level of HPA.
Men and women do not seem to differ in the relation between
HPA and LLMS in this meta-analysis; the difference in knee
extension strength between habitually active people and sedentary people was not different for men and women (p = 0.69). In line
with other studies (Aniansson et al., 1980; Hurley, 1995), the rate
of decline in knee extension strength was slightly, but not
significantly, slower for women (d = 0.40) than for men
(d = 1.04).
Various types of HPA have a positive influence on knee
extension strength, as indicated by significant effect sizes for
people who perform HPA that are mainly focused on strength, on
other (no specific) HPA, or mainly on endurance (d = 2.41, d = 2.05,
d = 0.46 respectively). However, the influence of habitual endurance activities on knee extension strength was significantly lower
than that of habitual strength activities. A possible explanation is
that endurance activities mainly increase the aerobic capacity of
the involved muscles (muscular endurance) and not muscle mass
specifically (Goldspink, 2005; Scharhag-Rosenberger et al., 2009).
Muscle mass is positively related to strength (Fukunaga et al.,
2001) and can be increased by (strength) activities of sufficient
intensity and duration (Goldspink, 2005). It should be noted that
endurance activities are important for aerobic capacity (Goldspink,
2005), cognition, especially for executive functions (Kramer et al.,
1999, 2006) and it lowers the risk of mobility limitations (Visser
et al., 2005) and dementia (Neumann and Frasch, 2007). Muscle
tissue is highly plastic that responds to the type and intensity of
day to day demands.
4.4. Limitations
The present meta-analysis and review have several limitations.
First, the type of strength measurement differs throughout most of
Conflicts of interest statement
None.
Acknowledgement
We thank Martijn Wieling for his writing assistance. There was
no funding for this study.
References
Aagaard, P., Magnusson, P.S., Larsson, B., Kjaer, M., Krustrup, P., 2007. Mechanical
muscle function, morphology, and fiber type in lifelong trained elderly. Med.
Sci. Sports Exerc. 39, 1989–1996.
Ainsworth, B.E., Haskell, W.L., Whitt, M.C., Irwin, M.L., Swartz, A.M., Strath, S.J.,
O’Brien, W.L., Bassett Jr., D.R., Schmitz, K.H., Emplaincourt, P.O., Jacobs Jr., D.R.,
Leon, A.S., 2000. Compendium of physical activities: an update of activity codes
and MET intensities. Med. Sci. Sports Exerc. 32 (9 Suppl.), S498–S504.
Al-Abdulwahab, S.S., 1999. The effects of aging on muscle strength and functional
ability of healthy Saudi Arabian males. Ann. Saudi Med. 19, 211–215.
Alway, S.E., Coggan, A.R., Sproul, M.S., Abduljalil, A.M., Robitaille, P.M., 1996. Muscle
torque in young and older untrained and endurance-trained men. J. Gerontol. A:
Biol. Sci. Med. Sci. 51, B195–B201.
Amara, C.E., Rice, C.L., Koval, J.J., Paterson, D.H., Winter, E.M., Cunningham, D.A.,
2003. Allometric scaling of strength in an independently living population age
55–86 years. Am. J. Hum. Biol. 15, 48–60.
Andrews, A.W., Thomas, M.W., Bohannon, R.W., 1996. Normative values for isometric muscle force measurements obtained with hand-held dynamometers.
Phys. Ther. 76, 248–259.
Aniansson, A., Grimby, G., Rundgren, A., 1980. Isometric and isokinetic quadriceps
muscle strength in 70-year-old men and women. Scand. J. Rehabil. Med. 12,
161–168.
Aniansson, A., Sperling, L., Rundgren, A., Lehnberg, E., 1983. Muscle function in 75year-old men and women. A longitudinal study. Scand. J. Rehabil. Med. Suppl. 9,
92–102.
Aniansson, A., Grimby, G., Hedberg, M., 1992. Compensatory muscle fiber hypertrophy in elderly men. J. Appl. Physiol. 73, 812–816.
Anton, M.M., Spirduso, W.W., Tanaka, H., 2004. Age-related declines in anaerobic
muscular performance: weightlifting and powerlifting. Med. Sci. Sports Exerc.
36, 143–147.
Aoyagi, Y., Katsuta, S., 1990. Relationship between the starting age of training and
physical fitness in old age. Can. J. Sport Sci. 15, 65–71.
Aoyagi, Y., Park, H., Watanabe, E., Park, S., Shephard, R.J., 2009. Habitual physical
activity and physical fitness in older Japanese adults: the Nakanojo Study.
Gerontology 55, 523–531.
Asaka, M., Usui, C., Ohta, M., Takai, Y., Fukunaga, T., Higuchi, M., 2009. Elderly
oarsmen have larger trunk and thigh muscles and greater strength than agematched untrained men. Eur. J. Appl. Physiol. 108, 1239–1245.
Bertrand, A.M., Mercier, C., Bourbonnais, D., Desrosiers, J., Grave, D., 2007. Reliability
of maximal static strength measurements of the arms in subjects with hemiparesis. Clin. Rehabil. 21, 248–257.
Please cite this article in press as: Volkers, K.M., et al., Lower limb muscle strength (LLMS): Why sedentary life should never start? A
review. Arch. Gerontol. Geriatr. (2011), doi:10.1016/j.archger.2011.04.018
G Model
AGG-2488; No. of Pages 16
K.M. Volkers et al. / Archives of Gerontology and Geriatrics xxx (2011) xxx–xxx
Bianchi, E., 2005. Living with elder wisdom. J. Gerontol. Soc. Work 45, 319–329.
Bischoff, H.A., Conzelmann, M., Lindemann, D., Singer-Lindpaintner, L., Stucki, G.,
Vonthein, R., Dick, W., Theiler, R., Stahelin, H.B., 2001. Self-reported exercise
before age 40: influence on quantitative skeletal ultrasound and fall risk in the
elderly. Arch. Phys. Med. Rehabil. 82, 801–806.
Bohannon, R.W., 1997. Reference values for extremity muscle strength obtained by
hand-held dynamometry from adults aged 20 to 79 years. Arch. Phys. Med.
Rehabil. 78, 26–32.
Borenstein, M., 1999. Comprehensive Meta-Analysis, A Computer Program for
Research Synthesis, 2nd ed. Biostat Inc., Englewood, NJ.
Borges, O., 1989. Isometric and isokinetic knee extension and flexion torque in men
and women aged 20–70. Scand. J. Rehabil. Med. 21, 45–53.
Boussuge, P.Y., Rance, M., Bedu, M., Duche, P., Praagh, E.V., 2006. Peak leg muscle
power, peak VO2 and its correlates with physical activity in 57 to 70-year-old
women. Eur. J. Appl. Physiol. 96, 10–16.
Brooke-Wavell, K., Cooling, V.C., 2009. Fall risk factors in older female lawn bowls
players and controls. J. Aging Phys. Act. 17, 123–130.
Bryant, E.C., Trew, M.E., Bruce, A.M., Cheek, L., 2007. Lower limb muscle strength and
physical activity in healthy individuals approaching retirement. J. Sports Sci. 25,
835–842.
Buford, T.W., Cooke, M.B., Manini, T.M., Leeuwenburgh, C., Willoughby, D.S., 2010.
Effects of age and sedentary lifestyle on skeletal muscle NF-kappaB signaling in
men. J. Gerontol. A: Biol. Sci. Med. Sci. 65, 532–537.
Bunyard, L.B., Katzel, L.I., Busby-Whitehead, M.J., Wu, Z., Goldberg, A.P., 1998.
Energy requirements of middle-aged men are modifiable by physical activity.
Am. J. Clin. Nutr. 68, 1136–1142.
Casale, R., Rainoldi, A., Nilsson, J., Bellotti, P., 2003. Can continuous physical training
counteract aging effect on myoelectric fatigue? A surface electromyography
study application. Arch. Phys. Med. Rehabil. 84, 513–517.
Casey, M.M., Eime, R.M., Payne, W.R., Harvey, J.T., 2009. Using a socioecological
approach to examine participation in sport and physical activity among rural
adolescent girls. Qual. Health Res. 19, 881–893.
Cochran, W.G., 1954. The combination of estimates from different experiments.
Biometrics 10, 101–129.
Cohen, J., 1988. Statistical Power Analyses for the Behavioral Sciences, 2nd ed.
Erlbaum, Hillsdale, NY.
Connelly, D.M., Vandervoort, A.A., 1997. Effects of detraining on knee extensor
strength and functional mobility in a group of elderly women. J. Orthop. Sports
Phys. Ther. 26, 340–346.
Corder, K., Ogilvie, D., van Sluijs, E.M., 2009. Invited commentary: physical activity
over the life course—whose behavior changes, when, and why? Am. J. Epidemiol. 170, 1078–1081.
Davies, C.T., Wemyss-Holden, J., Young, K., 1984. Measurement of short term power
output: comparison between cycling and jumping. Ergonomics 27, 285–296.
De Rekeneire, N., Visser, M., Peila, R., Nevitt, M.C., Cauley, J.A., Tylavsky, F.A.,
Simonsick, E.M., Harris, T.B., 2003. Is a fall just a fall: correlates of falling in
healthy older persons. The Health, Aging and Body Composition Study. J. Am.
Geriatr. Soc. 51, 841–846.
Desrosiers, J., Hebert, R., Bravo, G., Rochette, A., 1998. Comparison of cross-sectional
and longitudinal designs in the study of aging of upper extremity performance.
J. Gerontol. A: Biol. Sci. Med. Sci. 53, B362–B368.
Dik, M., Deeg, D.J., Visser, M., Jonker, C., 2003. Early life physical activity and
cognition at old age. J. Clin. Exp. Neuropsychol. 25, 643–653.
Dreyer, H.C., Schroeder, E.T., Hawkins, S.A., Marcell, T.J., Tarpenning, K.M., Vallejo,
A.F., Jensky, N.E., Shaibi, G.Q., Spears, S., Yamada, R., Wiswell, R.A., 2006. Chronic
exercise and skeletal muscle power in older men. Appl. Physiol. Nutr. Metab. 31,
190–195.
Duque, I., Parra, J.H., Duvallet, A., 2009. Physical deconditioning in chronic low back
pain. J. Rehabil. Med. 41, 262–266.
Egger, M., Davey, S.G., Schneider, M., Minder, C., 1997. Bias in meta-analysis
detected by a simple, graphical test. Brit. Med. J. 315, 629–634.
Era, P., Lyyra, A.L., Viitasalo, J.T., Heikkinen, E., 1992. Determinants of isometric muscle
strength in men of different ages. Eur. J. Appl. Physiol. Occup. Physiol. 64, 84–91.
Fatouros, I.G., Kambas, A., Katrabasas, I., Leontsini, D., Chatzinikolaou, A., Jamurtas,
A.Z., Douroudos, I., Aggelousis, N., Taxildaris, K., 2006. Resistance training and
detraining effects on flexibility performance in the elderly are intensity-dependent. J. Strength Cond. Res. 20, 634–642.
Fratiglioni, L., Paillard-Borg, S., Winblad, B., 2004. An active and socially integrated
lifestyle in late life might protect against dementia. Lancet Neurol. 3, 343–353.
Frontera, W.R., Hughes, V.A., Fielding, R.A., Fiatarone, M.A., Evans, W.J., Roubenoff,
R., 2000. Aging of skeletal muscle: a 12-yr longitudinal study. J. Appl. Physiol.
88, 1321–1326.
Frontera, W.R., Reid, K.F., Phillips, E.M., Krivickas, L.S., Hughes, V.A., Roubenoff, R.,
Fielding, R.A., 2008. Muscle fiber size and function in elderly humans: a
longitudinal study. J. Appl. Physiol. 105, 637–642.
Fukunaga, T., Miyatani, M., Tachi, M., Kouzaki, M., Kawakami, Y., Kanehisa, H., 2001.
Muscle volume is a major determinant of joint torque in humans. Acta Physiol.
Scand. 172, 249–255.
Gauchard, G.C., Tessier, A., Jeandel, C., Perrin, P., 2003. Improved muscle strength
and power in elderly exercising regularly. Int. J. Sports Med. 24, 71–74.
Gerdhem, P., Ringsberg, K.A., Akesson, K., Obrant, K.J., 2003. Influence of muscle
strength, physical activity and weight on bone mass in a population-based
sample of 1004 elderly women. Osteoporos. Int. 14, 768–772.
Gergley, J.C., 2009. Comparison of two lower-body modes of endurance training on
lower-body strength development while concurrently training. J. Strength
Cond. Res. 23, 979–987.
15
Gliner, J.A., Morgan, G.A., Harmon, R.J., 2003. Meta-analysis: formulation and
interpretation. J. Am. Acad. Child Adolesc. Psychiatry 42, 1376–1379.
Goldspink, D.F., 2005. Ageing and activity: their effects on the functional reserve
capacities of the heart and vascular smooth and skeletal muscles. Ergonomics
48, 1334–1351.
Grassi, B., Cerretelli, P., Narici, M.V., Marconi, C., 1991. Peak anaerobic power in
master athletes. Eur. J. Appl. Physiol. Occup. Physiol. 62, 394–399.
Greig, C.A., Botella, J., Young, A., 1993. The quadriceps strength of healthy elderly
people remeasured after eight years. Muscle Nerve 16, 6–10.
Grimston, S.K., Nigg, B.M., Hanley, D.A., Engsberg, J.R., 1993. Differences in
ankle joint complex range of motion as a function of age. Foot Ankle 14,
215–222.
Harridge, S., Magnusson, G., Saltin, B., 1997. Life-long endurance-trained elderly
men have high aerobic power, but have similar muscle strength to non-active
elderly men. Aging (Milano) 9, 80–87.
Harris, N.K., 2008. Kinetics and kinematics of strength and power development.
Auckland University.
Hautier, C.A., Linossier, M.T., Belli, A., Lacour, J.R., Arsac, L.M., 1996. Optimal velocity
for maximal power production in non-isokinetic cycling is related to muscle
fibre type composition. Eur. J. Appl. Physiol. Occup. Physiol. 74, 114–118.
Hoang, V.M., Dao, L.H., Wall, S., Nguyen, T.K., Byass, P., 2010. Multilevel analysis of
covariation in socioeconomic predictors of physical functioning and psychological well-being among older people in rural Vietnam. BMC Geriatr. 10, 7.
Hughes, V.A., Frontera, W.R., Wood, M., Evans, W.J., Dallal, G.E., Roubenoff, R.,
Fiatarone Singh, M.A., 2001. Longitudinal muscle strength changes in older
adults: influence of muscle mass, physical activity, and health. J. Gerontol. A:
Biol. Sci. Med. Sci. 56, B209–B217.
Hunter, S.K., Thompson, M.W., Adams, R.D., 2000. Relationships among age-associated strength changes and physical activity level, limb dominance, and muscle
group in women. J. Gerontol. A: Biol. Sci. Med. Sci. 55, B264–B273.
Hunter, S.K., Thompson, M.W., Adams, R.D., 2001. Reaction time, strength, and
physical activity in women aged 20–89 years. J. Aging Phys. Act. 9, 32–42.
Hurley, B.F., 1995. Age, gender, and muscular strength. J. Gerontol. A: Biol. Sci. Med.
Sci. 50, 41–44.
Johannsen, D.L., DeLany, J.P., Frisard, M.I., Welsch, M.A., Rowley, C.K., Fang, X.,
Jazwinski, S.M., Ravussin, E., 2008. Physical activity in aging: comparison among
young, aged, and nonagenarian individuals. J. Appl. Physiol. 105, 495–501.
Karamanidis, K., Arampatzis, A., 2005. Mechanical and morphological properties of
different muscle-tendon units in the lower extremity and running mechanics:
effect of aging and physical activity. J. Exp. Biol. 208, 3907–3923.
Karamanidis, K., Arampatzis, A., 2006. Mechanical and morphological properties of
human quadriceps femoris and triceps surae muscle-tendon unit in relation to
aging and running. J. Biomech. 39, 406–417.
Kent-Braun, J.A., Ng, A.V., 1999. Specific strength and voluntary muscle activation in
young and elderly women and men. J. Appl. Physiol. 87, 22–29.
Kettunen, J.A., Kujala, U.M., Raty, H., Sarna, S., 1999. Jumping height in former elite
athletes. Eur. J. Appl. Physiol. Occup. Physiol. 79, 197–201.
Kinsella, K., Velkoff, V.A., 2001. An Aging World: 2001. US Bureau of Census, US
Government: Printing Office, Washington, DC.
Klitgaard, H., Mantoni, M., Schiaffino, S., Ausoni, S., Gorza, L., Laurent-Winter, C.,
Schnohr, P., Saltin, B., 1990. Function, morphology and protein expression of
ageing skeletal muscle: a cross-sectional study of elderly men with different
training backgrounds. Acta Physiol. Scand. 140, 41–54.
Knuth, A.G., Hallal, P.C., 2009. Temporal trends in physical activity: a systematic
review. J. Phys. Act. Health 6, 548–559.
Korhonen, M.T., Cristea, A., Alen, M., Hakkinen, K., Sipila, S., Mero, A., Viitasalo, J.T.,
Larsson, L., Suominen, H., 2006. Aging, muscle fiber type, and contractile
function in sprint-trained athletes. J. Appl. Physiol. 101, 906–917.
Korhonen, M.T., Mero, A.A., AlIn, M., Sipila, S., Hakkinen, K., Liikavainio, T., Viitasalo,
J.T., Haverinen, M.T., Suominen, H., 2009. Biomechanical and skeletal muscle
determinants of maximum running speed with aging. Med. Sci. Sports Exerc. 41,
844–856.
Kortebein, P., Symons, T.B., Ferrando, A., Paddon-Jones, D., Ronsen, O., Protas, E.,
Conger, S., Lombeida, J., Wolfe, R., Evans, W.J., 2008. Functional impact of 10
days of bed rest in healthy older adults. J. Gerontol. A: Biol. Sci. Med. Sci. 63,
1076–1081.
Kostka, T., Bonnefoy, M., Arsac, L.M., Berthouze, S.E., Belli, A., Lacour, J.R., 1997.
Habitual physical activity and peak anaerobic power in elderly women. Eur. J.
Appl. Physiol. Occup. Physiol. 76, 81–87.
Kostka, T., Arsac, L.M., Patricot, M.C., Berthouze, S.E., Lacour, J.R., Bonnefoy, M.,
2000a. Leg extensor power and dehydroepiandrosterone sulfate, insulin-like
growth factor-I and testosterone in healthy active elderly people. Eur. J. Appl.
Physiol. 82, 83–90.
Kostka, T., Rahmani, A., Berthouze, S.E., Lacour, J.R., Bonnefoy, M., 2000b. Quadriceps
muscle function in relation to habitual physical activity and VO2max in men
and women aged more than 65 years. J. Gerontol. A: Biol. Sci. Med. Sci. 55,
B481–B488.
Kramer, A.F., Hahn, S., Cohen, N.J., Banich, M.T., McAuley, E., Harrison, C.R., Chason, J.,
Vakil, E., Bardell, L., Boileau, R.A., Colcombe, A., 1999. Ageing, fitness and
neurocognitive function. Nature 400, 418–419.
Kramer, A.F., Erickson, K.I., Colcombe, S.J., 2006. Exercise, cognition, and the aging
brain. J. Appl. Physiol. 101, 1237–1242.
Kuh, D., Bassey, E.J., Butterworth, S., Hardy, R., Wadsworth, M.E.J., 2005. Grip
strength, postural control, and functional leg power in a representative cohort
of British men and women: associations with physical activity, health status,
and socioeconomic conditions. J. Gerontol. A: Biol. Sci. Med. Sci. 60, 224–231.
Please cite this article in press as: Volkers, K.M., et al., Lower limb muscle strength (LLMS): Why sedentary life should never start? A
review. Arch. Gerontol. Geriatr. (2011), doi:10.1016/j.archger.2011.04.018
G Model
AGG-2488; No. of Pages 16
16
K.M. Volkers et al. / Archives of Gerontology and Geriatrics xxx (2011) xxx–xxx
Kuta, I., Parizkova, J., Dycka, J., 1970. Muscle strength and lean body mass in old men
of different physical activity. J. Appl. Physiol. 29, 168–171.
Lang, T., Streeper, T., Cawthon, P., Baldwin, K., Taaffe, D.R., Harris, T.B., 2010.
Sarcopenia: etiology, clinical consequences, intervention, and assessment.
Osteoporos. Int. 21, 543–559.
Laroche, D.P., Knight, C.A., Dickie, J.L., Lussier, M., Roy, S.J., 2007. Explosive force and
fractionated reaction time in elderly low- and high-active women. Med. Sci.
Sports Exerc. 39, 1659–1665.
Larsson, L., Grimby, G., Karlsson, J., 1979. Muscle strength and speed of movement in
relation to age and muscle morphology. J. Appl. Physiol. 46, 451–456.
Le, T.N., 2008. Cultural values, life experiences, and wisdom. Int. J. Aging Hum. Dev.
66, 259–281.
Leong, B., Kamen, G., Patten, C., Burke, J.R., 1999. Maximal motor unit discharge
rates in the quadriceps muscles of older weight lifters. Med. Sci. Sports Exerc.
31, 1638–1644.
Lindle, R.S., Metter, E.J., Lynch, N.A., Fleg, J.L., Fozard, J.L., Tobin, J., Roy, T.A., Hurley,
B.F., 1997. Age and gender comparisons of muscle strength in 654 women and
men aged 20–93 yr. J. Appl. Physiol. 83, 1581–1587.
Lindstrom, P.J., Suni, J.H., Nygard, C.H., 2009. Associations of leisure-time physical
activity with balance and lower extremity strength: a validation of the neuromuscular part of the physical activity Pie. J. Phys. Act. Health 6, 493–502.
Liu, C.J., Latham, N.K., 2009. Progressive resistance strength training for improving
physical function in older adults. Cochrane Database Syst. Rev. 8, CD002759.
Low Choy, N.L., Brauer, S.G., Nitz, J.C., 2007. Age-related changes in strength and
somatosensation during midlife: rationale for targeted preventive intervention
programs. Ann. N. Y. Acad. Sci. 1114, 180–193.
MacGilchrist, C., Paul, L., Ellis, B.M., Howe, T.E., Kennon, B., Godwin, J., 2010. Lowerlimb risk factors for falls in people with diabetes mellitus. Diabet. Med. 27,
162–168.
Marini, M., Sarchielli, E., Brogi, L., Lazzeri, R., Salerno, R., Sgambati, E., Monaci, M.,
2008. Role of adapted physical activity to prevent the adverse effects of the
sarcopenia. A pilot study. Ital. J. Anat. Embryol. 113, 217–225.
Marsh, A.P., Miller, M.E., Rejeski, W.J., Hutton, S.L., Kritchevsky, S.B., 2009. Lower
extremity muscle function after strength or power training in older adults. J.
Aging Phys. Act. 17, 416–443.
McCrory, J.L., Salacinski, A.J., Hunt, S.E., Greenspan, S.L., 2009. Thigh muscle strength
in senior athletes and healthy controls. J. Strength Cond. Res. 23, 2430–2436.
Miyatake, N., Saito, T., Miyachi, M., Tabata, I., Numata, T., 2009. Evaluation of muscle
strength and its relation to exercise habits in Japanese. Acta Med. Okayama 63,
151–155.
Muraki, S., Akune, T., Oka, H., Mabuchi, A., En-Yo, Y., Yoshida, M., Saika, A.,
Nakamura, K., Kawaguchi, H., Yoshimura, N., 2009. Association of occupational
activity with radiographic knee osteoarthritis and lumbar spondylosis in elderly
patients of population-based cohorts: a large-scale population-based study.
Arthritis Rheum. 61, 779–786.
Neder, J.A., Andreoni, S., Lerario, M.C., Nery, L.E., 1999. Reference values for lung
function tests. II. Maximal respiratory pressures and voluntary ventilation. Braz.
J. Med. Biol. Res. 32, 719–727.
Neumann, N.U., Frasch, K., 2007. The significance of regular physical exercise for
health and well-being. Dtsch. Med. Wochenschr. 132, 2387–2391.
Newman, A.B., Kupelian, V., Visser, M., Simonsick, E.M., Goodpaster, B.H., Kritchevsky, S.B., Tylavsky, F.A., Rubin, S.M., Harris, T.B., 2006. Strength, but not
muscle mass, is associated with mortality in the health, aging and body
composition study cohort. J. Gerontol. A: Biol. Sci. Med. Sci. 61, 72–77.
Newton, M.J., Morgan, G.T., Sacco, P., Chapman, D.W., Nosaka, K., 2008. Comparison
of responses to strenuous eccentric exercise of the elbow flexors between
resistance-trained and untrained men. J. Strength Cond. Res. 22, 597–607.
Oya, Y., Nakamura, M., Tabata, E., Morizono, R., Mori, S., Kimuro, Y., Horikawa, E.,
2008. Fall risk assessment and knee extensor muscle activity in elderly people.
Nippon Ronen Igakkai Zasshi 45, 308–314.
Pearson, S.J., Young, A., Macaluso, A., Devito, G., Nimmo, M.A., Cobbold, M., Harridge,
S.D., 2002. Muscle function in elite master weightlifters. Med. Sci. Sports Exerc.
34, 1199–1206.
Peiffer, J.J., Galvao, D.A., Gibbs, Z., Smith, K., Turner, D., Foster, J., Martins, R., Newton,
R.U., 2010. Strength and functional characteristics of men and women 65 years
and older. Rejuvenation Res. 13, 75–82.
Pollock, M.L., Mengelkoch, L.J., Graves, J.E., Lowenthal, D.T., Limacher, M.C., Foster,
C., Wilmore, J.H., 1997. Twenty-year follow-up of aerobic power and body
composition of older track athletes. J. Appl. Physiol. 82, 1508–1516.
Przybysz, R., Dawson, H., Leeb, K., 2009. Falls among top reasons for transfers from
continuing care to acute care hospitals in Canada. Healthc. Q. 12, 62–66.
Rantanen, T., Heikkinen, E., 1998. The role of habitual physical activity in preserving
muscle strength from age 80 to 85 years. J. Aging Phys. Act. 6, 121–132.
Rantanen, T., Parkatti, T., Heikkinen, E., 1992. Muscle strength according to level of
physical exercise and educational background in middle-aged women in
Finland. Eur. J. Appl. Physiol. Occup. Physiol. 65, 507–512.
Rantanen, T., Sipila, S., Suominen, H., 1993. Muscle strength and history of heavy
manual work among elderly trained women and randomly chosen sample
population. Eur. J. Appl. Physiol. Occup. Physiol. 66, 514–517.
Rantanen, T., Era, P., Heikkinen, E., 1997. Physical activity and the changes in
maximal isometric strength in men and women from the age of 75 to 80 years.
J. Am. Geriatr. Soc. 45, 1439–1445.
Rantanen, T., Guralnik, J.M., Sakari-Rantala, R., Leveille, S., Simonsick, E.M., Ling, S.,
Fried, L.P., 1999. Disability, physical activity, and muscle strength in older women:
the Women’s Health and Aging Study. Arch. Phys. Med. Rehabil. 80, 130–135.
Rantanen, T., Harris, T., Leveille, S.G., Visser, M., Foley, D., Masaki, K., Guralnik, J.M.,
2000. Muscle strength and body mass index as long-term predictors of mortality in initially healthy men. J. Gerontol. A: Biol. Sci. Med. Sci. 55, M168–M173.
Rantanen, T., Sakari-Rantala, R., Heikkinen, E., 2002. Muscle strength before and
mortality after a bone fracture in older people. Scand. J. Med. Sci. Sports 12,
296–300.
Reid, K.F., Naumova, E.N., Carabello, R.J., Phillips, E.M., Fielding, R.A., 2008. Lower
extremity muscle mass predicts functional performance in mobility-limited
elders. J. Nutr. Health Aging 12, 493–498.
Ringsberg, K.A.M., Gardsell, P., Johnell, O., Josefsson, P.O., Obrant, K.J., 2001. The
impact of long-term moderate physical activity on functional performance,
bone mineral density and fracture incidence in elderly women. Gerontology 47,
15–20.
Rodrigues, M.A., Facchini, L.A., Thume, E., Maia, F., 2009. Gender and incidence of
functional disability in the elderly: a systematic review. Cad. Saude Publica 25
(Suppl. 3), S464–S476.
Rosenthal, R., 1995. Writing meta-analytic reviews. Psychol. Bull. 118, 183–192.
Ruuskanen, J.M., Parkatti, T., 1994. Physical activity and related factors among
nursing home residents. J. Am. Geriatr. Soc. 42, 987–991.
Sandler, R.B., Burdett, R., Zaleskiewicz, M., Sprowls-Repcheck, C., Harwell, M., 1991.
Muscle strength as an indicator of the habitual level of physical activity. Med.
Sci. Sports Exerc. 23, 1375–1381.
Scharhag-Rosenberger, F., Meyer, T., Walitzek, S., Kindermann, W., 2009. Time
course of changes in endurance capacity: a 1-yr training study. Med. Sci. Sports
Exerc. 41, 1130–1137.
Scott, D., Blizzard, L., Fell, J., Jones, G., 2009. Ambulatory activity, body composition,
and lower-limb muscle strength in older adults. Med. Sci. Sports Exerc. 41, 383–
389.
Sipila, S., Suominen, H., 1994. Knee extension strength and walking speed in relation
to quadriceps muscle composition and training in elderly women. Clin. Physiol.
14, 433–442.
Sipila, S., Viitasalo, J., Era, P., Suominen, H., 1991. Muscle strength in male athletes
aged 70–81 years and a population sample. Eur. J. Appl. Physiol. Occup. Physiol.
63, 399–403.
Slade, J.M., Miszko, T.A., Laity, J.H., Agrawal, S.K., Cress, M.E., 2002. Anaerobic power
and physical function in strength-trained and non-strength-trained older
adults. J. Gerontol. A: Biol. Sci. Med. Sci. 57, M168–M172.
Sturnieks, D.L., St George, R., Lord, S.R., 2008. Balance disorders in the elderly. J. Clin.
Neurophysiol. 38, 467–478.
Tanaka, H., Seals, D.R., 2003. Invited Review: dynamic exercise performance in
masters athletes: insight into the effects of primary human aging on physiological functional capacity. J. Appl. Physiol. 95, 2152–2162.
Tarpenning, K.M., Hamilton-Wessler, M., Wiswell, R.A., Hawkins, S.A., 2004. Endurance training delays age of decline in leg strength and muscle morphology.
Med. Sci. Sports Exerc. 36, 74–78.
Tarpenning, K.M., Hawkins, S.A., Marcell, T.J., Wiswell, R.A., 2006. Endurance exercise and leg strength in older women. J. Aging Phys. Act. 14, 3–11.
Tseng, B.S., Marsh, D.R., Hamilton, M.T., Booth, F.W., 1995. Strength and aerobic
training attenuate muscle wasting and improve resistance to the development
of disability with aging. J. Gerontol. A: Biol. Sci. Med. Sci. 50, 113–119.
Uusi-Rasi, K., Sievanen, H., Heinonen, A., Vuori, I., Beck, T.J., Kannus, P., 2006. Longterm recreational gymnastics provides a clear benefit in age-related functional
decline and bone loss. A prospective 6-year study. Osteoporos. Int. 17, 1154–1164.
Visser, M., Simonsick, E.M., Colbert, L.H., Brach, J., Rubin, S.M., Kritchevsky, S.B.,
Newman, A.B., Harris, T.B., 2005. Type and intensity of activity and risk of
mobility limitation: the mediating role of muscle parameters. J. Am. Geriatr.
Soc. 53, 762–770.
Xu, D.Q., Hong, Y., Li, J.X., 2008. Tai Chi exercise and muscle strength and endurance
in older people. Med. Sport Sci. 52, 20–29.
Yoshiga, C.C., Higuchi, M., Oka, J., 2002. Rowing prevents muscle wasting in older
men. Eur. J. Appl. Physiol. 88, 1–4.
Please cite this article in press as: Volkers, K.M., et al., Lower limb muscle strength (LLMS): Why sedentary life should never start? A
review. Arch. Gerontol. Geriatr. (2011), doi:10.1016/j.archger.2011.04.018


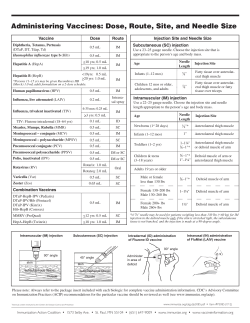


© Copyright 2026