
Why children die: death in infants, Part A May 2014
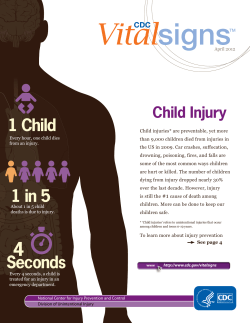
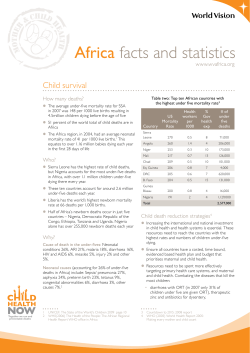
Why children die: death in infants,
children and young people in the UK
Part A
May 2014
A REPORT BY:
INGRID WOLFE
ALISON MACFARLANE
ANGELA DONKIN
MICHAEL MARMOT
RUSSELL VINER
ON BEHALF OF:
ROYAL COLLEGE OF PAEDIATRICS AND CHILD HEALTH
NATIONAL CHILDREN’S BUREAU
BRITISH ASSOCIATION FOR CHILD AND ADOLESCENT PUBLIC HEALTH
Why children die: death in infants, children,
and young people in the UK
Part A
A report by:
Ingrid Wolfe
Alison Macfarlane
Angela Donkin
Michael Marmot
Russell Viner
On behalf of:
Royal College of Paediatrics and Child Health
National Children's Bureau
British Association for Child and Adolescent Public Health
May 2014
© Royal College of Paediatrics and Child Health and National Children’s Bureau 2014
Why children die: death in infants, children, and young people in the UK - Part A
Key points
•
•
•
•
2
Infant, child and adolescent death rates in the UK have declined substantially and
continue to fall.
However, there are significant areas of concern:
o The overall UK childhood mortality rate is higher than in some other
European countries.
o The key areas where the UK rates appear to be relatively high are infant
deaths and deaths among children and young people who have chronic
conditions.
o Injuries are the most frequent cause of death in children after their first year
of life, and although unintentional injuries are the most common, the failure
to reduce intentional injury deaths among young people recently is also a
pressing concern.
o Several reports have shown that health services do not always deliver
optimal care for children and young people, and lives may be lost as a
result.
o There are marked social inequalities in death rates.
Many of the causes and determinants of childhood deaths are preventable.
There are three levels through which we can work together to improve the health
and lives of children and young people, and reduce their chances of death:
o Government and the role of civil society.
o Health systems and organisations.
o Healthcare and public health services.
Why children die: death in infants, children, and young people in the UK - Part A
Introduction
Child and adolescent health in the UK has improved dramatically over the past 30 years. This
improvement has undoubtedly been one of the success stories of modern healthcare. Yet, despite
steady mortality declines, in 2012 in the UK over 3,000 babies died before their first birthday and
over 2,000 children and young people died between the ages of one and 191.
A number of factors suggest that the UK is not providing optimal conditions for children to survive
and thrive. Firstly, the UK performs poorly on several measures of child health and wellbeing,
including mortality, compared with some other European countries2,3,4,5. Secondly, there are stark
inequalities in survival chances between rich and poor children in the UK6. Finally, many children’s
deaths are potentially preventable. Although it is difficult to measure avoidability on a population
basis, recent estimates suggest that 21% of child deaths involved 'modifiable factors' – in other
words, something could possibly have been done to prevent the death7.
Understanding why some children in the UK may have a greater chance of dying than their richer
peers, or those in some other countries, is challenging. It requires going beyond the direct cause
of death to examine the events leading to death and also the underlying factors that may have
contributed to making death more likely. Preterm birth is an example of where this can be complex.
Very preterm babies may die because the baby’s lungs are not developed sufficiently for survival
outside the womb, even with the most advanced neonatal intensive care. Some medical conditions
can lead to preterm delivery, but may be more likely to occur if the mother was unusually young,
smoked in pregnancy, or was materially disadvantaged. Thus the potential for prevention of
childhood death may involve complex interactions between many factors including those that are
intrinsic to the child, such as the child's genes; the social, economic, and physical environment
into which the child is born and grows up; and the health services and systems that provide care
for the child and family.
Outlining actions that could be taken to prevent childhood deaths in the future is the aim of this
report. We will look at the causes of death and some of the underlying determinants such as
poverty and social inequalities. Although the remit of this report concerns deaths that happen
from birth through childhood and adolescence, it must be noted that stillbirths are a significant
problem and many of the causes and underlying determinants are similar to those of deaths that
happen later in childhood.
This report highlights the most recently available data on deaths, focusing specifically on areas
where we could make a difference through what we do in policy and practice.
3
Why children die: death in infants, children, and young people in the UK - Part A
A snapshot of UK infant, child, and adolescent mortality
Over 5,000 children under the age of 19 years died in the UK, in 2012. As shown in Figure 1 and
accommpanying Table 1, 60% of deaths occurred before the age of one year and 18% between the
ages of 15 and 19 years. Mortality rates are lower in early childhood from one to four years, and are
lowest for five to nine year olds and the early adolescents, 10 to 14 year olds.
Figure 1: Deaths by age group, as percentage of total, UK, 20121
Table 1: Infant and childhood mortality rates by age and sex, UK, 2012
Age, years
Male
Female
Total
Numbers of deaths
Infant deaths per 1,000 live birthsA
4.4
3.5
4.0
3,219
Deaths per 100,000 population in age groupB,C
1-4
18
15
16
523
5-9
9
8
9
325
10-14
11
8
10
340
15-19
33
15
24
959
Source: Office for National Statistics
A Childhood mortality statistics, Table 2, 2012
B Death registrations by single year of age, Tables 1 and 2, and
C Mid-year population estimates, 2012
The highest death rates are in infancy and adolescence and the main causes of death vary by age
group too, so to understand better and to think about how to prevent deaths from happening,
it is important to look in more detail at narrower age groups. Furthermore, specific causes merit
special consideration. For example, injuries, many of which are highly amenable to prevention,
cause a substantial proportion of deaths. This tells us we could do better. What proportion of
deaths may be amenable to healthcare is another important question and one which has caught
4
Why children die: death in infants, children, and young people in the UK - Part A
the imagination of the public, professionals, and policy makers. Unfortunately there is no simple
answer. Finally, there are wider aspects of society and determinants of health and wellbeing, such
as poverty and social inequalities, which have an important bearing on the likelihood that children
will survive and flourish.
Deaths in the first year of life
Infant mortality (deaths of babies in their first year expressed as a rate per 1,000 live births) has
long been considered as an indicator of the overall health status of a population. Infant deaths
are also a reflection of the quality of midwifery, obstetric, and newborn care. Maternal health
and the development of the fetus and baby are strongly influenced by the social, economic, and
environmental circumstances that surround them. These factors can also affect their chances of
death.
Figure 2: Infant mortality rates, UK, 1971-20121
25
United Kingdom
Deaths per 1,000 live births
20
England and Wales
Scotland
Northern Ireland
15
10
5
0
1970
1975
1980
1985
1990
1995
2000
2005
2010
2015
Source: ONS, Vital Statistics: Population and Health Reference Tables, 2012
Infant mortality rates for England and Wales and for the UK as a whole have been declining
steadily for many years, with occasional exceptions. Because rates for Scotland and Northern
Ireland are based on smaller numbers of births and deaths, they fluctuate from year to year,
although rates for Scotland tend to be below those for England and Wales and those for Northern
Ireland tend to be higher (Figure 2).
Infant mortality can be divided into neonatal mortality, deaths up to 27 days after live births,
and post-neonatal mortality, deaths from 28 days but under one year. As in most high-income
countries, the majority of infant deaths occur in the neonatal period and in the countries of the
UK they account for around 70% of infant deaths, except in Northern Ireland where they account
for nearly 80%. Just over three-quarters of neonatal deaths occur in the early neonatal period,
5
Why children die: death in infants, children, and young people in the UK - Part A
although the proportion is higher, over four-fifths, in Northern Ireland. Not surprisingly, neonatal
mortality rates show the same downward trends as infant mortality, although the higher rates in
Northern Ireland and the lower rates in Scotland are more marked (Figure 3).
Figure 3: Neonatal mortality rates, United Kingdom and constituent countries, 1971-20121
20
United Kingdom
Deaths per 1,000 live births
England and Wales
Scotland
15
Northern Ireland
10
5
0
1970
1975
1980
1985
1990
1995
2000
2005
2010
2015
Source: ONS, Vital Statistics: Population and Health Reference Tables, 2012
Postneonatal deaths form a much smaller proportion of infant deaths, and trends in postneonatal
mortality are much less marked, although there is a consistent downward trend as shown in Figure
4. There was a notable fall in the late 1980s and early 1990s when the rate of deaths from sudden
infant death syndrome fell markedly.
Figure 4: Postneonatal mortality rates, United Kingdom and constituent countries, 1971-20121
20
Deaths per 1,000 live birth
United Kingdom
England and Wales
15
Scotland
Northern Ireland
10
5
0
1970
1975
1980
1985
1990
1995
2000
2005
Source: ONS, Vital Statistics: Population and Health Reference Tables, 2012
6
2010
2015
Why children die: death in infants, children, and young people in the UK - Part A
International comparisons of infant mortality, including neonatal mortality, are difficult and
subject to caveats. The Euro-Peristat collaboration was formed to bring together clinicians and
statisticians from each participating country to harmonise definitions and derive data from their
countries in line with these definitions. In describing infant mortality, this report shows data from
the second European Perinatal Health Report which brings together data for the year 2010 about
the demographics and health of the childbearing populations, the care provided and the outcomes
for mothers and babies8.
Figure 5: Neonatal mortality in Europe, 20108
All neonatal deaths
Neonatal deaths among babies born at 24 or
more weeks of gestation
Belgium
Belgium
2.7
2.3
2.1
1.7
1.9
2.4
1.9
2.1
2.1
BE: Brussels
BE: Flanders
BE: Wallonia
Czech Republic
Denmark
Germany
Estonia
Ireland (cohort)
Greece
BE: Wallonia
Czech Republic
Denmark
Germany
Italy
Cyprus
Greece
Spain
France
Italy
Cyprus
Hungary
4.5
Malta
Austria
3.5
5.5
Finland
Sweden
Slovakia
Finland
Sweden
United Kingdom
2.5
0.0
1.0
0.8
Iceland
2.0
2.6
Switzerland
2.1
UK: Scotland
1.2
Iceland
Norway
3.0
UK: Northern Ireland
2.5
UK: Scotland
2.0
UK: England and Wales…
3.8
UK: Northern Ireland
1.1
1.8
1.3
1.3
Slovenia (cohort)
United Kingdom
UK: England and Wales (cohort)
4.3
Romania
1.8
1.8
1.5
1.6
Slovakia
1.6
Portugal
Romania
Slovenia (cohort)
3.1
Poland
1.6
Portugal
2.2
1.7
Netherlands (cohort)
2.2
Poland
4.0
Malta
3.3
Austria
1.2
Luxembourg
3.5
Netherlands (cohort)
2.3
Lithuania
1.8
Hungary
3.3
Latvia
3.6
2.7
Luxembourg
2.4
2.1
ES: Valencia
Latvia
Lithuania
1.3
1.8
Estonia
Ireland (cohort)
2.5
2.3
2.5
1.6
France
2.0
1.8
1.6
1.5
BE: Flanders
Spain
ES: Valencia
2.7
BE: Brussels
1.6
1.9
Norway
Switzerland
2.0
3.0
4.0
Rate per 1000 live births
5.0
6.0
0.0
1.0
2.0
3.0
4.0
Rate per 1000 live births
5.0
6.0
Source: Euro-Peristat8
Figure 5 shows comparative neonatal mortality among all babies and those born at 24 weeks or
more of gestation. This shows that the rates for babies born at 24 or more weeks ranged from 0.8
per 1,000 live births (in Iceland) to 4.3 per 1,000 live births (in Romania). There are no composite
UK data, because constituent countries collect data in different ways, but the rate was 2.0 per
1,000 live births in England and Wales, 2.1 in Scotland, and 3.0 in Northern Ireland. The rates for
many countries are based on relatively small numbers of deaths as in Scotland and Northern
Ireland. The Nordic countries, Sweden, Finland and Iceland, are among those with the lowest
neonatal mortality rates.
High proportions of neonatal and infant deaths are of babies who were born preterm, that is,
before 37 completed weeks of gestation. These accounted for nearly two-thirds of infant deaths
7
Why children die: death in infants, children, and young people in the UK - Part A
of babies born in 2011 in England and Wales. Similarly, babies born weighing under 2,500 grams
(defined as low birthweight) accounted for about three-quarters of neonatal deaths and two
thirds of infant deaths.
Preterm births are those occurring before 37 completed weeks of gestation, and rates reported to
Euro-Peristat ranged from around 5.7% to 10.5%. There is not a clear geographic distribution for
preterm births, as there is for low birthweight. In the UK, preterm birth rates were 7.1% in England
and Wales, 7.0% in Scotland, and 7.2% in Northern Ireland. These were higher than in the Nordic
countries and lower than in Germany, Spain, and Belgium8.
The percentage of babies born weighing less than 2,500 grams ranged from 3.4% to 9.8% in
countries participating in Euro-Peristat. The countries with the lowest rates of babies born at low
birthweight include Sweden, Norway, Denmark, Iceland, Finland, Ireland, Latvia, Lithuania, and
Estonia. Rates for southern European countries tend to be among the higher rates, while the UK
countries are in the middle range: 7.0% of babies born in England and Wales 6.5% in Scotland, and
5.7% in Northern Ireland had low birthweights8.
Low birthweight, preterm birth, and neonatal and infant mortality are associated, so it is not
surprising that the UK has higher rates of all these measures than the Nordic countries, but lower
than many other European countries. However the associations between these risks and outcomes
are not completely straightforward, since, for example, Northern Ireland has lower low birthweight
percentages, but higher neonatal and infant mortality. That said, the rates fluctuate considerably
year on year as the numbers are small.
Rates of low birthweight and preterm birth for a country's population can vary according to
demographic factors such as maternal age distribution and multiple birth rate. In the UK, over 5%
of mothers were aged under 20 years, and just under 20% were aged 35 years and over, which
are the age ranges with the highest risk of infant mortality. In Sweden, only 1.6% of mothers were
under 20 years of age but just over 22% were over 35 years8. Rates of multiple births in the UK
countries were just over 15 per 1,000 women delivering, which is middle-range among European
countries.
Babies born to women who smoke are at a raised risk of low birthweight. It is difficult to compare
rates of smoking in pregnancy because countries collect data in different ways. It does appear that
the UK has some of the highest rates with 26% of women smoking before or during pregnancy
and 12% during pregnancy, compared, for example, with Sweden where 6.5% of women smoke
at the beginning of pregnancy and 4.9% by the time the baby is due8. However, within the UK
smoking in pregnancy is more common among women in more disadvantaged socio-economic
groups, who also have a higher risk of low birthweight babies and other adverse outcomes.
Finally, two further specific problems concerning the early stages of life merit special consideration
here; stillbirths and unexplained deaths in infancy. The UK appears to have the highest stillbirth
rate of 12 high-income countries; the UK rate is 3.8 stillbirths per 1,000 births, contrasted with 2.2
per 1,000 in Norway9. Euro-Peristat has also reliably shown that the UK had among the higher
stillbirth rates in Europe, because they compared rates of still births after 28 weeks gestation8. As
is the case with infant deaths, variations in coding and death registration practices may account
for some of the differences between countries, however these data show that further reductions
in stillbirths should be possible. Exploring differences between countries helps point towards
8
Why children die: death in infants, children, and young people in the UK - Part A
possible actions that could be taken at practice or policy level. Important modifiable factors
contributing to risk of stillbirth include smoking in pregnancy, and overweight or obesity and
social inequalities9. Unexplained deaths in infancy are another important problem that require
urgent attention. In 2010, there were 254 unexplained infant deaths in England and Wales1. 80%
of unexplained deaths happen in the post-neonatal period, they are more likely among socially
disadvantaged families, among those who smoke, and mothers who are very young10.
Infant mortality has a particular social relevance, as it is widely used as a marker of the overall
health status of a population. As such, the UK has cause for concern. In 1970, the infant mortality
rate in the UK was similar to the median rate for comparable countries (EU15+ countries, including
European Union member countries before 2004, plus Australia, Canada, and Norway). However,
trend data over three decades shows that UK infant mortality is now above the 75th centile among
EU15+ countries5.
The causes, associations, and risk factors for infant mortality outlined briefly in this section
highlight that social disadvantage is important, this and many other problems contributing to
deaths in early life, are amenable to interventions in practice and policy.
Deaths in childhood
From one to four years old, the three most common causes of death are injuries and poisoning
(external causes), cancer, and congenital causes (Figure 6). There is evidence that preterm
birth impacts not only on infant mortality but has appreciable effects on mortality during later
childhood11.
Figure 6: Deaths by cause, percentage of total, and numbers, among 1-4 year olds in the UK,
201012
Perinatal
2% (9)
Sudden Death
1% (8)
Digestive
2% (12)
Other
6% (31)
Infectious
9% (53)
Respiratory
11% (64)
Cancer
15% (83)
Circulatory
6% (32)
Blood and Immune
2% (11)
Endocrine,
nutritional and
metabolic
5% (31)
External
15% (84)
Nervous system andRisk and behaviours
developmental
0%
12% (65)
Congenital
14% (78)
9
Why children die: death in infants, children, and young people in the UK - Part A
In later childhood, from five to nine years old, the most common causes of death in the UK are
injuries and poisoning, cancer, and congenital causes (Figure 7). The proportion of children who
died with a chronic condition (or more than one) increased significantly in England in the decade
to 2010, however intriguingly no such increase was found in Scotland or Wales11.
Figure 7: Deaths by cause, percentage of total, and numbers, among 5-9 year olds in the UK,
201012
Perinatal
2% (9)
Sudden Death
1% (8)
Digestive
2% (12)
Other
6% (31)
Infectious
9% (53)
Respiratory
11% (64)
Cancer
15% (83)
Circulatory
6% (32)
Blood and Immune
2% (11)
Endocrine,
nutritional and
metabolic
5% (31)
External
15% (84)
Nervous system andRisk and behaviours
developmental
0%
12% (65)
Congenital
14% (78)
Survival rates from cancer in childhood vary, and there are many different types of cancer. However,
there is some evidence that survival from cancer may be a little (but significantly) lower than in
Northern European countries, and possibly that some tumours are at a later stage by the time
children are diagnosed13.
Deaths in adolescence
After infancy, late adolescence is the second riskiest time for death under the age of 19 years.
Whilst we have made huge advances in reducing mortality among infants and young children in
the past 40 years, death rates amongst adolescents have fallen little across the same period. As
a result mortality amongst 15 to 19 year olds is still higher than any time in early childhood after
the first 12 months.
10
Why children die: death in infants, children, and young people in the UK - Part A
From 10 to 19 years, the most common causes of death in the UK are injuries and poisoning and
cancer (neoplasms). In early adolescence, from 10 to 14 years, these two categories contribute
around half of all deaths, as shown in Figure 8. The proportion of young adolescents (age 10 to 14
years) in England who died with one or more chronic condition increased significantly between
2000 and 201011.
Figure 8: Deaths by cause, percentage of total, and numbers, among 10-14 year olds in the UK,
201012
Other Perinatal Infectious
3% (11) 1% (2)
4% (15)
Digestive
1% (5)
Sudden Death
0%
Respiratory
8% (28)
Circulatory
7% (24)
Cancer
24% (89)
External
24% (87)
Blood
and
Immune
3% (11)
Congenital
6% (24)
Nervous system
and
developmental
14% (52)
Endocrine,
nutritional and
metabolic
4% (14)
Risk and
behaviours
1% (5)
In later adolescence, from 15 to 19 years, the causes of mortality are largely split between injuries
and poisoning (and risks and behaviours), and non-communicable diseases (NCDs); the most
common cause within NCDs is cancer.
As shown in Figure 9, over half of deaths in this age group can be attributed to external causes,
including injuries and poisoning, risks and behaviours, with major causes being transport injuries;
intentional injuries, including suicide and violent deaths; and other non-intentional injuries, such
as drowning or fires. Injuries are a common cause of death among adolescents who have chronic
conditions including mental and behavioural disorders, accounting for approximately a third
(33.2%) of deaths among 15 to 18 year olds in England who had a long-term condition, 39.7% in
Scotland, and 43.8% in Wales11.
11
Why children die: death in infants, children, and young people in the UK - Part A
Figure 9: Deaths by cause, percentage of total, and numbers, among 15-19 year olds in the UK,
201012
Digestive
2%
Sudden Death
0%
Respiratory
3% (33)
Perinatal
0% (2)
Infectious
3% (31)
Other
3%
Circulatory
5% (63)
Cancer
13% (149)
Blood and
Immune
1% (11)
Endocrine,
nutritional
and
metabolic
3% (33)
Risk and
behaviours
13% (149)
External
42% (479)
Nervous system
and
developmental
9% (100)
Congenital
3% (40)
Adolescence is a time of increasing freedom and personal autonomy, and exploratory behaviours,
often involving risk, are part of normal development. However, injuries are non-random preventable
events, amenable to public health and public policy initiatives. This is true for suicide and violent
deaths as well as other injuries. Unfortunately there is evidence from a national case audit of
children’s deaths suggesting that many children who died from suicide had not had any contact
with mental health services, and there were reportedly problems with services failing to follow up
patients who had been referred but not turned up for appointments14.
Deaths from injuries and poisoning
Injuries and poisoning are important causes of death in childhood and adolescence. Indeed, injury
is the most frequent cause of death after the first year of life, responsible for 31% to 48% of deaths
among children and young people11. The major causes differ by age group, and between boys and
girls. Adolescent boys have the highest risk; they have three times the mortality rate from injuries
compared with girls of similar ages11. Scotland, Wales, and Northern Ireland have notably higher
rates of injury mortality among young people11.
The most common causes of injury-related deaths are transport accidents, drowning, and
intentional injuries, including self-harm and assault. Unintentional injury deaths are most often
related to transport, responsible for 41% of injury deaths among 1 to 9 year olds, and 77% among
12
Why children die: death in infants, children, and young people in the UK - Part A
10 to 18 year olds11. Reductions in unintentional injuries account for most of the declines in injury
related mortality rates over the past several years.
It is of great concern that there has been no reduction in rates of deaths from intentional injury
among 10 to 18 year olds in three decades11. Indeed intentional injury deaths represent a substantial
proportion of all injury deaths. In the four years to 2010, just over 34% of injury deaths among boys
were intentional as were nearly 38% among girls11. Injury resulting in death among adolescents
often occur when there is coexisting chronic conditions, for example injuries accounted for nearly
70% of deaths among 15 to 18 year olds with mental or behavioural problems11.
Many deaths from injuries (both unintentional and intentional) and poisoning are preventable, for
example through transport planning, social and public health policy. While the UK scores above
average compared with the rest of Europe in the Child Safety Alliance grading system which
assesses implementation of child safety policies (although not intentional injury prevention);
injuries and poisoning are still preventable causes of death, with poor children more affected
than rich ones, highlighting that more should be done15.
Sweden and the Netherlands are the only two European nations which perform more strongly
than the UK on the Child Safety Alliance score. Sweden is noteworthy for its road safety Vision
Zero Initiative which aims to achieve zero road traffic deaths and serious injuries, chiefly through
changes in system design16. Vision Zero is now secured in Swedish legislation. Other measures,
such as reducing and enforcing speed limits for traffic, improving the skills of novice drivers, safe
pedestrian crossings, and barriers around water such as garden ponds can save lives17,18,19.
Sadly, despite the preventability of deaths from injuries and poisoning, these causes still account
for between 31 to 48% of lives lost between one and 18 years old, and no real progress has been
made in reducing deaths from intentional injury11.
Healthcare amenable deaths
How important is healthcare to population child health? For an individual child, health services
are clearly important, sometimes life saving. But many important things that contribute to child
health, both at an individual and a population level, are part of the wider health system and
society. Before the middle of the 20th century, healthcare probably contributed relatively little
to improvements in health when compared with changes in living conditions brought about by
increasing wealth and security that accompanied industrialisation and universal education20,21.
However, since that time, paediatric medicine has developed into a sophisticated specialty, and
our abilities to intervene successfully have improved dramatically. Furthermore, as overall health
has improved, the marginal contribution made by healthcare to health will have increased.
Healthcare amenable mortality as a concept and as a measure, has contributed to the technical
capacity for evaluating health services and for understanding how much healthcare contributes to
population health through mortality reduction. Estimates of the scale of health gain attributable
to healthcare range from 20% to 40%, but these are largely about the adult population22. This
means of inquiry is of limited value to children’s health because the number of deaths is small,
making interpretation difficult or impossible. Still, healthcare amenable mortality is a helpful
concept, and there are two possible ways it might be useful for child health. The first is through
individual case audit, and the second is through combining causes into categories and/or
13
Why children die: death in infants, children, and young people in the UK - Part A
examining trends or several years’ data combined as an average. Both methods are subject to
considerable uncertainty, and should be used merely as indicators pointing the direction towards
further inquiry.
The first method has been done to notable effect by the Confidential Enquiry into Maternal and
Child Health in England, which conducted a meticulous audit into the deaths of a representative
sample of children. They reported identifiable failures in a child’s direct care in just over a quarter
of deaths, and potentially avoidable factors in a further 43% of deaths14. An audit of asthma
deaths is due to report soon. From an epidemiological perspective, this type of evidence does not
demonstrate causality. However, from a clinical perspective it provides useful information, pointing
out where to investigate further in our attempts to improve care. From a parental perspective, it
is alarming and demands attention and indeed in the past decade, and especially since the Bristol
Royal Infirmary Enquiry in 2001, there has been a welcome degree of scrutiny into the quality
of care for children23. There is now a systematic multiagency process for gathering data after
every childhood death, known as a Child Death Review (CDR), which attempts comprehensively
to gather information on potentially avoidable factors in order to make recommendations on
changes in practice.
The Department for Education (DfE) collects reports from CDRs, and publishes a yearly report
on childhood mortality with an estimate of the percentage of deaths with identified modifiable
factors. For example, in the year ending 31 March 2013 there were 3,857 reviews completed, and
21% of those deaths were judged as having modifiable factors7. Modifiable deaths are where
there were factors which may have contributed to death, and which through nationally or locally
achievable interventions may be modified to reduce the risk of future deaths. The most recent
DfE report found that the highest proportion of deaths with modifiable factors were among
children aged between one month and one year old, and between 15 and 17 years old; nearly 30%
of deaths in these age groups were thought to have modifiable features7.
Examining mortality by cause, and combining data from several years, may allow some comparison
between countries as long as data collection is standardised to enable valid comparison. Focusing
on deaths from illnesses that ought not to kill children in highly developed European health
systems may reveal useful insights, though with the caveats outlined. For example, mortality
rates from asthma, meningococcal disease, and pneumonia seem to be highly variable between
countries24. It is possible that some or all of these differences may be explainable because data
is captured in different ways between countries, or the process of death certification varies
between countries. For example, in some countries death may be said to be from pneumonia
but the underlying cause was a neurodevelopmental problem from which death was inevitable
and pneumonia was the final event. Indeed a large proportion of deaths do occur in children with
chronic and sometimes life-limiting conditions11. Although these data about healthcare amenable
causes of death need further enquiry, there are some worrying consistencies in the findings with
the UK seeming to have generally higher rates than many other European countries, suggesting
at least that there may be scope for improvement in the UK.
Although much of the literature on assessing the contribution of healthcare to health focuses
on mortality, data on deaths alone give an incomplete impression, especially for children. First
and fortunately because the numbers are small, so variability can be large and interpretation
must be made with caution. Second there are many other valuable aspects to healthcare for
children beyond saving life, such as healing, relieving suffering, and improving the quality of
life. These essential parts of healthcare are often more difficult to measure as morbidity data
is scarce and often unreliable, and quality of care is difficult to quantify and compare reliably.
14
Why children die: death in infants, children, and young people in the UK - Part A
Social determinants of health
The social determinants approach involves improving the conditions that we experience through
birth, life, education, and work that influence negatively on health and wider outcomes6,25. From
before birth, a range of socio-economic circumstances can impact on the way in which we develop,
and our future health, happiness and economic prosperity. Having a good start in life, maximising
parental abilities through education and life-long learning, good work, adequate incomes and
good quality environments, will all have an impact on outcomes for parents and their children in
addition to the efforts of health promotion and access to healthcare.
Three important social determinants are poverty, inequality, and social policies that affect the
ways we live, such as housing, parental leave allowance, and early years education. Absolute
levels of poverty matter to child survival, but how fairly wealth is shared across the population is
also important. How well our society protects children and young people through social policy
also helps determine their chances of survival and affects how well they are able to fulfil their
potential.
As has been shown elsewhere, there are substantial differences between the UK and some other
European child mortality rates2. This is partly explained by the higher infant mortality rates in the
UK, a high percentage of which is driven by the fact that nearly two thirds of the children who
die before their first birthday were born preterm, and/or with low birthweight. UK rates of low
birthweight and preterm births are higher than some other European countries including the
Nordic countries, though lower than some Eastern European countries.
Rates of low birthweight are higher in less advantaged socio-economic groups26, and are
particularly linked to a number of negative health behaviours such as poor prenatal care,
substance abuse, poor nutrition during pregnancy and smoking which are more common in these
groups27. For example, prenatal smoking rates are higher in less advantaged socio-economic
groups and smoking in pregnancy, for example, is associated with a 20 to 30% higher likelihood
of stillbirth, a 40% higher rate of infant mortality and a 200% higher incidence of Sudden Infant
Death Syndrome (SIDS)28,29. In addition there is a relation between teenage pregnancy and low
birthweight, where there is competition for nutrients between the fetus and the growth needs
of the mother30. Inadequate nutrition can also drive low birthweights, and we know that there
are increasing numbers of families being referred in the UK to foodbanks which is an urgent and
growing concern. We also know that breastfeeding is less common in less advantaged socioeconomic groups and that it can protect against infection, and also save lives from SIDS31.
Traditionally, social inequalities in infant mortality and low birthweight have been analysed
according to the father’s social class but this has now been changed. Babies born within
marriage or a civil partnership and others who have been jointly registered by both parents
are analysed according to the social class of the most advantaged parent, and babies
registered by their mothers alone are analysed by their own social class. Infant mortality,
subdivided into neonatal and postneonatal mortality is presented in this way in Figure 10.
Wide differences in infant mortality and in low birthweight (shown in Figure 11) can be seen
between babies born into managerial and professional families, those with parents who are
self-employed or in semi-routine occupations and those in routine occupations. Although
postneonatal mortality makes for only a small proportion of deaths in more advantaged
households, it makes up a higher proportion of deaths in the least advantaged households.
15
Why children die: death in infants, children, and young people in the UK - Part A
Figure 10: Infant mortality rates by social class of most advantaged parent, babies born in
England and Wales in 201132
Figure 11: Low birthweight rates by social class of most advantaged parent, babies born in
England and Wales in 201232
These data (Figures 10 and 11) show that babies from poorer families are more likely to be born
with low birthweight, and are more likely to die than children from richer families. This relation can
be shown at country level too; the wealthier the country, the lower the child mortality rate2. The
effect of country-level wealth on life chances is highly complex, but the important facts here are
that economic policy matters to the lives of children.
16
Why children die: death in infants, children, and young people in the UK - Part A
The UK has among the highest rates of child poverty in wealthy countries33. It is crucial to note
that the impact of poverty can be alleviated through supportive social policy, which means things
to assist families to ensure they are not deprived of basic necessities in life such as secure housing
and nutritious food. Countries make choices about social policy and these decisions are reflected
in what happens to children and young people.
Table 2 below shows that Sweden has a lower percentage of the population who are at risk of
poverty or social exclusion, but importantly that the UK disproportionately disadvantages children
and young people because the risk is not equitably spread across the age groups34.
Table 2: Percentage at risk of poverty or social exclusion, in 201135
Country
Total (%)
Children age
0–17 years (%)
Adults age
18–64 years (%)
Age 65 and over (%)
Sweden
16.1
15.9
15.4
18.6
United Kingdom
22.7
26.9
21.4
22.7
Comparing how children fare in different countries shows that Britain’s children unfortunately are
amongst the more deprived in Western Europe33. This is reflected in mortality rates; there is a higher
mortality rate among children under five years old who live in countries with a high proportion of
deprived households36. As before, the lowest mortality rates are in the Nordic countries, with the
lowest proportions of deprived households, and the highest mortality rates are in Eastern Europe,
with the UK in the group of intermediate countries.
How fairly wealth is shared between people within a country is important for child survival too.
Inequality matters to health. Children are more likely to die in countries where the rich are very
much richer than the poor. This is true of adolescents as well37.
The UK is above the OECD average for inequalities, as measured by the Gini coefficient and shown
in Figure 12; that is we have a more unequal society than most.
Figure 12: Income inequality in the mid-2000s38
0.5
0.45
0.4
0.3
0.25
0.2
0.15
0.1
0.05
Mexico
OECD average
Portugal
Turkey
Poland
United States
New Zealand
United Kingdom
Italy
Greece
Ireland
Canada
Spain
Japan
Australia
Korea
Hungary
Germany
Norway
Iceland
France
Belgium
Switzerland
0
Denmark
Sweden
Luxembourg
Austria
Czech Republic
Slovak Republic
Finland
Netherlands
Gini coefficient
0.35
17
Why children die: death in infants, children, and young people in the UK - Part A
Social and economic policy matter to children’s chances of survival. For example, the harsh effects
of the unforgiving economic climate during the ongoing financial crisis gripping the UK could be
softened through social policy. Countries that spend more on social protection have lower child
mortality rates2. Social policy can save lives.
Key points
•
•
•
•
•
•
•
18
Annually, around 6,000 children between 0 and 19 years die in the UK.
Around two-thirds of those deaths happen in the first year of life.
One in five deaths happen between the ages of 15 and 19 years.
The most frequent causes of death in babies and young children are different from
those in adolescents.
Injuries are the most frequent cause of death after the first year of life, and many of
these are highly preventable.
The quality and safety of aspects of children’s healthcare requires further scrutiny
and improvement.
Social and economic inequalities are matters of life and death for children.
Why children die: death in infants, children, and young people in the UK - Part A
Understanding why children die, and how to prevent deaths
Understanding why children die, and taking action to prevent deaths in childhood is our purpose.
Since children’s lives, their health, illnesses and chances of death are influenced by a wide variety
of factors, where should we direct our attention? Avoidable mortality in the adult population has
been defined as premature and unnecessary deaths but since all childhood deaths are premature
by definition, are they all avoidable39? What is an unnecessary child death? What proportion of
child deaths are – or could ever be – acceptable?
Taking the first question: where should we direct our attention? Setting aside biological factors
that operate for all children regardless of which country they live in, there are three broad domains
to consider: the role of government and civil society; health systems and organisations; healthcare
and public health services.
And the second question, on avoidability, what we are really talking about is what goal should
we set ourselves? How many deaths could be prevented? It is doubtful that this could ever be
answered precisely, but we can begin to think about the notion of avoidability by comparing
ourselves with other countries. The UK has the highest all-cause mortality rates among comparable
European countries, but importantly this was not always the case2. The UK has failed to match
mortality reductions made by other comparable countries over the past four decades5. Problems
are particularly notable among infant deaths and deaths in childhood and adolescence from noncommunicable diseases (NCDs) and conditions including neuropsychiatric causes5. The rise in
prevalence of NCDs is part of the epidemiological transition affecting all age groups including the
young. Tackling these problems has become an pressing issue in the UK as it has across the globe,
and will require action at all levels of the health system and beyond. The finding that the UK has
failed to match survival gains made by other countries in NCD mortality rates is of urgent concern.
In considering how to improve UK child health, we could start with the question; if Sweden and the
Nordic countries can achieve a particular child mortality rate, why can’t we?
These comparisons are difficult, given that countries have different populations that may
be more or less liable to have certain diseases (for example, sickle cell disease deaths will be
higher in populations with greater numbers from Caribbean or African ethnic groups). There are
undoubtedly population differences between the UK and Sweden but rapid population change
through immigration has meant that 6.8% of the Swedish population was non-national in 2012
in contrast to 7.6% in the UK40. Aside from these population caveats, comparison with another
country with much better outcomes shows us what might be possible for us to achieve.
What is the scale of difference that would be achieved if in the UK we were able to match Sweden’s
childhood mortality rate? That question can be addressed by calculating excess deaths. This
means adjusting the mortality rate (numbers of deaths per 100,000 population) to take account
of the different population sizes in the countries being compared. If the UK had the same all-cause
mortality rate for children under 14 years as Sweden we could have nearly 2,000 fewer deaths
among children in that age group per year - five fewer children’s deaths per day2.
Comparing countries which have different approaches to setting priorities in government, different
social values, systems and services, and different healthcare services can help by providing
insights and potential lessons towards improvement. Using the natural laboratory that Western
Europe offers can help give us direction in further investigation as we turn our attention to look
19
Why children die: death in infants, children, and young people in the UK - Part A
for explanations and solutions in the three broad categories outlined earlier; government and civil
society; health systems and organisations; healthcare and public health services2.
Government and civil society
The ways in which we organise our society, our cultural values, and the functions and choices of
Government are things which affect children and their families at the level of the whole population.
Although the impact of tax policy may be felt by individual children and families, the effects of
economic conditions that help determine family wealth, shape social inequalities, and affect the
neighbourhoods in which children grow up, may be seen by looking at what happens to the
whole population of young people, and by measuring over many years.
Economic wellbeing of a country and the fiscal policies that shape the macroeconomic environment
in which families live have a measurable impact on child survival. As discussed previously, the
wealthier a country is, the greater the chances of children surviving their childhood. Tax policy
affects distribution of wealth within a country, and more children survive in countries where
wealth is shared more equitably than those that have wide gaps between the very rich and the
very poor. There is a social gradient in many aspects of health and wellbeing too. Children from
wealthier families tend to live longer and to have healthier lives. These inequities do not happen
by chance, they are shaped in a large part by the choices governments make. Family policy
and supportive social policy can help protect children from the harsh effects of poverty. More
children survive in countries that support families better. Recently published research shows that
standards of living are deteriorating for many families in the UK; 35% of households with children
do not have an income that is high enough to ensure an acceptable standard of living41.
The social determinants of health can help to explain why negative health behaviours are more
common in low income groups. Having no job, no prospects, and little money in a developed
economy can lead to low levels of self-esteem, poor mental health, depression, higher levels of
stress, and difficult relationships, and can make having children young an appealing option42. We
also know that maternal stress and being a young mother can lead to lower levels of breastfeeding
initiation. Given that poor mental health is more prevalent in more disadvantaged socioeconomic
groups, and that these groups are also more likely to have low levels of social support, tackling
negative health behaviours such as smoking, or alcohol and drug consumption, requires more than
just information. Policies to modify health behaviours need to address the social determinants of
health, and interventions need to be proportionately targeted across the social gradient if they
are to reduce health inequalities effectively6.
Sweden has different cultural attitudes from the UK, and these translate into policy. For example,
Sweden has lower levels of poverty but it also has a more equitable distribution of poverty and
social exclusion between age groups, as shown previously. Furthermore, the Nordic cultural
approach to the early years of life means that the quality of their early childhood education
and childcare systems, together with long and equitable parental leave, speak of countries that
understand childhood to be a special time deserving of protection.
Reducing childhood deaths and improving children’s lives through actions at the level of civil
society and state could be achieved by ensuring that all families have a sufficient income to buy
essential goods and be free from stress about basic security of housing, heat, and food. These
things could be achieved through more equitable distribution of resources through redistributive
fiscal policy, and by social policy that protects the young and vulnerable.
20
Why children die: death in infants, children, and young people in the UK - Part A
Health systems and organisations
The ways that we deliver healthcare, the systems for funding health services, the emphasis we
place on primary care; all these things affect the lives and health of children.
Child health systems and policy research is a relatively new field, and comparing general health
systems only began in earnest about a decade ago, in 2000, when the World Health Organization
published a report on health system performance. Research methods and acceptable standards
of evidence are still being developed and agreed. This is an area for which it is difficult to test
hypotheses, and using the gold standard research method of the biomedical science world, the
randomised controlled trial, is extremely challenging and often impossible. Recommendations
from this type of research are more likely to be constructs based on the best available evidence
rather than the most desirable data43.
Here we focus on everyday healthcare, because this is where most activity in the health service
happens, and because everything else that happens in the health service, from the simplest to
the most complex and sophisticated, relies on the performance of services at the first point of
contact that families have with the system of care.
It is well established that countries with strong primary care systems deliver high-quality outcomes,
and most international policy correctly focuses on strengthening primary care as the foundation
for improving health systems44. Much less is known about exactly how best to organise everyday
healthcare, for example, how primary and hospital care interact, in the best interests of children
and young people. There is no overall measure of the quality of healthcare for children.
Country comparisons of health systems are fraught with difficulties, but this sort of health
systems research can indicate areas that need further investigation and attention. The UK has
distinct advantages in a highly equitable accessible system of universal primary care. This is a
precious asset, and must be preserved. At the same time, there are striking differences between
countries in the way that first contact and primary care services are organised and delivered, and
there may be scope for learning and improvement. For example, all countries are struggling to
adapt their health systems to meet the evolving health needs of children and young people. The
epidemiological transition towards chronic illness and long-term conditions mandates a different
approach to organising and delivering health services compared with the existing hospitalcentric model which was designed more for acute and infectious illnesses requiring hospital
admission. Countries with strong primary care systems which enable close cooperation between
health professionals seem to be making progress in delivering high-quality care but there are
other important differences too2,4. For example, investment in health workforce differs between
countries; Sweden has more doctors per child than the UK, and GPs in Sweden are required to be
trained specifically in paediatrics and work in teams with children’s nurses and doctors24.
The National Children’s Bureau (NCB) has recently published a report on general practice for
children and young people, making important points about the necessity to ensure that services
meet current and evolving needs45. This topic is especially important since primary care plays a
strong gate-keeping role in the UK, and delivers the majority of healthcare for children. So a wellfunctioning children’s primary care service is the bedrock for the rest of the health service. The
NCB report, and other recent reports acknowledge that there are some challenges in primary
care for children46,47. It is crucial to ensure that the primary care workforce is appropriately skilled,
as these reports make clear. However, a more flexible approach to delivering primary care, for
21
Why children die: death in infants, children, and young people in the UK - Part A
example, through a team of professionals, as is the case in many European countries with better
outcomes in many areas of child health, may also offer a help towards achieving this goal24,2.
Primary care is also crucially important to address the growing problem of chronic disease and
long-term conditions, and a well-functioning acute care service should enable sufficient resource
to direct towards the increasingly important area of chronic disease care in early life.
Healthcare and public health
As discussed previously, healthcare amenable deaths are an incomplete way of trying to
address the question of possible differences in quality of care between countries, given the
current differences in data reliability and comparability between countries and the important
contribution that healthcare makes to health beyond preventing death, such as improving quality
of life. However, the data that do exist point to possible areas of concern that should be further
investigated.
Suboptimal care resulting in avoidable harm and poor health are other ways of examining
healthcare. Disease-based audits of quality of care for two important diseases in childhood,
diabetes and epilepsy, for example, reveal disturbing findings. Fewer than 6% of children with
diabetes in England receive care consistent with published guidelines, and preventable diabetic
emergencies and deaths are the consequence48. England’s performance as measured by HbA1c,
an indicator of diabetic control, is poor compared with Germany and Austria, as shown in the
table below.
Table 3: Country comparison of quality of care for children with diabetes49, 50, 51
NICE HbA1c target, 2004
England and Wales, 2010/2011
Germany and Austria, 2011
HbA1c <7.5%
15.1% females
16.4% males
50–55%
HbA1c considered to be
at risk levels
Over 30%
(>80mmol/mol, 9.5%)
10%
(>75mmol/mol, 9.0%)
A national audit of the quality of care for children with epilepsy, published in 2012, showed that
35% of children with epilepsy did not have an appropriate first assessment, and 40% did not see
a paediatric neurologist when it was indicated, and that less than half of children had specialist
nurse care as recommended52.
A systematic assessment of variations in healthcare processes within the UK revealed substantial
variations in some measures of care. For example, the emergency hospital admission rate for
children with asthma ranges from 25.9 to 641.9 per 100,000 population; a 25-fold difference53.
Further work is needed to assess how much of this variation is appropriate for differences in
population need, and how much is unwarranted.
Public health services and policies are other important means of preventing deaths in the longer
term, and improving health and quality of life. Tobacco control is a hugely important area for
preventing disease and promoting health. Smoking habits often begin in adolescence, yet
there are effective policies for tobacco control including banning smoking in public places, quit
smoking supports, media campaigns, health warnings, bans on tobacco advertising, promotion
and sponsorship, and taxes. The UK scores highly on implementation compared with many other
22
Why children die: death in infants, children, and young people in the UK - Part A
countries, but specifically for children and young people there are further actions that could be
taken, noting that a ban on smoking in cars is soon to be implemented in England, with the
rest of the UK likely to follow, and a review of standardised packaging of tobacco is currently
underway54. Smoking cessation interventions in pregnancy can be effective, leading to higher quit
rates (by 6%) and increases in birth weight (by 53g on average) compared with women who had
usual care55. However since most women who smoke in pregnancy continue to do so, the most
effective policies are preventative population-based and include tobacco price increases, and
school-based health education programmes56. Alcohol consumption among young people in the
UK is a considerable public health concern, with signs of alcohol-related liver disease affecting
people at increasingly younger adult ages57,58,59. There is good evidence that minimum pricing of
alcohol is effective at reducing consumption, and there are further harm reduction strategies that
can be implemented to reduce harm from alcohol60,61,62.
There is a growing movement for quality improvement in healthcare in the UK, and there could
be much to learn from cross country comparisons. More reliable comparable data on mortality,
morbidity, and quality of care, would go a long way towards enabling useful lessons to be learned
from other countries.
Key points
•
•
•
There are no simple explanations for why more children die (per capita) in the UK
than in some other European countries.
However, there are clear actions that could be taken to reduce the risk of children
dying and to improve the health and quality of life of British children.
There are effective interventions in economic and social policy, in health systems
strengthening, and in healthcare and public health services.
23
Why children die: death in infants, children, and young people in the UK - Part A
Next steps
The UK could, in theory, achieve the same mortality rate as countries where children have a greater
chance of surviving but how we might go about achieving this goal is less clear. There is no single
cause for the disparities between countries and equally there are no simple solutions.
Health systems and policy research for children is at an early stage of development, and the
problem of child mortality is highly complex. However, we can start to make reasoned general
policy and practice recommendations by careful definition of criteria for action:
•
•
•
•
Common causes of deaths or substantial contributors to the mortality burden.
Diseases or conditions where significant deficiencies in care have been identified and for
which there are identifiable and achievable solutions.
Systems and organisation issues that seem to be important when comparing the UK with
other European countries.
Wider societal and policy issues that make a difference to the chances of children's survival.
Five things fulfil these criteria, from which specific recommendations for action could be based:
First, infant deaths. The highest mortality rates in childhood occur in the first year of life. In
terms of scale, therefore, this is where the greatest scope for improvement lies. Preventing risk of
preterm birth and low birthweight, and promoting maternal health are good ways forward.
Second, acute illness. It is important that measures are taken to improve recognition and
management of serious illness across the health service – both primary and secondary care;
community and hospital; general practice, paediatrics, and mental health.
Third, injuries and poisoning. These causes of death are highly preventable, with effective
policies for most common causes of death from accidents and injuries. However, legislation,
implementation, and enforcement are crucial. Crucially also, a concerted and sustained policy
response to the problem of violence and self-harm among Britain’s young people is needed
urgently to address the lack of progress in reducing deaths and injuries from these causes.
Fourth, chronic disease. The numbers of children with chronic diseases are increasing, and there is
evidence of comparatively poor outcomes for example, in asthma, epilepsy, and diabetes. Moreover
the UK has failed to match the health gains for children and young people with chronic conditions
made by other comparable countries, with particular concern regarding non-communicable
disease mortality in young people. Urgent attention is needed to improve prevention and care for
children and young people with long-term conditions, including mental ill health. Policy responses
are needed from public health and healthcare, together with other domains including food and
nutrition policy, tobacco and alcohol, transport, and environment.
Fifth, the role of civil society and government. Absolute resource availability and equity of
distribution both have an impact on mortality and on life chances. Children’s lives can be protected
through supportive social policy and redistributive fiscal measures. The messages are stark and
crucial. Poverty kills children. Equity saves lives. Social protection is life-saving medicine for the
population.
24
Why children die: death in infants, children, and young people in the UK - Part A
It is a grave injustice that British children do not enjoy the highest standards of health, wellbeing,
and of chances to fulfil their individual potential in life. That children in the UK may die unnecessarily
should be a matter of national shame. As child health advocates, professionals, and policy makers,
we have a duty to act urgently to improve the life chances of our children.
25
Why children die: death in infants, children, and young people in the UK - Part A
References
1. Office for National Statistics. Vital Statistics: Population and Health Reference Tables. 2012.
www.ons.gov.uk/ons/rel/vsob1/vital-statistics--population-and-health-reference-tables/
index.html
2. Wolfe I, Thompson M, Gill P et al. Health services for children in western Europe. The Lancet
2013; 381(9873):1224-34.
3. Wolfe I, Cass H, Thompson M et al. Improving child health services in the UK: insights from
Europe. BMJ 2011; 342:d1277.
4. Wolfe I, and McKee M. European Child Health Services & Systems: Lessons without Borders
(European Observatory on Health Care Systems). Open University Press. 2013.
5. Viner R, Hargreaves D, Coffey C et al. Deaths amongst young people 0-24 years in the UK
compared with other rich countries: trends over four decades. The Lancet (in press).
6. Marmot, M. Fair Society, Healthy Lives: the Marmot Review. Strategic review of health inequalities
in England post 2010. 2010. www.ucl.ac.uk/marmotreview
7. Department of Education. Child death reviews: year ending 31 March 2013. Main tables:
SFR26/2013. Gov.uk. 2013. www.gov.uk/government/publications/child-death-reviews-yearending-31-march-2013
8. Euro-Peristat Project with SCPE and EUROCAT. European perinatal health report. The health
and care of pregnant women and babies in Europe 2010. 2013. www.europeristat.com
9. Flenady V, Middleton P, Smith GC et al. Stillbirths: the way forward in high-income countries.
The Lancet 2011; 377:1703-17.
10. The Lullaby Trust. 2014. www.lullabytrust.org.uk
11. Royal College of Paediatrics and Child Health & University College London. Child Health
Research UK – Clinical outcomes review programme. Overview of child deaths in four UK
countries. 2013. London. RCPCH.
12. World Health Organization Regional Office for Europe. European Detailed Mortality Database.
2013. Copenhagen , World Health Organization.
13. Pritchard-Jones K. et al. Cancer in children and adolescents in Europe: developments over 20
years and future challenges. European Journal of Cancer. 2006; 42(3): 2183-90.
14. Pearson GA (Ed). Why Children Die: A Pilot Study 2006; England (South West, North East and
West Midlands), Wales and Northern Ireland. London: CEMACH, 2008.
15. European Child Safety Alliance. Child Safety Report Cards. 2012. www.childsafetyeurope.org/
reportcards/index.html
16. Vision Zero Initiative. [Online] Traffic Safety by Sweden. www.visionzeroinitiative.com/en/
Concept
17. Wolfe I. Child health. In: Mackenbach J and McKee M. Successes and failures of health policy
in Europe over four decades: Diverging trends, converging challenges. 2013. Open University
Press.
26
Why children die: death in infants, children, and young people in the UK - Part A
18. Sethi, D. Road Traffic Injuries. In: Mackenbach J and McKee M. Successes and failures of health
policy in Europe over four decades: Diverging trends, converging challenges. 2013. Open
University Press.
19. Department of Transport. Novice drivers: Evidence review and Evaluation Pre-driver training,
Graduated Driver Licensing. 2013. www.gov.uk/government/publications/novice-driversevidence-review-and-evaluation
20.McKeown T. The role of medicine: dream, mirage or nemesis? 1979. Oxford, Blackwell.
21. Colgrove J. The McKeown thesis: a historical controversy and its enduring influence. American
Journal of Public Health 2002; 92: 725-729.
22.Figueras J and McKee M (Eds). Health, Wealth and Societal Well-being. European Observatory
on Health Systems and Policies. 2012. Maidenhead, Open University Press.
23.The Bristol Royal Infirmary Inquiry. The report of the public inquiry into children’s health
surgery at the Bristol Royal Infirmary 1984-1995: learning from Bristol. 2001.
24.Wolfe, I., H. Cass, et al. How can we improve child health services? British Medical Journal 2011;
342: 901-904.
25.Bell R, Donkin A and Marmot M. Tackling Structural and Social Issues to Reduce Inequities in
Children’s outcomes in Low to Middle Income Countries. 2013. UNICE.
26.Jeffries B J M H, Power C and Hertzman C. Birthwieght, childhood socioeconomic environment,
and cognitive development in the 1958 Birth Cohort Study. BMJ 2002; 325:305.
27.Pordes-Bowers, A, Strelitz J, Allen J and Donkin A. An Equal Start: Improving outcomes in
children’s centres – the evidence review. 2012. UCL Institute of Health Equity.
28.Korenman S, Miller JE and Sjaastas J. Long term poverty and child development in the United
States: results from the NLSY. Institute for research on Poverty Discussion paper, 1044-1094.
1994.
29.Salihu HM and Wilson RE. Epidemiology of prenatal smoking and perinatal outcomes. Early
Human Development. 83(11): 713-720, 2007.
30.Baker et al. A prospective study of micronutrient status in adolescent pregnancy. Am J Clin
Nutr. 89:1114-1124, 2009.
31. Renfrew M J et al. Preventing disease and saving resources: the potential contribution of
increasing breastfeeding rates in the UK. London : UNICEF UK, 2012.
32.Office for National Statistics. Mortality Rates: Child Mortality. 2013. www.ons.gov.uk/ons/
taxonomy/index.html?nscl=Child+Mortality
33.Adamson, P. Measuring child poverty. New league tables of child poverty in the world’s rich
countries. UNICEF Innocenti Research Centre. Report Card 10. Italy : UNICEF, 2012.
34.Wolfe, I. Disproportionate disadvantage of the young: Britain, the Unicef report on child
wellbeing, and political choices. Arch Dis Child 2013; 99(1): 6-9.
35.European Commission: Eurostat. People at risk of poverty or social exclusion. 2013 http://epp.
eurostat.ec.europa.eu/statistics_explained/index.php/People_at_risk_of_poverty_or_social_
exclusion
27
Why children die: death in infants, children, and young people in the UK - Part A
36.Marmot, M., Allen, J., Bell R., et al. WHO European review of social determinants of health and
the health divide. The Lancet. 2012; 380:1011-1029.
37.Viner, R. Adolescence and the social determinants of health. The Lancet. 2012; 379:1641-52.
38.OECD. OECD Factbook 2010: Economic, Environmental and Social Statistics. 2010. OECD
Publishing. doi: 10.1787/factbook-2010-en
39.Nolte & McKee. Does Healthcare Save Lives? Avoidable mortality revisited. Nuffield Foundation,
2004.
40.European Commission: Eurostat. Migration and migrant population statistics. Share of
foreigners in the resident population, 1 January 2012. 2013. http://epp.eurostat.ec.europa.eu/
statistics_explained/index.php/Migration_and_migrant_population_statistics
41. Padley D and Hirsch D. Households below a minimum income standard 2008/9 to 2011/12.
2014. Loughborough, University of Loughborough.
42.Marryat L and Martic C. Growing up in Scotland: maternal mental health and its impact on child
behaviour and development. 2010. Scottish Government Crown Copyright.
43.Ghaffar A et al. Changing mindsets in health policy and systems research. The Lancet. 2013;
381:436-37.
44.Starfield BS, Shi L, Macinko J. Contribution of primary care to health systems and health. The
Milbank Quarterly. 2005; 83:457-502.
45.Clements, K. Opening the door to better healthcare: ensuring general practice is working for
children and young people. 2013. London, National Children’s Bureau.
46.Royal College of General Practitioners and The Health Foundation. Guiding patients through
complexity: modern medical generalism. Report of an independent commission for the Royal
College of General Practitioners and The Health Foundation. 2011.
47.Harnden A. RCGP Child Health Strategy 2010-2015. 2010. London, RCGP.
48.Royal College of Paediatrics and Child Health. National paediatric diabetes audit. Report 2010–
2011. 2012. London, RCPCH.
49.de Beaufort, C.E. et al. Continuing stability of center differences in pediatric diabetes care: do
advances in diabetes treatment improve outcome? The Hvidoere Study Group on Childhood
Diabetes. Diabetes Care. 2007; 30(9):2245–50.
50.Gerstl EM et al. Metabolic control as reflected by HbA1c in children, adolescents and young
adults with type-1 diabetes mellitus: combined longitudinal analysis including 27,035 patients
from 207 centers in Germany and Austria during the last decade. European Journal of
Pediatrics. 2008; 167(4):447–53.
51. Cinek, O. et al. Heterogeneity in the systems of pediatric diabetes care across the European
Union. Pediatric Diabetes. 2012; 13(Suppl 16): 5–14.
52.Royal College of Paediatrics and Child Health. Epilepsy 12 National Report: United Kingdom
collaborative clinical audit of healthcare for children and young people with suspected epileptic
seizures. 2012. London, RCPCH.
28
Why children die: death in infants, children, and young people in the UK - Part A
53.NHS. NHS Atlas of Variation in Healthcare for Children and Young People. Reducing unwarranted
variation to increase value and improve quality. March 2013. www.rightcare.nhs.uk
54.Currie and Gilmore. Tobacco. In: Mackenbach J and McKee M. Successes and failures of health
policy in Europe over four decades: Diverging trends, converging challenges. 2013. Open
University Press.
55.Lumley J, Chamberlain C, Dowswell T, et al. Interventions for promoting smoking cessation
during pregnancy. Cochrane Database of Systematic Reviews. 2009; 3:CD001055.
56.Cnattingius, S. The epidemiology of smoking during pregnancy: smoking prevalance, maternal
circumstances, and pregnancy outcome. Nicotine Tob Res. 2004; 6(supp 2):S125-40.
57.World Health Organisation. Global status report on alcohol and health. 2011. Geneva, WHO.
58.Balance: getting the measure of alcohol. Facts and Figures. www.balancenortheast.co.uk/theevidence/facts-and-figures
59.Royal College of Physicians. Press Release: Research shows worrying rise in young people
with alcohol-related liver disease. March 2013. www.rcplondon.ac.uk/press-releases/researchshows-worrying-rise-young-people-alcoholic-liver-disease
60.Anderson P. Alcohol. In: Mackenbach J and McKee M. Successes and failures of health policy
in Europe over four decades: Diverging trends, converging challenges. 2013. Open University
Press.
61. Holmes J, Meng Y, Meier PS, et al. Effects of minimum unit pricing for alcohol on different
income and socioeconomic groups: a modelling study. The Lancet. 2014; S0140-6736 (13)
62417-4.
62.Toumbourou JW, Stockwell T, Neighbors C., et al. Interventions to reduce harm associated with
adolescent substance use. The Lancet. 2007; 369: 1391-401
29
May 2014
Published by:
Royal College of Paediatrics and Child Health
5-11 Theobalds Road, London, WC1X 8SH
The Royal College of Paediatrics and Child Health (RCPCH) is a registered
charity in England and Wales (1057744) and in Scotland (SC038299).


© Copyright 2026