
ST. JOHNS COUNTY 2005 Health Needs Assessment
ST. JOHNS COUNTY 2005 Health Needs Assessment Prepared by: Health Planning Council of Northeast Florida, Inc. 900 University Blvd. North, Suite 110 Jacksonville, Florida 32211 TABLE OF CONTENTS LIST OF TABLES AND FIGURES................................................................................ ii INTRODUCTION..............................................................................................................1 ST. JOHNS COUNTY PROFILE ....................................................................................3 I. Introduction ...........................................................................................................3 II. Population Characteristics.....................................................................................3 III. Socio-Economic Profile ........................................................................................4 HEALTH STATUS............................................................................................................9 I. Mortality Indicators ................................................................................................9 II. Infectious Diseases...............................................................................................23 III. Maternal and Child Health...................................................................................24 IV. Social and Mental Health.....................................................................................29 V. Behavioral Risk Factor Surveillance Survey .......................................................31 ACCESS TO CARE/HEALTH CARE RESOURCES.................................................33 I. Introduction .........................................................................................................33 II. Health Coverage..................................................................................................33 III. Primary Care .......................................................................................................35 IV. Health Care Professionals...................................................................................36 V. Health Care Facilities..........................................................................................36 VI. Other Health Care Services .................................................................................40 COMMUNITY COMMENTS ........................................................................................41 I. Focus Groups........................................................................................................41 II. Community Surveys..............................................................................................45 KEY ISSUES AND RECOMMENDATIONS...............................................................53 I. Introduction ...........................................................................................................53 II. Key Issues and Recommendations........................................................................53 APPENDICES Appendix A-1 2004 Executive Summary, Florida Youth Substance Abuse Survey Appendix A-2 2002 County Behavioral Risk Factor Surveillance Survey Appendix B St. Johns County Health Resources Appendix C-1 C-2 C-3 C-4 Focus Group Instrument Survey Instrument Other Survey Comments Survey Results by Select Zip Codes i LIST OF TABLES AND FIGURES TABLES St. Johns County Profile Table 1 Population Trends 2000-2015...............................................................................3 Table 2 Per Capita and Median Household Income, 2001 ................................................4 Table 3 Estimates of Persons and Families in Poverty, 2000 ............................................5 Table 4 Families on Public Assistance, 2000-2004 ...........................................................5 Table 5 Unemployment Rates, 2000-2004 ........................................................................6 Table 6 Students Receiving Reduced Price or Free Lunch, 2003-2004 ............................7 Health Status Table 7 Population by Race, 2003 .....................................................................................9 Table 8 Death Rates for Leading Causes of Death, 2002-2004.......................................10 Table 9 Reported AIDS and HIV Cases, 2002-2004........................................................23 Table 10 Total Births and Birth Rates by Race, 2002-2004 ..............................................24 Table 11 Female Population of Childbearing Women Age 15-44 by Race, 2002-2004 ..24 Table 12 Domestic Violence Offenses, 2004 ...................................................................29 Table 13 Arrests by Offenses, 2004..................................................................................31 Access to Care Table 14 Uninsured by Zip Codes, 2004 ..........................................................................33 Table 15 Health Insurance Coverage, 2004......................................................................33 Table 16 Medicaid Enrollees, 2000-2004.........................................................................34 Table 17 KidCare Enrollment, 2005.................................................................................35 Table 18 Medicare County Enrollment and Aged and Disabled Enrollment, 2003 .........35 Table 19 Adult Discharges, St. Johns County Residents, 2004........................................37 Table 20 Pediatric Discharges, St. Johns County Residents, 2004...................................38 Table 21 Free Standing Community Nursing Homes, 2004.............................................40 FIGURES St. Johns County Profile Figure 1 Estimates of Population by Age Group, 2004 ......................................................3 Figure 2 St. Johns County Population by Race, 2004.........................................................4 Figure 3 St. Johns Household Income Levels, 2003...........................................................5 Figure 4 High School Graduates, 2003-2004 .....................................................................6 Health Status Figure 5 Heart Disease Death Rates, All Races, 1998-2004 ............................................11 Figure 6 Heart Disease Death Rates by Race, 2002-2004 ................................................11 Figure 7 All Cancer Death Rates, All Races, 1998-2004 .................................................12 Figure 8 All Cancer Death Rates by Race, 2002-2004.....................................................12 Figure 9 Lung Cancer Death Rates, All Races, 1998-2004..............................................13 Figure 10 Lung Cancer Death Rates by Race, 2002-2004.................................................13 ii Figure 11 Breast Cancer Death Rates, All Races, 1998-2004 ..........................................14 Figure 12 Breast Cancer Death Rates by Race, 2002-2004..............................................14 Figure 13 Stroke Disease Death Rates, All Races, 1998-2004.........................................15 Figure 14 Stroke Disease Death Rates by Race, 2002-2004 ............................................15 Figure 15 C.O.P.D. Death Rates, All Races, 1998-2004 .................................................16 Figure 16 C.O.P.D. Death Rates by Race, 2002-2004......................................................16 Figure 17 Unintentional Injuries, All Races, 1998-2004..................................................17 Figure 18 Unintentional Injuries by Race, 2002-2004......................................................17 Figure 19 Motor Vehicle Accident Death Rates, All Races, 1998-2004..........................18 Figure 20 Motor Vehicle Accident Death Rates by Race, 2002-2004 .............................18 Figure 21 Diabetes Death Rates, All Races, 1998-2004...................................................19 Figure 22 Diabetes Death Rates by Race, 2002-2004 ......................................................19 Figure 23 Influenza & Pneumonia Disease Death Rates, All Races, 1998-2004 .............20 Figure 24 Influenza & Pneumonia Disease Death Rates by Race, 2002-2004.................20 Figure 25 Alzheimer’s Disease Death Rates, All Races, 1998-2004 ...............................21 Figure 26 Alzheimer’s Disease Death Rates by Race, 2002-2004 ...................................21 Figure 27 Liver Disease Death Rates, All Races, 1998-2004...........................................22 Figure 28 Liver Disease Death Rates by Race, 2002-2004 ..............................................22 Figure 29 Gonorrhea, Chlamydia, & Infectious Syphilis Rates, All Races, 1998-2004 ..23 Figure 30 Infant Mortality Rates, All Races, 1998-2004..................................................25 Figure 31 Infant Mortality Rates by Race, 2002-2004 .....................................................25 Figure 32 Low Birthweights, All Races, 1998-2004 ........................................................26 Figure 33 Low Birthweights by Race, 2002-2004............................................................26 Figure 34 Births to Mothers Under 18, All Races, 1998-2004.........................................27 Figure 35 Births to Mothers Aged 15-17 by Race, 2002-2004.........................................27 Figure 36 Percent of Pregnancies Receiving First Trimester Prenatal Care, All Races, 1998-2004 .........................................................................................................28 Figure 37 Percent of Pregnancies Receiving First Trimester Prenatal Care by Race, 2002-2004 ........................................................................................................28 Figure 38 Births to Mothers Who Smoked During Pregnancy, All Races, 2002-2004....29 Figure 39 Suicide Death Rates for All Races, 1998-2004 ................................................30 Figure 40 Suicide Death Rates by Race, 2002-2004 ........................................................30 Access to Care Figure 41 Hospital Utilization of St. Johns County Residents, 2004 ...............................37 Figure 42 Flagler Hospital, ER Visits, 1997-2004 ...........................................................38 Figure 43 Flagler Hospital Inpatient Hospital Admissions, 1997-2004 ...........................39 iii INTRODUCTION The St. Johns County Health Department spearheaded an initiative to conduct a comprehensive, county-wide health needs assessment. The Health Planning Council of Northeast Florida was asked to facilitate this community initiative. The St. Johns County Health Assessment Task Force, comprised of representatives from Flagler Hospital, Baptist Health-South, the St. Johns County Chamber of Commerce, local medical and behavioral health providers, social service agencies, civic organizations, minority and faith-based groups, and concerned citizens, was formed. Information collected during the needs assessment process was presented to the St. Johns County Health Assessment Task Force at community meetings that were held at the St. Johns County Health Department from June through December of 2005. Components of St. Johns County’s needs assessment included an analysis of demographics, health statistics, and access to health care indicators for county residents. Community input was obtained from six focus group interviews with a variety of groups, including community redevelopment agencies, elderly, foster parents, and minority churches. A community-wide survey that examined the community’s opinion on health care services and quality of life issues was also distributed to gain additional feedback from St. Johns County residents. Detailed information summarizing each of these components is included in this report. At the final two community meetings, members of the St. Johns County Health Assessment Task Force made recommendations of key health issues based on data obtained from the various components of the needs assessment. A summary of their key issues and recommendations is included in the final section of this report. The St. Johns Health Assessment Task Force plans to continue meeting on a quarterly basis in order to assess the progress of the implementation of these recommendations 1 2 ST JOHNS COUNTY PROFILE I. INTRODUCTION The characteristics of a community, including the age, gender, ethnic background, and economic characteristics, influence the community’s health care needs and the design of delivery of services to meet those needs. This section provides an overview of the demographics and socio-economic characteristics of St. Johns County in comparison to the state. II. POPULATION CHARACTERISTICS Table 1 shows St. Johns County’s population trends and projections between 2000-2015. It is projected that the county will experience a 60% population growth during this period, while Florida is projected to increase by just over 30%. Table 1 Population Trends, 2000-2015 Area St. Johns Florida 2000 124,556 16,072,832 Population 2005 2010 151,136 175,299 17,844,137 19,478,414 2015 % Population Change 2000-2010 199,311 60.0% 21,080,569 31.2% Source: July 1 Population Estimates, Office of Governor, October 2004 Figure 1 summarizes the age groups of St Johns County residents with comparison to Florida. The highest percentage of St. Johns County residents are in the 45-64 age group, accounting for nearly 30% of the county’s population. Elderly residents over the age of 65 make up 15% of the total population. Figure 1 Estimates of Population by Age Group, 2004 30 Percent 25 20 15 10 5 0 0-14 15-24 25-44 45-64 St. Johns Florida Source: July 1 Population Estimates, Office of Governor, 2004 3 65+ Race and Ethnicity Figure 2 shows the racial composition of St. Johns County with comparison to Florida. Only 7.% of the population in St. Johns is non-white, with comparison to 18% of the state. The “Other” race category includes American Indians, Asians, and Hawaiian/Pacific Islanders. Figure 2 St. Johns County Population by Race, 2004 100.0 92.9 81.7 Percent 80.0 60.0 40.0 15.8 20.0 0.0 White 5.8 1.3 Black Other St. Johns 2.5 Florida Source: Population Estimates, Office of the Governor, 2004 III. SOCIO-ECONOMIC PROFILE Income St. Johns County had a per capita income of $25,233 in 2001, which exceeded Florida’s per capita income of $20,199 (Table 2 ). At $46,653, St. Johns County had a higher median household income than the state’s average of $37,307. Table 2 Per Capita and Median Household Income, 2001 St. Johns Florida Per Capita Income Median Household Income Per Capita Income Median Household Income $25,233 $46,653 $20,199 $37,307 Source: ESRI Marketing Systems, 2002 Nearly 20% of St. Johns County households had incomes between $50,000 - $99,000. Only 6% of the county had household incomes less than $10,000 (Figure 3). 4 Figure 3 St. Johns Household Income, 2003 20 18 16 14 12 10 8 6 4 2 0 <$10K $1014,999 $15$24,999 $25$34,999 $35$49,999 $50$74,999 $75$100$99,999 $149,000 >$150 Source: Demographics Now, 2003 Poverty The estimated percentage of all persons living in poverty in St. Johns County was 8.0% compared to 12.5% in Florida (Table 3). Table 3 Estimates of Persons and Families in Poverty, 2000 All Persons Children 0-17 Total County Population Number Percent Percent St. Johns 120,920 9,698 8.0 2.3 Florida 15,605,367 1,952,629 12.5 4.0 18-64 65+ Percent 4.8 6.9 Percent 0.9 1.6 Source: 2000 US Census Bureau. Note: 2000 US Census Poverty status refers to the 1999 poverty income level. Public Assistance National welfare reform and the initiation of Florida's WAGES program in 1996 dramatically reduced the number of families enrolled in the State Public Assistance Program. Table 4 summarizes the number of clients and families receiving public assistance. St. Johns County experienced an increase of 42% in persons receiving assistance while Florida experienced a decreased of 14%. Table 4 Families on Public Assistance 2000-2004 2000 Area Families 231 63,684 Clients 397 139,605 2001 Families 327 57,702 Persons Receiving Cash Assistance 2002 2003 Clients 639 123,480 Families 253 58,525 Clients 488 124,579 Families 251 58,535 Clients 497 124,592 2004 Families 280 57,248 St Johns Florida Note: July TANF enrollment figures provided Source: Economic Self-Sufficiency Services, Florida Department of Children and Families, 2005. 5 Clients 564 119,665 % Change 42.1% -14.3% Labor Force, Employment, and Industry According to the Florida Department of Labor and Employment Statistics, there was an average of 70,361 persons employed in the workforce in St. Johns County. Between 2000-2004, St. Johns County’s unemployment rate showed an increase of 56%, however St. Johns County’s unemployment rate is still below the state average (Table 5). Table 5 Unemployment Rates, 2000-2004 % Unemployment Area 2000 2001 2002 2003 2004 % Change 1999-2004 St .Johns 2.4 3.5 3.8 3.7 3.7 56% Florida 3.6 4.8 5.5 5.1 4.8 33% Source: Florida Agency for Workforce Innovation, Labor Market Statistics, Local Area Unemployment Statistics Program, 2004 Education Total enrollment in St. Johns County public schools (pre kindergarten - grade 12) is estimated at 24,061. The high school graduation rate and drop out rates are shown in Figure 4. St. Johns County had a higher graduation rate and lower drop out rate than the state average. Figure 4 High School Graduates, 2003-04 100.0 78.3 71.6 80.0 60.0 40.0 20.0 0.0 2.9 2.3 St. Johns Florida Graduation Rate Drop Out Rate Source: Bureau of Education information and Accountability Services. Florida Dept of Education, Florida School Indicator Report; Profiles of School Districts, 2003-04 Graduation rate is defined as % of students who graduate from high school within 4 years after entering 9th grade for the first time. 6 Students receiving free or reduced price lunch is a good indicator of poverty in young families. Table 6 summarizes the number of students receiving free or reduced price lunch. St. Johns County had a much lower percentage of elementary and middle school students receiving free or reduced lunch with comparison to Florida. Table 6 Students Receiving Free or Reduced Price Lunch, 2000-04 Area St. Johns Florida Type of School Middle 19.5% 48.0% Elementary 23.4% 53.5% Source: Florida School Indicators Report, 2003-04. Total percentage of students in enrolled in public schools receiving free or reduced lunches. Students whose family incomes are < 130% of the federal poverty guidelines are eligible for free lunch and students whose family incomes are between 131-185% are eligible for the reduced price lunch program. High schools students are not included in these figures 7 8 HEALTH STATUS I. MORTALITY INDICATORS Mortality rates can be key indicators of the state of health of a community. This section will compare mortality rates for St. Johns County with Florida mortality rates, as well as three other counties in Northeast Florida, including Baker, Clay, and Nassau Counties. Table 7 summarizes the population by race for St. Johns County and the comparison counties in Northeast Florida. St. Johns County’s minority population is lower than Florida as well its surrounding counties. Table 7 Population by Race, 2003 Area Baker Race Population Total White Black Other Total White Black Other Total White 23,457 19,829 3,386 242 Clay 156,951 140,345 11,750 4,856 Nassau 63,425 58,119 4,681 Black Other 625 St. Johns Total 141,216 White 130,495 8,745 Black Other 1,976 Florida Total 17,134,945 White 14,012,002 Black 2,690,405 Other 432,538 Source: July 1 Population Estimates, Office of the Governor, 2004 Race as % of Population 100% 84.5% 14.4% 1.0% 100% 89.4% 7.5% 3.1% 100% 91.6% 7.4% 1.0% 100% 92.4% 6.2% 1.4% 100% 81.8% 15.7% 2.5% A significant number of St. Johns County’s deaths are premature and preventable. Behavior modification and risk reduction can reduce the mortality rates of many of the leading causes of death, especially those attributed to heart disease, stroke, diabetes, lung cancer, and motor vehicle accidents. Individuals may improve both the length and quality of their lives by simply following a healthy lifestyle and receiving regular medical care. Table 8 summarizes age-adjusted death rates for several of the leading causes of deaths for all races. St. Johns County age-adjusted death rates for cancer, chronic obstructive pulmonary disease, and pneumonia/influenza were slightly higher than Florida, while death rates for heart disease, stroke, diabetes, and liver disease fell below the state. 9 Table 8 Death Rates for Leading Causes of Death, 2002-2004 Area Baker Clay Nassau St Johns Florida Heart Disease 377.1 303.0 304.7 207.3 264.1 Age-Adjusted Death Rates, All Race, Per 100,00 Population Cancer Stroke COPD Diabetes Pneumonia/ Liver Disease Influenza 195.1 67.1 83.2 62.2 37.6 14.7 211.4 58.5 55.9 27.2 17.1 10.7 222.0 59.6 61.9 19.9 22.8 11.5 176.8 39.0 42.4 13.7 15.6 9.5 174.7 42.0 38.1 20.8 13.1 10.7 Note: Three-Year Average, Age Adjusted Source: Florida Department of Health, Office of Planning, Evaluation & Data Analysis, 2004 The remainder of this section will explore the leading causes of death for St. Johns County in comparison with Baker, Clay and Nassau Counties as well as Florida. Age-adjusted death rates for all races from the period of time between 1998 – 2004 will be presented, as well as age adjusted death rates by race from 2002 – 2004. Unless otherwise noted, all tables in this section compare three-year rolling averages using age-adjusted death rates from the Florida Department of Health’s CHARTS website which can be found at http://www.floridacharts.com/charts/chart.aspx Mortality rates for the following indicators are included in this section: • Heart Disease • All Cancers • Breast Cancer • Lung Cancer • Stroke • Chronic obstructive pulmonary disease (C.O.P.D.) • Unintentional injuries • Motor vehicle accidents • Diabetes • Influenza and pneumonia • Alzheimer’s disease • Liver Disease In addition, this section will review infectious disease rates, maternal and child health and social and mental health indicators as well as results of the Behavioral Risk Factor Surveillance System Survey and Florida Youth Substance Abuse Survey. 10 Heart Disease Heart disease remains the nation’s leading cause of death. Figure 5 shows age-adjusted heart disease death rates for the period of time between 1998 – 2004. St Johns County experienced a decline in heart disease deaths during this time period and was lower than the state and surrounding counties. Non-white deaths from heart disease in St Johns County were higher than white deaths (Figure 6). Figure 5 Heart Disease Deaths, All Races, 1998-2004 500.0 400.0 300.0 200.0 100.0 0.0 Baker Clay Nassau St. Johns Florida 1998-2000 429.1 381.9 380.6 239.2 314.3 2000-2002 412.5 333.7 372.4 231.2 292.8 2002-2004 377.1 303.0 304.7 207.3 264.1 Figure 6 Heart Disease Death Rates By Race, 2002-2004 500.0 400.0 300.0 200.0 100.0 0.0 Baker Clay Nassau St. Johns Florida All Races 377.1 303.0 304.7 207.3 264.1 White 391.9 304.9 296.9 203.8 254.6 Non-White 263.4 260.7 409.9 267.5 339.8 11 Cancer Cancer ranks second only to heart disease as the leading cause of death in the United States. Age-adjusted deaths from all types of cancer in St. Johns County showed a decrease during this time period (Figure 7). Cancer deaths in the non-white population of were higher than the white population in St. Johns County (Figure 8). Figure 7 All Cancer Death Rates For All Races, 1998-2004 300.0 250.0 200.0 150.0 100.0 50.0 0.0 Baker Clay Nassau St. Johns Florida 1998-2000 256.5 218.1 210.4 206.8 190.2 2000-2002 224.2 229.3 204.7 189.1 182.8 2002-2004 195.1 211.4 222.0 176.8 174.7 Figure 8 All Cancer Death Rates By Race, 2002-2004 300.0 250.0 200.0 150.0 100.0 50.0 0.0 Baker Clay Nassau St. Johns Florida All Races 195.1 211.4 222.0 176.8 174.7 White 194.8 216.0 224.6 175.0 173.0 Non-White 211.5 143.9 191.8 210.3 188.5 12 Lung Cancer St. Johns County experienced a decrease in age-adjusted lung cancer deaths between 1998-2004. (Figure 9). Lung cancer deaths in the non-white population were higher in the white population in St. Johns County but lower in Florida and Baker, Clay, and Nassau Counties (Figure 10). Figure 9 Lung Cancer Death Rates, All Races, 1998-2004 100.0 80.0 60.0 40.0 20.0 0.0 Baker Clay Nassau St. Johns Florida 1998-2000 87.7 68.9 72.7 63.8 56.7 2000-2002 62.2 78.3 67.5 60.1 54.8 2002-2004 58.2 73.5 71.9 50.1 52.6 Figure 10 Lung Cancer Death Rates By Race, 2002-2004 100.0 80.0 60.0 40.0 20.0 0.0 Baker Clay Nassau St. Johns Florida All Races 58.2 73.5 71.9 50.1 52.6 White 59.2 76.1 74.7 49.0 53.4 Non-White 53.4 31.3 38.3 68.7 43.8 13 Breast Cancer St. Johns County showed a decrease in the number of breast cancer deaths during 1998-2004 (Figure 11). There was little difference in breast cancer deaths among racial groups in St. Johns County (Figure 12). Figure 11 Breast Cancer Death Rates, All Races, 1998-2004 50.0 40.0 30.0 20.0 10.0 0.0 Baker Clay Nassau St. Johns Florida 1998-2000 35.5 29.6 20.8 21.4 24.9 2000-2002 32.2 30.4 22.1 19.1 23.6 2002-2004 16.5 13.0 16.8 13.3 12.4 Figure 12 Breast Cancer Death Rates By Race, 2002-2004 25.0 20.0 15.0 10.0 5.0 0.0 Baker Clay Nassau St. Johns Florida All Races 16.5 13.0 16.8 13.3 12.4 White 15.5 13.2 16.9 13.3 11.9 Non-White 21.7 10.5 12.8 12.5 15.4 14 Stroke Stroke is a cardiovascular disease that affects the blood vessels supplying blood to the brain. Stroke is the third leading cause of death in the United States. As shown in Figure 13, St. Johns County’s death rate from strokes decreased slightly from 1998-2004. There was a higher death rate among the non-white population in St. Johns County as shown in Figure 14. Figure 13 Stroke Disease Death Rates, All Races, 1998-2004 80.0 60.0 40.0 20.0 0.0 Baker Clay Nassau St. Johns Florida 1998-2000 81.7 65.2 62.8 47.1 49.6 2000-2002 69.4 61.2 60.9 46.3 46.8 2002-2004 67.1 58.5 59.6 39.0 42.0 Figure 14 Stroke Disease Death Rates By Race, 2002-2004 100.0 80.0 60.0 40.0 20.0 0.0 Baker Clay Nassau St. Johns Florida All Races 67.1 58.5 59.6 39.0 42.0 White 69.3 57.1 56.2 38.3 39.0 Non-White 53.7 76.4 105.0 51.1 69.1 15 Chronic Obstructive Pulmonary Disease (C.O.P.D.) Chronic bronchitis, emphysema, and asthma all fall within the category of C.O.P.D. There was a decline in C.O.P.D. death rates from 1998-2004 in St. Johns County as shown in Figure 15. There was little difference in C.O.P.D death rates among racial groups in St. Johns County (Figure 16). Figure 15 C.O.P.D. Death Rates For All Races, 1998-2004 100.0 80.0 60.0 40.0 20.0 0.0 Baker Clay Nassau St. Johns Florida 1998-2000 92.4 67.5 72.4 49.9 41.0 2000-2002 83.5 67.9 67.6 47.8 39.8 2002-2004 83.2 55.9 61.9 42.4 38.1 Figure 16 C.O.P.D. Death Rates By Race, 2002-2004 80.0 60.0 40.0 20.0 0.0 Baker Clay Nassau St. Johns Florida All Races 83.2 55.9 61.9 42.4 38.1 White 86.9 57.7 65.6 42.6 39.1 Non-White 43.2 19.5 20.9 39.3 24.5 16 Unintentional Injuries Unintentional injuries include motor vehicle crashes, drowning, fires, fall, and other home and recreation injuries. Unintentional injuries have shown a slight increase in St. Johns County from 1998-2004 (Figure 17). The white population in Clay County had more deaths from unintentional injuries in comparison to the non-white population (Figure 18). Figure 17 Unintentional Injuries Death Rates, All Races, 1998-2004 70.0 50.0 30.0 10.0 -10.0 Baker Clay Nassau St. Johns Florida 1998-2000 63.4 38.9 57.2 33.9 36.5 2000-2002 54.9 40.3 44.1 35.5 39.7 2002-2004 51.2 40.0 54.2 36.7 42.8 Figure 18 Unintentional Injuries Death Rates By Race, 2002-2004 60.0 45.0 30.0 15.0 0.0 Baker Clay Nassau St. Johns Florida All Races 51.2 40.0 54.2 36.7 42.8 White 50.9 42.7 55.4 37.1 44.8 Non-White 50.3 13.7 43.2 31.9 34.3 17 Motor Vehicle Accidents Half of all unintentional injury deaths are due to motor vehicle accidents. Age-adjusted motor vehicle accidents in St. Johns County showed an increase during the period of time from 19982004 (Figure 19). The non-white population in St. Johns County had a high motor vehicle death rate than the white population (Figure 20). Figure 19 Motor Vehicle Accident Death Rates, All Races, 1998-2004 40.0 30.0 20.0 10.0 0.0 Baker Clay Nassau St. Johns Florida 1998-2000 29.4 15.7 23.8 16.5 16.4 2000-2002 38.0 16.3 21.4 15.3 17.7 2002-2004 35.9 17.4 24.7 18.5 18.5 Figure 20 Motor Vehicle Accident Death Rates By Race, 2002-2004 40.0 30.0 20.0 10.0 0.0 Baker Clay Nassau St. Johns Florida All Races 35.9 17.4 24.7 18.5 18.5 White 34.3 18.9 26.4 18.2 19.0 Non-White 40.0 3.9 6.9 22.7 17.4 18 Diabetes Diabetes is a chronic metabolic disease that affects millions of Americans and is the sixth leading cause of death in the United States. St. John’s County’s age-adjusted death rate from diabetes remained relatively stable during the period from 1998 – 2004 (Figure 21). St. Johns County had a significantly higher number of deaths from diabetes in the non-white population, with over double the number of deaths than the white population (Figure 22). Figure 21 Diabetes Disease Death Rates For All Races, 1998-2004 60.0 45.0 30.0 15.0 0.0 Baker Clay Nassau St. Johns Florida 1998-2000 46.7 32.4 17.4 17.1 21.3 2000-2002 46.2 30.5 16.1 13.1 21.3 2002-2004 62.2 27.2 19.9 13.7 20.8 Figure 22 Diabetes Disease Death Rates By Race, 2002-2004 60.0 45.0 30.0 15.0 0.0 Baker Clay Nassau St. Johns Florida All Races 62.2 27.2 19.9 13.7 20.8 White 60.4 25.2 18.4 12.8 18.4 Non-White 66.4 55.2 34.6 30.7 45.3 19 Influenza and Pneumonia Influenza and pneumonia deaths together constitute the seventh leading cause of death in the United States. St. Johns County showed a decrease in age-adjusted death rates from influenza and pneumonia from 1998-2004 (Figure 23). The death rate from influenza and pneumonia was higher in the non-white population in St. Johns County, as shown in Figure 24. Figure 23 Influenza & Pneumonia Disease Death Rates, All Races, 1998-2004 50.0 40.0 30.0 20.0 10.0 0.0 Baker Clay Nassau St. Johns Florida 1998-2000 47.9 21.0 38.9 25.5 17.3 2000-2002 36.8 20.4 33.1 19.7 15.0 2002-2004 37.6 17.1 22.8 15.6 13.1 Figure 24 Influenza & Pneumonia Disease Death Rates by Races, 2002-2004 40.0 30.0 20.0 10.0 0.0 Baker Clay Nassau St. Johns Florida All Races 37.6 17.1 22.8 15.6 13.1 White 38.1 17.0 23.0 15.1 12.7 Non-White 44.2 19.0 24.5 22.7 15.7 20 Alzheimer’s Disease An estimated 4.5 million Americans have Alzheimer’s disease. St. Johns County showed a decrease in the number of deaths from this disease during the period of time from 1998-2004 (Figure 25). There were no difference in Alzheimer’s death rates among racial groups in St. Johns County as shown in Figure 26. Figure 25 Alzheimer’s Disease Death Rates, All Races, 1998-2004 40.0 30.0 20.0 10.0 0.0 Baker Clay Nassau St. Johns Florida 1998-2000 13.4 23.5 19.2 11.0 12.3 2000-2002 19.2 39.2 16.5 17.9 16.0 2002-2004 37.1 37.0 23.6 13.3 17.0 Figure 26 Alzheimer’s Disease Death Rates By Race, 2002-2004 40.0 30.0 20.0 10.0 0.0 Baker Clay Nassau St. Johns Florida All Races 37.1 37.0 23.6 13.3 17.0 White 41.7 37.5 23.8 13.3 17.2 Non-White 0.0 26.5 22.1 13.8 14.0 21 Liver Disease Among the numerous diseases that affect the liver, cirrhosis accounts for most of the cases of liver disease and death associated with liver failure. As shown in Figure 27, death rates from liver disease showed a decline in St. Johns County. Liver disease death rates were higher in the white population than non-white population in St. Johns County as shown in Figure 28. Figure 27 Liver Disease And Cirrhosis Death Rates For All Races, 1998-2004 30.0 25.0 20.0 15.0 10.0 5.0 0.0 Baker Clay Nassau St. Johns Florida 1998-2000 18.5 7.8 10.6 13.4 11.0 2000-2002 24.6 10.3 9.1 10.0 10.9 2002-2004 14.7 10.7 11.5 9.5 10.7 Figure 28 Liver Disease And Cirrhosis Death Rates By Race, 2002-2004 25.0 20.0 15.0 10.0 5.0 0.0 Baker Clay Nassau St. Johns Florida All Races 14.7 10.7 11.5 9.5 10.7 White 13.6 11.3 10.6 9.7 11.3 Non-White 20.6 4.0 22.7 6.6 6.9 22 II. INFECTIOUS DISEASES HIV/AIDS represents the eleventh leading cause of death among Floridians. St. Johns County had a significantly lower average rate of HIV and AIDS cases than Florida (Table 9). The number of HIV and AIDS cases by race is not available in counties where the total number of cases are less than three, due to confidentiality issues. Table 9 AIDS and HIV Cases, 2002-2004 HIV Cases Average # of Rate per Area Cases 100,000 Baker 3.0 12.7 Clay 13.0 8.2 Nassau 6.3 9.9 St. Johns 17.3 12.1 Florida 6,381.0 37.1 AIDS Cases Average # of Rate per 100,000 Cases 1.6 6.8 13.0 8.2 5.0 7.9 17.3 12.1 5,210.0 30.3 Source: Florida Department of Health, Bureau of HIV/AIDS, 2005 Sexually Transmitted Diseases The sexually transmitted disease rate in St. Johns County experienced an increase from 19982004 however, still remained signficantly lower than the state’s rate (Figure 29) Figure 29 Gonorrhea, Chlamydia & Infectious Syphilis Rates, All Races, 1998-2004 450.0 400.0 350.0 300.0 250.0 200.0 150.0 100.0 50.0 0.0 Baker Clay Nassau St. Johns Florida 1998-2000 425.2 191.6 196.1 92.1 330.3 2000-2002 433.0 225.5 226.1 114.6 365.9 2002-2004 399.2 224.9 213.5 130.0 364.5 23 III. MATERNAL AND CHILD HEALTH Birth Rate Population growth in a community is a combination of natural increase (more births than deaths) and migration (more people moving into the area than leaving). The birth rate for St. Johns County was 10.4 births per 1,000 for all races, which fell below the state’s rate of 12.3 births per 1,000 (Table 10 ). The rate of non-white births in St. Johns County was 19.0 births per 1,000 population which exceeded the state’s non-white birth rate of 17.6 births per 1,000 population. Table 10 Total Births and Birth Rates by Race, 2002-2004 All Races White Area Ave Number Rate Ave Rate Number Baker 360 15.3 317 11.1 Clay 2,020 12.8 1,747 15.9 Nassau 698 11.0 631 12.4 St. Johns 1,484 10.4 1,283 10.8 Florida 211,956 12.3 156,554 11.1 Nonwhite Ave Rate Number 43 11.9 272 16.3 66 12.5 201 19.0 55,038 17.6 Female Population of Childbearing Age The percentage of women of childbearing age (15- 44 years) in St. Johns County represented 19% of the total population as shown in Table 11. The majority of women of childbearing age in St. Johns County were white. Table 11 Female Population of Childbearing Women Age 15-44 by Race, 2002-2004 White Black Area Total Childbearing Population Ave % Ave % Ave % Number Number Number Baker 4,730 20.2% 4,092 86.5% 598 12.6% Clay 33,526 21.4% 29,470 87.9% 2,879 8.6% Nassau 12,507 19.7% 11,400 91.1% 974 7.8% St. Johns 27,084 19.2% 24,771 91.5% 1,888 7.0% Florida 3,361,680 19.6% 2,606,919 77.6% 650,917 19.4% 24 Other Ave Number 40 1,177 133 425 103,844 % 0.8% 3.5% 1.1% 1.6% 3.1% Infant Mortality Infant mortality includes the deaths of babies from birth to 364 days. The leading causes of infant deaths in Florida were perinatal conditions, congenital anomalies, low birth weight, and sudden infant death syndrome. St. Johns County experienced an increase in infant deaths during 1998-2004 (Figure 30). As shown in Figure 31, St. Johns County had a higher non-white infant mortality rate, with over twice as many non-white deaths in comparison to the white population. Figure 30 Infant Mortality Rates, All Races, 1998– 2004 1 0 .0 8 .0 6 .0 4 .0 2 .0 0 .0 B ak er Clay Nas s au S t. J ohns Florida 1 9 9 8 -2 0 0 0 4 .7 8 .0 7 .1 5 .6 7 .2 2 0 0 0 -2 0 0 2 5 .7 6 .9 8 .4 6 .0 7 .3 2 0 0 2 -2 0 0 4 7 .4 6 .9 5 .7 7 .0 7 .3 Figure 31 Infant Mortality Rates By Race, 2002-2004 2 0 .0 1 5 .0 1 0 .0 5 .0 0 .0 B ak er Clay Nas s au S t. J ohns Florida All Races 7 .4 6 .9 5 .7 7 .0 7 .3 W hite 8 .4 5 .9 5 .3 5 .2 5 .7 Non-W hite 0 .0 1 3 .5 1 0 .1 1 8 .2 1 2 .0 25 Low Birth Weight Babies born less than five and a half pounds, or 2500 grams, in weight are termed "low birth weight" births. The highest rates of these births occur to teen and minority mothers. These vulnerable babies have an increased risk of morbidity and mortality and consume a disproportionate share of health care resources during the early childhood years. St. Johns County’s low birth rate remained stable from 1998– 2004 and was close to the state’s low birthweight rate (Figure 32). St. Johns County’s low birthweight rate of non-white mothers was three times as high as white mothers (Figure 33). Figure 32 Low Birthweights For All Races, 1998-2004 10.0 8.0 6.0 4.0 2.0 0.0 Baker Clay Nassau St. Johns Florida 1998-2000 6.5 7.3 8.0 7.8 8.1 2000-2002 7.8 7.0 7.5 7.5 8.2 2002-2004 7.9 6.8 8.0 7.7 8.5 Figure 33 Low Birthweights By Race, 2002-2004 20.0 15.0 10.0 5.0 0.0 Baker Clay Nassau St. Johns Florida All Races 7.9 6.8 8.0 7.7 8.5 White 7.0 6.3 7.2 6.8 7.2 Non-White 14.0 9.8 15.6 13.6 12.4 26 Adolescent Births Babies born to young mothers under the age of 18 are more likely to experience poor birth outcomes than those born to older mothers. Birth outcomes are also closely tied to the education, economic outlook, and family relationships of the mother. Births to teenage mothers in St. Johns County showed a decrease from 1998-2004 (Figure 34). Births to non-white teenage mothers was over three times as high as white mothers in St. Johns County (Figure 35). Figure 34 Births To Mothers Ages 15-19, All Races, 1998-2004 100.0 80.0 60.0 40.0 20.0 0.0 Baker Clay Nassau St. Johns Florida 1998-2000 91.3 42.3 57.0 36.6 52.2 2000-2002 84.9 37.8 49.2 31.2 47.3 2002-2004 73.8 34.6 47.3 29.9 42.8 Figure 35 Births To Mothers Ages 15-19 By Race, 2002-2004 100.0 80.0 60.0 40.0 20.0 0.0 Baker Clay Nassau St. Johns Florida All Races 73.8 34.6 47.3 29.9 42.8 White 74.9 33.5 44.4 23.8 36.7 Non-White 68.1 42.6 76.1 86.2 60.1 27 Early Prenatal Care Prenatal care begun during the first trimester of pregnancy can have a profound effect on birth outcomes. Figure 36 illustrates the percentage of pregnancies receiving early prenatal care for all races from 1998-2004. St. Johns County remained stable over this period of time. A higher percentage of white mothers received early prenatal care in St. Johns County than non-white mothers (Figure 37). Figure 36 Percent of Pregnancies Receiving First Trimester Prenatal Care, All Races, 1998-2004 100.0 80.0 60.0 40.0 20.0 0.0 Baker Clay Nassau St. Johns Florida 1998-2000 85.2 89.0 90.7 85.9 83.8 2000-2002 85.8 89.0 91.3 87.1 84.4 2002-2004 83.8 87.4 89.1 88.2 84.1 Figure 37 Percent of Pregnancies Receiving First Trimester Prenatal Care By Race, 2002-2004 100.0 80.0 60.0 40.0 20.0 0.0 Baker Clay Nassau St. Johns Florida All Races 83.8 87.4 89.1 88.2 84.1 White 84.7 88.4 90.2 90.3 86.5 Non-White 77.1 81.1 78.2 73.8 77.2 28 Other Birth Risk Factors Smoking during pregnancy can lead to complications and health problems in newborns. Smoking nearly doubles woman’s risk of having a low birthweight baby. In St. Johns County, nearly 13% of births occurred to mothers who smoked which exceeded the state’s percentage (Figure 38). With regard to race, more births occurred to white mothers who smoked. Figure 38 Births to Mothers Who Smoked During Pregnancy by Race, 2002-2004 25.0 20.0 15.0 10.0 5.0 0.0 Baker Clay Nassau St. Johns Florida All Races 19.5 14.1 18.8 12.9 8.6 White 21.2 15.5 19.8 13.4 10.2 Non-White 7.0 5.4 9.0 9.6 4.1 Note: Resident Live Births to Mothers Who Smoked During Pregnancy IV. SOCIAL AND MENTAL HEALTH Domestic Violence Domestic violence is a widespread social problem that affects families on all socio-economic and demographic levels. A high number of domestic violence offenses in a community can be used as an indicator to estimate the number of persons in a population who may potentially have serious mental illness conditions or substance abuse problems and are in need of mental health treatment programs. St. Johns County showed a slight increase in domestic violence from 20032004, as shown in Table 12. Table 12 Domestic Violence Offenses, 2004 Total Domestic Rate Per Total Violence % Change 100,000 Rate Change 2003-2004^ Population 2003-2004^ Area Population Offenses Baker 23,963 96 88.2% 400.6 83.7% Clay 163,461 865 -4.1% 529.2 -8.5% Nassau 65,016 418 28.2% 642.9 24.4% St. Johns 149,336 1,145 4.7% 766.7 -2.0% Florida 17,516,732 119,772 -0.8% 683.8 -3.3% Note:^ Percent changes in the number and should be interpreted with caution, due the fact that in small counties, a small increase in crime can produce a large percent change. Source: FDLE. Crime in Florida, Florida Uniform Crime Report, Florida Statistical Analysis Center, 2004 29 Suicide Suicide is a terrible potential outcome of mental illness and disorders such as panic, depression, and schizophrenia. St. Johns County showed a slight decrease in suicide rates between 19982004 (Figure 39). Suicides appear to disproportionately affect the white population in St. Johns County, with twice as many deaths in the white population (Figure 40). Figure 39 Suicide Death Rates, All Races, 1998-2004 30.0 25.0 20.0 15.0 10.0 5.0 0.0 Baker Clay Nassau St. Johns Florida 1998-2000 18.5 7.8 10.6 13.4 11.0 2000-2002 24.6 10.3 9.1 10.0 10.9 2002-2004 14.7 10.7 11.5 9.5 10.7 Figure 40 Suicide Death Rates by Race, 2002-2004 20.0 15.0 10.0 5.0 0.0 Baker Clay Nassau St. Johns Florida All Races 9.6 15.1 15.8 15.0 12.9 White 11.5 16.6 16.1 15.6 14.6 Non-White 0.0 0.0 13.9 7.3 4.5 30 Adolescent Substance Abuse Teen-age drinking and drug use is a growing concern in many counties throughout Florida, as well as the nation. In 2004, 4.4% of all arrests in St. Johns County from drug offenses were among juveniles with comparison to 9% statewide. According to the St. Johns County Sheriff’s office, there were no DUI or liquor law violations among St. Johns County youth during 2004. Table 13 summarizes the total arrests from drug and alcohol related offenses in St. Johns County and Florida for juveniles and adults. Table 13 Arrests by Offenses, 2004 Offenses St. Johns County Offenses Drug Arrests Driving Under Influence (DUI) Liquor Law Violations Florida Offenses Drug Arrests Driving Under Influence (DUI) Liquor Law Violations Juvenile Arrests Number Percent Total Arrested Adult Arrests Number Percent 500 295 20 22 0 0 4.4% 0 0 478 295 20 95.6% 100% 100% 150,334 55,805 35,692 14,134 480 1,419 9% 0.1% 4% 136,200 55,325 34,273 91% 99% 96% Source: Office of the Sheriff, Clay County, Annual Arrests Report, 2004 Florida Department of Law Enforcement, Crime in Florida, 2004 Florida Uniform Crime Report The Florida Youth Substance Abuse Survey (FYSAS) is an annual, statewide school-based survey effort that measures the prevalence of alcohol, tobacco and other drug use and delinquent behaviors as well as the risk and protective factors related to these behaviors. The 2004 FYSAS was administered to 1,113 St. Johns County students in grades 6 – 12 in the spring of 2004. Key findings revealed that alcohol was the most commonly used drug among St. Johns County students. The Executive Summary of this report is included as Appendix A-1. A full copy can be found at http://www.dcf.state.fl.us/mentalhealth/publications/fysas/county04/stjohns04.pdf V. BEHAVIORAL RISK FACTOR SURVEILLANCE SURVEY The Centers for Disease Control and Prevention began the Behavior Risk Factor Surveillance System Survey (BRFSS) in the early 1980’s in a handful of states and today, all states participate in the survey. BRFSS data have been widely used to monitor health behavior and health status at the state and national levels, however, due to small sample sizes, statewide BRFSS results cannot provide accurate and reliable data at the county level for public health program planning and evaluation. Therefore, with support from county health departments and other health agencies, the Florida Bureau of Epidemiology designed and implemented the county BRFSS to provide data on behavioral risk factors and chronic disease conditions for every one of Florida’s 67 counties. 31 The 2002 County Behavior Risk Factor Surveillance System Survey (BRFSS) was conducted in September 2002 through January 2003. Approximately 500 adults (age 18 and older) were randomly selected and interviewed in each county. The purpose of this telephone survey was to obtain county-level estimates of the prevalence of personal health behaviors that contribute to morbidity and mortality. Data obtained from the BRFSS county report can be used to make comparisons between counties and the state overall on a variety of health-related issues. Data can also be used to: (1) prioritize health issues and identify populations at highest risk for illness, disability, and death; (2) plan and evaluate prevention programs; (3) educate the community and policy makers about disease prevention; (4) support community policies that promote health and prevent disease. A summary of the 2002 County BRFSS is provided as Appendix A-2. St. Johns County is compared the state, as well as other surrounding counties in the area including Baker, Clay, and Nassau Counties. A full copy of the report can be found on the Bureau of Epidemiology’s website at http://www.doh.state.fl.us/disease_ctrl/epi/index.html. Some of the findings from St. Johns County revealed poor health behaviors among its residents. Nearly 34% of St. Johns County residents reported being overweight. In addition, 46% reported that they did not engage in any regular moderate exercise. Another 22% reported that they were current smokers and nearly 29% reported having high blood pressure. 32 ACCESS TO CARE/HEALTH CARE RESOURCES I. INTRODUCTION Access to health care is the key to achieving a healthy community and is a primary goal of health policy in Florida. This section will review health coverage of St. Johns County residents, health care providers practicing in the county, as well as review health care facilities and licensed health care services and other community resources in St. Johns County. II. HEALTH COVERAGE According to the 2004 Florida Health Insurance Study, St. Johns County had a total uninsured rate of 10.2%, a decrease from 12.9% in the 1999 Florida Health Insurance Study. A smaller area analysis from the 2004 Florida Health Insurance Study further explored the percentage of uninsured residents by specific zip codes of the county as summarized in Table 14. Table 14 Uninsured by Zip Code, 2004 Area/Zip Code Population in 2000 Estimated Uninsured Number Percent St Augustine 32084 15,774 1,714 32086 18,082 1,828 32092 5,661 566 32095 18,819 1,922 Other 32082: Ponte Vedra 23,365 2,322 32145: Hastings area 3,456 338 32033: Elkton 1,723 172 32059: “St. Johns” 16,708 1,885 Source: Florida Health Insurance Study 2004, Zip Code Estimates, August 2005 10.9% 10.1% 10.0% 10.2% 9.9% 9.8% 10.0% 11.3% A listing of health insurance coverage by major providers can be found in Table 15. These figures represent enrollments in Medicare, Medicare HMO, Medicaid, Medicaid HMO, and Commercial HMO insurance programs. Significant numbers of insured residents are not reported because commercial insurance enrollment figures are not available and the number of employees covered by self insurance is unknown. Table 15 Health Insurance Coverage, 2004 Percent of Population by Type of Health Coverage *Medicare Medicare HMO Medicaid Medicaid HMO Commercial HMO 2003 Area Population Enrollment % Enrollment % Enrollment % Enrollment % Enrollment % St. Johns 141,239 10,380 23,256 16.5 275 0.2 7.3 0 0 17,183 12.2 Florida 17,134,945 2,920,971 17.0 556,960 3.3 2,215,198 12.9 764,438 4.5 2,364,071 13.8 * Medicare Enrollment, Centers for Medicare & Medical Services (CMS) as of July 1, 2003 Source: Department of Insurance Quarterly HMO Enrollment Reports and AHCA Monthly Medicaid Enrollment Reports as of December 31, 2004 33 St. Johns County had a lower percentage of residents enrolled in Medicaid with comparison to the state. There are no residents enrolled in the Medicaid HMO and very few in the Medicare HMO. Commercial HMO enrollment was 12.2%, similar to the state’s enrollment at 13.8%. Florida’s Medicaid program serves over 2.1 million Floridians, with about half of those being children and adolescents under the age of 21. While children are the bulk of the beneficiaries, most of the costs arise from providing services to seniors, especially nursing home care, and people with disabilities who have significant medical costs. There are four categories of Medicaid eligibility for adults in Florida, which include low income families, pregnant women, emergency medical assistance for non-citizens, and Medicaid for the elderly and disabled. Eligibility for each of those programs is based on specific income criteria. The number of Medicaid enrollees in St. Johns County increased by nearly 24% during 20002004 while the number of enrollees in the state increased by 21.5% (Table 16). Table 16 Medicaid Enrollees, 2000-2004 2000 Area St. Johns Florida 7,668 1,734,389 Number of Medicaid Enrollees 2001 2002 2003 8,484 1,844,275 8,829 2,012,548 9,363 2,113,820 2004 9,494 2,106,951 2000-2004 % Change 23.8% 21.5% Source: Agency for Health Care Administration, July enrollment figures for 2000 – 2004. Federal government provisions for children’s health coverage include Medicaid and Title XXI of the Social Security Act. The states use Title XXI block grants to fund child health care coverage through an expansion of the Medicaid program, health insurance, or a combination of the two. In Florida, the KidCare Act of 1997 expanded Medicaid eligibility and the Healthy Kids Program, and initiated the MediKids program for children ages 0-5. The Healthy Kids program provides medical coverage for children ages 5 up to 19 in households whose income is between 100 – 200% of the federal poverty level (FPL). Children’s Medical Services covers children from birth through 18 who have special behavioral or physical health needs or chronic medical conditions. MediKids covers children age 1 –5 whose income is between 133-200% of the federal poverty level. Medicaid is the fourth KidCare program for children birth though 18 years and eligibility is based on the age of child and household income. Children less than age 1 are covered if the household income is below 200% of FPL, children ages 1-5 if household income is less than 133% of FPL, and children ages 6 up to 19 if household income is below 100% of FPL. KidCare enrollment figures for the four programs are provided in Table 17 34 Table 17 KidCare Enrollment, 2005 Area Healthy Kids 661 St. Johns 182,113 Florida Source: Healthy Kids, as of February, 2005 *AHCA as of January 2005 KidCare Program Enrollment CMS MediKids 35 44 7,690 16,926 *Medicaid 5,362 1,266,731 Nationally, Medicare beneficiaries make up 14% of the population. In Florida, the percentage of Medicare beneficiaries comprise 17% of the state’s population. Medicare provider coverage for people age 65 or older, some people under the age of 65 with disabilities, and people with EndStage Renal Disease. Table 18 summarizes Medicare enrollment by county for aged and disabled by hospital insurance (HI) and supplemental medical insurance (SMI). Table 18 Medicare County Enrollment and Aged and Disabled Enrollment, 2003 Aged Disabled Total Aged & Disabled HI HI &/or HI &/or &/or Area SMI HI SMI HI SMI SMI HI SMI SMI St. Johns 20,433 20,386 19,893 2,823 2,821 2,532 23,256 23,207 22,425 Florida 2,558,145 2,545,289 2,482,092 362,826 362,627 329,160 2,920,971 2,907,916 2,811,252 Source: Medicare Enrollment, Centers for Medicare & Medicaid Services (CMS) as of July 1, 2003 Aged and Disabled Enrollment, Centers for Medicare & Medical Services (CMS), as of March, 2004 III. PRIMARY CARE Primary care providers (PCP) give routine medical care for the diagnosis, treatment, and prevention of common medical conditions. Primary care is the entry point into the health care system for non-emergent services. PCPs refer patients requiring additional care to specialists for treatment. In this way, primary care providers serve as gatekeepers for the health care system and play an important role in the coordination of care in today's managed care environment. Family practitioners, internists, pediatric and general medicine physicians, obstetricians and gynecologists nurse midwives, physician assistants, and nurse practitioners are all considered primary care providers. Additionally, public health nurses and school nurses provide primary care services to designated populations. The Department of Health and Human Services (HHS) considers a primary care physician-topopulation ratio of 1:3,500 persons adequate for most communities. In areas where more than 20% of the population lives in poverty, the ratio is increased to 3,000 persons per primary care physician. HHS uses physician/population ratios to determine Health Professional Shortage Areas (HSPA) and eligibility for the development of federally funded primary care programs and placement of 35 National Health Service Corps personnel. Primary care HPSA designation is based on the described ratio, the availability of care in nearby areas, infant mortality, birth rates, and poverty level. The St Johns County Health Department and the low-income population of Western St. John’s County are the only two areas of St. Johns County that was given a primary care HPSA designation. IV. HEALTH CARE PROFESSIONALS There are 67 family practice, general practice and internal medicine physicians, 10 Obstetricians/gynecologist, and 22 pediatricians practicing in St. Johns County. Some of these primary care physicians also see patients in Duval County as well. Specialty physicians generally practice in the St. Augustine area at Flagler Hospital. A summary of primary care and specialty care providers is found at the beginning of “St. Johns County Health Resources” included as Appendix B. Other health care professionals, including dentists are also listed. V. HEALTH CARE FACILITIES Acute Care Acute care hospitals play a key role in the delivery of health care services in a community. In addition to providing traditional inpatient services, hospitals also provide extensive diagnostic and treatment services on an outpatient basis. Hospital Utilization Flagler Hospital, a 300 bed acute care facility, is the only hospital located in St. Johns County. The hospital offers comprehensive services, including obstetrics, surgery, rehabilitative services, transitional care, as well as numerous specialty care services. In addition, Flagler Hospital offers emergency room care, a Heart and Lung Center, Cardiac Rehabilitation Center, Oncology Center, free standing imaging center, a sleep laboratory and an outpatient surgery center. In February of 2005, Baptist Medical Center opened a 92 bed facility in Southern Duval County, near the border of St. Johns County. Many residents of Northern St. Johns County utilize Baptist Medical Center South for their health care needs. Baptist Medical Center South offers a vast array of services including emergency services, obstetrics, cardiology, oncology, radiology, surgery, and a sleep lab. Figure 41 shows the hospital utilization rates by St. Johns County residents in 2004. Of the 17,950 total inpatient discharges, nearly 60% of residents received inpatient care at Flagler Hospital. Another 11% received care at St. Luke’s and 6% at Baptist Medical Center-Beaches, both facilities located in Duval County. 36 Figure 41 Hospital Utilization of St. Johns County Residents, 2004 Memorial-Jax 3.2% St. Vincent's 2.7% BMC-Beaches 6.3% Shands-Jax 2.2% All Others 6.1% Baptist Medical Center 8.5% St Luke's 11.0% Flagler Hospital 59.8% Source: AHCA Hospital Discharge Data Files, 2004 Table 19 illustrates St. Johns County’s top ten hospital discharges by diagnostic related groups (DRGs) for adults. Normal deliveries lead the list, followed by psychoses and heart failure and shock related conditions. Table 19 Adult Discharges, St. Johns County Residents, 2004 Adult Top 10 DRG's (Adults age 18 and over) Vaginal Delivery W/O Complicating Diagnoses Heart Failure & Shock Chest Pain Psychoses Simple Pneumonia & Pleurisy With Complicating Conditions (CC) Major Joint & Limb Reattach Procedures of Lower Extremity Septicemia Age >17 Chronic Obstructive Pulmonary Disease (COPD) Cesarean Section W/0 CC Esophagitis, Gastroent & Mis Digestive Disorders With CC Total Top 10 DRG’s Source: AHCA Hospital Discharge Data Files, Calendar Year 2004 37 Total 923 540 538 509 475 459 409 389 341 336 4,919 % of Top 10 DRG's 18.8% 11.0% 10.9% 10.3% 9.7% 9.3% 8.3% 7.9% 6.9% 6.8% 100% Table 20 illustrates the leading pediatric discharges in St. Johns County. Normal newborns lead the list, accounting for nearly 68% of the top 10 discharges. Table 20 Pediatric Discharges, St. Johns County Residents, 2004 Pediatric Top 10 DRG's (Children age 0-17 years) Normal Newborn Neonate With Other Significant Problems Bronchitis & Asthma, 0-17 years Prematurity W/O Major Problems Full Term Neonate With Major Problems Psychoses Vaginal Delivery Without Complicating Diagnosis Simple Pneumonia & Pleurisy, Age 0-17 Esophagitis Gastrent & Misc Digest Disorders, Age 0-17 Prematurity With Major Problems Total Top 10 DRG’s % of Top 10 DRG's 67.9% 11.2% 3.8% 3.1% 3.1% 2.6% 2.4% 2.0% 2.0% 1.9% 100% Total 1,170 193 65 53 53 44 42 35 35 32 1,722 Source: AHCA Hospital Discharge Data Files , Calendar Year 2004 Emergency Room Care Local hospital emergency room utilization is a good indicator of the availability and accessibility of area health care services. Many appropriate visits to an emergency room do not result in hospital admissions. Figure 42 depicts the increase in the number of emergency room visits from Flagler Hospital. Between 1997-2004, Flagler Hospital experienced a 48% increase. Figure 42 Flagler Hospital ER Visits, 1997-2004 Number of ER Visits 60,000 50,000 40,000 32,457 34,747 36,443 38,446 41,365 43,185 45,581 2001 2002 2003 48,026 30,000 20,000 10,000 0 1997 1998 1999 2000 2004 Source: AHCA Discharge Hospital Data, Calendar Year 2004 Figure 43 illustrates total inpatient hospital admissions and the number of hospital inpatient admissions through the emergency room at Flagler Hospital from 1997-2004. The number of 38 total hospital inpatient admissions increased by 58% during this period of time. In 2004, over 60% of total hospital inpatient admissions came through the emergency department. Figure 43 Flagler Hospital Inpatient Hospital Admissions, 1997 – 2004 Number of Admissions 16,000 14,000 12,585 12,000 10,000 13,176 13,368 14,383 10,863 9,850 9,115 9,086 7,039 8,000 5,609 6,000 6,023 8,028 8,617 8,721 9,057 6,811 4,000 2,000 0 1997 1998 1999 Total Inpatient Admissions 2000 2001 2002 2003 2004 Total Inpatient Admissions through ER Source: AHCA Discharge Hospital Data, Calendar Year 2004 Long-Term Care Long-term care is defined as "those services designed to provide diagnostic, preventive, therapeutic, rehabilitative, supportive, and maintenance services for individuals who have chronic physical and/or mental impairments, in a variety of settings ranging from home to institutional settings, to ensure the quality of life." Long-term care includes nursing home care. Medicaid is the primary funding source of nursing home care, paying for 66% of all nursing home days. Medicaid typically pays for long-term care while Medicare provides funding for short-term care following hospital discharge. Many nursing homes limit the number of dedicated Medicaid beds in their facilities in order to control the number of low-reimbursing, long-term Medicaid patients admitted. Table 21 summarizes the number of nursing home beds and occupancy rates of the eight facilities in St. Johns County. Six of the eight nursing homes are located in St Augustine. Occupancy rates are rapidly approaching full capacity and no new beds will be approved until July 2006. 39 Table 21 Free Standing Community Nursing Homes, 2004 Licensed Beds 30 Total Census Days 2004 9,312 Total Census Days 2000 N/A Occupancy Rate 2004 84.8% Medicaid Rate 2004 0.0% Medicare Rate 2004 25.6% 62.1% 62.7% 18.0% 25.3% 53.9% 30.1% 72.6% 56.8% 0.0% 13.0% 16.4% 7.0% 44.6% 12.3% Facility Name *Glenmore Healthcare Moultrie Creek Nursing & Rehab Center 120 42,172 42,482 96.0% Ponce De Leon Care Center 120 41,046 41,356 93.5% Samantha R. Wilson Senior Citizens Home 120 41,857 41,479 95.3% St. Augustine Health & Rehab Center 120 41,907 37,011 95.4% St. Johns HealthCare Center 68 21,761 21,202 87.4% Vicar’s Landing Nursing Home 60 18,689 19,236 85.1% Westminster Woods on Julington Creek 60 19,975 18,802 95.7% Source: Health Planning Council of Northeast Florida, Calendar Year 2004 Note: Licensed 11/19/01 No Certificate of Need (CON) for additional nursing home beds shall be approved until 7-1-06 Assisted Living Facilities Assisted Living Facilities (ALFs) provide a residential setting where a group of older or disabled persons unable to live independently receive room, meals, and variety of personal supportive services. ALF fees vary greatly depending on the location, amenities, size of the units and services provided. Because neither Medicaid nor Medicare pays for ALF care, the vast majority of ALF residents use private funds to pay for their care. There are a total of 12 ALFs in St. Johns County, including 10 in St. Augustine (Barrington at Glenmoor, Buckingham Smith Assisted Living Facility, Coral Landing Assisted Living Residences, Grafton House, Loving Care Living Facility, Our Family & Friends, Park Place of St. Augustine, Pavilion at Bayview, Sefton Park Lodge, Stephens Memorial Home. There is one ALF in Ponte Vedra Beach (The Stratford) and one in the Julington Creek area (Westminster Woods on Julington Creek). VI. OTHER HEALTH CARE SERVICES Appendix B includes a list of health care services and agencies in St. Johns County, including home health agencies, EMS, ambulatory care centers, dialysis centers, and rehabilitative services. In addition, an inventory of mental health providers and services is also included at the end of Appendix B. 40 COMMUNITY COMMENTS I. FOCUS GROUPS Introduction In the Summer of 2005, the Health Planning Council of Northeast conducted six focus groups for the St. Johns County health needs assessment. The purpose of these focus groups was to better understand the views and opinions of St. Johns County residents about the quality of life in their community. This report will outline the focus group methodology, demographics of participants as well as a summary of key themes identified in the focus group discussions. Focus Group Methodology A set of questions was developed for the focus groups to explore how residents felt about the quality of life in St. Johns County. The focus group instrument was used in similar health needs assessments in surrounding counties. A copy of the focus group questions that were used are included as Appendix C1. Focus groups were scheduled by staff at the St. Johns County Health Department and Health Planning Council through the assistance of members from the St. Johns County Community Health Assessment Task Force. Efforts were made to target existing groups that were already meeting throughout the county. Six focus groups were conducted during July of 2005. The size of the focus groups ranged from 7 – 17 participants, with a total of 61 participants. A list of the focus group locations, as well as the number of participants in each group is summarized below: 1. 2. 3. 4. 5. 6. West St. Augustine Community Redevelopment Agency (CRA): 17 participants First Baptist Church of Armstrong (Elkton): 7 participants Council on Aging (St Augustine): 10 participants Mt. Moriah Missionary Baptist Church (Hastings): 10 participants Flagler Estates Community Redevelopment Agency: 9 participants Foster Parents (St. Augustine): 8 participants Focus groups were moderated by a staff member from the Health Planning Council and handwritten notes were taken during each of the groups to ensure that no comments were missed. Notes were carefully reviewed to explore participants’ comments and discover whether similar concerns and opinions were voiced by St. Johns County residents. A summary of common themes each of the focus groups discussions is included in this section. Demographics Over 60% of focus group participants were female and over 60% were non- white, providing excellent representation from the minority community in the focus group discussions. Approximately 38% of participants were age 40-54 and another 16% were age 65 and older, which matched the elderly population of St. Johns County. Nearly 50% of the participants worked full-time and over a third were retirees. 41 The majority of participants reported having health insurance through their job or member’s job or had Medicare. More detailed demographic information is included below. DEMOGRAPHICS OF FOCUS GROUP PARTICIPANTS Summary of Focus Group Discussions A summary of each of the six focus group discussions is provided below: ZIP CODE 32033 32080 32082 32084 32086 32145 Unknown Total Total Responses 8 2 2 23 4 21 1 61 Percent 13.1% 3.2% 3.2% 37.7% 6.6% 34.4% 1.6% 100% AGE GROUP Under 18 years old 18 – 25 26 – 39 40 – 54 55 – 64 65 – 74 75+ Total Total Responses 0 0 5 23 15 13 5 61 Percent 0 0 8.2% 37.7% 24.6% 21.3% 8.2% 100% GENDER Male Female Total Total Responses 24 37 61 Percent 39.3% 60.7% 100% RACE/ETHNICITY African American/Black Asian/Pacific Islander Caucasian/White Hispanic/Latino Native American Mixed Total EMPLOYMENT STATUS Working Full-Time Working Part-Time Student Unemployed Home Maker Retired Other Total Total Responses 34 0 24 1 1 1 61 Percent 55.7% 0% 39.3% 1.6% 1.6% 1.6% 100% Total Responses 29 3 0 0 2 23 4 61 42 Percent 47.5% 4.9% 0 0 3.2% 37.7% 6.6% 100% HOW IS HEALTH CARE COVERED: (check all that apply) Health insurance offered from your job or a family member’s job Health insurance you pay for on your own Medicare Medicaid Veteran’s Administration Military Coverage I don’t have health insurance Total Responses 33 6 21 6 4 3 6 Summary of Focus Group Discussions A). West St. Augustine Redevelopment Agency • • • • • • • There are plans to build a new multi-purpose community center Number of issues in this community (safety concerns, environmental health, crime, poverty) “Weed and Seed” community Lack of affordable day care Teenagers skipping school is a problem There are many residents in West St Aug who do not have health insurance, their voice is not heard Overall feeling of group that more services and resources need to be offered in West St Augustine Health Programs/Services Needed: • Mental health services • Prenatal education and counseling, especially for teen mothers • Dental services for the uninsured • Vision services • HIV prevention/education • Early testing for juvenile diabetes • Health education to prevent childhood obesity • Need a location to provide the above services/programs- new community center B). First Baptist Church of Armstrong (Elkton) • • • • • • Not enough activities for children Transportation is an issue for many families (children, elderly, and other residents who don’t drive or have their own vehicles) Church plays an important role in the community, but it can’t be everything to everyone (limited resources/space) Health care is not available for people without insurance or the working poor Health Dept does a great job offering health education and outreach to the Armstrong community Dental clinic at the elementary school is used by many families-residents greatly appreciate this service and its location Health services/programs needed: • Outpatient primary care clinic • More mobile health services – bring services to the people • Vision care • Sickle cell anemia education/awareness • Need a multi-purpose community center to offer variety of services • Offer more health screenings (diabetes, blood pressure, body fat, cholesterol)- screenings are very important in this community • Need to provide more mental health services and education for children, parents and/or caregivers • Increase health promotion/education in the schools 43 C). Council on Aging (St Augustine) • • • • • • Overall, group is satisfied with quality of life for the elderly Would like to see more interaction between the elderly and youth in the community COA van is very helpful for many elderly residents but transportation is still an issue, especially for elderly living in Hastings and Flagler Estates Need more affordable housing for elderly Concern that there is a growing number of sex offenders, worried about the safety of the children Prescriptions are very expensive. COA offers Drug Assistance Program which is very helpful though not everyone qualifies due to income requirements D). Mt. Moriah Missionary Baptist Church (Hastings) • • • • • • • • Overall, feel that Hastings is a neglected area of the county. Numerous health problems and health care access issues. Transportation is a problem for many residents Would like to see COA open a new site in Hastings (many elderly residents are not comfortable traveling to St Aug) Need for affordable, quality housing Crime is an ongoing issue (police need to be more visible) Medical Specialists in Hastings is used by many residents, but there is concern about funding changes Concern about vending machines in schools, students are not making healthy choices Health Services/Programs Needed: • Parenting skills class • Wellness class/nutrition class involving the whole family (parents and children together) • Pregnancy/prenatal classes; more teen prevention efforts • Dialysis center • Local pediatrician • Dental care for adults • Local pharmacy • Better water testing E). Flagler Estates Community Redevelopment Agency (Hastings) • • • • • • • • • Some residents feel the crime rate has improved over the last year, others do not see a difference Churches play an important role in the community Concern that there is not a Baker Act facility in the county Many residents go to Palatka for their health care needs Need more mobile health services Transportation to health services is a huge issue Adult dental care is another problem Asthma is an issue for many children in this community Good Samaritan Clinic- 6 month waiting list F). Foster Parents (St. Augustine): • • • • • • • • Concern that there nurses are not in all of the public schools Not enough affordable housing for the elderly Lack of public transportation in western and southern portions of the county Concern about safety of children (sexual predators, congested roads near bus stops, neighbors don’t know each other anymore) Many physicians will not accept Medicaid – growing issue. Access to dental services for adults is another problem; dental services for children are great Flagler Hospital ER very slow, waiting list to get into VA clinic Youth drug use and drinking is a growing problem 44 Health Services/Programs Needed: • Need more mental health services (6-8 week wait for appt). • Need more P.E. in the schools • Need to have more health services for the uninsured, especially dental care. II. COMMUNITY SURVEY Survey Design and Distribution The purpose of the survey was to capture the opinions and concerns from St. Johns County residents about the health of their community. Existing community surveys were reviewed that incorporated the MAPP Model (Mobilizing for Action through Planning and Partnerships). MAPP is a community-wide strategic planning tool for improving community health and assists communities prioritize public health issues and identify resources for addressing them. The St. Johns County Health Department selected a MAPP survey that was used by other local communities during previous needs assessments. The survey was then revised to specifically address the needs of St. Johns County. A copy of the survey instrument in included as Appendix C-2. Surveys were distributed throughout the county in June of 2005 and continued to be circulated through September. Surveys were collected at the county health department centers, local churches, Council on Aging sites, Flagler Hospital and Baptist Health-South, Chamber of Commerce, mental health and substance abuse agencies, public schools, and other groups and organizations in St. Johns County. In addition, an online version of the survey was advertised in on websites of numerous agencies and public libraries for those residents with Internet access. A total of 1,051 surveys were collected and analyzed. Demographics of Survey Respondents The majority of the respondents who completed the surveys were females. Nearly 30% of survey respondents were age between the ages of 26-39 and another 27% of respondents were between the ages of 40-54, which represent the largest age groups of St. Johns County. Approximately 15% of survey respondents were over the age of 65, which matches the county’s elderly population. Almost 25% of respondents were non-white, providing a good representation from the minority community. With regard to ethnicity, 3.6% of survey respondents were Hispanic, which closely matched the county’s Hispanic population of 4.3%. Geographically, there was a wide range of participants living throughout St. Johns County, including good representation from Hastings and St. Augustine. Approximately half of participants were employed full-time and 9.3% reported being unemployed, which exceed the county’s unemployment rate of 3.7%. Over 40% reported having a high school diploma or GED as their highest level of education completed and 18% reported having a 4 year college degree. Approximately 37% reported household incomes under $20,000. A detailed summary of information obtained from the demographic section of the survey is included in this report. Survey Analysis A total of 1,051 surveys were entered into an electronic database software program. Descriptive statistics were used to summarize the survey questions and data tables with frequencies and percentages are included in this section. A summary of all other written in comments by survey 45 respondents is included as Appendix C-3. The following section summarizes the top 5 selections for St. Johns County residents. 1. How do you rate your overall health? (check one selection) St. Johns County Excellent Good Fair Poor Don’t Know Total Not Available Total Responses 234 570 160 25 19 1,008 43 Percent 23.2% 56.5% 15.9% 2.5% 1.9% 100% 2. Check up to 5 selections you feel are the most important features of a healthy community: Top 5 Access to healthcare Clean and healthy environment Good education Low crime rates/safe neighborhoods Good jobs, healthy economy Total Responses 700 554 490 486 476 All other responses, based on the total number of responses for each category Category Good place to raise kids Affordable and/or available housing options Access to churches or other places of worship Access to parks and recreation Preventative health care (annual check-ups) Access to public transportation Affordable childcare Good place to grow old Absence of discrimination Access to social services Other Not Available Total Responses 437 380 375 239 219 200 172 172 162 153 21 12 3. Check up to 5 of the health problems that you feel are the most important in Clay County: Top 5 Addiction – alcohol or drug Cancers Heart disease and stroke Child abuse/neglect Smoking/tobacco use HIV/AIDS/STD’s Total Responses 454 370 326 295 282 282 All other responses, based on the total number of responses for each category Category Diabetes Mental health problems Adult obesity High blood pressure Domestic violence Childhood obesity Teenage pregnancy Total Responses 275 271 249 241 219 215 199 46 Other Responses (Cont’d) Dental problems Asthma Respiratory/lung disease (COPD, emphysema) End of life care (nursing homes, hospice) Contagious diseases (flu, pneumonia) Environmental health, sewers, septic tanks Rape/sexual assault Motor vehicle crash injuries Other Not Available Total Responses 192 164 164 150 146 125 109 25 25 23 4. Check up to 3 behaviors you are most concerned about in Clay County: Top 5 Category Drug abuse Alcohol abuse Being overweight Dropping out of school Tobacco use Total Responses 542 389 314 298 256 All other responses, based on the total number of responses for each category Category Teen sexual activity Unsafe sex Unlicensed and/or unsafe drivers Lack of exercise Poor eating habits Not using birth control Discrimination Not getting shots to prevent disease Other Skipped This Question Total Responses 252 239 234 224 162 114 112 109 19 20 5. What health care services are difficult to obtain in your community? Top 5 Category Dental/oral care Prescriptions/medications/medical supplies Mental health/counseling Primary care Specialty care Total Responses 427 255 241 198 197 All other responses, based on the total number of responses for each category Category Total Responses Emergency room care Vision care Substance abuse services-drug and alcohol Alternative therapy (herbals, acupuncture) Preventative care (annual check-ups) Family planning/birth control Lab work Inpatient hospital X-rays/mammograms Physical therapy, rehab therapy Other None of the above 193 189 182 170 160 97 96 90 89 87 59 187 47 6. How do you rate the quality of health services in St. Johns County? St. Johns County Excellent Good Fair Poor Don’t Know Total Not Available Total Responses 84 466 351 67 56 1,024 27 Percent 8.2% 45.4% 34.3% 6.5% 5.5% 100% 7. What do feel are barriers for you in getting healthcare? Top 5 Barriers Can’t pay for doctor/hospital visits Long wait for appointments Lack of evening and week-end services Don’t know what types of services are available Can’t find providers that accept my insurance Have no regular source of healthcare Lack of transportation None of these apply – I don’t have any barriers Other Total Responses 359 352 298 180 179 169 129 262 39 8. When you need to use prescription medications for an illness, do you (check all that apply) Category Have your prescription filled at the drugstore or supermarket Buy over-the-counter medicine instead Go without medicine Got to the hospital emergency room Use leftover medication prescribed for a different illness Use medication of friends or family Use herbal remedies instead Get medications from sources outside the country Not Available Total Responses 837 187 183 123 93 77 71 39 36 9. How is your health care covered? (check all that apply) Category Health insurance offered from your job or a family member’s job Medicaid I don’t have health insurance Medicare Health insurance that you pay for on your own Military coverage/VA Other Not Available 48 Total Responses 443 208 195 182 126 71 17 20 10. Where would you go if you are sick? (check one) Categories Total Responses 573 191 85 75 44 31 30 1,029 22 Your doctor’s office Hospital emergency room in St. Johns County Local health department Flagler Hospital Primary Care No where – I don’t have a place to go when I get sick Other Hospital ER outside St. Johns Total Not Available Percent 55.7% 18.68. 8.3% 7.3% 4.3% 3% 2.9% 100% 11. Where would you go if your children/dependents are sick? (check one) Total Responses 405 187 167 150 38 32 13 12 1,004 47 Categories Their doctor’s office Don’t have children/dependents Local Health Department Hospital emergency room in St. Johns County Flagler Hospital Primary Care Hospital emergency room outside St. Johns County Other No where – we don’t have a place to go when we get sick Total Not Available Percent (%) 40.3% 18.6% 16.6% 14.9% 3.8% 3.2% 1.3% 1.2% 100% DEMOGRAPHICS Area of County St Augustine 32080 32084 32085 32086 32092 32095 SubTotal Southwestern St. Johns 32145 32033 Sub-Total Northern St. Johns 32259 32082 Sub-Total Total Responses Percent 131 290 12 208 75 46 762 13.2% 29.2% 1.2% 20.9% 7.6% 4.6% 76.7% 111 58 169 11.2% 5.8% 17% 33 29 62 3.3% 2.9% 6.2% Total Not Available 993 58 100% 49 AGE GROUPS 18-25 26-39 40-54 55-64 65-74 75+ Total Respondents Not Available Total Responses 162 300 273 134 81 75 1,025 26 Percent 15.8% 29.3% 26.6% 13.1% 7.9% 7.3% 100% GENDER Female Male Total Respondents Not Available Total Responses 228 751 979 72 Percent 23.2% 76.7% 100% RACE/ETHNICITY Black/African American Hispanic Native American White/Caucasian Asian/Pacific Other Total Not Available Total Responses 186 37 17 774 7 4 1,025 26 Percent 18.1% 3.6% 1.7% 75.5% 0.7% 0.4% 100% EDUCATION Elementary/Middle School High School Diploma or GED Technical/Community College 4 Year College/Bachelor’s Degree Graduate/Advanced Degree Total Respondents Not Available Total Responses 61 410 235 185 122 1,013 38 Percent 6% 40.5% 23.2% 18.3% 12% 100% EMPLOYMENT STATUS Employed Full-Time Retired Employed Part-Time Unemployed Retired Home Maker Student Other Total Respondents Not Available Total Responses 511 160 101 96 84 47 18 18 1,035 16 Percent 49.4% 15.5% 9.8% 9.3% 8.1% 4.5% 1.7% 1.7% 100% 50 HOUSEHOLD INCOME Less Than $10,000 $10,000 - $19,999 $20,000 - $29,999 $30,000 - $49,999 $50,000 - $74,999 $75,000 - $99,000 $100,000 or more Total Respondents Not Available Total Responses 157 200 175 189 106 72 61 960 91 Percent 16.4% 20.8% 18.2% 19.7% 11% 7.5% 6.4% 100% Survey Results by Select Zip Codes In effort to look more closely at survey responses by region of the county, an analysis was done on select zip codes of the county, including the Hastings area (32145) and lower-income area of St. Augustine (32086 and 32095). The top choices for survey response as ranked by residents of these zip codes is included as Appendix C-4. 51 52 KEY ISSUES AND RECOMMENDATIONS I. INTRODUCTION Members of the St. Johns County Health Assessment Task Force reviewed the information presented during the six month needs assessment process and identified key issues and recommendations. Information that was reviewed by the task force included an analysis of the demographics, health statistics and access to care indicators for county residents. In particular, they examined key death and disease rates, maternal and child health indicators, hospital utilization data and behavioral risk factor survey data. Community input in the form of focus groups and a community wide survey were also examined by the task force. II. KEY ISSUES/RECOMMENDATIONS Key findings included age adjusted death rate data showed that St. Johns County has high rates in Chronic Obstructive Pulmonary Disease (COPD) for the general population and high death rates in Influenza and Pneumonia, and unintentional injuries/motor vehicle accidents and infant mortality in the nonwhite population. The Behavior Risk Factor Surveillance Survey showed that St. Johns County had a higher percentage of the population who smoked and drank alcohol than the state average. The high drinking rate may have an impact on domestic violence, motor vehicle accidents and other unintentional injuries. Key findings from the focus groups include access issues to mental health services and dental care as well as transportation for those living outside of St. Augustine. Cost of prescriptions and medical services were also an issue for those without insurance coverage. Task Force members then prioritized these issues and developed recommendations and action steps. Many of these recommendations can be implemented in partnership with existing community groups such as the Health and Human Services Advisory Board and the PACT Prevention Coalition. Recommendation 1: Expand adult oral health care services and resources to more residents of St. Johns County. Activity Steps 1) Determine what dental insurance options are available and acceptable to local dentists and inform community about these options. 2) Implement social marketing campaign targeting dental education and promotion of preventative dental care. 3) Expand volunteer dental program (retired dentists and other retired dental care professionals) or donated services at local dentist offices. 4) Explore funding opportunities for adult dental care through grants and other sources. a) Consider making oral health care a priority area for the Health and Human Services Advisory Board (HHSAB). 53 Referred to: Dental Society and St. Johns County Health Dept. (SJCHD) for steps # 1,2,&3 HHSAB Recommendation 2: Focus efforts on substance abuse prevention and education for alcohol, tobacco and other drugs. Activity Steps 1) Provide prevention education and awareness for adolescent substance abuse. 2) Explore effective smoking cessation programs that include patches, medications, and other aides that are affordable and will promote long-term success. 3) Partner with schools, law enforcement, businesses, and parents to promote stricter enforcement of liquor and tobacco sales to minors as well as enforcing smoke-free environment on school grounds. 4) Expand mental health services to cover full spectrum of services, from prevention through after-care programs. Referred to: PACT, HHSAB Flagler Hospital, Cancer Society PACT, HHSAB HHSAB Recommendation 3: Improve access to health services in outlying areas of St. Johns County through coordination of public transportation. Activity Steps 1) Improve advertising and marketing of transportation options to the public, including Council on Aging Services. a) Explore the need to change current bus routes/schedules. b) Explore the use of cab vouchers. 2) Identify county commissioner’s priorities for: a) Multi-county, cross county transportation b) Transportation for the disadvantaged 3) Explore funding sources for dental/medical mobile health units to provide health care in rural areas of the county. Possible partners include Flagler Hospital, St. Vincent’s, St. Johns County Health Department, Medical Society and/or Dental Society. 4) Explore the use of the old Hastings elementary school as a health and social service center. 54 Referred to: Transportation Task Force Transportation Task Force Major health providers & civic organizations County Govt, Patient Centered Health Network EXECUTIVE SUMMARY T he Florida Legislature’s 1999 Drug Control Summit recommended the establishment of an annual, multi-agencydirected, statewide school-based survey effort, combining several survey instruments, with specific variations in odd and even years. The Florida Youth Substance Abuse Survey (FYSAS), one of these instruments and the focus of this report, is administered to a county-level sample of students in even years, and a smaller statewide sample in odd years. The FYSAS is based on the Communities That Care® Youth Survey, developed from the nationally recognized work of Dr. J. David Hawkins and Dr. Richard F. Catalano. It not only measures the prevalence of alcohol, tobacco and other drug use and delinquent behavior, but also measures the risk and protective factors related to these behaviors. The 2004 FYSAS was administered to 1,113 St. Johns County students in grades 6 through 12 in the spring of 2004. The results supply a valuable source of information to help reduce and prevent the use of alcohol, tobacco and other drugs by school-aged youth. Key Survey Results Strengths to Build on • Marijuana use has declined in St. Johns County. Overall lifetime marijuana use has gone from 34.9% in 2000 to 27.3% in 2004. Overall past-30-day marijuana use has gone from 19.4% in 2000 to 15.3% in 2004. • Surveyed students reported a substantial reduction in past-30-day cigarette use. The rate dropped from 23.2% in 2000 to 13.3% in 2004. • Past-30-day prevalence rates for Ecstasy (1.0%), Rohypnol (0.4%), GHB (0.8%), ketamine (0.1%), methamphetamine (0.6%), crack cocaine (0.7%), heroin (0.4%) and steroids (1.0%) are all 1.0% or less. • Relatively few students reported that they would be seen as “cool” by their peers if they drank alcohol regularly (12.0%), smoked cigarettes (4.9%) or smoked marijuana (11.3%). • A substantial proportion of students indicated that it would be “wrong” or “very wrong” for someone their age to smoke cigarettes (74.8%), smoke marijuana (76.4%) or use other illicit drugs (93.9%). • A majority of respondents reported that each of the following behaviors poses a “great risk” of harm: smoking a pack or more of cigarettes per day (70.6%) and regular use of marijuana (62.4%). • Students reported particularly low percentile scores for two risk factor scales that are directly associated with alcohol, tobacco and other drug use: Perceived Availability of Drugs and Handguns (39) and Low Perceived Risks of Drug Use (38). • Prevalence rates for Carrying a Handgun (3.6%), Attempting to Steal a Vehicle (3.4%) and Taking a Handgun to School (1.1%) are all less than 5.0%. Opportunities for Improvement • With overall prevalence rates of 60.6% for lifetime use and 36.2% for past-30-day use, alcohol is the most commonly used drug among St. Johns County students. 2004 Florida Youth Substance Abuse Survey - St. Johns County Report • Binge drinking (defined as the consumption of five or more drinks in a row within the last two weeks) is more prevalent than past-30-day tobacco, marijuana and other illicit drug use. • After alcohol, students reported cigarettes (36.4% lifetime and 13.3% past-30-day) and marijuana (27.3% lifetime and 15.3% past-30-day) as the most commonly used drugs. Prevalence rates for other drugs are substantially lower. • More than one student out of every 10 reported lifetime use of depressants (10.1% lifetime and 4.2% past-30day) or other prescription pain relievers (10.4% lifetime and 4.4% past-30-day). • St. Johns County students reported one of their highest percentile scores for the community risk factor scale Personal Transitions and Mobility (66). This means that students are less likely to become involved with prosocial organizations and positive role models in their communities. • St. Johns County students reported some of their lowest percentile scores for two reward-based protective factor scales: School Rewards for Prosocial Involvement (42) and Community Rewards for Prosocial Involvement (48). This means that schools and communities need to provide additional positive feedback to students, to help them form prosocial bonds in their schools and communities. • Of surveyed St. Johns County students, 15.5% reported Getting Suspended, 12.8% reported Attacking Someone with Intent to Harm and 15.0% reported Being Drunk or High at School. These key findings illustrate the complexity of drug use and antisocial behavior among St. Johns County’s youth and the possible factors that may contribute to these activities. While some of the findings compare favorably to the national findings, St. Johns County youth are still reporting drug use and delinquent behavior that will negatively affect their lives and our society. The FYSAS data will enable St. Johns County’s planners to learn which risk and protective factors to target for their prevention, intervention and treatment programs. 2004 Florida Youth Substance Abuse Survey - St. Johns County Report APPENDIX A-2 Summary Report from 2002 County Behavior Risk Factor Surveillance System Survey Bureau of Epidemiology, Florida Department of Health The 2002 County Behavior Risk Factor Surveillance System Survey (BRFSS) was conducted in September 2002 through January 2003. Approximately 500 adults were randomly selected and interviewed in each county. The purpose of this telephone survey was to obtain county-level estimates of the prevalence of personal health behaviors that contribute to morbidity and mortality. These estimates might differ slightly from estimates obtained through the 2002 Florida State BRFSS because sampling methods of the two surveys were different. Data in this report can be used to make comparisons between counties and the state overall on a variety of health-related issues. These data can also be used to: (1) prioritize health issues and identify populations at highest risk for illness, disability, and death; (2) plan and evaluate prevention programs; (3) educate the community and policy makers about disease prevention; (4) support community policies that promote health and prevent disease. Area Baker Clay Nassau St. Johns Florida Area Baker Clay Nassau St. Johns Florida (1) Population 22,259 140,814 57,663 123,135 15,982 Population Size and Health Status Number of adults surveyed Health Status is Fair or Poor 503 24.0% 507 16.0% 503 18.4% 507 12.9% 34,551 16.7% No leisure time physical activity 34.5% 26.1% 25.2% 18.0% 26.4% Risk Factor: Physical Activity No regular moderate No regular vigorous physical activity (1) physical activity (2) 60.9% 81.9% 52.3% 72.4% 54.9% 79.0% 46.6% 71.4% 55.1% 75.6% People who do not engage in regular moderate physical activity (at least 30 minutes a day and 5 days a week) or regular vigorous physical activity (at least 20 minutes a day and 3 days a week). (2) People who do not engage in regular vigorous physical activity (at least 20 minutes a day and 3 days a week). Area Baker Clay Nassau St. Johns Florida (3) Overweight 30.8% 35.1% 37.7% 33.9% 35.1% (3) Risk Factor: Overweight and Nutrition Obese (4) Less than 5-A-Day (5) 25.5% 82.0% 25.8% 72.0% 26.9% 76.6% 16.4% 70.9% 22.3% 74.3% People with a Body Mass Index (BMI) between 25 and 30. People with a Body Mass Index (BMI) equal to or greater than 30. (5) People who consume less than 5 servings of fruits and vegetables a day. (4) APPENDIX A-2 Area Baker Clay Nassau St. Johns Florida (6) Risk Factor: Tobacco and Alcohol Use Current Smoker (6) Ever quit smoking in Engage in heavy or binge the past 12 months drinking (7) 29.2% 51.9% 13.4% 23.2% 50.5% 14.7% 19.5% 57.0% 12.7% 22.2% 45.1% 22.3% 17.6% 55.3% 16.4% People who have smoked at least 100 cigarettes in their lifetimes and who also smoked some days or every day in the past month. (7) People who have consumed 5+ drinks at one occasion in the past month (binge drinker) or men who have 2+ drinks every day or women who have 1+ drinks every day (heavy drinker). Area Baker Clay Nassau St. Johns Florida Area bAKER Clay Nassau St. Johns Florida Area Baker Clay Nassau St. Johns Florida Risk Factor: Health Care Coverage and Access No health care No personal health Unable to get medical coverage care provider care in past 12 months 20.5% 18.7% 8.2% 11.9% 18.4% 5.5% 18.1% 18.6% 8.2% 17.9% 18.5% 6.9% 18.7% 23.9% 8.7% Visit a dentist within past year 60.2% 67.2% 74.2% 75.8% 70.2% Oral Health No teeth removed 39.6% 56.1% 46.0% 54.3% 46.7% Had teeth cleaned within past year 60.7% 67.0% 67.0% 73.8% 70.5% Chronic Health Conditions: Hypertension and Weight Control Had high blood Now taking HBP Received advice about pressure (HBP) medication, if had weight in past year HBP 31.7% 78.3% 16.4% 25.4% 76.0% 20.9% 29.4% 65.9% 21.1% 28.7% 75.5% 15.9% 27.7% 76.0% 21.1% APPENDIX A-2 Area Baker Clay Nassau St. Johns Florida Area Baker Clay Nassau St. Johns Florida Area Baker Clay Nassau St. Johns Florida Area Baker Clay Nassau St. Johns Florida Chronic Health Conditions: High Cholesterol Ever had blood If yes, cholesterol Blood cholesterol is high cholesterol checked checked in past 2 years 79.4% 91.8% 34.3% 84.6% 90.0% 32.3% 84.6% 92.2% 39.2% 86.1% 88.2% 30.0% 83.1% 91.8% 35.2% Chronic Health Conditions: Asthma & Diabetes Ever had asthma If yes, still have Have diabetes asthma 13.6% 73.7% 15.4% 12.8% 73.1% 6.0% 13.8% 81.4% 7.4% 9.2% 69.8% 7.8% 10.7% 60.4% 8.2% Chronic Health Cardiovascular Disease Prevention Being advised by a health professional to… Eat fewer higher fat Eat more fruits and Be more physically active or cholesterol food vegetables 23.0% 30.3% 26.9% 20.8% 21.3% 25.8% 20.6% 26.2% 29.9% 17.2 22.7% 21.5% 21.0% 27.9% 28.0% Preventive Health Behaviors: Annual Flu and One-Time Pneumonia Shot Received flu shot Received flu shot at Ever had a pneumonia within past 12 county health dept shot months 22.4% 4.4% 20.4% 26.0% 1.1% 18.8% 23.7% 1.5% 18.6% 28.6% 2.2% 24.1% 26.2% 1.2% 22.7% APPENDIX A-2 Area Baker Clay Nassau St. Johns Florida Area Baker Clay Nassau St. Johns Florida Area Baker Clay Nassau St. Johns Florida Preventive Health Behaviors: Mammograms & Pap Smear Tests For women age 40+: All adult Women: All Adult Women: Had mammogram Ever had Pap smear Had Pap smear test in in past 2 years test past 2 years 68.0% 97.2% 77.9% 84.0% 97.6% 87.7% 75.3% 97.0% 82.0% 89.5% 98.6% 89.4% 79.0% 93.5% 82.2% Preventive Health Behaviors: Colorectal Screening For respondents 50 years and older… Ever had blood stool Had blood stool test in Ever had sigmoidoscopy test past 2 years 45.0% 38.1% 60.4% 36.8% 25.4% 52.2% 44.3% 32.9% 51.8% 50% 36.5% 64.8% 44.4% 33.5% 52.6% Preventive Health Behaviors: HIV/AIDS Tests For respondents 64 years and younger… Ever been If yes, the test was In the past 12 months, health tested for HIV done in the past 2 professional talked to you about years preventing sexually transmitted diseases through condom use. 49.8% 66.9% 14.9% 45.0% 59.5% 8.1% 42.4% 51.0% 12.3% 45.5% 53.9% 7.3% 47.7% 65.6% 16.3% APPENDIX B ST JOHNS COUNTY HEALTH RESOURCES SPECIALISTS Last Mas First Juan Title MD Address St Augustine Area of Specialty Allergy/Immunology Hospital Affiliation Flagler Hosp Baker George Goel Greene Kelsey Matthews Platko Saikaly Signor Sikaria Tutar Muehrcke Howard Ferris Mukesh Trevor Robert Laurence Willim B.S. Robert Krishna Ali Derek MD MD MD MD MD MD MD MD MD MD MD MD St Augustine St Augustine St Augustine St Augustine St Augustine St Augustine St Augustine St Augustine St Augustine St Augustine St Augustine St Augustine Cardiology Cardiology Cardiology Cardiology Cardiology Cardiology Cardiology Cardiology Cardiology Cardiology Cardiology Cardiothoracic Surgery Flagler Hosp Flagler Hosp Flagler Hosp Flagler Hosp Flagler Hosp Flagler Hosp Flagler Hosp Flagler Hosp Flagler Hosp Flagler Hosp Flagler Hosp Flagler Hosp Cheiken Gross Paley Rabey Schiavone Robins Shvartzman Towne David David Bruce Craig Frank Douglas Leonard Laura MD MD MD MD MD MD MD MD St Augustine St Augustine St Augustine St Augustine St Augustine St Augustine St Augustine St Augustine Dermatology Dermatology Dermatology Dermatology Dermatology Dermatology Dermatology Dermatology Other Flagler Hosp Flagler Hosp Other Other Other Other Other Oesterle Shrestha Robert Anil MD MD St Augustine St Augustine Endocrine Endocrine Flagler Hosp Flagler Hosp Mehrotra Pineau Rosado Soroka Villanueva Badri Ben Santiago Stuart Steven MD MD MD MD MD St Augustine St Augustine St Augustine St Augustine St Augustine GI GI GI GI GI Flagler Hosp Flagler Hosp Flagler Hosp Flagler Hosp Flagler Hosp Amshel Eyyunni Gonzalez Kluger Craig Ram Leopoldo Warren MD MD MD MD St Augustine St Augustine St Augustine St Augustine General Surgery General Surgery General Surgery General Surgery Flagler Hospital Flagler Hospital Flagler Hospital Flagler Hospital APPENDIX B Last Kuntz Sadowski Tessler First Luiz George Michael Title MD MD MD Address St Augustine St Augustine St Augustine Area of Specialty General Surgery General Surgery General Surgery Hospital Affiliation Flagler Hospital Flagler Hospital Flagler Hospital Justice Montgomery Qunitero Streeter Warmuth Keith Daniele Ricardo Ruth Marc MD MD MD MD MD St Augustine St Augustine St Augustine St Augustine St Augustine Hematology/Oncology Hematology/Oncology Hematology/Oncology Hematology/Oncology Hematology/Oncology Flagler Hospital Flagler Hospital Flagler Hospital Flagler Hospital Flagler Hospital Ali Manikal Syed Vivek MD MD St Augustine St Augustine Infectious Disease Infectious Disease Flagler Hospital Flagler Hospital Caputo Jayachandra Malik Mandal Torres Richard Paul Amir Anil Carlos MD MD MD MD MD St Augustine St Augustine St Augustine St Augustine St Augustine Nephrology Nephrology Nephrology Nephrology Nephrology Flagler Hospital Flagler Hospital Flagler Hospital Flagler Hospital Flagler Hospital Das Deshmukh Gerling Perumal Machado Amit Vinod Gerard Amudha Miguel MD MD MD MD MD St Augustine St Augustine St Augustine St Augustine St Augustine Neurology Neurology Neurology Neurology Neurosurgery Flagler Hospital Flagler Hospital Flagler Hospital Flagler Hospital Flagler Hospital Hale Hossain Hund McLeod Okatavec Staman Thompson Vassallo Winkler Patrick TS Paul Elizabeth William John Todd John Donald MD MD MD MD MD MD MD MD MD St Augustine St Augustine St Augustine St Augustine St Augustine St Augustine St Augustine St Augustine St Augustine Opthalmology Opthalmology Opthalmology Opthalmology Opthalmology Opthalmology Opthalmology Opthalmology Opthalmology Flagler Hospital Flagler Hospital Flagler Hospital Flagler Hospital Flagler Hospital Other Flagler Hospital Flagler Hospital Flagler Hospital Johnson Wells Douglas Marvin DMD DMD St Augustine St Augustine Oral and Maxillofacial Surgery Oral and Maxillofacial Surgery Flagler Hospital Flagler Hospital Charles Dew Michael Douglas MD MD St Augustine St Augustine Orthopedic Surgery Orthopedic Surgery Flagler Hospital Flagler Hospital APPENDIX B Last Girouard Grimes Haycook Hort Machado Northrup Risch Stanescu Volk Bishai First Allain James Brian Kurtis Miguel Tod David Stefan Albert S Title MD MD MD MD MD MD MD MD MD MD Address St Augustine St Augustine St Augustine St Augustine St Augustine St Augustine St Augustine St Augustine St Augustine St Augustine Area of Specialty Orthopedic/Spine Surgery Orthopedic Surgery Orthopedic/Spine Surgery Orthopedic Surgery Orthopedic/Spine Surgery Orthopedic Surgery Orthopedic Surgery Orthopedic Surgery Orthopedic Surgery Othopedic-not surgery Hospital Affiliation Flagler Hospital Flagler Hospital Flagler Hospital Flagler Hospital Flagler Hospital Flagler Hospital Flagler Hospital Flagler Hospital Flagler Hospital Other Depasquale Eyyunni Leake Taliaferro Witten Kalpana Uma Deirdre Cort Bruce DO MD MD MD MD St Augustine St Augustine St Augustine St Augustine St Augustine Otolaryngology Otolaryngology Otolaryngology Otolaryngology Otolaryngology Flagler Hospital Other Flagler Hospital Flagler Hospital Flagler Hospital Deshmukh Dieguez Monzon Patel Stanescu Sunanda Edward Raul Jyoti Elana MD MD MD MD MD St Augustine St Augustine St Augustine St Augustine St Augustine Pain Management Pain Management Pain Management Pain Management Pain Management Flagler Hospital Flagler Hospital Flagler Hospital Flagler Hospital Flagler Hospital McGuire Smith Rumsey Burk Scioscia Snyder James Gregory Cayce Robert Paul Brett MD MD MD MD MD MD St Augustine PVB PVB PVB PVB PVB Plastic/Reconstruc Surgery Plastic Surgeon Plastic Surgeon Plastic Surgeon Plastic Surgeon Plastic Surgeon Flagler Hospital Other Other Other Other Other Camp Concha Cutler Efron Johnson Lagoutaris Matey Miles Militello Pearce Victoria Jose Brett Barry Richard Stratis Mark Dawn James Beth DPM DPM DPM DPM DPM DPM DPM DPM DPM DPM St Augustine St Augustine St Augustine St Augustine St Augustine PVB St Augustine St Augustine St Augustine St Augustine Podiatry Podiatry Podiatry Podiatry Podiatry Podiatry Podiatry Podiatry Podiatry Podiatry Flagler Hospital Flagler Hospital Other Flagler Hospital Flagler Hospital Other Flagler Hospital Flagler Hospital Flagler Hospital Flagler Hospital APPENDIX B Last Pereira Rodriguez Sheets Simonson Weed First Ryan Rosana Holly David Jerry Title DPM DPM DPM DPM DPM Address St Augustine St Augustine St Augustine St Augustine St Augustine Area of Specialty Podiatry Podiatry Podiatry Podiatry Podiatry Hospital Affiliation Flagler Hospital Flagler Hospital Flagler Hospital Other Flagler Hospital Husain Josephkutty Kubiet Prakash Kishwar Sebastian Martin Manoj MD MD MD MD St Augustine St Augustine St Augustine St Augustine Pulmonology Pulmonology Pulmonology Pulmonology Flagler Hospital Flagler Hospital Flagler Hospital Flagler Hospital Graham Kuruvilla Paryani Scott Simmons Thompson David Anand Shyam Walter Dwelvin Spencer MD MD MD MD MD MD St Augustine St Augustine St Augustine St Augustine St Augustine St Augustine Radiation Therapy Radiation Therapy Radiation Therapy Radiation Therapy Radiation Therapy Radiation Therapy Flagler Hospital Flagler Hospital Flagler Hospital Flagler Hospital Flagler Hospital Flagler Hospital Epstein Lin Scarpitti Howard Wen Edward MD MD MD St Augustine St Augustine St Augustine Urology Urology Urology Flagler Hospital Flagler Hospital Flagler Hospital Kluger Kuntz Warren Luiz MD MD St Augustine St Augustine Vascular/Thoracic Surgery Vascular/Thoracic Surgery Flagler Hospital Flagler Hospital Dehgan Olazar Robert Cecilia MD MD St Augustine PVB Sports Medicine Arthritis Clinic Other Other Melchor Todd Michael Linda James Thomas MD MD MD MD DO MD DO MD DM MD St Augustine St Augustine PVB St Augustine St Augustine St Augustine SJCHD St Augustine PVB St Augustine Family Practice Family Practice Family Practice Family Practice Family Practice Family Practice Family Practice Family Practice Family Practice Family Practice Flagler Hospital Flagler Hospital Other Flagler Hospital Flagler Hospital Mayo SJCHD Flagler Hospital Baptist Flagler Hospital PRIMARY CARE Barros Batenhorst Brian Clonch Connor Davlantes Dobbertien Dolgin Drew Feaster Frederick James Lina APPENDIX B Last Fischer Grimard Gunn Hinman Krueger Kudia Larson McBrayer McCaulie Sanders Swanson Whitlock Zub Tomlin First Gary Brian Andrew Roy Lothar Ashfaq Jan Roy John Michael Donald Warren Christopher Thomas Title MD DO MD MD MD MD MD MD MD MD DO MD DO MD Address St Augustine St Augustine St Augustine St Augustine St Augustine St Augustine St Augustine St Augustine PVB St Augustine St Augustine St Augustine St Augustine PVB Area of Specialty Family Practice Family Practice Family Practice Family Practice Family Practice Family Practice Family Practice Family Practice Family Practice Family Practice Family Practice Family Practice Family Practice Family Practice Hospital Affiliation Flagler Hospital Mayo Flagler Hospital Flagler Hospital Flagler Hospital Flagler Hospital Mayo Mayo Baptist Flagler Hospital Other Flagler Hospital Flagler Hospital Other Tessler Ybanez Freedman Budd Lowney Eyerly Michael Sofia Donald Gerard Maria MD MD MD MD DO MD St Augustine St Augustine St Augustine PVB PVB SJCHD General Practice General Practice General Practice General Practice General Practice General Practice Flagler Hospital Flagler Hospital Other Walk In Medical Care Walk In Medical Care SJCHD Ali Barakat Bhide Borbely Caputo Carmaes De Lamerens Dobies Farhat Frady Gibson Harris Huang Husain Husain Jayachandra Josephkyutty Kubiet Syed Mirna Vandana Bernard Richard Ernest Goar Barry Jawad Walter Gregg Jean Qixi Kishwar Shakiraa Paul Sebastian Martin MD MD MD MD MD MD MD MD MD MD MD MD MD MD MD MD MD MD St Augustine St Augustine St Augustine St Augustine St Augustine St Augustine St Augustine St Augustine St Augustine St Augustine St Augustine St Augustine St Augustine St Augustine St Augustine St Augustine St Augustine St Augustine IM IM/Rheum Internal Medicine/Pediatrics Internal Medicine/Pulmonology IM IM IM IM IM IM IM IM IM IM IM IM Internal Medicine/Pulmonology IM Flagler Hospital Other Flagler Hospital Flagler Hospital Flagler Hospital Flagler Hospital Flagler Hospital Flagler Hospital Flagler Hospital Flagler Hospital Flagler Hospital Flagler Hospital Flagler Hospital Flagler Hospital Flagler Hospital Flagler Hospital Flagler Hospital Flagler Hospital APPENDIX B Last Lim Long Malik Mandal Manikal Martinez Marathe Mehrotra Neerukonda Patel Perez Prakash Prakash Renuart Rozas Shrestha Torres Vivero Ybanez First Rosemarie Mson Amir Anil Vivek Carmen SS Badri S Jignesh Myriam Manoj Radhika Ronald Joseph Anil Carlos Carmen Dino Title MD MD MD MD MD MD MD MD MD MD MD MD MD DO MD MD MD MD MD Address St Augustine St Augustine St Augustine St Augustine St Augustine PVB St Augustine/Hastings St Augustine St Augustine St Augustine St Augustine St Augustine St Augustine PVB St Augustine St Augustine/Hastings St Augustine St Augustine St Augustine Area of Specialty IM IM IM IM IM IM Internal Medicine/Nephrology IM IM IM IM Internal Medicine/Pulmonology IM IM IM IM IM IM IM Hospital Affiliation Flagler Hospital Flagler Hospital Flagler Hospital Flagler Hospital Flagler Hospital Other Flagler Hospital Flagler Hospital Flagler Hospital Flagler Hospital Other Flagler Hospital Flagler Hospital Baptist Flagler Hospital Flagler Hospital Flagler Hospital Flagler Hospital Flagler Hospital Browning Dupree Joyner Kirdnual Larroude Maetozo Mussallem Whitney Wyninger Yarian Leanne Robert James Amnath Juan Sherri Anthony Robert Susan MD MD MD MD MD MD MD MD MD MD St Augustine St Augustine St Augustine St Augustine St Augustine St Augustine St Augustine St Augustine SJCHD St Augustine Ob/Gyn Ob/Gyn Ob/Gyn Ob/Gyn Ob/Gyn Ob/Gyn Ob/Gyn Ob/Gyn Ob/Gyn Ob/Gyn Flagler Hospital Flagler Hospital Flagler Hospital Flagler Hospital Flagler Hospital Flagler Hospital Flagler Hospital Other SJCHD Flagler Hospital Dembrek Lelaidier Riccitello Weaver Barbara Gloria Maureen Georgiann CNM CNM CNM CNM St Augustine St Augustine St Augustine St Augustine Nurse-Midwifery Nurse-Midwifery Nurse-Midwifery Nurse-Midwifery Flagler Hospital Flagler Hospital Flagler Hospital Flagler Hospital Anderson Bhargva Buckley Capili Luis Hemant Julie Angelita MD MD MD MD St Augustine St Augustine PVB St Augustine Pediatrics Pediatrics Pediatrics Pediatrics Flagler Hospital Flagler Hospital Other Flagler Hospital APPENDIX B Last Erickson Ghatta Leadem Leadem Mas Ng Ozdemir Valdez Weise Yasin Baptist Pediatrics-PVB Atkins Emanuel Granat Horn Lazoff Paton Walker Fordan-Herman First Aliya Title MD MD MD MD MD MD MD MD MD MD Address SJCHD SJCHD St Augustine St Augustine St Augustine St Augustine PVB PVB STCHD St Augustine Area of Specialty Pediatrics (also IM) Pediatrics Pediatrics Pediatrics Pediatrics Pediatrics Pediatrics Pediatrics Pediatrics Pediatrics Hospital Affiliation SJCHD SJCHD Flagler Hospital Flagler Hospital Flagler Hospital Flagler Hospital Other Other SJCHD Flagler Hospital Bethany Christopher lloyd Kenneth Stephen Matt Martha Jennifer MD MD MD MD MD MD MD MD PVB PVB PVB PVB PVB PVB PVB PVB Pediatrics Pediatrics Pediatrics Pediatrics Pediatrics Pediatrics Pediatrics Pediatrics Baptist Baptist Baptist Baptist Baptist Baptist Baptist Baptist Paul Shirley Miguel Raphael Aleen Maria APPENDIX B Last DENTISTS Alberto Bailey Burgess Carrothers Cavallazzo Chamberlain Cowling Delfelice Della Porta Depetris Diaz Dixon Domingoes Ebert Elannan Elias Evans Forbes Fortus Glenos Glenos Gordon Grosselin Hackney Hayes Henderson Howland Hucke Johnson Joyner Karol Kessler Le Maroney Martin McClellan McMlellan Morse First Title Address David Marshall Eric Kelly Paul Steven David Michelle John Eric Frank Ronald Michael Suzanne Erica Nidal Pamela Phillip Stephen Della William Jeremiah Pierre DMD DMD DMD DDS DDS DMD DMD DDS DMD DMD DMD DMD DDS DMD DDS DDS DDS DDS DDS DDS DMD DDS DDS DDS DMD DDS DMD DMD DMD DMD DMD DDS DDS DDS DDS DDS DMD DDS St Aug St Aug PVB St Aug St Aug St Aug St Aug St Aug PVB St Aug St Aug St Aug St Aug PVB St Aug St Aug PVB St Aug St Aug St Aug St Aug St Aug St Aug SJCHD PVB St Aug PVB St Aug St Aug St Aug PVB PVB SJCHD PVB St Aug St Aug St Aug St Aug Randolph James Ronald Ronald Douglas John Robert Micheal William Steven Barbara Matt William Area of Specialty Oral/Maxillofacial Surgery Hospital Affiliation APPENDIX B Last Mortemore Narvaez Nadji Neal Nguyen Oxford Oxford Painter Poulos Rourke Russell Santiago Schellhase Schweim Sears Sindad Soud Thousand Tilberg Townsend Vail Valdes-Domingoes Versaggi Weeks Wells Wilcox Winter First Tanya Zita Holley Kevin Minh Isabell Gregory Rex Steve Daniel Greg Roberto Daniel Barry Don Greg Robert Robert Todd Eric David Maria Michael Penney Marvin Michael Michael Title DMD DDS DDS DDS DMD DMD DDS DDS DDS DDS DMD DDS DDS DDS DDS DMD DDS DDS DMD DDS DDS DDS DDS DMD DMD DDS DDS Address St Aug St Aug PVB PVB St Aug St Aug St Aug St Aug St Aug St Aug St Aug St Aug PVB PVB PVB St Aug PVB St Aug St Aug PVB PVB St Aug St Aug PVB St Aug Hastings PVB Area of Specialty Peridontal Surgery Peridontal Surgery Oral/Maxillofacial Surgery Hospital Affiliation APPENDIX B HEALTH CARE FACILITIES/SERVICES Home Health Agencies Bayview Home Health of St Augustine Community Home Health Care Flagler Hospital Care Tenders Housecall Home Healthcare Interim Healthcare of St. Augustine Omni Home Care Welcome Homecare EMS City St Augustine Fire Department (2 locations) County Palm Valley- Volunteer Fire Department (VFD) Switzerland VFD Colee Cove VFD Orangedale Bakersville VFD St. Augustine South VFD Crescent Beach VFD St. Augustine Beach Hastings VFD South Ponte Vedre VFD St. Augustine Shores VFD North City Riverdale VFD West Augustine St. Augustine Sampson VFD North Shores VFD Hospice Community Hospice of Northeast Florida Ambulatory Surgical Care Centers Eye Surgery Center of St. Augustine, Inc. Healthsouth St. Augustine Surgery Center Old Moultrie Surgical Cetner, Inc. Ponte Vedra Beach Surgery Center, Inc Ponte Verdra Plastic Surgery Center Ponte Vedra Surgery Center St. Augustine Endoscopy Center Renal Dialysis Units APPENDIX B FMC Dialysis Services St. Augustine St. Augustine Artifical Kidney Center Rehabilitative Services Performance Physical Therapy Ponte Vedrea Physical Therapy Rebound Rehabilitative Services, Inc. St. Johns Physical Therapy Center Ability Rehab Services Alliance Care Brooks Rehabilitation Bayview-The Pavilion Bodymax Physical Therapy & Personal Fitness Center Back to Basics Therpay Doan Therapy Flagler Hospital Rehab Services Healthsouth Sports Medicine & Rehab Center Interim Healthcare Bodywise Studios The Therapy Place Adult Day Care Sunshine Center Volunteer Clinics/Indigent Care Programs Good Samaritan Flagler Hospital Primary Care Veteran's Services Veteran's Administration- Community-based Outpatient Clinic APPENDIX B St Johns County Inventory of Mental Health and Substance Abuse Services Inpatient Services Flagler Hospital: 21 psych beds St Johns County Mental Health Department/St Johns Place: 10 beds (residential treatment facility) Outpatient Services St Johns County Mental Health and Recovery Services Department (SJCMHD) SJCMHD provides comprehensive behavioral services for children, adolescents, and adults by a broad range of mental health professional disciplines. Adult services offered by SJCMHD include case management, individual/family/group therapy, psychosocial programming/day treatment, emergency/crisis response services and community workshops. Services for children include case management, in-home counseling, individual/family/group therapy, school-based counseling, and behavioral analysis. Substance abuse services offer treatment for both adolescents and adults. A staff directory and job titles of employees at SHCMHD is included at the end of this section. The St. Johns County Community-Based Care Family Integrity Program (FIP) is a child safety agency responsible for protective services and out of home placement for St. Johns County children. FIP’s mission is to work in partnership with the state of Florida and local community to develop, implement and manage a community-based system of care for abused and neglected children and their families. A staff directory is included at the end of this section. EPIC Community Services Licensed by the Florida Department of Children and Families, EPIC Community Services provides substance abuse prevention, intervention, outpatient treatment and aftercare services as well as mental health counseling services. EPIC also offers Community Prevention Services Program, parenting education programs, Big Brothers Big Sisters, school-based prevention programs, foster parenting programs, and a Counseling Center. A staff directory is provided at the end of this section. Psychological Services of St Augustine Outpatient mental health and substance abuse services for children, adolescents and adults Cohen, Stanley, DO, Child, Adolescent and Adult Psychiatrist Brito, Odalys, MD, Child, Adolescent and Adult Psychiatrist Fuller, Antonia, ARNP Merwin, Jack, PhD, Licensed Psychologist Sappington, Andrew, PhD, Licensed Psychologist Shulman, Sharon, PhD, Licensed Psychologist Abbott, Kathleen, LMHC Bartol, Valerie, LMHC St Claire, Carol, LMHC Dungan, Deborah, LMHC Monoghan, Christy, LMHC Wood, Gini, LMHC Hackney, David LMHC Molinaro, Catherine, LCSW Henneka, Stephen, LCSW Lewis-Slayton, Patricia, LCSW Bennet, Mavis PhD, Licensed Marriage and Family Therapist Selig, Karen, MA, Licensed Marriage and Family Therapist APPENDIX B Private Practice – St Augustine Psychiatrists Dent, Gregory, MD Fox-Fliesser, Judith, MD Fliesser, Jeffrey, MD Morgan, Stacy, MD Olds, Robert, MD Psychologists Coshow, Kimerly, PHD Helder, Lynn PhD, PA Martin, Paul, PhD Middleton, Sue, PhD Risch, Sherrry, PhD Dr. Steven Dingfelder & Associates, Inc (St Aug, Pontre Vedra Beach, and Palatka) Dingfelder, Stephen, PhD, Psychologist Gates, Joann, PhD, Psychologist Schwartz, Mark, Psychologist Evans, Deborah, LCSW Haynes, Sandra, LCSW Meehan, Michael, LCSW Ott, Melody, LCSW Other Psychotherapists Bauer, Nicole, LMHC Byerly, Tammy, LCSW Felison, Jan, LCSW Hays, Jontie, LCSW McDermott, Amy, LMHC Deprey, Marilyn LMHC Mark, Joe LMHC Ponte Vedra Beach First Coast Therapy Group Outpatient Mental Health and Substance Abuse- children, adolescents, and adults Heideman, Brenda, LCSW Hanna, Deborah, LCSW Malec, Michael, EdD, LCSW Buckle, Neysa LMHC Crenshaw, Kristina, LMHC Inclan, Albert, PhD, LMHC King, Pamela, PhD, LMHC Wadelton, Lynn, PhD, Licensed Clinical Psychologist Hughes, Deanna, Psy.D, Licensed Clinical Psychologist Thomas, Nancy, PhD, Licensed Clinical Psychologist Goyal, Reena, Psy.D. Licensed Clinical Psychologist McQuillan, Jennifer, PhD, Licensed School Psychologist Rojas, Claudia, Licensed Mental Health Intern Edwards, Drew, Ed.D, Addictions Education APPENDIX B Ponte Vedra Medical Center- Family Counseling Voorhes, Eileen RN, Psychiatric and Mental health nurse Devlin, Pat, LMHC Barrow, Susan, SCSW Private Practice Psychologists Harvey, David, PhD Kilpatrick, Ted, PhD Simon, Joan, PhD Other Agencies Betty Griffin House (locations in St Aug and PVB) Counseling for domestic violence, sexual abuse, dating violence for adults, adolescents and children • 6 licensed therapists St Johns County Health Department Haney, Priscella, LCSW (for HIV clients) APPENDIX C-1 St Johns County Focus Group Questions 1. In general, are you satisfied with the quality of life in your community for yourself? A. Is this a good place to raise children? a. School quality b. Day care c. After school care d. Recreation e. Environment B. Is this community a good place to grow old? a. Elder friendly housing b. Transportation c. Churches d. Shopping e. Elder day care f. Social support organizations and agencies g. Services and activities C. Do you feel there is economic opportunity in the community? a. Locally owned and operated businesses b. Jobs with career growth and job training c. Higher education opportunities d. Affordable housing options e. Reasonable commute 2. Do you feel your community is a safe place to live? a. Safety in the home b. Workplace c. Schools and playgrounds d. Parks e. Do the neighbors know each other and look out for one another… 3. Do you believe there is a network of support for individuals and families during times of stress and need? a. Medical crisis b. Mental health and substance abuse c. Pregnancy d. Financial e. Death f. Services for children with special needs APPENDIX C-1 4. Are you satisfied with the health care system in your community? a. Cost b. Quality c. Options d. Prescription drugs e. Specialty care 5. Are there health services you need that are not available to you? 6. Are you aware of the public health services that are available in St Johns County? (i.e. County Health Department) 7. What do you see as the school’s role in health? 8. If you could create any type(s) of “health program(s)” for St Johns County residents what would it/they be? APPENDIX C-2 HOW HEALTHY IS ST. JOHNS COUNTY? The St. Johns County Community Health Assessment Task Force needs your help in better understanding the community’s health. Please fill out this survey to share your opinions about healthcare services and the quality of life in St. Johns County. The survey results will be presented to the community and made available to the public. The information gathered from responses to this survey will help make St. Johns County a better place to live. 1. How do you rate your overall health? (check one selection) Excellent Good Fair Poor Don’t Know 2. Check up to 5 selections you feel are the most important features of a healthy community: Access to churches or other places of worship Good place to raise kids Access to healthcare Good jobs, healthy economy Access to parks and recreation Good education Access to public transportation Low crime rates/safe neighborhoods Affordable and/or available housing options Preventative health care (i.e. annual check-ups) Access to social services Affordable child care Clean and healthy environment Good place to grow old Absence of discrimination Other______________________________ 3. Check up to 5 of the health problems you feel are the most important in St. Johns County: Asthma Addiction – alcohol or drug Respiratory/ lung diseases (i.e. COPD, emphysema) Mental health problems Cancers Child abuse/neglect Contagious diseases (i.e. flu, pneumonia) Teenage pregnancy Diabetes HIV/ AIDS/ Sexually Transmitted Diseases Heart disease & stroke Domestic violence Adult obesity End of life care (i.e. nursing homes, hospice) Childhood obesity Environmental health, sewers, septic tanks High blood pressure Motor vehicle crash injuries Smoking/tobacco use Other___________________________ Dental problems Rape/sexual assault 4. Check up to 3 unhealthy behaviors you are most concerned about in St. Johns County: Alcohol abuse Lack of exercise Tobacco use (i.e. cigarettes, cigars, Being overweight Not getting “shots” to prevent disease chewing tobacco) Dropping out of school Not using birth control Unlicensed and/or unsafe drivers Drug abuse Discrimination Unsafe sex Poor eating habits Teen sexual activity Other______________________ 5. What health care services are difficult to obtain in your community? (check all that apply): Alternative therapy (i.e. herbals, acupuncture) Prescriptions/medications/medical supplies Dental/oral care Preventive care (i.e. annual check-ups) Emergency room care Primary care (i.e. family doctor or walk-in clinic) Family planning/birth control Specialty M. D. care (i.e. heart doctor) Inpatient hospital Substance abuse services-drug and alcohol Lab work Vision care Mental health/counseling X-rays/mammograms Physical therapy, rehab therapy Other __________________________ None of the above 6. How do you rate the quality of health services in St. Johns County? Excellent Good Fair Poor Don’t Know TURN OVER APPENDIX C-2 7. What do you feel are barriers for you in getting healthcare? (check all that apply): ____ Lack of transportation ____ Have no regular source of healthcare ____ Can’t pay for doctor/hospital visits ____ Lack of evening and week-end services ____ Can’t find providers that accept my insurance ____ Long waits for appointments ____ Don’t know what types of services are available ____ Other _________________________ ____ None, I don’t have any barriers 8. When you need to use prescription medications for an illness, do you…(check all that apply) Have your prescription filled at drugstore/supermarket/mail order Go without medicine Buy over-the-counter medicine instead Use medication of friends or family Use leftover medication prescribed for a different illness Use herbal remedies instead Get medications from sources outside the country Go to the hospital emergency room 9. How is your health care covered? (check all that apply) Health insurance offered from your job or a family member’s job Health insurance that you pay for on your own I don’t have health insurance Medicare Medicaid Military Coverage/VA Other:_______________ 10. Where would you go if you are sick or need a medical professional’s advice about your health? (check one selection) Hospital emergency room in St. Johns County Flagler Hospital Primary Care Hospital emergency room outside the county Your doctor’s office No where—I don’t have a place to go when I get sick The local health department Other _____________________ 11. Where would you go if your children/dependents are sick or need a medical professional’s advice about their health? (check one selection) Hospital emergency room in St. Johns County Flagler Hospital Primary Care Hospital emergency room outside the county Their doctor’s office No where-we don’t have a place to go when we get sick The local health department Don’t have children/dependents Other_______________________ 12. Name of city/town where you live:________________________ Zip Code: ______________ 13. Age: less than 18 55-64 14. Gender: Female 18-25 26-39 40-54 65 –74 75+ Male 15. Race/Ethnicity: Which group do you most identify with? (check one selection) Black/African American Hispanic Native American White/Caucasian Asian/Pacific Other (Please describe)________________ 16. Education: Please check the highest level completed: (check one selection) Elementary/Middle School Technical/Community College Graduate/Advanced Degree High school diploma or GED 4 year College/Bachelor’s degree 17. Employment Status: (check one selection) Employed Full-Time Employed Part-Time Retired Home Maker 18. Household Income: (check one selection) Less than $10,000 $20,000 to $29,999 $10,000 to $19,999 $30,000 to $49,999 Unemployed Student Self-employed Other_________________ $50,000 – $74,999 $75,000 - $99,999 THANK YOU FOR COMPLETING THIS SURVEY! $100,000 or more APPENDIX C-3 St Johns County Survey Results - Other Comments 2. Check up to 5 selections you feel are the most important features of a healthy community: Other Comments VA Hospital (6) Affordable adult health care Exposure to creative arts and music Adult recreation No more McDonalds Homeless people Good Shopping (2) Green belts, wildlife areas, parks, forests, gardens Self discipline (exercise, diet) Good mental health care Place for mentally ill to go Good libraries Access to fishing/boat ramps Law enforcement that follow the law 3. Check up to 5 of the health problems that you feel are the most important in Clay County: Other Comments No drainage Community relations – men and women staying Overwhelming stupidity Drowning Venomous snakes/spiders and proper medical attention for their bites VA Care Homelessness (2) Dirty/unhealthy restaurants Police tazers Cell phone use while driving Animal attacks Insect problems Affordable health care for everyone, no exceptions Health, clean water Poor eating habits Kidney disease (4) Children not getting medical attention because they can’t afford it and doctors being able to turn them away Alzheimer’s Trauma Hurricanes Abortion APPENDIX C-3 4. Check up to 3 behaviors you are most concerned about in Clay County: Other Comments Homelessness (3) Law needs more work Lack of professionalism by police Oxycontin abuse Dirty/unhealthy restaurants Traffic Cell phones Not taking showers Not actively promoting abstinence Drunk drivers (2) No help for mentally ill Littering Doctors abusing insurance companies Corruption School menus Teen drug/alcohol abuse, no teen activities 5. What health care services are difficult to obtain in your community? Other Comments VA Hospital (20) Open VA clinic to new patients (2) Podiatry Pediatric specialty doctors (4) Adult dental and health care Dental care over 18 years old Dental for children under 5 Kidney transplant doctor Psychiatrist/psychologist Orthopedics (2) Low income day care Mental health takes too long to get an appt Female MD Specialists (2) Emergency room care for poor without insurance Christian mental health/counseling Transportation to medical facilities Children and families 24 hour walk in clinic, weekend clinic (2) Cost of health care (2) Health insurance for low income, uninsured (3) Methadone clinic Local dialysis (in Hastings) Smoking prevention Mental health services for children Health care too expensive for elderly Child care help “If you have the money, we have the services” APPENDIX C-3 7. What do you feel are barriers for you in getting health care? Other Comments High insurance costs (2) No insurance Prescription costs too high (3) No kidney transplant doctor Need socialized medicine if co-pays are excessive in number and amount per visit Lack of quality providers Too many foreign doctors Copays and medications Difficulty in qualifying Affordable adult insurance Certain doctor’s attitudes Quality of care High insurance rates, making too much money for assistance and not having enough money to have a reasonable deductible Long waits in the ER Local VA needed (2) Insurance premiums to high Medicaid doesn’t cover adult vision or dental No help for dental services for low income families Dental insurance (2) Share of cost too high Doctor’s that don’t explain tests Lack of quality practitioners in Hastings Far distance for health care Doctors won’t accept you as a patient if you want to switch doctors No good family doctors No health insurance Employers not providing healthcare or affordable healthcare Care for specific illness in this area Health dept turns you away I don’t have insurance and can’t get into health department My impatience with waiting to see a doctor 9. How is your health care covered? (check all that apply) Other Comments Share of cost (2) Student health insurance Ryan White Medipass Medicaid with share of cost is more than I can pay for KidCare AARP (2) Supplemental insurance that we pay for on our own My kids have Medicaid Retirement pension BCBS Private – CMS APPENDIX C-3 Pioneer At times, no insurance My husband doesn’t have it and it’s too expensive to put him on my plan 10. Where would you go if you are sick or need a medical professional’s advice about your health? (check one selection) Other Comments Walk-in clinic (9) I am looking for a good PCP since Mayo doesn’t take my insurance now and there are no good PCP’s taking new patients, I have to go to Jax Mayo Clinic (2) Chiropractor Mother (2) Depends on severity of illness Baptist South Hospital Haven’t been sick Ask a friend Good Samaritan clinic Herbalist 11. Where would you go if your children/dependents are sick or need a medical professional’s advice about your health? (check one selection) Other Comments Walk-in clinic Chirporactor Need a VA hospital VA VA clinic or Baptist South Hospital I would take children to first place available Anywhere I could get them in to see a doctor Pediatrician outside St Johns County No insurance on child, I can’t afford to go anywhere, I try natural/herbal first and gonly go to ER if emergency APPENDIX C-4 St. Johns County Survey Results by Select Zip Codes 1. How do you rate your overall health? Category Excellent Good Fair Poor Don’t Know Total County 2 1 3 4 5 32145 3 1 2 4 5 32095 *2 1 *2 3 4 32086 2 1 3 4 5 *Tie 2. Check up to 5 selections you feel are the most important features of a health community: Top 5 Access to health care Clean and healthy environment Good education Low crime rates/safe neighborhoods Good place to raise kids Good jobs, economy Affordable housing Total County 1 2 32145 1 3 32095 1 3* 32086 1 3* 3 4 2 2 4* 5 2 4* 4* 3* 3* 4 5 5 4 *Tie 3. Check up to 5 of the health problems you feel are the most important in St. Johns County: Top 5 Obesity Cancers Diabetes Addiction- alcohol or drug Mental health Heart disease and stroke Smoking/tobacco use Respiratory diseases Child abuse/neglect HIV/STD’s Domestic violence Dental problems Total County 32145 2 1 3 1 2 3 4 32095 32086 5 4 1 1 2 4* 2 5 4 5 3 4* 4* 5 3 *Tie 4. Check up to 3 behaviors you are the most concerned about in St. Johns County: Top 5 Being overweight Alcohol abuse Drug abuse Tobacco use Dropping out of school *Tie Total County 3 2 1 32145 3* 3* 1 3* 2 32095 3 2 1 32086 3 2 1 APPENDIX C-4 5. What health care services are difficult to obtain in your community? Top 5 Dental/oral care Mental health/counseling Prescription drugs Vision care Total County 1 3 2 32145 1 32095 1 2 3 2 3 32086 1 2 3 6. How do you rate the quality of health services in St. Johns County? Category Excellent Good Fair Poor Don’t Know Total County 3 1 2 4 5 32145 5 2 1 3 4 32095 3 1 2 4 5 32086 4 1 2 3 5 7. What do you feel are barriers for you in getting health care? Category Long waits for appointments Lack of evening and weekend services Can’t pay for doctor/hospital visits Have no regular source of care Lack of transportation Total County 2 32145 2 32095 1* 32086 1 3 3 1* 2 1 1 1* 3 3 2 *Tie 8. When you need to use prescription medications for an illness, do you… Category Have your prescription filled at the drugstore Buy over-the-counter medicine instead Go without medicine Total County 1 32145 1 32095 1 32086 1 2 3 3 3 3 2 2 2 Total County 1 32145 1 32095 1 32086 1 2 3 2 3 3 2 3 2 9. How is your health care covered? Category Have your prescription filled at the drugstore Buy over-the-counter medicine instead Go without medicine APPENDIX C-4 10. Where would you go if you are sick? Category Hospital ER in St. Johns County Your doctor’s office The local health department Total County 2 32145 2 32095 2 32086 2 1 3 1 3 1 3 1 3 11. Where would you go if your children/dependents are sick? Category Hospital ER in St. Johns County Their doctor’s office The local health department Don’t have children/dependents Total County 32145 3 32095 32086 1 3 1 1 2 1 2 2 2 3 3 Total County 15.8% 29.3% 26.6% 13.1% 7.9% 7.3% 32145 19.3% 36.7% 20.2% 11.9% 9.2% 2.8% 32095 28.3% 32.6% 30.4% 2.2% 2.2% 4.3% 32086 10.8% 34.8% 36.8% 9.3% 3.9% 4.4% Total County 23.3% 76.7% 32145 30.8% 69.2% 32095 21.7% 78.3% 32086 17.4% 82.6% Total County 18.1% 3.6% 1.7% 75.5% 0.7% 0.4% 32145 46.8% 6.4% 0% 45.9% 0.9% 0% 32095 9.1% 4.5% 2.3% 84.1% 0% 0% 32086 8.3% 4.9% 2.0% 83.9% 0% 1.0% AGE Category 18-25 26-39 40-54 55-64 65-74 75+ GENDER Category Male Female RACE/ETHNICITY Category Black/African American Hispanic Native American White/Caucasian Asian/Pacific Islander Other APPENDIX C-4 EDUCATION Category Elementary/middle school High school diploma or GED Technical/community college 4 year Bachelor’s degree Graduate/advanced degree Total County 6.0% 32145 12.3% 32095 10.9% 32086 3.4% 40.5% 46.2% 34.8% 42.4% 23.2% 26.4% 37.0% 21.7% 18.3% 12.0% 11.3% 3.8% 8.7% 8.7% 21.2% 11.3% Total County 49.4% 9.8% 9.3% 4.5% 15.5% 8.1% 1.7% 1.7% 32145 51.8% 7.3% 12.7% 4.5% 9.1% 7.3% 2.7% 4.5% 32095 41.3% 21.7% 8.7% 0% 6.5% 15.2% 4.3% 2.2% 32086 59.6% 10.1% 8.2% 3.4% 8.7% 8.2% 1.4% 0.5% Total County 16.4% 20.8% 18.2% 19.7% 11.0% 7.5% 6.4% 32145 21.9% 25.7% 29.5% 15.2% 6.7% 0% 1.0% 32095 20.9% 34.9% 9.3% 16.3% 4.7% 7.0% 7.0% 32086 10.9% 15.0% 14.5% 25.4% 17.1% 11.4% 5.7% EMPLOYMENT STATUS Category Employed full-time Employed part-time Unemployed Self-employed Retired Home Maker Student Other INCOME Category Less than $10,000 $10,000 - $19,999 $20,000 - $29,999 $30,000 - $49,999 $50,000 - $74,999 $75,000 - $99,999 $100,000 or more


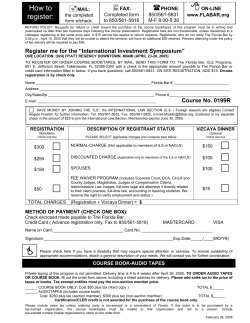

© Copyright 2026