
DOCUMENT COVER SHEET UKP-GW-GL-033 2
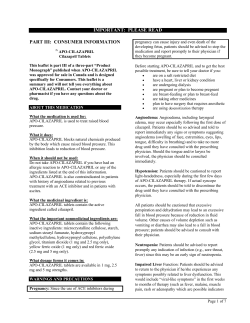
F-3.4.1-1 Rev 6 DOCUMENT COVER SHEET DOCUMENT NO. REVISION UKP-GW-GL-033 DOCUMENT STATUS: TDC: PAGE 2 PRE CFC ASSIGNED TO 1 of 50 CAE Permanent File: OPEN ITEMS (Y/N) W-Russ DES N Westinghouse Acceptance of AP1000 Design Partner Document by: N/A (Name and Date) ALTERNATE DOCUMENT NUMBER: N/A WORK BREAKDOWN #: ORIGINATING ORGANIZATION: Westinghouse Electric Company LLC TITLE: Assessment of Radioactive Discharges on Non-Human Species ATTACHMENTS: N/A DCP/DCA/SUPPLEMENTS/EDCR # INCORPORATED IN THIS DOCUMENT REVISION: N/A CALCULATION/ANALYSIS REFERENCE: N/A ELECTRONIC FILENAME UKP-GW-GL-033.doc ELECTRONIC FILE FORMAT Word ELECTRONIC FILE DESCRIPTION © 2011 WESTINGHOUSE ELECTRIC COMPANY LLC, ALL RIGHTS RESERVED – WESTINGHOUSE NON-PROPRIETARY CLASS 3 All Class 3 Documents require the following two approvals in lieu of a Form 36. LEGAL REVIEW SIGNATURE / DATE (If processing electronic approval select option) L. A. Campagna Electronically Approved*** PATENT REVIEW SIGNATURE / DATE D. E. Ekeroth Electronically Approved*** © 2011 WESTINGHOUSE ELECTRIC COMPANY LLC, ALL RIGHTS RESERVED – WESTINGHOUSE PROPRIETARY CLASS 2 This document is the property of and contains Proprietary Information owned by Westinghouse Electric Company LLC and/or its subcontractors and suppliers. It is transmitted to you in confidence and trust, and you agree to treat this document in strict accordance with the terms and conditions of the agreement under which it was provided to you. *NOTE: This selection is only to be used for Westinghouse generated documents. © 2011 WESTINGHOUSE ELECTRIC COMPANY LLC, ALL RIGHTS RESERVED and/or STONE & WEBSTER, INC. WESTINGHOUSE PROPRIETARY CLASS 2 and/or STONE & WEBSTER CONFIDENTIAL AND PROPRIETARY This document is the property of and contains Proprietary Information owned by Westinghouse Electric Company LLC and/or is the property of and contains Confidential and Proprietary Information owned by Stone & Webster, Inc. and/or their affiliates, subcontractors and suppliers. It is transmitted to you in confidence and trust, and you agree to treat this document in strict accordance with the terms and conditions of the agreement under which it was provided to you. Third Party Provided Information – TREAT AS WESTINGHOUSE PROPRIETARY CLASS 2 Requirements and responsibilities for reviewing, accepting and archiving this information are specified in the appropriate Level II or Level III Procedure. ORIGINATOR(S) WEC 6.1.pdf L. R. Eisenstatt SIGNATURE / DATE (If processing electronic approval select option) Electronically Approved*** REVIEWER(S) WEC 6.1.pdf D. M. Popp SIGNATURE / DATE Electronically Approved*** SIGNATURE / DATE VERIFIER(S) WEC 6.1.pdf R. P. Vijuk Plant Applicability: SIGNATURE / DATE SIGNATURE / DATE Electronically Approved*** All AP1000 plants except: Only the following plants: UKP APPLICABILITY REVIEWER WEC 6.1.pdf N/A SIGNATURE / DATE RESPONSIBLE MANAGER* WEC 6.1.pdf P. A. Russ SIGNATURE / DATE Electronically Approved*** * Verification Method: Independent Review Approval of the responsible manager signifies that the document and all required reviews are complete, the appropriate proprietary class has been assigned, electronic file has been provided to the EDMS, and the document is released for use. *** Electronically approved records are authenticated in the electronic document management system. Forms/NS-NPP/UKP-GW-GL-033 R2 Non-Humans.doc F-3.4.1-1 Rev 6 Westinghouse Non-Proprietary Class 3 Assessment of Radioactive Discharges on Non-Human Species UKP-GW-GL-033, Revision 2 Westinghouse Electric Company LLC 1000 Westinghouse Drive Cranberry Township, PA 16066 Copyright © 2011 Westinghouse Electric Company LLC All Rights Reserved Assessment of Radioactive Discharges on Non-Human Species Revision History REVISION HISTORY Revision Description of Changes 0 Initial Submittal 1 Complete rewrite and reformatting to incorporate responses to Technical Queries and Regulatory Observations. 2 Incorporates change in height of the plant stack described in Design Change Proposal APP-GW-GEE-1942 , Rev. 0. Addresses new Westinghouse trademark guidelines. Trademark Notice AP1000 is a trademark or registered trademark in the United States of Westinghouse Electric Company LLC, its subsidiaries and/or its affiliates. This mark may be used and/or registered in other countries throughout the world. All rights reserved. Unauthorized use is strictly prohibited. Other names may be trademarks of their respective owners. UKP-GW-GL-033 ii Revision 2 Assessment of Radioactive Discharges on Non-Human Species Table of Contents TABLE OF CONTENTS Section Title Page REVISION HISTORY ................................................................................................................................. ii LIST OF TABLES ........................................................................................................................................ v LIST OF FIGURES ..................................................................................................................................... vi LIST OF ACRONYMS AND TRADEMARKS ........................................................................................ vii EXECUTIVE SUMMARY ....................................................................................................................... viii 1.0 INTRODUCTION ........................................................................................................................... 1 2.0 OBJECTIVES AND SCOPE ........................................................................................................... 2 3.0 BACKGROUND INFORMATION ................................................................................................ 3 3.1 Conservation Legislation .................................................................................................... 3 3.2 ERICA Assessment Tool [Reference 1] ............................................................................. 3 3.2.1 3.2.2 3.2.3 3.2.4 3.3 Wildlife Dose Assessment Spreadsheet (version 1.20) ...................................................... 6 3.4 Generic Site ........................................................................................................................ 7 3.4.1 3.5 4.0 Tier 1...................................................................................................................... 3 Tier 2...................................................................................................................... 4 Tier 3...................................................................................................................... 5 Applicability and Limitations of Generic Models in ERICA Tool........................ 5 Reference Organisms ............................................................................................. 7 AP1000 NPP Emissions and Discharges ............................................................................ 7 ASSESSMENT OF IMPACT OF ATMOSPHERIC EMISSIONS .............................................. 17 4.1 ERICA Tool ...................................................................................................................... 17 4.1.1 4.1.2 4.1.3 4.2 Wildlife Dose Assessment Spreadsheet ............................................................................ 17 4.2.1 4.2.2 4.3 ERICA Tool Air Emissions Tier 1 Input ............................................................. 17 ERICA Tool Air Emissions Tier 1 Output .......................................................... 17 Sensitivity of ERICA Tool Air Emissions Tier 1 Outputs .................................. 17 Wildlife Dose Assessment Spreadsheet – Input Data .......................................... 17 Wildlife Dose Assessment Spreadsheet Output................................................... 18 Effects on Terrestrial Organisms ...................................................................................... 18 UKP-GW-GL-033 iii Revision 2 Assessment of Radioactive Discharges on Non-Human Species Table of Contents TABLE OF CONTENTS (cont.) Section 5.0 Title Page ERICA TOOL ASSESSMENT – WATER DISCHARGES ......................................................... 24 5.1 ERICA Tool Water Discharges Input Data ...................................................................... 24 5.2 ERICA Tool Water Discharges Output ............................................................................ 24 5.2.1 5.2.2 5.2.3 5.3 ERICA Tool Water Discharges Tier 1 Output..................................................... 24 ERICA Tool Water Discharges Tier 2 Output..................................................... 24 Sensitivity of ERICA Tool Tier 2 Outputs for Water Discharges to Sea ............ 25 Effects on Marine Organisms ........................................................................................... 26 6.0 CONCLUSIONS ........................................................................................................................... 38 7.0 REFERENCES .............................................................................................................................. 39 APPENDIX A Calculation of Ar-41 and Kr-85 Receptor Concentrations ................................................. 40 UKP-GW-GL-033 iv Revision 2 Assessment of Radioactive Discharges on Non-Human Species Table of Contents LIST OF TABLES Table 3-1 Tier 2 Output Classification ................................................................................................... 9 Table 3-2 Reference Organisms Considered in the Vicinity of the Generic Site ................................. 10 Table 3-3 Air Emission Data used in the ERICA Tool ........................................................................ 11 Table 3-4 Water DISCHARGE Data used in the ERICA Tool ............................................................ 12 Table 4-1 Input Data for the ERICA Tier 1 Assessment of Air Emissions .......................................... 19 Table 4-2 Tier 1 Results of ERICA Tool Assessment on Air Emissions ............................................. 20 Table 4-3 Sensitivity of the Tier 1 Results of ERICA Tool Assessment for Air Emissions ................ 21 Table 4-4 Input Data in the Wildlife Dose Assessment Spreadsheet ................................................... 22 Table 4-5 Output Data in the Wildlife Dose Assessment Spreadsheet ................................................ 23 Table 5-1 Input Data in the ERICA Tier 1 and Tier 2 Assessment of Water Emissions ..................... 27 Table 5-2 Tier 1 Results of ERICA Tool Assessment on Water Discharges ....................................... 30 Table 5-3 Tier 2 Results of Water Discharges using the ERICA Dose Rate Screening Value ............ 31 Table 5-4 Sensitivity of the Tier 2 Results of ERICA Tool Assessment for Water Discharges to Sea ................................................................................................................. 33 Table 5-5 Effects on Marine Organisms .............................................................................................. 35 UKP-GW-GL-033 v Revision 2 Assessment of Radioactive Discharges on Non-Human Species Table of Contents LIST OF FIGURES Figure 3-1 Location of Nuclear Power Stations Used to Establish the Generic Design Case ............... 14 Figure 3-2 Land Use and Habitat Data for the Generic Design Case .................................................... 15 Figure 3-3 Sites of Special Interest for the Generic Design Case ......................................................... 16 UKP-GW-GL-033 vi Revision 2 Assessment of Radioactive Discharges on Non-Human Species List of Acronyms LIST OF ACRONYMS AND TRADEMARKS AP1000TM EA EMCL ERICA GDA HSE IAEA NPP PWR RQ SRS UF AP1000™ nuclear power plant Environment Agency Environmental Media Concentration Limit Environmental Risk from Ionising Contaminants: Assessment and Management Generic Design Assessment Health & Safety Executive International Atomic Energy Agency Nuclear Power Plant Pressurised Water Reactor Risk Quotient Safety Report Series Uncertainty Factor UKP-GW-GL-033 vii Revision 2 Assessment of Radioactive Discharges on Non-Human Species Executive Summary EXECUTIVE SUMMARY The UK Nuclear Regulators have developed a Generic Design Assessment process for evaluating alternative designs for the next generation of nuclear power plants to be built in the UK. Initially the Regulators will to review the safety, security and environmental impact of the nuclear power plant designs against a generic site which, as far as possible, envelops or bounds the characteristics of any potential UK site. One of the key environmental issues is to understand the impact of the radioactive emissions of the nuclear power plant on the terrestrial and aquatic fauna and flora. This report makes an assessment of the likely impact of radioactive discharges from the Westinghouse AP1000™ Nuclear Power Plant (NPP) on non-human species. Use is made of the ERICA tool which provides a recognized methodology for assessing the environmental exposure, effects and risks from ionising radiation on ecosystems. Use is also made of the Wildlife Dose Assessment Spreadsheet Version 1.20 in order to address the impact of emissions of the inert gas isotopes – argon, krypton and xenon. The results indicate that the atmospheric emissions from the AP1000 NPP will cause negligible impact on the reference organisms beyond the site boundary. The ERICA tool has also been used at Tier 1 and Tier 2 level to assess the impact of water discharges from the AP1000 NPP to the marine environment. The model predicts that there is negligible risk to pelagic organisms that live within the water column (pelagic fish, phytoplankton and zooplankton). However, the ERICA screening dose rate of 10.0 µGyh-1 is exceeded for the selected generic site conditions for organisms that live within the sediment or at the sediment – water interface (polychaete worms, macroalgae, sea anemonies or true coral polyps and colonies, benthic molluscs, crustacean, vascular plants and benthic fish). Sensitivity analysis of the ERICA results confirms that polychaete worms are the most vulnerable organism. These organisms live within the sediment. Comparison with published radiation dose effects on marine organisms indicates that there may be some adverse effects from the AP1000 NPP discharges. However, the predicted dose rates are well below the 400 µGyh-1 which is a benchmark derived from the IAEA (1992) and UNSCEAR (1996) reports below which populations are unlikely to be significantly harmed. The models will need to be run again to predict the impact at any specific site where the input parameters and reference organisms relating to the site and the protected species may differ from those assumed for the generic site. UKP-GW-GL-033 viii Revision 2 Assessment of Radioactive Discharges on Non-Human Species 1.0 Introduction 1.0 INTRODUCTION The UK Nuclear Regulators (the Health and Safety Executive (HSE) and the Environment Agency (EA)) have developed a Generic Design Assessment (GDA) process for evaluating alternative designs for the next generation of nuclear power plants to be built in the UK. Westinghouse Electric Company has submitted an application for its AP1000 NPP design to be considered in this process. The EA has reviewed the preliminary Westinghouse application and concluded that further information on likely impact of the radioactive discharges from the AP1000 NPP on nonhuman species is required. This report provides the results of the assessment of radioactive emissions and discharges from the AP1000 NPP on non-human species. The assessment has been carried out using the following tools: the ERICA (Environmental Risk from Ionising Contaminants: Assessment and Management) tool [Reference 1] the terrestrial Wildlife Dose Assessment Spreadsheets version 1.20 [Reference 2]. UKP-GW-GL-033 1 Revision 2 Assessment of Radioactive Discharges on Non-Human Species 2.0 Objectives and Scope 2.0 OBJECTIVES AND SCOPE The objective of this report is to determine the likely impact of the AP1000 NPP design on non-human species. The predicted radioactive emissions and discharges from the AP1000 NPP are input into the ERICA tool or Wildlife Dose Assessment spreadsheet to determine the impact on various reference organisms. For the GDA, it is assumed that all reference organisms specified in the respective tools are present in the vicinity of the plant. Later site specific analysis may revise this assumption based on conditions at the specific site under consideration. UKP-GW-GL-033 2 Revision 2 Assessment of Radioactive Discharges on Non-Human Species 3.0 Background Information 3.0 BACKGROUND INFORMATION 3.1 Conservation Legislation There is a variety of European and UK legislation that requires the conservation of natural habitats and wild flora and fauna [e.g. Reference 3, 4, 5, and 6]. The EA is required to ensure that no EA authorised activity or permission results in an adverse effect on protected sites which identified in the 1992 European Commission Habitats Directive [Reference 3]. These Natura 2000 sites are ecologically sensitive areas with the highest value natural habitats which contain species of plants and animals which are rare, endangered or vulnerable in the European Community. With respect to the nuclear power plant new build programme each sensitive site therefore needs an assessment to determine likelihood of, and significance of, any impact from exposure to ionising radiation. For the purpose of this assessment it is assumed that the site has the characteristics of the generic coastal site [Reference 7]. The generic site is assumed to have several sensitive habitats, including Natura 2000 sites, within 2km of the nuclear power plant. 3.2 ERICA Assessment Tool [Reference 1] ERICA is an EC funded project to develop an integrated approach to the assessment and management of environmental risks from ionising radiation. The purpose is to ensure that decisions on environmental issues give appropriate weight to the environmental exposure, effects and risks from ionising radiation with emphasis on ensuring the structure and function of ecosystems. To fulfill this objective, elements related to environmental management, risk characterisation and impact assessment have been integrated. The ERICA Integrated Approach is supported by the ERICA Tool, which is a software programme that guides the user through the assessment process, keeps records and performs the necessary calculations to estimate dose rates to selected biota. The Tool interacts with a number of databases and other functions that help the assessor to estimate environmental media activity concentrations, activity concentrations in biota, and dose rates to biota. The ERICA Tool also interfaces with the FREDERICA radiation effects database, which is a compilation of the scientific literature on radiation effect experiments and field studies, organised around different wildlife groups and, for most data, broadly categorised according to four effect umbrella endpoints: morbidity, mortality, reproduction, and mutation. The databases of the ERICA Tool are built up around a number of reference organisms. Each reference organism has its own specified geometry and is representative of terrestrial, freshwater or marine ecosystems. The version of the ERICA tool used in this project is April 2008. The ERICA assessment tool functions at three levels: 3.2.1 Tier 1 Tier 1 is a concentration screening level. The Tool calculates a risk quotient (RQ) for a given nuclide as a ratio of the input media concentrations (M) to the most restrictive Environmental Media Concentration Limit (EMCL) for the most limiting reference organism: UKP-GW-GL-033 3 Revision 2 Assessment of Radioactive Discharges on Non-Human Species 3.0 Background Information RQ M EMCL where M = Estimated or measured activity concentration for a given radionuclide in Bq l-1 for water, Bq kg-1 dry wt for soil/sediment or Bq m-3 for isotopes of C, H, P and S within the terrestrial environment; EMCL Screening Dose Rate (10 Gy h 1 ) F where F = The dose rate that a given organism will receive for a unit concentration of a given radionuclide in an environmental medium (μGy h-1 per Bq l-1 or kg-1 (dry weight) or m-3 of medium). The value of F depends upon the reference organism type, its position(s) within habitat and the radionuclide. In this respect the following factors become important: dose conversion coefficients – the relationship between the activity concentration of an organism or media and internal or external absorbed dose rates radioactive decay – type of decay (e.g. α, β, γ) and energy of decay concentration ratios – the activity concentrations of radionuclides in biota relative to the media (e.g. air, soil, water) activity concentrations distribution coefficients – defining the partitioning of radionuclide between different media (e.g. sediment / water partition coefficients) occupancy factors – fraction time organism spends within a particular habitat For the terrestrial environment, EMCL values always refer to soil activity concentrations, except for isotopes of H, C, S and P that refer to air concentrations. For aquatic systems, EMCL values are derived for both water and sediment activity. Tier 1 compares emissions and discharges against a default incremental dose rate of 10 μGy h-1 for all ecosystems and organisms. The overall RQ is the sum of the RQs for the most limiting reference organism for each radionuclide. If the sum of the RQs for all nuclides is less than one there is a very low probability that the absorbed dose rate to any organism exceeds the screening dose rate, and the situation may be considered to be of negligible radiological concern and the assessment can be terminated. If the ratio exceeds unity further Tier 2 assessment is required. 3.2.2 Tier 2 Tier 2 is a dose rate screening level. In Tier 2, the ERICA screening dose rate of 10 μGy h-1 is compared directly to the total estimated whole body absorbed dose rate for each individual organism. The RQ is calculated as follows: UKP-GW-GL-033 4 Revision 2 Assessment of Radioactive Discharges on Non-Human Species 3.0 Background Information RQ Whole Body Absorbed Dose Rate Screening Level Dose Rate In Tier 2 RQ for a given organism equals the sum of the radionuclide-specific RQs for that organism. Two RQs are reported in Tier 2 for every organism selected in the assessment: the expected RQ and the conservative RQ. The expected RQ uses the best estimate values for the input data and the parameters. The conservative RQ determines uses 95th or 99th percentile input values to determine the 5% or 1% probability of exceeding the dose screening value. The significance of the Tier 2 output is determined based on the values of the expected RQ and the conservative RQ for each individual organism (see Table 3-1). The results are categorized as “negligible”, “insufficient confidence” and “of concern”. These classifications will be used to present the results from ERICA in later section of this report. For results in the “insufficient confidence” and “of concern” category it may be necessary to make more qualified judgments and/or to refine model inputs to complete the Tier 2 assessment. Alternatively an in-depth Tier 3 assessment is required. 3.2.3 Tier 3 Tier 3 is a site specific probabilistic analysis. Situations, which give rise to a Tier 3 assessment, are likely to be complex and unique. There may be requirements to consider the detailed biological effects of exposure to ionising radiation in different species or to undertake ecological survey work to supplement information databases held within the ERICA software. This requires an experienced, knowledgeable assessor or consultation with an appropriate expert to estimate the probability and severity of the environmental effects and to determine the acceptability of the risk to non-human species. Tier 3 is beyond the scope of this report. 3.2.4 Applicability and Limitations of Generic Models in ERICA Tool In this work, two generic models (coastal transport model and air transport model) are used in assessing the impact of discharges of radioactive substances to the environment. As a result, a number of modeling criteria are assumed to be satisfied for the model. These criteria and assumptions are listed below for both coastal and air transport model. For the coastal transport modeling it is assumed that: The surface water geometry (e.g. river cross-section, shoreline) does not change greatly with distance. The flow characteristics (e.g. flow velocity, water depth) do not change significantly with distance or with time. Radionuclides in water and sediment, under the conditions of a routine, long term release, can be considered to be in equilibrium. This model is only applicable if the longitudinal distance x (the distance from the release point to a potential receptor location along the coastal current direction) is more than seven times of the water depth and when the transversal distance does not differ much from the distance between the release point and the beach. UKP-GW-GL-033 5 Revision 2 Assessment of Radioactive Discharges on Non-Human Species 3.0 Background Information This model is best suited to predicting radionuclide activity concentrations for distances of up to 10’s of km from the discharge point. At greater distances (>100 km) the predictions become less reliable. For distances > 100 km, the utilisation of a purpose built dispersion model is advised. For the air transport modeling it is assumed that: 3.3 As this model uses the principle of Gaussian plume model, it should be noted it is not generally applicable on receptor distance which is greater than 20 km. As a result, it is recommended that any receptors of concern that are beyond 20 km from the release point should be considered to be at 20 km for generic assessment purposes. The uncertainty associated with the application of a Gaussian plume model for continuous releases from a single source is about a factor of 4 or 10 for a flat and complex terrain respectively. For the purpose of the assessment tool, the exact simulation of the influence of the building is considered as relatively unimportant. The ERICA tool does not accept inputs of radioactive emissions of some inert gases (e.g. argon, krypton and xenon). Wildlife Dose Assessment Spreadsheet (version 1.20) The Wildlife Dose Assessment Spreadsheet [Reference 2] was developed in the UK and formed an important building block of the ERICA tool. This spreadsheet comes in three forms; the freshwater, marine and terrestrial versions. Only the terrestrial spreadsheet was used in this exercise, because it enables the impact of emissions of Argon-41 and Krypton-85 to be assessed. These inert gases contribute approximately 80% of the radioactive releases from the AP1000 NPP to the atmosphere (see Section 3.5). The dose calculation method employs a number of inherent assumptions: Organisms are represented as ellipsoids Concentrations of radionuclides in biota are calculated using simple equilibrium concentration ratios between biota and water, soil or air. Argon and krypton radionuclides are not taken up into the body of the animal or plant. This means that there is no internal dose rate associated with Argon-41 and Krypton-85 emissions. The dose rate is received from these emissions is a result of external exposure only. Resulting absorbed doses, both internal and external, are calculated as an average throughout the volume of the organism. The concentration of Argon-41 and Krypton-85 in the soil and bacteria is assumed to be 1E-04 times the atmospheric concentration. Organisms receive external dose at a reduced rate during the fraction of their time spend above ground surface, e.g. birds flying or roosting UKP-GW-GL-033 6 Revision 2 Assessment of Radioactive Discharges on Non-Human Species 3.0 Background Information 3.4 Absorbed fractions for α emissions are assumed to be zero for bacteria and unity for all other organisms. Calculated doses to micro-organisms are equal to the absorbed dose in the soil or sediment in which they are located. Generic Site At present there has been no decision made on where to site the next generation nuclear power stations in the UK. In order to allow early assessment of the proposed reactor designs, the nuclear regulators have required the impact of the new plants to be assessed against a generic site. A coastal generic site has previously been developed based on information obtained from five coastal nuclear power stations around the United Kingdom [Reference 7]. These power stations are Dungeness (A), Hartlepool (B), Heysham (C), Hinkley (D) and Sizewell (E). These sites are considered typical of the range of nuclear coastal sites in the UK. The sites are located around the English coast (see Figure 3-1) Maps have been generated from the generic site data gathered in Reference 7 and, although not unique solutions to the generic site, are consistent with the information and help to visualize the generic site. Figure 3-2 shows the land use and habitat areas within 5 km of the generic site. Figure 3-3 shows the sites of special interest within 5 km of the site For the coastal generic site all liquid discharges from the AP1000 NPP are discharged to the marine environment. There are no direct discharges to freshwater ecosystems. 3.4.1 Reference Organisms ERICA and the Wildlife Dose Assessment Spreadsheet uses a number of reference organisms selected to provide a basis for estimating the radiation dose rate and effects on a range of organisms with similar taxonomy. Each reference organism has its own specified geometry and is representative of either the terrestrial, freshwater or marine ecosystems. The reference organisms have precisely defined anatomical, physiological and life history properties that can be used for the purposes of relating exposure to dose and dose to effects for that type of living organism. The reference organisms have been selected to be representative of all protected species within Europe. For the purpose of this study on the impact of the AP1000 NPP on the coastal generic site, it is assumed that all reference terrestrial and marine organisms are located within the vicinity of the plant. This ensures that the evaluation is relevant to as many protected species as possible. Table 3-2 identifies these reference organisms. 3.5 AP1000 NPP Emissions and Discharges The ERICA assessment tool requires the emissions and discharges of radioactive isotopes to be input into the programme to assess the likely impact on ecological indicator species. The isotopic emissions and discharge data used in the ERICA evaluation is based on predicted operating data from Westinghouse proprietary calculations [Reference 8]. The air emissions data is presented in Table 3-3 and the water discharge data is presented in Table 3-4. The data are based on annual average air emission and water discharge rates. No account is taken of short term variability of emissions and discharges. UKP-GW-GL-033 7 Revision 2 Assessment of Radioactive Discharges on Non-Human Species 3.0 Background Information It is not possible to include all the isotopes in the AP1000 NPP atmospheric emissions in the ERICA tool. Table 3-3 shows that the ERICA tool can accept input for thirteen of the eighteen isotopes. However, because the ERICA tool does not accept inputs for the inert gases argon, krypton and xenon, the inputs only represent 20.6% of the total radioactivity in Bqs-1 emitted to atmosphere. The inert gas isotopes of Argon-41, Krypton-85 and Xenon-133 constitute 76.7% of the total radioactivity in Bqs-1 emitted to atmosphere. The effects of these radioactive emissions on non-human species were determined using the Wildlife Dose Assessment Spreadsheet Version 1.20. This method allows inputs for Argon-41 and Krypton-85. For this purpose of this spreadsheet Krypton-85 was used as a surrogate for Xenon-133. Table 3-4 shows that at Tier 1 the ERICA tool can accept inputs into the coastal model of twenty out of the twenty nine isotopes present in the AP1000 NPP water discharges. At Tier 2 all isotopes in Table 3-4 were included. These represent over 99.9% of the total radioactivity in Bqs-1 in the water discharge. UKP-GW-GL-033 8 Revision 2 Assessment of Radioactive Discharges on Non-Human Species 3.0 Background Information Table 3-1 TIER 2 OUTPUT CLASSIFICATION Level of Concern Expected RQ Conservative RQ Negligible <1 <1 Insufficient Confidence <1 >1 Of Concern >1 >1 UKP-GW-GL-033 9 Revision 2 Assessment of Radioactive Discharges on Non-Human Species 3.0 Background Information Table 3-2 REFERENCE ORGANISMS CONSIDERED IN THE VICINITY OF THE GENERIC SITE Terrestrial (ERICA) Terrestrial (Wildlife Dose Assessment) Marine (ERICA) Amphibian (frog) Ant (Wading) bird (duck) Bird (duck) Bacteria Benthic fish (flat fish) Bird egg (duck egg) Bee Bivalve mollusc Detritivorous invertebrate Bird Crustacean (crab) Flying insect (bee) Bird Egg Macroalgae (brown seaweed) Gastropod Caterpillar Mammal Grasses and herbs (wild grass) Earthworm Pelagic fish Lichen and bryophytes Fungi Phytoplankton Mammal (rat, deer) Lichen Polychaete worm Reptile Mammal (carnivore) Reptile Shrub Mammal (herbivore) Sea anemones/true corals Soil invertebrate (earthworm) Reptile Vascular plant Tree (pine tree) Rodent Zooplankton Seed Shrub Tree Woodlouse UKP-GW-GL-033 10 Revision 2 Assessment of Radioactive Discharges on Non-Human Species 3.0 Background Information Table 3-3 AIR EMISSION DATA USED IN THE ERICA TOOL Westinghouse Predicted Operating Data [Reference 8] Value used in ERICA Tool Value used in Wildlife Dose Assessment Spreadsheet Isotope Bqs-1 Bqs-1 Bqs-1 Tritium 5.71E+04 5.71E+04 - Carbon-14 1.92E+04 1.92E+04 - Argon-41 3.99E+04 - 3.99E+04 Manganese-54 5.07E-03 5.07E-03 - Cobalt-58 2.70E-01 2.70E-01 - Cobalt-60 1.01E-01 1.01E-01 - Krypton-85 1.73E+05 [Note 1] - 2.12E+05 [Note 1,2] Krypton-85m 7.61E+02 - - Strontium-89 3.49E-02 3.49E-02 - Strontium-90 1.40E-02 1.40E-02 - Zirconium-95 1.17E-02 1.17E-02 - Niobium-95 2.95E-02 2.95E-02 - Iodine-131 6.66E+00 6.02E+00 - Iodine-133 1.11E+01 9.83E+00 - Xenon-133 4.12E+04 - [Note 2] Caesium-134 2.70E-02 2.70E-02 - Caesium-137 4.12E-02 4.12E-02 - Notes: 1. Krypton-85 value includes emissions of isotopes Krypton-87, Krypton-88, Xenon-131 m, Xenon-133 m, Xenon-135, Xenon-135m, Xenon-137 and Xenon-138 2. Xenon-133 included with Krypton-85 UKP-GW-GL-033 11 Revision 2 Assessment of Radioactive Discharges on Non-Human Species 3.0 Background Information Table 3-4 WATER DISCHARGE DATA USED IN THE ERICA TOOL Westinghouse Predicted Operating Data [Reference 8] Value used in ERICA Tier 1 Assessment Value used in ERICA Tier 2 Assessment Isotope Bqs-1 Bqs-1 Bqs-1 Tritium 1.06E+06 1.06E+06 1.06E+06 Carbon-14 1.05E+02 1.05E+02 1.05E+02 Sodium-24 1.20E+00 - 1.20E+00 Chromium-51 1.46E+00 - 1.46E+00 Manganese-54 1.01E+00 1.01E+00 1.01E+00 Cobalt-58 1.30E+01 1.30E+01 1.30E+01 Iron-55 1.55E+01 - 1.55E+01 Iron-59 1.59E-01 - 1.59E-01 Cobalt-60 7.29E+00 7.29E+00 7.29E+00 Nickel-63 1.71E+01 1.71E+01 1.71E+01 Zinc-65 3.17E-01 - 3.17E-01 Rubidium-88 1.24E-02 - 1.24E-02 Strontium-89 7.61E-02 7.61E-02 7.61E-02 Strontium-90 7.93E-03 7.93E-03 7.93E-03 Yttrium-91 2.89E-03 - 2.89E-03 Zirconium-95 2.19E-01 2.19E-01 2.19E-01 Niobium-95 1.93E-01 1.93E-01 1.93E-01 Molybdenum-99 6.02E-01 - 6.02E-01 Technetium-99m 5.71E-01 - 5.71E-01 Ruthenium-103 3.81E+00 3.81E+00 3.81E+00 Silver-110m 8.24E-01 8.24E-01 8.24E-01 Iodine-131 4.76E-01 4.76E-01 4.76E-01 Iodine-132 6.34E-01 6.34E-01 6.34E-01 Iodine-133 9.20E-01 9.20E-01 9.20E-01 Iodine-134 1.87E-01 - 1.87E-01 Iodine-135 7.61E-01 - 7.61E-01 UKP-GW-GL-033 12 Revision 2 Assessment of Radioactive Discharges on Non-Human Species 3.0 Background Information Table 3-4 (cont.) WATER DISCHARGE DATA USED IN THE ERICA TOOL Westinghouse Predicted Operating Data [Reference 8] Value used in ERICA Tier 1 Assessment Value used in ERICA Tier 2 Assessment Isotope Bqs-1 Bqs-1 Bqs-1 Caesium-134 2.41E-01 2.41E-01 2.41E-01 Caesium-136 2.95E-01 2.95E-01 2.95E-01 Caesium-137 7.29E-01 7.29E-01 7.29E-01 Barium-140 4.44E-01 - 4.44E-01 Lanthanum-140 5.71E-01 - 5.71E-01 Cerium-144 2.54E+00 2.54E+00 2.54E+00 Praseodymium-144 2.54E+00 - 2.54E+00 Plutonium-241 2.54E-03 2.54E-03 2.54E-03 Note: 1. Cl-36, Nb-94, As-76, Br-82, Rb-86, Tc-99, Ru-106, Sn-117m, Sb-122, Sb-124, Sb-125, I-129 U-234, U-235, U-238, Np-237, Pu-238, Pu-239, Pu-240, Pu-242, Am-241, Am-243, Cm-242, Cm244 and all others each < 1.17E-03 Bqs-1. UKP-GW-GL-033 13 Revision 2 Assessment of Radioactive Discharges on Non-Human Species 3.0 Background Information Dungeness (A), Hartlepool (B), Heysham (C), Hinkley (D) and Sizewell (E) Figure 3-1. Location of Nuclear Power Stations Used to Establish the Generic Design Case UKP-GW-GL-033 14 Revision 2 UKP-GW-GL-033 3.0 Background Information 15 Figure 3-2. Land Use and Habitat Data for the Generic Design Case Revision 2 Assessment of Radioactive Discharges on Non-Human Species UKP-GW-GL-033 3.0 Background Information 16 Figure 3-3. Sites of Special Interest for the Generic Design Case Revision 2 Assessment of Radioactive Discharges on Non-Human Species 4.0 Assessment of Impact of Atmospheric Emissions Assessment of Radioactive Discharges on Non-Human Species 4.0 ASSESSMENT OF IMPACT OF ATMOSPHERIC EMISSIONS 4.1 ERICA Tool 4.1.1 ERICA Tool Air Emissions Tier 1 Input The input data for the ERICA Tier 1 and Tier 2 analyses include the emissions data identified in Table 3-3. Other input data includes information shown in Table 4-1. 4.1.2 ERICA Tool Air Emissions Tier 1 Output The output of the ERICA Tier 1 assessment for air emissions using the ERICA dose rate screening value of 10 µGyh-1 is shown in Table 4-2. The Tier 1 results show that the sum of the risk quotients is substantially below unity indicating that the values are below the screening dose rate of 10 µGyh-1. This indicates that no further analysis at Tier 2 or Tier 3 is required. 4.1.3 Sensitivity of ERICA Tool Air Emissions Tier 1 Outputs The sensitivity of the Tier 1 results to changes in input parameters has been investigated for variations in windspeed, distance to receptor and stack height. The results are shown in Table 4-3. In Table 4-3 Scenario A is default scenario which matches the results in Table 4-2. Scenario B identifies the effect on the risk quotient if all emissions were released from the lower turbine vent stack. In practice no more than 8.4% of the radioactivity emitted to atmosphere from the plant is potentially released from the turbine vent [Reference 8], so this is highly conservative. Scenarios C-F show the impact of changing the wind speed from 1 ms-1 to 10 ms-1. The risk quotient reduces as the wind speed increases. Scenario G-J show the effect of changing the distance to receptor from 50 m to 300 m. The risk quotient reduces as the distance to receptor increases. Scenario K is a worst case scenario assuming emissions are from the lower stack height, the lowest wind speed and the nearest receptor distance. Under these conditions the risk quotient is 2.91E-01, which is still below the screening dose rate of 10 µGyh-1. 4.2 Wildlife Dose Assessment Spreadsheet 4.2.1 Wildlife Dose Assessment Spreadsheet – Input Data The input data for the Wildlife Dose Assessment Spreadsheet includes the ground level concentrations of Argon-41 and Krypton-85 in Bqm-3 predicted at the assumed receptor distance of 200 m. These have been calculated using the emissions data identified in Table 3-3 and the same Gaussian plume model equations as those built into the ERICA tool for an emission point that is in the lee of a building inside the wake zone [Reference 5-8]. The ground level concentrations are shown in Table 4-4 together with other input data used in the Wildlife Dose Assessment Spreadsheet. UKP-GW-GL-033 17 Revision 2 4.0 Assessment of Impact of Atmospheric Emissions 4.2.2 Assessment of Radioactive Discharges on Non-Human Species Wildlife Dose Assessment Spreadsheet Output The weighted output of the Wildlife Dose Assessment Spreadsheet for the air emissions of Argon-41 and Krypton-85 is shown in Table 4-5. For Argon-41 and Krypton-85 the total dose rate occurs entirely from external rather than internal dose rates. The highest total dose rate occurs for fungi and is 0.00027 µGyh-1. 4.3 Effects on Terrestrial Organisms The results of the Tier 1 ERICA model and the Wildlife Dose Assessment spreadsheet indicate that there is negligible risk from the radioactive atmospheric emissions from the AP1000 NPP to terrestrial organisms living at the site boundary or beyond. UKP-GW-GL-033 18 Revision 2 4.0 Assessment of Impact of Atmospheric Emissions Assessment of Radioactive Discharges on Non-Human Species Table 4-1 INPUT DATA FOR THE ERICA TIER 1 ASSESSMENT OF AIR EMISSIONS Parameter Ecosystem Input Comments Terrestrial Appropriate for evaluating impact of air emissions Media activity concentration IAEA SRS-19 air model Generic dispersion model within ERICA. Established internationally recognised methodology. Provides consistency, allowing comparison between different assessments. May be overly conservative. Release height 81.6264 m Reactor Building Vent 74.926m [Reference 9] + 6.7m plume rise under neutral atmospheric conditions Distance to receptor 200 m Distance to generic site boundary Wind speed 5.0 m/s Average wind speed value assumed for generic site Fraction of time (wind blowing towards the direction of receptor) 0.25 Default value – conservative for generic site Dry deposition coefficient 500 m/d Wet deposition coefficient 500 m/d Surface soil density Duration of discharge 260 kg/m2 60 years Buildings nearby yes Building Height 70 m Buildings Surface Area Wall UKP-GW-GL-033 ERICA Default Value. These values are based on a recommendation that a total deposition coefficient for wet and dry deposition 1000 m/d is used for screening purposes for deposition of aerosols and reactive gases [Reference 10] ERICA Default Value. Value typical for crops on non-peat soils with a rooting zone depth of 0-20cm [Reference 9]. Actual values of surface soil density may vary depending on the origin, mineral content and classification of the soil, but uncertainties about soil density are relatively small. Lifetime of Westinghouse PWR plant [Reference 9] Reactor Building [Reference 9] Reactor Building [Reference 9] 2 3000 m Reactor Building [Reference 9] 19 Revision 2 Assessment of Radioactive Discharges on Non-Human Species 4.0 Assessment of Impact of Atmospheric Emissions Table 4-2 TIER 1 RESULTS OF ERICA TOOL ASSESSMENT ON AIR EMISSIONS Isotope Risk Quotient (unitless) H-3 2.26E-04 Detritivorous invertebrate C-14 2.38E-03 Mammal (deer) Mn-54 4.09E-09 Detritivorous invertebrate Co-58 7.17E-08 Mammal (rat) Co-60 1.51E-06 Mammal (rat) Sr-89 1.42E-07 Reptile Sr-90 7.10E-06 Reptile Zr-95 1.72E-09 Detritivorous invertebrate, soil invertebrate (worm) Nb-95 2.53E-09 Mammal (rat) I-133 6.49E-06 Bird egg Cs-134 6.06E-07 Mammal (Deer) Cs-137 2.55E-06 Mammal (Deer) I-131 1.71E-05 Bird egg ∑ Risk Quotients 2.64E-03 UKP-GW-GL-033 Limiting Reference Organism 20 Revision 2 4.0 Assessment of Impact of Atmospheric Emissions Assessment of Radioactive Discharges on Non-Human Species Table 4-3 SENSITIVITY OF THE TIER 1 RESULTS OF ERICA TOOL ASSESSMENT FOR AIR EMISSIONS Scenario Stack Height (m) Wind Speed (ms-1) Distance to Receptor (m) Sum of Risk Quotient (unitless) A 81.626 5 200 2.64E-03 B 39.8 5 200 2.99E-03 C 81.626 1 200 1.32E-02 D 81.626 2 200 6.60E-03 E 81.626 5 200 2.64E-03 F 81.626 10 200 1.32E-03 G 81.626 5 50 5.82E-02 H 81.626 5 100 5.82E-02 I 81.626 5 200 2.64E-03 J 81.626 5 300 1.56E-03 K 39.8 1 50 2.91E-01 UKP-GW-GL-033 21 Revision 2 4.0 Assessment of Impact of Atmospheric Emissions Assessment of Radioactive Discharges on Non-Human Species Table 4-4 INPUT DATA IN THE WILDLIFE DOSE ASSESSMENT SPREADSHEET Parameter Ecosystem Input Comments Terrestrial Concentration Rations Spreadsheet Default Spreadsheet Default Value Occupancy Factor Spreadsheet Default Spreadsheet Default Value 1.0 Spreadsheet Default Value Radiation Weighting Factor Beta/Gamma Emission flow rate 38.13 m3s-1 Westinghouse Design [Reference 9] Argon-41 emission rate 0.360 Bqm-3 Calculated (see Appendix A) Krypton-85 emission rate 1.911 Bqm-3 Calculated (see Appendix A) Distance to receptor 200 m Distance to generic site boundary Wind speed 5.0 m/s Default value – conservative for generic site Fraction of time (wind blowing towards the direction of receptor) 0.25 ERICA Default Value Building Height 70 m Reactor Building [Reference 9] 3000 m2 Reactor Building [Reference 9] Buildings Surface Area Wall UKP-GW-GL-033 22 Revision 2 4.0 Assessment of Impact of Atmospheric Emissions Assessment of Radioactive Discharges on Non-Human Species Table 4-5 OUTPUT DATA IN THE WILDLIFE DOSE ASSESSMENT SPREADSHEET Organism Sum of Ar-41 and Kr-85 Dose Rate per Organism (µGy h-1) Ant 1.1E-04 Bacteria 6.4E-08 Bee 2.3E-04 Bird 1.5E-04 Bird Egg 1.1E-04 Caterpillar 2.6E-04 Earthworm 3.1E-08 Fungi 2.7E-04 Herb 1.7E-04 Lichen 1.4E-04 Mammal (carnivore) 5.7E-05 Mammal (herbivore) 4.9E-05 Reptile 6.3E-05 Rodent 4.6E-05 Seed 2.0E-04 Shrub 1.7E-04 Tree 1.7E-04 Woodlouse 1.4E-04 UKP-GW-GL-033 23 Revision 2 Assessment of Radioactive Discharges on Non-Human Species 5.0 ERICA Tool Assessment – Water Discharges 5.0 ERICA TOOL ASSESSMENT – WATER DISCHARGES 5.1 ERICA Tool Water Discharges Input Data The input data for the ERICA Tier 1 assessment included the discharge data identified in the second column of Table 3-4. These were the isotopes that matched the default isotopes available in the ERICA model at the Tier 1 assessment stage. Other input data includes information shown in Table 5-1. The data for the ERICA Tier 2 assessment included the discharge data for all isotopes identified in the third column of Table 3-4. The additional isotopes in this column were input into the ERICA model together with literature values for the required concentration factors and distribution coefficients. This information is referenced with other input data in Table 5-1. 5.2 ERICA Tool Water Discharges Output 5.2.1 ERICA Tool Water Discharges Tier 1 Output The output of the ERICA Tier 1 assessment of water discharges using the ERICA dose rate screening value of 10 µGyh-1 is shown in Table 5-2. For the Westinghouse predicted operating data the Tier 1 results indicate that the total risk quotient is 1.44 indicating that the ERICA dose rate screening value of 10 µGyh-1 is exceeded for at least one reference organism. Further inspection of Table 5-2 shows that the limiting reference organism is polychaete worms. As the Tier 1 results for the total risk quotient exceed unity, a Tier 2 analysis is carried out. 5.2.2 ERICA Tool Water Discharges Tier 2 Output A Tier 2 analysis was carried out with all isotope data set to predict total dose rates for each reference organism. The Tier 2 results for the ERICA model are presented in Table 5-3. Based on the definition in Section 3.2.2, the Tier 2 results indicate “negligible risk” to wading birds, zooplankton, pelagic fish and phytoplankton at distances greater than 100m from the point of release. The results for mammals and reptiles indicate “insufficient confidence” to be sure that there will be negligible effect on these organisms which live within the sediment. The results for polychate worms, macroalgae, sea anemonies or true corals – polyps and colonies, benthic molluscs, vascular plants, benthic fish and crustaceans show that the ERICA screening dose rate of 10 µGyh-1 is exceeded. The maximum predicted dose rate for all organisms is 25.2 µGyh-1 is for polychaete worms. Table 5-3 shows that the isotopes responsible for the ERICA screening dose rate being exceeded either Fe-59 or Fe-55. Iron partitions strongly into the sediment phase and the organisms experiencing dose rates greater than the ERICA screening dose rate of 10 µGyh-1 are the ones that have high occupancy factors in the sediment or at the sediment-water interface. The dose rates are well below the 400 µGyh-1 which is the higher threshold derived from the IAEA (1992) and UNSCEAR (1996) reports and are really benchmarks below which populations are unlikely to be significantly harmed based on reviews of the scientific literature [References 11 and 12]. These also correspond to the US DoE dose limit of 10 mGyd-1 (≈ 400 µGyh-1) for native aquatic animals [Reference 13]. UKP-GW-GL-033 24 Revision 2 Assessment of Radioactive Discharges on Non-Human Species 5.0 ERICA Tool Assessment – Water Discharges 5.2.3 Sensitivity of ERICA Tool Tier 2 Outputs for Water Discharges to Sea The sensitivity of the Tier 2 results to changes in input parameters has been investigated for variations in water depth, distance between release point and shore, distance between release point and receptor and coastal current. The results are shown in Table 5-4. Scenario A represents the default scenario which matches the results in Table 5-2 and 5-3. Scenarios A-D show the effect of changing water depth. The dose rate decreases with increasing water depth. At a depth of 7m only polychaete worms dose date exceeds the ERICA screening dose rate of 10 µGyh-1 (Scenario C). At a depth of 13m and the dose rate to polychaete worms drops to below the ERICA screening dose rate and changes to a ‘insufficient confidence’ condition, where the conservative risk quotient exceeds 1. Scenarios A and E-G show that changing the distance between the release point and the shore has no effect on dose rates on organisms 100m from the discharge point at sea. Scenarios A and H-K show the effect of changing the distance between the release point and the receptor. The ERICA screening dose rate is exceeded for at least one organism at all distances between the release point and receptor up to 220m (Scenario J). At 220m the most sensitive organism, polychate worms, falls into the ‘insufficient confidence’ category together with seven other organisms. At 560m (Scenario K) and beyond the dose rates for all organisms fall into the ‘negligible’ category indicating negligible risk. Scenarios A and L-N show the effect of changing the coastal current. The predicted dose rates decrease slightly as the coastal current decreases from 0.5 ms-1 to 0.05 ms-1. The number of organisms receiving dose rates above the ERICA screening level falls from eight to six as the coastal current decreases. Scenario O shows the worst case combination of variables from the scenarios selected above (i.e. water depth 2m, the distance between the release point and the shore 150m, the distance between the release point and the receptor 50m and the coastal current 0.5 ms-1). The results predict that the ERICA screening dose rate is exceeded for eleven organisms with the highest predicted dose rate of 191 μGyh-1being experienced by polychaete worms. Scenario P shows the best case combination of variables from those selected above (i.e. water depth 13m, the distance between the release point and the shore 150m, the distance between the release point and the receptor 560m and the coastal current 0.05 ms-1). The results produce a ‘negligible’ risk condition for all organisms. The sensitivity analysis confirms that polychaete worms are the most vulnerable organism, experiencing the highest dose rates. This is because polychaete worms are the only organism that resides entirely within the sediment and the dominant source of radioactive dose is from Fe-59 and Fe-55 (see Table 5-3) which partitions strongly into sediments. The range of dose rates predicted for polychaete worms in this sensitivity analysis is 3.27 μGyh-1 to 191 μGyh-1. Organisms with occupancy factors of 100% at the sediment water interface (benthic molluscs, crustacean, macroalgae, benthic fish, sea anemones or true corals – colony and polyps and vascular plants) experience the next highest dose rates ranging from 0.5 μGyh-1 to 103 μGyh-1. Mammals, wading birds and reptiles have 100% occupancy factors in water, but food sources may be within the sediment or at the sediment – water interface. These organisms receive a range of dose rates under the scenarios considered of 0.1 μGyh-1 to 26 μGyh-1. UKP-GW-GL-033 25 Revision 2 Assessment of Radioactive Discharges on Non-Human Species 5.0 ERICA Tool Assessment – Water Discharges The organisms which experience the lowest dose rates fall within the ‘negligible’ risk category for all scenarios. These are pelagic fish, phytoplankton and zooplankton which have 100% occupancy factors in water with no habitation within the sediment surface or sediment zones. These organisms receive a range of dose rates under the scenarios considered of 0.001 μGyh-1 to 0.2 μGyh-1. 5.3 Effects on Marine Organisms Table 5-5 summarises the effects on organisms of radiation dose rates reported in the ERICA tool. The table only identifies the effects where the total dose rate per organism is within or below the predicted dose rate range from the scenarios in Section 5.2.3. A comparison of the reported effects with dose rates from Scenario A, O and P is made in Table 5-5. The following observations can be made: The worst case dose rate for wading birds (20.04 µGyh-1) exceeds the dose rate of 10 µGyh-1 where an increase in infestations with parasites (feather and gastroenterine) was observed in grouse. The expected dose rate for benthic fish (11.5 µGyh-1) is above the dose rate observed to have detrimental effects on tilapia, bleak and salmon. The worst case dose rate for benthic fish (85.9 µGyh-1) is also above the threshold of reported detrimental effects of pike and silver bream There are no reported adverse effects on benthic molluscs or crustaceans at the expected dose rate or worst case dose rates The expected dose rate (13.4 µGyh-1) and worst case dose rate (103 µGyh-1) for macroalgae exceed the dose rate of 2.41 µGyh-1 where blue green algae (synechococcus lividus) experience a minor stimulating effect on growth (1.2-fold). The worst case dose rate for mammals (26 µGyh-1) exceeds the dose rate of 10 µGyh-1 where detrimental effects on mice and otters are observed. The worst case dose rate for pelagic fish (0.287µGyh-1) is below the dose rate where detrimental effects on fish are reported. The predicted dose rate for polychaete worms (25.2 µGyh-1) is above the 0.83 µGyh-1 level at which Paramecium Aurelia exhibits a moderate increase in cell proliferation (1.8-fold) and the 14.0 µGyh-1 where Dero obtuse experience a moderate increase in cytogenetic damage in somatic cells. The predicted dose rate is below the no observed effect dose rate (85 µGyh-1) for new growth on sponge. The predicted dose rate for vascular plants (12.2 µGyh-1) exceeds the dose rate of 2.41 µGyh-1 where blue green algae (synechococcus lividus) experience a minor stimulating effect on growth (1.2-fold). There is no reported data for a dose rate comparison to be carried out with reptiles, sea anemonies or true corals, phytoplankton and zooplankton UKP-GW-GL-033 26 Revision 2 UKP-GW-GL-033 ERICA Default Concentration Ratios (check boxes 1,2,3,5 and 7 activated) supplemented with literature data from IAEA for additional isotopes at Tier 2 (Reference 14). IAEA SRS-19 coastal model Media activity concentration 3 Uncertainly factor (UF) -1 10 Gyh Marine Input Dose rate screening value Ecosystem Parameter Table 5-1 Assessment of Radioactive Discharges on Non-Human Species 27 Revision 2 The activity concentrations of radionuclides in biota within the ERICA tool are predicted from media activity concentrations using equilibrium concentration ratios (CRs). For the marine environment these are based on the ratio of whole body to filtered water activity concentrations. The default radioecology databases within the ERICA tool were used to provide CR values for all reference organisms. The CRs used in the ERICA default database are comprehensive, drawing on an extensive review of published literature and characterised by statistical information. Where there is no published data for particular reference organism-radionuclide combinations, the ERICA tool adopts a standard procedure to derive the best CR values. This procedure requires information to be selected from various other sources prioritised in the following order: 1) Similar taxonomy 2) Similar reference organism 3) From published reviews 4) Specific activity models 5) Similar biogeochemistry 6) Similar biogeochemistry and taxonomy 7) Similar biogeochemistry and reference organism 8) Allometric or other modelling approaches 9) highest available value 10) Reference organism in a different ecosystem 11) Combination of approaches. In order to completely populate the CR database for Tier 2 analysis with default ERICA values, it was necessary to check boxes that incorporated information from the following sources above: 1), 2), 3), 5) and 7). For isotopes Na, Cr, Fe, Zn, Y, and Ba CR data for fish, crustacean, mollusc, macroalgae, zooplankton, phytoplankton and seal were obtained from IAEA (Reference 14) and extrapolated to other species. For Mo fish and shellfish data were obtained from IAEA (Reference 10) and extrapolated between species. Y data was substituted for missing La and Ce data substituted for missing Pr data. Generic dispersion model within ERICA. Established internationally recognised methodology. Provides consistency, allowing comparison between different assessments. May be overly conservative. The method using uncertainty factors is based on the assumption that the estimated doses, and RQs, are exponentially distributed, which is supported by the principle of maximum entropy. Under these circumstances a UF of 3 establishes a 5% probability of exceeding the dose screening value. ERICA dose rate screening value Appropriate for evaluating impact of water discharges to sea Comments INPUT DATA IN THE ERICA TIER 1 AND TIER 2 ASSESSMENT OF WATER EMISSIONS 5.0 ERICA Tool Assessment – Water Discharges ERICA Default 10.0 1.0 3.0 5m Radiation Weighting Factor Alpha Radiation Weighting Factor – Beta/Gamma Radiation Weighting Factor – Low beta Water depth (Chart Datum) ERICA default data at Tier 1 supplemented with literature data from IAEA for additional isotopes at Tier 2 (Reference 14) Distribution Coefficients Occupancy Factor Input Parameter UKP-GW-GL-033 Table 5-1 (cont.) Assessment of Radioactive Discharges on Non-Human Species 28 Generic site information [Reference 7] Revision 2 For a given unweighted absorbed dose rate, α-radiation may result in a more significant effect than β- or γ-radiation. Radiation weighting factors are introduced to account for the relative biological effectiveness of these different types of radiation. The radiation weighting factors used in ERICA have been adopted from FASSET. They have always been considered provisional values, applied for demonstration purposes only and their application therefore is arguably unsubstantiated. They might be considered conservative values. The occupancy factor, the fraction of time that the aquatic organism spends at a specified location in its habitat (e.g. on water surface / in water / at water sediment interface / in sediment). The ERICA default occupancy factors have been selected to maximise the dose, such as those selected for the location in the habitat where highest doses might be expected. This may lead to an overestimation of the dose rate in some cases. For aquatic environments, the distribution coefficient (Kd) is used to relate equilibrium activity concentrations in sediments with those in water. However, it is recognised that the Kd values are mostly poorly defined statistically, but they are used in the absence of a specific site selection and site-specific Kd values. Comments INPUT DATA IN THE ERICA TIER 1 AND TIER 2 ASSESSMENT OF WATER EMISSIONS 5.0 ERICA Tool Assessment – Water Discharges Input 150 m 100 m 0.1 m/s Parameter Distance between release point and shore Distance between release point and receptor Coastal current UKP-GW-GL-033 Table 5-1 (cont.) Assessment of Radioactive Discharges on Non-Human Species 29 Revision 2 Default value recommended for use when site specific information is not available [Reference 10] Assumed distance to nearest population of marine organisms of concern Assumed value Comments INPUT DATA IN THE ERICA TIER 1 AND TIER 2 ASSESSMENT OF WATER EMISSIONS 5.0 ERICA Tool Assessment – Water Discharges Assessment of Radioactive Discharges on Non-Human Species 5.0 ERICA Tool Assessment – Water Discharges Table 5-2 TIER 1 RESULTS OF ERICA TOOL ASSESSMENT ON WATER DISCHARGES Isotopes Risk Quotient (unitless) Limiting Reference Organism H-3 1.78E-03 Phytoplankton C-14 9.61E-03 Wading bird, reptile Mn-54 1.70E-01 Polychaete worm Co-58 3.86E-01 Polychaete worm Co-60 5.50E-01 Polychaete worm Ni-63 2.31E-04 Benthic mollusc Sr-89 1.57E-06 Sea anemones or true corals – colony Sr-90 3.06E-07 Sea anemones or true corals – colony Zr-95 3.32E-02 Polychaete worm Nb-95 1.18E-02 Polychaete worm Ru-103 8.15E-03 Phytoplankton Ag-110m 2.83E-03 Reptile I-131 4.44E-05 Macroalgae I-132 1.33E-04 Vascular plant I-133 1.61E-04 Macroalgae Cs-134 1.50E-04 Polychaete worm Cs-136 2.51E-04 Polychaete worm Cs-137 1.71E-04 Polychaete worm Ce-144 2.69E-01 Polychaete worm Pu-241 4.35E-07 Phytoplankton ∑ Risk Quotients 1.44+00 UKP-GW-GL-033 30 Revision 2 Assessment of Radioactive Discharges on Non-Human Species 5.0 ERICA Tool Assessment – Water Discharges Table 5-3 TIER 2 RESULTS OF WATER DISCHARGES USING THE ERICA DOSE RATE SCREENING VALUE Organism Total Dose Rate per Organism (µGyh-1) Dominant Sources of Dose Rate Isotope % Dose RQ (expected value) (unitless) RQ (conservative value) (unitless) Polychaete worm 2.52E+01 Fe-59 Co-60 Co-58 76% 7% 5% 2.52E+00 7.57E+00 Macroalgae 1.34E+01 Fe-59 Co-60 Co-58 72% 7% 5% 1.34E+00 4.02E+00 Sea anemones or true corals – polyp 1.31E+01 Fe-59 Co-60 Co-58 73% 7% 5% 1.31E+00 3.92E+00 Benthic mollusc 1.23E+01 Fe-59 Co-60 Co-58 77% 7% 5% 1.23E+00 3.70E+00 Vascular plant 1.22E+01 Fe-59 Co-60 Co-58 77% 7% 5% 1.22E+00 3.65E+00 Benthic fish 1.15E+01 Fe-59 Co-60 Co-58 78% 8% 5% 1.15E+00 3.44E+00 Sea anemones or true corals – colony 1.13E+01 Fe-59 Co-60 Co-58 77% 8% 5% 1.13E+00 3.39E+00 Crustacean 1.10E+01 Fe-59 Co-60 Co-58 79% 8% 5% 1.10E+00 3.30E+00 Mammal 3.51E+00 Fe-55 Fe-59 C-14 65% 34% 1% 3.51E-01 1.05E+00 Reptile 3.50E+00 Fe-55 Fe-59 C-14 65% 33% 1% 3.50E-01 1.05E+00 (Wading) bird 2.76E+00 Fe-55 Fe-59 C-14 83% 16% 1% 2.76E-01 8.28E-01 Zooplankton 9.09E-02 Fe-55 C-14 Ru-103 56% 20% 6% 9.09E-03 2.73E-02 UKP-GW-GL-033 31 Revision 2 Assessment of Radioactive Discharges on Non-Human Species 5.0 ERICA Tool Assessment – Water Discharges Table 5-3 (cont.) TIER 2 RESULTS OF WATER DISCHARGES USING THE ERICA DOSE RATE SCREENING VALUE Organism Total Dose Rate per Organism (µGyh-1) Dominant Sources of Dose Rate Isotope % Dose RQ (expected value) (unitless) RQ (conservative value) (unitless) Pelagic fish 3.87E-02 Fe-55 H-3 C-14 57% 13% 12% 3.87E-03 1.16E-02 Phytoplankton 3.23E-02 Fe-55 H-3 Fe-59 88% 7% 4% 3.23E-03 9.69E-03 UKP-GW-GL-033 32 Revision 2 Table 5-4 Assessment of Radioactive Discharges on Non-Human Species 5 2 7 13 5 5 5 5 5 5 5 Scenario A B C D E F G H I J K UKP-GW-GL-033 Water Depth (m) 150 150 150 150 200 100 50 150 150 150 150 Distance Between Release Point and Shore (m) 560 220 80 50 100 100 100 100 100 100 100 0.1 0.1 0.1 0.1 0.1 0.1 0.1 0.1 0.1 0.1 0.1 Distance Between Release Coastal Point and Current Receptor (m) (ms-1) 3.27 9.87 32.9 57.5 25.2 9.71 18.0 63.1 25.2 33 Total Dose Rate (µGyh-1) 0 0 8 (PW, Ma, SAp, BM, VP, BF, SAc, Cr) 0 8 (PW, Ma, SAp, BM, VP, BF, SAc, Cr) 3 (Mm, Re, WB) 2 (Mm, Re) 8 (PW, Ma, SAp, BM, VP, BF, SAc, Cr) All Revision 2 6 (WB, Zo, PF, Ph, Mm, Re) 3 (Zo, PF, Ph) 4 (WB, Zo, PF, Ph) 6 (WB, Zo, PF, Ph, Mm, Re) 8 (PW, Ma, SAp, BM, VP, BF, SAc, Cr) 0 3 (Zo, PF, Ph) 6 (WB, Zo, PF, Ph, Mm, Re) 3 (Mm, Re, WB) 8 (PW, Ma, SAp, BM, VP, BF, SAc, Cr) 4 (WB, Zo, PF, Ph) No. Organisms “Negligible Risk” 7 (Ma, SAp, BM, VP, BF, SAc, Cr) 2 (Mm, Re) 8 (PW, Ma, SAp, BM, VP, BF, SAc, Cr) 1 (PW) No. Organisms “Insufficient Confidence” No. Organisms Greater with than ERICA Screening Value SENSITIVITY OF THE TIER 2 RESULTS OF ERICA TOOL ASSESSMENT FOR WATER DISCHARGES TO SEA 5.0 ERICA Tool Assessment – Water Discharges Water Depth (m) 5 5 5 2 13 Scenario L M N O P Mammal Vascular Plant Mm VP UKP-GW-GL-033 Wading Bird WB Key: Table 5-4 (cont.) Assessment of Radioactive Discharges on Non-Human Species Zo PF BF 150 150 150 150 150 Distance Between Release Point and Shore (m) Zooplankton Pelagic Fish Benthic Fish 560 50 100 100 100 Sac Ph BM 0.05 0.5 0.5 0.2 0.05 Distance Between Release Coastal Point and Current Receptor (m) (ms-1) 34 Sea Anemones or true corals Phytoplankton 0 Sac PW Cr Re Ma Revision 2 Reptile Macroalgae All 3 (Zo, PF, Ph) 3 (Zo, PF, Ph) 4 (Zo, PF, Ph, WB) 6 (WB, Zo, PF, Ph, Mm, Re) No. Organisms “Negligible Risk” Sea Anemones or true corals – polyp Polychaete Worm Crustacean 0 0 11 (PW, Ma, SAp, BM, VP, BF, SAc, Cr, Mm, Re, WB) 2 (Mm, Re) 8 (PW, Ma, SAp, BM, VP, BF, SAc, Cr) 3 (Mm, Re, WB) 4 (Mm, Re, SAc, Cr) 6 (PW, Ma, SAp, BM, VP, BF, SAc, Cr) 8 (PW, Ma, SAp, BM, VP, BF, SAc, Cr) No. Organisms “Insufficient Confidence” No. Organisms Greater with than ERICA Screening Value Benthic Mollusc 1.7 191 33.9 28.7 22.1 Total Dose Rate (µGyh-1) SENSITIVITY OF THE TIER 2 RESULTS OF ERICA TOOL ASSESSMENT FOR WATER DISCHARGES TO SEA 5.0 ERICA Tool Assessment – Water Discharges UKP-GW-GL-033 16.6 µGyh-1 16.6 µGyh-1 16.6 µGyh-1 12.5 µGyh-1 35 Revision 2 Aquarium Fish (Tilapia mossambica) – No statistical effect on spawning Aquarium Fish (Tilapia mossambica) – Weak stimulating effect on fertility (no value given) Plaice – No statistical effect on percentage of successful hatching Plaice – No statistical effect on the percentage of abnormal larvae Carp – No statistical effect on phagocytic response of leucocytes to infection Bleak – Severe effect on ovary development (supression) (no value given) Salmon – Major decrease in concentrations of erythrocytes (50-60%) Salmon – Moderate effect on the amount of primary sex cells in embryos (1.5-1.8-fold) Rainbow Trout – No statistical effect on the number of fish egg deaths before hatching Salmon – Moderate increase in number of primary sex cells in embryos (1.5-1.8-fold) Pike – No statistical effect on the survival of irradiated embryos Pike – Minor increase in the number of defective anaphases and telophases in cells of irradiated embryos (1.4-fold) Pike – No statistical effect on cells with fragments in irradiated embryos Silver Bream – No statistical effect on chromosomal aberrations in fish eggs Silver Bream – Moderate increase in number of chromosomal aberrations for abnormal embryos (1.9-fold) Silver Bream – Severe increase in number of chromosomal aberrations for abnormal larvae (4.3-fold) Aquarium Fish (Tilapia mossambica) – No statistical effect on mortality due to experimental infection with parasites Aquarium Fish (Tilapia mossambica) – Moderate shortening of lifetime of exposed fish (24%) Silver Carp – Moderate increase in numbers of sex cells with anomalies (25%) in comparison to the control (0.25%) 0.16 µGyh-1 0.16 µGyh-1 0.53 µGyh-1 0.53 µGyh-1 1.38 µGyh-1 3.08 µGyh-1 3.58 µGyh-1 3.58 µGyh-1 5.41 µGyh-1 7.08 µGyh-1 12.5 µGyh-1 12.5 µGyh-1 11.5 (0.77-85.9) Benthic Fish 12.5 µGyh-1 12.5 µGyh-1 12.5 µGyh-1 Small Grouse – No statistically significant effect on weight of birds Large Grouse – Increase in infestations with parasites of feather and gastroenterine (no value given) 10.0 µGyh-1 10.0 µGyh-1 2.76 (0.186-20.04) Reported Effects on Organisms where Total Dose Rate per Organism is within or Below the Predicted Dose Rate Range (Reference 1) EFFECTS ON MARINE ORGANISMS Table 5-5 Assessment of Radioactive Discharges on Non-Human Species (Wading) Bird Organism Total Dose Rate per Organism(1) (µGyh-1) 5.0 ERICA Tool Assessment – Water Discharges UKP-GW-GL-033 Revision 2 Aquarium Fish (Tilapia mossambica) – No statistical effect on spawning Aquarium Fish (Tilapia mossambica) – Weak stimulating effect on fertility (no value given) 0.16 µGyh-1 0.16 µGyh-1 36 Otter- Minor decrease of body weight (10% reduction). No statistically significant effect on hair density Otter- Moderate decrease of otter population density (33% reduction) Mice- No statistically significant effect on body weight Mice- Significant increase of life span (1.3 times the control value) 10.0 µGyh-1 3.51 (0.237 – 26) Mammal 0.0387 (0.00261 – 0.287) Blue green algae (Synechococcus lividus) – Minor stimulating effect on growth (1.2-fold) 2.41 µGyh-1 13.4 (0.9 – 103) Macroalgae Pelagic Fish Lobster – No statistically significant effect on DNA strand breakage 0.58 µGyh-1 11.0 (0.729 – 81.9) Crustacean 10.0 µGyh-1 16.0 µGyh-1 16.0 µGyh-1 No statistically significant effect on the frequency of abnormal larvae regardless of the rearing temperature (20, 24 and 28 ºC). Irradiation began as gamete zygote (2-cell) or locating blastula stage and continued until 48hr post fertilisation (Pacific oyster Crassostrea gigas) 16.7 µGyh-1 Brown Trout – No statistical effect on the percentage of abnormal larvae Carp – No statistical effect on bacteriostatic properties of blood serum in the period from 30 up to 180 days of radiation exposure Perch – No statistical effect on bacteriostatic properties of blood serum in the period from 30 up to 180 days of radiation exposure Carp – No statistical effect on the level of chromosomal aberrations on epithelium of eye cornea in comparison with control Pike – Majority increase in the number of variable anaphases in larvae in comparison with the control (2.5-fold) 12.3 (0.829-92.9) 54.16 µGyh-1 41.66 µGyh-1 40.41 µGyh-1 28.8 µGyh-1 37.5 µGyh-1 Reported Effects on Organisms where Total Dose Rate per Organism is within or Below the Predicted Dose Rate Range (Reference 1) EFFECTS ON MARINE ORGANISMS Table 5-5 (cont.) Assessment of Radioactive Discharges on Non-Human Species Benthic Molluscs Organism Total Dose Rate per Organism(1) (µGyh-1) 5.0 ERICA Tool Assessment – Water Discharges 2.41 µGyh-1 12.2 (0.819 – 91.60) Vascular plant UKP-GW-GL-033 1. 37 Revision 2 Blue green algae (Synechococcus lividus) – Minor stimulating effect on growth (1.2-fold) Predicted total dose rate from Scenario A and predicted range in total dose rate from Scenario P and Scenario O (in brackets) No data 13.1 (0.878 – 99.7) No data Sea anemones or true corals – polyps Note Paramecium Aurelia – Moderate increase in cell proliferation at radiation levels below normal background levels – achieved using lead shielding (1.8-fold) Dero obtuse – Moderate increase in cytogenetic damage in somatic cells (e.g. single & double fragments, single bridges) (1.8-fold) Sponge – No observed effect on growth of new tissue No data in FREDERICA for effects observed at this dose rate range 85 µGyh-1 14.0 µGyh-1 0.83 µGyh-1 Assessment of Radioactive Discharges on Non-Human Species Reported Effects on Organisms where Total Dose Rate per Organism is within or Below the Predicted Dose Rate Range (Reference 1) EFFECTS ON MARINE ORGANISMS Table 5-5 (cont.) No data in FREDERICA for effects observed at this dose rate range 11.3 (0.76 – 85) 3.5 (0.236 – 25.9) 25.2 (1.7 – 191) 0.0323 (0.00217 – 0.241) Sea anemones or true corals – colony Reptile Polychaete Worm Phytoplankton Organism Total Dose Rate per Organism(1) (µGyh-1) 5.0 ERICA Tool Assessment – Water Discharges Assessment of Radioactive Discharges on Non-Human Species 6.0 Conclusions 6.0 CONCLUSIONS The impact of the atmospheric emissions of the AP1000 NPP on terrestrial non-human species has been assessed using the ERICA model at Tier 1 and the Wildlife Dose Assessment Spreadsheet. The results indicate the emissions will cause negligible impact on the errestrial organisms living beyond the predicted site boundary 200m distant from the source. The ERICA tool has also been used at Tier 1 and Tier 2 level to assess the impact of water discharges from the AP1000 NPP to the marine environment. The model predicts that there is negligible risk to pelagic organisms that live within the water column (pelagic fish, phytoplankton and zooplankton). However, the ERICA screening dose rate of 10.0 µGyh-1 is exceeded for the selected generic site conditions for organisms that live within the sediment or at the sediment – water interface (polychaete worms, macroalgae, sea anemonies or true coral polyps and colonies, benthic molluscs, crustacean, vascular plants and benthic fish). Sensitivity analysis of the ERICA results confirms that polychaete worms are the most vulnerable organism. These organisms live within the sediment. Comparison with published radiation dose effects on marine organisms indicates that there may be some adverse effects from the AP1000 NPP discharges. However, the predicted dose rates are well below the 400 µGyh-1 which is a benchmark derived from the IAEA (1992) and UNSCEAR (1996) reports below which populations are unlikely to be significantly harmed based on reviews of the scientific literature [References 11 and 12]. This also corresponds to the US DoE dose limit of 10 mGyd-1 (≈ 400 µGyh-1) for native aquatic animals [Reference 13]. The models will need to be run again to predict the impact at any specific site where the input parameters and reference organisms relating to the site and the protected species may differ from those assumed for the generic site. UKP-GW-GL-033 38 Revision 2 Assessment of Radioactive Discharges on Non-Human Species 7.0 References 7.0 REFERENCES 1. D-ERICA: An integrated approach to the assessment and management of environmental risks from ionising radiation. Description of purpose, methodology and application. ERICA, 1st February 2007 2. Impact Assessment of Ionising Radiation in Wildlife, R&D Publication 128, Environment Agency, June 2001 3. 1992 EC Habitats Directive: Council Directive 92/43/EEC of 21 May 1992 on the conservation of natural habitats and of wild fauna and flora. Official Journal L 206, 22/07/1992 P. 0007 – 0050. 4. The Conservation (Natural Habitats, &c.) Regulations 1994. Statutory Instrument 1994 No. 2716. HMSO 5. The Conservation (Natural Habitats, &c.) (Amendment) Regulations 2007. Statutory Instrument 2007 No. 1843 6. Countryside and Rights of Way Act 2000 7. UKP-GW-GL-025, Rev. 1, “Characteristics of a Generic Site for a Nuclear Power Station,” Westinghouse Electric Company LLC, 2010 8. Design Basis Estimates for Monthly Discharges of Gaseous and Liquid Radioactive Waste. Sections 3.3.10.2 and 3.4.5.2, UK AP1000 Environment Report UKP-GW-GL-790, Westinghouse Electric Company LLC 9. EPS-GW-GL-700, Rev. 1, “AP1000 European Design Control Document,” Westinghouse Electric Company LLC, 2009 10. Generic Models for Use in Assessing the Impact of Discharges of Radioactive Substances to the Environment, Safety Report Series No. 19, International Atomic Energy Agency, Vienna 2001 11. Effects of Ionising Radiation on Plants and Animals at Levels implied by Current Radiation Protection Standards. Technical Report Series No. 332. IAEA, Vienna, 1992. 12. Effects of radiation on the environment. In: Sources and Effects of Ionising Radiation. United Nations Scientific Committee on the Effects of Atomic Radiation. UNSCEAR Report to the General Assembly, with Scientific Annex. United Nations, New York, 1996 13. Radiation protection of the public and the environment. Order 5400.5, US Department of Energy, 1993 14. Sediment Distribution Coefficients and Concentration factors for Biota in the Marine Environment, IAEA Technical Report Series No. 422, IAEA, 2004 UKP-GW-GL-033 39 Revision 2 Assessment of Radioactive Discharges on Non-Human Species Appendix APPENDIX A CALCULATION OF AR-41 AND KR-85 RECEPTOR CONCENTRATIONS The Argon-41 and Krypton-85 concentrations in air at the receptor (used in Table 4-4) have been calculated using equations based on a version of a Gaussian plume model [Equation 4 to 6 from Reference 10]. The selected equations are the same as those built into the ERICA tool for an emission point that is in the lee of a building inside the wake zone, as defined by: H ≤ 2.5HB and χ ≥ 2.5AB0.5 where: H is the stack release height (81.626m) HB is the building height (70m) χ is the distance to the receptor (200m) AB is the surface area of the building wall (3000m2) Equations: The equations are as follows: Equation 4 CA = (Pp B Qi)/ua where CA is concentration at receptor (Bqm-3) Pp is fraction of time wind blows towards receptor (0.25) B Qi ua is diffusion factor (m-2), see Equation 5 Release rate (Bqs-1) geometric mean wind speed (5 ms-1) Equation 5 B = 12 / (2π3)0.5 x 1 / (χΣz) where Σz is from Equation 6 Equation 6 Σz = (σz2 + AB / π)0.5 for χ ≥ 2.5AB0.5 where σz is the vertical diffusion parameter (m) σz = EχG where E = 0.265 and G = 0.818 for release heights > 80m UKP-GW-GL-033 40 Revision 2 Assessment of Radioactive Discharges on Non-Human Species Appendix Numerically: σz = EχG Σz = (σz2 + AB / π)0.5 for χ ≥ 2.5AB0.5 3 0.5 B = 12 / (2π ) x 1 / (χΣz) 0.265 x 2000.885 = 28.82 m (28.822 + 3000/π)0.5 = 42.26 m 12 / (2π3)0.5 x 1 / (200 x 42.26) = 1.803E-04 m-2 For Argon-41: Qi = 3.99E+04 Bqs-1 (See Table 3-3) CA = (Pp B Qi) / ua (0.25 x 1.803E-04 x 3.99E+04) / 5 = 0.360 Bqm-3 The concentration of Argon-41 at the receptor distance of 200m is calculated to be 0.360 Bqm-3 For Krytpon-85: Qi = 2.12E+05 Bqs-1 (See Table 3-3) CA = (Pp B Qi) / ua (0.25 x 1.803E-04 x 2.12E+05) / 5 = 1.911 Bqm-3 The concentration of Krypton-85 at the receptor distance of 200m is calculated to be 1.911 Bqm-3 UKP-GW-GL-033 41 Revision 2


© Copyright 2026