
DOCUMENT COVER SHEET UKP-GW-GL-790 4
F-3.4.1-1 Rev 6 DOCUMENT COVER SHEET DOCUMENT NO. REVISION UKP-GW-GL-790 DOCUMENT STATUS: TDC: PAGE 4 PRE CFC ASSIGNED TO 1 of 403 CAE Permanent File: DES OPEN ITEMS (Y/N) W-Russ N Westinghouse Acceptance of AP1000 Design Partner Document by: N/A (Name and Date) ALTERNATE DOCUMENT NUMBER: N/A WORK BREAKDOWN #: N/A ORIGINATING ORGANIZATION: Westinghouse Electric Company LLC TITLE: UK AP1000 Environment Report ATTACHMENTS: N/A DCP/DCA/SUPPLEMENTS/EDCR # INCORPORATED IN THIS DOCUMENT REVISION: N/A CALCULATION/ANALYSIS REFERENCE: N/A ELECTRONIC FILENAME UKP-GW-GL-790 ELECTRONIC FILE FORMAT M/S Word ELECTRONIC FILE DESCRIPTION © 2011 WESTINGHOUSE ELECTRIC COMPANY LLC, ALL RIGHTS RESERVED – WESTINGHOUSE NON-PROPRIETARY CLASS 3 All Class 3 Documents require the following two approvals in lieu of a Form 36. LEGAL REVIEW SIGNATURE / DATE (If processing electronic approval select option) L. A. Campagna Electronically Approved*** PATENT REVIEW SIGNATURE / DATE D. E. Ekeroth Electronically Approved*** © 2011 WESTINGHOUSE ELECTRIC COMPANY LLC, ALL RIGHTS RESERVED – WESTINGHOUSE PROPRIETARY CLASS 2 This document is the property of and contains Proprietary Information owned by Westinghouse Electric Company LLC and/or its subcontractors and suppliers. It is transmitted to you in confidence and trust, and you agree to treat this document in strict accordance with the terms and conditions of the agreement under which it was provided to you. *NOTE: This selection is only to be used for Westinghouse generated documents. © 2011 WESTINGHOUSE ELECTRIC COMPANY LLC, ALL RIGHTS RESERVED and/or STONE & WEBSTER, INC. WESTINGHOUSE PROPRIETARY CLASS 2 and/or STONE & WEBSTER CONFIDENTIAL AND PROPRIETARY This document is the property of and contains Proprietary Information owned by Westinghouse Electric Company LLC and/or is the property of and contains Confidential and Proprietary Information owned by Stone & Webster, Inc. and/or their affiliates, subcontractors and suppliers. It is transmitted to you in confidence and trust, and you agree to treat this document in strict accordance with the terms and conditions of the agreement under which it was provided to you. Third Party Provided Information – TREAT AS WESTINGHOUSE PROPRIETARY CLASS 2 Requirements and responsibilities for reviewing, accepting and archiving this information are specified in the appropriate Level II or Level III Procedure. ORIGINATOR(S) WEC 6.1.pdf Larry R. Eisenstatt SIGNATURE / DATE (If processing electronic approval select option) Electronically Approved*** REVIEWER(S) WEC 6.1.pdf Dennis M. Popp SIGNATURE / DATE Electronically Approved*** SIGNATURE / DATE VERIFIER(S) WEC 6.1.pdf Ronald P. Vijuk Plant Applicability: SIGNATURE / DATE SIGNATURE / DATE Electronically Approved*** All AP1000 plants except: Only the following plants: UKP APPLICABILITY REVIEWER WEC 6.1.pdf N/A SIGNATURE / DATE RESPONSIBLE MANAGER* WEC 6.1.pdf Paul A. Russ SIGNATURE / DATE Electronically Approved*** * Verification Method: Independent Review Approval of the responsible manager signifies that the document and all required reviews are complete, the appropriate proprietary class has been assigned, electronic file has been provided to the EDMS, and the document is released for use. *** Electronically approved records are authenticated in the electronic document management system. UKP-GW-GL-790 Rev 4 master 2.doc F-3.4.1-1 Rev 6 Westinghouse Non-Proprietary Class 3 UK AP1000 Environment Report UKP-GW-GL-790, Revision 4 Westinghouse Electric Company LLC 1000 Westinghouse Drive Cranberry Township, PA 16066 Copyright © 2011 Westinghouse Electric Company LLC All Rights Reserved Revision History UK AP1000 Environment Report REVISION HISTORY Revision Description of Change 0 Initial Submittal 1 Added information required by the Process and Information Document for Generic Assessment of Candidate Nuclear Power Plant Designs 2 Complete rewrite and reformatting to incorporate responses to Technical Queries and Regulatory Observations 3 Incorporated responses to later Technical Queries and results of discussions with regulators. Topics include confirmation that the Environment Report is a part of the reference design point, expectations of operating utility mangament system, prevention of contamination, sludge not being expected in WLS tanks due to design, use of enriched boric acid vs. natural boric acid, use of waste storage procedures, solid radwaste estimates being best realistic estimates, decommissioning waste, and comparison of predicted releases to proposed limits. 4 Includes relevant information provided in responses to regulator technical queries and regulatory observations from April to Dec 2010. Incorporates Design Change Proposals APP-GW-GEE-355, Rev. 0; APP-GW-GEE-1078, Rev. 0; APP-GW-GEE-1126, Rev. 0; APP-GW-GEE-1942, Rev. 0; APP-GW-GEE-2043, Rev 1; APP-GW-GEE-2083, Rev. 0; APP-GW-GEE-2084, Rev. 0; APP-GW-GEE-2085, Rev. 0; EPS-GW-GEE-001, Rev. 0; EPS-GW-GEE-004, Rev. 0. Addresses new Westinghouse trademark guidelines. Trademark Notices AP1000 and ZIRLO are trademarks or registered trademarks in the United States of Westinghouse Electric Company LLC, its subsidiaries and/or its affiliates. These marks may be used and/or registered in other countries throughout the world. All rights reserved. Unauthorized use is strictly prohibited. Other names may be trademarks of their respective owners. INCONEL® is a registered trademark of Special Metals, a PCC company. Stellite is a registered trademark of Deloro Stellite Group. UKP-GW-GL-790 ii Revision 4 Table of Contents UK AP1000 Environment Report TABLE OF CONTENTS Section Title Page REVISION HISTORY ................................................................................................................................. ii LIST OF TABLES ........................................................................................................................................ x LIST OF FIGURES ................................................................................................................................... xvi LIST OF ACRONYMS AND TRADEMARKS ....................................................................................... xix 1.0 INTRODUCTION .............................................................................................................. 1 1.1 Need for Nuclear Power ..................................................................................................... 2 1.2 Regulatory Bodies .............................................................................................................. 3 1.3 1.4 1.5 2.0 1.2.1 Regulatory Approach ......................................................................................... 3 1.2.2 Environment Agency (EA) ................................................................................. 3 1.2.3 Health and Safety Executive (HSE) ................................................................... 3 1.2.4 Department for Transport (DfT) ......................................................................... 3 1.2.5 Local Planning Authorities ................................................................................. 4 The Generic Design Assessment Process ........................................................................... 4 1.3.1 Westinghouse AP1000 NPP Generic Design Assessment – Overview of Documentation ................................................................................................... 5 1.3.2 Relationship to Integrated Waste Management Strategy ................................... 6 1.3.3 Relationship to Radioactive Waste Management Case ...................................... 6 Management System........................................................................................................... 6 1.4.1 Westinghouse Management System ................................................................... 6 1.4.2 Licensee’s Management System ........................................................................ 8 1.4.3 Westinghouse Support to a Licensee’s Management System .......................... 10 References......................................................................................................................... 12 GENERIC PLANT DESCRIPTION ................................................................................ 16 2.1 General Facility Information ............................................................................................ 16 2.2 Development of the AP1000 NPP .................................................................................... 16 2.2.1 UKP-GW-GL-790 Design Principles – Safety & Simplicity .......................................................... 16 iii Revision 4 Table of Contents 2.2.2 2.3 2.4 UK AP1000 Environment Report Development of the AP1000 NPP Design........................................................ 17 External Appearance and Layout...................................................................................... 18 2.3.1 Nuclear Island................................................................................................... 18 2.3.2 Turbine Building .............................................................................................. 19 2.3.3 Annex Building ................................................................................................ 19 2.3.4 Diesel Generator Building ................................................................................ 19 2.3.5 Radwaste Building ........................................................................................... 19 2.3.6 Radioactive Waste Stores ................................................................................. 19 2.3.7 Other Buildings and Structures ........................................................................ 20 Reactor Power Conversion System................................................................................... 20 2.4.1 Reactor.............................................................................................................. 21 2.4.2 Steam and Power Conversion System .............................................................. 21 2.4.3 Turbine Generator ............................................................................................ 22 2.5 Engineered Safety Features .............................................................................................. 22 2.6 Best Available Techniques (BAT) Applicable to AP1000 Reactor Design ..................... 22 2.7 2.6.1 Reduction of Containment Penetrations ........................................................... 22 2.6.2 Reactor Coolant Pump Selection ...................................................................... 23 2.6.3 Load Follow with Rods .................................................................................... 24 2.6.4 Chemical and Volume Control System (CVS) ................................................. 24 2.6.5 Use of Demineralisers for Treatment of Reactor Coolant System Let Down ................................................................................................................ 25 2.6.6 Zinc Addition ................................................................................................... 25 2.6.7 Air Diaphragm Waste Pumps ........................................................................... 26 Plant Water Use ................................................................................................................ 26 2.7.1 Circulating Water System (CWS) .................................................................... 26 2.7.2 Service Water System (SWS)........................................................................... 27 2.7.3 Demineralised Water Treatment System (DTS) ............................................... 27 2.7.4 Potable Water System (PWS)........................................................................... 28 UKP-GW-GL-790 iv Revision 4 Table of Contents 2.7.5 2.8 2.9 2.10 3.0 UK AP1000 Environment Report Fire Protection System (FPS) ........................................................................... 28 Transportation of Radioactive Fuel .................................................................................. 28 2.8.1 New Fuel .......................................................................................................... 28 2.8.2 Spent Fuel ......................................................................................................... 29 Radioactive and Non-Radioactive Materials .................................................................... 30 2.9.1 Inventory of Radioactive Materials and Radioactively Contaminated Chemicals ......................................................................................................... 30 2.9.2 Non-Radioactive Chemical Inventory .............................................................. 33 2.9.3 Chemical Storage ............................................................................................. 34 2.9.4 Prevention of Contamination - Chemical Storage Systems.............................. 36 2.9.5 Prevention of Contamination – Radioactive Systems ...................................... 38 References......................................................................................................................... 41 RADIOACTIVE WASTE MANAGEMENT SYSTEMS................................................ 61 3.1 Introduction....................................................................................................................... 61 3.2 Minimization of Waste at Source ..................................................................................... 62 3.3 3.2.1 Fuel Rod Burn-up ............................................................................................. 62 3.2.2 Operational Cycle ............................................................................................. 62 3.2.3 Tramp Uranium ................................................................................................ 62 3.2.4 Fuel Rod/Cladding Design ............................................................................... 62 3.2.5 Materials Selection ........................................................................................... 63 3.2.6 Minimization of Leakage Pathways ................................................................. 63 3.2.7 Control of Reactor Coolant Water Chemistry .................................................. 63 3.2.8 Gray Rods and Burnable Absorber Rods ......................................................... 64 3.2.9 Reactor Coolant Pressure Boundary ................................................................. 64 3.2.10 Reactor Coolant Purification ............................................................................ 65 3.2.11 pH Control with Li7OH ................................................................................... 66 3.2.12 Recycling Steam Generator Blow Down ......................................................... 66 Gaseous Radioactive Waste .............................................................................................. 66 UKP-GW-GL-790 v Revision 4 Table of Contents 3.4 3.5 UK AP1000 Environment Report 3.3.1 Gaseous Radwaste System ............................................................................... 66 3.3.2 HVAC Systems for Radiologically Controlled Areas ...................................... 68 3.3.3 Condenser Air Removal System ...................................................................... 71 3.3.4 Air Emission Release Points ............................................................................ 71 3.3.5 BAT Assessment for Gaseous Radwaste Treatment ........................................ 72 3.3.6 Air Emissions ................................................................................................... 73 3.3.7 Comparison of AP1000 NPP Discharges with Existing Plants ........................ 73 Liquid Radioactive Waste................................................................................................. 74 3.4.1 Sources ............................................................................................................. 74 3.4.2 Storage and Containment of Liquid Radwaste ................................................. 74 3.4.3 Liquid Radwaste System .................................................................................. 75 3.4.4 BAT Assessment for Liquid Radwaste Treatment ........................................... 79 3.4.5 Liquid Effluent Discharges............................................................................... 81 3.4.6 Comparison of AP1000 NPP Liquid Discharges with Other European Pressurised Water Reactors .............................................................................. 82 Solid Radioactive Waste ................................................................................................... 83 3.5.1 Overview of the Integrated Waste Management Strategy ................................ 83 3.5.2 Radioactive Waste Classification ..................................................................... 86 3.5.3 Radioactive Solid Waste Generation ................................................................ 87 3.5.4 Waste Minimisation ......................................................................................... 88 3.5.5 BAT – LLW and ILW ...................................................................................... 90 3.5.6 BAT – HLW ..................................................................................................... 95 3.5.7 Waste Treatment............................................................................................... 96 3.5.8 Interim Storage ............................................................................................... 100 3.5.9 Transportation and Disposal ........................................................................... 104 3.5.10 Decommissioning Waste ................................................................................ 106 3.5.11 Comparison of Waste Volumes from the AP1000 NPP and Other UK NPPs ............................................................................................................... 107 UKP-GW-GL-790 vi Revision 4 Table of Contents 3.6 4.0 UK AP1000 Environment Report References....................................................................................................................... 107 NON-RADIOACTIVE WASTE MANAGEMENT SYSTEMS.................................... 210 4.1 Gaseous Non-Radioactive Waste.................................................................................... 210 4.1.1 4.2 4.3 4.4 5.0 Emission Sources ........................................................................................... 210 Liquid Non-Radioactive Wastes ..................................................................................... 211 4.2.1 Non-Radioactive Waste Water Systems with Off-Site Release ..................... 211 4.2.2 Systems Discharging to the Waste Water System .......................................... 212 4.2.3 Seawater Cooling Systems ............................................................................. 212 4.2.4 Closed Loop Cooling Systems ....................................................................... 214 4.2.5 Chemicals Discharged with Liquid Effluents ................................................. 214 4.2.6 Treatment and Disposal of Non-Radioactive Effluent ................................... 216 4.2.7 Storm Water ................................................................................................... 217 4.2.8 Fire Water ....................................................................................................... 217 Solid Non-Radioactive Waste......................................................................................... 218 4.3.1 Sources ........................................................................................................... 218 4.3.2 Waste Minimization ....................................................................................... 218 4.3.3 Treatment and Disposal .................................................................................. 218 References....................................................................................................................... 218 ENVIRONMENTAL IMPACT...................................................................................... 231 5.1 5.2 Characteristics of the Generic Site.................................................................................. 231 5.1.1 Human Population .......................................................................................... 231 5.1.2 Reference Organisms ..................................................................................... 232 5.1.3 Meteorology ................................................................................................... 232 5.1.4 Terrestrial Environment ................................................................................. 232 5.1.5 Coastal Environment ...................................................................................... 233 Prospective Human Dose Assessment ............................................................................ 234 5.2.1 UKP-GW-GL-790 Approach ........................................................................................................ 234 vii Revision 4 Table of Contents 5.3 5.4 5.5 6.0 UK AP1000 Environment Report 5.2.2 Initial Assessment of Doses Stage 1 ............................................................... 234 5.2.3 Initial Assessment of Doses Stage 2 ............................................................... 236 5.2.4 Total Individual Doses for Comparison with the Discharge Limit and Discharge Constraint ...................................................................................... 238 5.2.5 Potential Short-Term Doses ........................................................................... 238 5.2.6 Collective Dose Assessment........................................................................... 241 5.2.7 Build-up of Radionuclides in the Environment .............................................. 243 Radiological (Non-Human Dose Assessment) ............................................................... 244 5.3.1 ERICA Assessment ........................................................................................ 244 5.3.2 Wildlife Dose Assessment Spreadsheet ......................................................... 248 Accidental Release of COMAH Chemicals.................................................................... 249 5.4.1 Causes of Hydrazine Spills............................................................................. 249 5.4.2 Accidental Hydrazine Spills within the Turbine Building ............................. 249 5.4.3 Accidental Hydrazine Spills outside the Turbine Building ............................ 250 5.4.4 Hydrazine in the Marine Environment ........................................................... 250 5.4.5 Summary of Accidental Hydrazine Release Control Measures ..................... 251 References....................................................................................................................... 252 ENVIRONMENTAL MONITORING ........................................................................... 316 6.1 6.2 Proposed Regulatory Limits ........................................................................................... 316 6.1.1 Selection of Isotopes ...................................................................................... 316 6.1.2 Limits Setting Procedure ................................................................................ 316 6.1.3 Calculated Limits ........................................................................................... 317 6.1.4 Proposed Limits .............................................................................................. 318 Monitoring Programmes ................................................................................................. 318 6.2.1 Radiological Monitoring ................................................................................ 318 6.2.2 Hydrological Monitoring ................................................................................ 324 6.2.3 Ecological Monitoring .................................................................................... 325 6.2.4 Thermal Monitoring ....................................................................................... 325 UKP-GW-GL-790 viii Revision 4 Table of Contents UK AP1000 Environment Report 6.2.5 Chemical Monitoring ..................................................................................... 325 6.2.6 Meteorological Monitoring ............................................................................ 326 6.3 Ground Information Required Before Construction ....................................................... 326 6.4 References....................................................................................................................... 328 7.0 SELECTED CONSIDERATIONS FOR SPECIFIC SITES .......................................... 350 7.1 Commentary on Sites with Multpile AP1000 NPP Units ............................................... 350 7.2 Use of Cooling Towers for the Service Water System ................................................... 350 7.3 References....................................................................................................................... 351 Appendix A Waste Arisings 352 A1 Identification of Waste Arisings from Solid, Liquid, and Gaseous Radioactive Sources 353 A2 Identification of Waste Arisings from Primary System Components 356 A3 Estimated Radwaste Arising from Large-Volume Components at Decommissioning 368 A4 Estimated Radwaste Arising from Small-Volume Components at Decommissioning 377 A5 Key for Preconditioning and Disposal Methods 379 A6 Steel and Concrete Rubble from Demolishing Various Modules 380 UKP-GW-GL-790 ix Revision 4 Table of Contents UK AP1000 Environment Report LIST OF TABLES Table 1.3-1 Relationship Between Environment Report and Process and Information Document Reference Issues .............................................................................................. 14 Table 2.9-1 Chemical Inventory on AP1000 NPP Turbine Island ....................................................... 42 Table 2.9-2 Chemical Inventory on AP1000 NPP Nuclear Island ....................................................... 44 Table 2.9-3 Chemical Inventory on Seawater Nuclear Island.............................................................. 44 Table 2.9-4 AP1000 NPP Chemicals that are List I and II Substances Under the Groundwater Directive ........................................................................................................................... 45 Table 2.9-5 AP1000 NPP Non-Radioactive Effluent Components that are List I and II Substances Under the Dangerous Substances Directive ................................................... 45 Table 2.9-6 AP1000 NPP Chemical System Tanks and Secondary Containment ............................... 46 Table 3.1-1 Nuclear BAT Management Factors and AP1000 NPP Features .................................... 111 Table 3.3-1 AP1000 NPP Estimated Operational Gaseous Radwaste Arising from System Operations ....................................................................................................................... 112 Table 3.3-2 Abatement Provisions For HVAC Systems .................................................................... 113 Table 3.3-3 Specification of Containment Filtration System Elements ............................................. 114 Table 3.3-4 Main Plant Vent Release Point Data............................................................................... 115 Table 3.3-5 Condenser Air Removal Stack Release Point Data ........................................................ 115 Table 3.3-6 Expected Annual Release of Airborne Radioiodines to the Atmosphere ....................... 116 Table 3.3-7 Expected Annual Release of Radioactive Noble Gases, Tritium, and Carbon-14 to the Atmosphere ........................................................................................................... 117 Table 3.3-8 Expected Annual Release of Radioactive Particulates to the Atmosphere ..................... 118 Table 3.3-9 Radionuclides Listed in EU Commission Recommendation 2004/2/Euratom for PWR Nuclear Power Reactors that were Included in AP1000 NPP Design Basis Estimates for Monthly Discharges to Atmosphere ......................................................... 119 Table 3.3-10 Monthly Discharges in Gas, All Radionuclides.............................................................. 120 Table 3.3-11 Monthly Radioiodine Discharges in Gas(1) ..................................................................... 121 Table 3.3-12 Monthly Noble Gas Discharges ...................................................................................... 123 Table 3.3-13 Monthly Tritium Discharges in Gas ............................................................................... 124 Table 3.3-14 Monthly C-14 Discharges in Gas.................................................................................... 125 Table 3.3-15 Monthly Ar-41 Discharges in Gas .................................................................................. 126 UKP-GW-GL-790 x Revision 4 Table of Contents UK AP1000 Environment Report Table 3.3-16 Monthly Co-60 Discharges in Gas.................................................................................. 127 Table 3.3-17 Monthly Kr-85 Discharges in Gas .................................................................................. 128 Table 3.3-18 Monthly Sr-90 Discharges in Gas ................................................................................... 129 Table 3.3-19 Monthly 1-131 Discharges in Gas .................................................................................. 130 Table 3.3-20 Monthly Xe-133 Discharges in Gas................................................................................ 131 Table 3.3-21 Monthly Cs-137 Discharges in Gas ................................................................................ 132 Table 3.3-22 Monthly Discharges of Other Particulates ...................................................................... 133 Table 3.3-23 Comparison of AP1000 NPP Gaseous Radioactive Discharges with Other Nuclear Power Plants ...................................................................................................... 134 Table 3.4-1 AP1000 NPP Estimated Operational Liquid Radwaste Arising from System Operations ....................................................................................................................... 135 Table 3.4-2 AP1000 NPP Liquid Radwaste Storage Tank Information ............................................ 137 Table 3.4-3 AP1000 NPP Liquid Radwaste Storage Tank Secondary Containment Information ..................................................................................................................... 138 Table 3.4-4 Assumed Decontamination Factors for Liquid Radwaste Ion Exchange Beds .............. 139 Table 3.4-5 BAT Comparison of Evaporators and Ion Exchange for the Treatment of Liquid Radwaste ......................................................................................................................... 140 Table 3.4-6 Expected Annual Release of Radioactive Effluent Discharges ...................................... 143 Table 3.4-7 Monthly Discharges in Liquid, All Radionuclides ......................................................... 146 Table 3.4-8 Monthly Tritium Discharges in Liquid ........................................................................... 147 Table 3.4-9 Monthly Non-Tritium Discharges in Liquid ................................................................... 148 Table 3.4-10 Monthly C-14 Discharges in Liquid ............................................................................... 149 Table 3.4-11 Monthly Fe-55 Discharges in Liquid .............................................................................. 150 Table 3.4-12 Monthly Co-58 Discharges in Liquid ............................................................................. 151 Table 3.4-13 Monthly Co-60 Discharges in Liquid ............................................................................. 152 Table 3.4-14 Monthly Ni-63 Discharges in Liquid .............................................................................. 153 Table 3.4-15 Monthly Sr-90 Discharges in Liquid .............................................................................. 154 Table 3.4-16 Monthly Cs-137 Discharges in Liquid............................................................................ 155 Table 3.4-17 Monthly Pu-241 Discharges in Liquid............................................................................ 156 UKP-GW-GL-790 xi Revision 4 Table of Contents UK AP1000 Environment Report Table 3.4-18 Monthly Other Particulate Discharges in Liquid ............................................................ 157 Table 3.4-19 Comparison of AP1000 NPP Liquid Radioactive Discharges of Tritium with European Nuclear Power Plants Between 1995 and 1998 .............................................. 158 Table 3.4-20 Comparison of AP1000 NPP Liquid Radioactive Discharges of Radionuclides Other than Tritium with European Nuclear Power Plants Between 1995 and 1998....... 158 Table 3.4-21 Comparison of AP1000 NPP Liquid Radioactive Discharges with Other Nuclear Power Plants ................................................................................................................... 159 Table 3.5-1 Summary of Main Solid Radioactive Waste Produced by the AP1000 NPP ................. 160 Table 3.5-2 Annual Average Solid Radwaste Production.................................................................. 162 Table 3.5-3 Actinides in Dry Active Solid Radwaste ........................................................................ 163 Table 3.5-4 Colour Coding Representations for Initial Screening of Radwaste Treatment Options............................................................................................................................ 164 Table 3.5-5 Initial Radwaste Treatment Option Screening Results ................................................... 165 Table 3.5-6 Mapping of Scoring Requirements Against BAT Criteria ............................................. 168 Table 3.5-7 Mapping of Scoring Requirements Against BAT Criteria ............................................. 173 Table 3.5-8 Comparison of BPEO Approach at Sizewell B with AP1000 NPP BAT Approach ...... 174 Table 3.5-9 Summary of Treatment of LLW and ILW Solid Wastes at Various Nuclear Power Plants in Europe ................................................................................................... 177 Table 3.5-10 Summary of Main Radwaste Arisings from Decommissioned Process Equipment ....... 179 Table 3.5-11 Comparison of AP1000 NPP ILW/LLW Production Against Other Types of UK NPPs ............................................................................................................................... 179 Table 4.1-1 Annual Emissions from Diesel Generators ..................................................................... 220 Table 4.2-1 AP1000 NPP Estimated Operational Liquid Conventional Waste from System Operations ....................................................................................................................... 221 Table 4.2-2 AP1000 NPP Estimated Discharge of Chemicals within the Liquid Effluent Streams ........................................................................................................................... 222 Table 4.2-3 BAT Approach for the Cooling Water System ............................................................... 225 Table 4.2-4 Halogenated By-Products of Chlorination in Seawater .................................................. 228 Table 4.3-1 Summary of Main Solid Non-Radioactive Waste Produced by the AP1000 NPP ......... 229 Table 5.1-1 Number of Population Centres within 2km of the Generic Site ..................................... 254 Table 5.1-2 Habit Data of Local Resident Family Exposure Group .................................................. 255 UKP-GW-GL-790 xii Revision 4 Table of Contents UK AP1000 Environment Report Table 5.1-3 Habit Data of Local Fisherman Family Exposure Group ............................................... 255 Table 5.1-4 Reference Organisms Considered in the Vicinity of the Generic Site ............................ 256 Table 5.1-5 Meteorological Data for the Generic Site ....................................................................... 257 Table 5.1-6 Atmospheric Conditions ................................................................................................. 258 Table 5.1-7 Highest Ground Elevations Around the Generic Site ..................................................... 258 Table 5.1-8 Main Land Cover Within 5km ........................................................................................ 258 Table 5.1-9 Characteristic Semi-Natural Habitats within 5km .......................................................... 259 Table 5.1-10 Nearest Sensitive Sites .................................................................................................... 259 Table 5.1-11 Tidal Range ..................................................................................................................... 260 Table 5.1-12 Bathymetry ..................................................................................................................... 260 Table 5.1-13 Marine Biological Features within 10km ....................................................................... 261 Table 5.2-1 Annual Liquid Discharges Applied for the Human Dose Assessments.......................... 262 Table 5.2-2 Dose Per Unit Intake Factors for the Assessment of Doses from Liquid Discharges....................................................................................................................... 263 Table 5.2-3 Stage 1 Dose Per Unit Release Factors for Annual Liquid Discharges .......................... 264 Table 5.2-4 Stage 1 Dose to Fisherman Family Exposure Group from Representative Annual Liquid Discharges ........................................................................................................... 265 Table 5.2-5 Stage 1 Dose to Fisherman Family Exposure Group from Calculated Annual Limit Liquid Discharges ................................................................................................. 266 Table 5.2-6 Annual Gaseous Discharges Applied for the Human Dose Assessments ....................... 267 Table 5.2-7 Dose Per Unit Intake Factors for the Assessment of Doses from Gaseous Discharges....................................................................................................................... 268 Table 5.2-8 Stage 1 Dose Per Unit Release Factors for Annual Gaseous Discharges ....................... 269 Table 5.2-9 Stage 1 Dose to Local Resident Family Exposure Group from Representative Annual Gaseous Discharges ........................................................................................... 270 Table 5.2-10 Stage 1 Dose to Local Resident Family Exposure Group from Calculated Annual Limit Gaseous Discharges .............................................................................................. 271 Table 5.2-11 Stage 2 Dose Per Unit Release Factors for Annual Liquid Discharges .......................... 272 Table 5.2-12 Stage 2 Dose to Fisherman Family Exposure Group from Representative Annual Liquid Discharges ........................................................................................................... 273 UKP-GW-GL-790 xiii Revision 4 Table of Contents UK AP1000 Environment Report Table 5.2-13 Stage 2 Dose to Fisherman Family Exposure Group from Calculated Annual Limit Liquid Discharges ................................................................................................. 274 Table 5.2-14 Parameters Applied for Plume Rise and Building Wake Modelling .............................. 275 Table 5.2-15 Stage 2 Dose Per Unit Release Factors for Annual Gaseous Discharges ....................... 276 Table 5.2-16 Stage 2 Dose to Local Resident Family Exposure Group from Representative Annual Gaseous Discharges ........................................................................................... 277 Table 5.2-17 Stage 2 Dose to Local Resident Family Exposure Group from Calculated Annual Limit Gaseous Discharges .............................................................................................. 278 Table 5.2-18 Discharges Applied for the Short-Term Dose Assessment............................................. 279 Table 5.2-19 Parameters Applied for Short-term Release Modelling .................................................. 280 Table 5.2-20 Activity Concentration in Air and Deposited to the Ground per Unit Released for a Short-term Release ....................................................................................................... 281 Table 5.2-21 Cloud Gamma Dose Factors for a Short-term Release ................................................... 282 Table 5.2-22 Breathing Rates for Short-term Release Assessment...................................................... 282 Table 5.2-23 Activity Concentrations in Food One Year after a Short-term Release .......................... 283 Table 5.2-24 Ingestion Rates for Short-term Release Assessment ...................................................... 284 Table 5.2-25 Annual External Gamma Dose per unit Surface Deposition .......................................... 284 Table 5.2-26 Occupancy and Shielding Factors for Short-term Dose Assessment.............................. 285 Table 5.2-27 Dose to Adults from Short-term Gaseous Discharge...................................................... 285 Table 5.2-28 Dose to Children from Short-term Gaseous Discharge .................................................. 286 Table 5.2-29 Dose to Infants from Short-term Gaseous Discharge ..................................................... 287 Table 5.2-30 Collective Dose Statistics for AP1000 Representative Discharges to Atmosphere........ 288 Table 5.2-31 Collective Dose Statistics for AP1000 Calculated Annual Limit Discharges to Atmosphere ..................................................................................................................... 289 Table 5.2-32 Collective Dose Statistics for AP1000 Representative Discharges to Sea ..................... 290 Table 5.2-33 Collective Dose Statistics for AP1000 Calculated Annual Limit Discharges to Sea .................................................................................................................................. 291 Table 5.2-34 Activity in Soil in 60th Year of Atmospheric Discharges .............................................. 292 Table 5.2-35 Activity Concentration in Coastal Sediments in 60th Year of Liquid Discharges ......... 293 Table 5.3-1 ERICA Tool Tier 2 Output Classification ...................................................................... 295 UKP-GW-GL-790 xiv Revision 4 Table of Contents UK AP1000 Environment Report Table 5.3-2 Air Emission Data Used in the ERICA Tool .................................................................. 296 Table 5.3-3 Input Data for the ERICA Tier 1 Assessment of Air Emissions .................................... 297 Table 5.3-4 Tier 1 Results of ERICA Tool Assessment on Air Emissions........................................ 298 Table 5.3-5 Sensitivity of the Tier 1 Results of ERICA Tool Assessment for Air Emissions ........... 299 Table 5.3-6 Water Discharge Data used in the ERICA Tool ............................................................. 300 Table 5.3-7 Input Data in the ERICA Tier 1 and Tier 2 Assessment of Water Emissions ................ 302 Table 5.3-8 Tier 1 Results of ERICA Tool Assessment on Water Discharges .................................. 304 Table 5.3-9 Tier 2 Results of Water Discharges using the ERICA Dose Rate Screening Value ....... 305 Table 5.3-10 Sensitivity of the Tier 2 Results of ERICA Tool Assessment for Water Discharges to Sea ............................................................................................................ 307 Table 5.3-11 Input Data in the Wildlife Dose Assessment Spreadsheet .............................................. 310 Table 5.3-12 Output Data in the Wildlife Dose Assessment Spreadsheet ........................................... 311 Table 6.1-1 Isotopic Selection Criteria for Air Emission Limit Calculation ..................................... 329 Table 6.1-2 Isotopic Selection Criteria for Liquid Discharge Limit Calculations ............................. 330 Table 6.1-3 Predicted Monthly Air Radiation Emissions During 18-Month cycle ............................ 331 Table 6.1-4 Predicted Monthly Liquid Discharges of Radioisotopes during 18 Month Fuel Cycle ............................................................................................................................... 332 Table 6.1-5 Calculated Annual Limits for Air Emissions .................................................................. 333 Table 6.1-6 Calculated Annual Limits for Liquid Discharges ........................................................... 334 Table 6.1-7 Comparison of Proposed Air Emission Limits with Sizewell B PWR ........................... 335 Table 6.1-8 Comparison of Proposed Liquid Discharge Limits with Sizewell B PWR .................... 336 Table 6.1-9 Comparison of Air Emission Limits with UK AGR Sites .............................................. 337 Table 6.1-10 Comparison of Liquid Discharge Limits with UK AGR Sites ....................................... 338 Table 6.2-1 Monitoring Programmes ................................................................................................. 339 Table 6.2-2 AP1000 NPP Aerial Effluent Monitors and Detection Ranges – Main Plant Vent ....... 340 Table 6.2-3 AP1000 NPP Aerial Effluent Monitors and Detection Ranges – Turbine Building Vent ................................................................................................................................ 341 Table 6.2-4 AP1000 NPP Liquid Effluent Monitors and Detection Ranges...................................... 342 UKP-GW-GL-790 xv Revision 4 Table of Contents UK AP1000 Environment Report LIST OF FIGURES Figure 2.3-1. AP1000 NPP Schematic ....................................................................................................... 51 Figure 2.3-2. Typical AP1000 NPP Plot Plan 52 Figure 2.3-3. Location of System Functions within the AP1000 NPP Power Generation Complex ......... 54 Figure 2.4-1. Reactor Power Conversion System – Simplified Flow Diagram ......................................... 55 Figure 2.7-1. AP1000 NPP Standard Plant Water Balance 56 Figure 2.9-1. Plan View of AP1000 NPPTurbine Chemical Storage ........................................................ 58 Figure 2.9-2. Turbine Island Chemical Storage Arrangement ................................................................... 59 Figure 2.9-3. Rugged Hazardous Liquid Tote Container........................................................................... 60 Figure 3.1-1. Waste Management Hierarchy ........................................................................................... 182 Figure 3.1-2. Nuclear BAT Management Factors for Optimization of Releases from Nuclear Facilities (Reference 3-10) ................................................................................................ 183 Figure 3.3-1. AP1000 NPP Gaseous Radwaste System........................................................................... 184 Figure 3.3-2. AP1000 NPP Air Emission Point Source Locations .......................................................... 185 Figure 3.3-3. BAT Sizing of WGS Delay Beds ....................................................................................... 186 Figure 3.3-4. AP1000 NPP Monthly Gaseous Radioactive Emissions.................................................... 187 Figure 3.4-1. AP1000 NPP Liquid Radwaste System ............................................................................. 188 Figure 3.4-2. Comparison of Evaporator and Ion Exchange Flow Sheets for Liquid Radwaste Treatment ........................................................................................................................... 189 Figure 3.4-3. AP1000 NPP Monthly Liquid Radioactive Discharges ..................................................... 190 Figure 3.5-1. AP1000 NPP Solid Radwaste Management Strategy ........................................................ 191 Figure 3.5-2. Solid AP1000 NPP Waste Management ............................................................................ 192 Figure 3.5-3. Low Level Waste Options (Reference 3-16)...................................................................... 193 Figure 3.5-4. Intermediate Level Waste Organic Resin Treatment Options (Ref. 3-16) ......................... 193 Figure 3.5-5. Total Weighted Benefit versus Cost of Process Technology (Ref. 3-16) .......................... 194 Figure 3.5-6. Total Weighted Benefit versus Cost of Waste Disposal (Ref. 3-16).................................. 195 Figure 3.5-7. ILW Filter Treatment Options (Ref. 3-13) ......................................................................... 195 Figure 3.5-8. Summary of Selected BAT for ILW and LLW Radwaste ................................................. 196 UKP-GW-GL-790 xvi Revision 4 Table of Contents UK AP1000 Environment Report Figure 3.5-9. LLW Processing in Radwaste Building ............................................................................. 197 Figure 3.5-10. Solid LLW Disposal Routes............................................................................................. 198 Figure 3.5-11. CPS Resin Disposal ......................................................................................................... 199 Figure 3.5-12. Solid LLW Waste Oil Disposal Route ............................................................................. 200 Figure 3.5-13. Solid ILW Treatment and Disposal .................................................................................. 201 Figure 3.5-14. ILW Mobile Encapsulation Plant ..................................................................................... 202 Figure 3.5-15. Solid HLW Treatment and Disposal ................................................................................ 203 Figure 3.5-16. ILW Store ......................................................................................................................... 204 Figure 3.5-17. Holtec Spent Fuel Storage System .................................................................................... 205 Figure 3.5-18. Holtec Spent Fuel Storage System ................................................................................... 206 Figure 3.5-19. Spent Fuel Interim Storage, Transportation and Disposal Strategy ................................. 207 Figure 3.5-20. Minimisation of Equipment and Materials....................................................................... 208 Figure 3.5-21. Decommissioning Waste Treatment and Disposal........................................................... 209 Figure 4.3-1. Conventional Solid Waste Treatment and Disposal Rout .................................................. 230 Figure 5.1-1. Location of Nuclear Power Stations Used to Establish the Generic Design Case ............. 312 Figure 5.1-2. Population Centres for the Generic Design Case ............................................................... 313 Figure 5.1-3. Land Use and Habitat Data for the Generic Design Case .................................................. 314 Figure 5.1-4. Sites of Special Interest for the Generic Design Case ........................................................ 315 Figure 6.1-1. Comparison of Predicted Air Radioiodine Air Emission with Proposed Limits................ 343 Figure 6.1-2. Comparison of Predicted Noble Gas Air Emissions with Proposed Limits ....................... 343 Figure 6.1-3. Comparison of Predicted Tritium Air Emissions with Proposed Limits............................ 344 Figure 6.1-4. Comparison of Predicted Carbon-14 Air Emissions with Proposed Limits ....................... 344 Figure 6.1-5. Comparison of Predicted Argon-41 Air Emissions with Proposed Limits ........................ 345 Figure 6.1-6. Comparison of Predicted Iodine-131 Air Emission with Proposed Limits ........................ 345 Figure 6.1-7. Comparison of Predicted Beta Particulate Air Emission with Proposed Limits ................ 346 Figure 6.1-8. Comparison of Predicted Tritium Liquid Discharge with Proposed Limits....................... 346 Figure 6.1-9. Comparison of Predicted C-14 Liquid Discharge with Proposed Limits ........................... 347 UKP-GW-GL-790 xvii Revision 4 Table of Contents UK AP1000 Environment Report Figure 6.1-10. Comparison of Predicted Liquid Discharges of All Isotopes without Other Limits ........ 347 Figure 6.2-1 Schematic Illustrating Aerial Release Vents of the AP1000 NPP and Associated Monitors............................................................................................................................. 348 Figure 6.2-2 Schematic Illustrating the Liquid Discharge Monitoring Points of the AP1000 NPP and Associated Monitors ................................................................................................... 349 UKP-GW-GL-790 xviii Revision 4 List of Acronyms and Trademarks UK AP1000 Environment Report LIST OF ACRONYMS AND TRADEMARKS Acronym Definition ac Alternating Current AD Annual Average Dissolved AGR Advanced Gas-cooled Reactor ALARP As Low As Reasonably Practicable AOX Adsorbable organically bound halogens ™ AP1000 AP1000™ nuclear power plant ASS Auxiliary Steam Supply System AT Annual Average Total BAT Best Available Techniques BDS Steam Generator Blowdown System BEGL British Energy Generation Limited BPEO Best Practicable Environmental Option BPM Best Practicable Means BWR Boiling Water Reactor CCS Component Cooling Water System CCTV Close Circuit Television CDM Construction (Design & Management) CDS Condensate System CEC Cavity Enclosure Container CFA Conditions for Acceptance CFS Turbine Island Chemical Feed System COD Chemical Oxygen Demand COMAH Control of Major Accident Hazards CPS Condensate Polishing System CR Concentration Ratio CVS Chemical and Volume Control System CWS Circulating Water System DAC Design Acceptance Certificate DAW Dry Active Waste DBD Different By Design dc Direct Current DCD AP1000 European Design Control Document DF Decontamination Factor UKP-GW-GL-790 xix Revision 4 List of Acronyms and Trademarks UK AP1000 Environment Report LIST OF ACRONYMS AND TRADEMARKS (cont.) Acronym Definition DfT Department for Transport DoE Department of Energy DOP Dioctyl phthalate DOS Standby Diesel and Auxiliary Boiler Fuel Oil System DTS Demineralised Water Treatment System DWS Demineralised Water Transfer and Storage System EA Environment Agency EOL End-of-life (core life) FHM Fuel Handling Machine FPS Fire Protection System FWS Feedwater System GALE Gaseous and Liquid Effluents (Calculation of releases of radioactive materials in gaseous and liquid effluents from pressurised water reactors) GDA Generic Design Assessment GDF Geological Disposal Facility gpm U.S. gallons per minute HEPA High Efficiency Particulate Air HHISO Half Height ISO (container), (meeting low level waste repository CFA) HLW High Level Waste HPA Health Protection Agency HRGS High Resolution Gamma Spectroscope (a waste package assay instrument) HSE Health and Safety Executive HVAC Heating, Ventilation, and Air Conditioning HV-VLLW High Volume Very Low Level Radioactive Waste IAEA International Atomic Energy Agency ILW Intermediate Level Waste IRWST In-containment Refueling Water Storage Tank IWMS Integrated Waste Management Strategy LLW Low Level Waste LLWR Low Level Waste Repository LOCA Loss of Coolant Accident lop Life of plant UKP-GW-GL-790 xx Revision 4 List of Acronyms and Trademarks UK AP1000 Environment Report LIST OF ACRONYMS AND TRADEMARKS (cont.) Acronym Definition LRGS Low Resolution Gamma Spectroscope (a waste package assay instrument) LV-VLLW Low Volume Very Low Level Radioactive Waste MAC Maximum Allowable Concentration MATTE Major Accident to the Environment MCR Main Control Room MP Monitoring Point MPC Multi-Purpose Canister MTU/MWD Megawatt–days per metric ton of uranium metal NDA Nuclear Decommissioning Authority NII Nuclear Installations Inspectorate NPP Nuclear Power Plant NRC United States Nuclear Regulatory Commission OCNS Office for Civil Nuclear Security ORNL Oak Ridge National Laboratory P&I Document Process and Information Document for Generic Assessment of Candidate Nuclear Power Plant Designs PCS Passive Containment Cooling System PCSR Pre-Construction Safety Report PGS Plant Gas System ppb Parts per billion PRA Probabilistic Risk Assessment PWR Pressurised Water Reactor PWS Potable Water System QA Quality Assurance QMS Quality Management System Radwaste Radioactive Waste RCA Radiation Controlled Area RCDT Reactor Coolant Drain Tank RCPB Reactor Coolant Pressure Boundary RCS Reactor Coolant System RO Regulatory Observation (raised by regulators) RQ Risk Quotient RWMC Radioactive Waste Management Case UKP-GW-GL-790 xxi Revision 4 List of Acronyms and Trademarks UK AP1000 Environment Report LIST OF ACRONYMS AND TRADEMARKS (cont.) Acronym Definition RWMD Radioactive Waste Management Directorate RWS Raw Water System SAP Safety Assessment Principle scfm Standard cubic feet per minute SCV Secondary Containment Vessel SDS Sanitary Drainage System SEPA Scottish Environmental Protection Agency SMPP Secure Military Power Plant SQEP Suitably Qualified and Experienced Persons SUDS Sustainable Urban Drainage System SWS Service Water System TCS Turbine Building Closed Cooling Water System TEI Technology Evolution Index TQ Technical Query (raised by regulators) UF Uncertainty Factor UK United Kingdom UKAEA UK Atomic Energy Authority U.S. NRC United Status Nuclear Regulatory Commission VAS Radiologically controlled area ventilation system VFS Containment air filtration system VLLW Very Low Level Radioactive Waste VTS Turbine building ventilation system VVM Vertical Ventilated Module VWS Central Chilled Water System WCPD Worst Case Annual Plant Discharges WEC Westinghouse Electric Company WGS Gaseous Radwaste System WHO World Health Organisation WLS Liquid Radwaste System WRS Radioactive Waste Drain System WSS Solid Radwaste System WWRB Waste Water Retention Basin WWS Waste Water System UKP-GW-GL-790 xxii Revision 4 1.0 Introduction 1.0 UK AP1000 Environment Report INTRODUCTION The UK Nuclear Regulators have developed a Generic Design Assessment (GDA) process for evaluating alternative designs for the next generation of nuclear power plants (NPPs) to be built in the UK. Westinghouse Electric Company (WEC) has submitted an application for its AP1000™ NPP design to be considered in this process. As part of this application, Westinghouse has submitted EPP-GW-GL-700, “AP1000 European Design Control Document” (Reference 1-1) as the primary source of technical information for the NPP design. This UK AP1000 Environment Report has been prepared to consolidate and summarise the environmental information in the Design Control Document (DCD) and to supplement the environmental information to meet the environmental requirements of the GDA process. The report comprises six chapters: Chapter 1 Introduction This chapter contains an introduction to the need for new nuclear power and the nuclear regulators responsible for permitting the new NPPs. The chapter also includes a description of the relationship between this submittal and other documentation submitted as part of the GDA process. The chapter contains a section on the management systems applied to the GDA application. Chapter 2 Generic Plant Description This chapter provides an overview of the development, layout, and design features of the AP1000 NPP that are particularly relevant to the generation of emissions, discharges, and wastes. The chapter includes information on the storage of radioactive water and process chemicals. Chapter 3 Radioactive Waste Management Systems This chapter contains quantitative information about the radioactive emissions, discharges, and wastes produced in the AP1000 NPP. The chapter includes a description of the minimisation and abatement techniques employed. Chapter 4 Non-Radioactive Waste Management Systems This chapter contains quantitative information about the non-radioactive emissions, discharges, and wastes produced in the AP1000 NPP. The chapter addresses non-radioactive discharges of waste water and cooling water, and associated discharges of residual chemicals from the required chemical dosing regimes. Chapter 5 Environmental Impact This chapter defines the bounding characteristics of a UK coastal generic site and provides assumed data that is input into dose assessments for human and non-human species. The dose assessments for the UK generic site are reported. UKP-GW-GL-790 1 Revision 4 1.0 Introduction UK AP1000 Environment Report Chapter 6 Environmental Monitoring This chapter identifies the proposed emission and discharge limits for the AP1000 NPP and the arrangements for monitoring emissions and discharges from the generic site. Chapter 7 Selected Considerations for Specific Sites For the GDA, it is assumed that the generic site will be occupied by one AP1000 NPP and the information in this Environement Report reflects this case. This chapter provides a commentary on the relevance of the Environment Report to sites which may have multiple AP1000 NPP units. Detailed environmental impact of such sites would be evaluated at the site-specific design stage. 1.1 Need for Nuclear Power In January 2008, the UK government published “A White Paper on Nuclear Power” (Reference 1-2) on the future of nuclear power in the UK. The White Paper sets out the decision the government has taken in response to a consultation on nuclear power. The consultation considered the following issues: nuclear power and carbon emissions security of supply impacts of nuclear power the economics of nuclear power the value of having a low-carbon electricity generation option: nuclear power and the alternatives the safety and security of nuclear power transport of nuclear materials waste and decommissioning nuclear power and the environment the supply of nuclear fuel supply chain and skills implications reprocessing of spent fuel The White Paper (Reference 1-2) concluded that: “The Government believes it is in the public interest that new nuclear power stations should have a role to play in this country’s future energy mix alongside other low-carbon sources; that it would be in the public interest to allow energy companies the option of investing in new nuclear power stations; and that the Government should take active steps to open up the way to the construction of new nuclear power stations. It will be for energy companies to fund, develop and build new nuclear power stations in the UK, including meeting the full costs of decommissioning and their full share of waste management costs.” The majority of the UK’s nuclear power stations are due to close over the next two decades. It is appropriate that, as part of a balanced approach to electricity generation, a second phase of nuclear power station construction is encouraged to help ensure a clean, secure, and sufficient supply of energy demanded by modern society. UKP-GW-GL-790 2 Revision 4 1.0 Introduction UK AP1000 Environment Report 1.2 Regulatory Bodies 1.2.1 Regulatory Approach Regulatory bodies have important roles in the nuclear power program. Their remit is to ensure that any new nuclear power station built in the UK meets the highest standards of safety, security, environmental protection and waste management. The following organisations are involved in the authorisation of new nuclear power stations. 1.2.2 Environment Agency (EA) The EA (in England and Wales) regulates: radioactive waste (radwaste) disposal, including discharges; abstraction from and discharges to controlled waters, including rivers and estuaries; the sea and groundwater; operation of specific “non-nuclear” activities; assessment and, where necessary, clean-up of contaminated land; disposal of conventional waste; and certain flood risk management matters. It also has wider responsibilities with regard to Euratom Article 37 requirements concerning the impact of nuclear sites on other European Union Member States. Operators have to satisfy the EA that discharges and disposals made into the environment are minimised and their effects are acceptable, such that people and the environment will be properly protected throughout the whole lifecycle of the plant, from construction to decommissioning. 1.2.3 Health and Safety Executive (HSE) 1.2.3.1 Nuclear Installations Inspectorate (NII) HSE’s NII grants site licenses to the operators of nuclear power stations. Applicants have to satisfy HSE about the safety aspects of the design, manufacture, construction, commissioning, operation, maintenance, and decommissioning of the installation, and the management of radwaste on the site, before a license is granted. 1.2.3.2 Office for Civil Nuclear Security (OCNS) HSE’s OCNS regulates security at all civil nuclear sites. It is concerned with physical security of nuclear material, IT security, security of nuclear material in transit, and vets people who access nuclear sites. OCNS requires the holder of a nuclear site licence to submit a site security plan, which must be approved before nuclear material arrives on site. 1.2.4 Department for Transport (DfT) The DfT’s Dangerous Goods Division is the UK Competent Authority for the safe transport of all radioactive material by all modes. It issues Design and Shipment Approvals for certain package designs. It directly regulates road transport and some aspects of rail transport, and advises/supports the Civil Aviation Authority and the Maritime and Coastguard Agency in air and maritime transport matters. UKP-GW-GL-790 3 Revision 4 1.0 Introduction 1.2.5 UK AP1000 Environment Report Local Planning Authorities Local planning authorities have a role in approving the planning applications required for the nuclear power stations. 1.3 The Generic Design Assessment Process As part of this regulatory role, the EA and HSE proposed that the new nuclear power stations be subject to a methodical, well-defined, multi-stage assessment and licensing/permitting process. This process would implement a “pre-authorisation” system for reactor designs to allow generic designs to be assessed in advance of any application to build a nuclear power station at a particular location. This process is called the generic design assessment or GDA. It involves looking at all the design issues separately from the other important factors such as whether the siting of a new nuclear power station is suitable, or whether the potential operator is competent. The GDA process has been introduced jointly by the UK nuclear regulators – the HSE (incorporating NII and OCNS) and the EA. The Scottish Environmental Protection Agency (SEPA) is not taking part in the GDA. The HSE produced guidance to reactor vendors or vendor/operator partnerships in preparing a GDA application (Reference 1-3). As part of the GDA process, the HSE (incorporating the NII and ONCS) carry out a detailed assessment of the safety and security elements of a design, based on a submission made by the reactor vendor or vendor/operator partnership. In addition, the EA has issued its “Process and Information Document for Generic Assessment of Candidate Nuclear Power Plant Designs” (P&I Document) (Reference 1-4), which describes the information on waste management and environmental issues that the EA needs to use to perform a generic assessment of new NPPs in England and Wales. The regulators consider that it is important for potential site operators/licensees to be engaged in the GDA process, as they will ultimately be required to demonstrate sufficient knowledge of the design before receiving permission to construct and operate a nuclear power station. The operator may also wish to be part of the design process to allow the design to be adapted to its particular needs. The regulators intend that the GDA process operates in a transparent and open way so that the documentation provided for the GDA is made available to the public by the Requesting Party, with the exclusion of sensitive nuclear information and commercially confidential information. The regulators will make public statements on their progress and interim findings at key stages during the GDA process, and also publish their technical reports. When the GDAs are completed, the regulators will issue reports on their findings. If the design is judged to be satisfactory, the regulators will issue the following: EA: Statement of Generic Design Acceptability NII: Design Acceptance Confirmation OCNS: Generic Conceptual Security Plan approval The Requesting Party is expected to cooperate with the regulators by: UKP-GW-GL-790 4 Revision 4 1.0 Introduction UK AP1000 Environment Report Liaising with regulators Responding to regulatory issues Providing additional information as requested Responding to public comments Where applications are made for site-specific permissions (nuclear site licence, environmental authorisations and permits, and security plan approval), the regulators will follow their existing procedures. Where these site-specific applications are based on a design that has undergone GDA, the regulators will take full account of the work that they have already carried out and the advice that they have provided. It is expected that following a GDA, the regulatory bodies would typically be involved as follows: 1.3.1 EA – for site-specific applications, the EA will take full account of the detailed design of the proposed station, including any changes since GDA, and generally focus on local impacts associated with the permissions sought and the suitability of the potential operator. Potential operators will need to address exclusions or caveats from the GDA process. NII – will focus their licensing assessment on those site-specific issues that have consequences for the safety of the station and matters relating to the organisational structure and capabilities of the potential operator. OCNS – will require the security plan to be taken forward and developed into a site security plan that could be considered for approval of material that is brought to the site. A construction security plan, that builds upon the conceptual security plan of the intended location and articulates how this will be developed into the site security plan, will be required to be approved by OCNS before construction activities begin. Westinghouse AP1000 NPP Generic Design Assessment – Overview of Documentation WEC is seeking approval to have an AP1000 simplified, passive advanced light water reactor plant built in the UK. The general plant description is included in Chapter 1 of the European DCD (Reference 1-1). The AP1000 NPP design has been incorporated into the United States Nuclear Regulatory Commission’s (U.S. NRC’s) Design Certification Rule for the AP1000 NPP design, Section II.A of Appendix D to 10 CFR Part 52. However, to show compliance with the UK regulations, additional information on the AP1000 NPP is required. The EA reviewed previous Westinghouse submittals, including the DCD (formerly known as the UK AP1000 Safety, Security, and Environment Report) against its “Process and Information Document for Generic Assessment of Candidate Nuclear Power Plant Designs” (Reference 1-4), and “Generic Design Assessment – Regulatory Issue RI-AP1000-0001” (Reference 1-5) to provide guidance on the additional information needed. In December 2008, Westinghouse responded by issuing Revision 1 of the “UK AP1000 Environment Report” (Reference 1-6) to supplement the DCD and to provide the additional information required. The Environment Report has been reviewed by the EA and HSE who issued technical queries (TQs) and regulatory observations (ROs) which required further response or clarification from Westinghouse. This report addresses the TQs and ROs raised by the EA and HSE. The document was substantially restructured to present the information by subject rather than by the P&I Document (Reference 1-5). This is intended to make the information more accessible to the public. UKP-GW-GL-790 5 Revision 4 1.0 Introduction UK AP1000 Environment Report Table 1.3-1 is attached to help readers understand where the information requested by the EA in their P&I Document is addressed. This report forms part of the 2010 reference design point for the GDA of the AP1000 plant. 1.3.2 Relationship to Integrated Waste Management Strategy The EA has requested the production of an integrated waste management strategy (IWMS) for the wastes generated by the AP1000 NPP. UKP-GW-GL-054, “UK AP1000 Integrated Waste Strategy” (Reference 1-7), has been produced and will be referenced throughout this Environment Report to provide details of the recycling, treatment, and disposal of radioactive and non-radioactive solid wastes, liquid waste, and gaseous waste. 1.3.3 Relationship to Radioactive Waste Management Case The UK Regulators have also requested that a radioactive waste management case (RWMC) is prepared for the AP1000 NPP waste treatment systems. An RWMC has been prepared for the AP1000 NPP which demonstrates the long-term safety and environmental performance of the management of specific Intermediate Level Waste (ILW) (Reference 1-8) and High Level Waste (HLW) (Reference 1-9) from their generation, conditioning, storage, and disposal. These documents hold information that is relevant to the Environment Report and vise versa. 1.4 Management System 1.4.1 Westinghouse Management System The management system used in preparation of the Environment Report is also used in preparing other documentation supporting the UK GDA of the AP1000 NPP. These other documents include: AP1000 Pre-Construction Safety Report (PCSR) (Reference 1-10). The PCSR includes a similar description of the Management System. UK AP1000 Integrated Waste Strategy (Reference 1-7) UK AP1000 Radioactive Waste Management Case Evidence Report for Intermediate Level Waste (Reference 1-8) UK AP1000 Radioactive Waste Management Case Evidence Report for High Level Waste (Reference 1-9) It is the Westinghouse Policy to design, produce, market, and distribute products and services and to conduct operations in an environmentally sound, socially responsible manner. We consider the impact our actions may have on the environment and the health and safety of our employees, subcontractors, customers, and public (Reference 1-11). WEC is committed to the integration of safety into the design process, as well as during construction and commissioning. Implementation of the Policy is through the “Westinghouse Environment, Health and Safety Manual” (Reference 1-12). The Westinghouse Electric Company “Quality Management System” (Reference 1-13) has been developed to comply with regulatory, industry, and customer quality requirements imposed by customers or regulatory agencies for items and services provided by Westinghouse world-wide operations. The Quality Management System (QMS) describes UKP-GW-GL-790 6 Revision 4 1.0 Introduction UK AP1000 Environment Report the Westinghouse commitments to the quality assurance (QA) requirements of ISO 9001; ISO 9000-3; 10CFR50, Appendix B; ASME NQA-1; and IAEA 50-C-QA. WEC, headquartered in Pittsburgh, Pennsylvania, U.S.A., has operations located throughout the world that are responsive to energy industry, utilities, and government needs. Westinghouse operations are made up of organizations that are responsible for specific business areas. These operational organizations are responsible for marketing, design, procurement, manufacture, installation, inspection, testing, servicing, project management, and operation of certain NPP items, radioactive material packaging and transportation, and non-nuclear items. Westinghouse also offers engineering services such as life-extension studies, diagnostics, service analyses, and item and service testing. The Nuclear Power Plants Business Unit is responsible for designing and licensing the AP1000 NPP. The QMS applies to activities that affect the quality of items and services supplied by Westinghouse. It defines the basic requirements applicable to customer contracts and is a commitment to our customers. It serves as a directive for all functions in establishing necessary policies and procedures that comply with the requirements of ISO 9001:2000 and ISO 9000-3:1997; and in addition, as applicable for safety-related activities, 10CFR50, Appendix B; ASME NQA-1-1994 Edition; and IAEA 50-C-QA, Revision 1. Westinghouse implements all applicable requirements of the QMS for all safety-related items and services. Westinghouse implements those requirements of the QMS consistent with ISO 9001 for items and services that are not safety-related, as a minimum. An inspection conducted by UK regulators from 31 March to 3 April 2009 found that Westinghouse uses a well-developed set of quality processes that include sub-tier procedures that are periodically reviewed and audited. These are supported by UKP-GW-GAH-001, “Project Quality Plan for UK Generic Design Assessment” (Reference 1-14) and procedures. Safety-related items, services, and activities are those that may impact those NPP structures, systems, and components that are relied upon to remain functional during and following design basis events to assure: 1) the integrity of the reactor coolant pressure boundary (RCPB), 2) the capability to shut down the reactor and maintain it in a safe shutdown condition; or 3) the capability to prevent or mitigate the consequences of accidents which could result in potential offsite exposures comparable to the applicable guideline exposures set by the governing regulatory agency, if applicable. In addition, safety-related items, services, and activities may be those defined by a governing regulatory agency or contract. Project Quality Plans, for example, the Project Quality Plan for the UK GDA, may be developed to supplement the requirements of the QMS and provide for specific contractual requirements and alternate QA standards when necessary. Westinghouse complies with the regulatory requirements applicable to the items and services it provides for use in NPPs, as imposed by the governing regulatory agency. The Project Quality Plan for the UK GDA (Reference 1-14) establishes the Project QA Plan and defines the QA objectives for the conduct of activities to be performed by WEC related to the GDA of the AP1000 NPP and supporting licensing activities in the U.K. Work performed by Westinghouse shall be performed in accordance with the QMS described above. It is the policy of WEC to provide accurate and reliable information to fully satisfy the EA and NII and regulatory requirements. This Project QA Plan for the UK delineates the QA requirements that WEC uses to meet its stated objectives for providing the necessary technical information and documentation for the EA and NII to conduct a complete GDA of UKP-GW-GL-790 7 Revision 4 1.0 Introduction UK AP1000 Environment Report the AP1000 NPP design. Activities affecting quality are documented in accordance with WEC manuals, procedures, instructions, specifications, and drawings that contain appropriate information to accomplish prescribed activities in a complete and satisfactory manner. The Management of Safety starts at the senior level of an organization, expressed in terms of a safety policy committing the organization to objectives, actions, and behaviors that will deliver effective safety through all phases of plant life. The policy provides organizational commitment to continuous safety improvement. Safety management permeates the whole of the organization as evidenced by an effective safety culture. 1.4.2 Licensee’s Management System 1.4.2.1 Intelligent Customer WEC has an established organizational structure and arrangements to deliver effective safety management up to the end of its input to the GDA, and during subsequent plant construction and commissioning prior to handover to the Operating Organization. Thereafter, the Operating Organization’s Licensee will assume the responsibility for safety and environmental management of the operating power station through the operating life and eventual decommissioning of the plant. The WEC organizational structure, processes, and competences to control the design have the attributes of a Design Authority in the context of the GDA. Licensees of the Operating Organization will possess the characteristics of an Intelligent Customer. The NII has published a Technical Assessment Guide (Reference 1-15) that provides guidance on the required attributes of an Intelligent Customer. This guidance signposts the specific parts of the Safety Assessment Principles (SAPs), the License Conditions, and International Atomic Energy Agency (IAEA) documentation that are relevant to the Intelligent Customer role. The Intelligent Customer should: Understand the safety requirements of all their activities relevant to safety including those of its contractors and to take responsibility for managing their safe operation. Understand their duties under the law with respect to safety. Set, interpret, and deliver safety standards relevant to their nuclear operations. Have sufficient breadth and depth of knowledge and experience to understand the safety envelope of their plant(s) and the nuclear safety hazards represented. Understand and support all aspects of the safety case/report and the facility operation over the full facility lifetime – including, where necessary, decommissioning and disposal. Know where and when to seek advice and, on receipt of this advice, understand the implications for safety. Maintain and develop the corporate memory with an ability to readily extract nuclear safety-related business intelligence. UKP-GW-GL-790 8 Revision 4 1.0 Introduction UK AP1000 Environment Report Ensure adequate numbers of Suitably Qualified and Experienced Persons (SQEP) are available to make safety judgments. The Licensee must develop an organizational baseline which will ensure that the Licensee operates as an Intelligent Customer and the Licensee is capable of exerting proper controls of contractors’ activities. The proper implementation of the above attributes will ensure that this is achieved. 1.4.2.2 Pre-Construction Design and Safety Case Consolidation The GDA Safety Case, and the associated design which receives a Design Acceptance Certificate (DAC) from the regulator (including exclusions and conditions), will be the basis for the Site-Specific Safety Case. The Licensee may wish to make alterations to the GDA design prior to (and possibly even during) construction and commissioning. This will require a defined design modification process as well as alterations to the safety case. The management arrangements (both Westinghouse and Licensee) will clearly state that the Licensee is responsible for these processes to ensure the safety of any such changes. The Licensee is expected to have an acceptance process before any changes that could affect safety or the environment are put into effect. The relationship between Westinghouse and the Licensee will require Westinghouse to provide any information and support to the Licensee to enable them to make informed decisions and to be able to present the case for change knowledgeably to the regulators. In this case, clear and effective lines of communication are to be defined. The Licensee will take full responsibility for ensuring that Westinghouse is fully informed as to all aspects of the safety or environmental significance of any work which Westinghouse might be asked to do in this context, and this should be fully incorporated in the Licensee’s management arrangements. 1.4.2.3 Construction During the construction phase, responsibility for safety and the environment will rest with the Licensee. The Licensee will also have to implement arrangements to ensure full compliance with the legal regulations such as the Construction (Design & Management) (CDM) Regulations. The management arrangements for any design modifications will be similar to these described in subsection 1.4.2.2 above and will be documented in the management arrangements of the Licensee and Westinghouse. The Licensee will require adequate quality arrangements to be in place to manage testing and inspection requirements during construction. During manufacturing, appropriate contractor quality arrangements need to be in place so that the Licensee can ensure that safety, reliability, and environmental targets are achieved. 1.4.2.4 Operation Westinghouse will make clear in the GDA safety documentation its initial identification of those operational constraints and requirements which will be needed to operate the plant safely and to protect the environment. The GDA safety documentation will also define the limiting conditions of operation, the expectations from the structures, systems, and components, and the necessary testing and maintenance. The GDA safety documentation will reflect the role of the operator insofar as this affects safety and the environment. UKP-GW-GL-790 9 Revision 4 1.0 Introduction UK AP1000 Environment Report Westinghouse expects the prospective Licensee to utilise this information during the Licensee’s determination of technical specifications and operating rules. WEC also expects the Licensee to utilise this information in developing their Station Operating Instructions. During operation, Westinghouse will provide services that the Licensee may need to operate their plant safely. In addition, Westinghouse will encourage and assist the Licensee to ensure that they have management arrangements in place to maintain in-house core competences which will permit them to demonstrate competence as a Licensee. It will be the Licensee’s responsibility to ensure that the essential services they require to maintain safety and the environment continue to be available either from Westinghouse or an alternate supplier if Westinghouse is unable or unwilling to provide such support. 1.4.2.5 Decommissioning Only high-level reference will be made to management arrangements for decommissioning in this report. More details can be found elsewhere in the in GDA documentation [Ref. 1-16]. It is anticipated that knowledge transfer and the management arrangements developed to support operation will provide the foundations of the arrangements required for the decommissioning process. However, a review of this will be carried out during the creation of the operational management arrangements to ensure that this is true. It is expected that the decommissioning arrangements will be reviewed every ten years. 1.4.3 Westinghouse Support to a Licensee’s Management System Any contract between Westinghouse and a prospective Licensee is expected to define the tasks and the interrelation between the organisations. The management arrangements and the related communication processes between the Licensee and Westinghouse have to be agreed within this framework. 1.4.3.1 Design Authority The GDA process requires that the Licensee of the Operating Organization establishes a Design Authority, and that arrangements are put in place that ensure that sufficient information is transferred from the Design Organization to the Licensee such that it can function as an effective Design Authority. The Licensee Design Authority is a key component of the Intelligent Customer organisation. In the context of the AP1000 NPP introduction to the UK, WEC has processes in place that ensure that design and operational knowledge is transferred to the Licensee of the Operating Organization to permit it to perform as an Intelligent Customer. These processes include the provision of design information and comprehensive training and education programs such that the Licensee can establish a credible Design Authority. The Design Authority may not be bounded by the Operating Organization and may include inputs from external bodies, particularly the Design Organization, WEC. In the Intelligent Customer role, the Licensee will show that it can maintain continuity of the necessary engineering skills and knowledge, access to appropriate research, and control intellectual property issues such that it can demonstrate full control of the plant independent of any changes in the external contracting environment. The future Licensee of an AP1000 NPP is likely to join and to contribute to the Pressurized Water Reactor Owners Group, formerly the Westinghouse Owners Group, which provides a focus for information, services, and development programs from which Owners and Licensees of AP1000 plants can benefit. The group is coordinated centrally by WEC. The UKP-GW-GL-790 10 Revision 4 1.0 Introduction UK AP1000 Environment Report services provided by the group include the optimization of Tech-Specs, performance improvements, and access to a common knowledge base of plant and licensing issues. 1.4.3.2 Life Cycle Support Generally, throughout all phases of the plant life cycle, the key areas for interface with the site Licensee are expected to include the following: Westinghouse’s intention is to work closely with the Licensee, providing all necessary technical information to enable the development of the safety cases and all other essential operating documentation, including emergency arrangements and maintenance schedules. Westinghouse is expected to demonstrate to the Licensee the adequacy of its management arrangements to support safety, the environment, and the quality of the plant. Westinghouse will work with the Licensee to support the production of a comprehensive Licensee quality management system insofar as the safety and environmental aspects of operation of the Westinghouse AP1000 NPP design are concerned. Westinghouse expects the Licensee to have a document management system that ensures appropriate records are retained. Westinghouse will support the Licensee in transferring AP1000 NPP information into their document management system. Westinghouse will identify the aspects of the design that need special consideration from a security point of view and will relay them to the Licensee. Whilst these will not explicitly be identified in the management arrangements, a requirement to transfer such information will be included in the Westinghouse management arrangements as will an undertaking to support the Licensee in any discussions with OCNS. SQEP from within both the Licensee’s organisation and Westinghouse will work to their own respective management systems to support safety and the environment. However, where the Licensee has a high dependency on individual contractors (e.g., Westinghouse staff) to support safety or the environment, the Licensee is expected to have processes for ensuring the competency of contractor staff. All contracted SQEP personnel (Westinghouse, other) will work according to the Licensee’s management system. Where this is done, it will be clearly communicated and agreed upon between both parties. Westinghouse will cooperate with the Licensee in demonstrating the competency of its staff for their assigned roles. Westinghouse expects that the Licensee will secure an independent review of proposals prior to submission to the regulators (e.g., through appropriate Independent Nuclear Safety Assessments and Nuclear Safety Committee arrangements). There is an overview of lifetime management arrangements in the Life Cycle Safety Report (Reference 1-11). 1.4.3.3 Knowledge Transfer and Competence Retention On a contractual basis, Westinghouse will support the Licensee to ensure that their knowledge of the aspects of the design which affect each of these topics is transmitted in an effective and appropriate way. UKP-GW-GL-790 11 Revision 4 1.0 Introduction UK AP1000 Environment Report Arrangements for knowledge transfer will be defined and discussed in detail with prospective Licensees. The process will be applied throughout the stages leading up to and beyond the start of operation. These will include, but are not be limited to: Programme and processes (GDA, for construction and operation) Technical knowledge of the plant systems, staffing, and related competences Arrangements for training SQEP arrangements and competence retention Arrangements for experience feedback (construction, commissioning, operation/project management, and communication) The ability of the Licensee to satisfy the safety and environmental requirements of the site license shall be demonstrated via the safety management prospectus. This may be one document which embraces safety, environment and security, or it may be split according to the Licensee’s preference. As required, Westinghouse will assist to ensure that such a safety management prospectus is created and maintained. In addition, Westinghouse will advise and assist in the creation of a Licensee’s nuclear baseline, whereby it can demonstrate the adequacy of its organisational structure, staffing, and competences to maintain safety. This will be based on requirements from the operator to support safety and the environment. Knowledge transfer will be systematically carried out starting from the arrangements in place during the GDA process. One such method already in place during the GDA is the involvement of the utilities in the safety and environmental document specification and review process. Once a site has been selected, WEC will provide the utility with all necessary technical, safety, and environmental input to prepare a site-specific Pre-Construction Safety Report (PCSR) and Environment Report. During the GDA, pre-construction, construction, commissioning, and operational stages, Westinghouse will engage with the Licensee in respect of the Learning from Experience processes which Westinghouse has in place. The Learning from Expierence processes will benefit from the plants being constructed in China and the USA. The requirements to alert and involve Licensees in the discussion and resolution of learning events, which have relevance to safety or the environment, will be built into the Westinghouse management arrangements. 1.5 References 1-1 EPS-GW-GL-700, Rev. 1, “AP1000 European Design Control Document,” Westinghouse Electric Company LLC, January 2010. 1-2 “A White Paper on Nuclear Power,” Department for Business, Enterprise & Regulatory Reform, January 2008. 1-3 “Nuclear Power Station Generic Design Assessment: Guidance to Requesting Parties,” Version 2, Health and Safety Executive, July 2007. UKP-GW-GL-790 12 Revision 4 1.0 Introduction UK AP1000 Environment Report 1-4 “Process and Information Document for Generic Assessment of Candidate Nuclear Power Plant Designs,” Version 1, Environment Agency, January 2007. 1-5 Grundy, C., Environment Agency Letter No. WEC70020R, Rev. 0, “Generic Design Assessment – Regulatory Issue RI-AP1000-0001,” February 2008. 1-6 UKP-GW-GL-790, Rev. 1, “UK AP1000 Environment Report,” Westinghouse Electric Company LLC, December 2008. 1-7 UKP-GW-GL-054, Rev. 1, “UK AP1000 Integrated Waste Strategy,” Westinghouse Electric Company LLC, 2011. 1-8 UKP-GW-GL-055, Rev. 2, “UK AP1000 Radioactive Waste Management Case Evidence Report for Intermediate Level Waste,” Westinghouse Electric Company LLC, 2011. 1-9 UKP-GW-GL-056, Rev. 2, “UK AP1000 Radioactive Waste Management Case Evidence Report for High-Level Waste,” Westinghouse Electric Company LLC, 2011. 1-10 UKP-GW-GL-793, Rev. 0, “AP1000 Pre-Construction Safety Report,” Westinghouse Electric Company LLC, 2011. 1-11 UKP-GW-GL-737, Rev. 2, “Plant Life Cycle Safety Report,” Westinghouse Electric Company LLC, March 2011. 1-12 Issue No: 1, “Westinghouse Environment, Health and Safety Manual,” Westinghouse Electric Company LLC. 1-13 “Quality Management System,” Rev. 5, Westinghouse Electric Company LLC, October 1, 2002. 1-14 UKP-GW-GAH-001, Rev. 4, “Project Quality Plan for the UK Generic Design Assessment,” Westinghouse Electric Company LLC, November 2010 [Westinghouse Proprietary Class 2, Protect – Commercial]. 1-15 UK NII, T/AST/049, Issue 2, “Technical Assessment Guide – Principles for the Assessment of a Licensee’s Intelligent Customer Capability,” October 2009. 1-16 UKP-GW-GL-795, Rev. 0, “UK AP1000 Westinghouse Electric Company LLC, 2011. UKP-GW-GL-790 13 NPP Decommissioning Plan” Revision 4 1.0 Introduction UK AP1000 Environment Report Table 1.3-1 RELATIONSHIP BETWEEN ENVIRONMENT REPORT AND PROCESS AND INFORMATION DOCUMENT REFERENCE ISSUES Environment Report Section 1 Environment Report Topic INTRODUCTION 1.1 Need for Nuclear Power 1.2 Regulatory Bodies 1.3 The Generic Design Assessment Process 1.4 Management System 2 P&I Document Reference Number 1.1 GENERIC PLANT DESCRIPTION 2.1 General Facility Information 1.2 2.2 Development of the AP1000 1.5 part, 2.9 part 2.3 External Appearance and Layout 1.2 2.4 Reactor Power Conversion System 1.2 2.5 Engineered Safety Features 1.5 part 2.6 Best Available Techniques Applicable to AP1000 Reactor Design 1.5 part 2.7 Plant Water Use 2.8 Transportation of Radioactive Fuel 2.9 Radioactive and Non-Radioactive Materials 3 RADIOACTIVE WASTE MANAGEMENT SYSTEMS 3.1 1.4, 2.4, A-1 3.2 ,3.4 3.1 Introduction 3.2 Minimization of Waste at Source 3.3 Gaseous Radioactive Waste 1.5 part, 2.1 part, 2.2 part, 2.9 part 3.4 Liquid Radioactive Waste 1.5 part, 2.1 part, 2.2 part, 2.9 part 3.5 Solid Radioactive Waste 1.4, 1.4.3, 1.5 part, 2.1 part, 2.4, A-1, 2.5.1, 2.5.2, 2.5.3, 2.5.4, 2.5.5 UKP-GW-GL-790 14 2.1 part Revision 4 1.0 Introduction UK AP1000 Environment Report Table 1.3-1 (cont.) RELATIONSHIP BETWEEN ENVIRONMENT REPORT AND PROCESS AND INFORMATION DOCUMENT REFERENCE ISSUES Environment Report Section 4 Environment Report Topic P&I Document Reference Number NON-RADIOACTIVE WASTE MANAGEMENT SYSTEMS 4.1 Gaseous Non-Radioactive Waste 3.3 4.2 Liquid Non-Radioactive Waste 3.3 4.3 Solid Non-Radioactive Waste 2.4 5 ENVIRONMENTAL IMPACT 5.1 Characteristics of the Generic Site 5.2 Radiological (Human Dose Assessment) 5.3 Radiological (Non-Human Dose Assessment) 6 1.3, 2.9 part 2.7, 2.8 2.10 ENVIRONMENTAL MONITORING 6.1 Proposed Regulatory Limits 2.3 6.2 Monitoring Programmes 2.6 UKP-GW-GL-790 15 Revision 4 2.0 Generic Plant Description UK AP1000 Environment Report 2.0 GENERIC PLANT DESCRIPTION 2.1 General Facility Information The GDA site consists of one AP1000 NPP on a coastal site. During its operating and decommissioning life, an AP1000 NPP will generate solid waste, liquid discharges, and gaseous emissions. To assist in understanding the sources the AP1000 NPP is described below. The AP1000 NPP is designed to provide net electrical power to the grid of at least 1000 MWe. The overall goal is plant availability of greater than 90 percent considering all forced and planned outages. The plant design objective is 60 years without the need for replacement of the reactor vessel, although the design provides for the replacement of other major components, including the steam generators. WEC has received standard design certification from the U.S. NRC for the AP1000 NPP design. 2.2 Development of the AP1000 NPP The history of the development of the AP1000 NPP design has been previously documented (Reference 2-1). Throughout the design process, consideration has been given to safety, environmental protection, and waste minimization through concepts comparable to the UK regulatory principles of As Low as Reasonably Practicable (ALARP), Best Available Techniques (BAT), and the waste management hierarchy. 2.2.1 Design Principles – Safety & Simplicity The AP1000 NPP design is founded upon rigorously holding to a few inviolate safety principles: 1. No alternating current (ac) power is required to perform any safety function. This includes the three key safety functions of: stopping the nuclear reaction removing the decay heat maintaining reactor coolant water inventory and other safety functions such as: spent fuel pit cooling main control room (MCR) habitability beyond design basis security-related mitigation features. 2. The fission product barriers of the fuel clad, the reactor vessel and coolant system, and the containment vessel are maintained. The containment vessel is an ideal barrier against radioactive releases to the environment. To transfer decay heat out of the core, natural, non-pumped mechanisms like natural circulation, evaporation, conduction, convection, and condensation are used. 3. Core damage frequency and large release frequency, as calculated by a robust probabilistic risk assessment (PRA), are minimized, by designing out failure modes in lieu of designing in mitigation features. UKP-GW-GL-790 16 Revision 4 2.0 Generic Plant Description UK AP1000 Environment Report Another underlying philosophy of the AP1000 NPP design process is that the best path to safety is through simplicity. For example, in operating plants today the reactor coolant pumps use a controlled coolant leakage system for establishing a seal on the reactor coolant pump shaft. This shaft seal is a potential source of excessive leakage of reactor coolant. Shaft seal failure mitigation features and safety-related responses to excessive leakage must be provided for these plants. In the AP1000 NPP, the shaft seals are eliminated altogether through the use of canned motor pumps. Another example is the methods of post-accident core decay heat removal. Operating plants today use a variety of systems to take reactor coolant out of containment, cool it down, and return it to the core. This creates a number of potential reactor coolant release scenarios, each requiring a mitigation strategy. In AP1000 NPP, reactor coolant remains within containment and only decay heat energy is transferred out of containment. The only remaining containment bypass, reactor coolant release scenarios are the highly unlikely leak in-containment itself and the unlikely steam generator tube leak. In addition to the design objectives of safety first and no ac power for safety-related functions, the AP1000 NPP design process included making constructability, reliability, operability, and maintainability part of the design. This approach ultimately results in a plant design that is safe, because it is simple and the objectives of lowest hazard to the public and operators, lowest risk, and lowest cost are achieved as by products of the process. Detailed discussion of the AP1000 NPP design safety issues can be found in UKP-GW-GL732, “AP1000 Pre-Construction Safety Report” (Reference 2-2). 2.2.2 Development of the AP1000 NPP Design The design of the AP1000 NPP is a development of the AP600 design (References 1-1 and 21). The AP600 design incorporated the simple safety systems evolved for the Secure Military Power Plant (SMPP) originally developed for the United States Air Force. These simple safety systems included a plant driven by natural forces to perform the safety functions of shutting down the reactor, keeping it cool, and containing its coolant. The design process used throughout the development of SMPP/AP600/AP1000 NPP is to create a safe NPP with costs, radiation exposures, and radioactive discharges ALARP. The development of the AP600 was a large design and licensing effort to produce the safest, simplest, least expensive NPP on the world market. However, other nuclear plants were not AP600’s competition, other non-nuclear power stations were. In particular, natural gas plants were the economic plants of choice in the United States. In order to compete against natural gas plants at the time, the AP600 would have to lower its cost per megawatt by over 30 percent. To lower its cost by eliminating any more systems, structures, or components would lessen its safety margins and increase its risk to the public. Obviously, this approach was rejected. Instead, it was decided to raise the power level of the design without raising the overall plant price an equivalent amount to drive the cost per megawatt down so that the cost of electricity generated by a nuclear plant could compete with natural gas plants. This design power increase needed to be constrained to reap the benefits of the design and licensing effort already invested in the AP600 design. The constraints included: 1. 2. 3. Safety first – maintain large margins to safety limits Maintain passive nature of all safety functions Maintain no operator actions for safety functions UKP-GW-GL-790 17 Revision 4 2.0 Generic Plant Description 4. 5. 6. 7. UK AP1000 Environment Report Maintain use of proven components and technology Do not change the plant footprint and lose layout and analysis already completed No design impacts unrelated to power Minimize design impacts on the DCD (Design Certification) The resulting AP1000 NPP design met cost goals while changing only those features necessary to increase power and maintain safety margins. The nuclear island footprint remained unchanged by adding height to the reactor vessel and containment vessel while maintaining their diameters. 2.3 External Appearance and Layout A schematic of the AP1000 NPP is shown in Figure 2.3-1. The site and plant layout are illustrated in Figure 2.3-2. The location of the functional components of the AP1000 NPP power generation complex is shown in Figure 2.3-3. Each AP1000 NPP unit is composed of the following principal building structures, each constructed on their own individual foundation slabs. Further details are found in Chapter 1.2 of the European DCD (Reference 1-1). 2.3.1 Nuclear Island The nuclear island comprises the containment building, shield building, and auxiliary building: The containment building is a freestanding cylindrical steel containment vessel with elliptical upper and lower heads. The containment building provides shielding for the reactor core and the reactor coolant system (RCS) during normal operations. The containment building houses the RCS and other related systems and provides a high degree of leak tightness. It provides containment of the releases of airborne radioactivity following postulated design basis accidents. The shield building is the reinforced concrete structure that surrounds the containment vessel. During normal operations, a primary function of the shield building is to provide shielding for the containment vessel and the radioactive systems and components located in the containment building. Another function of the shield building is to protect the containment building from external events. The shield building protects the containment vessel and the RCS from the effects of tornadoes and tornado produced missiles. The auxiliary building houses and protects safety-related mechanical and electrical equipment located outside the containment building, including the MCR. The auxiliary building also provides an area for handling and storage of new and spent fuel, ion exchange columns and liquid radwaste system (WLS) components. The auxiliary building rail car bay is used to accommodate the ILW stabilisation equipment when ILW is being treated (see subsection 3.5.7.2). The nuclear island structures are designed to withstand the effects of natural phenomena such as hurricanes, floods, tornados, tsunamis, and earthquakes without the loss of capability to perform safety functions. Further details are found in Chapter 3 of the European DCD (Reference 1-1). UKP-GW-GL-790 18 Revision 4 2.0 Generic Plant Description 2.3.2 UK AP1000 Environment Report Turbine Building The turbine building is a steel column and beam structure. The turbine building houses the main turbine, generator, and associated fluid and electrical systems. It provides weather protection for the laydown and maintenance of major turbine/generator components. The turbine building also houses the makeup water purification system. No safety-related equipment is located in the turbine building. 2.3.3 Annex Building The annex building is a combination of reinforced concrete and steel-framed structure with insulated metal siding. The annex building provides the main personnel entrance to the power generation complex. It includes access ways for personnel and equipment to the clean areas of the nuclear island in the auxiliary building and to the radiological control area. The building includes the health physics facilities for the control of entry to and exit from the radiological control area as well as personnel support facilities such as locker rooms. The annex building also contains the non-safety-related electric power systems, the ancillary diesel generators and their fuel supply, other electrical equipment, the control support area, and various heating, ventilating, and air conditioning systems. 2.3.4 Diesel Generator Building The diesel generator building is a single-story, steel-framed structure with insulated metal siding. It houses two identical diesel generators separated by a three hour fire wall. These generators provide backup power for plant operation in the event of disruption of normal power sources. No safety-related equipment is located in the diesel generator building. 2.3.5 Radwaste Building The radwaste building includes facilities for dealing with low level waste (LLW) produced during the operation of the AP1000 NPP. The building is used for the sorting and conditioning or treatment of various categories of LLW prior to processing, and transfers to shipping and disposal containers (see subsection 3.5.7.1). Six liquid waste monitor tanks are located within the radwaste building. These tanks contain processed effluents which are ready for release to the environment. The liquid radwaste processing areas are designed to contain any liquid spills. These provisions include a raised perimeter and floor drains that lead to the WLS waste hold-up tanks. The radwaste building is used to store the ILW waste stabilisation equipment when not in use (see Figure 3.5-9). 2.3.6 Radioactive Waste Stores 2.3.6.1 LLW Store The LLW store is a non-seismic building with sufficient space to accommodate two years of LLW production. It is located within the boundary of the licensed site to the rear of the radwaste building. UKP-GW-GL-790 19 Revision 4 2.0 Generic Plant Description 2.3.6.2 UK AP1000 Environment Report ILW Store The ILW store for the generic site is a reinforced concrete structure that can be extended at suitable intervals to suit new ILW arisings. Initially, the ILW store will be 33m long, 13.5m wide, and 14m high (externally) and has walls 1m thick. The ILW store facility incorporates a package receipt area and assay equipment and shielded vault serviced by a certified nuclear crane. Additionally, office and administration space is provided for real time record keeping, as well as an equipment room that houses heating, ventilation, and air conditioning (HVAC), and small electrical and mechanical equipment. Extension to the store will be sized to suit future waste arisings and are expected to be added in 20-year increments. The ILW store is located within the confines of the licensed site in an area large enough to accommodate future extensions of the store. The location has been selected to minimize the transportation distances between the auxiliary building and the ILW store and to facilitate safe transfer of waste. 2.3.6.3 Dry Spent Fuel Store The spent fuel store for the generic site is a seismically qualified facility and comprises spent fuel flasks, flask loading equipment within the AP1000 NPP, a suitable transport vehicle, and below ground storage cells. The spent fuel store is also located within the confines of the licensed site and retains the potential for future extension of the store. The location has been selected to minimize the transportation distances between the auxiliary building and the spent fuel store and to facilitate safe transfer of waste. 2.3.7 Other Buildings and Structures Additional plant structures include warehouses, administration/office buildings, and the switchyard and transmission towers. At coastal sites, the circulating water systems (CWS) uses once through direct seawater cooling systems with appropriate seawater intake and discharge structures. The exact layout of these seawater cooling structures will be site specific. The overall plant arrangement for an AP1000 NPP is such that building configurations and structural designs minimize the building volumes and quantities of bulk materials (concrete, structural steel, rebar) consistent with safety, operational, maintenance, and structural needs to provide an aesthetically pleasing effect. Natural features of the site are preserved as much as possible and are utilized to reduce the station’s impact on the environment. Landscaping for the site, areas adjacent to the structures and in the parking areas blend with the natural surroundings in order to reduce visual impacts. 2.4 Reactor Power Conversion System The AP1000 NPP reactor power conversion system comprises a single reactor pressure vessel, two steam generators, and four reactor coolant pumps for converting reactor thermal energy into steam. A single high-pressure turbine and three low pressure turbines drive a single electric generator. A simplified diagram of the reactor power conversion system is shown in Figure 2.4-1. UKP-GW-GL-790 20 Revision 4 2.0 Generic Plant Description 2.4.1 UK AP1000 Environment Report Reactor The AP1000 NPP reactor contains 157 mechanically identical fuel assemblies. Each fuel assembly consists of 264 fuel rods in a 17 x 17 square array. There is substantial operating experience with this type of fuel assembly. The fuel rods consist of ZIRLO™ tubing containing cylindrical pellets of sintered uranium dioxide enriched in U-235. The ZIRLO tubing is plugged and seal-welded at the ends to encapsulate the fuel. An axial blanket comprised of fuel pellets with reduced enrichment may be placed at each end of the enriched fuel pellet stack to reduce the neutron leakage and to improve fuel utilization. The reactor core is cooled and moderated by light water at a pressure of 2250 psia. Soluble boron in the moderator/coolant serves as a neutron absorber. The concentration of boron is varied to control reactivity changes that occur relatively slowly, including the effects of fuel burn-up. Burnable absorbers are also employed in the initial cycle to limit the amount of soluble boron required, and thereby maintain the desired negative reactivity coefficients. Some spaces of the 17x17 fuel rod array contain guide tubes in place of fuel. These guide tubes house instrumentation and accommodate either rod cluster control assemblies or gray rod cluster assemblies, both of which provide in-core reactivity control. Gray rods and control rods assist primarily in controlling core power distribution. Gray rods and control rods can also control reactivity to compensate for minor variations in moderator temperature and boron concentration during power operations. They can also assist in compensating for reactivity changes caused by power level and xenon changes during load following transients without the need for changing boron concentration. Normally, the reactor will operate approximately 18 months between refuelling; accumulating a cycle burn-up of approximately 21,000 megawatt–days per metric ton of uranium metal (MWD/MTU). However, a maximum fuel rod average burn-up of 62,000 MWD/MTU has been established. Refer to Chapter 4 of the European DCD for detailed information regarding the reactor design (Reference 1-1). 2.4.2 Steam and Power Conversion System The design of the major components required for power generation such as the steam generators, reactor coolant pumps, fuel, internals, turbine, and generator is based on equipment that has successfully operated in power plants. The steam and power conversion system is designed to remove heat energy from the RCS via the two steam generators and to convert it to electrical power in the turbine-generator. The reactor is connected to two steam generators via two primary hot leg pipes and four primary cold leg pipes. A reactor coolant pump is located in each primary cold leg pipe to circulate pressurised reactor coolant through the reactor core. The coolant flows through the reactor core, making contact with the fuel rods containing the enriched uranium dioxide fuel. As the coolant passes through the core, heat from the nuclear fission process is transferred from the fuel rods to the coolant. The heat is transported to the steam generators by the circulating reactor coolant and passes through the steam generator tubes to heat the feedwater from the secondary system. Reactor coolant is pumped back to the reactor by the reactor coolant pumps, where it is reheated to start the heat transfer cycle over again. Inside the steam generators, the heat from the primary system is transferred through the tube walls UKP-GW-GL-790 21 Revision 4 2.0 Generic Plant Description UK AP1000 Environment Report to convert the incoming feedwater from the secondary system into steam. The steam is transported from the steam generators by the main steam piping to drive the high-pressure and low-pressure turbines connected to the electric generator. After passing through three low pressure turbines, the steam is condensed back to water by cooled water circulating inside the tubes of three main condensers. The heat rejected in the main condensers is removed by the CWS. The condensate is then preheated and pumped back to the steam generators as feedwater to repeat the steam cycle. For detailed information regarding the steam and power conversion system refer to Chapter 10 of the European DCD (Reference 1-1). 2.4.3 Turbine Generator The turbine generator system converts the thermal energy of the steam flowing through the turbine into rotational mechanical work, which rotates a generator to provide electrical power. The turbine-generator has an output of approximately 1,200 MW for the thermal output of the Westinghouse nuclear steam supply system of 3,415 MWt (Chapter 10.1 of Reference 1-1). 2.5 Engineered Safety Features Engineered safety features protect the public in the event of an accidental release of radioactive fission products from the RCS. The engineered safety features function to localize, control, mitigate, and terminate such accidents and to maintain radiation exposure levels to the public below applicable limits and guidelines. A basic premise of the AP1000 NPP design is to maintain safety and respond to accidents without reliance on ac power. A detailed description of the safety features can be found in the PCSR (Reference 2-2). 2.6 Best Available Techniques (BAT) Applicable to AP1000 Reactor Design Over the 15 years of design duration of the AP1000 NPP and AP600, there were many design decisions that reinforced the concept of safety through simplicity, ALARP, and BAT (Reference 2-3). Examples of the decisions that relate to waste minimisation, waste generation, and waste disposal are identified below. 2.6.1 Reduction of Containment Penetrations Penetrations through the containment are designed to be leak-tight assemblies allowing pipes and cables to pass through the leak-tight containment vessel boundary. Very often, in previous designs, they are the sites of small leak paths. One of the fundamental design objectives for passive cooling of the AP1000 NPP is to isolate containment during a design basis accident with no ac supply so that only energy passes through the containment boundary, not fluids. This minimizes the number of penetrations and reduces design, inspection and maintenance burdens, and therefore, waste arisings that could result from these activities. Penetrations have been minimized by implementation of a variety of innovative techniques: Service systems in containment, for example, component cooling water or compressed air are split and routed inside containment resulting in only one supply or return penetration for each service. UKP-GW-GL-790 22 Revision 4 2.0 Generic Plant Description UK AP1000 Environment Report Some intermittent services with common fluids share common penetrations. For example, both chilled water and hot water heating services to HVAC in containment share common penetrations since they won’t be used at the same time. The fire protection water and containment spray supply systems also share a common penetration. Instrumentation and control penetrations are reduced by taking advantage of digital data highway technology. Multiplexing cabinets are located such that instrumentation and control signals share a common highway penetration in lieu of multiple individual signal penetrations. The minimization of containment penetrations reduces the risk for containment leakage and public or operator radiation exposure and minimizes the potential of waste generation from this source. 2.6.2 Reactor Coolant Pump Selection The function of the reactor coolant pump is to deliver adequate cooling water for power operations and for accident shutdown situations. The classic type of reactor coolant pump is a shaft seal pump. It can be made large and can have high hydraulic and electrical efficiencies; however, shaft seals are prone to leakage and associated liquid effluent production. Alternatives considered included direct current (dc) powered safety pumps, canned motor pumps, no pumps (natural circulation), and others. In the AP1000 NPP, hermetically sealed canned motor pumps have been selected to eliminate the potential for reactor coolant leakage from shaft seals. This decision sacrifices the efficiency of shaft seal pumps for higher inherent reliability, safety, and simplicity of maintenance. The selection of canned pumps also eliminates the shaft seal pump support systems such as seal injection, seal leak off, lube oil, and fire protection systems (FPSs). The design and operation philosophy for the canned motor pumps is one of minimal maintenance. Unlike shaft seal pumps, canned motor pumps cannot be repaired in situ and require the entire pump (motor, hydraulics, flywheel, etc.) to be removed as a unit and replaced by a spare pump. This reduces the radioactive hazard and lowers the risk to the operators. A basic premise of the AP1000 NPP design is to maintain safety and respond to accidents without reliance on ac power. For post reactor trip core cooling this meant natural circulation through the core to the reactor coolant heat sink. However, relying on natural circulation core cooling in the long term is acceptable if the core/heat sink thermal centres are far enough apart. Natural circulation does not supply sufficient cooling flow at the very beginning of a shut down transient. The passive solution is the addition of rotating inertia to the canned pumps in the form of a heavy flywheel. The new design features for additional rotating inertia were tested and proven. The pump is not expected to function post accident and its pressure boundary is continuous without any planned or unplanned leakage. In summary, the canned motor pump was chosen over the shaft seal pump for reactor coolant service because it meets the design requirements with the lowest radioactive effluent, lowest risk for accidental loss of coolant, high reliance on proven technology, lowest risk for public or operator radiation exposure, and lowest overall plant cost. UKP-GW-GL-790 23 Revision 4 2.0 Generic Plant Description 2.6.3 UK AP1000 Environment Report Load Follow with Rods Most central station NPPs today are operated as base load plants. The utilities require that new nuclear plants be designed for a defined level of load follow. To provide some level of load follow, many existing plants have systems that manage boron concentrations in and recycle boron in and out of the reactor coolant water. This requires elaborate and complicated boron and water handling systems and results in restrictions on the rate of load follow available. The use of boron and water handling systems are often associated with the production of radioactive effluent. Load follow control in the AP1000 NPP incorporates the proven, safe, and simple method of shim rods rather than the complex method of boron recycle. Shim control is the use of moveable control rods with a low density neutron absorber (gray rods) that can be moved to provide reactivity controls in addition to normal reactivity feedbacks. The gray rod cluster assembly comprises stainless steel rodlets and rodlets containing silver-indium-cadmium absorber material clad with stainless steel. Note that shim rods are used in addition to safety rods and are not needed for reactor shutdown. This solution is that it provides safety through simplicity by satisfying its design requirements with no potential radioactive effluent, no risk for accidental loss of coolant outside containment, high reliance on proven technology, lowest risk for public or operator radiation exposure, and lowest overall plant cost while maintaining complete shutdown margin in the shutdown rods. 2.6.4 Chemical and Volume Control System (CVS) The functional requirements for the CVS are to fill, make up, let down, drain, and maintain the proper chemistry of reactor coolant water. This includes removal of impurities (both radioactive and non-radioactive) from the RCS. In many operating plants today, this function is performed by taking a portion of the reactor coolant into a variety of safety-related subsystems that are outside containment. These systems reduce pressure and temperature of the reactor coolant, purify it, and pump it back into containment and the RCS with a high pressure pumping system. This process introduces potential reactor coolant leak sites outside containment with associated waste production, as well as imposing additional reactor coolant inventory control requirements. The AP1000 NPP design improvements (see Sections 2.6.2 and 2.6.3) have eliminated the requirement to continuously pump borated makeup water into the RCS or to include complicated water processing systems in the design. This has allowed simplifications to the CVS where coolant purification was developed to perform continuous purification of a portion of the reactor coolant at reactor coolant pressure (~200 bar(a)) using the reactor coolant pump head as a motive pressure and keeping all the purification equipment and reactor coolant within the containment vessel. The high pressure water purification uses ion exchange that is an industry proven process. In the AP1000 NPP, the basic design philosophy requires passive systems that eliminate the need for safety-related coolant charging or letdown. The functions of reactor coolant makeup, boron injection, letdown, purification, and others are non-safety-related making most of the system non-safety-related. Redundancies and potential safety-related failure modes associated with these functions have been eliminated. In summary, the CVS functional requirements were satisfied by simple designs using in-containment, high pressure coolant purification rather than out of containment, pumped, UKP-GW-GL-790 24 Revision 4 2.0 Generic Plant Description UK AP1000 Environment Report low pressure purification. This created a process that satisfies the design requirements with the lowest radioactive effluent, lowest risk for accidental loss of coolant, high reliance on proven technology, and lowest risk for public or operator radiation exposure. 2.6.5 Use of Demineralisers for Treatment of Reactor Coolant System Let Down Radioactive isotopes accumulate in the reactor coolant and spent fuel pool cooling water during operation. Some of these isotopes are gaseous or volatile; most are soluble or suspended in the reactor or spent fuel pool coolant water. During plant heat up or cool down, boron concentration adjustments are made using a feed and bleed system where volumes of this potentially radioactive water accumulate as waste water. In addition, volumes accumulate as a result of sampling operations or as leakage. These sources will accumulate to the point where they must be discharged from the plant. Unlike many plants, the AP1000 NPP has no planned leakage of reactor coolant from the pump shaft seal leak-off systems (see Section 2.6.2). In addition, the AP1000 NPP has no plans to recycle dissolved boron in the reactor coolant for load follow changes (see Section 2.6.3). By these design decisions, the AP1000 NPP’s radioactive water sources are reduced with the main source coming from let down during heat up. Three options were considered for the treatment of the borated radioactive let down water: 1. Storage and Recycle The potential for storage and reuse during the next plant cool down was considered. However, it was dismissed for several reasons. Storage requires additional equipment to store, monitor, process, and recycle relatively small amounts of water. The storage duration could be many months as reuse would only be possible during the next cool down. Small amounts of additional demineralised make up water are easily made between shutdowns to fulfill the cool down requirements. The approach is unnecessarily complicated and adds radiological hazard risks and additional containment and handling issues. 2. Evaporation Evaporators concentrate the radionuclides in liquid radwaste. Evaporators were dismissed because their operation is complicated, involve a number of fluid systems, use plant energy that could be used as net electrical output, and increase the potential for operator dose during maintenance. 3. Demineralisers Ion exchangers or demineralisers use disposable resin to capture radionuclides in a highly concentrated solid form. Demineralisers were selected on the basis of simplicity, reduction of equipment, operations, potential failure modes, and energy loss. The selected process satisfies the design requirements with lowest risk for accidental loss of radionuclides, high reliance on proven technology, and lowest cost. Section 3.4.5 addresses these issues further. 2.6.6 Zinc Addition Nucleate boiling, especially in high duty cores can result in build up of boron and boronlithium compounds in the RCS that has the potential to cause water stress corrosion cracking, crud-induced power shift and the release of active corrosion products into the WLS. To UKP-GW-GL-790 25 Revision 4 2.0 Generic Plant Description UK AP1000 Environment Report reduce these effects, the AP1000 NPP incorporates a zinc addition subsystem as part of the CVS to produce and maintain a zinc oxide film on primary piping and components. This zinc addition has also been found to significantly reduce occupational radiation exposure by as much as 50 percent when incorporated as early as hot functional testing. Zinc concentrations ranging from 10 parts per billion (ppb) (+/- 5ppb) are dosed into the RCS. Higher injection rates are typically used when zinc addition is first initiated in order to more quickly saturate RCS surfaces with zinc and achieve a residual zinc concentration in the coolant. Typical zinc uptake rates up to 95% occur in the first few months of zinc injection. On average these reduce to 20% - 90% of the injection rate over a given operational cycle. It is expected that up to around 5 kg of zinc will be injected during the first zinc cycle to maintain a target concentration of 10 ppb, assuming a CVS purification flowrate of 100 gpm. This zinc usage will decrease over time, potentially to 2-3 kg per cycle. 2.6.7 Air Diaphragm Waste Pumps Liquid waste water (oily, radioactive, non-radioactive) must be transferred within the plant from tank to tank or for processing and must be transferred out of the plant. In plants today, this transfer is powered by a wide variety of pump types (centrifugal, positive displacement, air operated, and others). The trade-off was to continue with this variety approach or to pick a standard pump type for all AP1000 NPP waste pump services. After consideration of the available types, the decision was made to use inexpensive, simple, air-operated, fully contained pumps for waste water service. In these types of pumps, the working fluid remains inside its pressure boundary. This eliminates any chance of seal leakage since there are no seals, especially no rotating seals. The benefit of this solution is a very safe, simple set of diaphragm pumps. The use of similar pumps for common service has the advantage of requiring the minimum number of spares for storage and familiar maintenance requirements. It also satisfies its design requirements with no potential radioactive or oily effluent, no risk for accidental loss of radioactive fluid outside containment, high reliance on proven technology, lowest risk for public or operator radiation exposure, and lowest overall plant cost. 2.7 Plant Water Use The AP1000 NPP requires water for both plant cooling and operational uses. The plant water consumption and water treatment are determined from engineering evaluations based on the AP1000 NPP design requirements and the water resources available at the specific site. For the coastal generic site, it is assumed that the cooling water requirement will be met by seawater abstraction. Mains water will be supplied to meet other facility water demands during construction and operation. A block diagram of the water supply and waste water system is shown in Figure 2.7-1. This diagram identifies the normal and maximum flow rates in the water system. Refer to Chapter 9 of the European DCD for detailed information regarding the water systems (Reference 1-1). 2.7.1 Circulating Water System (CWS) The CWS is a once through seawater cooling system that supplies seawater cooling water to remove heat from the main condensers, the turbine building closed cooling water system UKP-GW-GL-790 26 Revision 4 2.0 Generic Plant Description UK AP1000 Environment Report (TCS) heat exchangers, and the condenser vacuum pump seal water heat exchangers, under varying conditions of power plant loading and design weather conditions. Circulating water from the seawater intake basin is pumped by three 33 1/3 percent capacity vertical turbine pumps into the main condensers and heat exchangers and then returned to the seawater outfall basin. The AP1000 NPP will not operate with a significantly reduced cooling water flow. If the water flow becomes too low, the plant will trip and enter the passive cooling mode. There is sufficient hold-up capacity for a plant trip. The heat removed is rejected to the seawater cooling return basin (see subsection 4.2.3.3 and Reference 2-4). The potential impacts of the cooling water discharge are also discussed in Reference 2-4. The once through seawater cooling system will be dosed with sodium hypochlorite to control biofouling when seawater temperatures exceed 10C (Reference 2-4). 2.7.2 Service Water System (SWS) The SWS supplies cooling water to remove heat from the non-safety-related component cooling water system (CCS) heat exchangers in the turbine building. For the generic site, the SWS is also a once through seawater cooling system. However, the option to use a cooling tower is retained for particular site-specific requirements (see Section 7.2). Service water is pumped through strainers to the CCS heat exchangers for removal of heat. The once through seawater cooling system will also be dosed with sodium hypochlorite to control biofouling when seawater temperatures exceed 10C (Reference 2-4). 2.7.3 Demineralised Water Treatment System (DTS) The DTS receives water from the mains supply and processes this water to remove ionic impurities, and provides demineralised water to the demineralised water transfer and storage system (DWS). The DTS consists of two 100 percent cartridge filters, two 100 percent reverse osmosis units normally operating in series for primary demineralization, and two 100 percent electrodeionisation units for secondary demineralization. The capacity of the DTS is sufficient to supply the plant makeup demand during startup, shutdown, and power operation. Depending on the feedwater supply quality, a pH adjustment chemical (ammonium hydroxide) may be added upstream of the cartridge filters to adjust the pH of the reverse osmosis influent. The pH is maintained within the operating range of the reverse osmosis membranes to inhibit scaling and corrosion. A dilute antiscalant (polyphosphate), which is chemically compatible with the pH adjustment chemical, may also be metered into the reverse osmosis influent water to increase the solubility of salts (that is, decrease scale formation on the membranes). Both the pH adjustment chemical and antiscalant are injected into the demineralised water treatment process from the turbine island chemical feed system (CFS). The DWS provides a reservoir of demineralised water to supply the condensate storage tank and for distribution throughout the plant. In addition to supplying water for makeup of systems that require pure water, the demineralised water is used to sluice spent radioactive resins to the solid radwaste system from the ion exchange vessels in the CVS, the spent fuel pool cooling system, and the WLS. UKP-GW-GL-790 27 Revision 4 2.0 Generic Plant Description 2.7.4 UK AP1000 Environment Report Potable Water System (PWS) The PWS is designed to furnish water for domestic use and human consumption. Potable water is supplied from the mains supply. 2.7.5 Fire Protection System (FPS) The FPS provides water to points throughout the plant where wet system-type fire suppression (e.g., sprinkler, deluge, etc.) may be required. The FPS is designed to supply fire suppression water at a flow rate and pressure sufficient to satisfy the demand of any automatic sprinkler system plus 500 U.S. gallons per minute (gpm) (114 m3/h) for fire hoses for a minimum of 2 hours. Make-up water for the FPS is provided by the mains supply which feeds the fire protection storage tanks. 2.8 Transportation of Radioactive Fuel 2.8.1 New Fuel Details of the fuel storage and handling systems can be found in Chapter 9.1 of the European DCD (Reference 1-1). New fuel assemblies are transported to the site by truck, in accordance with DfT regulations. The initial fuel loading consists of 157 fuel assemblies for one unit. Every 18 months, refueling requires an average of 64 fuel assemblies for one unit. The fuel assemblies are fabricated at a fuel fabrication plant and shipped by truck to the site shortly before they are required. The details of the container designs, shipping procedures, and transportation routings depend on the requirements of the suppliers providing the fuel fabrication services. Truck shipments do not exceed the applicable gross vehicle weight restrictions. The new fuel storage facility is located in the auxiliary building fuel handling area. Fuel is received in the rail car bay at the 30.48 m (100 ft) grade elevation. The fuel containers (travellers) are offloaded one container at a time by the rail car bay overhead crane. The traveller is positioned over an embedment at grade elevation, fastened, and manually rotated to the vertical position by the traveller upender. To assist with unloading, a man-lift is provided. The traveller is equipped with accelerometers that are installed to monitor any excessive acceleration during transport. The accelerometers are checked to ensure that they have not tripped prior to fuel assembly removal. Each traveller contains one fuel assembly which is removed from the traveller using new fuel handling tool and the fuel handling machine hoist. The fuel assembly is raised through the “Bay Door” at elevation 41.22 m (135 ft – 3 in) and transported to the new fuel storage rack. The new fuel is visually inspected while it is being inserted into the rack. No scaffolding is required to support the visual inspection process. Once the fuel is seated in the storage rack, the new fuel handling tool is disengaged and removed from the fuel assembly. The cell covers are reinstalled and the process is repeated for the remaining fuel assemblies. The new fuel rack includes storage locations for 72 fuel assemblies with the maximum design basis enrichment. The rack layout provides a minimum separation between adjacent fuel assemblies which is sufficient to maintain a subcritical array even in the event the building is flooded with unborated water or fire extinguishant aerosols or during any design basis event. The racks include integral neutron-absorbing material to maintain the required degree of subcriticality. In the case of first-time fuelling, the spent fuel pool is also used for new fuel storage. UKP-GW-GL-790 28 Revision 4 2.0 Generic Plant Description UK AP1000 Environment Report The rack rests on the floor of the reinforced concrete new fuel storage pit and is braced as required to the pit wall structures. The 5.2m (17ft) deep pit is dry and unlined. Materials used in rack construction are compatible with the storage pit environment, and surfaces that come into contact with the fuel assemblies are made of annealed austenitic stainless steel. Structural materials are corrosion resistant and will not contaminate the fuel assemblies or pit environment. Neutron absorbing “poison” material used in the rack design has been qualified for the storage environment. Venting of the neutron absorbing material is considered in the detailed design of the storage rack. The new fuel storage pit is drained by gravity drains that are part of the radwaste drain system, draining to the waste holdup tanks which are a part of the WLS. These drains preclude flooding of the pit by an accidental release of water. The new fuel pit is covered to prevent foreign objects from entering the new fuel storage rack. The new fuel handling crane is used to load new fuel assemblies into the new fuel rack and transfer new fuel assemblies from the new fuel pit into the spent fuel pool. A gated opening connects the spent fuel pool and fuel transfer canal. The fuel transfer canal is connected to the in-containment refueling cavity by a fuel transfer tube. A new fuel elevator in the spent fuel pool lowers the new fuel to an elevation accessible by the fuel handling machine (FHM). The FHM is part of the fuel transfer system. The fuel transfer system is used to move up to two fuel assemblies at a time between the auxiliary building fuel handling area and the refuelling cavity in the containment building. The FHM performs fuel handling operations in the fuel handling area. Fuel is placed into a basket of the underwater transfer car for passage through the fuel transfer tube and into the refuelling cavity. The refueling machine performs fuel handling operations in the containment building. Fuel is moved between the fuel transfer system and the reactor vessel by the refueling machine. It withdraws the fuel from the refueling cavity, moves over the core area, and inserts the fuel assembly into a vacant core location. During refuelling, the vacant core location is created by prior removal of a spent fuel assembly. 2.8.2 Spent Fuel Spent fuel assemblies are discharged from the reactor every refuelling outage and are placed into the spent fuel pool. The spent fuel storage pool has the capacity to store 889 fuel assemblies. Each refuelling offload is 68 fuel assemblies. Therefore, the spent fuel storage pool has the capacity for ten refuelling offloads, which represents approximately 18 years, plus a full core offload. The spent fuel is transferred from containment to the spent fuel pool by the fuel transfer system described in Section 2.8.1. The fuel handling equipment is designed to handle the spent fuel assemblies underwater from the time they leave the reactor vessel until they are placed in a container for shipment from the site. The spent fuel pool provides storage space for spent fuel. The pool is approximately 13m (42.5 feet) deep and constructed of reinforced concrete and concrete filled structural modules. The portion of the structural modules in contact with the water in the pool is stainless steel and the reinforced concrete portions are lined with a stainless steel plate. The normal water volume of the pool is about 191,500 U.S. gallons (725 m3) of borated water with a nominal boron concentration of 2700 ppm. A spent fuel pool cooling system is provided to remove decay heat which is generated by stored fuel assemblies from the water in the spent fuel pool. Spent fuel is stored in high density racks which include integral neutron absorbing material to maintain the required degree of subcriticality. The racks are designed to store fuel of the maximum design basis enrichment. The design of the racks is such that a fuel assembly UKP-GW-GL-790 29 Revision 4 2.0 Generic Plant Description UK AP1000 Environment Report cannot be inserted into a location other than a location designed to receive an assembly. An assembly cannot be inserted into a full location. The spent fuel assemblies can normally be stored in the spent fuel pool for approximately 18 years, until fission product activity is low enough and cooling is sufficient to permit transfer to the HLW dry storage cask. Westinghouse has proposed the option of using the Holtec system as the dry storage casks of choice (see subsections 3.5.7.3 and 3.5.8.3). The spent fuel assemblies are then transferred to the dry storage canister that is then placed in an underground storage cask which is designed to shield radiation. The process of loading spent fuel is carried out in the following steps: A clean, empty canister is brought into the cask washdown pit by the cask handling crane and washed with demineralised water. The cask lid is removed and stored while the remainder of the cask is washed. The clean, empty cask is then properly positioned in the flooded cask loading pit. The FHM is positioned over the specific fuel assembly to be shipped out of the spent fuel storage rack. The fuel assembly is picked up and transported into the cask loading pit. During the transfer process, the fuel assembly is always maintained with the top of the active fuel at least 9.5 feet (2.9m) below the water surface. This provides confidence that the direct radiation from the fuel at the surface of the water is minimal. Once the fuel transfer process is complete, the lid is placed on top of the canister. The canister is then moved to the washdown pit and cleaned with demineralised water. Decontamination procedures can be started at this time. When the canister is satisfactorily decontaminated, it is lifted out of the cask washdown pit by the cask handling crane and prepared for transfer to the HLW store (see subsection 3.5.8.3). During the operations, sufficient water is maintained between plant personnel and fuel assemblies that are being moved to limit dose levels to those acceptable for continuous occupational exposure. 2.9 Radioactive and Non-Radioactive Materials This section identifies the radioactive materials and non-radioactive chemicals that are stored on an AP1000 NPP site. The primary storage and secondary containment systems that prevent releases to the environment are described. 2.9.1 Inventory of Radioactive Materials and Radioactively Contaminated Chemicals 2.9.1.1 Fuel Rods The fuel rods consist of uranium dioxide ceramic pellets contained in cold-worked and stress-relieved ZIRLO tubing. The fuel rods include integral fuel burnable absorbers, for example boride-coated fuel pellets. The reactor contains 41,448 fuel rods in 157 fuel assemblies. The total fuel weight is 95975kg (211588 lb) of uranium dioxide. UKP-GW-GL-790 30 Revision 4 2.0 Generic Plant Description 2.9.1.2 UK AP1000 Environment Report In-Core Control Components In addition to the burnable absorbers, reactivity control is provided by neutron-absorbing rods and gray rods. 2.9.1.3 Reactor Coolant The reactor coolant liquid volume at power conditions is 9600 ft3 (272 m3) which includes (1000 ft3) 28 m3 pressuriser liquid. The CVS provides a means for adding chemicals to the RCS. The reactor coolant contains the following chemicals which become contaminated with radioisotopes by passage through the reactor: Boric Acid The RCS contains demineralised and borated water that is circulated at the flow rate and temperature consistent with achieving the reactor core thermal and hydraulic performance. The soluble boron in the form of boric acid is added to the reactor coolant to serve as a neutron absorber/moderator. The concentration of boron is varied to control reactivity changes that occur relatively slowly, including the effects of fuel burn-up (chemical shim control). Boron concentrations in the reactor coolant typically range between 612 ppm to 2700 ppm. Lithium 7 Hydroxide The pH control chemical is lithium hydroxide monohydrate, enriched in the lithium-7 isotope to 99.9 percent. This chemical is chosen for its compatibility with the materials and water chemistry of borated water/stainless steel/zirconium/nickel-chromium-iron systems. In addition, lithium-7 is produced in solution from the neutron irradiation of the dissolved boron in the coolant. The lithium-7 hydroxide is introduced into the RCS via the charging flow. The concentration of lithium-7 hydroxide in the RCS is maintained in the range specified for pH control. The concentration of lithium-7 in the RCS is varied between 0.7 ppm and 2.2 ppm as a function of the boric acid concentration of the RCS. Hydrazine During reactor start up from the cold condition, hydrazine is used as an oxygen-scavenging agent. The hydrazine solution is introduced into the RCS at a concentration of 10 ppm to reduce oxygen to less than 0.1 ppm in the reactor coolant. Once above 200°F (93.3°C), the oxygen concentration is maintained below 0.005 ppm by the addition of hydrogen. Zinc Acetate Addition of soluble zinc acetate to the reactor coolant leads to the incorporation of zinc into oxide films on wetted reactor component surfaces, steam generator tubing and RCS piping. This reduces ongoing corrosion of austenitic stainless steel and nickel-based alloys. Zinc acetate is injected into the RCS to maintain a maximum zinc concentration of 10ppb (+/- 5ppb). UKP-GW-GL-790 31 Revision 4 2.0 Generic Plant Description 2.9.1.4 UK AP1000 Environment Report Borated Water Boric acid is added to water in the following systems (in addition to the reactor coolant): Spent Fuel Pool/Fuel Transfer Canal The spent fuel pool provides storage space for spent fuel and the fuel transfer canal provides an underwater passage for the transfer of spent fuel. The normal water volume of the pool is about 191,500 U.S. gallons (725m3) and the fuel transfer canal is 64,100 U.S. gallons (243 m3). Both the spent fuel pool and transfer canal are kept full of borated water with a nominal boron concentration of 2700 ppm. Demineralised water can be added for makeup purposes, including replacement of evaporative losses, from the DWS. Boron may be added to the spent fuel pool from the CVS. In-Containment Refueling Water Storage Tank (IRWST)/Refueling Cavity The volume of the IRWST is 565,500 U.S. gallons (2141 m3) and it contains a nominal boron concentration of 2700 ppm. The borated water is transferred to the refuelling cavity prior to a refuelling and then back to the IRWST by the spent fuel pool cooling system. The volume of borated water required to flood the refuelling cavity is 350,000 U.S. gallons (1325 m3). Cask Washdown Pit The cask washdown pit is flooded with borated water to provide shielding before spent fuel assemblies are transferred to a shipping cask. The minimum volume of the cask washdown pit is 39000 U.S. gallons (148 m3). The nominal boron concentration is 2700 ppm. 2.9.1.5 Absorption Media Chemical Volume Control System (CVS) Demineralisers The CVS demineralisers maintain RCS fluid purity and activity level within acceptable limits. The purification loop operates at RCS pressure. The purification fluid flows through a mixed bed demineraliser, optionally through a cation bed demineraliser, and through a filter. It returns to the suction of a reactor coolant pump after being heated in the regenerative heat exchanger. Two stainless steel vessels contain mixed ion exchange resin beds in the Li7OH form. Each bed contains approximately 50 ft3 (1.4 m3) of resin. A third bed of similar size contains a cationic resin in the H+ form. Spent Fuel Pool Demineralisers Two mixed bed type demineralisers are provided to maintain spent fuel pool purity. The demineralisers are initially charged with a hydrogen type cation resin and hydroxyl type anion resin to remove fission and corrosion products. The demineralisers will be borated during initial operation with boric acid. Each demineraliser is sized to accept the maximum purification flow from its respective cooling train. The ion exchange resin are held in two stainless steel vessels that hold approximately 75 ft3 (2.1 m3) of resin each. UKP-GW-GL-790 32 Revision 4 2.0 Generic Plant Description UK AP1000 Environment Report Liquid Radwaste System The liquid radwaste system (WLS) provides treatment of radioactive effluent. The WLS has four stainless steel vessels containing absorption media in the treatment train. The first vessel contains 50 ft3 (1.4 m3) of layered activated charcoal above the zeolite resin. The next vessel contains 30 ft3 (0.85 m3) of cationic resin. Each of the final two vessels contain 30 ft3 (0.85 m3) of mixed resin. Gaseous Radwaste System The gaseous radwaste system (WGS) provides treatment of radioactive air emission. The WGS activated carbon guard bed removes residual moisture as well as iodine from the gas stream. The guard bed is a stainless steel vertical pipe with a nominal volume of 8 ft3 (0.23 m3). The main part of the WGS is two activated carbon delay beds. These are in series and each comprise a carbon steel vertical serpentine tube containing of 80 ft3 (3 m3) of activated carbon. Stabilised ILW When the absorption media described above nears exhaustion, it is removed as ILW for treatment, stabilisation, and storage. Details can be found in Section 3.4.2. 2.9.2 Non-Radioactive Chemical Inventory Chemicals are stored at the AP1000 NPP on the turbine island, the nuclear island, and in the yard with the seawater cooling system. The inventory and chemical content of each tank on the turbine, nuclear island, and seawater cooling system are summarised in Tables 2.9-1, 2.9-2, and 2.9-3, respectively. 2.9.2.1 Control of Major Accident Hazards An evaluation of the applicability of the Control of Major Accident Hazards (COMAH) regulations has been carried out on the storage quantities of chemicals in Tables 2.9-1, 2.9-2, and 2.9-3 (Reference 2-5). Based on the current specification, the AP1000 NPP site will be a lower tier COMAH site. This is because the proposed hydrazine inventory in Tank MT-01 is 1.1 tonnes (see Table 2.9-1) which exceeds the lower tier COMAH threshold of 0.5 tonnes (Reference 2-5). The hydrazine inventory does not exceed the top tier COMAH threshold of 2 tonnes (Reference 2-5). Other chemicals listed in Tables 2.9-1, 2.9-2, and 2.9-3 do not fall under COMAH because they do not have the defined hazardous properties or they are not stored in volumes that exceed the COMAH threshold quantities. 2.9.2.2 Substances Under the Groundwater Directive The existing Groundwater Directive (80/68/EEC, Reference 2-6) aims to protect groundwater from pollution by controlling discharges and disposals of certain dangerous substances to groundwater. In the UK, the directive is implemented through the Groundwater Regulations 2009. Groundwater is protected under these regulations by preventing or limiting the inputs of listed substances into groundwater. Substances controlled under these regulations fall into two lists: UKP-GW-GL-790 33 Revision 4 2.0 Generic Plant Description UK AP1000 Environment Report List I substances are the most toxic and must be prevented from entering groundwater. Substances in this list may be disposed of to the ground, under a permit, but must not reach groundwater. They include pesticides, sheep dip, solvents, hydrocarbons, mercury, cadmium, and cyanide. List II substances are less dangerous, and can be discharged to groundwater under a permit, but must not cause pollution. Examples include sewage, trade effluent, and most wastes. Substances in this list include some heavy metals and ammonia (which is present in sewage effluent), phosphorus, and its compounds. Some of the chemicals used on the AP1000 NPP fall within the List I and List II substances under the Groundwater Directive. These are identified in Table 2.9-4. 2.9.2.3 Substances Under the Dangerous Substances Directive The Dangerous Substances Directive (76/464/EEC) and its “daughter” directives (Reference 2-7) control discharges that are liable to contain dangerous substances and that go to inland, coastal, and territorial surface waters. Dangerous substances are toxic substances that pose the greatest threat to the environment and human health. The directive specifies two lists of Dangerous Substances. List I covers those which are particularly toxic, persistent, and which may tend to accumulate in the environment. List II covers substances whose effects are still toxic, but less serious. The directive requires that pollution by List I substances is eliminated and pollution by List II substances is minimised. All discharges that are liable to contain dangerous substances must be authorised. The directive also specifies some requirements for environmental monitoring. Some of the chemicals used on the AP1000 NPP fall within the List I and List II substances under the Dangerous Substances Directive. These are identified in Table 2.9-5. The list includes halogenated by-products of seawater chlorination, which is discussed further in Section 4.2.5. 2.9.3 Chemical Storage The inventory of chemicals stored on-site is presented in Table 2.9-6. 2.9.3.1 Turbine Island The chemical inventory on the turbine island is stored in the northeast corner of the turbine building at ground level (reference elevation 100' 0") in an area reserved for chemical storage (see Figure 2.9-1). There are six tanks in the southern group (left side) and one spare location for a future addition, if needed. The five tanks on the north side (right side) of the chemical storage area are separated into groups of two and three. The storage and handling equipment arrangement for each type of chemical is almost identical. Figure 2.9-2 presents an elevation view of an arrangement of the southernmost group of storage tanks. Each chemical is stored in a tank assembly consisting of an upper removable tote container and a permanent lower stainless steel covered rectangular tank. The movement of chemical tote containers to the storage area is via fork truck. The upper tote container and its associated lower tank are each nominally 400 U.S. gallons (1.514 m3) in capacity. The total capacity of each tank assembly is 800 U.S. gallons (3.028 m3). A filled tote container is connected to the lower permanent tank using a quick connect on a flexible hose. An isolation valve is opened to permit the draining of the upper tote into the lower tank. Vents at the tops of each tank allow air to fill in behind the draining liquid and UKP-GW-GL-790 34 Revision 4 2.0 Generic Plant Description UK AP1000 Environment Report flow out when displaced by the filling liquid. Vented air is directed to a pipe vent leading to the outside of the turbine building at a high elevation. Each vent line can be individually isolated. The lower tank has a level transmitter with a local display to permit the operator to observe the level inside the tank. When the lower tank is full, the isolation valve between tanks may be closed, holding any excess in the upper tote container until needed later. However, it is not necessary to isolate the two tanks until it is time to remove an empty tote container for refill. The piping, valves, and hoses are suitable for more than 150 psig internal pressure, and under normal operation only need to contain a few inches of solution head pressure (<2 psig). The chemical handling procedures require closing the isolation valve prior to disconnecting the quick connects. The preferred quick connect type is self-closing. Upon disconnection, the ends automatically seal and retain the contents. Inadvertent mispositioning of valves does not result in a spill upon disconnection. The storage arrangement and scheme for liquid transfer between tanks eliminates the potential release of chemicals within the turbine building. Figure 2.9-3 is a photograph of a typical rugged tote container certified for transportation of hazardous materials. Operating plants have typically chosen stainless steel tote containers similar to the one shown. The exact container used for transporting hydrazine to an AP1000 NPP will be a site-specific choice by the owner/operator of the plant. 2.9.3.2 Standby Diesel Fuel Oil The Standby Diesel and Auxiliary Boiler Fuel Oil System (DOS) fuel storage tanks are each 60,000 U.S. gallons (227 m3) and are located away from the main plant buildings (see Figure 2.3-2, Item No. 18). There are two smaller diesel generator day tanks located in the Diesel Generator Building. These three tanks each have a volume of 1300 U.S. gallons (4.9 m3). There is also an ancillary diesel generator fuel oil tank 650 U.S. gallons (2.46 m3) located in the southeast corner of the Annex Building. 2.9.3.3 Central Chilled Water System (VWS) There is low capacity chemical storage associated with the VWS. The chemicals include sodium molybdate/tolytriazole and ethylene/propylene glycol. However, Westinghouse is currently in the process of revising the low capacity chiller design to remove the need for ethylene glycol and replace with electrical heat trace. The volume of the sodium molybdate/tolytriazole storage is 20 U.S. gallons (0.076 m3). 2.9.3.4 Chemical Volume Control System (CVS) A zinc injection package is included in the CVS design to allow for continuous addition of zinc acetate solution into the RCS. The zinc acetate is kept in the stainless steel zinc addition tank which has a volume of 200 U.S. gallons (0.76 m3). 2.9.3.5 Reactor Coolant Supply The stainless steel boric acid tank holds 80,000 U.S. gallons (303 m3) of boric acid at a maximum concentration of 4375 mg/l. The tank is located outside the Annex Building (see Item in 20 Figure 2.3-2). UKP-GW-GL-790 35 Revision 4 2.0 Generic Plant Description UK AP1000 Environment Report The boric acid storage tank capacity is sized to permit one shutdown to cold shutdown, followed by a shutdown for refueling, at the most limiting time in core cycle with the most reactive control rod withdrawn. This assures that the tank size is large enough to not interfere with normal plant operations. The concentration of boric acid is selected to eliminate the need to provide heat tracing for the purpose of preventing boric acid precipitation. Only normal freeze protection is required to maintain solubility of the 2.5 weight percent boric acid. This freeze protection is provided by an immersion heater in the tank, which maintains a minimum temperature of 45°F (7.2°C) to ensure boric acid solubility. A Boric Acid Batching Tank with a volume of 800 U.S. gallons (3.03 m3) is used to supply the Boric Acid Tank. This tank is located in the Annex Building. Lithium7 hydroxide is injected on a manual, as needed basis through the CVS chemical mixing tank. The amount of lithium7 hydroxide stored on site in a warehouse will be decided by the utility. 2.9.3.6 Fire Protection System The diesel fuel supply for the diesel-driven fire pump is in the diesel-driven fire pump enclosure which is located in the yard more than 50 feet from safety-related structures. The diesel is supplied from a 240 U.S. gallon (0.91 m3) diesel tank. 2.9.3.7 Seawater Cooling System The chemical dosing system required for the seawater cooling supply is a site-specific design. Three 10000 U.S. gallon (37.9 m3) chemical tanks are located in the yard next to the CWS. These tanks contain sodium hypochlorite, ammonium hydroxide and polyacrylate/ polyphosphate/orthopolyphosphate. 2.9.4 Prevention of Contamination - Chemical Storage Systems The secondary containment systems provided for the AP1000 NPP chemical storage tanks are shown in Table 2.9-6. 2.9.4.1 Turbine Island All of the CFS storage tanks are in the Turbine Building Chemical Storage Tank Dike Area (see Figure 2.9-1). The concrete curb around the chemical storage area is 11.2 m long x 6.9 m wide x 0.2 m high giving a retention volume of 15.5 m3. This volume is more than the volume of the largest tank stored within the bund (3.03 m3) and more than 25% of the total volume of the chemicals (~22 m3) stored within the bund (see Table 2.9-6). The bund complies with the UK guidance that it should have a minimum capacity of either 110 percent of the capacity of the largest tank, or 25 percent of the total capacity of all the tanks within the bund, whichever is greater (Reference 2-8). The chemical storage area has a plugged floor drain. The WWS catch basin serving this area is covered so that spills can be contained. When washing down the area, the cover can be removed to allow water to enter the catch basin. The catch basin then feeds into the Turbine Building sumps. The Turbine Building sumps are concrete lined with a fibre-reinforced epoxy coating. The two Turbine Building sumps provide effective tertiary containment, each having a volume of 25,675 U.S. gallons (92 m3). UKP-GW-GL-790 36 Revision 4 2.0 Generic Plant Description 2.9.4.2 UK AP1000 Environment Report Standby Diesel Fuel Oil Each DOS fuel storage tank is surrounded by a concrete dike which is sized to hold 110 percent of the tank capacity (i.e., 66,000 U.S. gallons (252 m3)). The secondary containment complies with the requirements of the Control of Pollution (Oil Storage) (England) Regulations 2001. There is a drain in each of the dikes which drains them to the Diesel Fuel Oil Area Sump (MT04) which has a capacity of 2000 U.S. gallons (7.6 m3). The manual ball valves from the dike drain sump both have to be normally “closed.” The operator has to check the liquid level inside the dike regularly or after the storm event. Then, the operator has to decide which valve to be opened. If there is no oil leak, the clean storm water can directly drain to the clean water sewer. If oil is presented, the valve discharging to the Diesel Fuel Oil Area Oil Sump has to be opened to allow controlled collection of the oil. The Diesel Generator Building Sump (580 U.S. gallons (2.2 m3)) and the Annex Building Sump (2500 U.S. gallons (9.5 m3)) provide the secondary containment for the small diesel oil day tanks for the diesel generator and ancillary diesel generator, respectively. This will be reviewed during site-specific analysis and designed as necessary to ensure that the secondary containment will comply with UK guidance (Reference 2-8). 2.9.4.3 Central Chilled Water System Secondary containment for the small volume chemical storage located in the Turbine Building is provided by the Turbine Building Sump. This is a concrete-lined, fibre reinforced, epoxy coated sump with a volume of 51,350 U.S. gallons (194.4 m3). 2.9.4.4 Chemical Volume Control System The Turbine Building Sump also provides the secondary containment for the zinc acetate stored in the zinc addition tank. 2.9.4.5 Reactor Coolant Supply There is currently no secondary containment designed for the Boric Acid Storage Tank. This will be reviewed during site-specific analysis and designed as necessary to ensure that the secondary containment will comply with the UK guidance (Reference 2-8). The secondary containment for the Boric Acid Batching Tank, Chemical Mixing Tank, and Lithium7 hydroxide tank is provided by the Auxiliary Building Sump. This is a concrete-lined, fibre reinforced, epoxy coated sump with a volume of 2500 U.S. gallons (9.5 m3). 2.9.4.6 Fire Protection System The diesel tank feeding the diesel driven fire pump is located within a concrete dike in the yard. This will be reviewed during site-specific analysis and designed as necessary to ensure that the secondary containment will comply with UK guidance (Reference 2-8). 2.9.4.7 Seawater Cooling System The three 10000 U.S. gallon (37.9 m3) tanks used to contain sodium hypochlorite, ammonium hydroxide and polyacrylate/polyphosphate/orthopolyphosphate currently do not have a secondary containment design. This will be reviewed during site-specific analysis and designed as necessary to ensure that the secondary containment will comply with UK guidance (Reference 2-8). UKP-GW-GL-790 37 Revision 4 2.0 Generic Plant Description 2.9.5 UK AP1000 Environment Report Prevention of Contamination – Radioactive Systems In the AP1000 NPP, radioactive contamination from the facility is minimised by using structure, system, and component designs and operational procedures that limit leakage and/or control the spread of contamination. Westinghouse prepared a document (Reference 2-9) to demonstrate that these practices address the U.S. NRC Regulatory Guide 4.21 (Reference 2-10) which is considered good practice. 2.9.5.1 Construction Features The nuclear island basemat, extending beneath the containment and the auxiliary building, is made using techniques which result in a monolithic basemat, without expansion joints. The walls are built as a single monolithic structure with the basemat, without expansion joints or other building joints. The concrete used for building construction is thick and extensively waterproofed. This precludes leakage from the radioactive equipment located in this building to the environment. The modular construction technique used results in a large number of walls in the radiologically-controlled areas which are comprised of concrete contained within permanent steel forms. This left-in-place steel will be coated with paints and sealants to minimize the potential for contamination to penetrate. This not only reduces waste and background radiation during operation, but also greatly reduces decommissioning wastes, since the need for concrete scarification will be minimized. The number of passageways (doors) between the radiologically controlled area and the environment has been minimized. Where such doors are incorporated, systems of drains and floor and exterior concrete sloping are used to prevent (potentially radioactive) fluid from the interior of the buildings from exiting the buildings, and also to prevent surface water from entering the buildings. Decontamination of potentially contaminated areas and equipment within the plant is facilitated by the application of epoxy paints and suitable smooth-surface coatings to the concrete floors and walls. Sloping floors with floor drains are provided in potentially contaminated areas of the plant. In addition, radioactive and potentially radioactive drains are separated from non-radioactive drains. 2.9.5.2 Radioactive Liquid Tanks Radioactive liquids in an AP1000 NPP are contained within the reactor vessel, steam generators, the RCS, the WLS, and connected auxiliary systems. All radioactive tanks are located inside appropriately designed buildings within the radiologically controlled area. Therefore, any leakage from these tanks would accumulate in the radiogically controlled area of the plant, where adequate provisions have been made through floor drains and sealed surfaces to prevent the spread of contamination. In particular, incursion of radioactive fluid into the groundwater due to a long-term leak in one of these tanks is completely precluded. No underground radioactive tanks, other than tanks located in buildings, are used in the design. No flat-bottomed radioactive tanks are used in the design. Radioactive tanks are equipped with high level alarms to alert the operators before a tank overflows. Overflow lines are piped to optimum collection points (generally to another waste collection tank or the radioactive waste drain system). UKP-GW-GL-790 38 Revision 4 2.0 Generic Plant Description 2.9.5.3 UK AP1000 Environment Report Piping The simplicity of the AP1000 NPP design reduces lengths of contaminated piping and the number of nuclear systems pumps and valves, thereby reducing the potential for leaks. To the extent possible, all radioactive piping is located inside the auxiliary building and the containment vessel. This minimises the potential for leakage to the groundwater from piping or fittings. The few exceptions are: Process piping to and from the radwaste building: This piping can be fully, visually inspected from the radwaste building pipe trench to the auxiliary building wall; only the short portion of the pipe embedded in the auxiliary building wall is not visible. Drain lines from the radwaste building and annex building back to the auxiliary building: This piping is not normally water-filled. These lines can be fully, visually inspected from the radwaste building pipe trench to the auxiliary building wall; only the short portion of the pipe embedded in the auxiliary building wall is not visible. The monitored radwaste discharge pipeline: The monitored radwaste discharge pipeline is engineered to preclude leakage to the environment. This pipe is routed from the auxiliary building to the radwaste building (the short section of pipe between the two buildings will be fully available for visual inspection as noted above) and then out of the radwaste building to the licensed release point for dilution and discharge. The discharge radiation monitor and isolation valve are located inside the radiologically controlled area. The exterior piping is designed to preclude inadvertent or unidentified releases to the environment; it is either enclosed within a guard pipe and monitored for leakage, or is accessible for visual inspection. No valves or vacuum breakers are incorporated outside of monitored structures. The use of embedded pipes has been minimized consistent with maintaining radiation doses ALARP. To the extent possible, pipes have been routed in accessible areas such as dedicated pipe routing tunnels or pipe trenches, which will provide good conditions for decommissioning. 2.9.5.4 Floor Drains and Sumps All floor drains in radioactive areas are grouted into the surrounding concrete to ensure that any leakage will be collected in the floor drain, and not bypass the drain. Sumps which may contain radioactivity (the containment sump and the radioactive auxiliary building sump) are constructed from stainless steel and are fully surrounded by concrete to ensure that any leakage will be collected in the sump and that no bypass paths exist. Sumps are covered to keep out debris. Covers are removable, or manholes are provided for access. The total capacity of each sump includes a 10 percent freeboard allowance to permit operation of high-high level alarms and associated controls before the overflow point is reached. UKP-GW-GL-790 39 Revision 4 2.0 Generic Plant Description 2.9.5.5 UK AP1000 Environment Report Spent Fuel Pool The spent fuel pool and connected pools that contain borated water are designed with redundant means of protection and detection to eliminate unidentified leakage to the groundwater (Reference 2-9): 2.9.5.6 The walls of these pools will be constructed using modular construction techniques, allowing higher quality than typical “in the hole” construction. The pools have liners to prevent borated water from corroding the concrete or structural steel behind the liner. Leaks in spent fuel pools are primarily associated with welds. In the AP1000 NPP spent fuel pool design, the number of welds has been significantly reduced. The advanced welding techniques which will be employed will minimize the potential for weld failures during operation, and allow for inspection to verify weld quality. The pools walls are made of a 0.5-inch stainless steel plate joined to one another with full penetration welds; these welds will be fully inspected prior to being placed into service. The thickness of the wall plate and the use of full penetration welds ensure that the walls will not be damaged by fuel handling, including tool manipulation and storage. All welds in the liners are equipped with leak chases, which means that the the tank is effectively double-walled in the area of plate joint. The leak chases provide for evidence of leakage and direct any contaminated leakage flow to the waste handling systems (see subsection 2.9.5.6). They also prevent leaching of active fluid into concrete, if a leak occurs. To the extent possible, these pools are located entirely inside the auxiliary and containment building, so that any theoretical leakage from the tanks would accumulate in the building rather than to the environment. Specifically, for pools other than a portion of the fuel transfer canal, the concrete support structure of the pools may be inspected from rooms adjacent to or below (i.e. outside) the pool. Leak Chase Subsystem Leak chases are provided for pools inside containment and in the auxiliary building, which are filled with borated water. The leak chases are provided to prevent borated water from getting behind the various pool liner plates and potentially corroding the structural elements behind the pool liners. The leak chase subsystems consist of collection channels (which are part of the CA structural modules) surrounding pool welds, collection piping, headers, collection pots, and the associated valves and instrumentation. The leak chase subsystems are zoned to allow identification of the source of leakage. Headers are provided for each of the zones with isolation valves to support leakage testing and localization of the leak. Pots with level instruments are provided to collect, detect, and quantify any leakage. UKP-GW-GL-790 40 Revision 4 2.0 Generic Plant Description UK AP1000 Environment Report This leak detection system will use piping which is adequately sized to allow testing and to minimize the potential for blockage by encrustation of precipitates (boric acid), and will facilitate removal of any such blockage. The leak chase subsystems are part of the Liquid Radwaste System (WLS) and the Radioactive Waste Drain System (WRS). The leak chases for the pools inside containment are part of the WLS. These leak chases would capture potential leakage from the fuel transfer tube, refuelling cavity, and the incontainment refuelling water storage tank (IRWST). The leak chases for the pools outside containment are part of the WRS. These leak chases would capture potential leakage from the fuel transfer canal, spent fuel pool, cask loading pit, and the cask washdown pit. 2.10 References 2-1 APP-GW-GER-005, Rev. 1, “Safe and Simple: The Genesis and Process of the AP1000 Design,” Westinghouse Electric Company LLC, August 2008. 2-2 UKP-GW-GL-793, Rev. 0, “AP1000 Pre-Construction Safety Report,” Westinghouse Electric Company LLC, 2011. 2-3 UKP-GW-GL-026, Rev. 2, “AP1000 Nuclear Power Plant BAT Assessment,” Westinghouse Electric Company LLC, 2011. 2-4 UKP-GW-GL-034, Rev. 1, “Generic Assessment of the Impacts of Cooling Options for the Candidate Nuclear Power Plant AP1000,” Westinghouse Electric Company LLC, February 2010. 2-5 UKP-GW-GL-037, Rev. 1, “Applicability of COMAH Regulations to AP1000,” Westinghouse Electric Company LLC, January 2010. 2-6 “Council Directive 80/68/EEC of 17 December 1979 on the protection of groundwater against pollution caused by certain dangerous substances,” European Commission, 1980. 2-7 “Directive 76/464/EEC – Water pollution by discharges of certain dangerous substances,” European Commission, 2006/11/EC. 2-8 Health and Safety Executive, “COMAH Competent Authority Policy on Containment of Bulk Hazardous Liquids at COMAH Establishments,” HSE Books, February 2008. 2-9 APP-GW-GLN-098, Rev. 0, “Compliance with 10CFR20.1406,” Westinghouse Electric Company LLC, April 2007. 2-10 Regulatory Guide 4.21, “Minimization of Contamination and Radioactive Waste Generation: Life-Cycle Planning,” U.S. Nuclear Regulatory Commission, June 2008. 2-11 EPS-GW-GL-700, Rev 1, “AP1000 European Design Control Document,” Westinghouse Electric Company LLC, January 2010. UKP-GW-GL-790 41 Revision 4 Ammonium Hydroxide Ammonium Hydroxide Sodium Sulfite and Sodium Hydroxide Polyphosphate Ammonium Chloride Ammonium Hydroxide No. 2 Diesel Fuel Oil No. 2 Diesel Fuel Oil No. 2 Diesel Fuel Oil MT03 MT04 MT05 MT07 MT08 MT11 MT01 A/B MT02 A/B MT03 UKP-GW-GL-790 pH control chemical – monoethanolamine (actual pH control additive used may differ) MT02 m3 Concentration (%w/v) 800 800 800 240 800 800 800 800 3.028 3.028 3.028 0.9 3.028 3.028 3.028 3.028 30% 25% <100% 30% 30% 30% 40% 35% Turbine Island Chemical Feed System (CFS) U.S. gallons Volume 650 2600 120000 42 2.5 9.8 454.2 100% 100% 100% Standby Diesel and Auxiliary Boiler Fuel Oil System (DOS) Hydrazine Chemical(1) Table 2.9-1 2.5 9.8 454.2 0.9 0.8 <3.0 0.3 0.9 0.9 1.23 1.1 Revision 4 DOS DOS DOS DTS SWS DTS ASS ASS, FWS, CDS, BDS ASS, FWS, CDS, BDS FWS, CDS, BDS ASS, FWS, CDS, BDS Affected System UK AP1000 Environment Report Mass Chemical (tonnes) CHEMICAL INVENTORY ON AP1000 NPP TURBINE ISLAND MT01 Tank 2.0 Generic Plant Description Nitrogen Nitrogen Hydrogen Hydrogen Carbon Dioxide Sodium Molybdate/Polytriazole Ethylene/Propylene Glycol Zinc Acetate Liquid Gas (3 bottle) Liquid Gas (1 bottle) Liquid MT02/MT05 MT02/MT05 Zinc Addition Tank m3 2967.6 14.2 5.7 785.4 5.7 100% 100% 100% 100% 100% 200 45 45 0.8 Zinc Addition Subsystem 0.2 0.2 <40% <50% <50% Central Chilled Water System (VWS) 104800 scf 500 scf 1500 0.9 Plant Gas System (PGS) 27735 scf 1500 240 100% Concentration (%w/v) Fire Protection System (FPS) U.S. gallons Volume UKP-GW-GL-790 43 Note: 1. The selection of chemicals may change based on site-specific requirements and site-operating experience. No. 2 Diesel Fuel Oil Chemical(1) Table 2.9-1 (cont.) <0.32 <0.1 <0.1 6 0.001 0.4 0.9 4.6 0.9 Revision 4 CVS VWS VWS PGS PGS PGS PGS PGS FPS Affected System UK AP1000 Environment Report Mass Chemical (tonnes) CHEMICAL INVENTORY ON AP1000 NPP TURBINE ISLAND MT02 Tank 2.0 Generic Plant Description Lithium7 Hydroxide Hydrazine Lithium7 Hydroxide Tank Hydrazine Tank Polyacrylate or polyphosphate or orthopolyphosphate Sodium Hydrochlorite Ammonium Hydroxide MT09 MT10 Chemical MT06 UKP-GW-GL-790 5 5 1500 80,000 U.S. Gallons 0.019 0.019 5.7 302.8 m3 Table 2.9-3 Volume 35% <12% 100% 0.4375% Concentration (% w/v) 10,000 10,000 10,000 U.S. Gallons Volume 44 37.85 37.85 37.85 m3 30% 30% <100% Concentration (% w/v) 11.4 11.4 <37.85 Mass of Chemical (tonnes) 0.007 <0.002 0.4 132.4 Revision 4 CWS, SWS CWS, SWS SWS Affected System CVS CVS CVS CVS Affected System UK AP1000 Environment Report Mass of Chemical (tonnes) CHEMICAL INVENTORY ON SEAWATER NUCLEAR ISLAND Hydrogen Hydrogen (liquid) Chemical Boric Acid Tank Table 2.9-2 CHEMICAL INVENTORY ON AP1000 NPP NUCLEAR ISLAND Boric Acid Tank Tank 2.0 Generic Plant Description 2.0 Generic Plant Description UK AP1000 Environment Report Table 2.9-4 AP1000 NPP CHEMICALS THAT ARE LIST I AND II SUBSTANCES UNDER THE GROUNDWATER DIRECTIVE Chemical List I or List II Basis for Classification Ammonium hydroxide List II Ammonia Polyphosphate or orthopolyphosphate List II Inorganic compounds of phosphorus and elemental phosphorus Sodium hypochlorite List II Nominated chemical Boric acid List II Inorganic compounds of boron Zinc compounds List II Nominated metal compounds Diesel fuel oil List I Mineral oils and hydrocarbons Halogenated By-Products of Chlorination in Seawater (see Table 4.2-3) List I Organohalogen compounds (and substances which may form such compounds in the aquatic environment) i.e., any organic compound which contains one or more covalently bonded halogen atoms Table 2.9-5 AP1000 NPP NON-RADIOACTIVE EFFLUENT COMPONENTS THAT ARE LIST I AND II SUBSTANCES UNDER THE DANGEROUS SUBSTANCES DIRECTIVE Chemical List I/List II Basis for Classification Ammonium hydroxide List II Ammonia Polyphosphate or orthopolyphosphate List II Inorganic compounds of phosphorus and elemental phosphorus Hydrazine List II Substances which have an adverse effect on the oxygen balance, particularly: ammonia, nitrites Sodium hypochlorite List II Biocides and their derivatives not appearing in List I Boric acid List II Inorganic compounds of boron Diesel fuel oil List I Mineral oils and hydrocarbons Halogenated By-Products of Chlorination in Seawater (see Table 4.2-3) List I Organohalogen compounds (and substances which may form such compounds in the aquatic environment) i.e., any organic compound which contains one or more covalently bonded halogen atoms UKP-GW-GL-790 45 Revision 4 Hydrazine pH control chemical – monoethanolamine (actual pH control additive used may differ) Ammonium Hydroxide Ammonium Hydroxide Sodium Sulfite and Sodium Hydroxide Polyphosphate Ammonium Chloride Ammonium Hydroxide MT02 MT03 MT04 MT05 MT07 MT08 MT11 Chemical / Radioactive Material UKP-GW-GL-790 Table 2.9-6 UK AP1000 Environment Report 800 800 800 240 800 Tote Container 3.03 800 3.03 3.03 3.03 0.91 3.03 3.03 3.03 800 800 (see Figure 2.9-3) m3 ft m Dimensions Material 46 ~4.9 high ~4.9 wide ~4.9 long ~1.5 high ~1.5 wide ~1.5 long Concrete Turbine Island Chemical Feed System (CFS) U.S. Gallons Stainless Steel Material Volume Primary Containment 4095 U.S. Gallons m3 15.5 Volume 0.67 high 22.75 wide 33.75 long ft Revision 4 0.2 high 6.9 wide 11.2 long m Dimensions Secondary Containment AP1000 NPP CHEMICAL SYSTEM TANKS AND SECONDARY CONTAINMENT MT01 Tank 2.0 Generic Plant Description Chemical/ Radioactive Material No. 2 Diesel Fuel Oil No. 2 Diesel Fuel Oil No. 2 Diesel Fuel Oil No. 2 Diesel Fuel Oil No. 2 Diesel Fuel Oil MT01A MT01B MT02A MT02B MT03 UKP-GW-GL-790 Table 2.9-6 (cont.) UK AP1000 Environment Report U.S. Gallons m3 ft m Dimensions Material Ancillary diesel generator fuel oil tank Day Tank Day Tank Storage Tank Storage Tank 4.9 2.45 650 4.9 227 227 1300 1300 60000 60000 47 Note (2) Note (2) Note (2) Note (2) Note (2) Annex building Sump. Concrete, fibrereinforced epoxy coating Diesel Generator Building Sump. Concrete lined with fiberreinforced epoxy coating Concrete Concrete Standby Diesel and Auxiliary Boiler Fuel Oil System (DOS) Material Volume Primary Containment 9.5 2.2(1) 580(1) 2500 250 250 m3 66000 66000 U.S. Gallons Volume 7 high 8 wide 6 long 6 high m Revision 4 2.13 high 2.44 wide 1.83 long 1.83 high 1.22 diam Note (2) Note (2) 4 diam ft Dimensions Secondary Containment AP1000 NPP CHEMICAL SYSTEM TANKS AND SECONDARY CONTAINMENT Tank 2.0 Generic Plant Description Sodium Molybdate/ Tolytriazole Ethylene/Propylene Glycol Zinc Acetate MT05(3) Zn Addition Tank Chemical/ Radioactive Material UKP-GW-GL-790 Table 2.9-6 (cont.) UK AP1000 Environment Report Stainless steel SA-516 Grade 70 carbon steel, chemical addition tank Material ft m Note (2) 0.076 0.36 diam 1.17 high 1.17 diam 3.83 high Turbine building sumps. Concrete lined with fibrereinforced epoxy coating. Material 0.76 48 Note (2) Note (2) Turbine building sumps. Concrete lined with fibrereinforced epoxy coating. Chemical Volume Control System (CVS) 200 20 m3 Dimensions Central Chilled Water System (VWS) U.S. Gallons Volume Primary Containment 51350 51350 U.S. Gallons m3 194.4 194.4 Volume 11 high 24 wide 13 long 2@ 11 high 24 wide 13 long 2@ ft Revision 4 3.35 high 7.32 wide 3.96 long 2@ 3.35 high 7.32 wide 3.96 long 2@ m Dimensions Secondary Containment AP1000 NPP CHEMICAL SYSTEM TANKS AND SECONDARY CONTAINMENT MT02/MT 05 Tank 2.0 Generic Plant Description Boric Acid Boric Acid Normally empty Lithium7 Hydroxide Batching tank Chemical Mixing Tank Lithium 7 Hydroxide tank Chemical/ Radioactive Material UKP-GW-GL-790 Table 2.9-6 (cont) UK AP1000 Environment Report stainless steel austenitic stainless steel stainless steel Material 5 800 80000 U.S. Gallons m3 ft m Dimensions Note (2) 0.02 3.03 303 ~1.5 high ~4.9 high 49 ~1.5 wide ~4.9 wide Note (2) ~1.5 long 7.01 high 7.32 diam ~4.9 long 23 high 24 diam Reactor Coolant Supply Volume Primary Containment Auxiliary Building Sump. Concrete, fibrereinforced epoxy coating Annex building Sump. Concrete, fibrereinforced epoxy coating Material 2500 (1) 2500(1) U.S. Gallons m3 9.5 9.5(1) Note (1,2) Volume 7 high 8 wide 6 long 7 high 8 wide 6 long ft Revision 4 2.13 high 2.44 wide 1.83 long 2.13 high 2.44 wide 1.83 long m Dimensions Secondary Containment AP1000 NPP CHEMICAL SYSTEM TANKS AND SECONDARY CONTAINMENT Storage tank Tank 2.0 Generic Plant Description Table 2.9-6 (cont) UK AP1000 Environment Report Polyacrylate or polyphosphate or orthopolyphosphate Sodium hypochlorite Ammonium hydroxide MT06 MT09 MT10 Note (2) Note (2) Note (2) Ancillary diesel generator fuel oil tank Material ft m 0.91 Note (2) Fire Protection System (FPS) m3 Concrete Material 10000 10000 10000 37.9 37.9 37.9 Note (2) Note (2) Note (2) Concrete Concrete Concrete Circulating Water System (CWS) (Seawater) 240 U.S. Gallons Dimensions U.S. Gallons Volume m3 Note (1) Note (1) Note (1) Note (1) ft m Dimensions Secondary Containment UKP-GW-GL-790 50 Revision 4 Notes: 1. Secondary containment design to be made compliant with UK requirements during site specific design. 2. To be determined. 3. For the low capacity MT05 (ethylene/ propylene glycol), WEC is in the process of revising the low capacity chiller design to remove glycol and replace with electrical heat trace. No. 2 Diesel Fuel Oil Chemical/ Radioactive Material Volume Primary Containment AP1000 NPP CHEMICAL SYSTEM TANKS AND SECONDARY CONTAINMENT MT02 Tank 2.0 Generic Plant Description UKP-GW-GL-790 2.0 Generic Plant Description 51 Figure 2.3-1. AP1000 NPP Schematic Revision 4 UK AP1000 Environment Report UKP-GW-GL-790 2.0 Generic Plant Description 52 Figure 2.3-2. Typical AP1000 NPP Plot Plan Revision 4 UK AP1000 Environment Report 2.0 Generic Plant Description UK AP1000 Environment Report Figure 2.3-2 (cont) KEY TO TYPICAL AP1000 NPP PLOT PLAN Item Description 1 Containment Shield Building 2 Turbine Building 3 Annex Building 4 Auxiliary Building 5 Radwaste Building 6 Plant Entrance 7 Diesel Generator Building 8 Fire Water / Clearwell Storage Tank 9 Fire Water Storage Tank 10 Transformer Area 11 Switch Yard 12 Condensate Storage Tank 13 Diesel Generator Fuel Oil Storage Tanks 14 Demineralised Water 15 Boric Acid Storage Tank 16 Hydrogen Storage Tank Area 17 Turbine Building Letdown Area 18 Waste Water Retention Basis 19 Passive Containment Cooling Ancillary Water Storage Tank 20 Diesel Driven Fire Pump/Enclosure 21 ILW Store (20 Years ) 22 Spent Fuel Store (20 Years Storage) 23 Spent Fuel Store Extension 1 (40 Years) 24 Spent Fuel Store Extension 2 (60 years) 25 ILW Store Extension 1 (40 Years) 26 ILW Store Extension 2 (60 Years) 27 Decommissioning Facility (Future) 28 Storage Area for Non-Radioactive Waste 29 Storage Area Low Level Waste 30 Area for Contractors Compound 31 Area for Storage of Large Radioactive Components UKP-GW-GL-790 53 Revision 4 2.0 Generic Plant Description UK AP1000 Environment Report Figure 2.3-3. Location of System Functions within the AP1000 NPP Power Generation Complex UKP-GW-GL-790 54 Revision 4 UKP-GW-GL-790 2.0 Generic Plant Description 55 Figure 2.4-1. Reactor Power Conversion System – Simplified Flow Diagram Revision 4 UK AP1000 Environment Report UKP-GW-GL-790 2.0 Generic Plant Description COMPONENT COOLING WATER SYSTEM CONDENSATE SYSTEM TURBINE ISLAND CHEMICAL FEED SYSTEM CONDENSER AIR REMOVAL SYSTEM CONDENSATE POLISHING SYSTEM CHEMICAL AND VOLUME CONTROL SYSTEM CIRCULATING WATER SYSTEM STORM DRAIN SYSTEM DEMINERALIZED WATER TREATMENT SYSTEM FIRE PROTECTION SYSTEM MAIN FEEDWATER SYSTEM MAIN STEAM SYSTEM PASSIVE CONTAINMENT COOLING SYSTEM PRIMARY SAMPLING SYSTEM POTABLE WATER SYSTEM PASSIVE CORE COOLING SYSTEM REACTOR COOLANT SYSTEM RADIATION MONITORING SYSTEM NORMAL RESIDUAL HEAT REMOVAL SYSTEM SANITARY DRAINAGE SYSTEM SPENT FUEL POOL COOLING SYSTEM STEAM GENERATOR SYSTEM SERVICE WATER SYSTEM TURBINE ISLAND CLOSED COOLING WATER SYSTEM TURBINE/GENERATOR RADIOLOGICALLY CONTROLLED AREA VENTILATION SYSTEM NUCLEAR ISLAND NONRADIOACTIVE VENTILATION CCS CDS CFS CMS CPS CVS CWS DRS DTS FPS FWS MSS PCS PSS PWS PXS RCS RMS RNS SDS SFS SGS SWS TCS T/G VAS VBS CENTRAL CHILLED WATER SYSTEM ANNEX/AUXILIARY BUILDING NONRADIOACTIVE VWS VXS LIQUID RADWASTE SYSTEM SOLID RADWASTE SYSTEM WASTE WATER SYSTEM WLS WSS WWS 56 Revision 4 Figure 2.7-1. AP1000 NPP Standard Plant Water Balance HOT WATER HEATING SYSTEM VYS VENTILATION SYSTEM TURBINE BUILDING VENTILATION SYSTEM VTS SYSTEM HEALTH PHYSICS AND HOT MACHINE SHOP HVAC SYSTEM STEAM GENERATOR BLOWDOWN SYSTEM BDS VHS AUXILIARY STEAM SUPPLY SYSTEM ASS SYSTEM KEY LOCATOR UK AP1000 Environment Report PLATE HEAT EXCHANGERS IN THE TURBINE ISLAND CLOSED COOLING WATER SYSTEM. EACH STRAINER AUTOMATICALLY BACKWASHES AT 1820 GPM FOR A PERIOD OF 30 SECONDS, 5 TIMES PER 24 HOUR PERIOD DURING NORMAL OPERATION. THE BACKWASH CYCLE TIMERS ARE STAGGERED TO AVOID SIMULTANEOUS BACKWASHES FROM THE STRAINERS; HENCE, THERE AND MAXIMUM FLOWS FOR THE DTS, PWS, FPS, SWS, AND CWS ARE PROVIDED IN THE SPECIFIC SYSTEM NOTES BELOW. SITE PRECIPITATION IS NOT INCLUDED IN THE WATER BALANCE DIAGRAM. PERIODS AND IS CONSIDERED TO BE AN INFREQUENT AND INTERMITTENT FLOW BASED ON THE UTILITY REQUIREMENTS DOCUMENT. THE QUANTITY OF THE WATERBOX DRAIN HAS NOT BEEN QUANTITATIVELY CONSIDERED IN DETERMINING THE CIRCULATING MAKEUP WATER REQUIREMENTS OR THE DISPOSITION TO WASTE WATER. INTERMITTENT FLOWS. THESE INCLUDE THE CONDENSER WATER BOX DRAIN, THE STRAINER BACKWASH FLOWS FROM THE CWS AND SWS STRAINERS, AND THE CONDENSATE RINSE OF THE CONDENSATE POLISHER RESINS. DEMINERALIZED WATER FLOWS ORIGINATING FROM THE DEMINERALIZED WATER TREATMENT PLANT (DTS), AND DISTRIBUTED THROUGHOUT THE FIRE WATER MAKEUP FLOW IS BASED ON REQUIREMENT TO REPLENISH 300,000 GALLONS FIRE RESERVE IN 8 HOURS. 14. TOTAL DISCHARGES EXCLUDE INTERMITTENT STRAINER BACKWASH AND INFREQUENT CONDENSER WATERBOX DRAIN AND SEA WATER RETURN FLOWS. 15. DISCHARGE MONITORING POINT (MP) 5. NORMAL SERVICE WATER FLOWS ARE BASED ON 100% POWER OPERATION AT 4 CYCLES OF CONCENTRATION. MAXIMUM SERVICE WATER FLOWS ARE BASED ON PLANT COOLDOWN WITH 4 CYCLES OF CONCENTRATION. 6. BACKWASH FROM SERVICE WATER STRAINERS IS ESTIMATED AT 3000 GPM FOR 1 MINUTE EVERY 12 HOURS THAT A UKP-GW-GL-790 MAXIMUM CIRCULATING WATER FLOWS ARE BASED ON 100% POWER OPERATION WITH 2 CYCLES OF CONCENTRATION. 7. NORMAL CIRCULATING WATER FLOWS ARE BASED ON 100% POWER OPERATION WITH 4 CYCLES OF CONCENTRATION. IS <= 0.1% OF BLOWDOWN FLOW. INTERMITTENT AND IS NOT FIGURED INTO THE WATER BALANCE NUMERICALLY SINCE THE AVERAGE DISCHARGE OVER TIME BACKWASH IS 3000 GPM FOR 1 MINUTE EVERY 6 HOURS (I.E., 8.33 GPM AVERAGE). STRAINER BACKWASH IS CONSIDERED TO BE NORMAL STRAINER BACKWASH IS 3000 GPM FOR 1 MINUTE EVERY 12 HOURS (4.17 GPM AVERAGE) AND MAXIMUM STRAINER PLANT COOLDOWN. STRAINER BACKWASH CYCLES ARE STAGGERED TO AVOID SIMULTANEOUS DISCHARGES. THEREFORE, 57 Revision 4 Figure 2.7-1 (cont.). AP1000 NPP Standard Plant Water Balance (Notes) INJECTED INTO THE VARIOUS SYSTEMS AND ARE DISCHARGED VIA THE WASTE STREAMS. PWS FLOWS ARE BASED ON CONSUMPTION OF 50 GPD FOR 1000 PERSONS, REPRESENTATIVE OF SHUTDOWN PERIODS. STRAINER IS IN SERVICE. ONE STRAINER IS IN SERVICE FOR POWER OPERATION AND TWO STRAINERS ARE IN SERVICE DURING 13. LIQUID CHEMICALS ARE TREATED AS AN INFLUENT SOURCE OF LIQUID. THE CHEMICALS ARE PURCHASED AS LIQUIDS AND 4. NORMAL PWS FLOWS ARE BASED ON CONSUMPTION OF 50 GALLONS PER DAY PER PERSON FOR 500 PERSONS. MAXIMUM WASTE WATER SYSTEM PROCESSING. BACK TO THE PLANT OUTFALL, TO THE WWRB, OR TO THE BLOWDOWN SUMP DIRECTLY WITHOUT PASSING THROUGH THE DEMINERALIZED WATER STORAGE TANK. THE DISPOSITION OF THE BYPASS WATER IS SITE DEPENDENT. IT CAN BE DIRECTED PROCESSING TO BRING THE PRODUCT WATER INTO SPECIFICATION BEFORE DIRECTING THE PRODUCT INTO THE FLOWS. AN ALLOWANCE HAS BEEN INCLUDED TO BYPASS THE PRODUCT WATER FROM THE DTS ON INITIATION OF BATCH 540 GPM OF MAINS WATER, REJECTING 180 GPM OF WASTE WATER; THESE VALUES FORM THE BASIS FOR THE MAXIMUM 12. NORMAL FIRE WATER CONSUMPTION FLOWS ARE BASED ON APPLICATION OF NFBA TESTING REQUIREMENTS. MAXIMUM WATER STORAGE TANK ON DEMAND. IN THE SINGLE PASS MODE, THE SYSTEM PRODUCES 360 GPM OF PRODUCT WATER FROM THE OIL-WATER SEPARATOR THROUGH THE OIL STORAGE DISPOSAL TANK. SPENT RESIN STORAGE TANK (WSS) OR FROM THE CPS. NOR DOES IT QUANTIFY THE VOLUME OF OIL WASTES REMOVED BY 3. THE DEMINERALIZED WATER TREATMENT PLANT (DTS) OPERATES IN A BATCH MODE TO REFILL THE DEMINERALIZED SPECIFIC SYSTEM NOTES WATER AND CONDENSATE ARE TYPICALLY BASED ON COMPONENT AND SYSTEM CAPACITIES (E.G., PUMP DESIGN FLOWS). COMPLETE FUEL CYCLE FOR PURPOSES OF DENOTING A NORMAL FLOW RATE. MAXIMUM FLOW RATES FOR DEMINERALIZED INDIVIDUALLY INTERMITTENT, BUT ARE SHOWN AS THE AVERAGE OF THESE INDIVIDUAL INTERMITTENT FLOWS OVER A 11. THE WATER BALANCE DOES NOT QUANTIFY OR REPRESENT THE VOLUME OF RESINS DISCHARGED OFFSITE FROM THE BLOWDOWN SUMP, OR DIRECTLY TO THE PLANT OUTFALL. THE WATERBOX DRAIN OCCURS ONLY DURING SHUTDOWN WHICH ARE VERY INFREQUENT OR WHICH PERSIST FOR VERY SHORT DURATIONS ARE SHOWN AS DOTTED LINE PLANT VIA THE DEMINERALIZED WATER TRANSFER & STORAGE SYSTEM (DWS), ARE, WITH CERTAIN EXCEPTIONS, 10. THE DISPOSITION OF THE CONDENSER WATERBOX DRAIN IS SITE DEPENDENT. IT CAN BE DISCHARGED TO THE WWRB, THE 2. MANY OF THE FLOWS REPRESENTED IN THE WATER BALANCE ARE INTERMITTENT TO A CERTAIN DEGREE. THOSE FLOWS TIME IS <= 0.2% OF BLOWDOWN FLOW. BE INTERMITTENT AND IS NOT FIGURED INTO THE WATER BALANCE NUMERICALLY SINCE THE AVERAGE DISCHARGE OVER ARE 15 CYCLES OF BACKWASH, EACH LASTING 30 SECONDS, PER 24 HOUR PERIOD. STRAINER BACKWASH IS CONSIDERED TO 9. THERE ARE THREE STRAINERS IN THE COOLING WATER SUPPLY LINES FROM THE CIRCULATING WATER PUMPS TO THE SHOWN ABOVE THE LINE, AND MAXIMUM VALUES OF FLOW RATES ARE SHOWN BELOW THE LINE. THE BASES FOR NORMAL THE WWRB. ESTABLISHING THE REQUIRED MAKEUP TO THE CWS. ALTERNATIVELY, SERVICE WATER BLOWDOWN CAN BE DIRECTED TO 8. SERVICE WATER BLOWDOWN IS DIRECTED TO THE CWS. CREDIT FOR THIS INFLOW HAS NOT BEEN CONSIDERED IN UK AP1000 Environment Report 1. PATH FLOW RATES ARE DENOTED IN GALLONS PER MINUTE FOR A SINGLE UNIT. NORMAL VALUES OF FLOW RATES ARE GENERAL NOTES 2.0 Generic Plant Description 2.0 Generic Plant Description UK AP1000 Environment Report Figure 2.9-1. Plan View of AP1000 NPP Turbine Chemical Storage UKP-GW-GL-790 58 Revision 4 UKP-GW-GL-790 2.0 Generic Plant Description 59 Figure 2.9-2. Turbine Island Chemical Storage Arrangement Revision 4 UK AP1000 Environment Report 2.0 Generic Plant Description UK AP1000 Environment Report Figure 2.9-3. Rugged Hazardous Liquid Tote Container UKP-GW-GL-790 60 Revision 4 3.0 Radioactive Waste Management Systems UK AP1000 Environment Report 3.0 RADIOACTIVE WASTE MANAGEMENT SYSTEMS 3.1 Introduction During the GDA process, an IWMS has been developed to ensure that radioactive material and radwastes generated by the AP1000 NPP are managed in a manner which minimises the need for future processing, and that is compatible with anticipated facilities for ultimate disposal or end-use (Reference 3-1). During site-specific analysis, the operator of an AP1000 NPP may develop its own strategy in line with its own corporate waste disposal procedures and policies. The AP1000 NPP IWMS (Reference 3-1) is consistent with the waste hierarchy shown in Figure 3.1-1 and the key BAT management factors for optimization of releases from nuclear facilities shown in Figure 3.1-2 (Reference 3-2). These factors correlate closely as follows: Waste Hierarchy BAT Waste Management Factor Avoid Use of low waste technology Minimise Use of low waste technology Efficient use of resources Reduce emissions Reduce/Recycle Use of low waste technology Use less hazardous substances Abatement Reduce emissions It is not possible to avoid the production of radwaste entirely. Radioisotopes are produced during the normal operation of nuclear reactors, primarily through the processes of fission and activation. Fission products may enter the reactor coolant by diffusing from the fuel and then passing through the fuel cladding through leaks. The primary cooling water may contain dissolved or suspended corrosion products and non-radioactive materials leached from plant components which can be activated by the neutrons in the reactor core as the water passes through the core. These radioisotopes leave the reactor coolant either by plant systems designed to remove impurities, by small leaks that occur in the RCS and auxiliary systems, or during maintenance. Therefore, each plant generates radwaste that can be liquid, solid, or gaseous. The other aspects of the waste hierarchy, minimization, reduce/recycle and abatement of emissions, are all implemented within the AP1000 NPP design in a manner that is consistent with the BAT waste management factors. Examples of these BAT techniques are shown in Table 3.1-1 and these and other techniques are discussed in more detail in the following sections. UKP-GW-GL-790 61 Revision 4 3.0 Radioactive Waste Management Systems 3.2 UK AP1000 Environment Report Minimization of Waste at Source In the AP1000 NPP, there are several ways in which the release of radioactive emissions is reduced at source. These ways are described below. 3.2.1 Fuel Rod Burn-up The fuel economics and the amount of spent fuel are closely correlated. Both are optimized when the fuel cycle is designed with fuel being discharged from the reactor as close as is reasonable to the licensed discharge burn-up limit. The current licensed limit for Westinghouse fuel is 62,000 MWD/MTU on the lead rod maximum burn-up. Typically, a batch average burn-up of approximately 50,000 MWD/MTU is achieved. The concept of high burn-up fuel is generally environmentally and economically beneficial. However, high fuel burn-up can result in extended cooling time for spent fuel. This will be a consideration for any future repository operator to address (see subsection 3.5.8.3). 3.2.2 Operational Cycle Utilities can operate an AP1000 NPP on different cycle lengths (e.g., annual vs. 18 month cycles) as best meets their operational needs. If the prime objective is to reduce the average number of discharge assemblies per year, then an annual cycle in the AP1000 NPP would discharge fewer assemblies on the average than an 18 month cycle (40 vs. 43). However, depending on the cost of the extra outage every 3 years, the cost of replacement power during the outage, the impact of outage length on average capacity factor, etc., this may not be the most overall economically efficient operation of the core. The vast majority of Westinghouse customers choose the longer 18 month fuel cycle. 3.2.3 Tramp Uranium Uranium contamination on the exterior surface of Westinghouse fabricated fuel rods, sometimes called tramp uranium, is insignificant. Normally, Westinghouse does not smear their rods for contamination. However, when smears were taken, analysis showed that the levels of alpha contamination, and therefore any tramp uranium levels, were so low that statistically, smears no longer need to be taken. 3.2.4 Fuel Rod/Cladding Design The AP1000 NPP fuel rods consist of cylindrical, ceramic pellets of slightly enriched uranium dioxide (UO2). These pellets are contained in cold-worked and stress-relieved ZIRLO tubing, which is plugged and seal-welded at the ends to encapsulate the fuel. Sintered, high-density uranium dioxide fuel reacts only slightly with the clad at core operating temperatures and pressures. In the event of clad defects, the high resistance of uranium dioxide to attack by water protects against fuel deterioration, although limited fuel erosion can occur. The consequences of defects in the clad are greatly reduced by the ability of uranium dioxide to retain fission products, including those which are gaseous or highly volatile. ZIRLO is an advanced zirconium-based alloy which has a high corrosion resistance to coolant, fuel, and fission products, and high strength and ductility at operating temperatures. Selection of ZIRLO cladding materials minimises the formation of defects that can result in radioactive releases to the reactor coolant. The design of the fuel that will be used in the AP1000 NPP is an improvement over previous designs in that vibrations in the assembly are reduced. This design has already been used in existing plants. Since the implementation of the Westinghouse 17x17 RFA in 1998 the UKP-GW-GL-790 62 Revision 4 3.0 Radioactive Waste Management Systems UK AP1000 Environment Report overall leakage rate of this design, incorporating all the Wetinghouse debris protection features, is 0. The overall leakage rate, on a rod basis, of the basic RFA fuel product including designs that do not use all the debris protection features is less than 10-5 (Reference 3-42). 3.2.5 Materials Selection In order to reduce Co-60 production by activation of Co-59, the latter is limited to below 0.05 weight percent in reactor internal structures and below 0.2 weight percent in primary and auxiliary materials. Low or zero cobalt alloys used for hard-facing or other applications where cobalt alloys have been previously used are qualified using wear and corrosion tests. The corrosion tests qualify the corrosion resistance of the alloy in the reactor coolant. Cobalt free wear resistant alloys considered for this application include those developed and qualified in nuclear industry programs. The use of cobalt base alloy (e.g., Stellite®) is limited to applications where its hardness, low friction, and resistance to wear provide the best reliability for critical operations. Examples include use on guide surfaces of motor-operated gate valves and the seating surfaces of airoperated globe valves where tight shutoff and durability are required. The parts of the control rod drive mechanisms and control rod drive line exposed to reactor coolant are made of metals that resist the corrosive action of the coolant. Three types of metals are used exclusively: stainless steels, nickel-chromium-iron alloys, and, to a limited extent, cobalt-based alloys. These materials have provided many years of successful operation in similar control rod drive mechanisms. In the case of stainless steels, only austenitic and martensitic stainless steels are used. Cobalt-based alloys have limited use in the AP1000 NPP design. Co-58 is produced from activation of Ni-58. For this reason, nickel-based alloys in the reactor coolant system are used only where component reliability may be compromised by the use of other materials. The major use of nickel-based alloys in the reactor coolant system is the INCONEL® steam generator tubes. There are general prohibitions on copper, lead and antimony and other low-melting-point metals used in engineered safety features. In addition, the reactor coolant pump mechanical design criteria prohibit antimony completely from the reactor coolant pump and its bearings. 3.2.6 Minimization of Leakage Pathways The AP1000 NPP is designed with fewer valves and components than predecessor plants which will result in fewer leakage pathways and lower overall input to the radwaste systems. 3.2.7 Control of Reactor Coolant Water Chemistry The RCS contains boric acid for long-term reactivity control of the core. The RCS water chemistry is controlled to minimize corrosion by the addition of chemicals using the CVS. The following chemicals are added to the borated RCS system: Lithium hydroxide (Li7OH) is used to control the pH of the RCS and is chosen for its compatibility with borated water chemistry and the stainless steel and zirconium materials. The effective control of pH reduces the formation of radioactive corrosion products that may be released in liquid effluent. The use of Li7OH, where the Li-7 isotope has been enriched, also removes an important formation mechanism for UKP-GW-GL-790 63 Revision 4 3.0 Radioactive Waste Management Systems UK AP1000 Environment Report tritium. The neutron absorption cross-section of lithium-7 is five orders of magnitude smaller than that of lithium-6, and the use of Li7OH substantially reduces the potential for tritium formation associated with neutron absorption by lithium-6 present in natural lithium hydroxide. Hydrazine is introduced as an oxygen scavenger during plant startup from cold shutdown to reduce corrosion product formation associated with dissolved oxygen. Dissolved hydrogen is added to the RCS during power operations to eliminate free oxygen produced by radiolysis in the core and to prevent ammonia formation. Zinc acetate is added initially during hot functional testing and during operations to minimize corrosion and to reduce radiocobalt and activated nickel concentrations. The RCS water chemistry is routinely analyzed to ensure that the chemistry is correct and that corrosion product particulates are below specified limits. 3.2.8 Gray Rods and Burnable Absorber Rods Core reactivity is controlled by means of a chemical poison (boric acid) dissolved in the coolant, rod cluster control assemblies, gray rod cluster assemblies, and burnable absorbers. The gray rod cluster assemblies are used in load follow maneuvering and provide a mechanical shim reactivity mechanism which eliminates the need for chemical shim control provided by changes to the concentration of soluble boron. Discrete burnable absorber rods, integral fuel burnable absorber rods, or both may be used to provide partial control of the excess reactivity available during the fuel cycle. In doing so, the burnable absorber rods reduce the requirement for soluble boron in the moderator at the beginning of the fuel cycle. The reactor controls provided by gray rods and burnable absorber rods reduce the requirements for varying the boron concentrations in the RCS. By doing so, the volume of reactor coolant that is withdrawn by the CVS and treated in the WLS is reduced. 3.2.9 Reactor Coolant Pressure Boundary Airborne releases can be limited by restricting reactor coolant leakage. The RCPB provides a barrier against the release of radioactivity generated within the reactor. The RCPB comprises the vessels, piping, pumps, and valves that are part of the RCS, or that are connected to the RCS up to and including the following: The outermost containment isolation valve in system piping that penetrates the containment The second of two valves closed during normal operation in system piping that does not penetrate containment The RCS overpressure protection valves The RCPB is designed to contain the coolant under operating temperature and pressure conditions and limit leakage (and activity release) to the containment atmosphere. RCPB leakage detection is accomplished by diverse measurement methods, including level, flow, UKP-GW-GL-790 64 Revision 4 3.0 Radioactive Waste Management Systems UK AP1000 Environment Report and radioactivity measurements. Monitoring provides a means of detecting, and to the extent practical, identifying the source and quantifying the reactor coolant leakage. 3.2.10 Reactor Coolant Purification The CVS purifies the RCS to maintain low RCS activity levels. The CVS purification loop contains two mixed-bed demineralisers, an optional cation-bed demineraliser, and two reactor coolant filters. The mixed-bed demineralisers are provided in the purification loop to remove ionic corrosion products and certain ionic fission products. The demineralizers also act as coarse filters for infrequent large particulates. Fine filtration is provided by reactor coolant filters which are provided downstream of the demineralisers to collect particulates and resin fines. They are specified to retain 98% of 0.10 micron particles with sufficient filter capacity to maintain a differential pressure of less than 0.30 MPa. It is expected that during plant startup, plant testing, and possibly during the first few cycles that filter cartridges with larger micron ratings may be required (to increase filter life and reduce cartridge changeout). One mixed bed is normally in service; with a second demineraliser acting as backup in case the normal unit should become exhausted during operation. Each demineraliser and filter is sized to provide a minimum of one fuel cycle of service with change-out of the in-service demineraliser normally occurring at the end of each fuel cycle, irresepective of the conditions and chemical exposure history during the fuel cycle. The mixed-bed and cation-bed demineralisers are expected to have considerable excess capacity to handle primary circuit purification during shutdown operations. Unforeseen or unexpected events or transients in contaminant loading could potentially necessitate the premature need to remove the primary CVS purification mixed bed from service. In this case, the backup CVS mixed bed can be placed in service without the need to enter containment. At that point, it would be the left to the judgment of the operating utility whether there is a pressing need to replace the exhausted CVS change-out with the unit in power operation. Radiological conditions at any specific time must be carefully assessed. The CVS mixed-bed demineralisers have limited capability for deboration. The purification mixed bed that is in service at any given time will already be operating fully equilibrated with boron. The designated “backup” CVS mixed-bed demineraliser (not yet in service) has the capability to perform deboration of roughly 70 ppm boron at the end of the fuel cycle. If the backup mixed bed is used only for end of cycle deboration of the RCS, then that mixed bed may be suitable for use as the purification mixed bed in the following fuel cycle. The mixed-bed demineralisers also remove zinc during periods of zinc addition (see Section 2.6.6). Approximately 8% of the mixed-bed cation resin sites may be converted to the zinc form following 18 months of continuous CVS mixed-bed operation at 10 ppb zinc in the RCS. The mixed-bed demineraliser in service can be supplemented by intermittent use of the cation-bed demineraliser for additional purification in the event of fuel defects. In this case, the cation resin removes mostly lithium and caesium isotopes. The cation-bed demineraliser has sufficient capacity to maintain the caesium-136 concentration in the reactor coolant below 1.0 μCi/cm3 with design basis fuel defects. Each mixed bed and the cation-bed demineraliser is sized to accept the maximum purification flow. The CVS ion exchange treatment also removes radioactive iodine concentrations in the reactor coolant. Removal of the noble gases from the RCS is not normally necessary because the gases will not build up to unacceptable levels when fuel defects are within normally UKP-GW-GL-790 65 Revision 4 3.0 Radioactive Waste Management Systems UK AP1000 Environment Report anticipated ranges. If noble gas removal is required because of high RCS concentration, the CVS can be operated in conjunction with the WLS degasifier to remove the gases. By maintaining low RCS activity levels, the radioactive releases associated with reactor coolant leakage to the containment atmosphere is reduced. 3.2.11 pH Control with Li7OH Lithium hydroxide is used to control pH within the RCS. Naturally occurring lithium would produce large amounts of tritium when exposed to neutron irradiation. In order to reduce this source of tritium production, lithium hydroxide enriched in the Li-7 isotope (Li7OH) is used to largely avoid addition of the Li-6 isotope prone to such tritium production. 3.2.12 Recycling Steam Generator Blow Down Fluid recycling is provided for the steam generator blowdown fluid which is normally returned to the CDS. 3.3 Gaseous Radioactive Waste 3.3.1 Gaseous Radwaste System The WGS is described in detail in Chapter 11.3 of the DCD (Reference 1-1). 3.3.1.1 Gaseous Radwaste System Sources During reactor operation, tritium and radioactive isotopes of xenon, krypton, and iodine are created as fission products. A portion of these radionuclides is released to the reactor coolant because of a small number of fuel cladding defects. The reactor coolant may also contain tritium and gaseous carbon-14 (mainly in the form of methane) produced by various activation reactions within the reactor coolant. Leakage of reactor coolant thus results in a release to the containment atmosphere of these gases. Airborne releases can be limited both by restricting reactor coolant leakage and by limiting the concentrations of radioactive gases in the RCS. WGS inputs are as follows: RCS degassing: Removal of the noble gases from the RCS is not normally necessary because the gases do not build up to unacceptable levels when fuel defects are within normally anticipated ranges. However, the WGS periodically receives influent when CVS letdown is processed through the WLS degasifier. This occurs when the CVS letdown flow is diverted to the WLS degasifier during dilutions, borations, and RCS degassing before shutdown. The WLS degasifier discharge is the largest input to the WGS. Since the degasifier is a vacuum type and requires no purge gas, the maximum gas influent rate to the WGS is essentially equal to the maximum dissolved hydrogen rate into the degasifier. The maximum input flow rate from degasifier separator is 0.58 standard cubic feet per minute (scfm) (0.99 m3/h) based on RCS hydrogen concentration 45 cm3/kg. WLS reactor coolant drain tank (RCDT) degassing: UKP-GW-GL-790 66 Revision 4 3.0 Radioactive Waste Management Systems UK AP1000 Environment Report The RCDT contents are also degassed by the WLS degasifier, and the resulting gas is then routed to the WGS. When enough gas has naturally come out of the RCDT contents, the tank is also vented to the WGS. The maximum input flow rate from the RCDT is 0.5 scfm (0.85m3/h). The estimated gaseous radwaste emissions arising from the system operations are shown in Table 3.3-1. 3.3.1.2 Gaseous Radwaste Treatment System If noble gas removal is required because of high RCS concentration, the CVS is operated in conjunction with the WLS degasifier, to remove the gases. Iodine is removed by ion exchange in the CVS. Gases generated by RCS or RCDT degassing are passed to the WGS for further treatment. The WGS is used intermittently. Most of the time during normal operation of the AP1000 NPP, the WGS is inactive. Based on the maximum input gas volume, the WGS is expected to operate approximately 100 hours per year. The WGS is designed to perform on an intermittent basis the following major functions: Collect radioactive or hydrogen bearing gaseous wastes Process and discharge the waste gas while keeping offsite releases of radioactivity within acceptable limits The AP1000 NPP WGS is a once-through, ambient temperature, activated carbon delay system (see Figure 3.3-1). The system includes a gas cooler, a moisture separator, an activated carbon-filled guard bed, and two activated carbon-filled delay beds. The radioactive fission gases entering the system are carried by hydrogen and nitrogen gases that pass through the system tanks to their incoming pressure. These influents successively pass through: The gas cooler, where they are cooled to about 40°F (4ºC) by the chilled water system. The moisture separator, which is a stainless steel receiver, collects condensed water vapour (including condensed tritiated water vapour) from the cooled gas thus removing it from the gaseous radioactivity stream. The collected water is periodically discharged automatically to the WLS. An activated carbon-filled guard bed, which protects the delay beds from abnormal moisture carryover or chemical contaminants. It absorbs radioactive iodine with efficiencies of 99 percent for methyl iodine and 99.9 percent for elemental iodine. It also provides increased delay time for xenon and krypton and deep bed filtration of particulates entrained in the gas stream. Two activated carbon delay beds in series are provided where the release of xenon and krypton is delayed by a dynamic adsorption process. During the delay period, the radioactive decay of the fission gases significantly reduces the radioactivity of the gas flow leaving the system. The minimum calculated holdup times are 38.6 days for xenon and 2.2 days for krypton, based upon a continuous input flow rate to the WGS of 0.5 scfm (0.85 m3/h). However, UKP-GW-GL-790 67 Revision 4 3.0 Radioactive Waste Management Systems UK AP1000 Environment Report the design basis period of operation is the last 45 days of a fuel cycle when the RCS dilution and subsequent letdown from the CVS into the WLS peaks. During this period, the WGS input is at a maximum and the average input flow rate is 0.014 scfm (0.024 m3/h), which results in longer hold up times being achieved. The two beds together provide 100 percent of the stated system capacity under design basis conditions. During normal operation, a single bed provides adequate performance. This provides operational flexibility to permit continued operation of the gaseous radwaste system in the event of operational upsets in the system that requires isolation of one bed. Normal operation will be with two beds in series and it is not expected that a delay bed will be out of service on a frequent basis. No final filter is incorporated in the gaseous radwaste system because the carrier-gas velocity through the beds is very low, and flow in the final leg of the delay beds is oriented upward through the bed. Therefore, the potential for particulate carry-over is not judged to be significant, and the complexity associated with an outlet filter is not justified. A radiation monitor before discharge to the ventilation exhaust duct. The use of a gas cooler, a moisture separator, a guard bed, and delay beds is a common gas treatment system throughout the nuclear power industry. 3.3.2 HVAC Systems for Radiologically Controlled Areas The AP1000 NPP design uses several HVAC systems, which are identified in Table 3.3-2. The classification of working areas being served by the HVAC systems and the systems that are fitted with abatement systems are also shown in Table 3.3-2. Detailed descriptions of the HVAC systems can be found in Chapter 9.4 of the DCD (Reference 1-1). The HVAC systems which extract air or process from radioactively controlled areas are described in the following subsections. 3.3.2.1 Containment Recirculation Cooling System (VCS) The Containment Recirculation System (VCS) recirculates and cools air within the containment during power operations and shutdown. This results in an energy savings and a reduction in waste generated in the form of used filters when compared to that which would arise from the level of once-through HVAC ventilation system. The air recirculated by this system is expected to contain some activity, mostly noble gases and some iodine. The VCS does not penetrate the containment boundary and thus does not give rise to any discharges to atmosphere. During shutdown operations in the containment, local, filtered extract systems are available for particular operations where airborne activity may be generated. This reduces the potential for airborne activity to be released into the general containment atmosphere which the recirculation system could spread to other parts of the containment building. The extracted air is continuously monitored for airborne activity which would give an early warning to workers in the containment of the presence of airborne activity UKP-GW-GL-790 68 Revision 4 3.0 Radioactive Waste Management Systems 3.3.2.2 UK AP1000 Environment Report Containment Air Filtration System (VFS) The containment building can contain activity as a result of leakage of reactor coolant and as a result of activation of naturally occurring Ar-40 in the atmosphere to form radioactive Ar-41. The Containment Air Filtration System (VFS) purges the containment by providing fresh air from outside and exhausting air to the plant vent. The air exhausted by the VFS is filtered with high-efficiency filters, charcoal filters, and postfilters. The VFS also exhausts from areas served by the Radiologically Controlled Area Ventilation System (VAS) and the Health Physics and Hot Machine Shop HVAC System (VHS) after receipt of a High radiation signal in the VAS or the VHS exhaust, respectively. The VFS comprises two parallel systems which may be operated individually or simultaneously as required by the operating regime with or without associated inlet air handling units. The two exhaust air filtration units are located within the radiologically controlled area of the annex building. Each exhaust air filtration unit can handle 100% of the system capacity. The VFS is diesel backed to improve its reliability. Each VFS unit consists of an electric heater, an upstream high-efficiency particulate air (HEPA) filter bank, a charcoal adsorber with a downstream postfilter bank, and an exhaust fan. The efficiencies of the individual filtration elements are in Table 3.3-3. A gaseous radiation monitor is located downstream of the exhaust air filtration units in the common ductwork to provide an alarm if abnormal gaseous releases are detected. During normal plant operation, the VFS operates on a periodic basis to purge the containment atmosphere as determined by the MCR operator to reduce airborne radioactivity or to maintain the containment pressure within its normal operating range. The filtered exhaust air from the containment is discharged to the atmosphere through the plant vent by the VFS exhaust fan. Radioactivity indication and alarms are provided to inform the MCR operators of the concentration of gaseous radioactivity in the VFS exhaust duct. There are additional VFS radiation monitors that measure gaseous, particulate, and iodine concentrations in the plant vent. 3.3.2.3 Radiologically Controlled Area Ventilation System (VAS) The AP1000 Radiologically Controlled Area Ventilation System (VAS) serves the radiologically controlled areas of the auxiliary and annex buildings. The VAS consists of two separate once-through type ventilation subsystems; the auxiliary/annex building ventilation subsystem and the fuel handling area ventilation subsystem. The auxiliary/annex building ventilation subsystem is routed to minimize the spread of airborne contamination by directing the supply airflow from the low-radiation access areas into the radioactive equipment and piping rooms with a greater potential for airborne radioactivity. Additionally, the exhaust air ductwork is connected to the radwaste effluent holdup tanks to prevent the potential buildup of gaseous radioactivity or hydrogen gas within these tanks. The exhaust fans normally discharge the auxiliary/annex building exhaust air into the plant vent at an approximate flow rate of 16.42 m3s-1 (34,900 cfm). The fuel handling area ventilation subsystem supply and exhaust ductwork is arranged to exhaust the spent fuel pool area separately from the auxiliary building. It provides directional airflow from the rail car/bay filter storage area into the spent resin equipment rooms. The UKP-GW-GL-790 69 Revision 4 3.0 Radioactive Waste Management Systems UK AP1000 Environment Report exhaust fans normally pass the exhaust air through a HEPA filter system at an approximate flow rate of 5.52 m3s-1 (11,700 cfm) before discharge via the plant vent. The supply and exhaust ducts are configured so that each subsystem may be independently isolated. If the radiation monitors in either duct system detect a high level of radiation, the subsystem extract is diverted to the VFS. This allows filtration by both HEPA filters and charcoal filters, which provides abatement of both particulate emissions and radioiodine gases. The VAS and VFS may also be switched manually if particular operations are being undertaken which could result in release of activity. In addition to the duct monitors, the following area monitors will also provide a VFS actuation signal to divert the VAS exhaust to the HEPA filters and charcoal filters of the VFS: Primary Sampling Room Chemistry Laboratory Fuel Handling Area 1 Auxiliary Building Rail Car Bay/Filter StorageArea Liquid and Gaseous Radwaste Area Annex Staging and Storage Area Fuel Handling Area 2 The purpose of using these area monitors to actuate the switch from VAS to VFS upon contamination detection improves the reliability of the switching system and reduces the duration of potentially untreated atmospheric releases from ~30 seconds to ~15 seconds. 3.3.2.4 Health Physics and Hot Machine Shop HVAC System (VHS) The Health Physics and Hot Machine Shop HVAC System (VHS) exhaust air system consists of two 100% capacity exhaust fans sized to allow the system to maintain negative pressure. HEPA filtration is not provided on the HVAC system and normally air discharges directly to the plant vent at a flow rate of 6.84 m3s-1 (14,500 cfm). However, in the event that duct monitors or area monitors detect contamination, the VHS will be diverted to the VFS to allow filtration by both HEPA filters and charcoal filters. The hot machine shop provides a location within the controlled area for repair and refurbishment of items of equipment from within the controlled area. The facility has a dedicated decontamination facility which has HEPA filtration and a glovebox which also has HEPA filtration. Individual machine tools have local exhaust ventilation also equipped with HEPA filters with each individual machine operating at an exhaust flow rate from of 0.85 m3s-1 (1800 cfm). 3.3.2.5 Turbine Building HVAC System (VTS) – Bay 1 Area The VTS serves all areas of the turbine building. The HVAC systems serving the switchgear rooms, rectifier room, security rooms, and plant control system cabinet rooms do not have a credible source of radioactive contamination and are considered non-radioactive ventilation systems (see subsection 4.1.1.3). The Bay 1 area of the turbine building contains the reactor coolant pump variable-speed drives, Component Cooling Water System (CCS) equipment (a nonradioactive system), and the Steam Generator Blowdown System (BDS). The BDS may be contaminated in the very unlikely event of concurrent fuel defects, steam generator leak, radiation monitor or BDS isolation failure, and a BDS leak. The general area of the turbine UKP-GW-GL-790 70 Revision 4 3.0 Radioactive Waste Management Systems UK AP1000 Environment Report building is ventilated using about 850 m3s-1 (1,800,000 cfm) exhausted direct to atmosphere through roof ventilators without abatement. 3.3.2.6 Radwaste Building Ventilation (VRS) The Radwaste Building HVAC System (VRS) supplies and exhausts air from the radwaste building. The radwaste building has three potential sources of radioactive contamination, as follows: Tanks for low-level liquid effluent for monitoring and sentencing Area for loading packaged solid LLW into containers Portable or permanently installed equipment for processing LLW. The VRS general extract may contain significant airborne activity either during normal operation or fault conditions if the portable radwaste equipment is not properly operated. Extract air from the building equipment will be by means of low level extract grilles and conveyed through high integrity ductwork to HEPA filters and discharged to the main plant exhaust stack by two 50 percent extract fans. Dedicated HEPA filtered extracted branches will provide extract from the waste sorting cabinets (Reference 3-3). All HEPA filter housings will be of the safe change type and supplied in accordance with NF0153/1 (Reference 3-4). Filter inserts will comply with AESS30/95100 (Reference 3-5). 3.3.2.7 ILW Store Ventilation The ILW store will be equipped with two HEPA filters in series to remove radioactive particulates present in the ILW building atmosphere. 3.3.3 Condenser Air Removal System Air in-leakage and non-condensable gases contained in the turbine exhaust steam are collected in the condenser. The condenser air removal system removes the air and non-condensable gases from the condenser during plant start-up, cool down, and normal operation from the steam side of the three main condenser shells and exhausts them into the atmosphere via the condenser air removal stack. During normal operation and shutdown, the main condenser has no significant inventory of radioactive contaminants; thus the non-condensable gases and vapour mixture are discharged to the atmosphere are not normally radioactive. However, it is possible for the mixture to become contaminated in the event of a steam generator tube leak. Radiation monitors associated with the BDS, steam generator system (main steam), and the condenser air removal system provides the means to determine if the secondary side is radioactively contaminated. Upon detection of unacceptable levels of radiation, operating procedures are implemented to precipitate corrective action. 3.3.4 Air Emission Release Points The point source release points to the atmosphere are shown in Figure 3.3-2. The main plant vent and ILW ventilation stack provide the only potential sources of gaseous radioactive emissions under normal operating conditions. Both these sources are subject to abatement (see Sections 3.3.2, 3.3.2, and 3.3.3). The other emission points identified in Figure 3.3-2 only act as sources of radioactive air emissions in abnormal conditions, such as a loss of coolant accident (LOCA) or primary-secondary tube leak failure. UKP-GW-GL-790 71 Revision 4 3.0 Radioactive Waste Management Systems UK AP1000 Environment Report The main plant vent is located on the side of the containment building. Data relating to the main plant vent is shown in Table 3.3-4. The details of the Condenser Air Removal Stack are shown in Table 3.3-5. No design data is currently available for the ILW store ventilation stack. 3.3.5 BAT Assessment for Gaseous Radwaste Treatment 3.3.5.1 BAT – Optimization of Delay Bed Sizing The carbon delay beds in the WGS have been designed as a folded serpentine configuration to minimize space requirements and the potential for voids in the activated carbon. The length-to-diameter ratio will maximize the ratio of breakthrough time to mean delay time. The waste gas flow is generally vertical (up and down) through columns of granular activated carbon. No retention screens are required on the delay bed since the flow is low velocity and enters and leaves each delay bed at its top. No failure mechanisms have been identified that could increase discharge flow rates high enough to suspend activated carbon particulates from the delay beds. Each serpentine has four legs. The number of legs, and hence the volume of carbon in the delay bed, has been optimized by evaluating the radioactive releases (using the GALE code) expected as a function of the number of legs. Figure 3.3-3 shows how the optimum number of legs in the delay bed system is eight. Increasing the number of legs above eight has a diminishing benefit in terms of reducing releases of radioactivity. Increasing the size of the delay bed is not warranted in terms of the cost of increasing volumetric space requirements within the auxiliary building which is a Category 1 seismic building; the cost of purchase, installation, and decommissioning of the additional serpentine legs and the additional cost of activated carbon. 3.3.5.2 BAT – HEPA Filter Selection The VFS, VAS (fuel handling area), and VRS will have HEPA filter housings capable of holding a range of different specification filters. Higher specification HEPA filters than those shown in Table 3.3-3 are available. However, these filters may increase differential pressure and have shorter replacement intervals than the specified filters. This would result in increased energy use on the extraction fans and a larger filter element waste volumes requiring disposal as LLW. The final choice of filter element is best determined by operator experience when the optimum balance between cost of filters, cost of filter disposal, and filter performance can be evaluated. 3.3.5.3 BAT – Radiologically Controlled Ventilation Areas The normal operating condition is one in which radioactivity is not detected within the radiologically-controlled areas of the auxiliary and annex buildings. Under these circumstances, the air extracted by the ventilation system is emitted to the atmosphere via the plant vent without treatment. The advantage of this system is that the exhaust air filtration units of the VFS are not being used to filter uncontaminated air. This prolongs the life of the filters and charcoal adsorber and minimizes the generation of LLW. UKP-GW-GL-790 72 Revision 4 3.0 Radioactive Waste Management Systems 3.3.6 Air Emissions 3.3.6.1 Annual Air Emissions UK AP1000 Environment Report The radioactive air emissions from the AP1000 NPP following abatement comprise radioiodines, noble gases, and particulates. The annual releases are presented in Tables 3.3-6, 3.3-7, and 3.3-8, respectively. The data are based on proprietary calculations determined from the revised GALE Code (Reference 3-6). The emissions data are for annual average air emission; no account is taken of short term variability of emissions. 3.3.6.2 Monthly Air Emissions The monthly radioactive discharges over an 18-month fuel cycle were estimated for an AP1000 NPP in Reference 3-7. The 18-month cycle includes startup, shutdown, and maintenance. The radionuclides considered in evaluating gaseous emissions were those from the nuclear power reactors listed in EU Commission Recommendation 2004/2/Euratom for discharges to the atmosphere and liquid discharges. However, some of the radionuclides were omitted due to insufficient source data. Those radionuclides included in the analysis are listed in Table 3.3-9. Table 3.3-10 lists the total monthly discharges of radionuclides in gas from an AP1000 NPP during an 18-month operating cycle. Tables 3.3-11 through 3.3-22 list radioiodine, noble gases, H-3, C-14, Ar-41, Co-60, Kr-85, Sr-90, I-131, Xe-133, Cs-137, and other particulates discharged in the gas, respectively. Sources of gas discharges include the following: RCS Containment building Auxiliary building Turbine buildingCondenser air removal system. The variability in gaseous discharges associated with the RCS over the fuel cycle is the same as the variability in liquid discharges from which they are derived. The non-RCS gas discharges are expected to be constant during the fuel cycle. The variability of the gaseous discharge over the 18-month fuel cycle is shown in Figure 3.3-4. 3.3.7 Comparison of AP1000 NPP Discharges with Existing Plants The gaseous discharges from the AP1000 NPP were compared with those from the following operating plants (Table 3.3-23): South Texas 1 Braidwood 1 Cook 1Vogtle 1Sizewell B These plants were selected for comparison to the generic AP1000 NPP because South Texas 1, Braidwood 1, Cook 1, and Vogtle 1 are more recently built Westinghouse pressurised water reactors (PWRs) in the United States; Sizewell B is a PWR in the UK. When the values are normalized to an annual basis and 1000 MW output, the AP1000 NPP has lower discharges than all but one of the plants and essentially the same as the remaining one. UKP-GW-GL-790 73 Revision 4 3.0 Radioactive Waste Management Systems 3.4 UK AP1000 Environment Report Liquid Radioactive Waste The management of liquid radwaste is described in detail in Chapter 11.2 of the DCD (Reference 1-1). The WLS is designed to control, collect, process, handle, store, and dispose of liquid radwaste generated as the result of normal operation, including anticipated operational occurrences. 3.4.1 Sources The WLS receives liquid waste from the following sources at flow rates shown in Table 3.4-1: 3.4.1.1 Reactor Coolant System Effluents The effluent subsystem receives borated and hydrogen-bearing liquid from two sources: the RCDT and the CVS. The RCDT collects leakage and drainage from various primary systems and components inside containment. Effluent from the CVS is produced mainly as a result of RCS heat-up, boron concentration changes, and RCS level reduction for refuelling. The RCS effluents contain dilute boric acid at concentrations up to 2700 ppm. This borated water is the principal input in terms of volume and activity. 3.4.1.2 Floor Drains and Other Wastes with High Suspended Solids Floor drains and other wastes are collected by various building floor drains and sumps, and routed to one of two waste holdup tanks, with a volume of 57 m3 each. They potentially have high suspended solid contents. 3.4.1.3 Detergent Wastes Detergent wastes coming from the plant hot sinks and showers as well as some cleanup and decontamination processes are routed to the chemical waste tank with a volume of 34 m3. 3.4.1.4 Chemical Wastes Chemical wastes collected from the laboratory and other relatively small volume sources are transferred to the chemical waste tank. It may be mixed non-hazardous, hazardous, and radwastes or other radwastes with high dissolved-solids content. These wastes are generated at a low rate. 3.4.1.5 Steam Generator Blowdown Steam generator blowdown is normally non-radioactive and is accommodated within the BDS. However, if steam generator tube leakage results in significant levels of radioactivity in the steam generator blowdown stream, this stream is redirected to the WLS for treatment before release. In this event, one of the waste holdup tanks is drained to prepare it for blowdown processing. 3.4.2 Storage and Containment of Liquid Radwaste The liquid radwaste is collected in five tank systems: RCDTs UKP-GW-GL-790 74 Revision 4 3.0 Radioactive Waste Management Systems UK AP1000 Environment Report Effluent hold up tanks Waste hold up tanks Chemical waste tanks Monitor tanks (treated liquid radwaste, see subsection 3.4.3.6) Details of these tanks, their locations, and their secondary containment can be found in Tables 3.4-2 and 3.4-3. Sludge is not expected to accumulate significantly on the bottoms of liquid waste treatment tanks. These tanks are designed to minimize sludge formation by including provisions to slope the effluent hold-up tank from one end to the other into a dirt pan section where particulate material can collect; the vertical tanks are sloped to the low point where particulates will be collected. The discharge pump suction is taken from the dirt pan or low point for drawing waste water out of the tank, thus performing a self-cleaning action. The tanks are also fitted with oversized manways that allow for access in case any additional cleaning is necessary for tank maintenance or during decommissioning. 3.4.3 Liquid Radwaste System The WLS is located in the nuclear island auxiliary building. A schematic of the WLS is shown in Figure 3.4-1. 3.4.3.1 Degasification of Reactor Coolant System Effluent The input to the RCDT is potentially at high temperature. Therefore, provisions are made for recirculation through a heat exchanger for cooling. The tank is inerted with nitrogen and is vented to the WGS. The cooled RCS effluents then pass to the vacuum degasifier to remove hydrogen and dissolved radiogases before storage in the three effluent holdup tanks, with a volume of 106 m3 each. The stripped gases are vented to the WGS. The degasifier column is designed to reduce hydrogen by a factor of 40, assuming inlet flow of 22.7 m3/h (100 gpm) at 54°C (130°F). The contents of the effluent holdup tanks may be: 3.4.3.2 Recirculated and sampled. Recycled through the degasifier for further gas stripping. Returned to the RCS via the chemical and CVS makeup pumps. Passed through the filtration and ion exchange treatment units of the WLS before being sent to the monitor tanks for discharge. Pre-Filtration The contents of the effluent holdup tanks and waste holdup tanks are normally passed through a treatment system comprising an upstream filter followed by four ion exchange resin vessels in series and a downstream filter. A pre-filter is provided to collect particulate matter in the effluent stream before ion exchange. The unit is constructed of stainless steel and has disposable filter bags. The pre-filter has a nominal particulate removal efficiency of 90 percent for 25 μm particles. UKP-GW-GL-790 75 Revision 4 3.0 Radioactive Waste Management Systems UK AP1000 Environment Report The pre-filter is particularly important for removal of solids present in effluent collected from the floor drains which are directed to the waste holdup tanks. 3.4.3.3 Deep Bed Filtration The deep bed filter is a stainless steel vessel containing a layered bed of activated charcoal above a zeolite resin. The activated charcoal provides an adsorption media for removal of trace organics and provides protection for the ion exchange resins from contamination with small amounts of oil from the floor drain wastes. Moderate amounts of other chemical wastes can also be routed through this vessel. The top layer of activated charcoal collects particulates and, being less dense than the zeolite, can be removed without disturbing the underlying zeolite bed which minimizes solid-waste production. The lower layer of the deep bed filter is clinoptilolite zeolite which possesses an affinity for caesium (see Table 3.4-4). 3.4.3.4 Ion Exchange Three ion exchange beds are provided following the deep bed filter. The ion exchange vessels are stainless steel, vertical, cylindrical pressure vessels with inlet and outlet process nozzles plus connections for resin addition, sluicing, and draining. The process outlet and flush water outlet connections are equipped with resin retention screens designed to minimize pressure drop. The design flow is 75 U.S. gpm (17 m3/h). This capacity provides an adequate margin for processing a surge in the generation rate of this waste. The media will be selected by the plant operator to optimize system performance according to prevailing plant conditions. Typically, the first bed will contain a cation exchange resin and the second two beds will contain mixed bed resins. Any of these vessels can be manually bypassed and the order of the last two can be interchanged, so as to provide complete usage of the ion exchange resin. The ion exchange beds operate in the borated saturated mode. This means that the boric acid present in the reactor coolant effluent passes through the ion exchange beds without reduction in concentration. The assumed decontamination factors (DFs) for the resin beds are shown in Table 3.4-4. 3.4.3.5 After Filter This filter is provided downstream of the ion exchangers to collect particulate matter, such as resin fines. The unit is constructed of stainless steel and has disposable filter cartridges. The design filtration efficiency is 98 percent removal of 0.5μm particles. 3.4.3.6 Monitor Tanks Treated effluent is discharged to the six monitor tanks located in the radwaste building. Information relating to the design of the monitor tanks and their secondary containment can be found in Tables 3.4-2 and 3.4-3, respectively. Each tank has a capacity of 57 m3, giving a total storage capacity for treated effluent of 342 m3. This volume allows up to ~42 days storage during normal power operations when the average daily liquid radwaste release rate is ~8m3 per day (see Table 3.4-1). The storage UKP-GW-GL-790 76 Revision 4 3.0 Radioactive Waste Management Systems UK AP1000 Environment Report period is reduced during the short periods associated with higher discharge rates resulting from boron dilution near the end of core life and during RCS heat-up following refueling. The release of treated liquid waste from any monitor tank to the environment is permitted only when sampling of the subject tank’s contents indicates that such a release is permissible. If the effluent does not meet the permissible limits, it can be returned to a waste holdup tank or recirculated directly through the filters and ion exchangers. A radiation monitor is located on the common discharge line downstream of the WLS monitor tanks. These radiation monitors will provide a signal to terminate liquid radwaste releases if the discharge concentration in the line exceeds a predetermined set point. Effluent meeting discharge limits for radioactivity is pumped from the monitor tanks in a controlled fashion to the cooling water return from the CWS. The monitor tank pumps have a design flow rate of ~22.7 m3/h. The once through cooling water flow rate is 136,275 m3/h. It follows that the cooling water stream provides a substantial dilution of the discharged effluent before release to the environment. 3.4.3.7 Potential to By-pass Ion Exchange Routine bypass of the WLS ion exchangers is not anticipated. However, the WLS is designed to be flexible and capable of handling a relatively wide range of inputs, including both high grade water (from reactor effluents) and low grade water (floor drains). Each collection tank (effluent holdup tank, waste holdup tank) will typically be mixed and sampled prior to processing. Analysis of the sample from a specific batch of liquid will allow operator evaluation and determination of the optimum processing technique. The evaluation will include the chemistry of the batch, the radiological content of the batch, and the types and condition of the filters and ion exchange media in the WLS. This evaluation will be performed according to procedure. When processing a batch of reactor effluents, all WLS ion exchangers and filters are anticipated to be in service. However, when processing floor drains from the waste holdup tanks, it is possible that some batches may be very low in radioactivity; an example would be following actuation of the fire water system in the radiologically controlled area of the plant, when a significant volume of uncontaminated fire water might be collected by the WLS. In this case, it may be acceptable and preferable to bypass one or more of the WLS ion exchangers, in order to maximize the life of the media, thereby minimizing solid radwaste arisings and associated occupational radiation exposure. The selection of WLS ion exchange vessels in and out of service is made through the alignment of manually-operated valves. These valves are opened and closed by an operator who works in a personnel access corridor, where the operator is well shielded from the radiological source of the demineralisers and filters. These valves are under administrative control to prevent an advertent bypass of demineralisers or sub-optimal treatment of waste. In all cases, processed water downstream of the WLS ion exchanger/filter train is collected in a monitor tank, which is sampled prior to discharge to the environment. This sample will then be evaluated to ensure release goals are achieved, and serves as a final check that processing was appropriate. UKP-GW-GL-790 77 Revision 4 3.0 Radioactive Waste Management Systems 3.4.3.8 UK AP1000 Environment Report Use of Mobile and Temporary Equipment The WLS is designed to handle most liquid effluents and other anticipated events using installed equipment. However, for events occurring at a very low frequency, or producing effluents not compatible with the installed equipment, temporary equipment may be brought into the radwaste building mobile treatment facility truck bays. Any treatment of liquid waste by mobile or temporary equipment will be controlled and confirmed by plant procedures. Connections are provided to and from various locations in the WLS to these mobile equipment connections. This allows the mobile equipment to be used in series with installed equipment, as an alternative to it with the treated liquids returned to the WLS, or as an ultimate disposal point for liquids that are to be removed from the plant site for disposal elsewhere. The radwaste building truck bays and laydown space for mobile equipment, in addition to the flexibility of numerous piping connections to the WLS, allow the plant operator to incorporate mobile equipment in an integrated fashion. Temporary equipment is also used to clean up the condensate storage tank if it becomes contaminated following steam generator tube leakage. This use of temporary equipment is similar to that just described, except that the equipment is used in the yard rather than in the radwaste building truck bays. These provisions to utilize mobile and flexible technology properly interconnected with permanent systems allow for evolving state-of-the-art to be applied to waste processing throughout the life of the plant. 3.4.3.9 Detergent Waste Detergent wastes are collected in the chemical waste tank. They have low concentrations of radioactivity and contain soaps and detergents not compatible with the ion exchange resins. If their activity is low enough, they can be discharged without processing. When detergent waste activity is above acceptable limits and processing is necessary, the waste water may be transferred to a waste holdup tank and processed in the same manner as other radioactively contaminated waste water, if onsite equipment is suitable to do so. If onsite processing capabilities are not suitable for the composition of the detergent waste, processing can be performed using mobile equipment. The mobile equipment would comprise a concentration step (e.g., evaporation or cross-flow microfilter) in order to reduce the volume of waste to the extent necessary to allow an encapsulation plant to immobilize the concentrate in a cementitious grout. The encapsulation would typically take place in a 200l drum. The completed waste packages would be loaded into the half height ISO containers (HHISOs) for shipment to the Low Level Waste Repository (LLWR). After processing by the mobile equipment, the condensed evaporator distillate or filtrate would be transferred to a waste holdup tank for further processing in the WLS or transferred to a monitor tank for sampling and discharge. The commercial availability of mobile equipment using this type of volume reduction and waste stabilization techniques has been confirmed through companies offering specialist contract services. 3.4.3.10 Chemical Waste Chemical wastes are normally generated at a low rate and collected in the chemical waste tank shared with detergent wastes. Chemicals are added to the tank, as needed, for pH or other chemical adjustment. The design includes alternatives for processing or discharge. UKP-GW-GL-790 78 Revision 4 3.0 Radioactive Waste Management Systems UK AP1000 Environment Report These wastes may be processed onsite, without being combined with other wastes, using mobile equipment. When combined with detergent wastes, they may be treated like detergent wastes, as described in subsection 3.4.3.9. If onsite processing capabilities are not suitable, processing can be performed using mobile equipment or the waste water can be shipped offsite for processing. 3.4.4 BAT Assessment for Liquid Radwaste Treatment 3.4.4.1 Ion Exchange vs. Evaporation A comparison of typical flow sheets for evaporation and ion exchange is shown in Figure 3.4-2. The relative merits of ion exchange and evaporation has been evaluated by Westinghouse and the results are reported in Table 3.4-5. In Europe, many nuclear reactors are located on major rivers and not on coastal sites. These locations have less capacity to accept discharges of borated effluent. It is common for these reactors to be equipped with evaporators to minimise the radioactive liquid and boric acid discharges. However, the standard AP1000 NPP design does not have evaporators based on considerations shown in Table 3.4-5 and because it contradicts the AP1000 NPP overriding principle of safety and simplicity. Compared to the traditional evaporator-based WLS, the ion-exchange based AP1000 NPP system provides effectiveness and simplicity, and will tend to minimize operator doses and solid radwaste arisings. The complexity of the traditional evaporator design leads to significant maintenance with associated occupational radiation exposure, and also gives more opportunity for operator errors. The relatively passive nature of the ion-exchange based AP1000 NPP system provides effective operation without the issues of the evaporator-based system and at lower capital and operating costs. At Sizewell B, two evaporators were constructed; one for recycling boric acid from the RCS, and one for abatement of liquid radwaste. Evaporation of liquid for either purpose is not currently considered best practicable means (BPM) or ALARP, and the evaporators are not in use at Sizewell. This is because the benefit of reducing liquid discharges, in terms of the consequent small reduction of public dose, is much less than the potential harm of increased operator doses. In addition, the small reduction in public dose would not justify the cost of processing (evaporator and encapsulation) and the cost of providing sufficient high quality steam to run the evaporators. The ion exchange treatment process has been shown to effectively control off-site discharges. For the generic site, it has been demonstrated that the AP1000 NPP effluent discharges can be released to the coastal environment with only a minor impact on seawater boron concentrations and marine ecosystem dose rates (see Sections 4.2.5.2, 5.2, 5.3, and Reference 3-8). It is concluded that, for the UK generic coastal site, the proposed WLS treatment system using ion exchange beds and filtration rather than evaporation is BAT. 3.4.4.2 Enriched Boric Acid vs. Natural Boric Acid The AP1000 NPP is designed not to require a high quality boron source. Natural boric acid is used rather than very costly B-10 enriched boric acid. The use of B-10 enriched boric acid has the potential of reducing the concentration of boron required as a moderator in the RCS. Enriched boric acid typically contains 60 percent B-10 UKP-GW-GL-790 79 Revision 4 3.0 Radioactive Waste Management Systems UK AP1000 Environment Report compared to 20 percent B-10 in standard boric acid. As B-10 is the effective reactor moderator, the use of enriched boric acid has the potential for reducing the boron concentration in the RCS, at maximum, by a factor of three. The same amount of B-10 isotope is required as a moderator irrespective of whether it is provided in the enriched or natural form. This means that the production mechanism for tritium involving neutron activation of B-10 is similar for the enriched and natural forms of boric acid. Another important formation mechanism for tritium is the neutron activation of lithium. In principle, the use of enriched boric acid reduces the amount of lithium hydroxide required for pH control by a factor of three. Such a reduction in lithium concentration would reduce the potential for tritium formation (see Section 3.2.7). However, the AP1000 NPP employs other, more effective measures to minimise tritium formation including: Use of gray rods for mechanical shim control which reduces the quantity of boric acid required for chemical shim control (see Sections 2.6.3 and 3.2.8) Use of Li7OH rather than natural lithium hydroxide for pH control. This substantially reduces the potential for tritium formation from neutron absorption by Li-6 present in natural lithium hydroxide (see Section 3.2.7). The cost of enriched boric acid is more than two hundred times the cost of natural boric acid. Since lithium hydroxide is a strong base and boric acid is a weak acid, only a small quantity of lithium hydroxide is needed to adjust the pH of boric acid concentrations in the RCS. It is more cost-effective to use slightly more Li7OH for the pH control of natural boric acid than it is to incur the high cost of enriched boric acid with lower Li7OH use. 3.4.4.3 Boron Discharge vs. Boron Recycle The requirement for a reduction in the use of boron has been driven by U.S. users who see a capital and operating cost benefit in the reduced use of boron, as well as a major reduction in the complexity of the plant. The AP1000 NPP adopts several approaches which minimise the production of liquid radwaste before the treatment by the WLS (see Section 3.2). In particular, the use of mechanical shim control rather than chemical shim control during normal load follow operations substantially reduces the quantities of boron used as a moderator. This reduces the amount of boron that needs to be removed from the reactor coolant water and therefore reduces the amount of liquid radwaste produced. The use of natural boron rather than costly enriched boron (see subsection 3.4.4.2) reduces the economic incentive for recycling boron. Boron recycling requires a significant amount of additional equipment. The borated water cannot be reused until the start of the next fuel cycle and must be stored for long periods. This storage presents an additional safety issue and an additional source of operator dose, which is not considered ALARP. The additional equipment also presents increased operator dose during maintenance and decommissioning. Assuming the monitor tanks contain water with the upper limit of 2700mg/l of boron and that the effluent is discharged at 22.7m3/h into in the seawater cooling return flow of 136,275m3/h, the boron concentration in the cooling return would be increased by 450 μg/l. UKP-GW-GL-790 80 Revision 4 3.0 Radioactive Waste Management Systems UK AP1000 Environment Report At an average liquid radwaste effluent flow rate of 8m3/d, such as discharge, would only occur for 128 hours per year. It is concluded that the boron discharge is negligible in relation to the annual average Environmental Quality Standard of 7000μg/l for the protection of saltwater life (Reference 3-9) and that discharge of boron to seawater meets BAT and ALARP criteria. 3.4.4.4 Cartridge Filtration vs. Cross Flow Filtration The WLS incorporates an after filter downstream of the ion exchangers to collect particulate matter, such as resin fines. The disposable filter cartridges have a design filtration efficiency of 98 percent removal of 0.5μm particles. The radioactive particulate load in the WLS influent is already reduced by passage through the pre-filter, deep bed filter, and three ion exchange beds before the after filter. The use of cartridge filters offers a low pressure system that is suitable for the low flow rates (~8m3/day) associated with the WLS. The filters are readily replaceable and treated as LLW. Cross-flow filtration techniques of microfiltration and ultrafiltration potentially offer increasingly effective particulate removal efficiency (ranging from 0.1 μm to <0.001 μm) compared to cartridge filtration. All these techniques use membrane processes that segregate a liquid that permeates through the membrane producing a concentrate which is retained. The driving force of the process is the pressure difference across the membrane. The disadvantages of these processes are as follows: High pressure systems to drive the filtration process which carries an increased potential for leaks. The pressure requirements increase as follows: microfiltration < ultrafiltration < nanofiltration < reverse osmosis. Complicated return, recycling, and bleed system designs to deal with the concentrate stream. Polymeric membranes used, particularly in ultrafiltration, nanofiltration, and reverse osmosis, are subject to degradation by decay of captured radioactive particulates. Ceramic membranes are expensive. The complexity of these systems relative to the proposed cartridge filtration system has the potential for greater levels of maintenance and higher associated operator dose. More equipment that will become radwaste during decommissioning. Higher capital and operating costs than cartridge filtration. It is concluded that the proposed use of cartridge filters is BAT for filtration after the ion exchange beds. 3.4.5 Liquid Effluent Discharges 3.4.5.1 Annual Liquid Effluent Discharges The annual release of radioactive effluents is quantified in Table 3.4-6. The data are based on proprietary calculations determined from the revised GALE Code (Reference 3-6). The emissions data are for annual average water discharges and take no account of short term variability of releases. UKP-GW-GL-790 81 Revision 4 3.0 Radioactive Waste Management Systems 3.4.5.2 UK AP1000 Environment Report Monthly Liquid Effluent Discharges Table 3.4-7 lists the total monthly discharges of radionuclides in liquid from an AP1000 NPP during an 18-month operating or fuel cycle. Tables 3.4-8 through 3.4-18 list monthly discharges of tritium, non-tritium, C-14, Fe-55, Co-58, Co-60, Ni-63, Sr-90, Cs-137, Pu-241, and other particulates in the liquid, respectively. The discharged liquid is generated by the RCS and non-RCS sources. As the fuel burn-up increases over the fuel cycle, less boron is needed in the reactor cooling water. This adjustment in boron concentration is achieved by bleeding borated water from the RCS and replacing it with unborated water. A larger volume of water needs to be removed each month; therefore, the radioactive discharges increase each month of the cycle. This results in the variability in activity in liquid discharges from the RCS shown in Tables 3.4-7 and 3.4-8 and Figure 3.4-3. Non-RCS liquid volume comes from various sources in the plant: Inside containment Sample drains Reactor containment cooling Spent fuel pool liner leakage Miscellaneous drains Hot shower Hand wash Equipment and area decontamination Chemical wastes The volume of liquid from non-RCS sources is expected to be almost constant during each month of the cycle; therefore, the radioactive non-RCS discharges are expected to be constant, as shown in Tables 3.4-7 and 3.4-8. 3.4.6 Comparison of AP1000 NPP Liquid Discharges with Other European Pressurised Water Reactors The predicted liquid discharges from the AP1000 NPP are compared in Tables 3.4-19 and 3.4-20 with published discharges from European nuclear reactors operating over the period 1995-1998 (Reference 3-10). The tritium data in Table 3.4-19 indicates that the predicted AP1000 NPP discharges are similar to Sizewell B discharges, but above the European average for all European PWRs. The predicted AP1000 NPP tritium discharges are less than the Magnox and advanced gas-cooled reactors (AGRs), but higher than discharges from boiling water reactors (BWRs). In practice, it is very difficult to reduce discharges of tritium. The radiological impact of tritium is relatively small and the radiological impact of discharges is usually very low. Table 3.4-20 compares the predicted non-tritium radioactive liquid discharges from the AP1000 NPP against published data for European nuclear power stations between 1995 and 1998 (Reference 3-10). The results indicate that the AP1000 NPP emissions are predicted to be approximately 50 percent of the average PWR discharges. The predicted discharges are also considerably lower than the average Magnox, AGR, BWR and Sizewell B discharges. The liquid discharges from the AP1000 NPP were compared with those from the following operating plants (Table 3.4-21): South Texas 1 Braidwood 1 Cook 1 UKP-GW-GL-790 82 Revision 4 3.0 Radioactive Waste Management Systems UK AP1000 Environment Report Vogtle 1 Sizewell B These plants were selected for comparison to the generic AP1000 NPP because South Texas 1, Braidwood 1, Cook 1, and Vogtle 1 are more recently built Westinghouse PWRs in the United States; Sizewell B is a PWR in the UK. When the values are normalized to an annual basis and 1000 MW output, the AP1000 NPP has lower discharges than the other plants. 3.5 Solid Radioactive Waste 3.5.1 Overview of the Integrated Waste Management Strategy Management of radwaste is being planned with the expectation that the LLW, ILW, and spent fuel waste streams will be capable of being disposed in Nuclear Decommissioning Authority (NDA) facilities. Waste forms and treatment processes have been selected with this principle in mind. To ensure the waste packages are disposable, Radioactive Waste Management Directorate (RWMD) compliant containers have been designated. Westinghouse has initiated discussions regarding the disposability of radwaste with the EA and the UK NDA, and will continue this dialogue. Westinghouse has provided the NDA with information relating to the wastes that are expected to arise over the lifetime of an AP1000 NPP (Reference 3-11). In 2009, the NDA used this information as the basis for a disposability assessment report covering ILW and HLW generated by the AP1000 NPP (Reference 3-12). This report stated: “On the basis of the GDA Disposability Assessment for the AP1000 [NPP], RWMD has concluded that, compared with legacy wastes and existing spent fuel, no new issues arise that challenge the fundamental disposability of the wastes and spent fuel expected to arise from operation of such a reactor. This conclusion is supported by the similarity of the wastes to those expected to arise from the existing PWR at Sizewell B.” Uncertainties and risks relating to the achievement of this strategy will be identified as the strategy is implemented and managed by documenting and discussing them with the utility customers and the EA. The main uncertainty, risk, and assumptions in this strategy are associated with radioactive waste and spent fuel disposal in line with the NDA. At this time, the NDA is not able to provide information on the spent fuel packages they will accept; therefore, Westinghouse will assume that current practices for spent fuel packaging remain acceptable once the AP1000 NPP is built and operating. This includes container designs and sizes, and acceptable waste forms (spent fuel assemblies). Westinghouse is communicating with the NDA about these issues. Nearby facilities, where and when available, will be used to the extent practical to minimize the environmental impact of transport. During site operations, communications will be maintained to assess onsite and offsite interdependencies; for example, those between the AP1000 NPP and offsite disposal facilities. Figure 3.5-1 is a pictorial representation of the AP1000 NPP waste management strategy. This strategy is integrated to take into account all matters that might have a bearing on the management of radwaste and spent fuel, including the following: Waste minimization Avoidance of unnecessary introduction of waste into the environment Waste characterization and segregation UKP-GW-GL-790 83 Revision 4 3.0 Radioactive Waste Management Systems 3.5.1.1 UK AP1000 Environment Report Collection and retention of data on the waste and waste packages Consideration of options in a BAT assessment Communications with interfacing facilities and stakeholders Assurance that steps in the management of waste are compatible Characterization of risks and uncertainties Waste Minimization Waste minimization is an inherent part of waste management. The basic AP1000 NPP design principles minimize the creation of radwaste during operations and decommissioning. AP1000 NPP was designed with fewer valves, pipes, and other components so less waste will be generated during maintenance activities (repair and replacement) and decommissioning. Waste generation will be minimized in an AP1000 NPP due to material selection. For example, the level of cobalt in reactor internal structures is limited to below 0.05 weight percent, and in primary and auxiliary materials to less than 0.2 weight percent (see Chapter 20 of the DCD (Reference 1-1)). This limits the activation of the metal components. Surfaces, including steel wall and floor surfaces, will be sealed to prevent penetration and to facilitate decontamination. Also, during operation and maintenance, waste will be minimized by using best industry practices (for example, limiting the amount of material brought into containment). At the end of the storage period, the radiological characteristics of ILW packages will be reviewed to assess if sufficient decay has occurred to allow them to be reclassified as LLW. As described in subsection 3.5.1.7 laundry items will be reused, and therefore will not be considered waste. 3.5.1.2 Waste Generation Waste inventory estimates have been developed based on operational experience with existing plants to ensure this strategy is consistent with the waste expected to be generated (see Sections 3.5.3 and 4.3). Waste and discharges generated over the operational period of the AP1000 NPP will be systematically identified. They will be managed, treated, handled, and stored onsite by designing appropriate facilities and demonstrating that they are compatible with the AP1000 NPP (see Sections 3.5.7 to 3.5.10 and Section 4.3). Potential locations for the waste management facilities on the generic AP1000 NPP site are provided in Section 2.3. Transportation and disposal of wastes will use the appropriate methods. Management of wastes generated during decommissioning according to UK requirements is included (see Section 3.5.10). 3.5.1.3 Radioactive Waste Treatment Waste will be categorized for treatment as conventional or radioactive, and within radioactive as LLW, ILW, and HLW. Solid waste will be characterized and segregated using equipment discussed in Section 3.5.7. A range of appropriate options for waste treatment, such as evaporation, drying, incineration, and cement encapsulation, was considered at an optioneering workshop that included utility UKP-GW-GL-790 84 Revision 4 3.0 Radioactive Waste Management Systems UK AP1000 Environment Report participation and its respective operational experiences managing radwaste. The results of this workshop were documented, and the chosen options substantiated; for example, cement encapsulation of solid ILW and compaction of compactable LLW (see Section 3.5.5). Each step in the management of radwaste will be compatible with all other steps, including pre-treatment, treatment, storage, disposal, handling, and onsite and offsite transport. The design of AP1000 NPP and the process used for selection of radwaste treatment equipment provide flexibility to the operator. The solid radwaste technologies considered are currently proven technologies that have been used in the UK and elsewhere; for example, a mobile cement encapsulation system for the treatment of ILW. However, this equipment is not required until 18 months after the plant becomes operational. Before that time, the utility could decide to reassess solid waste treatment to consider the latest developments in technology and different packaging arrangements. Also, because the cement encapsulation system is mobile and designed to be easily removed, the utility could choose to replace the equipment after operations have started and when newer technology has been developed. Figure 3.5-2 is a pictorial representation of the AP1000 NPP solid waste management. 3.5.1.4 On-Site Storage The waste management strategy requires LLW to be shipped for disposal routinely according to schedules agreed to by the plant operator and the UK NDA. A facility will be available to store LLW during periods (up to 2 years) when waste cannot be received by the LLW disposal facility. An onsite storage facility for arisings of ILW from operation of the plant has been designed (see subsection 3.5.8.2), because the disposal of ILW from any new nuclear power stations to a future geologic repository is unlikely to occur until late this century. The design of the storage facility addresses how the ILW is transported to the facility and how waste is handled within it. Waste storage procedures will be developed to ensure safety, transportability, stock control, and ability to retrieve waste packages are all in place prior to dispatching the first batch of ILW to the ILW store. 3.5.1.5 Waste Transportation Westinghouse has discussed with the NDA the use of approved containers for transport and disposal of ILW, as well as LLW (see Section 3.5.9). The containers and packages with shielding will be acceptable for transport and disposal. 3.5.1.6 Spent Fuel Management Spent fuel management is discussed in subsection 3.5.7.3. After spent fuel is removed from the reactor, it will be stored in the fuel storage pool. Details of the fuel storage pool can be found in Section 9.1.2 of the European DCD (Reference 1-1). Because spent fuel is not expected to be reprocessed, a facility for dry spent fuel storage for the operational period of the plant and beyond is being designed (see subsection 3.5.8.3). Each step in the management of spent fuel will be compatible with all other steps, including storage, disposal, handling, and onsite and offsite transport. The spent fuel will be safely disposed, at appropriate times and in appropriate ways; Westinghouse has contacted the NDA to ensure spent fuel will be packaged in a manner acceptable to the NDA. UKP-GW-GL-790 85 Revision 4 3.0 Radioactive Waste Management Systems 3.5.1.7 UK AP1000 Environment Report Laundry There is no laundry facility in the standard AP1000 NPP design. It is assumed that overalls and gloves would be laundered at offsite facilities. One example of such facilities is the Unitech laundry facility in Wales. It offers a lease program wherein an operator would lease the garments, use them, package them in two categories based on contamination level, and ship them to the laundry facility. Unitech would supply clean replacement garments. The returned garments would be washed (and rewashed if necessary) before reuse. The leased garments would not form part of the LLW inventory, unless they became so contaminated that they could not be shipped to Unitech. 3.5.2 Radioactive Waste Classification 3.5.2.1 Low Level Waste Low level radwaste is defined as “radioactive waste having a radioactive content not exceeding 4 GBq/te of alpha or 12 GBq/te of beta/gamma activity” (Reference 3-13). Very Low Level Radioactive Waste (VLLW) is a sub-category of LLW. This is broken down into “low volume” and “high volume” VLLW, each of which has its own definition (Reference 3-14): 1. Low volume VLLW (LV-VLLW) In the case of low volumes (“dustbin loads”): “radioactive waste which can be safely disposed of to an unspecified destination with municipal, commercial or industrial waste (“dustbin” disposal), each 0.1m3 of waste containing less than 400 kilobecquerels (kBq) of total activity or single items containing less than 40 kBq of total activity.” For waste containing carbon-14 or hydrogen-3 (tritium): in each 0.1m3, the activity limit is 4,000 kBq for carbon-14 and hydrogen-3 (tritium) taken together; for any single item, the activity limit is 400 kBq for carbon-14 and hydrogen-3 (tritium) taken together. Controls for disposing of this material after it has been removed from the premises where it was produced are not necessary. 2. High Volume VLLW (HV-VLLW) In the case of bulk disposals – high volume: “radioactive waste with maximum concentrations of four megabecquerels per tonne (MBq/te) of total activity which can be disposed of to specified landfill sites. For waste containing hydrogen-3 (tritium), the concentration limit for tritium is 40MBq/te. Controls on disposal of this material, after removal from the premises where the wastes arose, will be necessary in a manner specified by the environmental regulators.” UKP-GW-GL-790 86 Revision 4 3.0 Radioactive Waste Management Systems 3.5.2.2 UK AP1000 Environment Report Intermediate Level Waste ILW is radwaste with radioactivity levels exceeding the upper boundaries for LLW: 3.5.2.3 Alpha emitters greater than 4 GBq/te. Beta/gamma emitters greater than 12 GBq/te. Waste that does not need radiological self-heating to be taken into account in the design of storage or disposal facilities. IAEA guidance is that ILW thermal power is below about 2 kW/m3 (Reference 3-15). High Level Waste HLW is waste in which the temperature may rise significantly as a result of radioactivity, so that this factor has to be taken into account in designing storage or disposal facilities. IAEA guidance is that HLW thermal power exceeds about 2 kW/m3 (Reference 3-15). 3.5.3 Radioactive Solid Waste Generation The sources of solid waste generated in the AP1000 NPP are summarized in Table 3.5-1. A detailed breakdown of the wastes can be found in Appendix A. The solid radioactive waste estimates are best, realistic estimates. A major source of information for their calculations was consultations with experienced personnel who have worked in the design of the AP1000 NPP and worked on existing plants. The annual solid radioactive waste production varies due to the 18-month fuel cycle and the different schedules for replacement consumables and equipment maintenance. However, the annual average waste volumes are presented in Table 3.5-2. 3.5.3.1 Low Level Waste LLW includes dry active wastes, general trash, and mixed wastes as a result of normal plant operation, including anticipated operational occurrences. LLW waste will generally contain plastics, paper, metallic items, clothing, rubber, filters, redundant equipment, glass, and wood. Under normal operations, LLW also includes Condensate Polishing System (CPS) resins which are non-radioactive. However, under abnormal conditions (e.g., steam generator tube failure), there may be a transfer for primary circuit activity into the secondary circuit. The amount of activity transferred will be very small and the activity of the CPS resin will not exceed the limits for LLW. If situations arise when the activity of the CPS resins exceed the threshold for LLW disposal, then they will be treated as ILW resins. The quantities of LLW generated by the AP1000 NPP are summarized in Table 3.5-1. 3.5.3.2 Intermediate Level Waste ILWs are mainly comprised of spent ion exchange resins, activated carbon, and used filters. The production of theses wastes is intermittent and associated with replacement and maintenance procedures. The quantities of ILW generated by the AP1000 NPP are summarized in Table 3.5-1. The quantities of the ILW filter and resin wastes are based on contact with high coolant activity associated with 0.25 percent fuel failure. This is the bounding design case and, in reality, UKP-GW-GL-790 87 Revision 4 3.0 Radioactive Waste Management Systems UK AP1000 Environment Report modern PWR fuel is considerably more reliable than this failure rate, and it is possible that the filter and resin activity levels will be low enough for them to be disposed as LLW. However, for the purpose of conservatism and to bound accident scenarios, the design case estimated volumes of ILW have been used. Operating experience-based estimates on the quantities of actinides in dry solid radwaste is provided in Table 3.5-3. The actinides are of interest because they generally have long half lives. However, the activity due to actinides is at very low concentrations. 3.5.3.3 High Level Waste The HLW produced by the AP1000 NPP is spent fuel. Spent nuclear fuel is used fuel from a reactor that is no longer efficient in creating electricity, because its fission process has slowed. However, it is still thermally hot, highly radioactive, and potentially harmful. Operational strategies can influence the amount of spent fuel and radioactivity of the spent fuel. The amount of spent fuel discharged as a function of time is primarily determined by the energy production rate (overall capacity factor including outages) and the discharge burn-up limit. The reference 18-month equilibrium cycle feeds (and discharges) 64 fuel assemblies every 18 months. On average, this means that approximately 43 assemblies per year are discharged and stored in the spent fuel pool storage area. Each fuel assembly consists of 264 fuel rods in a 17 x 17 square array. The fuel rods consist of uranium dioxide ceramic pellets contained in cold-worked and stress relieved ZIRLO tubing, which is plugged and seal-welded at the ends to encapsulate the fuel. The quantities of HLW generated by the AP1000 NPP are summarized in Table 3.5-1. 3.5.4 Waste Minimisation Waste minimisation, characterisation, and segregation are central to both establishing and updating a radwaste inventory and optimising waste management in line with the waste management hierarchy (Figure 3.1-1). Opportunities for waste minimisation, characterisation and segregation will be considered in all stages of waste management, including design, construction, operation, decommissioning, storage, and disposal. 3.5.4.1 Low Level Waste The basic AP1000 NPP design principles minimize the creation of radwaste during operations and decommissioning: Good housekeeping Operating procedures Segregation Volume reduction Sealed surfaces (including steel wall and floor surfaces) to prevent penetration and to facilitate decontamination. UKP-GW-GL-790 88 Revision 4 3.0 Radioactive Waste Management Systems 3.5.4.2 UK AP1000 Environment Report Limiting the amount of material brought into containment. Training all staff allowed to enter radiation controlled areas (RCAs) Provision of waste facilities immediately outside of the RCAs, for the disposal of unnecessary packaging materials Provision of tool stores within the RCAs to prevent contamination of clean tools brought in from outside Testing filter performance to ensure filters are only replaced when necessary Provision of radwaste advice on radiation work permits Intermediate Level Waste On the AP1000 NPP, ILW is minimised by the following activities: Optimum operation of the reactor in terms of power generation per tonne of fuel Select fuel with minimal potential for fuel defects, thereby minimising the radioactive isotope contamination of the primary cooling water circuit. This will reduce the load being treated by the ion exchange resin beds and hence the volume of ILW. Fuel is received and carefully inspected for any imperfections Minimisation of plant shutdowns Use of gray rods for mechanical shim control Use of canned coolant pumps eliminates seal leaks and creation of radioactive waste water Selection of materials of construction with a composition low in cobalt Use of zinc addition for corrosion control Selections of ion exchange media to give an optimum DF, which will minimise the number of ion exchange media changes required and reduce the waste volume. Flexibility in routing effluent through the different ion exchange beds to optimise resin uptake Monitoring differential pressure across the filters and filter performance to ensure that filters are only replaced when necessary Segregation procedures to prevent dilution of ILW streams by mixing them with LLW streams Formulation trials to determine an optimum blend ratio producing the optimum number of waste packages Operating procedures UKP-GW-GL-790 89 Revision 4 3.0 Radioactive Waste Management Systems 3.5.4.3 UK AP1000 Environment Report High Level Waste Westinghouse works with utilities to optimize the important characteristics of the fuel reload design in order to meet the utility needs. This is typically a balance between the economics of the fuel management and the amount of operationing margin available from the design, given any specific characteristics of the individual plant sites. The fuel economics and the amount of spent fuel are closely correlated. Both are optimized when the fuel cycle is designed with fuel being discharged from the reactor as close as is reasonable to the licensed discharge burn-up limit. The current licensed limit for Westinghouse fuel is 62,000 MWD/MTU on the lead rod maximum burn-up. Considering inter-assembly power variations and variations of assembly power in assemblies within the same batch, this translates into a batch average burn-up of approximately 50,000 MWD/MTU. The proposed operational regime will help to support the design intention of minimizing spent fuel. The reference AP1000 NPP equilibrium cycle design is an 18-month cycle. The cycle is based on an assumed 97 percent capacity factor and a 21-day refueling outage. This provides a cycle length of approximately 510 effective full power days. Many alternative cycling schemes are possible and have been studied to demonstrate the flexibility of the AP1000 NPP design. However, the 18-month design is used as the reference for most work and provides close to the optimum (lowest) overall electrical production costs. If the prime objective is to reduce the average number of discharge assemblies per year, then an annual cycle in the AP1000 NPP would discharge fewer assemblies on the average than an 18-month cycle (40 versus 43). For a plant lifecycle of 60 years, this translates to a generation of 2517 or 2653 spent fuel assemblies for an annual or 18-month cycle, respectively. However, depending on the cost of the extra outage every 3 years – combined with the cost of replacement power during the outage, the impact of outage length on average capacity factor, etc. – this may not be the most overall economically efficient operation of the core. Westinghouse works with its utility customers to determine the customer’s priorities before core loading patterns are defined. The vast majority of Westinghouse customers choose the longer fuel cycle. 3.5.5 BAT – LLW and ILW A BAT assessment has been carried out on the radwaste treatment system which addresses the waste activities from the transportation point of the “Nuclear Island” through to dispatch to the ILW storage prior to disposal or to LLW disposal. The BAT assessment involved Aker Solutions, Different by Design (DBD), WEC, and included representatives from several utilities (Reference 3-16). The assumption was made that all reasonable opportunities would be taken for waste minimisation, reuse, and recycling and, where possible, wastes would be declassified by segregation and cleaning to free release standards. Having made this assumption, the BAT assessment focused on the available technologies for the treatment of LLW and ILW. A prerequisite was that the options must comply with the following: Waste must be treated and handled in accordance with current LLW conditions for acceptance (CFA) (Reference 3-17) and any future ILW repository CFA. UKP-GW-GL-790 90 Revision 4 3.0 Radioactive Waste Management Systems 3.5.5.1 UK AP1000 Environment Report ILW and LLW containers must meet RWMD’s recommendations on package design and the requirements of the RWMD Generic Waste Package Specification (Reference 3-18). Initial Option Screening Initially, an optioneering process was carried out to identify a set of radwaste treatment options (Reference 3-19). Initial screening of a range of options was undertaken with an aim of filtering out unworkable or unsuitable options at an early stage. The two criteria that were used for initial screening are listed below: Process/waste compatibility (a straightforward “Yes or No”). This assesses the suitability of the option for the treatment of the waste stream and the compatibility of the waste stream with the process. Technology availability in the UK (a scale from one to five). This criterion is essential, because an option that is not fully tested in the UK is unlikely to yield a licensable design solution within a time scale that is commensurate with the GDA submission. In this scoring scheme, 1 represents a completely novel technology with no full scale application and 5 represents a fully tried and tested, UK licensed, widely applied technology. A score of 3 would be a widely available, fully mature, but a non-UK example. The potential options were evaluated against their process/waste compatibility for each type of waste and also against technology availability for ILW or LLW. The options were given a colour code based on these attributes (see Table 3.5-4). Red options were eliminated from further optioneering process if they do not meet the requirements from this initial screening. Amber options which show some potential, but are not necessarily proven for radwaste, would only be considered further if fully acceptable (green) options were not available. The outcome of the option screening is shown in Table 3.5-5. The options that survived the initial screening were grouped into potential “complete solutions.” This was carried out for LLW and ILW. 3.5.5.2 Evaluation of Screened LLW Treatment Options The initial option screening exercise for LLW identified the potential complete solution processes shown in Figure 3.5-3 (Reference 3-16). The complete solutions comprise: 1. Sorting This allows segregation of waste according to its suitability on the downstream process. 2. Size Reduction Because the LLWs are a mixture of wastes, it is difficult to specify the best option at this stage of assessment. All of the size reduction options are of low cost technologies and are considered as potential approaches. UKP-GW-GL-790 91 Revision 4 3.0 Radioactive Waste Management Systems UK AP1000 Environment Report 3. Volume Reduction The option of “Incineration” is omitted from further consideration as it is expected that the adverse public perception of this technology will lead to delays in obtaining licensing. Although “Controlled Oxidation” addresses many of the “Incineration” issues, it has not yet been licensed in the UK. In principle, “Controlled Oxidation” presents benefits in reducing the volume of wastes, which in turn leads to higher cost savings. It is recommended that design proposals are flexible to accommodate technologies with better volume reduction such as “Controlled Oxidation” once these are fully developed and proven. This leaves the last option, “Compaction,” as the most suitable option. 4. Immobilisation Immobilisation increases transport weights and volumes requiring disposal and costs more in terms of fuel consumption. As immobilisation is not a required approach of the Condition for Acceptance (Reference 3-17) for the LLW repository, the selected option is “No Immobilisation.” 3.5.5.3 Evaluation of Screened ILW Organic Resin Treatment Options The potential complete solutions that passed screening for ILW organic resin are shown in Figure 3.5-4 (Reference 3-16). To evaluate these options further, a scoring workshop was held on 4th June 2008 with 21 attendees from Aker Solutions, DBD, WEC, Rolls Royce, Vattenfall, RWE, Ulecia Endessa, and Iberdrola. Table 3.5-6 shows the set of agreed criteria for the scoring process which included the technical, safety, environmental, and economic aspects. Each criterion was also given a weighting factor which characterised the relative importance of the issue to the workshop attendees. The scoring was applied to the available options for the treatment of ILW organic resins (Reference 3-16). The results are shown in Table 3.5-7. 1. Dewatering Stage Table 3.5-7 shows that no dewatering had the highest total weighted score, but also had the lowest primary waste score. The second highest score was for settling/decanting. Once the consideration was given to the need for dewatering to lower the volume of wastes before undergoing encapsulation, settling/decanting proved to be the most sensible option and was selected for the dewatering stage. 2. Volume Reduction Stage Table 3.5-7 shows that no compaction has the highest total weighted score for volume reduction. Compaction leads to higher cost and introduces additional safety hazards and operability issues. Hence, the option of “No Compaction” is selected. 3. Passivation Stage Both the solutions of “Controlled Oxidation” and “Wet Oxidation” are similar in terms of overall benefit, but “Controlled Oxidation” is expected to cost more. Although they both can offer benefits in waste reduction, their proven availability is not expected to fall within the GDA submission stage. Hence, “No Passivation,” which received the highest total weighted score in Table 3.5-7, is the selected option. UKP-GW-GL-790 92 Revision 4 3.0 Radioactive Waste Management Systems UK AP1000 Environment Report 4. Immobilisation In Table 3.5-7 the option of vitrification is eliminated as it emerges as the most costly and least beneficial option with the lowest total weighted score. Vitrification is also not a well-developed and matured technology, and is not expected to meet the timeline for the GDA submission stage. The other two options are cement encapsulation, which has the highest score, and polymer encapsulation, which has the second highest score. Cement encapsulation has the following advantages (Reference 3-17): 3.5.5.4 This technology is widely used internationally and is well known as a practical and economic approach. Radwastes are transported safely. Meets requirements of the Nirex/RWMD Generic Waste Package Specification (Reference 3-17). This technique has very high reliability of physical containment. The estimated life span is believed to be more than 1000 years. It also allows 97 percent of radionuclides to decay in-situ. The porous structure of the cement in this technology enables gas generated from anaerobic conditions and microbial degradation to be emitted from waste packages. This helps in de-pressurisation of the system. High pH conditions provided by cement which generates (OH-) ions will create a barrier against solubility. Soluble radionuclides present in wastes will react with high pH water to form oxides or hydroxides which are insoluble. Hence, migration or transport of radionuclides is reduced. Cost/Benefit Analysis of ILW Organic Resin Radwaste Treatment Further analysis on capital cost has been carried out to determine the feasibility of the “complete” solution (Reference 3-16). Figure 3.5-5 shows that simple encapsulation options require the lowest capital cost compared to wet oxidation and controlled oxidation. Over the lifetime of disposal, the costs of disposal outweigh the capital costs of waste treatment equipment. Figure 3.5-6 shows that vitrification, wet oxidation, and controlled oxidation become more cost-effective when the predicted lifetime disposal costs are taken into consideration. This is because these technologies result in volume reduction rather than the volume increase associated with encapsulation. However, the necessary development of these technologies is unlikely to happen before the GDA process is complete, but could occur in the future. Therefore, the final selections for the ILW resins (organic) radwaste system are settling/decanting followed by cement encapsulation. It is proposed to use mobile encapsulation facilities on site. This brings the benefit of enabling future technology updates to be integrated into the immobilisation system if a plant operator decides to investigate future technologies. Mobile encapsulation facilities also enable the system to be moved to other locations, increasing its potential for utilisation. 3.5.5.5 Evaluation of Screened ILW Filter Treatment Options The potential complete solutions for ILW filter treatment are shown in Figures 3.5-7 (Reference 3-16). UKP-GW-GL-790 93 Revision 4 3.0 Radioactive Waste Management Systems UK AP1000 Environment Report The complete solutions for ILW filter treatment comprise: 1. Size Reduction and Volume Reduction It was preferred that the treatment options for ILW filters be similar to the ILW organic resin treatment options. This is due to the low amount of wastes in this category and the capital and maintenance cost benefit associated with using common equipment. This led to the conclusion that neither size nor volume reduction are needed because the filters can be accommodated within the disposal package without size reduction. 2. Immobilisation There are no issues with the choice of immobilisation by cement encapsulation and it has the advantage of being the same process proposed for ILW organic resins. 3.5.5.6 BAT ILW and LLW Radwaste Conclusion Figure 3.5-8 summarises the ILW and LLW radwaste treatment options that are selected following the BAT exercise. For LLW radwaste, the treatment process is based on sorting, sizing (e.g., cutting, shredding and crushing), and compaction. For ILW radwaste comprising organic resins, the case for dewatering by decantation/settling is strongly argued because of major savings in terms of waste disposal volumes, environmental impact, and cost. Cement encapsulation provides a currently available, simple, well understood technology that complies with current transportation and waste repository requirements. There are grounds to state that waste disposal volumes and cost may be reduced through the technology development of vitrification or oxidation. However, the development of these technologies is unlikely to happen before the submission of the GDA. Hence the final selections for ILW resins (organic) radwaste system are the settling/decanting followed by cement encapsulation. ILW filters will also be treated by cement encapsulation. The use of mobile systems for the processing functions permits the use of the latest technology and avoids the equipment obsolescence problems experienced with installed radwaste processing equipment. The most appropriate and efficient systems may be used as they become available. 3.5.5.7 Comparison with Existing Practices 1. Sizewell B British Energy Generation Limited (BEGL) carried out a review of the control and impact of the discharge and disposal of radwaste at Sizewell B in 2005 (Reference 3-20). The review was prepared as a submission of information to the EA to enable their review of Radioactive Substances Act 1993 authorisations. In 2006, the EA published their decision document and authorisations regarding future regulation of disposals of radwaste at UK nuclear power stations (Reference 3-21). This review commented on the best practicable environmental option (BPEO) and BPM proposed by British Energy for the control of radwastes from Sizewell B. Table 3.5-8 presents the BPEO issues identified for solid wastes at Sizewell B and compares them with the practices proposed for the AP1000 NPP. The table also provides a summary of the EA comments on the Sizewell B BPEO issues. UKP-GW-GL-790 94 Revision 4 3.0 Radioactive Waste Management Systems UK AP1000 Environment Report In general, the proposed AP1000 NPP practice is consistent with practices that were identified as BPEO at Sizewell B. The exception is where on-site incineration was proposed as BPEO. This proposal was not accepted by the EA. The AP1000 NPP generic design does not have an on-site incinerator. 2. European Practices The practices at various nuclear facilities within Europe were identified with cooperation of various utilities that participated in the BAT workshop including E.ON, RWE, Endesa, Iberdrola, Suez, and Vattenfall. Table 3.5-9 identifies how LLW and ILW solid waste is handled at several European NPPs. More details of the European practices can be found in utility presentations attached in Appendix A of UKP-GW-GL-026, “AP1000 Nuclear Power Plant BAT Assessment” (Reference 3-22). The examples presented show that the Spanish and Swedish practices for ILW follow a similar cementitious encapsulation approach to that proposed for ILW in subsection 3.5.5.6. The use of polymeric resin encapsulation is more common in France. The German approach of in-package drying of resin followed by storage does not produce a product that complies with current RWMD compliant waste packages (Reference 3-18). However, the approach does have benefits in reducing total waste volumes and allowing recovery of the dehydrated resin, if required. The resin compaction technique employed at Tihange, Belgium also produces smaller waste volumes than cement encapsulation, but the compacted product does not conform to UK CFA without further conditioning. The comparison shows a number of different practices for the disposal of ILW in European countries. The cementitious encapsulation option proposed for the ILW generated by the AP1000 NPP is practiced elsewhere in Europe and is consistent with current UK CFA. 3.5.6 BAT – HLW Spent fuel created by nuclear power stations may either be disposed of or recycled by reprocessing to separate out the useful uranium and plutonium. Reprocessing of spent fuel has a number of advantages in that it maximises the recovery of the energy from the fuel, can improve energy security by providing a source of fresh fuel, and reduces the amount of HLW. However, there are a number of disadvantages including production of separated plutonium, which requires long-term storage, production of other waste streams, production of regulated effluent discharges, and the requirement to transport spent fuel and other nuclear materials. The Government has concluded that, in the absence of any proposals from the industry, that any new nuclear power stations that might be built in the UK should proceed on the basis that spent fuel will not be reprocessed and that plans for, and financing of, waste management should proceed on this basis (Reference 1-2). Consistent with this approach, there is no intention to reprocess spent fuel from the AP1000 NPP. It is planned that the operators will safely store this fuel at their reactor sites until a permanent disposal repository for spent nuclear fuel is built. This allows flexibility by allowing the decision to reprocess or permanently dispose of the HLW to be deferred and reassessed when the options become clear in the future. After spent fuel is removed from the reactor, it will be stored in the fuel storage pool (see subsection 3.5.7.3). The spent fuel pool has a capacity for 18 years of storage, which UKP-GW-GL-790 95 Revision 4 3.0 Radioactive Waste Management Systems UK AP1000 Environment Report provides adequate time for the proposals set out below to be reviewed and amended, according to conditions prevailing at the time a decision is required. A facility for the storage of spent fuel for the operational period of the plant and beyond is being designed, because spent fuel is not expected to be reprocessed. The key BAT decisions for the spent fuel storage facility is whether to store the fuel wet or dry and whether to store the fuel above or below ground. Fuel transfers and early storage are all carried out underwater; however, for long term storage of the fuel in canisters, it is preferred to store fuel under an inert gas atmosphere to minimize the corrosion issues associated with long term wet storage. Underground dry storage has the advantage of providing greater levels of shielding and providing a more secure solution with respect to aircraft impact and other catastrophic events. The disadvantages of underground storage relate to control of groundwater issues and flood risk. However, these issues can be overcome by careful design of the storage system and evaluation of site-specific issues at the site-specific design stage. For the generic site application, Westinghouse is proposing a dry spent fuel storage system to be stored inside an underground cylindrical cavity (see Holtec system in subsection 3.5.8.3). 3.5.7 Waste Treatment The waste treatment methods for the generic site design are based on the waste minimization and BAT assessment techniques described in Sections 3.5.4 to 3.5.6. 3.5.7.1 Low Level Waste Incoming wastes from other radiation/contamination controlled areas will be brought into the facility and temporarily stored in a buffer/marshalling area within the radwaste building (see Figure 3.5-9). The wastes will then be sorted under controlled conditions (e.g., glove boxes). This sorting process is necessary to segregate the LLW into the three different components required by Low Level Waste Repository (LLWR) (Reference 3-23): Metals – Type S1 Combustibles – Type S2 VLLW – Type S3 This segregation is performed to ensure that no unnecessary waste is disposed of in the LLWR. Contaminated material arising from equipment replacement parts, tools, and other metallic, plastic, or cloth parts from outage operations would normally be classified as LLW. However, in the event that they were initially classified as ILW, the AP1000 NPP includes provisions for the decontamination of these types of materials to a LLW category, if feasible. Within the radwaste building the segregated waste is dispatched to one of a number of possible treatments including: On-site: Decontamination UKP-GW-GL-790 96 Revision 4 3.0 Radioactive Waste Management Systems Cutting/shredding Compacting Immobilisation (if justified) UK AP1000 Environment Report Off-site: Reconditioning and re-use (e.g., personal protective equipment) Incineration (e.g., oil) Wherever possible, waste items will be decontaminated to the extent that allows free release and handling as conventional waste. Compactable items will be sorted and compacted in drum to reduce packed volumes. Non-compactable items will be cut into pieces to allow packing into drums. Full drums will be assayed with a Low Resolution Gamma Spectroscope (LRGS) and placed into HHISO containers and when full, HHISO containers can be stored on site in the LLW buffer store prior to shipment to the national LLW repository. The treatment route for LLW is shown schematically in Figure 3.5-10. A preliminary safety statement (Reference 3-24) and hazard study (Reference 3-25) have been completed for the operations being carried out in the radwaste building. Under normal circumstance, CPS resins are not radioactive and will be sent to licensed incineration facilities for disposal. However, under abnormal conditions, for example, steam generator tube failure, there may be a transfer of primary circuit activity into the secondary circuit. The amount of activity transferred will be very small and the activity of the CPS resin will not exceed the limits for LLW. Incineration will remain the disposal route so long as the activity of the CPS resin is within the CFA for the incineration facility. There may be situations when the activity of the CPS resin exceeds the CFA for incineration (although still LLW) and in these cases, the resin will be encapsulated into a compliant container, e.g., 220l drum, using mobile plant and equipment operated by specialist sub-contractors. The encapsulated packages are then placed into HHISO containers and are ultimately disposed of at the national LLW repository. The disposal route for CPS resin is shown schematically in Figure 3.5-11. Waste oil will normally be non-radioactive. However, in the event of the oil becoming contaminated with radioactivity, it will be shipped to a suitable incinerator (e.g., the Tradebe Incinerator at Fawley) for incineration. Westinghouse have carried out a review of this contaminated oil against the conditions of acceptance of this incinerator and have shown that they can be met. Any waste oil that exceeds the radioactivity acceptance thresholds of the incinerator will be solidified by a mobile plant prior to disposal to the LLWR (see Figure 3.5-12). The only large solid radwaste item that could be generated during the operation period of the AP1000 NPP is the steam generators. It is expected that the steam generators will be radioactive but with an activity level that will fall into the LLW category. It is intended that these items are handled as they arise, are size-reduced, and are decontaminated to the extent practicable. To facilitate this disposal route, a temporary facility will be erected, for example, a tent with mobile HVAC equipment and connections to AP1000 NPP power, water, and air systems, as necessary. The area currently allocated for temporary waste handling facilities for the GDA site is identified as Item 33 in Figure 2.3-2. Decontaminated pieces that are no UKP-GW-GL-790 97 Revision 4 3.0 Radioactive Waste Management Systems UK AP1000 Environment Report longer radioactive will be released to conventional waste handling facilities for recycle or disposal. Decontaminated pieces that remain radioactive will be wrapped before placement into HHISO containers and sent for disposal at the LLWR. The reactor pressure vessel head is only likely to be removed during decommissioning (see Section 3.5.10). However, if it needed to be replaced during the operating lifetime, it would be treated in a similar manner to steam generators. 3.5.7.2 Intermediate Level Waste ILW will be treated and disposed according to the schematic in Figure 3.5-13. Further details can be found in Reference 3-3. ILW will be segregated on an AP1000 NPP site in the following ways: Ion exchange and spent activated carbon activity is monitored, and once the activity breakthrough level has been reached the material is transferred to spent resin tanks. Only ILW resins and activated carbon will be sent to spent resin tanks. Replacement filter cartridges will be tested for activity and any ILW filters will be placed in an RWMD approved box. This segregation is an operationally-controlled procedure which will occur in the auxiliary building. The spent ion exchange resin, or activated carbon, will be made passively safe by being immobilised in a cementitious grout formulation within an RWMD approved drum (Reference 3-18). The spent filters will be immobilised in a cementitious grout formulation within an RWMD approved box (Reference 3-3). The waste encapsulation will be carried out using a Mobile Encapsulation Facility on a campaign basis (see Figure 3.5-14). The Encapsulation Facility will be stored in the radwaste building when not in use and moved to the AP1000 NPP Auxiliary Building Railcar Bay for the campaign. Locating the mobile cement encapsulation plant within the auxiliary building allows the necessary extraction systems to be connected to the VAS which vents via the monitored Plant Vent. The encapsulation will take place by remote operation at three stations within the shielded Encapsulation Facility: Station 1 – Lidding and unlidding Station 2 – Grout capping /Curing/QA Station 3 – Fill/Grouting/Mixing The spent ion exchange resin or activated carbon will be pumped to the fill station from the spent resin storage tank where it will be mixed with cementitious grout. Any water that is decanted from the ion exchange resins will be returned to the ion exchange resin tanks. The grout formulation recipe will be determined during formulation trials. These trials will take into account the operational experience of similar plants close to the required date to ensure that a BAT solution is achieved and an approved and accepted formulation is used. The materials most commonly used to encapsulate UK ILW are hydraulic blends of Ordinary Portland Cement, with either Blast Furnace Slag or Pulverised Fuel Ash. The trials will confirm the optimum volume of ion exchange resin to minimise the number of waste packages, while maintaining the long term structural integrity of the waste package. It is UKP-GW-GL-790 98 Revision 4 3.0 Radioactive Waste Management Systems UK AP1000 Environment Report assumed that the RWMD package will contain 25 volume percent resin for the purpose of calculating the ILW waste volumes for storage. Once mixed, the stabilised waste will be allowed to cure and the RWMD containers will be subject to quality checks including: the Dartometer test to confirm the cement has set external swabbing to confirm that the waste package is free from contamination activity monitoring using a High Resolution Gamma Spectroscope (HRGS) to produce a “fingerprint” of the activity concentrations within the waste packages The RWMD containers are moved to and from the Mobile Encapsulation Facility by a self-propelled trailer and between stations of the Encapulation Facility by a conveyor. Once the cement has cured and the containers have passed QA checks, they will then be transported to the ILW storage building. The final specification for the processing plant including the grout mix and operating procedures will be prepared no later than during the first cycle of operation. The encapsulation plant will be operational prior to the second plant outage as it may be decided by the operator to move resins from the resin tanks before the second outage. Thus, revised estimates of resin activity will be prepared during Cycle 1 based on early operational experience. 3.5.7.3 High Level Waste HLW waste will be managed and disposed according to the schematic in Figure 3.5.15. The spent fuel assemblies are initially stored in the spent fuel cooling pond to allow radioactive decay to occur and decay heat to be removed (see Section 9.1.2 of the European DCD, Reference 1-1). The cooling pond, containing borated water as a neutron absorber, is located in the auxiliary building. The spent fuel assemblies are held in high density racks that contain integral neutron absorbing material, and are designed to ensure adequate spacing to ensure the appropriate degree of subcriticality is achieved. The spent fuel pool racks can hold 889 fuel assemblies which equates to approximately 18 years of spent fuel. The spent fuel pool cooling system is provided to remove decay heat which is generated by stored fuel assemblies from the water in the spent fuel pool. This is done by pumping the high temperature water from within the fuel pool through a heat exchanger, and then returning the water to the pool. The spent fuel pool is equipped with a purification system which removes radioactive corrosion products, fission product ions, and dust to maintain low spent fuel pool activity levels during plant operation and to maintain water clarity during all modes. Two mixed bed type demineralisers are provided to maintain spent fuel pool purity, each one sized to accept the maximum purification flow from its respective cooling train. Downstream of the demineraliser in the purification branch lines, a spent fuel pool filter is provided to collect small particles and resin fines. UKP-GW-GL-790 99 Revision 4 3.0 Radioactive Waste Management Systems UK AP1000 Environment Report After the spent fuel has been stored to allow sufficient cooling, it will be transferred to dry cask storage. 3.5.8 Interim Storage 3.5.8.1 Low Level Waste Storage There are a number of storage areas within the Radwaste Building, as shown in Figure 3.5-9. The ‘Waste Accumulation Room’ (room #50351) has a buffer/marshalling area in the NorthEast corner, used to store incoming LLW packages and bags. The ‘Mobile Systems Facility’ (room #50350), has areas on the North and South walls used to store clean, empty RWMD 3m3 drums and boxes, SCVs and 200l drums. The maximum storage capacity of these areas are: 10 off 3m3 packages (5 stacks of 2 high, mixture of boxes and drums) 2 off SCV (1 stack of 2) 27.3m3 for 200l drums (7m L x 1m W x 3.9m H) 89.6m3 for incoming LLW (8m L x 4m W x 2.8m H) The buffer/marshalling area can also be used to store higher activity LLW, rejected from the LLW treatment processes. The waste will be stored for a temporary period, until: The activity decays to a level that allows handling with the installed equipment It is determined that the waste should be handled and treated as ILW The LLW buffer store is a covered area comprising a concrete hard standing area with a steelframed canopy. The buffer store is designed for HHISO containers that have been filled in the radwaste building. Standard handling machinery (fork truck) will be used to move the containers from the radwaste building to the buffer store. The radwaste building will only store the HHISO containers currently being filled. All filled HHISO containers will be transported to the buffer store that provides storage for two years of waste arisings (Reference 3-3): 3.5.8.2 Intermediate Level Waste Storage ILW (spent filters, spent ion exchange resin, and activated carbon) is stored within suitably contamination zoned and shielded areas within the auxiliary building prior to treatment in the mobile encapsulation plant. Once the ILW is encapsulated in RWMD waste packages (3 m3 boxes and 3 m3 drums), the boxes and drums will be transported to an on-site ILW store where they will be stored until a national ILW repository becomes available. It is estimated that between 15 and 29 of these RWMD waste packages will be produced each year (Reference 3-26). A total of 1116 RWMD waste packages is predicted for the 60-year plant life (Reference 3-26). The ILW store proposed for the generic site is a reinforced concrete structure with 1m thick walls that can be extended at appropriate intervals to suit new ILW waste arisings (see Figure 3.5-16). The ILW store incorporates a receipt area with waste package assay equipment and a shielded vault serviced by a certified nuclear crane. Office and administration space, and an equipment room housing HVAC and electrical and mechanical equipment are provided in an annex to the main store building. UKP-GW-GL-790 100 Revision 4 3.0 Radioactive Waste Management Systems UK AP1000 Environment Report The packages will be transferred into the receipt area via a shielded door and then transported by the crane to a position in the store vault determined using the tag information. The package position will be recorded in the control log for ease of future retrieval. The packages will be placed in the store layer by layer, to limit the potential topple height of stored packages. The layers will be constructed from the furthest point of the store working back to the receipt area. The chosen transfer path for placing/retrieving a package will be such to minimise the effective drop height. The store design and operation will be such to enable retrieval and visual examination of individual packages. Close circuit television (CCTV) within the import/inspection area will be used to facilitate this. The first phase of construction will provide an ILW store suitable for 20 years of ILW production (372 No. x 3 m3 RWMD packages). Extensions to the store will be sized to suit future waste arisings and are expected to be added in 20-year increments. The ILW store will be designed for a total inventory of 60 years of operational waste arisings from one AP1000 NPP unit. The ILW store has a 100-year design life and could be used to retain ILW after AP1000 NPP is decommissioned and until the national ILW repository becomes available (Reference 3-3). Every ILW waste package will be “finger printed” using an HRGS within the ILW store to monitor its activity level before it is transferred to the ILW Store Vault. Waste package inventory records will be completed according to the required regulations to maintain an inventory record of each waste package and its location within the ILW Store Vault. Because all waste packages sent to the store will be ILW and are expected to remain ILW, no segregation will be required within the store vault. It is envisaged that when an ILW waste repository becomes available within the UK, the ILW waste packages will be removed from the store and monitored again with the HRGS before being sent to the repository along with its associated waste package inventory record. The same facilities used during placement of the ILW packages into the store will be used to ship the ILW packages, that is, the area at one end of the store building and the store building crane. If the HRGS result of a package indicates the radionuclides in the package have decayed such that the package could be LLW, the package will be temporarily placed in an LLW storage area. The LLW disposal facility will be contacted to ensure the appropriate records are prepared for LLW disposal at that time. All ILW packages will be visually inspected during handling and, if defects or external damage is found, the package will be flagged as “rogue” and placed/sealed within a secondary containment vessel (SCV) prior to storage. A “rogue” package might arise from: Overfill of a package during encapsulation, causing spillage and contamination to the outer surface. Malfunction during lidding, causing an unsealed package. Corrosion/damage to the package, resulting in a containment failure. Any “rogue” package will be transferred to a SCV. The SCV is a container of similar design to the RWMD packages that is sized to fit over the RWMD 3 m3 box/drum. If an ILW package is found to be “rogue” as a result of QA inspections, it will be inserted into an SCV, lidded, and positioned in the store as normal. A small batch of empty SCVs will be stored within the radwaste building until required. UKP-GW-GL-790 101 Revision 4 3.0 Radioactive Waste Management Systems 3.5.8.3 UK AP1000 Environment Report High Level Waste Storage The spent fuel system proposed for the generic site is a dry storage system and comprises: flask loading equipment within the AP1000 NPP. suitable flask transportation vehicles and equipment. a seismically qualified below ground storage facility. The flask handling equipment within the AP1000 NPP can accommodate a variety of flask types. Westinghouse is offering Holtec International’s underground dry spent fuel dry storage system, the HI-STORM 100U System (see Figure 3.5-17), as an option for dry spent fuel storage management (References 3-27, 3-28, and 3-29). However, the spent fuel pool within the AP1000 NPP provides sufficient capacity for up to 18 years of storage. This allows the AP1000 NPP operator time to select other options for the spent fuel storage system or defer selection for a period to allow new techniques to be incorporated, if appropriate. The HI-STORM 100U System is a vertical, ventilated dry spent fuel storage system. Holtec and Westinghouse have confirmed that the Holtec equipment can fit in the areas of the AP1000 NPP that need to be traveled to transfer spent fuel from the spent fuel pool to the underground storage area. The system consists of three primary components: 1. HI-STORM 100U underground vertical ventilated module (VVM) The VVM provides for storage of a multi-purpose canister (MPC) in a vertical configuration inside a subterranean cylindrical cavity entirely below the top-of-grade (Figure 3.5-18a). The principal function of the VVM structure is to provide the biological shield and cooling facility. The MPC storage cavity is defined by the cavity enclosure container (CEC), consisting of the container shell integrally welded to the bottom plate. In the installed configuration, the CEC is interfaced with the surrounding subgrade for most of its height except for the top region where it is girdled by the top surface pad. The CEC is a closed bottom, open top, thick-walled cylindrical vessel, which has no penetrations or openings. Thus, groundwater has no path for intrusion into the interior space of the MPC storage cavity. Corrosion mitigation measures commensurate with site-specific conditions are implemented on below-grade external surfaces of the CEC. All external and internal surfaces of the VVM are coated with an appropriate surface preservative. An optional concrete encasement around the coated external surface of the CEC may be added to control the pH at the CEC-to-subgrade interface. A corrosion allowance equal to 3 mm (1/8 in) on the external surfaces of the VVM in contact with the subgrade is nevertheless assumed in the structural evaluations. The closure lid is a steel structure filled with shielding concrete and incorporates a specially designed air ventilation system (see Figure 3.5-18b). 2. MPC, which each contain 32 spent fuel assemblies The MPC and HI-TRAC in the HI-STORM 100U System are 100 percent identical to those in the Holtec aboveground system that has been in use for several years. UKP-GW-GL-790 102 Revision 4 3.0 Radioactive Waste Management Systems UK AP1000 Environment Report The MPC is a single package equally suitable for onsite storage, transport, and permanent disposal in a future repository. The MPC is constructed entirely of stainless steel alloy materials with the exception of the Metamic, a fixed neutron absorber, which is contained within the canister for criticality control. The fuel assembly basket contained within the MPC is a honeycomb multi-flanged plate weldment that forms the square fuel cells in the basket. There is complete edge-to-edge continuity between the continuous cells that provides an uninterrupted heat transmission path, making the MPC an effective heat rejection device. The top end of the Holtec MPC uses a closure system that includes a lid equipped with vent and drain ports used to remove air and water and backfill the canister with inert gas [helium] (see Figure 3.5-17f) and a closure ring used to provide a redundant confinement boundary for the MPC lid. The vent and drain ports are covered, helium leak checked, and seal-welded before installing the closure ring. The closure ring is a circular ring that is edge welded to the canister outer shell and lid (see Figure 3.5-17g). The MPC lid provides sufficient structural capability to permit the loaded MPC to be lifted by threaded holes in the MPC lid. The heat from the fuel stored in the core region of the basket is removed by the thermosiphon (circulatory) action (Figure 3.5-18c). As a result, high heat rate fuel (gamma radiation emitted is proportional to the heat emission rate from the fuel) can be placed in the core region, surrounded by the cooler (and older) fuel in the periphery. This approach, known as “regionalized” storage, is extremely effective in mitigating the dose emitted from a basket in the lateral direction. The effectiveness of regionalized storage in reducing dose derives from the fact that almost 95 percent of the dose from the basket comes from the peripheral fuel; the inner region fuel is almost entirely noncontributory to the dose. 3. HI-TRAC transfer cask, which holds the MPC during loading operations HI-TRAC is the acronym for Holtec International transfer cask or “shuttle cask” for HI-STORM 100U. HI-TRAC is a slim cylindrical cask with removable bottom and top lids. HI-TRAC can be mounted on top of a HI-STORM 100U overpack to deliver or retrieve an MPC (see Figures 3.5-17i and 3.5-17k). HI-TRAC is a heavy-walled steel and lead cylinder with a water jacket attached to the exterior of the vessel. The main structural function of HI-TRAC is provided by carbon steel. Water and lead provide the main neutron and gamma shielding functions, respectively. A total of 97 MPCs will be filled over the 60-year plant life of the plant containing 3104 fuel assemblies (Reference 3-26). The spent fuel will remain within the HLW store for a determined period of time to enable the heat generating capacity of the spent fuel assemblies to reduce enough to meet the required standards for the national Geological Disposal Facility (GDF). At the proposed high burn-up rates, RWMD has estimated that dry cask storage for up to 100 years may be necessary in order to allow it to cool sufficiently to be transferred to an approved RWMD disposal canister for final disposal. However, Westinghouse expects the repository design may be reconsidered on the basis of current world-wide expectations from spent fuel characteristics which would allow for shorter dry cask storage periods. UKP-GW-GL-790 103 Revision 4 3.0 Radioactive Waste Management Systems 3.5.9 Transportation and Disposal 3.5.9.1 Low Level Waste UK AP1000 Environment Report LLW is bagged, collected manually, and transported to areas of the waste accumulation room. The waste is packaged in HHISO containers. A fork truck specifically designed for container handling will be used to move the HHISO containers from the radwaste building to the buffer store. HHISO containers will be handled within the radwaste building by the overhead crane. The HHISO container will be transported by road to the LLWR at Drigg for final disposal. A preliminary application has been made to LLWR to confirm their acceptance of LLW from an AP1000 NPP. The Acceptance in Principle (D1) forms obtained from the LLWR are presented in Reference 3-30 and contain activity estimates based on calculations from Reference 3-31. 636 HHISOs are predicted to be produced over the 60-year plant life (Reference 3-26). 3.5.9.2 Intermediate Level Waste During transport to the ILW store, the waste package (drum or box) will be placed in an overpack which will provide shielding in order to limit exposure to operators or the public. A self-propelled trailer will be used to move the waste packages to the ILW store along designated routes. Inside the ILW store, the packages will be placed and recovered using an overhead crane (see Figure 3.5-16). Shipment from the ILW store will only take place once a national repository is available. 1116 RWMD waste packages are predicted to be produced over the 60-year plant life (Reference 3-26). 3.5.9.3 High Level Waste Figure 3.5-19 shows a schematic of the process for the transportation and disposal of HLW. HLW packages will be transported from the spent fuel cooling pond in their dry cask storage Holtec MPC canister to the HLW store using an appropriate transport vehicle. Two types of transport vehicle are proposed for the Holtec system: a low profile transporter and the HI-TRAC system (see Figures 3.5-17h and 3.5-17i, respectively). The Holtec MPC is one option that can be used for the interim storage, transport, and final disposal of the AP1000 NPP spent nuclear fuel. There are various other systems under development which could also be used for the interim storage, transport, and/or disposal. It may also be possible to place the AP1000 NPP spent fuel directly into a RWMC disposal canister, once removed from the cooling pond, if the canister is designed for such a purpose. Once the spent fuel assemblies have reached the acceptable limits for heat generation (typically 100 years) they will be transported from their dry cask storage to the national GDF once it is available. During transport, each waste package will be placed in an overpack to provide radiation shielding and also to ensure the integrity of the waste during a road accident. The total weight of the waste package will be within appropriate limits for transport on UK roads when necessary. It is envisaged that transport of packaged spent fuel would be undertaken using a Disposal Canister Transport Container. This is an RWMD transport container concept that provides two layers of shielding (Reference 3-12): UKP-GW-GL-790 104 Revision 4 3.0 Radioactive Waste Management Systems UK AP1000 Environment Report adjacent to the canister, a stainless steel gamma shield with a radial thickness of 140 mm and 50 mm at each end of the canister, surrounding the gamma shield, a 50 mm thick neutron shield made of high neutron capture material “Kobesh.” At present, there is no operator for the national GDF and the NDA RWMD is acting as a “repository Licensee surrogate,” providing input to government strategy for ILW and HLW management. The repository will need to be available for spent fuel at the end of operating life after the required cooling period. The NDA have completed a disposability assessment of AP1000 NPP spent fuel to satisfy the requirements of the GDA (Reference 3-12). This assessment assumed that spent fuel would be overpacked for disposal. Under this concept, spent fuel would be sealed inside durable, corrosion-resistant disposal canisters manufactured from suitable materials, which would provide long-term containment for the radionuclide inventory. The exact long-term disposal canister material and design remains to be confirmed, but candidates include copper or steel canisters with an additional cast-iron insert to provide additional mechanical strength. The current RWMD disposal canisters do not allow ILW rod cluster control assemblies and certain other core components (e.g. burnable poisons and thimble plugs) to be included in the canisters. Westinghouse asked RWMD to consider the option of disposing these within the spent fuel assemblies as practiced elsewhere in the world to minimise handling and to avoid production of orphan wastes. Depending upon the features of the selected disposal canisters, it may be necessary to encapsulate AP1000 NPP spent fuel in the preferred canister. The particular details of any required encapsulation plant are not fully determined due to uncertainties in the GDF requirements. However, developed processes exist in other countries, for example: In Germany, a pilot encapsulation plant has been operating successfully reapiring defective spent fuel casks for over 10 years (Reference 3-32). In this process, the spent fuel is removed from the CASTOR® cask used for interim storage and encapsulated in a Pollux® cask which is also used as the final repository cask. The plant has operated safely for a number of years and has successfully encapsulated spent fuel and the risks associated with these operations, and the required technologies are well understood. In Sweden, the disposal method determined is to encapsulate the spent fuel in copper canisters and embed the filled canisters within bentonite clay at a depth of 500 metres in the crystalline bedrock of the GDF (Reference 3-33). This provides 3 separate environmental isolation barriers (canister, bentonite clay, and bedrock) for the spent fuel and prevents contamination from getting into groundwater. For the GDA, it is assumed that any HLW conditioning facility in the UK will use similar technologies taking advantage of the experience gained at facilities elsewhere in the world. It is expected that the repackaging of spent fuel will take place at a central location as outlined in the Nirex repository concept (Reference 3-34). The NDA disposability assessment (Reference 3-12) ultimately concluded that the characteristics of spent fuel from an AP1000 NPP (with 65 GWd/TU burn-up) are consistent with those from the Sizewell B PWR. When compared with legacy wastes, there are no new issues that challenge the fundamental disposability of the wastes expected to arise from operation of such a reactor. The additional repository storage space required to accommodate UKP-GW-GL-790 105 Revision 4 3.0 Radioactive Waste Management Systems UK AP1000 Environment Report spent fuel from the AP1000 NPP is not excessive, and is not significantly affected by a specific reactor or fuel design. 3.5.10 Decommissioning Waste The basic AP1000 NPP design principles minimise the creation of radwaste during operations and decommissioning. The AP1000 NPP was designed to have fewer valves, pipes, and other components so less waste will be generated during maintenance activities such as repair and replacement (see Figure 3.5-20). Also, less waste mass will be generated during decommissioning. As discussed in Chapter 20 of the DCD (Reference 1-1), the level of cobalt in reactor internal structures is limited to below 0.05 weight percent, and in primary and auxiliary materials to less than 0.2 weight percent. This limits the activation of the metal components. Surfaces, including steel wall and floor surfaces, will be sealed to prevent penetration and to facilitate decontamination. Also, during operation and maintenance, waste will be minimized by using best industry practices, for example, by limiting the amount of material brought into containment. More details on decontamination can be found in Ref. 3-40 and the decommissioning plan is described in more detail in Ref. 3-41. The wastes generated during decommissioning comprise the following: Small volume components The types of small volume components at decommissioning are shown in Appendix A4 and include various electrical equipment, filters, electrodeionisation units, and skids. These wastes are classified as LLW. Large volume components The quantities of ILW and LLW large volume component wastes generated during decommissioning are shown in Appendix A3 and summarised in Table 3.5-10. The waste includes the reactor head, which is not expected to require replacement during the operational period of the AP1000 NPP. It is assumed that the reactor vessel is disposed intact and the vessel is not decontaminated from its ILW classification. No benefit would be gained from decontaminating the reactor vessel since most of the dose would come from activation of vessel materials. Decontamination of the reactor systems could be accomplished with some piping modifications to bypass the reactor vessel, and the use of existing filter and demineraliser vessels. Waste from decontamination operations System decontamination operations produce ILW during the various system purification steps (e.g. spent resins and spent filter cartridges). Dry active waste The compactable dry active waste created during decommissioning operations (e.g. rags, overalls, gloves, and packaging) is LLW and is estimated to be 135m3 per year. This volume can be reduced five fold to 27m3 per year using a low force compactor. Assuming an accumulated decontamination operation of three years, the additional dry UKP-GW-GL-790 106 Revision 4 3.0 Radioactive Waste Management Systems UK AP1000 Environment Report active LLW generated during decommissioning would be 81m3 (see Table 3.5-10). The use of super compaction could reduce this number further. Demolition waste The radioactive demolition waste (rubble) is identified in Appendix A6. Only a very small fraction of demolished wastes is likely to be considered LLW, with the majority being non-radioactive or made non-radioactive during the decontamination process. The estimate of LLW demolition waste includes 2165m3 of concrete and 158m3 of steel (see Appendix A6). The LLW demolition waste includes wastes from the demolition of five modules within containment (CA01 to CA05). The only significant civil structure with the potential to become activated is CA-04. The other four major modules in containment (CA-01, CA02, CA-03, and CA-05) could become contaminated, but are unlikely to become activated. The modules are steel structures, some with concrete filled wall sections, which would be cut into transportable pieces with little volume increase. The modules are designed with exposed concrete and steel surface finishes that will prevent penetration and facilitate decontamination. The demolition waste also includes 199m3 of concrete surrounding module CA04 in the vicinity of the core. This represents a 1.5 m (5 ft) thickness of concrete around the reactor vessel cavity which may contain enough activation products to be treated as LLW. Beyond this thickness, the concrete is essentially VLLW (Reference 3-35). Since this is a solid chunk of concrete, the actual packaged LLW volume will be two to three times greater or about 400 to 600m3. The total ILW decommissioning waste associated with large volume components and waste from decontamination operations is estimated to be about 800m3. The total LLW waste associated with decommissioning large and small volume components, compactable dry active waste and demolition waste is estimated to be about 5500 - 6000 m3. A typical schematic for the treatment of decommissioning waste is shown in Figure 3.5-21. The management of decommissioning waste is being planned with the expectation that the LLW, ILW, and spent fuel waste streams will be capable of being disposed in NDA facilities. 3.5.11 Comparison of Waste Volumes from the AP1000 NPP and Other UK NPPs A comparison of the waste volumes generated by the AP1000 NPP and other UK NPPs is presented in Table 3.5-11. The data for other plants is extracted from the UK 2007 radioactive waste inventory (Reference 3-36). The data is normalized to the annual electricity production. 3.6 References 3-1 3-2 3-3 UKP-GW-GL-054, Rev. 1, “UK AP1000 Integrated Waste Strategy,” Westinghouse Electric Company LLC, 2011. ISBN 92-64-02146-9, “Effluent Release Options from Nuclear Installations,” Nuclear Energy Agency, 2003. UKP-GW-GL-027, Rev. 2, “UK AP1000 Radioactive Waste Arisings, Management and Disposal,” Westinghouse Electric Company LLC, 2011. UKP-GW-GL-790 107 Revision 4 3.0 Radioactive Waste Management Systems UK AP1000 Environment Report 3-4 NF0153/1, Issue 1, “Specification for Safe Change HEPA Filter Housings for Use in Building Ventilation Systems,” 2006. 3-5 AESS 30/95 100, “Filter Inserts for High Efficiency Particulate Air (HEPA) Circular Plug in 470 and 950 litres/second Capacities, 1990.” 3-6 APP-WLS-M3C-040, Rev. 0, “Expected Radioactive Effluents Associated with Advanced Plant Designs,” Westinghouse Electric Company LLC [Westinghouse Proprietary Class 2, Protect – Commercial]. 3-7 APP-WLS-M3C-049, Rev. 2, “Monthly Radiation Emissions from Radioactive Nuclides,” Westinghouse Electric Company LLC [Westinghouse Proprietary Class 2, Protect – Commercial]. 3-8 UKP-GW-GL-033, Rev. 2, “Assessment of Radioactive Discharges on Non-Human Species,” Westinghouse Electric Company LLC, 2011. 3-9 Environmental Risk Assessment Part 2, EPR H1, “Assessment of point source releases and cost-benefit analysis,” Environment Agency, 2008. 3-10 PARCOM Recommendation 91/4, “Implementation of PARCOM Recommendation 91/4 on Radioactive Discharges,” OSPAR Commission, 2003. 3-11 UKP-GW-GL-057, Rev. 0, “UK AP1000 NDA Data Sheet Submission,” Westinghouse Electric Company LLC, February 2010. 3-12 LL10568925 (also numbered UKP-GW-GL-012, Rev. 0), “Generic Design Assessment: Summary of Disposability Assessment for Wastes and Spent Fuel arising from Operation of the Westinghouse Advanced Passive Pressurised Water Reactor (AP1000),” Nuclear Decommissioning Authority, July 2009. 3-13 “Policy for the Long Term Management of Solid Low Level Radioactive Waste in the United Kingdom,” Department for Environment, Food and Rural Affairs, March 2007. 3-14 “Guidance: Disposing of Radioactive Waste to Landfill,” Environment Agency. 3-15 IAEA Safety Series No. 111-S-1, “Establishing a National System for Radioactive Waste Management,” International Atomic Energy Agency, Vienna, 1995. 3-16 UKP-GW-GL-039, Rev. 0, “Radwaste Treatment Westinghouse Electric Company LLC, June 2009. 3-17 Issue 01/08, “Conditions for Acceptance by LLW Repository Ltd of Radioactive Waste for Disposal at the Low Level Waste Repository (CFA),” LLW Repository Ltd, February 2008. 3-18 Nirex Report N/104, Generic Repository Studies, Volume 1, “Generic Waste Package Specification,” United Kingdom Nirex Limited, June 2005. 3-19 Nirex Report N/034, “Why a Cementitious Repository?” United Kingdom Nirex Limited, June 2001. UKP-GW-GL-790 108 Options Study Report,” Revision 4 3.0 Radioactive Waste Management Systems UK AP1000 Environment Report 3-20 Report No. SZB/THR/042, “Submission of information to the Environment Agency to enable review of Radioactive Substances Act 1993 Authorisations,” British Energy Generation Limited, July 2005. 3-21 “Decision Document and Authorisations for Future Regulation of Disposals of Radioactive Waste under the Radioactive Substances Act 1993 at British Energy Generation Limited’s Nuclear Sites: Dungeness B Power Station, Hartlepool Power Station, Heysham 1 Power Station, Heysham 2 Power Station, Hinkley Point B Power Station and Sizewell B Power Station,” Environment Agency, December 2006. 3-22 UKP-GW-GL-026, Rev. 2, “AP1000 Nuclear Power Plant BAT Assessment,” Westinghouse Electric Company LLC, 2011. 3-23 DI/TECH/2013. Issue 1, Low Level Waste Repository, “Guidance for consignors for the dispatch of segregated waste for treatment,” September 2009. 3-24 UKP-GW-GL-053, Rev. 1, “UK AP1000 Radwaste Preliminary Safety Statement,” Westinghouse Electric Company LLC, February 2010. 3-25 UKP-GW-GL-052, Rev. 1, “UK AP1000 Radwaste Process Hazard Study 1 Report (HAZOP),” Westinghouse Electric Company LLC, February 2010. 3-26 UKP-GW-GL-004, Rev. 1, “Process Mass Balance for AP1000 Solid Waste,” Westinghouse Electric Company LLC, April 2010. 3-27 Holtec Report No. HI-2084070, “General Overview of HI-STORM 100U SYSTEM,” Holtec International. 3-28 “HI-STORM 100 and HI-STAR 100, Holtec’s Systems for Storage and Transport of Spent Nuclear Fuel,” Holtec International, Marlton, NJ, USA. 3-29 “HI-STORM 100U General Loading Operations at the AP1000,” Holtec International. 3-30 UKP-GW-GL-058, Rev. 0, “UK AP1000 D1 Form Submission,” Westinghouse Electric Company LLC, March 2010. 3-31 UKP-GW-GL-003, Rev. 0, “Solid Waste Activity Calculation from AP1000,” Westinghouse Electric Company LLC, April 2010. 3-32 Graf R., W. Filbert, “Dispsoal of Spent Fue from German Nuclear Powr Plants – Paper Work or Technology?” TopSeal, Olkiluoto, Finland, September 2006. (R Graf, GNS MBH; W Filbert, DBE Technology GMBH, 2006.) 3-33 TR-06-21, “Initial state report for the safety assessment SR-Can,” SKB, October 2006. 3-34 502644, “Outline Design for a Reference Repository Concept for UK High Level Waste/Spent Fuel,” United Kingdom, Nirex Limited, September 2005. 3-35 BNFL-ES/ENRESA2/REP/010, “1000 MW Reference PWR Decommissioning Study,” BNFL. 3-36 3-Defra/RAS/08.003, NDA/RWMD/005, “UK 2007 Radioactive Waste Inventory. A Summary of Information for International Reporting,” 2008. UKP-GW-GL-790 109 Revision 4 3.0 Radioactive Waste Management Systems UK AP1000 Environment Report 3-37 APP-WLS-M3C-056, Rev. 1, “AP1000 Expected Production and Release Rates for 14C,” Westinghouse Electric Company LLC, September 2010 [Westinghouse Proprietary Class 2, Protect – Commercial]. 3-38 Andreas Roth, Baudouin Centner, Alain Lemmens, “Radioactive Spent Resins Conditioning By The Hot Super-Compaction Process,” Proceedings of the 11th International Conference on Environmental Remediation and Radioactive Waste Management ICEM2007, September 2-6, 2007, Bruges, Belgium. 3-39 Nuclear Industry Guidance, “An Aid to the Design of Ventilation of Radioactive Areas Issue 1,” NVF/DG001, January 2009. 3-40 UKP-GW-GL-084, Rev. 0, “Decontamination Considerations,” Westinghouse Electric Company LLC, March 2011. 3-41 UKP-GW-GL-795 Rev. 0, “UK AP1000 NPP Decommissioning Plan” Westinghouse Electric Company LLC, March 2011. 3-42 PPE-11-18, “17x17 RFA Overall Leakage Rate”, Westinghouse Electric Company, LLC, February 2011. UKP-GW-GL-790 110 Revision 4 Minimise treatment and conditioning necessary to safely store wastes Incinerate suitable LLW (oils, solvents and resins), cementitious encapsulation of ILW resin (without pre conditioning) Use of Low Waste Technology Minimise the generation of radioactive wastes from the nuclear facility Selection of materials, -Water chemistry improvements e.g. zinc addition for corrosion control, use of 7LiOH reduces 3H generation, Improved fuel performance and higher burnup, Reduction in the number of components, equipment, materials used to construct, Renovate & reuse where possible e.g., PPE/metal components, -Run primary filters and IX media to ILW to minimise waste volumes, use compactable materials for “disposable” components Radioactive wastes should be created in a manageable waste form ILW resins can be pumped (entrained in water), ILW and LLW will be processed and packaged to meet the CFA for the respective waste repositories and utilising RWMD compliant packages e.g. 3 m3 box/drum UKP-GW-GL-790 Table 3.1-1 UK AP1000 Environment Report Wastes should be capable of interim safe storage prior to final disposal in a repository ILW store will be constructed on site, all ILW waste packages produced are compatible with the store, associated equipment and the capability of the shielded vault, spent fuel will be packaged into suitable storage container for placement into the on-site spent fuel store. Minimise potential radioactive releases from credible accident conditions and their consequences for the environment Sealed containment and shield around reactor pressure vessel, catalytic hydrogen recombiners in the containment ventilation system, trisodium phosphatein baskets use of canned coolant pumps eliminates seal leaks and creation of waste, bunds, collection sumps are incorporated to locally retain leaks spills. Progressively reduce emissions Ongoing update of management procedures to ensure best industry practice, reassessment of BAT during plant upgrades to ensure incorporation of latest techniques 111 Condition and immobilise unstable waste forms into a passively safe state Structurally unstable ILW resins are immobilised in grout (robust mix determined from formulation trials) Reduce transboundary geographic displacement of environmental impacts ILW is collected, processed and stored on-site within the site boundary and with suitable shielding in ILW storage vault, spent fuel is stored on-site within the site boundary and with suitable shielding (fuel pond or on-site store) Optimise both radioactive and non-radioactive impacts to reduce the environmental footprint of the facility Use of canned coolant pumps eliminates seal leaks and creation of waste, Bunds, collection sumps are incorporated to locally retain leaks and spills, Reduced and simplified equipment inventory (less maintenance and decommissioning waste), Reduced building volumes (less decommissioning waste) Prioritise environment expenditure to maximise the amount of radioactive pollution avoided for each € invested IX resins are used to capture radionuclides from the soluble to the solid phase in a compact and energy efficient manner i.e. no evaporator used. Use of mechanical shims for reactivity control reducing boric acid use and associated liquid effluent due to reductions in primary circuit liquid volume changes. Progressively reduce worker doses from waste treatment and conditioning processes Reduction in waste volumes (including decommissioning) over previous designs so less time spent handling waste, suitable shielding and remote handling equipment are incorporated into the designs. Revision 4 Wastes should be capable of being stored in a monitorable and retrievable waste form ILW waste packages are RWMD compliant, ILW store incorporates handling equipment and package inspection bays allowing individual packages to be retrieved and monitored, proposed spent fuel store allows in-situ monitoring, all spent fuel canisters can be retrieved from the on-site store. Use of Less Hazardous Substances Radioactive waste should be created in a passively safe waste form Spent fuel stored in racks in the fuel pond at subcritical distances and incorporating neutron absorbing panels (Metamic), spent fuel packed into storage containers for placement in on-site store utilising passive systems for cooling and containment, storage canisters incorporate neutron absorbing materials, solid ILW is immobilised in grout (robust mix determined from formulation trials) Reduced Emissions Concentrate and contain environmentally persistent or bio accumulative emissions Use of filtration to capture airborne particulate emissions into solid phase, select materials that minimise the creation of persistent wastes, reduction in containment service penetrations, HEPA filter selection Efficient Use of Resources Improve the eco-efficiency of the nuclear facility (e.g., emissions/GWa) Best industry practise and adherence to IAEA guidelines minimising generation of waste, Reduced activated corrosions products, Reduced and simplified equipment inventories, Use of mechanical shims for reactivity control reduces liquid effluents and on site chemical inventory NUCLEAR BAT MANAGEMENT FACTORS AND AP1000 NPP FEATURES 3.0 Radioactive Waste Management Systems CVS shim bleed (gas) WGS UKP-GW-GL-790 RCDT drains Waste Description WGS System Table 3.3-1 UK AP1000 Environment Report LLW LLW Waste Level Hydrogen, nitrogen, and fission gases Hydrogen, nitrogen, and fission gases Physical/Chemical Description 45.7 0 cm3/min 112 0.002742 0 m3/h Normal Volume 81.6 1.05 cm3/min 0.004896 0.000063 m3/h Maximum Volume Estimated Quantities 50,904 1,170 ft3 Revision 4 33.14 m3 Volume for Life of Plant AP1000 NPP ESTIMATED OPERATIONAL GASEOUS RADWASTE ARISING FROM SYSTEM OPERATIONS 3.0 Radioactive Waste Management Systems 3.0 Radioactive Waste Management Systems UK AP1000 Environment Report Table 3.3-2 ABATEMENT PROVISIONS FOR HVAC SYSTEMS Area Ventilation System Area Classification [Ref 3-39] Ventilation Abatement Provisions Nuclear Island Nonradioactive VBS White No filtration Annex/Auxiliary Building Nonradioactive VXS White No filtration Diesel Generator Building VZS White No filtration Containment VCS N/A No discharge outside containment Containment VFS Amber high risk High efficiency and HEPA filtration Health Physics and Hot Machine Shop - Gloveboxes VHS Red HEPA filtration Health Physics and Hot Machine Shop – Machine tools VHS Amber high risk HEPA filtration Health Physics and Hot Machine Shop – Remaining space VHS Green Low risk No filtration but diversion to HEPA and charcoal filtered standby system (VFS) on High radiation signal* Radwaste Building VRS Amber high risk HEPA filtration* Turbine Building – Bay 1 area VTS Green Low risk No filtration Turbine Building – Remaining space VTS White No filtration Auxiliary/Annex Building Radiologically Controlled Area – Fuel handling area VAS Amber Low risk HEPA filtration* and diversion to HEPA and charcoal filtered standby system (VFS) on High radiation signal Auxiliary/Annex Building Radiologically Controlled Area – Remaining space VAS Amber Low risk No filtration but diversion to HEPA and charcoal filtered standby system (VFS) on High radiation signal Active Spent Fuel Pool Exhaust VAS Amber HEPA filtration Low risk Key to Area Classification [Ref. 3-39]: WHITE means a clean area free from radioactive contamination, whether surface or airborne. GREEN means an area which is substantially clean. Only in exceptional circumstances is airborne contamination such that provisions must be made for its control. AMBER means an area in which some surface contamination is expected. In some cases, there will be a potential for airborne contamination such that provision must be made for its control. RED means an area in which contamination levels are so high that there is normally no access without appropriate respiratory protection. UKP-GW-GL-790 113 Revision 4 3.0 Radioactive Waste Management Systems UK AP1000 Environment Report Table 3.3-3 SPECIFICATION OF CONTAINMENT FILTRATION SYSTEM ELEMENTS Filter System Parameter Pre High Efficiency Filter HEPA Filter Charcoal Filter Post High Efficiency Filters Design Type High Efficiency HEPA Type III rechargeable cell High Efficiency Design Code or Standard ASME N509 ASME N509 ASME N509 ASME N509 Dimensions (Approximate maximum for each unit) 10.7 m x 2.0 m x 1.7 m (35' x 6.5' x 5.6') Construction Material/ Filter Material Utility specific Utility specific Utility specific Utility specific Filter Pass (Pore) Size Utility specific Utility specific Utility specific Utility specific Typical Flowrate Per Unit (m3/h) 6800 6800 6800 6800 Efficiency 80% minimum ASHRAE efficiency >99.97% 0.3μm dioctyl phthalate (DOP) 90% Decontamination efficiency 95% 0.3μm DOP Monitoring of Efficiency Periodic DOP testing Periodic DOP testing Periodic DOP testing Periodic DOP testing Detection of Filter Blinding Differential pressure instrument Differential pressure instrument Radiation monitoring in the plant vent Differential pressure instrument Typical “In-Service” Periods Once a week for 20 hours Arrangement to Take Filter Out of Service Both filter units are 100% redundant. When one is being maintained it can be bypassed and the other can be used. UKP-GW-GL-790 114 Revision 4 3.0 Radioactive Waste Management Systems UK AP1000 Environment Report Table 3.3-4 MAIN PLANT VENT RELEASE POINT DATA Parameter Value Comments Stack Height 74.926 m Plant vent Plume Rise 6.7 m Under neutral atmospheric conditions Release Height 81.626 m Sum above Vent Dimensions 2.025 m x 2.311 m Rectangular stack Volumetric Flow Rate 38.13 m3s-1 Nominal Discharge Velocity 8.15ms-1 Exhaust Temperature 285 – 315 K Distance to Site Boundary 200 m Nearby Building Height 70 m Reactor Building Buildings Surface Area Wall 3000 m2 Reactor Building Depending on outside air temperature Table 3.3-5 CONDENSER AIR REMOVAL STACK RELEASE POINT DATA Parameter Value Comments Stack Height 38.4 m Turbine building vent Plume Rise 1.4m Under neutral atmospheric conditions Release Height 39.8m Sum above Vent Internal Diameter 0.3048m Circular 12” diameter stack Volumetric Flow Rate 0.6 m3s-1 Estimated Nominal Discharge Velocity 8.2ms-1 Exhaust Temperature 285 – 315 K Distance to Site Boundary 200 m Nearby Building Height 70 m Reactor building Buildings Surface Area Wall 3000 m2 Reactor building UKP-GW-GL-790 Depending on outside air temperature 115 Revision 4 3.0 Radioactive Waste Management Systems UK AP1000 Environment Report Table 3.3-6 EXPECTED ANNUAL RELEASE OF AIRBORNE RADIOIODINES TO THE ATMOSPHERE Activity Release, GBq/y Building/Area Ventilation Nuclide Waste Gas System Containment Building Auxiliary Building Turbine Building Condenser Air Removal System I-131 7.4E-03 1.9E-02 1.8E-01 2.4E-03 9.6E-04 2.1E-01 I-133 1.1E-02 7.4E-02 2.6E-01 7.4E-04 3.0E-03 3.5E-01 5.6E-01 Total Airborne Radioiodine UKP-GW-GL-790 Total Release 116 Revision 4 3.0 Radioactive Waste Management Systems UK AP1000 Environment Report Table 3.3-7 EXPECTED ANNUAL RELEASE OF RADIOACTIVE NOBLE GASES, TRITIUM, AND CARBON-14 TO THE ATMOSPHERE Activity Release (1), GBq/y Building/Area Ventilation Waste Gas System Containment Building Auxiliary Building Turbine Building Condenser Air Removal System Kr-85m 4.6E-01 1.4E-01 1.6E+01 8.5E-04 7.8E+00 2.4E+01 Kr-85 3.0E+03 1.1E+01 5.2E+01 2.9E-03 2.6E+01 3.1E+03 Kr-87 negl. 4.4E-02 1.7E+01 2.6E-04 2.2E+00 1.9E+01 Kr-88 6.7E-03 1.0E-01 1.8E+01 9.6E-04 8.5E+00 2.7E+01 Xe-131m 1.1E+03 3.1E+01 1.8E+02 9.3E-03 8.1E+01 1.4E+03 Xe-133m 3.6E-02 6.7E+00 7.4E+01 4.1E-03 3.5E+01 1.1E+02 Xe-133 2.4E+02 8.9E+01 6.3E+02 3.3E-02 2.9E+02 1.3E+03 Xe-135m negl. 6.7E-02 1.3E+02 7.0E-03 5.9E+01 1.9E+02 Xe-135 negl. 3.1E+00 1.7E+02 2.9E-02 2.6E+02 4.4E+02 Xe-137 negl. negl. 3.4E+01 1.8E-03 1.6E+01 4.8E+01 Xe-138 negl. 2.9E-02 5.9E+01 3.3E-03 2.9E+01 8.9E+01 Nuclide Total Noble Gas Total Release 6.7E+03 (2) Tritium Release via Gaseous Pathway (TBq/y) = 1.8 C-14 Released via Gaseous Pathway (TBq/y) = 0.606(3) Ar-41 Released via Gaseous Pathway (TBq/y) = 1.3 Notes: 1. Values less than 1 microcurie (3.7E+4Bq) are considered to be negligible, but their values are included in the totals. 2. Tritium release based on Westinghouse TRICAL computer code. 3. C-14 from Westinghouse calculation APP-WLS-M3C-056, Rev. 0, 2009 [Westinghouse Proprietary Class 2, Protect – Commercial]. UKP-GW-GL-790 117 Revision 4 3.0 Radioactive Waste Management Systems UK AP1000 Environment Report Table 3.3-8 EXPECTED ANNUAL RELEASE OF RADIOACTIVE PARTICULATES TO THE ATMOSPHERE Activity Release (1) , GBq/y Building/Area Ventilation Waste Gas System Containment Building Auxiliary Building Fuel Handling Area Total Cr-51 negl. negl. 1.2E-04 6.7E-05 2.3E-04 Mn-54 negl. negl. negl. 1.1E-04 1.6E-04 Co-57 negl. negl. negl. negl. negl. Co-58 negl. 9.3E-05 7.0E-04 7.8E-03 8.5E-03 Co-60 negl. negl. 1.9E-04 3.0E-03 3.2E-03 Fe-59 negl. negl. negl. negl. negl. Sr-89 negl. 4.8E-05 2.8E-04 7.8E-04 1.1E-03 S-90 negl. negl. 1.1E-04 3.0E-04 4.4E-04 Zr-95 negl. negl. 3.7E-04 negl. 3.7E-04 Nb-95 negl. negl. negl. 8.9E-04 9.3E-04 Ru-103 negl. negl. negl. negl. negl. Ru-106 negl. negl. negl. negl. negl. Sb-125 negl. negl. negl. negl. negl. Cs-134 negl. negl. 2.0E-04 6.3E-04 8.5E-04 Cs-136 negl. negl. negl. negl. negl. Cs-137 negl. negl. 2.7E-04 1.0E-03 1.3E-03 Ba-140 negl. negl. 1.5E-04 negl. 1.6E-04 Ce-141 negl. negl. negl. negl. negl. Nuclide Total Particulates 1.7E-02 Notes: 1. Values less than 1 microcurie (3.7E+4Bq) are considered to be negligible, but their values are included in the totals. UKP-GW-GL-790 118 Revision 4 3.0 Radioactive Waste Management Systems UK AP1000 Environment Report Table 3.3-9 RADIONUCLIDES LISTED IN EU COMMISSION RECOMMENDATION 2004/2/EURATOM FOR PWR NUCLEAR POWER REACTORS THAT WERE INCLUDED IN AP1000 NPP DESIGN BASIS ESTIMATES FOR MONTHLY DISCHARGES TO ATMOSPHERE Noble gases Ar-41 Kr-87 Xe-133 Xe-135m Kr-85 Kr-88 Xe-133m Xe-137 Kr-85m Xe-131m Xe-135 Xe-138 Particulates (excluding iodines) Cr-51 Co-60 Nb-95 Ba-140 Mn-54 Sr-89 Sb-125 Ce-141 Co-58 Sr-90 Cs-134 Fe-59 Zr-95 Cs-137 Iodines I-131 I-133 Tritium H-3 Carbon-14 C-14 UKP-GW-GL-790 119 Revision 4 7405 3.66 3.91 4.18 4.50 4.87 5.31 5.84 6.48 7.28 8.30 9.66 11.55 14.38 19.04 28.27 56.19 200.13 3 4 5 6 7 8 9 10 11 12 13 14 15 16 17 18 Total UKP-GW-GL-790 2079 3.45 2 1046 704 532 427 357 307 269 240 216 197 180 167 155 145 136 128 121 3.26 1 GBq curies Month RCS Table 3.3-10 217.80 12.10 12.10 12.10 12.10 12.10 12.10 12.10 12.10 12.10 12.10 12.10 12.10 12.10 12.10 12.10 12.10 12.10 12.10 curies 120 NON-RCS 8059 448 448 448 448 448 448 448 448 448 448 448 448 448 448 448 448 448 448 GBq MONTHLY DISCHARGES IN GAS, ALL RADIONUCLIDES 3.0 Radioactive Waste Management Systems 417.93 68.29 40.37 31.14 26.48 23.65 21.76 20.40 19.38 18.58 17.94 17.41 16.97 16.60 16.28 16.01 15.76 15.55 15.36 curies TOTAL Revision 4 15463 2527 1494 1152 980 875 805 755 717 687 664 644 628 614 602 592 583 575 568 GBq UK AP1000 Environment Report 0.0E+00 0.0E+00 0.0E+00 0.0E+00 0.0E+00 0.0E+00 0.0E+00 0.0E+00 0.0E+00 0.0E+00 0.0E+00 0.0E+00 0.0E+00 0.0E+00 0.0E+00 1 2 3 4 5 6 7 8 9 10 11 12 13 14 15 UKP-GW-GL-790 curies Month GBq 0.0E+00 0.0E+00 0.0E+00 0.0E+00 0.0E+00 0.0E+00 0.0E+00 0.0E+00 0.0E+00 0.0E+00 0.0E+00 0.0E+00 0.0E+00 0.0E+00 0.0E+00 RCS 4.1E-05 4.1E-05 4.1E-05 4.1E-05 4.1E-05 4.1E-05 4.1E-05 4.1E-05 4.1E-05 4.1E-05 4.1E-05 4.1E-05 4.1E-05 4.1E-05 4.1E-05 curies Table 3.3-11 1.5E-03 1.5E-03 1.5E-03 1.5E-03 1.5E-03 1.5E-03 1.5E-03 1.5E-03 1.5E-03 1.5E-03 1.5E-03 1.5E-03 1.5E-03 1.5E-03 1.5E-03 GBq 2.9E-04 2.9E-04 2.9E-04 2.9E-04 2.9E-04 2.9E-04 2.9E-04 2.9E-04 2.9E-04 2.9E-04 2.9E-04 2.9E-04 2.9E-04 2.9E-04 2.9E-04 curies 1.1E-02 1.1E-02 1.1E-02 1.1E-02 1.1E-02 1.1E-02 1.1E-02 1.1E-02 1.1E-02 1.1E-02 1.1E-02 1.1E-02 1.1E-02 1.1E -02 1.1E-2 GBq Containment Building 121 9.9E-04 9.9E-04 9.9E-04 9.9E-04 9.9E-04 9.9E-04 9.9E-04 9.9E-04 9.9E-04 9.9E-04 9.9E-04 9.9E-04 9.9E-04 9.9E-04 9.9E-04 curies 3.7E-02 3.7E-02 3.7E-02 3.7E-02 3.7E-02 3.7E-02 3.7E-02 3.7E-02 3.7E-02 3.7E-02 3.7E-02 3.7E-02 3.7E-02 3.7E-02 3.7E-02 GBq Auxiliary Building NON-RCS 7.1E-06 7.1E-06 7.1E-06 7.1E-06 7.1E-06 7.1E-06 7.1E-06 7.1E-06 7.1E-06 7.1E-06 7.1E-06 7.1E-06 7.1E-06 7.1E-06 7.1E-06 curies 2.6E-04 2.6E-04 2.6E-04 2.6E-04 2.6E-04 2.6E-04 2.6E-04 2.6E-04 2.6E-04 2.6E-04 2.6E-04 2.6E-04 2.6E-04 2.6E-04 2.6E-04 GBq Turbine Building MONTHLY RADIOIODINE DISCHARGES IN GAS(1) Fuel Handling Area 3.0 Radioactive Waste Management Systems 8.8E-06 8.8E-06 8.8E-06 8.8E-06 8.8E-06 8.8E-06 8.8E-06 8.8E-06 8.8E-06 8.8E-06 8.8E-06 8.8E-06 8.8E-06 8.8E-06 8.8E-06 curies 3.3E-04 3.3E-04 3.3E-04 3.3E-04 3.3E-04 3.3E-04 3.3E-04 3.3E-04 3.3E-04 3.3E-04 3.3E-04 3.3E-04 3.3E-04 3.3E-04 3.3E-04 GBq Condenser Air Removal System 5.0E-02 5.0E-02 5.0E-02 5.0E-02 5.0E-02 5.0E-02 5.0E-02 5.0E-02 5.0E-02 5.0E-02 5.0E-02 5.0E-02 5.0E-02 5.0E-02 5.0E-02 GBq Revision 4 1.34E-03 1.34E-03 1.34E-03 1.34E-03 1.34E-03 1.34E-03 1.34E-03 1.34E-03 1.34E-03 1.34E-03 1.34E-03 1.34E-03 1.34E-03 1.34E-03 1.34E-03 curies TOTAL UK AP1000 Environment Report 0.0E+00 0.0E+00 0.0E+00 0.0E+00 0.0E+00 17 18 Total UKP-GW-GL-790 Notes: 1. Includes I-131 and I-133. 0.0E+00 0.0E+00 0.0E+00 16 GBq curies Month RCS 7.35E-04 4.1E-05 4.1E-05 4.1E-05 curies Table 3.3-11 (cont.) 2.72E-02 1.5E-03 1.5E-03 1.5E-03 GBq 5.27E-03 2.9E-04 2.9E-04 2.9E-04 curies 1.95E-01 1.1E-02 1.1E-02 1.1E-02 GBq Containment Building 122 1.79E-02 9.9E-04 9.9E-04 9.9E-04 curies 6.62E-01 3.7E-02 3.7E-02 3.7E-02 GBq Auxiliary Building NON-RCS 1.28E-04 7.1E-06 7.1E-06 7.1E-06 curies 4.74E-03 2.6E-04 2.6E-04 2.6E-04 GBq Turbine Building MONTHLY RADIOIODINE DISCHARGES IN GAS(1) Fuel Handling Area 3.0 Radioactive Waste Management Systems 1.59E-04 8.8E-06 8.8E-06 8.8E-06 curies 5.88E-03 3.3E-04 3.3E-04 3.3E-04 GBq Condenser Air Removal System 8.92E-01 5.0E-02 5.0E-02 5.0E-02 GBq Revision 4 2.41E-02 1.34E-03 1.34E-03 1.34E-03 curies TOTAL UK AP1000 Environment Report 6.55E+03 3.2E+00 3.5E+00 3.7E+00 4.0E+00 4.3E+00 4.7E+00 5.2E+00 5.7E+00 6.4E+00 7.3E+00 8.5E+00 1.0E+01 1.3E+01 1.7E+01 2.5E+01 5.0E+01 1.77E+02 3 4 5 6 7 8 9 10 11 12 13 14 15 16 17 18 Total UKP-GW-GL-790 1.8E+03 3.1E+00 2 GBq 1 9.2E+02 6.3E+02 4.8E+02 3.7E+02 3.1E+02 2.7E+02 2.4E+02 2.1E+02 1.9E+02 1.7E+02 1.6E+02 1.5E+02 1.4E+02 1.3E+02 1.2E+02 1.1E+02 1.1E+02 curies 2.9E+00 Month Waste Gas System RCS 5.70E+00 3.2E-01 3.2E-01 3.2E-01 3.2E-01 3.2E-01 3.2E-01 3.2E-01 3.2E-01 3.2E-01 3.2E-01 3.2E-01 3.2E-01 3.2E-01 3.2E-01 3.2E-01 3.2E-01 3.2E-01 3.2E-01 curies Table 3.3-12 2.11E+02 1.2E+01 1.2E+01 1.2E+01 1.2E+01 1.2E+01 1.2E+01 1.2E+01 1.2E+01 1.2E+01 1.2E+01 1.2E+01 1.2E+01 1.2E+01 1.2E+01 1.2E+01 1.2E+01 1.2E+01 5.57E+01 3.1E+00 3.1E+00 3.1E+00 3.1E+00 3.1E+00 3.1E+00 3.1E+00 3.1E+00 3.1E+00 3.1E+00 3.1E+00 3.1E+00 3.1E+00 3.1E+00 3.1E+00 3.1E+00 3.1E+00 3.1E+00 curies 123 2.06E+03 1.1E+02 1.1E+02 1.1E+02 1.1E+02 1.1E+02 1.1E+02 1.1E+02 1.1E+02 1.1E+02 1.1E+02 1.1E+02 1.1E+02 1.1E+02 1.1E+02 1.1E+02 1.1E+02 1.1E+02 1.1E+02 GBq Auxiliary Building 3.77E-03 2.1E-04 2.1E-04 2.1E-04 2.1E-04 2.1E-04 2.1E-04 2.1E-04 2.1E-04 2.1E-04 2.1E-04 2.1E-04 2.1E-04 2.1E-04 2.1E-04 2.1E-04 2.1E-04 2.1E-04 2.1E-04 curies 1.39E-01 7.8E-03 7.8E-03 7.8E-03 7.8E-03 7.8E-03 7.8E-03 7.8E-03 7.8E-03 7.8E-03 7.8E-03 7.8E-03 7.8E-03 7.8E-03 7.8E-03 7.8E-03 7.8E-03 7.8E-03 7.8E-03 GBq Turbine Building NON-RCS MONTHLY NOBLE GAS DISCHARGES 1.2E+01 GBq Containment Building 3.0 Radioactive Waste Management Systems 3.20E+01 1.8E+00 1.8E+00 1.8E+00 1.8E+00 1.8E+00 1.8E+00 1.8E+00 1.8E+00 1.8E+00 1.8E+00 1.8E+00 1.8E+00 1.8E+00 1.8E+00 1.8E+00 1.8E+00 1.8E+00 1.8E+00 curies 1.18E+03 6.7E+01 6.7E+01 6.7E+01 6.7E+01 6.7E+01 6.7E+01 6.7E+01 6.7E+01 6.7E+01 6.7E+01 6.7E+01 6.7E+01 6.7E+01 6.7E+01 6.7E+01 6.7E+01 6.7E+01 6.7E+01 GBq Condenser Air Removal System 2.70E+02 5.49E+01 3.02E+01 2.20E+01 1.79E+01 1.54E+01 1.37E+01 1.25E+01 1.16E+01 1.09E+01 1.03E+01 9.88E+00 9.49E+00 9.16E+00 8.88E+00 8.64E+00 8.42E+00 8.23E+00 8.07E+00 curies Revision 4 9.99E+03 2.03E+03 1.12E+03 8.14E+02 6.62E+02 5.70E+02 5.07E+02 4.62E+02 4.29E+02 4.03E+02 3.81E+02 3.66E+02 3.51E+02 3.39E+02 3.29E+02 3.20E+02 3.12E+02 3.05E+02 2.99E+02 GBq TOTAL UK AP1000 Environment Report 117.3 417.4 0.19 0.21 0.22 0.24 0.25 0.27 0.30 0.33 0.37 0.41 0.47 0.54 0.65 0.81 1.07 1.59 3.17 11.28 2 3 4 5 6 7 8 9 10 11 12 13 14 15 16 17 18 58.8 39.6 30.0 24.0 20.0 17.4 15.2 13.7 12.2 11.1 10.0 9.2 8.9 8.1 7.8 7.0 6.7 0.18 1 GBq curies UKP-GW-GL-790 Total Table 3.3-13 124 60.72 3.37 3.37 3.37 3.37 3.37 3.37 3.37 3.37 3.37 3.37 3.37 3.37 3.37 3.37 3.37 3.37 3.37 3.37 curies NON-RCS 2247 125 125 125 125 125 125 125 125 125 125 125 125 125 125 125 125 125 125 GBq MONTHLY TRITIUM DISCHARGES IN GAS Month RCS 3.0 Radioactive Waste Management Systems 72.00 6.54 4.97 4.45 4.18 4.02 3.92 3.84 3.78 3.74 3.70 3.67 3.65 3.63 3.61 3.59 3.58 3.57 3.56 curies TOTAL Revision 4 2664 242 184 165 155 149 145 142 140 138 137 136 135 134 134 133 132 132 132 GBq UK AP1000 Environment Report 40.04 142.61 0.07 0.07 0.08 0.08 0.09 0.09 0.10 0.11 0.12 0.14 0.16 0.19 0.22 0.28 0.37 0.54 1.08 3.85 2 3 4 5 6 7 8 9 10 11 12 13 14 15 16 17 18 20.15 13.57 10.24 8.23 6.88 5.91 5.18 4.62 4.16 3.78 3.47 3.21 2.98 2.78 2.61 2.46 2.32 0.06 1 GBq curies UKP-GW-GL-790 Total Table 3.3-14 125 20.75 1.15 1.15 1.15 1.15 1.15 1.15 1.15 1.15 1.15 1.15 1.15 1.15 1.15 1.15 1.15 1.15 1.15 1.15 curies NON-RCS 767.59 42.64 42.64 42.64 42.64 42.64 42.64 42.64 42.64 42.64 42.64 42.64 42.64 42.64 42.64 42.64 42.64 42.64 42.64 GBq MONTHLY C-14 DISCHARGES IN GAS Month RCS 3.0 Radioactive Waste Management Systems 24.60 2.23 1.70 1.52 1.43 1.38 1.34 1.31 1.29 1.28 1.26 1.25 1.25 1.24 1.23 1.23 1.22 1.22 1.22 curies TOTAL Revision 4 910.20 82.69 62.79 56.21 52.89 50.88 49.53 48.56 47.83 47.26 46.80 46.43 46.12 45.85 45.62 45.43 45.25 45.10 44.97 GBq UK AP1000 Environment Report 295.6 0.16 0.17 0.18 0.19 0.21 0.23 0.26 0.29 0.33 0.39 0.46 0.57 0.76 1.13 2.24 7.99 4 5 6 7 8 9 10 11 12 13 14 15 16 17 18 UKP-GW-GL-790 Total 82.9 0.15 3 41.8 28.1 21.1 17.0 14.4 12.2 10.7 9.6 8.5 7.8 7.0 6.7 6.3 5.9 5.6 5.2 0.14 2 4.8 GBq 0.13 curies RCS Table 3.3-15 126 43.01 2.39 2.39 2.39 2.39 2.39 2.39 2.39 2.39 2.39 2.39 2.39 2.39 2.39 2.39 2.39 2.39 2.39 2.39 curies NON-RCS 1591 88.4 88.4 88.4 88.4 88.4 88.4 88.4 88.4 88.4 88.4 88.4 88.4 88.4 88.4 88.4 88.4 88.4 88.4 GBq MONTHLY AR-41 DISCHARGES IN GAS 1 Month 3.0 Radioactive Waste Management Systems 51.00 4.63 3.52 3.15 2.96 2.85 2.78 2.72 2.68 2.65 2.62 2.60 2.58 2.57 2.56 2.55 2.54 2.53 2.52 curies TOTAL Revision 4 1887 171.3 130.2 116.6 109.5 105.4 102.9 100.6 99.2 98.0 96.9 96.2 95.5 95.1 94.7 94.4 94.0 93.6 93.2 GBq UK AP1000 Environment Report 0.0E+00 0.0E+00 0.0E+00 0.0E+00 0.0E+00 0.0E+00 0.0E+00 0.0E+00 0.0E+00 0.0E+00 0.0E+00 0.0E+00 0.0E+00 0.0E+00 0.0E+00 0.0E+00 0.0E+00 0.0E+00 3 4 5 6 7 8 9 10 11 12 13 14 15 16 17 18 Total UKP-GW-GL-790 0.0E+00 0.0E+00 2 0.0E+00 0.0E+00 0.0E+00 0.0E+00 0.0E+00 0.0E+00 0.0E+00 0.0E+00 0.0E+00 0.0E+00 0.0E+00 0.0E+00 0.0E+00 0.0E+00 0.0E+00 0.0E+00 0.0E+00 0.0E+00 1 GBq curies Month Waste Gas System RCS 0.0E+00 0.0E+00 0.0E+00 0.0E+00 0.0E+00 0.0E+00 0.0E+00 0.0E+00 0.0E+00 0.0E+00 0.0E+00 0.0E+00 0.0E+00 0.0E+00 0.0E+00 0.0E+00 0.0E+00 0.0E+00 0.0E+00 curies Table 3.3-16 0.0E+00 0.0E+00 0.0E+00 0.0E+00 0.0E+00 0.0E+00 0.0E+00 0.0E+00 0.0E+00 0.0E+00 0.0E+00 0.0E+00 0.0E+00 0.0E+00 0.0E+00 0.0E+00 0.0E+00 0.0E+00 0.0E+00 GBq 127 7.65E-06 4.3E-07 4.3E-07 4.3E-07 4.3E-07 4.3E-07 4.3E-07 4.3E-07 4.3E-07 4.3E-07 4.3E-07 4.3E-07 4.3E-07 4.3E-07 4.3E-07 4.3E-07 4.3E-07 4.3E-07 4.3E-07 curies 2.83E-04 1.57E-05 1.57E-05 1.57E-05 1.57E-05 1.57E-05 1.57E-05 1.57E-05 1.57E-05 1.57E-05 1.57E-05 1.57E-05 1.57E-05 1.57E-05 1.57E-05 1.57E-05 1.57E-05 1.57E-05 1.57E-05 GBq Auxiliary Building 1.23E-04 6.8E-06 6.8E-06 6.8E-06 6.8E-06 6.8E-06 6.8E-06 6.8E-06 6.8E-06 6.8E-06 6.8E-06 6.8E-06 6.8E-06 6.8E-06 6.8E-06 6.8E-06 6.8E-06 6.8E-06 6.8E-06 curies 4.55E-03 2.53E-04 2.53E-04 2.53E-04 2.53E-04 2.53E-04 2.53E-04 2.53E-04 2.53E-04 2.53E-04 2.53E-04 2.53E-04 2.53E-04 2.53E-04 2.53E-04 2.53E-04 2.53E-04 2.53E-04 2.53E-04 GBq 1.31E-04 7.26E-06 7.26E-06 7.26E-06 7.26E-06 7.26E-06 7.26E-06 7.26E-06 7.26E-06 7.26E-06 7.26E-06 7.26E-06 7.26E-06 7.26E-06 7.26E-06 7.26E-06 7.26E-06 7.26E-06 7.26E-06 curies GBq Revision 4 4.83E-03 2.69E-04 2.69E-04 2.69E-04 2.69E-04 2.69E-04 2.69E-04 2.69E-04 2.69E-04 2.69E-04 2.69E-04 2.69E-04 2.69E-04 2.69E-04 2.69E-04 2.69E-04 2.69E-04 2.69E-04 2.69E-04 TOTAL UK AP1000 Environment Report Fuel Handling Area NON-RCS MONTHLY CO-60 DISCHARGES IN GAS Containment Building 3.0 Radioactive Waste Management Systems 1.45E+02 1.63E+02 2.1E+00 2.2E+00 2.4E+00 2.5E+00 2.7E+00 3.0E+00 3.2E+00 3.5E+00 3.9E+00 2 3 4 5 6 7 8 9 10 4.50E+03 7.0E+00 8.7E+00 1.2E+01 1.7E+01 3.4E+01 1.22E+02 14 15 16 17 18 Total UKP-GW-GL-790 1.26E+03 5.9E+00 13 6.35E+02 4.28E+02 3.23E+02 2.60E+02 2.17E+02 1.86E+02 4.4E+00 5.0E+00 11 12 1.31E+02 1.19E+02 1.09E+02 1.01E+02 9.40E+01 8.77E+01 8.23E+01 7.75E+01 7.32E+01 2.0E+00 1 GBq curies Month Waste Gas System RCS 4.5E-01 2.5E-02 2.5E-02 2.5E-02 2.5E-02 2.5E-02 2.5E-02 2.5E-02 2.5E-02 2.5E-02 2.5E-02 2.5E-02 2.5E-02 2.5E-02 2.5E-02 2.5E-02 2.5E-02 2.5E-02 2.5E-02 curies Table 3.3-17 1.67E+01 9.25E-01 9.25E-01 9.25E-01 9.25E-01 9.25E-01 9.25E-01 9.25E-01 9.25E-01 9.25E-01 9.25E-01 9.25E-01 9.25E-01 9.25E-01 9.25E-01 9.25E-01 9.25E-01 9.25E-01 9.25E-01 2.10E+00 1.2E-01 1.2E-01 1.2E-01 1.2E-01 1.2E-01 1.2E-01 1.2E-01 1.2E-01 1.2E-01 1.2E-01 1.2E-01 1.2E-01 1.2E-01 1.2E-01 1.2E-01 1.2E-01 1.2E-01 1.2E-01 curies 128 7.77E+01 4.32E+00 4.32E+00 4.32E+00 4.32E+00 4.32E+00 4.32E+00 4.32E+00 4.32E+00 4.32E+00 4.32E+00 4.32E+00 4.32E+00 4.32E+00 4.32E+00 4.32E+00 4.32E+00 4.32E+00 4.32E+00 GBq Auxiliary Building 1.19E-04 6.6E-06 6.6E-06 6.6E-06 6.6E-06 6.6E-06 6.6E-06 6.6E-06 6.6E-06 6.6E-06 6.6E-06 6.6E-06 6.6E-06 6.6E-06 6.6E-06 6.6E-06 6.6E-06 6.6E-06 6.6E-06 curies 4.38E-03 2.44E-04 2.44E-04 2.44E-04 2.44E-04 2.44E-04 2.44E-04 2.44E-04 2.44E-04 2.44E-04 2.44E-04 2.44E-04 2.44E-04 2.44E-04 2.44E-04 2.44E-04 2.44E-04 2.44E-04 2.44E-04 GBq Turbine Building NON-RCS MONTHLY KR-85 DISCHARGES IN GAS GBq Containment Building 3.0 Radioactive Waste Management Systems 1.04E+00 5.8E-02 5.8E-02 5.8E-02 5.8E-02 5.8E-02 5.8E-02 5.8E-02 5.8E-02 5.8E-02 5.8E-02 5.8E-02 5.8E-02 5.8E-02 5.8E-02 5.8E-02 5.8E-02 5.8E-02 5.8E-02 curies 3.83E+01 2.13E+00 2.13E+00 2.13E+00 2.13E+00 2.13E+00 2.13E+00 2.13E+00 2.13E+00 2.13E+00 2.13E+00 2.13E+00 2.13E+00 2.13E+00 2.13E+00 2.13E+00 2.13E+00 2.13E+00 2.13E+00 GBq Condenser Air Removal System 1.26E+02 3.43E+01 1.74E+01 1.18E+01 8.93E+00 7.21E+00 6.06E+00 5.24E+00 4.62E+00 4.13E+00 3.74E+00 3.42E+00 3.16E+00 2.93E+00 2.74E+00 2.57E+00 2.42E+00 2.29E+-- 2.18E+00 curies Revision 4 0.00E+00 1.27E+03 6.42E+02 4.35E+02 3.30E+02 2.67E+02 2.24E+02 1.94E+02 1.71E+02 1.53E+02 1.38E+02 1.27E+02 1.17E+02 1.08E+02 1.01E+02 9.51E+01 8.97E+01 8.49E+01 8.06E+01 GBq TOTAL UK AP1000 Environment Report 0.00E+00 0.00E+00 0.00E+00 0.00E+00 0.00E+00 0.00E+00 0.00E+00 0.00E+00 0.00E+00 2 3 4 5 6 7 8 0.00E+00 0.00E+00 0.00E+00 0.00E+00 0.00E+00 0.00E+00 0.00E+00 0.00E+00 0.00E+00 12 13 14 15 16 17 18 Total UKP-GW-GL-790 0.00E+00 0.00E+00 11 0.00E+00 0.00E+00 0.00E+00 0.00E+00 0.00E+00 0.00E+00 0.00E+00 0.00E+00 0.00E+00 0.00E+00 9 10 0.00E+00 0.00E+00 0.00E+00 0.00E+00 0.00E+00 0.00E+00 0.00E+00 0.00E+00 1 GBq curies Month Waste Gas System RCS 0.00E+00 0.00E+00 0.00E+00 0.00E+00 0.00E+00 0.00E+00 0.00E+00 0.00E+00 0.00E+00 0.00E+00 0.00E+00 0.00E+00 0.00E+00 0.00E+00 0.00E+00 0.00E+00 0.00E+00 0.00E+00 0.00E+00 curies Table 3.3-18 0.00E+00 0.00E+00 0.00E+00 0.00E+00 0.00E+00 0.00E+00 0.00E+00 0.00E+00 0.00E+00 0.00E+00 0.00E+00 0.00E+00 0.00E+00 0.00E+00 0.00E+00 0.00E+00 0.00E+00 0.00E+00 0.00E+00 GBq 129 4.35E-06 2.4E-07 2.4E-07 2.4E-07 2.4E-07 2.4E-07 2.4E-07 2.4E-07 2.4E-07 2.4E-07 2.4E-07 2.4E-07 2.4E-07 2.4E-07 2.4E-07 2.4E-07 2.4E-07 2.4E-07 2.4E-07 curies 1.61E-04 8.94E-06 8.94E-06 8.94E-06 8.94E-06 8.94E-06 8.94E-06 8.94E-06 8.94E-06 8.94E-06 8.94E-06 8.94E-06 8.94E-06 8.94E-06 8.94E-06 8.94E-06 8.94E-06 8.94E-06 8.94E-06 GBq Auxiliary Building 1.20E-05 6.7E-07 6.7E-07 6.7E-07 6.7E-07 6.7E-07 6.7E-07 6.7E-07 6.7E-07 6.7E-07 6.7E-07 6.7E-07 6.7E-07 6.7E-07 6.7E-07 6.7E-07 6.7E-07 6.7E-07 6.7E-07 4.44E-04 2.47E-05 2.47E-05 2.47E-05 2.47E-05 2.47E-05 2.47E-05 2.47E-05 2.47E-05 2.47E-05 2.47E-05 2.47E-05 2.47E-05 2.47E-05 2.47E-05 2.47E-05 2.47E-05 2.47E-05 2.47E-05 GBq 1.80E-05 1.0E-06 1.0E-06 1.0E-06 1.0E-06 1.0E-06 1.0E-06 1.0E-06 1.0E-06 1.0E-06 1.0E-06 1.0E-06 1.0E-06 1.0E-06 1.0E-06 1.0E-06 1.0E-06 1.0E-06 1.0E-06 curies GBq Revision 4 6.66E-04 3.70E-05 3.70E-05 3.70E-05 3.70E-05 3.70E-05 3.70E-05 3.70E-05 3.70E-05 3.70E-05 3.70E-05 3.70E-05 3.70E-05 3.70E-05 3.70E-05 3.70E-05 3.70E-05 3.70E-05 3.70E-05 TOTAL UK AP1000 Environment Report Fuel Handling curies NON-RCS MONTHLY SR-90 DISCHARGES IN GAS Containment Building 3.0 Radioactive Waste Management Systems 0.0E+00 0.0E+00 0.0E+00 0.0E+00 0.0E+00 0.0E+00 0.0E+00 0.0E+00 0.0E+00 2 3 4 5 6 7 8 0.00E+00 0.0E+00 0.0E+00 0.0E+00 0.0E+00 0.0E+00 0.0E+00 0.0E+00 0.00E+00 12 13 14 15 16 17 18 Total UKP-GW-GL-790 0.0E+00 0.0E+00 11 0.0E+00 0.0E+00 0.0E+00 0.0E+00 0.0E+00 0.0E+00 0.0E+00 0.0E+00 0.0E+00 0.0E+00 9 10 0.0E+00 0.0E+00 0.0E+00 0.0E+00 0.0E+00 0.0E+00 0.0E+00 0.0E+00 1 GBq curies Month Waste Gas System RCS 7.65E-04 4.3E-05 4.3E-05 4.3E-05 4.3E-05 4.3E-05 4.3E-05 4.3E-05 4.3E-05 4.3E-05 4.3E-05 4.3E-05 4.3E-05 4.3E-05 4.3E-05 4.3E-05 4.3E-05 4.3E-05 4.3E-05 curies 2.83E-02 1.57E-03 1.57E-03 1.57E-03 1.57E-03 1.57E-03 1.57E-03 1.57E-03 1.57E-03 1.57E-03 1.57E-03 1.57E-03 1.57E-03 1.57E-03 1.57E-03 1.57E-03 1.57E-03 1.57E-03 1.57E-03 GBq Table 3.3-19 7.20E-03 4.0E-04 4.0E-04 4.0E-04 4.0E-04 4.0E-04 4.0E-04 4.0E-04 4.0E-04 4.0E-04 4.0E-04 4.0E-04 4.0E-04 4.0E-04 4.0E-04 4.0E-04 4.0E-04 4.0E-04 4.0E-04 curies 130 2.66E-01 1.48E-02 1.48E-02 1.48E-02 1.48E-02 1.48E-02 1.48E-02 1.48E-02 1.48E-02 1.48E-02 1.48E-02 1.48E-02 1.48E-02 1.48E-02 1.48E-02 1.48E-02 1.48E-02 1.48E-02 1.48E-02 GBq Auxiliary Building 9.75E-05 5.4E-06 5.4E-06 5.4E-06 5.4E-06 5.4E-06 5.4E-06 5.4E-06 5.4E-06 5.4E-06 5.4E-06 5.4E-06 5.4E-06 5.4E-06 5.4E-06 5.4E-06 5.4E-06 5.4E-06 5.4E-06 curies 3.61E-03 2.00E-04 2.00E-04 2.00E-04 2.00E-04 2.00E-04 2.00E-04 2.00E-04 2.00E-04 2.00E-04 2.00E-04 2.00E-04 2.00E-04 2.00E-04 2.00E-04 2.00E-04 2.00E-04 2.00E-04 2.00E-04 GBq Turbine Building NON-RCS MONTHLY 1-131 DISCHARGES IN GAS Containment Building 3.0 Radioactive Waste Management Systems 3.90E-05 2.2E-06 2.2E-06 2.2E-06 2.2E-06 2.2E-06 2.2E-06 2.2E-06 2.2E-06 2.2E-06 2.2E-06 2.2E-06 2.2E-06 2.2E-06 2.2E-06 2.2E-06 2.2E-06 2.2E-06 2.2E-06 curies 1.44E-03 8.02E-05 8.02E-05 8.02E-05 8.02E-05 8.02E-05 8.02E-05 8.02E-05 8.02E-05 8.02E-05 8.02E-05 8.02E-05 8.02E-05 8.02E-05 8.02E-05 8.02E-05 8.02E-05 8.02E-05 8.02E-05 GBq Condenser Air Removal System 8.40E-03 4.67E-04 4.67E-04 4.67E-04 4.67E-04 4.67E-04 4.67E-04 4.67E-04 4.67E-04 4.67E-04 4.67E-04 4.67E-04 4.67E-04 4.67E-04 4.67E-04 4.67E-04 4.67E-04 4.67E-04 4.67E-04 curies GBq Revision 4 3.11E-01 1.73E-02 1.73E-02 1.73E-02 1.73E-02 1.73E-02 1.73E-02 1.73E-02 1.73E-02 1.73E-02 1.73E-02 1.73E-02 1.73E-02 1.73E-02 1.73E-02 1.73E-02 1.73E-02 1.73E-02 1.73E-02 TOTAL UK AP1000 Environment Report 3.2E-01 3.6E-01 4.1E-01 4.8E-01 5.7E-01 7.1E-01 10 11 12 13 14 15 UKP-GW-GL-790 5.17E+01 3.48E+01 2.63E+01 2.11E+01 1.77E+01 1.52E+01 1.33E+01 1.19E+01 1.07E+01 9.72E+00 3.66E+02 2.9E-01 9 9.90E+00 2.6E-01 8 8.92E+00 8.24E+00 Total 2.4E-01 7 1.03E+02 2.2E-01 6 7.66E+00 7.15E+00 2.8E+00 2.1E-01 5 18 1.9E-01 4 6.71E+00 6.31E+00 9.4E-01 1.8E-01 3 1.4E+00 1.7E-01 2 5.97E+00 17 1.6E-01 1 GBq 16 curies Month Waste Gas System RCS 3.60E+00 2.0E-01 2.0E-01 2.0E-01 2.0E-01 2.0E-01 2.0E-01 2.0E-01 2.0E-01 2.0E-01 2.0E-01 2.0E-01 2.0E-01 2.0E-01 2.0E-01 2.0E-01 2.0E-01 2.0E-01 2.0E-01 curies Table 3.3-20 1.33E+02 7.40E+00 7.40E+00 7.40E+00 7.40E+00 7.40E+00 7.40E+00 7.40E+00 7.40E+00 7.40E+00 7.40E+00 7.40E+00 7.40E+00 7.40E+00 7.40E+00 7.40E+00 7.40E+00 7.40E+00 7.40E+00 2.55E+01 1.4E+00 1.4E+00 1.4E+00 1.4E+00 1.4E+00 1.4E+00 1.4E+00 1.4E+00 1.4E+00 1.4E+00 1.4E+00 1.4E+00 1.4E+00 1.4E+00 1.4E+00 1.4E+00 1.4E+00 1.4E+00 curies 131 9.44E+02 5.24E+01 5.24E+01 5.24E+01 5.24E+01 5.24E+01 5.24E+01 5.24E+01 5.24E+01 5.24E+01 5.24E+01 5.24E+01 5.24E+01 5.24E+01 5.24E+01 5.24E+01 5.24E+01 5.24E+01 5.24E+01 GBq Auxiliary Building 1.35E-03 7.5E-05 7.5E-05 7.5E-05 7.5E-05 7.5E-05 7.5E-05 7.5E-05 7.5E-05 7.5E-05 7.5E-05 7.5E-05 7.5E-05 7.5E-05 7.5E-05 7.5E-05 7.5E-05 7.5E-05 7.5E-05 curies 5.00E-02 2.78E-03 2.78E-03 2.78E-03 2.78E-03 2.78E-03 2.78E-03 2.78E-03 2.78E-03 2.78E-03 2.78E-03 2.78E-03 2.78E-03 2.78E-03 2.78E-03 2.78E-03 2.78E-03 2.78E-03 2.78E-03 GBq Turbine Building NON-RCS MONTHLY XE-133 DISCHARGES IN GAS GBq Containment Building 3.0 Radioactive Waste Management Systems 1.19E+01 6.6E-01 6.6E-01 6.6E-01 6.6E-01 6.6E-01 6.6E-01 6.6E-01 6.6E-01 6.6E-01 6.6E-01 6.6E-01 6.6E-01 6.6E-01 6.6E-01 6.6E-01 6.6E-01 6.6E-01 6.6E-01 curies 4.38E+02 2.44E+01 2.44E+01 2.44E+01 2.44E+01 2.44E+01 2.44E+01 2.44E+01 2.44E+01 2.44E+01 2.44E+01 2.44E+01 2.44E+01 2.44E+01 2.44E+01 2.44E+01 2.44E+01 2.44E+01 2.44E+01 GBq Condenser Air Removal System 5.10E+01 5.05E+00 3.67E+00 3.22E+00 2.99E+00 2.85E+00 2.75E+00 2.69E+00 2.64E+00 2.60E+00 2.56E+00 2.54E+00 2.52E+00 2.50E+00 2.48E+00 2.47E+00 2.46E+00 2.45E+00 2.44E+00 curies Revision 4 1.89E+03 1.87E+02 1.36E+02 1.19E+02 1.10E+02 1.05E+02 1.02E+02 9.94E+01 9.75E+01 9.60E+01 9.49E+01 9.39E+01 9.31E+01 9.24E+01 9.18E+01 9.13E+01 9.09E+01 9.05E+01 9.01E+01 GBq TOTAL UK AP1000 Environment Report 0.0E+00 0.0E+00 0.0E+00 0.0E+00 0.0E+00 0.0E+00 0.0E+00 0.0E+00 0.0E+00 2 3 4 5 6 7 8 0.00E+00 0.0E+00 0.0E+00 0.0E+00 0.0E+00 0.0E+00 0.0E+00 0.0E+00 0.00E+00 12 13 14 15 16 17 18 Total UKP-GW-GL-790 0.0E+00 0.0E+00 11 0.0E+00 0.0E+00 0.0E+00 0.0E+00 0.0E+00 0.0E+00 0.0E+00 0.0E+00 0.0E+00 0.0E+00 9 10 0.0E+00 0.0E+00 0.0E+00 0.0E+00 0.0E+00 0.0E+00 0.0E+00 0.0E+00 1 GBq curies Month Waste Gas System RCS 0.00E+00 0.0E+00 0.0E+00 0.0E+00 0.0E+00 0.0E+00 0.0E+00 0.0E+00 0.0E+00 0.0E+00 0.0E+00 0.0E+00 0.0E+00 0.0E+00 0.0E+00 0.0E+00 0.0E+00 0.0E+00 0.0E+00 curies Table 3.3-21 0.00E+00 0.0E+00 0.0E+00 0.0E+00 0.0E+00 0.0E+00 0.0E+00 0.0E+00 0.0E+00 0.0E+00 0.0E+00 0.0E+00 0.0E+00 0.0E+00 0.0E+00 0.0E+00 0.0E+00 0.0E+00 0.0E+00 GBq 132 1.08E-05 6.0E-07 6.0E-07 6.0E-07 6.0E-07 6.0E-07 6.0E-07 6.0E-07 6.0E-07 6.0E-07 6.0E-07 6.0E-07 6.0E-07 6.0E-07 6.0E-07 6.0E-07 6.0E-07 6.0E-07 6.0E-07 curies 4.00E-04 2.22E-05 2.22E-05 2.22E-05 2.22E-05 2.22E-05 2.22E-05 2.22E-05 2.22E-05 2.22E-05 2.22E-05 2.22E-05 2.22E-05 2.22E-05 2.22E-05 2.22E-05 2.22E-05 2.22E-05 2.22E-05 GBq Auxiliary Building 4.05E-05 2.3E-06 2.3E-06 2.3E-06 2.3E-06 2.3E-06 2.3E-06 2.3E-06 2.3E-06 2.3E-06 2.3E-06 2.3E-06 2.3E-06 2.3E-06 2.3E-06 2.3E-06 2.3E-06 2.3E-06 2.3E-06 1.50E-03 8.33E-05 8.33E-05 8.33E-05 8.33E-05 8.33E-05 8.33E-05 8.33E-05 8.33E-05 8.33E-05 8.33E-05 8.33E-05 8.33E-05 8.33E-05 8.33E-05 8.33E-05 8.33E-05 8.33E-05 8.33E-05 GBq 5.40E-05* 3.00E-06* 3.00E-06* 3.00E-06* 3.00E-06* 3.00E-06* 3.00E-06* 3.00E-06* 3.00E-06* 3.00E-06* 3.00E-06* 3.00E-06* 3.00E-06* 3.00E-06* 3.00E-06* 3.00E-06* 3.00E-06* 3.00E-06* 3.00E-06* curies GBq Revision 4 0.0E+00 0.0E+00 0.0E+00 0.0E+00 0.0E+00 0.0E+00 0.0E+00 0.0E+00 0.0E+00 0.0E+00 0.0E+00 0.0E+00 0.0E+00 0.0E+00 0.0E+00 0.0E+00 0.0E+00 0.0E+00 0.0E+00 TOTAL UK AP1000 Environment Report Fuel Handling curies NON-RCS MONTHLY CS-137 DISCHARGES IN GAS Containment Building 3.0 Radioactive Waste Management Systems 0.0E+00 0.0E+00 4.16E-04 1.54E-02 8.54E-04 8.54E-04 8.54E-04 8.54E-04 8.54E-04 8.54E-04 8.54E-04 8.54E-04 8.54E-04 8.54E-04 8.54E-04 8.54E-04 8.54E-04 8.54E-04 8.54E-04 8.54E-04 8.54E-04 8.54E-04 GBq curies 0.0E+00 0.0E+00 0.0E+00 0.0E+00 0.0E+00 0.0E+00 0.0E+00 0.0E+00 0.0E+00 0.0E+00 0.0E+00 0.0E+00 0.0E+00 0.0E+00 0.0E+00 0.0E+00 0.0E+00 0.0E+00 2.3E-05 2.3E-05 2.3E-05 2.3E-05 2.3E-05 2.3E-05 2.3E-05 2.3E-05 2.3E-05 2.3E-05 2.3E-05 2.3E-05 2.3E-05 2.3E-05 2.3E-05 2.3E-05 2.3E-05 2.3E-05 curies 0.0E+00 0.0E+00 0.0E+00 0.0E+00 0.0E+00 0.0E+00 0.0E+00 0.0E+00 0.0E+00 0.0E+00 0.0E+00 0.0E+00 0.0E+00 0.0E+00 0.0E+00 0.0E+00 0.0E+00 0.0E+00 GBq Fuel Handling Area Waste Gas System UKP-GW-GL-790 Total 1 2 3 4 5 6 7 8 9 10 11 12 13 14 15 16 17 18 Month RCS Table 3.3-22 133 5.70E-06 3.2E-07 3.2E-07 3.2E-07 3.2E-07 3.2E-07 3.2E-07 3.2E-07 3.2E-07 3.2E-07 3.2E-07 3.2E-07 3.2E-07 3.2E-07 3.2E-07 3.2E-07 3.2E-07 3.2E-07 3.2E-07 curies 2.11E-04 1.17E-05 1.17E-05 1.17E-05 1.17E-05 1.17E-05 1.17E-05 1.17E-05 1.17E-05 1.17E-05 1.17E-05 1.17E-05 1.17E-05 1.17E-05 1.17E-05 1.17E-05 1.17E-05 1.17E-05 1.17E-05 GBq Containment Building NON-RCS curies 7.37E-05 4.1E-06 4.1E-06 4.1E-06 4.1E-06 4.1E-06 4.1E-06 4.1E-06 4.1E-06 4.1E-06 4.1E-06 4.1E-06 4.1E-06 4.1E-06 4.1E-06 4.1E-06 4.1E-06 4.1E-06 4.1E-06 GBq 2.73E-03 1.51E-04 1.51E-04 1.51E-04 1.51E-04 1.51E-04 1.51E-04 1.51E-04 1.51E-04 1.51E-04 1.51E-04 1.51E-04 1.51E-04 1.51E-04 1.51E-04 1.51E-04 1.51E-04 1.51E-04 1.51E-04 4.95E-04 2.75E-05 2.75E-05 2.75E-05 2.75E-05 2.75E-05 2.75E-05 2.75E-05 2.75E-05 2.75E-05 2.75E-05 2.75E-05 2.75E-05 2.75E-05 2.75E-05 2.75E-05 2.75E-05 2.75E-05 2.75E-05 curies Revision 4 1.83E-02 1.02E-03 1.02E-03 1.02E-03 1.02E-03 1.02E-03 1.02E-03 1.02E-03 1.02E-03 1.02E-03 1.02E-03 1.02E-03 1.02E-03 1.02E-03 1.02E-03 1.02E-03 1.02E-03 1.02E-03 1.02E-03 GBq TOTAL UK AP1000 Environment Report Auxiliary Building MONTHLY DISCHARGES OF OTHER PARTICULATES 3.0 Radioactive Waste Management Systems Table 3.3-23 UK AP1000 Environment Report UKP-GW-GL-790 Total Discharges Scaled to 1000 MWe and 1 yr Total Discharges 279 10311 GBq 15466 GBq curies 418 curies /y /y /18 mths /18 mths AP1000 NPP 7692 208 9609 260 /y /y /y /y 134 South Texas 1 561 15 667 18 /y /y /y /y Braidwood 1 12571 340 13025 352 Cook 1 /y /y /y /y 2184 59 2558 69 Vogtle 1 /y /y /y /y 70115 1894 83300 2251 Revision 4 /y /y /y /y Sizewell B COMPARISON OF AP1000 NPP GASEOUS RADIOACTIVE DISCHARGES WITH OTHER NUCLEAR POWER PLANTS 3.0 Radioactive Waste Management Systems Boron dilution near EOL RCS heat up CVS shim bleed (liquid) Equipment leaks Floor drains (dirty wastes) CVS CVS WLS WLS WLS UKP-GW-GL-790 Steam Generator blowdown Waste Description BDS System Table 3.4-1 UK AP1000 Environment Report LLW LLW LLW LLW LLW LLW Waste Class Dilute boric acid Dilute boric acid Diverted reactor coolant/dilute boric acid Borated reactor coolant Borated reactor coolant Secondary-side coolant Physical/ Chemical Description 1,200 90 435 22,440 1,663 18.6 U.S. Gallons 135 4.54 0.34 1.65 85 6 4.22 m3 Normal Daily Volume 5760 14400 776 44,880 6,980 186 U.S. Gallons 21.8 54.5 2.94 170 26 42.24 m3 Maximum Daily Volume 2.66E+07 2.84E+06 1.10E+07 1.08E+06 6.65E+04 5.87E+08 1.01E+05 1.07E+04 4.17E+04 4.08E+03 2.52E+02 2.22E+06 m3 Volume for Life of Plant U.S. Gallons Estimated Quantities Revision 4 0.1% reactor coolant 100% reactor coolant 100% reactor coolant 100% reactor coolant without radiogas 100% reactor coolant Included here as LLW but may be non-radioactive Radioactivity AP1000 NPP ESTIMATED OPERATIONAL LIQUID RADWASTE ARISING FROM SYSTEM OPERATIONS 3.0 Radioactive Waste Management Systems Hand wash/ hot shower Equipment and area decontamination Chemical waste Decontam fluids WLS WLS WLS WLS UKP-GW-GL-790 Samplingsystem drains Waste Description WLS System Table 3.4-1 (cont.) UK AP1000 Environment Report LLW Liquid with decontam chemicals Spent samples containing analytical chemicals Detergent waste LLW LLW Gray water Dilute boric acid Physical/ Chemical Description LLW LLW Waste Class 0.62 7.14 40 200 200 U.S. Gallons 136 0.0023 0.03 0.15 0.76 0.76 m3 Normal Daily Volume 1.24 14.28 400 2000 1000 U.S. Gallons 0.0047 0.05 1.51 7.57 3.79 m3 Maximum Daily Volume 1.63E+04 1.88E+05 2.45E+06 1.23E+07 4.56E+06 6.20E+01 7.10E+02 9.28E+03 4.64E+04 1.73E+04 m3 Volume for Life of Plant U.S. Gallons Estimated Quantities Revision 4 1 µCi/cc (37,000 MBq/m3) ≤ reactor coolant 0.1% reactor coolant 10E-7 µCi/cc (0.037 MBq/m3) 100% reactor coolant Radioactivity AP1000 NPP ESTIMATED OPERATIONAL LIQUID RADWASTE ARISING FROM SYSTEM OPERATIONS 3.0 Radioactive Waste Management Systems – Level Indication Arrangement Alarm Arrangement – Sampling Arrangement UKP-GW-GL-790 – Tank Content Mixing – – – – – m mm 3 Unit Overflow Arrangement Construction Material Design Code Venting Arrangement Volume Each Tank Dimensions Each Tank Parameter Local sample taken on the discharge line outside of containment. The samples are taken to the chemistry lab for analysis. Mixing is not necessary for this tank; however, the tank contents can be recirculated through a sparger located at the bottom of the tank. This will be done when the contents of the tank are too hot for efficient gas removal in the WLS degasifier column. Overflow is through a relief valve. The relief valve discharge is hard piped to the containment sump. Top mounted ultrasonic level instrument. There is a High/High alarm associated with this tank. The alarm indicates that the tank is ready for discharge, which is automatic. The alarm will be displayed in both the MCR and on the local Liquid and Gaseous Radwaste Control Panel. ASME III-3, Unstamped The vent is hard piped to the WGS because the tank gas space will contain hydrogen and trace fission gases. 3.407 (1 tank) Length = 2184 Height = 1600 (horizontal tank) Stainless Steel Reactor Coolant Drain Tank 3.0 Radioactive Waste Management Systems A local grab sample is taken from the recirculation line. The samples are taken to the chemistry lab for analysis. Bottom mounted differential pressure level transmitter. There are three alarms – High/High, High, and Low – associated with these tanks. The High/High alarm indicates that the tank is full and ready for processing. The High alarm warns the operator that the tank is close to full and to be alert. The Low alarm tells the operator that the puma has been shut off. The Low alarm can be cleared once it is acknowledged. The alarms will be displayed in both the MCR and the local Liquid and Gaseous Radwaste Control Panel. The pump suction is taken from the bottom of the tank and returned to the top as quickly as possible to minimize the time needed for mixing. The tank will be mixed prior to sampling. Sampling will be done periodically to determine the effectiveness of gas removal by the degasifier column. ASME III-3, Unstamped The vent contains hydrogen monitoring instrumentation and is hard piped to the VAS. The tank is swept with air on a high hydrogen alarm. The gases are removed from the process stream before entering the tanks. Overflow is hard piped to a WRS floor drain. 106 (3 tanks) L = 11180 H = 4114 (horizontal tank) Stainless Steel Effluent Holdup Tanks There are three alarms – High/High, High, and Low – associated with these tanks. The High/High alarm indicates that the tank is full and ready for processing. The High alarm warns the operator that the tank is close to full and to be alert. The Low alarm tells the operator that the pump has been shut off. The Low alarm can be cleared once it is acknowledged. The alarms will be displayed in both the MCR and the local Liquid and Gaseous Radwaste Control Panel. The pump suction is taken from the bottom of the tank and returned to the top as quickly as possible to minimize the time needed for mixing. The tank will be mixed prior to sampling. Sampling is done prior to discharge for processing to determine if the chemistry of the contents needs to be adjusted to increase the effectiveness of processing. A local grab sample is taken from the recirculation line. The samples are taken to the chemistry lab for analysis. Top mounted ultrasonic level instrument Overflow is hard piped to a WRS floor drain. ASME III-3, Unstamped The tank is vented to the room because the water has been stored at atmospheric pressure prior to entering the tanks, so the gases have come out of solution prior to entering the tanks. Stainless Steel 56.78 (2 tanks) Diameter = 3657 Height = 6273 Waste Holdup Tanks Chemical Waste Tank 137 A local grab sample is taken from the recirculation line. The samples are taken to the chemistry lab for analysis. There are three alarms – High/High, High, and Low – associated with these tanks. The High/High alarm indicates that the tank is full and ready for processing. The High alarm warns the operator that the tank is close to full and to be alert. The Low alarm tells the operator that the pump has been shut off. The Low alarm can be cleared once it is acknowledged. The alarms will be displayed in both the MCR and the local Liquid and Gaseous Radwaste Control Panel. The pump suction is taken from the bottom of the tank and returned to the top as quickly as possible to minimize the time needed for mixing. The tank will be mixed prior to sampling. Sampling is done prior to discharge to determine the appropriate method of processing. Overflow is through a relief valve whose discharge is hard piped to the containment sump. Top mounted ultrasonic level instrument. ASME III-3, Unstamped The tank is vented to the room because the gases have been removed prior to storage in the tank. Stainless Steel 33.69 (1 tank) Diameter = 3657 Height = 3479 AP1000 NPP LIQUID RADWASTE STORAGE TANK INFORMATION Table 3.4-2 Revision 4 A local grab sample is taken from the recirculation line. The samples are taken to the chemistry lab for analysis. There are three alarms – High/High, High, and Low – associated with these tanks. The High/High alarm indicates that the tank is full and ready for discharge. The High alarm warns the operator that the tank is close to full and to be alert. The Low alarm tells the operator that the pump has been shut off. The Low alarm can be cleared once it is acknowledged. The alarms will be displayed in both the MCR and the local Liquid and Gaseous Radwaste Control Panel. The pump suction is taken from the bottom of the tank and returned to the top as quickly as possible to minimize the time needed for mixing. The tank will be mixed prior to sampling. Sampling is done prior to discharge to the environment. Top mounted ultrasonic level instrument. Overflow is hard piped to a WRS floor drain. ASME III-3, Unstamped The tank is vented to the room because the gases have been removed prior to storage in the Monitor Tanks. Stainless Steel 56.78 (6 tanks) Diameter = 3657 Height = 6273 Monitor Tanks UK AP1000 Environment Report m – – – – Dimensions Construction Material Drainage Arrangements Sump Arrangements Leak Detection UKP-GW-GL-790 m3 Unit Volume Parameter The pressure instrument will indicate a low pressure alarm and the tank level will be 0. The water is collected and on High level is pumped to the WLS Waste Holdup tanks at 22.71 m3/hr for processing. The floor drains are routed to theWLS containment sump. Concrete N/A (Containment Shell) N/A (Containment Shell) Table 3.4-3 The tanks have Low level alarms. If the tank level is low and the pump is not running, then the tank has failed. The water is collected and on High level is pumped to the WLS Waste Holdup tanks at 28.39 m3/hr for processing. The floor drains are routed to the auxiliary building sump via the Radwaste Drain System. Concrete/Steel N/A (Auxiliary Building) N/A (Auxiliary Building) Effluent Holdup Tanks Each tank room contains a level instrument to detect the water level in the room. The tank level instrument can be used in association with the room level instrument to determine a tank failure. The floor drains are routed to the auxiliary building sump via the Radwaste Drain System where the water is collected and on High level is pumped to the WLS Waste Holdup Tanks for processing. The floor drains contain valves which are normally closed because the Waste Holdup Tank rooms are designed to be water tight. If necessary, the floor drains can be opened to drain the room. Concrete/Steel N/A (Auxiliary Building) N/A (Auxiliary Building) Waste Holdup Tanks 138 The room contains a level instrument to detect the overflow or failure of the chemical waste tank. Revision 4 The tanks have Low level alarms. If the tank level is low and the pump is not running, then the tank has failed. The water is collected and on High level is pumped to the WLS Waste Holdup tanks at 28.39m3/hr for processing. The floor drains contain valves which are normally closed because the Monitor Tank rooms are designed to be water tight. If necessary, the floor drains can be opened to drain the rooms to the auxiliary building sump via the Radwaste Drain System. The floor drains are normally plugged because the contents of the tank may not be compatible with the normal floor drain wastes or installed demineralisers. The floor drain plugs can be removed to drain the room if necessary. The floor drains are routed to the Auxiliary Building sump via the Radwaste Drain System where the water is collected and on High level is pumped to the WLS Waste Holdup Tanks for processing. Concrete/Steel N/A (Monitor Tank Rooms A & B) Tanks A, B, C located in Monitor Tank Room A Tanks D, E, F located in Monitor Tank Room B Monitor Tanks UK AP1000 Environment Report Concrete/Steel N/A (Auxiliary Building) N/A (Auxiliary Building) Chemical Waste Tank AP1000 NPP LIQUID RADWASTE STORAGE TANK SECONDARY CONTAINMENT INFORMATION Reactor Coolant Drain Tank 3.0 Radioactive Waste Management Systems 3.0 Radioactive Waste Management Systems UK AP1000 Environment Report Table 3.4-4 ASSUMED DECONTAMINATION FACTORS FOR LIQUID RADWASTE ION EXCHANGE BEDS Resin Type / Component Iodine Cs/Rb Other 1 100 1 Cation/waste ion exchanger 1 1 10 10 Mixed/waste ion exchanger 2 100 2(2) 100 Mixed/waste ion exchanger 2 10 10(2) 10(2) Zeolite/deep bed filter (1) Notes: 1. This component is not included in NUREG-0017. DFs are based upon “Reduction of Caesium and Cobalt Activity in Liquid Radwaste Processing Using Clinoptilolite Zeolite at Duke Power Company,” by O.E. Ekechokwu, et al., Proc. Waste Management '92, Tucson, Arizona, March 1992, University of Arizona, Tucson. 2. Credit for this DF is not taken in determination of anticipated annual releases. UKP-GW-GL-790 139 Revision 4 3.0 Radioactive Waste Management Systems UK AP1000 Environment Report Table 3.4-5 BAT COMPARISON OF EVAPORATORS AND ION EXCHANGE FOR THE TREATMENT OF LIQUID RADWASTE Natural Circulation Evaporators Forced Circulation Evaporators Ion Exchange Where Applied for Radwaste Processing Traditionally applied in U.S. PWRs – later replaced in some with ion exchange or forced circulation evaporators Japan, occasionally in U.S. Newer U.S. plants Processing Evaporator removes all solids in waste stream. Concentrates to 12 wt% “slurry” which is drummed or solidified Evaporator removes all solids in waste stream. Concentrates to 12 wt% “slurry” (or higher) which is drummed or solidified Ion exchange process removes activity from fluid. Non-specified solids (e.g., concrete dust, sand) and boric acid pass through to discharge. Effectiveness Acceptable DF 100-500 Good DF 100-1000 Good to excellent with appropriate usage. DF 100 -400 for single vessel, higher for multiple vessels in series. Flexibility Poor – many inputs can upset evaporator (e.g., detergents, oil) Excellent – same process for all inputs Excellent, but requires intelligent control: Capital Cost UKP-GW-GL-790 High – typically provided as custom built skid mounted units Very high – custom design and construction; essentially a complex system unto itself 140 Oils must be segregated because they will ruin resin Most detergents must be segregated Most effective use comes through “tuning” selected resins for prevailing conditions Low – ion exchange vessels only Cost ~50% evaporator Revision 4 3.0 Radioactive Waste Management Systems UK AP1000 Environment Report Table 3.4-5 (cont.) BAT COMPARISON OF EVAPORATORS AND ION EXCHANGE FOR THE TREATMENT OF LIQUID RADWASTE Natural Circulation Evaporators Operating Cost Forced Circulation Evaporators Ion Exchange Moderate – steam/energy Moderate – steam/energy High – resins Safety Excellent Excellent Excellent Reliability Poor – 12 wt% boric acid operation leads to frequent problems Good Excellent Operability Poor – problems with foaming and solidification Good More complex – operator should sample holdup tank contents and select ion exchange resins accordingly Low – equipment – much less equipment and less active equipment to maintain Higher throughput possible reducing potential impact on plant availability Maintainability Very poor – highly radioactive, no room to work Moderate – many components, but adequate space is provided Excellent – only normal maintenance is resin flushing which is remote Occupational Radiation Exposure High Moderate Very low Layout Impact Low – small skid mounted system Very large – sometimes an entire dedicated building Low – 4 exchange vessels, 2 filters Solid Radwaste Production High High (may be lower depending on concentration) Low Estimated waste volumes for 900MWe Plant Resins Filter Cartridges Evaporator Bottoms Chemical Wastes Total 6 0.5 102 1 109.5 Decommissioning Moderate – complex dismantling of highly radioactive equipment High – complex dismantling of large highly radioactive equipment UKP-GW-GL-790 141 m3/y m3/y m3/y m3/y m3/y 9 1 0 1 11 m3/y m3/y m3/y m3/y m3/y Low – simple decontamination and dismantling of resin tanks Revision 4 3.0 Radioactive Waste Management Systems UK AP1000 Environment Report Table 3.4-5 (cont.) BAT COMPARISON OF EVAPORATORS AND ION EXCHANGE FOR THE TREATMENT OF LIQUID RADWASTE Natural Circulation Evaporators Forced Circulation Evaporators Tritium Increased transfer of tritium from water to air. Impact of tritium dose is more significant in air than water. Licensable Traditionally licensable, but not allowed by U.S. utility requirements document Acceptable Ion Exchange Greater proportion of tritium in water than air Acceptable – licensed in U.S. and supported by U.S. utility requirements document Boric acid discharge – must be considered, but probably not an issue for seawater site or enriched boric acid UKP-GW-GL-790 142 Revision 4 3.0 Radioactive Waste Management Systems UK AP1000 Environment Report Table 3.4-6 EXPECTED ANNUAL RELEASE OF RADIOACTIVE EFFLUENT DISCHARGES Activity Release(1) GBq/y Nuclide Shim Bleed + Equip. Drains Miscellaneous Wastes Turbine Building Total Release C-14 3.3E+00(2) negl. negl. 3.3E+00(2) Na-24 3.5E-02 2.3E-04 2.8E-03 3.8E-02 Cl-36 negl. negl. negl. negl. Cr-51 4.5E-02 1.3E-04 2.8E-04 4.6E-02 Mn-54 3.2E-02 7.2E-05 1.4E-04 3.2E-02 Fe-55 4.8E-01 1.1E-03 2.1E-03 4.9E-01 Fe-59 4.9E-03 negl. negl. 5.0E-03 Co-58 4.1E-01 1.0E-03 2.0E-03 4.1E-01 Co-60 2.2E-01 5.0E-04 9.4E-04 2.3E-01 Ni-63 5.3E-01 1.2E-03 2.1E-03 5.4E-01 Zn-65 1.0E-02 negl. 4.5E-05 1.0E-02 Nb-94 negl. negl. negl. negl. W-187 2.8E-03 negl. 1.7E-04 3.0E-03 U-234 negl. negl. negl. negl. U-235 negl. negl. negl. negl. U-238 negl. negl. negl. negl. Np-237 negl. negl. negl. negl. Pu-238 negl. negl. negl. negl. Pu-239 negl. negl. negl. negl. Pu-240 negl. negl. negl. negl. Pu-241 8.0E-05 negl. negl. 8.0E-05 Pu-242 negl. negl. negl. negl. Am-241 negl. negl. negl. negl. Am-243 negl. negl. negl. negl. Cm-242 negl. negl. negl. negl. Cm-244 negl. negl. negl. negl. As-76 negl. negl. negl. negl. UKP-GW-GL-790 143 Revision 4 3.0 Radioactive Waste Management Systems UK AP1000 Environment Report Table 3.4-6 (cont.) EXPECTED ANNUAL RELEASE OF RADIOACTIVE EFFLUENT DISCHARGES Activity Release(1) GBq/y Nuclide Shim Bleed + Equip. Drains Miscellaneous Wastes Turbine Building Total Release Br-82 negl. negl. negl. negl. Rb-86 negl. negl. negl. negl. Rb-88 3.9E-04 negl. negl. 3.9E-04 Sr-89 2.4E-03 negl. negl. 2.4E-03 Sr-90 2.5E-04 negl. negl. 2.5E-04 Y-91 9.0E-05 negl. negl. 9.1E-05 Zr-95 6.8E-03 negl. negl. 6.9E-03 Nb-95 6.1E-03 negl. negl. 6.1E-03 Mo-99 1.9E-02 1.1E-04 5.3E-04 1.9E-02 Tc-99m 1.8E-02 1.1E-04 3.8E-04 1.8E-02 Tc-99 negl. negl. negl. negl. Ru-103 1.2E-01 3.1E-04 6.6E-04 1.2E-01 Ru-106 negl. negl. negl. negl. Ag-110m 2.6E-02 5.8E-05 1.1E-04 2.6E-02 Sn-117m negl. negl. negl. negl. Sb-122 negl. negl. negl. negl. Sb-124 negl. negl. negl. negl. Sb-125 negl. negl. negl. negl. I-129 negl. negl. negl. negl. I-131 1.5E-02 6.3E-05 2.5E-04 1.5E-02 I-132 1.9E-02 9.1E-05 8.5E-04 2.0E-02 I-133 2.6E-02 1.7E-04 2.7E-03 2.9E-02 I-134 5.8E-03 3.9E-05 negl. 5.9E-03 Cs-134 7.5E-03 negl. Negl. 7.6E-03 I-135 2.0E-02 1.3E-04 3.2E-03 2.4E-02 Cs-136 9.2E-03 negl. 8.5E-05 9.3E-03 Cs-137 2.3E-02 5.0E-05 1.1E-04 2.3E-02 Ba-140 1.3E-02 4.6E-05 1.1E-04 1.4E-02 UKP-GW-GL-790 144 Revision 4 3.0 Radioactive Waste Management Systems UK AP1000 Environment Report Table 3.4-6 (cont.) EXPECTED ANNUAL RELEASE OF RADIOACTIVE EFFLUENT DISCHARGES Activity Release(1) GBq/y Nuclide Shim Bleed + Equip. Drains Miscellaneous Wastes Turbine Building Total Release La-140 1.8E-02 6.6E-05 2.0E-04 1.8E-02 Ce-144 7.9E-02 1.8E-04 3.4E-04 8.0E-02 Pr-144 7.9E-02 1.8E-04 3.4E-04 8.0E-02 All Others negl. negl. negl. negl. Total 5.7E+00 6.3E-03 2.1E-02 5.8E+00 (3) Tritium Release in Liquid Effluents (TBq/y) = 33.4 Notes: 1. Values less than 1 microcurie (3.7E+4Bq) are considered to be negligible, but their values are included in the totals 2. C-14 from (Ref. 3-37 3. Tritium Release based on Westinghouse TRICAL computer code UKP-GW-GL-790 145 Revision 4 7852 212.22 Total UKP-GW-GL-790 128 135 144 153 164 177 191 208 229 254 285 326 379 453 564 747 1109 2205 3.46 3.66 3.89 4.14 4.44 4.77 5.17 5.63 6.19 6.87 7.72 8.80 10.24 12.25 15.25 20.19 29.98 59.59 1 2 3 4 5 6 7 8 9 10 11 12 13 14 15 16 17 18 GBq curies Month RCS Table 3.4-7 1141.01 63.39 63.39 63.39 63.39 63.39 63.39 63.39 63.39 63.39 63.39 63.39 63.39 63.39 63.39 63.39 63.39 63.39 63.39 curies 146 NON-RCS 42217 2345 2345 2345 2345 2345 2345 2345 2345 2345 2345 2345 2345 2345 2345 2345 2345 2345 2345 GBq MONTHLY DISCHARGES IN LIQUID, ALL RADIONUCLIDES 3. Radioactive Waste Management Systems 1353.24 66.85 67.05 67.27 67.53 67.82 68.16 68.56 69.02 69.58 70.26 71.11 72.19 73.63 75.64 78.63 83.58 93.37 122.98 curies TOTAL Revision 4 50070 2473 2481 2489 2499 2510 2522 2537 2554 2574 2600 2631 2671 2724 2799 2909 3092 3455 4550 GBq UK AP1000 Environment Report 3.45 3.65 3.88 4.14 4.43 4.77 5.16 5.63 6.18 6.86 7.71 8.79 10.23 12.24 15.23 20.17 29.95 59.52 211.99 1 2 3 4 5 6 7 8 9 10 11 12 13 14 15 16 17 18 Total UKP-GW-GL-790 curies Month RCS 7844 128 135 144 153 164 176 191 208 229 254 265 325 379 453 564 746 1108 2202 GBq 3. Radioactive Waste Management Systems 1141.01 63.39 63.39 63.39 63.39 63.39 63.39 63.39 63.39 63.39 63.39 63.39 63.39 63.39 63.39 63.39 63.39 63.39 63.39 curies 147 NON-RCS 42217 2345 2345 2345 2345 2345 2345 2345 2345 2345 2345 2345 2345 2345 2345 2345 2345 2345 2345 GBq MONTHLY TRITIUM DISCHARGES IN LIQUID Table 3.4-8 1353.00 66.84 67.04 67.27 67.53 67.82 68.16 68.55 69.02 69.57 70.25 71.10 72.18 73.62 75.63 78.62 83.56 93.33 122.91 curies TOTAL Revision 4 50061 2473 2480 2489 2499 2509 2523 2536 2553 2574 2599 2631 2671 2724 2798 2909 3092 3453 4548 GBq UK AP1000 Environment Report 1.4E-01 1.5E-01 1.6E-01 1.7E-01 1.8E-01 1.9E-01 2.1E-01 2.3E-01 2.5E-01 2.8E-01 3.1E-01 3.6E-01 4.2E-01 5.0E-01 6.2E-01 8.2E-01 1.2E+00 2.4E+00 8.7E+00 3.8E-03 4.0E-03 4.3E-03 4.6E-03 4.9E-03 5.3E-03 5.7E-03 6.2E-03 6.8E-03 7.6E-03 8.5E-03 9.7E-03 1.1E-02 1.4E-02 1.7E-02 2.2E-02 3.3E-02 6.6E-02 2.34E-01 1 2 3 4 5 6 7 8 9 10 11 12 13 14 15 16 17 18 Total GBq curies UKP-GW-GL-790 Table 3.4-9 148 11.25E-04 6.2E-05 6.2E-05 6.2E-05 6.2E-05 6.2E-05 6.2E-05 6.2E-05 6.2E-05 6.2E-05 6.2E-05 6.2E-05 6.2E-05 6.2E-05 6.2E-05 6.2E-05 6.2E-05 6.2E-05 6.2E-05 curies NON-RCS 4.16E-02 2.31E-03 2.31E-03 2.31E-03 2.31E-03 2.31E-03 2.31E-03 2.31E-03 2.31E-03 2.31E-03 2.31E-03 2.31E-03 2.31E-03 2.31E-03 2.31E-03 2.31E-03 2.31E-03 2.31E-03 2.31E-03 GBq MONTHLY NON-TRITIUM DISCHARGES IN LIQUID Month RCS 3. Radioactive Waste Management Systems 2.35E-01 3.87E-03 4.10E-03 4.35E-03 4.63E-03 4.95E-03 5.33E-03 5.76E-03 6.27E-03 6.89E-03 7.64E-03 8.57E-03 9.77E-03 1.14E-02 1.36E-02 1.69E-02 2.23E-02 3.31E-02 6.58E-02 curies TOTAL Revision 4 8.70E+00 1.43E-01 1.52E-01 1.61E-01 1.71E-01 1.83E-01 1.97E-01 2.13E-01 2.32E-01 2.55E-01 2.83E-01 3.17E-01 3.61E-01 4.20E-01 5.02E-01 6.24E-01 8.26E-01 1.23E+00 2.43E+00 GBq UK AP1000 Environment Report 5.00E+00 1.35E-01 Total UKP-GW-GL-790 8.13E-02 8.61E-02 9.14E-02 9.75E-02 1.04E-01 1.12E-01 1.22E-01 1.33E-01 1.46E-01 1.62E-01 1.82E-01 2.07E-01 2.41E-01 2.88E-01 3.59E-01 4.75E-01 7.06E-01 1.40E+00 2.2E-03 2.3E-03 2.5E-03 2.6E-03 2.8E-03 3.0E-03 3.3E-03 3.6E-03 3.9E-03 4.4E-03 4.9E-03 5.6E-03 6.5E-03 7.8E-03 9.7E-03 1.3E-02 1.9E-02 3.8E-02 1 2 3 4 5 6 7 8 9 10 11 12 13 14 15 16 17 18 GBq curies Month RCS 3. Radioactive Waste Management Systems 0.00E-00 0.00E-00 0.00E-00 0.00E-00 0.00E-00 0.00E-00 0.00E-00 0.00E-00 0.00E-00 0.00E-00 0.00E-00 0.00E-00 0.00E-00 0.00E-00 0.00E-00 0.00E-00 0.00E-00 0.00E-00 0.00E-00 curies 149 NON-RCS 0.00E-00 0.00E-00 0.00E-00 0.00E-00 0.00E-00 0.00E-00 0.00E-00 0.00E-00 0.00E-00 0.00E-00 0.00E-00 0.00E-00 0.00E-00 0.00E-00 0.00E-00 0.00E-00 0.00E-00 0.00E-00 0.00E-00 GBq MONTHLY C-14 DISCHARGES IN LIQUID Table 3.4-10 1.35E-01 2.20E-03 2.33E-03 2.47E-03 2.63E-03 2.82E-03 3.04E-03 3.29E-03 3.58E-03 3.94E-03 4.37E-03 4.91E-03 5.60E-03 6.52E-03 7.79E-03 9.70E-03 1.28E-02 1.91E-02 3.79E-02 curies TOTAL Revision 4 5.00E+00 8.13E-02 8.61E-02 9.14E-02 9.75E-02 1.04E-01 1.12E-01 1.22E-01 1.33E-01 1.46E-01 1.62E-01 1.82E-01 2.07E-01 2.41E-01 2.88E-01 3.59E-01 4.75E-01 7.06E-01 1.40E+00 GBq UK AP1000 Environment Report 7.22E-01 1.95E-02 Total UKP-GW-GL-790 1.18E-02 1.24E-02 1.32E-02 1.41E-02 1.51E-02 1.62E-02 1.76E-02 1.91E-02 2.10E-02 2.34E-02 2.62E-02 2.99E-02 3.48E-02 4.17E-02 5.18E-02 6.86E-02 1.02E-01 2.03E-01 3.2E-04 3.4E-04 3.6E-04 3.8E-04 4.1E-04 4.4E-04 4.7E-04 5.2E-04 5.7E-04 6.3E-04 7.1E-04 8.1E-04 9.4E-04 1.1E-03 1.4E-03 1.9E-03 2.8E-03 5.5E-03 1 2 3 4 5 6 7 8 9 10 11 12 13 14 15 16 17 18 GBq curies Month RCS 3. Radioactive Waste Management Systems 1.29E-04 7.2E-06 7.2E-06 7.2E-06 7.2E-06 7.2E-06 7.2E-06 7.2E-06 7.2E-06 7.2E-06 7.2E-06 7.2E-06 7.2E-06 7.2E-06 7.2E-06 7.2E-06 7.2E-06 7.2E-06 7.2E-06 curies 150 NON-RCS 4.77E-03 2.65E-04 2.65E-04 2.65E-04 2.65E-04 2.65E-04 2.65E-04 2.65E-04 2.65E-04 2.65E-04 2.65E-04 2.65E-04 2.65E-04 2.65E-04 2.65E-04 2.65E-04 2.65E-04 2.65E-04 2.65E-04 GBq MONTHLY FE-55 DISCHARGES IN LIQUID Table 3.4-11 1.96E-02 3.25E-04 3.43E-04 3.64E-04 3.88E-04 4.15E-04 4.46E-04 4.82E-04 5.25E-04 5.76E-04 6.38E-04 7.16E-04 8.16E-04 9.48E-04 1.13E-03 1.41E-03 1.86E-03 2.76E-03 5.48E-03 curies TOTAL Revision 4 7.26E-01 1.20E-02 1.27E-02 1.35E-02 1.43E-02 1.53E-02 1.65E-02 1.78E-02 1.94E-02 2.13E-02 2.36E-02 2.65E-02 3.02E-02 3.51E-02 4.19E-02 5.21E-02 6.89E-02 1.02E-01 2.03E-01 GBq UK AP1000 Environment Report 2.7E-04 2.8E-04 3.0E-04 3.2E-04 3.4E-04 3.7E-04 4.0E-04 4.4E-04 4.8E-04 5.3E-04 6.0E-04 6.8E-04 8.0E-04 9.5E-04 1.2E-03 1.6E-03 2.3E-03 4.6E-03 1.65E-02 1 2 3 4 5 6 7 8 9 10 11 12 13 14 15 16 17 18 Total UKP-GW-GL-790 curies Month RCS 9.94E-03 1.05E-02 1.12E-02 1.19E-02 1.28E-02 1.37E-02 1.49E-02 1.62E-02 1.78E-02 1.98E-02 2.22E-02 2.53E-02 2.95E-02 3.52E-02 4.39E-02 5.81E-02 8.62E-02 1.71E-01 6.11E-01 GBq 3. Radioactive Waste Management Systems 6.8E-06 6.8E-06 6.8E-06 6.8E-06 6.8E-06 6.8E-06 6.8E-06 6.8E-06 6.8E-06 6.8E-06 6.8E-06 6.8E-06 6.8E-06 6.8E-06 6.8E-06 6.8E-06 6.8E-06 6.8E-06 1.2E-04 curies 151 NON-RCS 2.53E-04 2.53E-04 2.53E-04 2.53E-04 2.53E-04 2.53E-04 2.53E-04 2.53E-04 2.53E-04 2.53E-04 2.53E-04 2.53E-04 2.53E-04 2.53E-04 2.53E-04 2.53E-04 2.53E-04 2.53E-04 4.55E-03 GBq MONTHLY CO-58 DISCHARGES IN LIQUID Table 3.4-12 2.76E-04 2.91E-04 3.09E-04 3.29E-04 3.52E-04 3.78E-04 4.09E-04 4.45E-04 4.88E-04 5.41E-04 6.07E-04 6.91E-04 8.03E-04 9.59E-04 1.19E-03 1.58E-03 2.34E-03 4.64E-03 1.66E-02 curies TOTAL Revision 4 1.02E-02 1.08E-02 1.14E-02 1.22E-02 1.30E-02 1.40E-02 1.51E-02 1.65E-02 1.81E-02 2.00E-02 2.24E-02 2.56E-02 2.97E-02 3.55E-02 4.41E-02 5.83E-02 8.65E-02 1.72E-01 6.15E-01 GBq UK AP1000 Environment Report 3.39E-01 9.15E-03 Total UKP-GW-GL-790 5.51E-03 5.84E-03 6.20E-03 6.61E-03 7.08E-03 7.62E-03 8.24E-03 8.99E-03 9.87E-03 1.10E-02 1.23E-02 1.40E-02 1.63E-02 1.95E-02 2.43E-02 3.22E-02 4.78E-02 9.51E-02 1.5E-04 1.6E-04 1.7E-04 1.8E-04 1.9E-04 2.1E-04 2.2E-04 2.4E-04 2.7E-04 3.0E-04 3.3E-04 3.8E-04 4.4E-04 5.3E-04 6.6E-04 8.7E-04 1.3E-03 2.6E-03 1 2 3 4 5 6 7 8 9 10 11 12 13 14 15 16 17 18 GBq curies Month RCS 3. Radioactive Waste Management Systems 5.9E-05 3.3E-06 3.3E-06 3.3E-06 3.3E-06 3.3E-06 3.3E-06 3.3E-06 3.3E-06 3.3E-06 3.3E-06 3.3E-06 3.3E-06 3.3E-06 3.3E-06 3.3E-06 3.3E-06 3.3E-06 3.3E-06 curies 152 NON-RCS 2.16E-03 1.2E-04 1.2E-04 1.2E-04 1.2E-04 1.2E-04 1.2E-04 1.2E-04 1.2E-04 1.2E-04 1.2E-04 1.2E-04 1.2E-04 1.2E-04 1.2E-04 1.2E-04 1.2E-04 1.2E-04 1.2E-04 GBq MONTHLY CO-60 DISCHARGES IN LIQUID Table 3.4-13 9.21E-03 1.52E-04 1.61E-04 1.71E-04 1.82E-04 1.94E-04 2.09E-04 2.26E-04 2.46E-04 2.70E-04 2.99E-04 3.36E-04 3.83E-04 4.45E-04 5.31E-04 6.61E-04 8.74E-04 1.30E-03 2.57E-03 curies TOTAL Revision 4 3.41E-01 5.63E-03 5.96E-03 6.32E-03 6.73E-03 7.20E-03 7.74E-03 8.36E-03 9.11E-03 9.99E-03 1.11E-02 1.24E-02 1.42E-02 1.65E-02 1.97E-02 2.44E-02 3.23E-02 4.79E-02 9.52E-02 GBq UK AP1000 Environment Report 7.77E-01 2.10E-02 Total UKP-GW-GL-790 1.27E-02 1.34E-02 1.42E-02 1.52E-02 1.62E-02 1.75E-02 1.89E-02 2.06E-02 2.27E-02 2.51E-02 2.82E-02 3.22E-02 3.75E-02 4.49E-02 5.58E-02 7.39E-02 1.10E-01 2.18E-01 3.4E-04 3.6E-04 3.8E-04 4.1E-04 4.4E-04 4.7E-04 5.1E-04 5.6E-04 6.1E-04 6.8E-04 7.6E-04 8.7E-04 1.0E-03 1.2E-03 1.5E-03 2.0E-03 3.0E-03 5.9E-03 1 2 3 4 5 6 7 8 9 10 11 12 13 14 15 16 17 18 GBq curies Month RCS 3. Radioactive Waste Management Systems 1.4E-04 7.5E-06 7.5E-06 7.5E-06 7.5E-06 7.5E-06 7.5E-06 7.5E-06 7.5E-06 7.5E-06 7.5E-06 7.5E-06 7.5E-06 7.5E-06 7.5E-06 7.5E-06 7.5E-06 7.5E-06 7.5E-06 curies 153 NON-RCS 5.00E-03 2.78E-04 2.78E-04 2.78E-04 2.78E-04 2.78E-04 2.78E-04 2.78E-04 2.78E-04 2.78E-04 2.78E-04 2.78E-04 2.78E-04 2.78E-04 2.78E-04 2.78E-04 2.78E-04 2.78E-04 2.78E-04 GBq MONTHLY NI-63 DISCHARGES IN LIQUID Table 3.4-14 1.35E-04* 3.50E-04 3.69E-04 3.92E-04 4.17E-04 4.46E-04 4.80E-04 5.19E-04 5.65E-04 6.20E-04 6.87E-04 7.71E-04 8.78E-04 1.02E-03 1.22E-03 1.52E-03 2.01E-03 2.97E-03 5.90E-03 curies TOTAL Revision 4 0.00E+00 1.29E-02 1.37E-02 1.45E-02 1.54E-02 1.65E-02 1.78E-02 1.92E-02 2.09E-02 2.29E-02 2.54E-02 2.85E-02 3.25E-02 3.78E-02 4.51E-02 5.61E-02 7.42E-02 1.10E-01 2.18E-01 GBq UK AP1000 Environment Report 3.66E-04 9.90E-06 Total UKP-GW-GL-790 5.97E-06 6.31E-06 6.71E-06 7.15E-06 7.66E-06 8.24E-06 8.92E-06 9.72E-06 1.07E-05 1.19E-05 1.33E-05 1.52E-05 1.77E-05 2.11E-05 2.63E-05 3.48E-05 5.17E-05 1.03E-04 1.6E-07 1.7E-07 1.8E-07 1.9E-07 2.1E-07 2.2E-07 2.4E-07 2.6E-07 2.9E-07 3.2E-07 3.6E-07 4.1E-07 4.8E-07 5.7E-07 7.1E-07 9.4E-07 1.4E-06 2.8E-06 1 2 3 4 5 6 7 8 9 10 11 12 13 14 15 16 17 18 GBq curies Month RCS 3. Radioactive Waste Management Systems 0.0E+00 0.0E+00 0.0E+00 0.0E+00 0.0E+00 0.0E+00 0.0E+00 0.0E+00 0.0E+00 0.0E+00 0.0E+00 0.0E+00 0.0E+00 0.0E+00 0.0E+00 0.0E+00 0.0E+00 0.0E+00 0.0E+00 curies 154 NON-RCS 0.0E+00 0.0E+00 0.0E+00 0.0E+00 0.0E+00 0.0E+00 0.0E+00 0.0E+00 0.0E+00 0.0E+00 0.0E+00 0.0E+00 0.0E+00 0.0E+00 0.0E+00 0.0E+00 0.0E+00 0.0E+00 0.0E+00 GBq MONTHLY SR-90 DISCHARGES IN LIQUID Table 3.4-15 1.00E-05 1.61E-07 1.71E-07 1.81E-07 1.93E-07 2.07E-07 2.23E-07 2.41E-07 2.63E-07 2.89E-07 3.20E-07 3.60E-07 4.11E-07 4.78E-07 5.72E-07 7.11E-07 9.42E-07 1.40E-06 2.78E-06 curies TOTAL Revision 4 3.66E-04 1.61E-07 1.71E-07 1.81E-07 1.93E-07 2.07E-07 2.23E-07 2.41E-07 2.63E-07 2.89E-07 3.20E-07 3.60E-07 4.11E-07 4.78E-07 5.72E-07 7.11E-07 9.42E-07 1.40E-06 2.78E-06 GBq UK AP1000 Environment Report 1.5E-05 1.6E-05 1.7E-05 1.8E-05 1.9E-05 2.1E-05 2.2E-05 2.4E-05 2.7E-05 3.0E-05 3.3E-05 3.8E-05 4.4E-05 5.3E-05 6.6E-05 8.7E-05 1.3E-04 2.6E-04 9.15E-04 1 2 3 4 5 6 7 8 9 10 11 12 13 14 15 16 17 18 Total UKP-GW-GL-790 curies Month RCS Table 3.4-16 3.6E-07 3.6E-07 3.6E-07 3.6E-07 3.6E-07 3.6E-07 3.6E-07 3.6E-07 3.6E-07 3.6E-07 3.6E-07 3.6E-07 3.6E-07 3.6E-07 3.6E-07 3.6E-07 3.6E-07 3.6E-07 6.5E-06 curies 155 NON-RCS 1.33E-05 1.33E-05 1.33E-05 1.33E-05 1.33E-05 1.33E-05 1.33E-05 1.33E-05 1.33E-05 1.33E-05 1.33E-05 1.33E-05 1.33E-05 1.33E-05 1.33E-05 1.33E-05 1.33E-05 1.33E-05 2.26E-04 GBq MONTHLY CS-137 DISCHARGES IN LIQUID 5.51E-04 5.84E-04 6.20E-04 6.61E-04 7.08E-04 7.62E-04 8.24E-04 8.99E-04 9.87E-04 1.10E-03 1.23E-03 1.40E-03 1.63E-03 1.95E-03 2.43E-03 3.22E-03 4.78E-03 9.51E-03 3.39E-02 GBq 3. Radioactive Waste Management Systems 1.53E-05 1.61E-05 1.71E-05 1.82E-05 1.95E-05 2.09E-05 2.26E-05 2.46E-05 2.70E-05 3.00E-05 3.36E-05 3.83E-05 4.45E-05 5.32E-05 6.61E-05 8.74E-05 1.30E-04 2.57E-04 6.45E-06* curies TOTAL Revision 4 5.65E-04 5.97E-04 6.33E-04 6.74E-04 7.21E-04 7.75E-04 8.38E-04 9.12E-04 1.00E-03 1.11E-03 1.24E-03 1.42E-03 1.65E-03 1.97E-03 2.45E-03 3.23E-03 4.80E-03 9.52E-03 0.00E+00 GBq UK AP1000 Environment Report 3.30E-06 Total UKP-GW-GL-790 5.4E-08 5.7E-08 6.0E-08 6.4E-08 6.9E-08 7.4E-08 8.0E-08 8.8E-08 9.6E-08 1.1E-07 1.2E-07 1.4E-07 1.6E-07 1.9E-07 2.4E-07 3.1E-07 4.7E-07 9.3E-07 curies 1 2 3 4 5 6 7 8 9 10 11 12 13 14 15 16 17 18 Month RCS 1.22E-04 1.99E-06 2.10E-06 2.24E-06 2.38E-06 2.55E-06 2.75E-06 2.97E-06 3.24E-06 3.56E-06 3.95E-06 4.44E-06 5.06E-06 5.89E-06 7.05E-06 8.77E-06 1.16E-05 1.72E-05 3.43E-05 GBq 3. Radioactive Waste Management Systems 156 0.00E+00 0.0E+00 0.0E+00 0.0E+00 0.0E+00 0.0E+00 0.0E+00 0.0E+00 0.0E+00 0.0E+00 0.0E+00 0.0E+00 0.0E+00 0.0E+00 0.0E+00 0.0E+00 0.0E+00 0.0E+00 0.0E+00 curies NON-RCS 0.00E+00 0.0E+00 0.0E+00 0.0E+00 0.0E+00 0.0E+00 0.0E+00 0.0E+00 0.0E+00 0.0E+00 0.0E+00 0.0E+00 0.0E+00 0.0E+00 0.0E+00 0.0E+00 0.0E+00 0.0E+00 0.0E+00 GBq MONTHLY PU-241 DISCHARGES IN LIQUID Table 3.4-17 3.30E-06 5.37E-08 5.69E-08 6.04E-08 6.44E-08 6.90E-08 7.42E-08 8.04E-08 8.76E-08 9.62E-08 1.07E-07 1.20E-07 1.37E-07 1.59E-07 1.91E-07 2.37E-07 3.14E-07 4.66E-07 9.27E-07 curies TOTAL Revision 4 1.22E-04 1.99E-06 2.10E-06 2.24E-06 2.38E-06 2.55E-06 2.75E-06 2.97E-06 3.24E-06 3.56E-06 3.95E-06 4.44E-06 5.06E-06 5.89E-06 7.05E-06 8.77E-06 1.16E-05 1.72E-05 3.43E-05 GBq UK AP1000 Environment Report 9.2E-01 2.49E-02 Total UKP-GW-GL-790 1.5E-02 1.6E-02 1.7E-02 1.8E-02 1.9E-02 2.1E-02 2.2E-02 2.4E-02 2.7E-02 3.0E-02 3.3E-02 3.8E-02 4.4E-02 5.3E-02 6.6E-02 8.8E-02 1.3E-01 2.6E-01 4.1E-04 4.3E-04 4.6E-04 4.9E-04 5.2E-04 5.6E-04 6.1E-04 6.6E-04 7.3E-04 8.1E-04 9.1E-04 1.0E-03 1.2E-03 1.4E-03 1.8E-03 2.4E-03 3.5E-03 7.0E-03 1 2 3 4 5 6 7 8 9 10 11 12 13 14 15 16 17 18 GBq curies Month RCS Table 3.4-18 6.15E-04 3.4E-05 3.4E-05 3.4E-05 3.4E-05 3.4E-05 3.4E-05 3.4E-05 3.4E-05 3.4E-05 3.4E-05 3.4E-05 3.4E-05 3.4E-05 3.4E-05 3.4E-05 3.4E-05 3.4E-05 3.4E-05 curies 157 NON-RCS 2.28E-02 1.26E-03 1.26E-03 1.26E-03 1.26E-03 1.26E-03 1.26E-03 1.26E-03 1.26E-03 1.26E-03 1.26E-03 1.26E-03 1.26E-03 1.26E-03 1.26E-03 1.26E-03 1.26E-03 1.26E-03 1.26E-03 GBq MONTHLY OTHER PARTICULATE DISCHARGES IN LIQUID 3. Radioactive Waste Management Systems 2.55E-02 4.40E-04 4.63E-04 4.90E-04 5.20E-04 5.55E-04 5.94E-04 6.40E-04 6.95E-04 7.60E-04 8.40E-04 9.39E-04 1.07E-03 1.24E-03 1.47E-03 1.82E-03 2.40E-03 3.55E-03 7.03E-03 curies TOTAL Revision 4 9.44E-01 1.63E-02 1.71E-02 1.81E-02 1.92E-02 2.05E-02 2.20E-02 2.37E-02 2.57E-02 2.81E-02 3.11E-02 3.48E-02 3.95E-02 4.57E-02 5.45E-02 6.74E-02 8.89E-02 1.31E-01 2.60E-01 GBq UK AP1000 Environment Report Table 3.4-19 UK AP1000 Environment Report 30.5 TBq/GWa TBq/GWa TBq/GWa Minimum Average Maximum Table 3.4-20 45.9 36.1 17.9 1 Sizewell B 45.9 16.2 0.02 73 All PWR 463 357.15 88 30 All Magnox & AGR 1.92 0.83 0.34 10 All BWR 1.1 GBq/GWa GBq/GWa GBq/GWa Minimum Average Maximum 28 21.8 16 1 Sizewell B 61 4.9 0 73 All PWR 28 12.2 2 30 All Magnox & AGR 599 65.5 0 10 All BWR UKP-GW-GL-790 158 Revision 4 Note: Data in Tables 3.4-19 and 3.4-20 for other nuclear plants extracted from measured data reported in “Implementation of PARCOM Recommendation 91/4 on Radioactive Discharges,” OSPAR Commission 2003 (Reference 3-10). AP1000 NPP data based upon estimated monthly discharge calculations. 3.5 2.4 0 AP1000 NPP No. Plants Unit COMPARISON OF AP1000 NPP LIQUID RADIOACTIVE DISCHARGES OF RADIONUCLIDES OTHER THAN TRITIUM WITH EUROPEAN NUCLEAR POWER PLANTS BETWEEN 1995 AND 1998 35.1 33.4 0 AP1000 NPP No. Plants Unit COMPARISON OF AP1000 NPP LIQUID RADIOACTIVE DISCHARGES OF TRITIUM WITH EUROPEAN NUCLEAR POWER PLANTS BETWEEN 1995 AND 1998 3.0 Radioactive Waste Management Systems Table 3.4-21 UK AP1000 Environment Report UKP-GW-GL-790 Total Discharges Scaled to 1000 MWe and 1 yr Total Discharges 902 33374 GBq 50061 GBq curies 1353 curies /y /y /18 mths /18 mths AP1000 NPP 46331 1252 57949 1566 /y /y /y /y 159 South Texas 1 49094 1327 58278 1575 /y /y /y /y Braidwood 1 44500 1203 46103 1246 Cook 1 /y /y /y /y 40450 1093 47289 1278 Vogtle 1 /y /y /y /y 50503 1365 60000 1622 Revision 4 /y /y /y /y Sizewell B COMPARISON OF AP1000 NPP LIQUID RADIOACTIVE DISCHARGES WITH OTHER NUCLEAR POWER PLANTS 3.0 Radioactive Waste Management Systems HLW ILW ILW ILW ILW ILW LLW LLW LLW LLW LLW LLW LLW LLW LLW Ion exchange resin Gray rod cluster Control Rod Cluster Wet granular carbon Filter cartridge – metallic cylinder Compactable paper, tape, clothing, plastic, elastomers Non-compactable metallic items, glass, wood HVAC filter – uncompacted fibreglass/metal Condensate Polisher spent resin Dry granular carbon HVAC filter – granulated charcoal Compressible rigid plastic – gaskets, valve packing, insulation Electrodeionisation Unit – resin/membrane module Heat exchanger insulation Radioactive Waste Classification Spent fuel rods Description of Waste UKP-GW-GL-790 Table 3.5-1 160 Once/60 yr Once/12 yr Various Once/10 yr Annual Annual Various Annual Annual Annual Annual Once/20 yr Once/20 yr Annual 40%/18 months Frequency 8.4 1.7 4.9 0.3 3.9 6.6 135 0.2 0.6 5.6 1.7 7.8 13.7 Normal Volume per Unit Frequency (m3) 3.3 7.7 10.6 206 0.4 1.1 15.6 Maximum Volume per Unit Frequency (m3) Revision 4 8.4 10.8 7.6 29.1 54.3 69.3 761 455 8924 13.7 41 16.9 5.1 561 549 Volume per Life of Plant (m3) UK AP1000 Environment Report SUMMARY OF MAIN SOLID RADIOACTIVE WASTE PRODUCED BY THE AP1000 NPP 3.0 Radioactive Waste Management Systems LLW LLW LLW LLW LLW LLW LLW Wet granular particles – sludge Waste Oil Mechanical pump seal – SiC Pump diaphragms – Buna n Degasifier Separator – canned pump Resin transfer screw pump Radioactive Waste Classification Filter – pleated polyester Description of Waste UKP-GW-GL-790 Table 3.5-1 (cont.) 161 Once/10 yr Once/60 yr 0.003 0.06 0.04 0.05 Once/5 yr to Once/30 yr Once/5 yr 0.15 0.03 0.1 Once/5 y Annual Annual Frequency Normal Volume per Unit Frequency (m3) 0.1 Maximum Volume per Unit Frequency (m3) Revision 4 0.02 0.06 0.47 0.58 1.8 2.4 5 Volume per Life of Plant (m3) UK AP1000 Environment Report SUMMARY OF MAIN SOLID RADIOACTIVE WASTE PRODUCED BY THE AP1000 NPP 3.0 Radioactive Waste Management Systems 161.85 13.75 175.6 LLW nonmaintenance LLW maintenance LLW Total 82.58 23.38(9) 13.68(5) (9) 72.73 59.2 41.8 40.86(3) 59.05(4) Internal Packaged Waste Volume(2) m3/y Treated Waste Volume m3/y or 234(8) (9) or 12(5) (9) or HHISO UKP-GW-GL-790 162 Revision 4 9. This is based on one HEPA filter per 200L drum. This gives a filter loading of 57% and hence a void space of 43% of the drum. This volume could be reduced by packaging other LLW in the same drum as the HEPA filters and thus reducing the void space per drum. Also, compaction may be used to reduce volume. Utility operators may adopt techniques and develop procedures to improve packaging efficiencies. 8. Based on HHISO external volume of 19.5m3 108.6(7) (9) 68.9(6) Volume of Containers m3/y 413(5) (9) 19 No. of Waste Containers No./y UK AP1000 Environment Report 200 litre drums RWMD 3m3 drums or boxes Container Type 7. Based on 200l drum with external dimensions 0.615m diam (with lid clamp fitted) x 0.886m high 6. Based on RWMD box with external dimensions 1.72m x 1.72m x 1.225m 5. Each HHISO container holds thirty-nine 200 litre drums 4. Volume following compaction 3. Volume following encapsulation 2. Treated waste volume + void space associated with partially filled containers Note: 1. Reference 3-26 10.26 Raw Waste Volume m3/y ILW Total Waste Classification Table 3.5-2 ANNUAL AVERAGE SOLID RADWASTE PRODUCTION(1) 3.0 Radioactive Waste Management Systems 1.26E-03 3.0E-03 2.8E-04 3.6E-01 5.4E-03 9.4E-04 4.8E-04 3.2E-04 Pu-238 Pu-239 Pu-240 Pu-241 Am-241 Cm-242 Cm-243 Cm-244 5.37E-06 8.05E-06 1.58E-05 9.05E-05 6.04E-03 4.69E-06 5.03E-05 2.11E-05 Activity(1) (GBq/y) UK AP1000 Environment Report UKP-GW-GL-790 163 Revision 4 Note: 1. Activity assumes 16.767 tonnes/y of dry active solid waste is produced. These numbers are conservative estimates, because fuel performance is improving; the above values assume previous fuel designs, not the RFA fuel design. Activity (Bq/g) ACTINIDES IN DRY ACTIVE SOLID RADWASTE Table 3.5-3 Actinide 3.0 Radioactive Waste Management Systems 3.0 Radioactive Waste Management Systems UK AP1000 Environment Report Table 3.5-4 COLOUR CODING REPRESENTATIONS FOR INITIAL SCREENING OF RADWASTE TREATMENT OPTIONS Colour Representations Colour Coding Waste/Process Compatibility Technology Availability Red No Scale 1 or Scale 2 Amber – Scale 3 Green Yes Scale 4 or Scale 5 UKP-GW-GL-790 164 Revision 4 3.0 Radioactive Waste Management Systems UK AP1000 Environment Report Table 3.5-5 INITIAL RADWASTE TREATMENT OPTION SCREENING RESULTS (REFERENCE 3-16) Prevent/Reduce Segregate Y n/a Y n/a Y n/a Y n/a Y Y Mixed LLW ILW Metal Scrap ILW Filters ILW Charcoal Processing Option ILW Resins (organic) ILW Resins (inorganic) Process/Waste Compatibility Y Y Technology Availability ILW 5 5 LLW 5 Comments Essential component in waste management strategy. To be performed at source of waste. Partial solution – waste consigned to radwaste requires further treatment. 5 Assumptions are: 1 Sorting of mixed LLW waste allows for selection of the appropriate treatment(s) for constituent waste streams, 2 Charcoal and resin streams will be treated via the same processes; therefore, segregation is not required other than dewatering – covered later. Store as Raw Waste Solids n/a n/a n/a Y Y Y 5 5 Unacceptable for disposal. However, may be contingency option if CFA cannot be determined. Solid/liquid mixture Y Y Y n/a n/a n/a 5 5 As for solids above. N N Y Y Y 5 5 Partial solution only – require further treatment. 5 Final treatment for LLW. ILW would require overpacking. It is a potential viable process for hollow items (e.g., tubes, canisters, but not for valves and solid items). Volume/Size Reduction Size Reduction Compaction/ supercompaction UKP-GW-GL-790 N Y Y Y Y Y/ N Y 165 5 Revision 4 3.0 Radioactive Waste Management Systems UK AP1000 Environment Report Table 3.5-5 (cont.) INITIAL RADWASTE TREATMENT OPTION SCREENING RESULTS (REFERENCE 3-16) ILW Metal Scrap Mixed LLW Drying Y Y Y N N N 5 n/a Evaporation N N N N N N 5 5 Dewatering (Settling/Decanting) Y Y Y N N N 5 n/a Partial solution only – require further treatment. Filtration Y Y Y N N N 5 n/a Partial solution only – require further treatment. Decontamination N N N Y Y Y 5 5 Partial solution – creates secondary wastes, requires further treatment. Partial solution – requires further treatment. For metal wastes, it is limited to swabbing to remove surface water dependent on downstream process selection. Processing Option ILW Resins (organic) ILW Resins (inorganic) ILW Filters Technology Availability ILW Charcoal Process/Waste Compatibility ILW LLW Comments Non-destructive Treatment Partial solution only – require further treatment. Applicable to liquid wastes only. Absorption Y Y Y Y Y N 5 n/a Direct Immobilisation Y Y Y Y Y Y 5 5 May require pre-treatment to passivate organics. 5 Partial solution passivates waste – requires further treatment to immobilise. No known applications for ILW resins. 3 Partial solution – requires further treatment to immobilise. Could be used on inorganic IX resin; however, provides no benefit. No UK applications, several in U.S. and Europe. Destructive Treatment Conventional Incineration Controlled Oxidation UKP-GW-GL-790 Y Y Y N Y Y Y Y N N Y Y 166 2 3 Revision 4 3.0 Radioactive Waste Management Systems UK AP1000 Environment Report Table 3.5-5 (cont.) INITIAL RADWASTE TREATMENT OPTION SCREENING RESULTS (REFERENCE 3-16) Mixed LLW ILW Metal Scrap ILW Filters ILW Charcoal Processing Option ILW Resins (organic) ILW Resins (inorganic) Process/Waste Compatibility Technology Availability ILW LLW Comments Vitrification Y Y Y N N Y 4 2 Single UK application on liquid HLW, several applications worldwide including other wastes, limited use for LLW. Synroc Y Y Y N N Y 2 2 Developed for liquid HLW, mainly used for High Pu military wastes. No UK application. Either with frit to form of glass or without – without requires further treatment of ash (i.e., encapsulation). No full scale nuclear application UK or elsewhere. Plasma Arc Y Y Y Y Y Y 2 2 GeoMelt N Y N N N N 2 n/a Only known applications are in the ground and non-UK. Partial solution only – requires further treatment. Emergent technology – lab scale only. Molten-salt Oxidation Y Y Y N N Y 2 2 Wet Oxidation Y N Y N N N 4 n/a One UK licensed mobile plant. Partial solution only – requires further treatment. *Note that ILW resins (organic and inorganic) and ILW charcoal will be treated via the same waste stream. UKP-GW-GL-790 167 Revision 4 UKP-GW-GL-790 Maintainability Operability/ Availability Technology Criterion Table 3.5-6 4 4 Weight technology although a moderate amount of work is anticipated in ensuring its application to this project. applications overseas. Potentially viable for UK use; however, significant effort anticipated to secure UK licensing. deployment either in UK or elsewhere, although pilot scale plants may exist. Major effort needed to develop to a lowest potential for outages, highest overall availability. potential for outages, high overall availability. moderate potential for outages, moderate overall availability. potential for outages, low overall availability. highest potential for outages, lowest overall availability. 168 Lowest complexity, Low complexity, low Moderately complex, licensing. anticipated with UK little/no problems documented process - in UK industry. Well Highly complex, high licence position. and to establish UK deployable condition currently. Licensable industrial/commercial evidence of full scale availability. Revision 4 with plant availability as distinct from technology periods reducing the overall availability. Concerned steps will increase the likelihood of maintenance engineered plant or one with a large number of process complexity of the envisaged plant a complex heavily option this will be based on a view of the scope and and maintainability. At the stage of development of the An assessment of the inherent availability, reliability implementation time attribute. development work is addressed under the technical confidence. The time to undertake be used as a measure. This attribute is focused on tool such as the Technology Evolution Index (TEI) can will it work?) or developed (how well will it work?). A earned where the technology remains to be proven (i.e. its successful implementation. A low score will be development required to underpin an option and enable option will be successful and therefore the amount of limited examples exist deployment in nuclear feasibility. Little/no technology application considered and reflects the uncertainty of whether the deployment although technology This assesses the maturity of the technology being underpin its Many examples of 5 Evidence of UK 4 Evidence of 3 development to significant amount of has undergone a Novel concept which 2 Highest complexity, UK licence position. anticipated to bring to development work fundamental Considerable application. industrial/commercial evidence of nuclear unproven concept. No completely novel and Essentially a 1 Score Description UK AP1000 Environment Report MAPPING OF SCORING REQUIREMENTS AGAINST BAT CRITERIA (REFERENCE 3-16) 3.0 Radioactive Waste Management Systems Technical UKP-GW-GL-790 radiological) Hazard Potential (Non- (Radiological) Hazard Potential Dose Uptake Criterion Table 3.5-6 (cont.) 3 4 4 Weight reliance on managerial control & protective measures on managerial control and protective measures. managerial control and protective measures. 169 scenarios. Moderate Significant reliance potential accident reliance on scenarios. consequence potential accident potential accident scenarios. Heavy or medium high consequence consequence measures. and protective managerial control Some reliance on Low consequence. accident scenarios. Low no. of potential measures or managerial/supervisory control. decommissioning. Revision 4 Considers construction, operation, and than one that places heavy reliance on protection scenarios. option that is inherently safe will score more highly height, confined space, moving machinery, etc.). An of conventional safety hazards (temperature pressure, A measure of the option's performance in management engineered protection). more highly than one that places heavy reliance on potential accident Very low no. of Inherently safe. Mitigate, Protect – passive means, Protect – active protection. protection. Medium number of Hazard Management Hierarchy of Eliminate, Prevent, consequence. Minimal engineered engineered means (i.e., an option that is inherently safe will score for management of radiological hazards against the scenarios. Very low consequence. reliance on national risk criteria. It reflects the option's potential potential accident design out. Low scenarios. Some confidence that hazards can be managed to achieve Very low no. of foreseeable accident scenarios of each option and the mostly easy to High noumber of or protection. engineered reliance on active to design out. Heavy scenarios. Difficult potential accident high consequence (frequency and consequence) from reasonably To address the radiological hazard potential function of the scope and complexity of the process. episodes. At a conceptual stage, it will be judged as a with the frequency and occupancy of maintenance potential accident uptake. uptake. uptake. uptake. However, the potential for dose uptake will increase Inherently safe. non-routine dose non-routine dose for non-routine dose non-routine dose then will be designed to stay within target levels. accident scenarios – potential for potential for Moderate potential Highest potential for intervention for maintenance during breakdowns and consequence of on activities. Lowest on activities. Low hands on activities. on activities. will be most likely to occur during periods of manual Low no. of potential outages, and hands outages, and hands for outages, and outages, and hands discriminator. The potential for radiation exposure routine dose uptake is not likely to be a major As a new facility built to modern plant standards, Medium no./ lowest potential for low potential for moderate potential high potential for High noumber of or Lowest complexity, 5 Low complexity, 4 Moderately complex, 3 Highly complex, 2 High no. of high protection. engineered reliance on active out. Very heavy difficult to design scenarios. Very potential accident consequence High no. of high dose uptake. for non-routine Highest potential hands on activities. for outages, and highest potential complexity, Highest 1 Score Description UK AP1000 Environment Report MAPPING OF SCORING REQUIREMENTS AGAINST BAT CRITERIA (REFERENCE 3-16) 3.0 Radioactive Waste Management Systems Safety UKP-GW-GL-790 Planning Issues 2 envisaged. delays to consent inquiry. Long probability of Very high generated. gaseous) (solid, liquid, Management and/or problematic secondary/subsidiary process route. secondary/subsidiary process route. inquiry. 170 of inquiry. Moderate probability generated requiring a generated requiring a High probability of of secondary wastes of secondary wastes volumes. in Primary waste Significant amounts volumes. waste volumes. reduction or increase No or insignificant 3 Score Significant amounts in Primary waste increase in Primary Considerable Significant increase 2 Considerable 1 secondary wastes 4 5 Weight Secondary Waste Management Primary Waste Criterion Table 3.5-6 (cont.) inquiry. Low probability of route. subsidiary process a secondary/ generated requiring of secondary wastes incinerators. Revision 4 and is particularly relevant to options such as consent envisaged. planning issues (e.g., with respect to public inquiry) This reflects the probability of delays through (e.g., washdown that are common to all options). or other media). Does not consider generic effluents including new liabilities and consumables (e.g., filters wastes to be taken as including S.L.G. waste streams the management of secondary wastes. Secondary A measure of the option’s potential performance in Water:solids taken as ~ 1:1 (volume). crossing the system boundary into radwaste treatment. classed as the combined volume of resin and water ordinary delays to of inquiry. No extra Very low probability process proposed. of the specific generated as a result secondary wastes Minimal to no generation through the treatment process. For the Moderate amounts on reduction or conversely additional waste waste volumes volumes. purposes of the scoring exercise. Primary waste is that prevention occurs at source and therefore focuses reduction in Primary in Primary waste Reuse, Recycle, Recover, Dispose whilst recognising Management Hierarchy Principles of Prevent, Reduce, the management of primary wastes. Considers Waste A measure of the option’s potential performance in Considerable 5 Significant reduction 4 Description UK AP1000 Environment Report MAPPING OF SCORING REQUIREMENTS AGAINST BAT CRITERIA (REFERENCE 3-16) 3.0 Radioactive Waste Management Systems Environmental UKP-GW-GL-790 Implementation Time Resource Usage Product Quality Criterion Table 3.5-6 (cont.) 2 1 5 Weight beyond deadline. submission is well standard for GDA appropriate design to Time to develop demand relative to the GDA deadline is used as the benchmark instead. within deadline. deadline. deadline. deadline. Revision 4 reactor plant. Therefore, the time to submit designs submission is well submission is within submission is on submission is behind 171 to be a factor relative to the time to implement the standard for GDA standard for GDA standard for GDA standard for GDA Time to implement the radwaste building is unlikely costs. human resources which is covered under operational water, and energy. Does not consider the demand for design to appropriate Time to develop demand resources (non-human), including raw materials, design to appropriate Time to develop demand Very low resource To compare the relative potential consumption of LLW repository in the case of mixed waste /trash. Nirex GWPS vol 2). Alternatively to meet CFA for generation), characterised, voids minimised (Ref. 2 – radiologically stable, chemically passive (i.e., zero gas Repository: immobilised, free of water, homogeneous, design to appropriate Time to develop demand Low resource have been taken. meets all CFA. requirements. Fully meeting current UK design to appropriate Time to develop demand High resource Moderate resource demonstrated that all process. compliance on all Very high resource it can be as a standalone or achieves partial reasonable measures granted an L.o.C. if ~50% of conditions isolated conditions UK specs. conditions. conditions). May be process. Meets specs. Meets only on isolated complementary would ever meet UK confidence in meeting current partial compliance by the addition of a technology proposed Very low RWMD by meeting their CFA for the ILW product that gains a Letter of Compliance from CFA fully with confidence in An indication of the option’s potential to produce a (e.g., meets most Very high 5 meet UK specs only requirements Nearly meets all 4 regarding whether 3 Could be made to Significant 2 uncertainty 1 Score Description UK AP1000 Environment Report MAPPING OF SCORING REQUIREMENTS AGAINST BAT CRITERIA (REFERENCE 3-16) 3.0 Radioactive Waste Management Systems Economic UKP-GW-GL-790 Costs Process Technology Criterion Table 3.5-6 (cont.) 3 Weight operator demand. most complex operator demand. 172 demand. process. High Greatest scope, process. Greatest Moderate operator High scope, complex development. require significant fundamental complex process. scope, moderately option. Expected to development cost. cost. Moderate the technology anticipated in research and Medium relative High relative cost for 3 investment 2 Substantial relative cost. Highest overall 1 Score demand. Low operator simplistic process. low scope, fairly Low relative cost. 4 Revision 4 rather than a full engineering estimate against bill of quantities, rates, and norms. scale, scope, and complexity of the process plant operator demand. an early stage, the score will reflect the anticipated process. Least development, design, capital and operating costs. At Least scope, simplest A relative assessment of treatment costs includes Lowest relative cost. 5 Description UK AP1000 Environment Report MAPPING OF SCORING REQUIREMENTS AGAINST BAT CRITERIA (REFERENCE 3-16) 3.0 Radioactive Waste Management Systems Economic Technology 5 2 5 3 UKP-GW-GL-790 Encapsulation Cement Vitrification lisation 2 5 1 3 3 4 Encapsulation Polymer Immobi 2 4 WETOX Oxidation Controlled None 4 5 5 3 4 4 4 3 Availability 5 5 5 5 5 5 5 4 Operability/ Compaction None Filtration Decanting Settling/ Absorption Drying None Option Weight Dose Uptake 1 3 3 2 5 2 3 4 5 5 3 4 4 4 Potential 2 4 4 2 5 2 3 4 5 5 3 4 4 4 Potential (Non- 2 4 2 3 5 2 3 4 5 5 3 4 4 3 Primary Waste Management 173 5 2 2 5 3 5 3 4 3 3 4 3 4 5 Waste 3 4 4 3 5 4 5 5 5 5 4 5 5 4 3 5 5 4 5 3 5 5 5 5 5 5 5 2 Planning Issues Management (Radiological) Hazard Maintainability 5 Product Quality 1 4 2 2 N/A 2 N/A N/A N/A N/A N/A N/A N/A Environmental Criteria 2 4 3 3 5 3 4 4 5 5 3 4 5 1 Economic Criteria 1 4 4 2 5 3 3 5 5 5 5 5 5 2 Time Safety Criteria Implementation Technical Criteria Resource Usage Secondary Radiological) Hazard MAPPING OF SCORING REQUIREMENTS AGAINST BAT CRITERIA (REFERENCE 3-16) Process Table 3.5-7 1 3 3 2 4 1 3 4 5 4 4 4 4 3 Revision 4 85 149 128 117 167 111 129 156 170 167 136 151 157 Total Weighted Score UK AP1000 Environment Report Costs 3.0 Radioactive Waste Management Systems Option Set Volume De-Water Reduction Passivation Technology UKP-GW-GL-790 Combustible solid LLW Organic liquid solvents Waste oils BPEO Issue (Reference 3-20) Table 3.5-8 UK AP1000 Environment Report No Incineration; Disposal to LLW repository British Energy off-site incinerator Commercial (off-site) incinerator On-site incinerator Pyrolysis* Biological Oxidation* Storage on-site On-site incineration Pyrolysis* Biological Oxidation* Chemical Oxidation* Storage on-site On-site incineration Options Considered in Sizewell B BPEO Study (Reference 3-20) On-site incineration Storage on-site On-site incineration 174 Sizewell B Recommendation following BPEO Study (Reference 3-20) Authorised transfer of some incinerable solid waste to a specialist incinerator. Do not consider that BEGL have demonstrated that the continued use of the Sizewell B incinerator is BPEO. Authorised both on-site and off-site disposal, but improvement condition to re-evaluate BPEO attached to use of onsite incinerator. Concern over high water content in PWR waste oils. Environment Agency Comment (Reference 3-21) Revision 4 No Incineration; Disposal to LLW repository or Commercial (off-site) incinerator Commercial (off-site) recycling (non-radioactive) or Commercial (off-site) incinerator (LLW) Waste stream not forecast, but disposal route could be: Commercial (off-site) recycling (non-radioactive) or Commercial (off-site) incinerator (LLW) AP1000 NPP Comparison COMPARISON OF BPEO APPROACH AT SIZEWELL B WITH AP1000 NPP BAT APPROACH 3.0 Radioactive Waste Management Systems Disposal to the LLW repository, following pretreatment LLW filters UKP-GW-GL-790 Off-site incineration, solids to landfill LLW sludge – non-oily Incineration Subject to batch-specific BPEO Disposal to the LLW repository LLW sludge – oily 175 Disposal to the LLW repository, following pretreatment subject to BPM constraints Off-site incineration Encapsulation in cement, disposal to the LLW repository Disposal to the LLW repository Sizewell B Recommendation following BPEO Study (Reference 3-20) Encapsulation in cement, disposal to the LLW repository Decontamination Recycling Volume reduction and disposal to the LLW repository Options Considered in Sizewell B BPEO Study (Reference 3-20) LLW resins Trash solid LLW BPEO Issue (Reference 3-20) Table 3.5-8 (cont.) UK AP1000 Environment Report Agreed disposal to the LLW repository, following pretreatment, if necessary Off-site incineration or drying and disposal to LLWR authorised Agreed improvement condition that required BPEO to be submitted before any treatment of LLWR waste, including oily sludge Considered encapsulation in cement, disposal to the LLW repository to be suitable Disposal to the LLW repository with volume reduction as a matter for BPM consideration Environment Agency Comment (Reference 3-21) Revision 4 Compaction, disposal to the LLW repository encapsulation, storage onsite, disposal to LLW repository or Commercial (off-site) incinerator Accumulation until end of generation cycle Disposal to the LLW repository AP1000 NPP Comparison COMPARISON OF BPEO APPROACH AT SIZEWELL B WITH AP1000 NPP BAT APPROACH 3.0 Radioactive Waste Management Systems Accumulation until end of generation, encapsulation, storage on-site, disposal to national repository Acid Digestion* Pyrolysis* Early encapsulation, longterm storage, disposal to national repository Options Considered in Sizewell B BPEO Study (Reference 3-20) Accumulation until end of generation, encapsulation, storage on-site, disposal to national repository Early encapsulation, long-term storage, disposal to national repository Sizewell B Recommendation following BPEO Study (Reference 3-20) UKP-GW-GL-790 176 Note: * Novel applications with limited relevant information on which to base an assessment. Solid ILW Wet ILW BPEO Issue (Reference 3-20) Table 3.5-8 (cont.) UK AP1000 Environment Report Agreed long-term storage and no disposal of wet or solid ILW Environment Agency Comment (Reference 3-21) Revision 4 Accumulation until end of generation cycle, encapsulation, storage onsite, disposal to national repository Early encapsulation, longterm storage, disposal to national repository AP1000 NPP Comparison COMPARISON OF BPEO APPROACH AT SIZEWELL B WITH AP1000 NPP BAT APPROACH 3.0 Radioactive Waste Management Systems Plant Country Belgium Tihange (Reference 3-38) UKP-GW-GL-790 LLW Waste Table 3.5-9 UK AP1000 Environment Report Compaction EDF France Burnable wastes incinerated. Slag, dust and ash stored in a tank and packaged in 200-I-drums. Copper cables/wiring shredded, recycled where possible, and packaged in 200-I-drums. 177 Ferrous and non-ferrous metals melted, re-used where possible, packaged/compacted into 200-I-drums. Metallic: Packaged in accepted bin (drum/box). Non-compactable: Placement in 220 litre drum + void filling with grout Non-compactable: In drum (220 litre) compaction Supercompaction and packaging into repository accepted bin (drum/box). Compactable: Iberdrola – Various Spain Compactable: RWE – Various Germany Collected by a special vehicle and transported to the waste treatment building Categorised measured and registered. Compacted to bales Stored in containers awaiting shipment to final repository or deposited in the shallow burial located on-site depending on dose rate level and content of nuclides. Revision 4 Sorted in the unit in special environmental stations Ringhals Sweden SUMMARY OF TREATMENT OF LLW AND ILW SOLID WASTES AT VARIOUS NUCLEAR POWER PLANTS IN EUROPE 3.0 Radioactive Waste Management Systems Plant Country Transfer to 200 litre drums Transfer to drying / heating (thermal oil) vessel Transfer to metal press drums and lidded High energy compaction Pellets packed in 200 litre drums Interim store or final repository No Dewatering Tihange (Reference 3-38) Belgium UKP-GW-GL-790 Waste form meets Nirex/RWMD Generic Waste Package Specification ILW Filters ILW Resins Waste Table 3.5-9 (cont.) UK AP1000 Environment Report Yes Concrete enclosures Concrete cask Cement or Polymer immobilization Dewatering EDF France 178 No Cementation in stainless steel drums Storage in MOSAIK cask Vapour condensate treatment In-package drying RWE – arious Germany Yes Immobilisation in type-filter drum with 5cm concrete wall Cement immobilization in 220 litre drum Dewatering Iberdrola – Various Spain Transfer to final repository Revision 4 Intermediate on-site storage Yes Solidified in cement in sheet-metal moulds Ringhals Sweden SUMMARY OF TREATMENT OF LLW AND ILW SOLID WASTES AT VARIOUS NUCLEAR POWER PLANTS IN EUROPE 3.0 Radioactive Waste Management Systems ILW ILW ILW ILW ILW ILW ILW LLW LLW LLW LLW LLW LLW LLW LLW Pumps – various Reactor System Internals Process Equipment Internals – various Heat Exchangers Filters – various Pressuriser Heaters Waste from system decontamination operations (e.g. spent resins and spent filter cartridges) Steam Generators / Heat Exchangers – various Reactor Integrated Head Package Tanks Ion exchange systems Pumps Fasteners Insulation HVAC Filters – various Waste Level ILW Waste Description Reactor Vessel and Pressuriser tanks UKP-GW-GL-790 Table 3.5-10 179 1,224 765 133 1,135 532 28,510 7,917 52,732 ~3002 2 203 332 6542 * 3540 13703 cubic feet 35 22 4 32 15.1 808 224 1,493 ~85 0.05 6 9 185 * 100 388 cubic metres Volume(1) 17,900 18,400 33,900 35489 60,998 205,899 258,676 2,818,560 ~225 358 18,200 21,280 641,094 321969 719488 936,846 pounds Mass 8 8 15 16 28 94 118 1,281 ~102 0.16 8 10 291 146 327 426 tonnes Revision 4 Mass based on average density 1200kg/m3 *individual pieces Notes UK AP1000 Environment Report SUMMARY OF MAIN RADWASTE ARISINGS FROM DECOMMISSIONED PROCESS EQUIPMENT 3.0 Radioactive Waste Management Systems Table 3.5-10 LLW LLW Small vessels Compacted dry active waste generated during decontamination operations 2860 0.53 252 cubic feet 81 0.02 7 cubic metres 267 51 9,245 pounds Mass 121 0.02 4 tonnes Mass based on average density 1500kg/m3 UKP-GW-GL-790 180 Revision 4 Notes: 1. Volume basis may include protruding appendages such as nozzles and brackets allowing the component to fit into an overpack for transport without modification. LLW Waste Level Adsorbers Waste Description Volume(1) Notes UK AP1000 Environment Report SUMMARY OF MAIN RADWASTE ARISINGS FROM DECOMMISSIONED PROCESS EQUIPMENT 3.0 Radioactive Waste Management Systems 3.0 Radioactive Waste Management Systems UK AP1000 Environment Report Table 3.5-11 COMPARISON OF AP1000 NPP ILW/LLW PRODUCTION AGAINST OTHER TYPES OF UK NPPS Reactor Type ILW and LLW (m3 per GW(e)-y)1 Magnox 1800(2, 3) AGR 890.3(2) PWR 430(2) AP1000 NPP 102(4) Notes: 1. Volumes are for wastes packaged for long-term management based on the probable conditioning method and container type. Station operational and decommissioning wastes are included. 2. Data source Reference 3-32. 3. Operating stations only. 4. Estimated operational waste only. UKP-GW-GL-790 181 Revision 4 3.0 Radioactive Waste Management Systems UK AP1000 Environment Report Avoid Minimise Recycle/Reuse Abatement Figure 3.1-1. Waste Management Hierarchy UKP-GW-GL-790 182 Revision 4 UKP-GW-GL-790 183 Revision 4 UK AP1000 Environment Report Figure 3.1-2. Nuclear BAT Management Factors for Optimization of Releases from Nuclear Facilities (Reference 3-10) 3.0 Radioactive Waste Management Systems UKP-GW-GL-790 3.0 Radioactive Waste Management Systems 184 Figure 3.3-1. AP1000 NPP Gaseous Radwaste System Revision 4 UK AP1000 Environment Report UKP-GW-GL-790 185 Figure 3.3-2. AP1000 NPP Air Emission Point Source Locations 3.0 Radioactive Waste Management Systems Revision 4 UK AP1000 Environment Report UKP-GW-GL-790 0 1000 2000 3000 4000 5000 6000 0 2 3.0 Radioactive Waste Management Systems Ci/y 4 186 Figure 3.3-3. BAT Sizing of WGS Delay Beds 6 8 10 No. Delay Bed Legs 12 Selected No. of Delay Bed Delay Bed BAT 14 16 Revision 4 UK AP1000 Environment Report UKP-GW-GL-790 0.00 0.50 1.00 1.50 2.00 2.50 1 2 4 5 7 8 Noble Gases 6 10 Tritium Month 9 C-14 11 13 Ar-41 12 187 14 15 16 17 Revision 4 18 UK AP1000 Environment Report Other Particulates Figure 3.3-4. AP1000 NPP Monthly Gaseous Radioactive Emissions RadioIodines 3 3.0 Radioactive Waste Management Systems Gaseous Discharge (TBq) UKP-GW-GL-790 3.0 Radioactive Waste Management Systems 188 Figure 3.4-1. AP1000 NPP Liquid Radwaste System Revision 4 UK AP1000 Environment Report 3.0 Radioactive Waste Management Systems UK AP1000 Environment Report EVAPORATOR APPROACH ION EXCHANGE APPROACH Figure 3.4-2. Comparison of Evaporator and Ion Exchange Flow Sheets for Liquid Radwaste Treatment UKP-GW-GL-790 189 Revision 4 0.00 1.00 2.00 3.00 4.00 5.00 1 UKP-GW-GL-790 TRITIUM Liquid Tritium Disharge (TBq) 2 3 4 5 6 7 8 1 2 190 UK AP1000 Environment Report 4 5 6 7 Carbon-14 Nickel-63 Other Particulates 3 Cobalt-58 Cesium-137 Revision 4 9 10 11 12 13 14 15 16 17 18 Month Iron-55 Strontium-90 8 Monthly discharges other than Tritium NON-TRITIUM ISOTOPES Non-Tritium Cobalt-60 Plutonium-241 0.00E+00 1.00E-03 2.00E-03 3.00E-03 4.00E-03 5.00E-03 6.00E-03 Figure 3.4-3. AP1000 NPP Monthly Liquid Radioactive Discharges Month 9 10 11 12 13 14 15 16 17 18 Monthly Tritium Discharges 3.0 Radioactive Waste Management Systems Liquid Disharge (TBq) UKP-GW-GL-790 AP1000 Primary System Components Radioactive Sources (see Figure 3.33.3-1) LIQUID LLW ILW SEGREGATION SOLID HLW ILW HLW ILW HLW LLW STREAMS WASTE ILW HLW TREATMENT LLW CONDITIONING LLW INTERIM STORAGE 191 Figure 3.5-1. AP1000 NPP Solid Radwaste Management Strategy AP1000 (see Figure 3.23.2-1) GASEOUS SOLID RADWASTE MANAGEMENT STRATEGY 3.0 Radioactive Waste Management Systems HLW REPOSITORY ILW REPOSITORY LLW REPOSITORY TRANSPORT TO LONG TERM STORAGE FACILITY Revision 4 UK AP1000 Environment Report UKP-GW-GL-790 3.0 Radioactive Waste Management Systems 192 Figure 3.5-2. Solid AP1000 NPP Waste Management Revision 4 UK AP1000 Environment Report 3.0 Radioactive Waste Management Systems UK AP1000 Environment Report Figure 3.5-3. Low Level Waste Options (Reference 3-16) Figure 3.5-4. Intermediate Level Waste Organic Resin Treatment Options (Ref. 3-16) UKP-GW-GL-790 193 Revision 4 3.0 Radioactive Waste Management Systems UK AP1000 Environment Report Figure 3.5-5. Total Weighted Benefit versus Cost of Process Technology (Ref. 3-16) UKP-GW-GL-790 194 Revision 4 3.0 Radioactive Waste Management Systems UK AP1000 Environment Report Figure 3.5-6. Total Weighted Benefit versus Cost of Waste Disposal (Ref. 3-16) Figure 3.5-7. ILW Filter Treatment Options (Ref. 3-13) UKP-GW-GL-790 195 Revision 4 UKP-GW-GL-790 196 Figure 3.5-8. Summary of Selected BAT for ILW and LLW Radwaste 3.0 Radioactive Waste Management Systems Revision 4 UK AP1000 Environment Report 3.0 Radioactive Waste Management Systems UK AP1000 Environment Report Electrical / Mechanical Equipment Room HVAC Room Monitor Tanks and Pumps Decontamination & Size Reduction Glove Box / Workstations LLW Processing Area Radwaste Sub-Change In-Drum Compactor Temporary Large Item Laydown Area Sorting Area / Glove Box Enclosure Buffer /Marshalling Area Working Table for Clearance Monitoring LRGS / LLW Assay System Clean drums, boxes and secondary containment vessel Mobile Processing Equipment / Truck Loading Area 200l Drum Storage Bay Laydown Area for Mobile Encapsulation Unit Crane ISO Freight Loading and Storage Figure 3.5-9. LLW Processing in Radwaste Building UKP-GW-GL-790 197 Revision 4 UKP-GW-GL-790 3.0 Radioactive Waste Management Systems 198 Figure 3.5-10. Solid LLW Disposal Routes Revision 4 UK AP1000 Environment Report UKP-GW-GL-790 3.0 Radioactive Waste Management Systems 199 Figure 3.5-11. CPS Resin Disposal Revision 4 UK AP1000 Environment Report UKP-GW-GL-790 3.0 Radioactive Waste Management Systems 200 Figure 3.5-12. Solid LLW Waste Oil Disposal Route Revision 4 UK AP1000 Environment Report UKP-GW-GL-790 3.0 Radioactive Waste Management Systems 201 Figure 3.5-13. Solid ILW Treatment and Disposal Revision 4 UK AP1000 Environment Report UKP-GW-GL-790 3.0 Radioactive Waste Management Systems 202 Figure 3.5-14. ILW Mobile Encapsulation Plant Revision 4 UK AP1000 Environment Report UKP-GW-GL-790 3.0 Radioactive Waste Management Systems 203 Figure 3.5-15. Solid HLW Treatment and Disposal Revision 4 UK AP1000 Environment Report UKP-GW-GL-790 3.0 Radioactive Waste Management Systems 204 Figure 3.5-16. ILW Store Revision 4 UK AP1000 Environment Report f) j) e) i) UKP-GW-GL-790 b) a) 3.0 Radioactive Waste Management Systems Figure 3.5-17. Holtec Spent Fuel Storage System k) g) c) l) h) d) 205 Revision 4 UK AP1000 Environment Report Cutaway View of HI-STORM 100U VVM UKP-GW-GL-790 a) 3.0 Radioactive Waste Management Systems 206 Figure 3.5-18. Holtec Spent Fuel Storage System b) HI-STORM 100U System Air Flow Pattern Revision 4 c) Heat Rejection in a Holtec MPC through Thermosiphon Action UK AP1000 Environment Report UKP-GW-GL-790 in fuel pond) GDF (Interim storage in Holtec MPC, loaded within AP1000 NPP Site) (Spent fuel cooled for up to 18 years 207 Revision 4 materials, packaging of fuel pins within repository cask) (e.g. removal of fuel element structural Fuel Element Conditioning up to 100 years storage) deposited into storage cells (Interim storage in Holtec MPC, On Site Store UK AP1000 Environment Report Figure 3.5-19. Spent Fuel Interim Storage, Transportation and Disposal Strategy (RWMD disposal container) Final Repository Cask MPC AP1000 NPP 3.0 Radioactive Waste Management Systems UKP-GW-GL-790 208 Figure 3.5-20. Minimisation of Equipment and Materials 3.0 Radioactive Waste Management Systems Revision 4 UK AP1000 Environment Report UKP-GW-GL-790 209 Figure 3.5-21. Decommissioning Waste Treatment and Disposal 3.0 Radioactive Waste Management Systems Revision 4 UK AP1000 Environment Report 4.0 Non-Radioactive Waste Management Systems UK AP1000 Environment Report 4.0 NON-RADIOACTIVE WASTE MANAGEMENT SYSTEMS 4.1 Gaseous Non-Radioactive Waste 4.1.1 Emission Sources 4.1.1.1 Mobile Encapsulation Plant The mobile encapsulation plant stabilises ILW by mixing with cementitious grout. The availability of locally generated premixed grout will be evaluated on a site-specific basis. Use of premixed grout is likely to be the simpler, therefore, preferred method of cement addition. However, in the absence of a suitable source of premixed grout, it will be necessary to mix the cementitious grout on-site from bagged, dry, powdered materials. If powdered grout materials are handled on-site, then local extraction systems and bag filters will be provided to reduce dust emissions. The grout mixing will take place within the rail car bay of the auxiliary building which has its own ventilation system (see Section 3.3.3). 4.1.1.2 Standby Generators There are four diesel generators on the AP1000 NPP: Two on-site standby diesel generators, output rated at 4000 kW (on a 60 Hz plant) Two ancillary diesel generators, output rated at 80 kW (on a 60 Hz plant) The maximum thermal rated input of the each standby generator is 12.9 MW. At this level, the diesel generators fall below the threshold of combustion devices that are subject to permitting under Schedule 1.1 of the Environmental Permitting (England & Wales) Regulations 2010 (References 4-1 and 4-2). During operation, the diesel generators will emit combustion gases including sulfur dioxide, nitrogen dioxide, carbon monoxide, and particulates (see Table 4.1-1). However, these generators will only operate for a few hours per year during mains power failure or during testing. The ancillary generators are rated two percent of the power of the standby generators. The contribution of these generators to the overall thermal rated input and air pollution is minimal. 4.1.1.3 HVAC Systems for Non-Radioactive Areas The AP1000 NPP design uses the following HVAC Systems to extract air from nonradioactively controlled areas and operate either in recirculation mode or exhaust to atmosphere without abatement. These areas are as follows: Nuclear Island Nonradioactive Ventilation System (VBS) – The VBS serves the main control room, control support area, 1E electrical spaces, and the Passive Containment Cooling System (PCS) valve room. These areas do not have sources of activity present during normal operation or during fault conditions. Annex/Auxiliary Building Nonradioactive Ventilation System (VXS) – The VXS serves the office areas, switchgear rooms, locker rooms, battery rooms, computer rooms, toilets, and other similar spaces. These areas do not typically have sources of radioactive contamination present during normal operation. A drain line from the Steam Generator UKP-GW-GL-790 210 Revision 4 4.0 Non-Radioactive Waste Management Systems UK AP1000 Environment Report Blowdown System (BDS) to the Liquid Radwaste System (WLS) passes through the areas served by the VXS. The drain line can be contaminated by the BDS system if there are 1) fuel leaks, 2) steam generator leakage, and 3) a radiation monitor failure or an isolation valve failure. Since the drain system has no valves or connections within the area served by the VXS, and it is gravity drained, the chance of leakage into the VXS area is negligible as there would need to be a pre-existing leak coincident with a fault. It is not reasonably foreseeable for activity to be present in the areas served by the VXS. Diesel Generator Building Heating and Ventilation System (VZS) – The VZS supplies air to and exhausts from the diesel generator building through a roof vent to atmosphere. The diesel generator building is a physically separate building and there is no credible source or fault which would result in a radioactive release from the diesel generator building. Turbine Building HVAC System (VTS) – The VTS serves all areas of the turbine building. The HVAC systems serving the switchgear rooms, rectifier room, security rooms, and plant control system cabinet rooms do not have a credible source of radioactive contamination. The general area of the turbine building is ventilated using about 850 m3s-1 (1,800,000 cfm) exhausted through roof ventilators without abatement. The Bay 1 area of the turbine building contains the reactor coolant pump variable-speed drives, CCS equipment (a non-radioactive system), and the BDS. The BDS may be contaminated in the very unlikely event of concurrent fuel defects, steam generator leak, radiation monitor or BDS isolation failure, and a BDS leak. The HVAC systems serving the switchgear rooms, rectifier room, security rooms, Bay 1 areas and plant control system cabinet rooms are recirculation systems. The sizing for these recirculation systems will not been determined until later in the design process. 4.2 Liquid Non-Radioactive Wastes 4.2.1 Non-Radioactive Waste Water Systems with Off-Site Release There are no direct or indirect discharges to ground or groundwater. The non-radioactive waste water systems are described below. The discharge flow rates are presented in Table 4.2-1. 4.2.1.1 Waste Water System (WWS) The WWS collects and processes equipment and floor drains from non-radioactive building areas. It is capable of handling the anticipated flow of waste water during normal plant operation and during plant outages. Effluent is collected in the turbine building sumps. The sumps are discharged via an oil separator. The waste oil is collected in a temporary storage tank before trucks remove the waste for offsite disposal. The waste water from the oil separator flows by gravity to a waste water retention basin (WWRB) for settling suspended solids and treatment before discharge, if required. The effluent in the retention basin is pumped to the plant cooling water outfall. In the event radioactivity is detected in the discharge from the sumps, the waste water is diverted from the sumps to the WLS for processing and disposal. 4.2.1.2 Sanitary Drainage System (SDS) The SDS is designed to collect the site sanitary waste (from plant restrooms and locker room facilities in the turbine building, auxiliary building, and annex building) for treatment, dilution and discharge. The SDS does not service facilities in radiologically-controlled areas. UKP-GW-GL-790 211 Revision 4 4.0 Non-Radioactive Waste Management Systems UK AP1000 Environment Report The SDS transports sanitary waste to either an on-site or off-site waste treatment plant. The selection of the waste treatment plant option is site-specific and is outside the scope of the generic site AP1000 NPP application. 4.2.2 Systems Discharging to the Waste Water System 4.2.2.1 Demineralised Water Treatment System (DTS) The DTS receives water from the raw water system, processes this water to remove ionic impurities, and provides demineralised water to the DWS. The treatment system comprises cartridge filters, two reverse osmosis units, and electrodeionisation systems. The reject flow or brine from the first reverse osmosis unit is discharged to the WWS. A pH adjustment chemical is added from the CFS to maintain the system within the operating range of the reverse osmosis membranes to inhibit scaling and corrosion. A dilute anti-scalant, which is chemically compatible with the pH adjustment chemical feed, is metered into the reverse osmosis influent water to increase the solubility of salts (decrease formation on the membranes). 4.2.2.2 Steam Generator Blowdown System (BDS) The BDS assists in maintaining acceptable secondary coolant water chemistry during normal operation and during anticipated operational occurrences of main condenser in-leakage or primary to secondary steam generator tube leakage by removing impurities which are concentrated in the steam generator. The BDS consists of two blowdown trains, one for each steam generator. The BDS accepts water from each steam generator and processes the water as required. If significant radioactivity is detected in secondary side systems, blowdown is re-directed to the WLS. However, normal operation is for the blowdown from each steam generator to be processed by a regenerative heat exchanger to provide cooling and an electrodeionisation demineralising unit to remove impurities from the blowdown flow. The blowdown fluid is then normally recovered for reuse in the CDS. Blowdown with high levels of impurities can be discharged directly to the WWS. A small waste stream from the electrodeionisation system may also be directed to the WWS or the WLS. 4.2.2.3 Condensate System (CDS) The CDS provides feedwater at the required temperature, pressure, and flow rate to the deaerator. Condensate is pumped from the main condenser hotwell by the condensate pumps and passes through the low-pressure feedwater heaters to the deaerator. During startup, the condensate is treated by ion exchange resin in the CPS to ensure the condensate and feedwater system (FWS) water chemistry meets specifications. Upon removal of the exhausted resin from the polisher vessel, the vessel is rinsed and the new resin is placed in the vessel using the resin addition hopper and eductor. Prior to plant startup, a new resin bed is rinsed and resin performance is verified, with flow through the vessel discharged to the WWS. 4.2.3 Seawater Cooling Systems The two seawater cooling systems are described below. presented in Table 4.2-1. 4.2.3.1 The discharge flow rates are Circulating Water System (CWS) The CWS supplies cooling water to remove heat from the main condensers, the TCS heat exchangers, and the condenser vacuum pump seal water heat exchangers. UKP-GW-GL-790 212 Revision 4 4.0 Non-Radioactive Waste Management Systems UK AP1000 Environment Report The cooling water system is a site-specific design. However, for the generic coastal site it is assumed that a once through seawater cooling system will be used with warm reject seawater being discharged directly to the sea via the cooling water return. A once through seawater cooling system will be dosed with sodium hypochlorite to control biofouling when seawater temperatures exceed 10C (Reference 4-3). Key mitigation measures for control of cooling water impacts are as follows: 4.2.3.2 Design and location of the abstraction point to minimise impact on habitats and entrainment of fish; Modelling, design, and location of the discharge point to minimize impacts on sensitive species and habitats; Minimising the need for conditioning of the cooling water by best practice design and choice of materials; Best practice design and monitoring of the cooling water treatment system; Blending of chlorinated and un-chlorinated streams to reduce residual oxidant to a minimum. Service Water System (SWS) The SWS supplies cooling water to remove heat from the non-safety-related CCS heat exchangers in the turbine building. Like the CWS, it is assumed that a once through seawater cooling system will be used for a generic coastal site (although the option for the use of cooling towers has been retained baased on specific site requirements, see section Error! Reference source not found.). The SWS uses ~4% of the seawater cooling flow of the CWS. This will be dosed with sodium hypochlorite to control biofouling when seawater temperatures exceed 10C. 4.2.3.3 Thermal Discharges The CWS will be designed to remove 7,540 million Btu per hour of heat with a seawater cooling flow of 600,000 U.S. gpm (136,275 m3/h). Cooling water will be discharged from the cooling water system approximately 14C warmer than the intake (Reference 4-3). This heat will be dissipated as rapidly as possible by suitable design and location of the discharge point at each site. By comparison, the SWS is small being designed to remove 346 million Btu per hour of heat with a seawater cooling flow of 21,000 U.S. gpm (4769 m3/h). The SWS will discharge at a temperature differential of up to 18.3C. The CWS and SWS discharge will be blended in the seawater return sump. The combined CWS and SWS discharge temperature differential will be 14.15C. Once discharged, the cooling water will start to mix with the ambient water body. Based on a temperature in the discharge water at 14C above ambient, the following dilution factors would be required to achieve lower rises in temperature (Reference 4-3): UKP-GW-GL-790 7 x dilution for a 2C temperature difference 10 x dilution for a 1.5C temperature difference 213 Revision 4 4.0 Non-Radioactive Waste Management Systems UK AP1000 Environment Report 14 x dilution for a 1C temperature difference A mixing zone will be proposed around the point of discharge such that the differential temperature beyond the mixing zone does not exceed 1 or 2C. The mixing zone requires a site-specific definition and impact evaluation. 4.2.4 Closed Loop Cooling Systems Closed loop cooling systems do not normally result in discharges to the waste water system. Discharges only arise in the event of maintenance or as a result of blowdown to maintain water chemistry or leakage. The closed loop cooling systems are described below: 4.2.4.1 Component Cooling Water System The CCS is a non-safety-related, closed loop cooling system that transfers heat from various plant components to the SWS during normal phases of operation. Cooling medium is provided by the SWS. The CCS also provides a barrier against leakage of service water into primary containment and reactor systems. Leakage of reactor coolant into the CCS is detected by a radiation monitor on the common pump suction header, by routine sampling, or by a high level in the surge tank. 4.2.4.2 Central Chilled Water System The VWS supplies chilled water to the HVAC systems and is functional during reactor full-power and shutdown operation. It also supplies chilled water to the WLS, WGS, secondary sampling system, and the temporary air supply units of the containment leak rate test system. The chemical feed tanks and associated piping are used to add chemicals to each chilled water subsystem stream to maintain proper water quality. Antifreeze solution is added to the low capacity subsystem to prevent freezing during cold weather operation. 4.2.4.3 Turbine Building Closed Cooling Water System (TCS) The TCS is a closed loop system which provides chemically treated, demineralised cooling water for the removal of heat from non-safety-related heat exchangers in the turbine building and rejects the heat to the CWS. The cooling water is treated with a corrosion inhibitor and uses demineralised water for makeup. 4.2.5 Chemicals Discharged with Liquid Effluents The chemicals used in the AP1000 NPP has been identified in Section 2.9.2 and Tables 2.9-1 and 2.9-2. Some of these chemicals are released with liquid effluent discharges into the seawater cooling return. The normal flow rate of once through seawater cooling is approximately two thousand times the normal flow rate of the non-radioactive effluent discharges (see Table 4.2-1). It follows that the seawater cooling return provides a substantial dilution of the normal plant effluent discharges. The concentrations of chemicals present at the seawater outfall are estimated in Table 4.2-2. 4.2.5.1 Sodium Hypochlorite and Halogenated By-Products The use of biocides is essential to prevent biofouling cooling water systems. Sodium hypochlorite is used as a biocide in the AP1000 NPP cooling water systems. The level of sodium hypochlorite dosing will be minimised by using the BAT design of the cooling water UKP-GW-GL-790 214 Revision 4 4.0 Non-Radioactive Waste Management Systems UK AP1000 Environment Report system (see Table 4.2-3) to minimise the potential for biofouling. Good design of the dosing and monitoring systems will reduce the level of hypochlorite dosing required further. These two factors will minimise the discharge of both residual oxidant and chlorination by-products to the receiving waters. The total residual chlorine discharge is expected to be ~0.2mg/l (see Table 4.2-2) between May to November when biofouling is prevalent because seawater temperatures exceed 10C. This is based on a hypochlorite dose rate of 0.2mg/l which is the BAT concentration reported for once through seawater cooling systems (Reference 4-4). Levels as low as 50 µg/l may be achievable based on best practice dosing regimes and mixing of chlorinated and unchlorinated streams prior to discharge (Reference 4-3). The required dosing rate is subject to site-specific differences in water temperature, particulate loading, and organic matter. Table 4.2-2 indicates that the predicted discharge of total residual chlorine will exceed the environmental quality standard of 10 µg/l at the point of discharge to the sea. However, the concentration is expected to rapidly decrease on contact with coastal water due to chlorine demand, exposure to sunlight, and dilution. Further dilution occurs in the mixing zone around the outlet of the cooling water discharge in the coastal water. There is minimal risk that the environmental quality standard for residual chlorine would be exceeded at the edge of the mixing zone. In principle, it is feasible to remove residual chlorine to below the environmental quality standard limits prior to discharge by addition of dechlorination chemicals (e.g., sulfite). This may be considered for a specific site with very sensitive marine environments. However, for the generic site, it is not considered BAT to incur the chemical cost and transportation cost associated with dosing another chemical to reduce the residual chlorine to below the environmental quality standard limits prior to discharge. The chlorination of seawater can give rise to the formation of halogenated by-products. A mixture of chlorinated and brominated compounds is formed due to the reaction of the chlorine with bromide. Brominated species normally predominate and, whilst generally more toxic, they tend to breakdown more rapidly in the environment. Trihalomethanes and halogenated acetic acids are the most common by-products formed. The quantities of by-products formed will be site-specific. Factors affecting the by-product formation include the applied chlorine dose, the concentration of organic carbon in the water, temperature, pH, and contact time. The concentrations of halogenated byproducts can be minimized by the use of good design of the dosing and monitoring systems to minimize the sodium hypochlorite dose rates and residual chlorine discharges. A summary of common by-products of chlorination in seawater is listed in Table 4.2-4 (Reference 4-3). 4.2.5.2 Boric Acid The AP1000 NPP discharges borated reactor coolant water in the radioactive liquid waste discharges. The boron is not removed by the ion exchange beds in the WLS because these operate in a boron saturated mode. The concentration of boric acid in the WLS discharge is a maximum of 2700 mg/l and this level declines over the 18-month fuel cycle. Table 4.2-2 indicates that the predicted contribution to boron concentrations from the AP1000 NPP discharge is ≤1.1 µg/l compared to an annual average environmental quality standard for seawater of 7000 µg/l. This discharge compares to typical seawater boron concentrations of ~4500 µg/l (Reference 4-5). It is concluded that the boron discharge can be considered negligible as it is less than 1% of the environmental quality standard. UKP-GW-GL-790 215 Revision 4 4.0 Non-Radioactive Waste Management Systems 4.2.5.3 UK AP1000 Environment Report Trace Metals Zinc acetate is dosed into the RCS to reduce corrosion. The zinc dose rate is typically 10 ppb (+/- 5ppb). When reactor coolant water is letdown via the CVS, a small amount of zinc acetate will be released. The zinc will be removed by passage through the WLS ion exchange resins, so no release of zinc is expected in the AP1000 NPP liquid discharges from this source. Some trace metal impurities may be present in the bulk chemical dosed into the various AP1000 NPP water systems. For a worst case calculation, it is assumed that the trace metal impurity of all chemicals may be 1 ppm. The trace metal discharges associated with this level of bulk chemical impurities would result in a metal discharge of 0.0026 µg/l (see Table 4.2-2). Table 4.2-2 also shows the environmental quality standards for various trace metals in the salt water environment. The worst case metal concentration predicted in the AP1000 NPP effluent discharge is less than 1% of any environmental quality standard for trace metals. As such, it is concluded that trace metal discharge associated with chemical impurity is negligible. The non-radioactive metal discharges associated with corrosion products have not been predicted for the AP1000 NPP. However, the presence of iron, nickel, copper, and chromium might all be expected in trace quantities. 4.2.5.4 Other Chemicals Other chemical discharges identified in Table 4.2-2 include ammonium hydroxide, ammonium chloride, monoethanolamine, and lithium7hydroxide. The discharge concentrations predicated are presented in Table 4.2-2. There are no relevant environmental quality standards to compare these discharge concentrations against. 4.2.6 Treatment and Disposal of Non-Radioactive Effluent Details of the WWS can be found in Chapter 9.2.9 of the DCD (Reference 1-1). The block flow diagram in Figure 2.7-1 shows the WWS comprising sumps, oil-water separator, and WWRB. The non-radioactive waste water during normal plant operation and during plant outages is handled by the WWS. Wastes from the turbine building floor and equipment drains (which include laboratory and sampling sink drains, oil storage room drains, the main steam isolation valve compartment, auxiliary building penetration area, and the auxiliary building HVAC room) are collected in the two turbine building sumps. Drainage from the diesel generator building sumps, the auxiliary building sump north (a non-radioactive sump), and the annex building sump is also collected in the turbine building sumps. The turbine building sumps provide a temporary storage capacity and a controlled source of fluid flow to the oil separator. A radiation monitor located on the common discharge piping of the sump pumps provides an alarm upon detection of radioactivity in the waste water. In the event radioactivity is present in the turbine building sumps, the waste water is diverted from the sumps to the WLS for processing and disposal. The radiation monitor also trips the sump pumps on detection of radioactivity to isolate the contaminated waste water. Provisions are included for sampling the sumps. The turbine building sump pumps route the waste water from either of the two sumps to the oil separator for removal of oily waste. The diesel fuel oil area sump pump also discharges UKP-GW-GL-790 216 Revision 4 4.0 Non-Radioactive Waste Management Systems UK AP1000 Environment Report waste water to the oil separator. The oil separator has internal, vertical coalescing tubes for removal of oily waste which flows by gravity to the waste oil storage tank. The oil separator has the capacity to process approximately 200 gpm (12.6 l/sec) of oil contaminated water. The oil separator is designed to remove free-oil droplets >20 microns from the process stream. At an inlet concentration of 0.1 percent, consisting of non-permanent, mechanically emulsified oil, grease, or petroleum hydrocarbons, the oil separator will discharge water with a maximum hydrocarbon concentration of 10 mg/l. The waste water from the oil separator flows by gravity to the WWRB. The waste oil storage tank provides temporary storage prior to removal by truck for offsite disposal. A bypass line allows for the oil separator to be out of service for maintenance. The bypass line will be normally closed. During maintenance of the oil separator, waste water can be retained in the turbine building sumps or, if necessary, in the WWRB. The WWRBs allow for retention of waste water, settling of suspended solids and treatment, if required, prior to discharge. The detailed design and configuration of the plant WWRB and associated discharge piping, including piping design pressure, basin transfer pump size, basin size, and location of the retention basins will be made according to site-specific conditions. Waste water that complies with discharge limits will be released intermittently via the seawater cooling return sump for final discharge via the plant outfall to the sea. The maximum design flow rate from the WWRB is ~408 m3/h (see Figure 2.7-1). The once through cooling water flow rate is 136,275 m3/h. It follows that the cooling water stream provides a substantial dilution of the discharged effluent before release to the environment. 4.2.6.1 Containment of Unplanned Emissions All discharges to the WWS are released via the WWRB. The AP1000 NPP design will have sufficient containment within the WWRB to retain unplanned emissions of effluents and spillages. The quality of these discharges can be ascertained by sampling and analysis from the WWRB to determine whether direct discharge is acceptable. If the water quality is unacceptable, then a mobile treatment system can be brought in to deal with the effluent or vacuum tankers can be used to remove the off-specification effluent to a licensed treatment plant. 4.2.7 Storm Water Storm water falling on hard standing outdoor areas will drain to a storm water pond or sustainable urban drainage system (SUDS) to minimise the risk of contamination or flooding of receiving waters. An oil water separator will be incorporated to prevent oily spillages on roads and loading bays from being carried over to discharge. The details of the storm water management will be developed in the site-specific design. 4.2.8 Fire Water Fire water from internal fire fighting systems will be retained within the lower levels of the buildings. Fire water used externally will fall on hard standing areas and be collected in the storm water pond or SUDS system. If the water quality is unacceptable, then a mobile treatment system can be brought in to deal with the effluent or vacuum tankers can be used to remove the off-specification effluent to a licensed treatment plant. UKP-GW-GL-790 217 Revision 4 4.0 Non-Radioactive Waste Management Systems 4.3 Solid Non-Radioactive Waste 4.3.1 Sources UK AP1000 Environment Report The sources of non-radwaste are identified in Appendix A and summarized in Table 4.3-1. 4.3.2 Waste Minimization The AP1000 NPP incorporates features of the waste management hierarchy (see Figure 3.11), realising the intent to avoid the generation of waste, minimise the generation of waste, reuse or recycle waste wherever possible. The conventional waste management strategy will ensure, to the extent practicable, that techniques will be used to prevent or minimise the production of wastes. Examples include: 4.3.3 Re-using receptacles, hoses, and other plant consumables, where it is safe to do so Use of appropriate signage to remind staff of the need to reduce waste Reuse of HEPA filter boxes Provision of waste collection facilities in the RCA outside of contamination-controlled areas from which waste can be monitored and, if it is not contaminated, removed from the RCA for disposal as non-radwaste Learning from operator experience shared between the sites and externally from other organisations in the UK and overseas Treatment and Disposal Use will be made of recycling and recovery techniques, where appropriate. For example, items that can be recycled include lube oil, batteries, metals, glass, and paper. Items that need to be disposed will be transferred to licensed waste disposal facilities by a registered waste disposal contractor. Nearby facilities, where and when available, will be used to the extent practical to minimise the environmental impact of transport. A schematic showing the proposed treatment and disposal of non-radwaste is shown in Figure 4.3-1. 4.4 References 4-1 UKP-GW-GL-036, Rev. 2, “Applicability of the Environmental Permitting (England and Wales) Regulations 2007 to AP1000,” Westinghouse Electric Company LLC, 2011. 4-2 “The Environmental Permitting (England and Wales) Regulations 2010,” The Office of Public Sector Information, SI 2010 No. 675. 4-3 UKP-GW-GL-034, Rev. 1, “Generic Assessment of the Impacts of Cooling Options for the Candidate Nuclear Power Plant AP1000,” Westinghouse Electric Company LLC, February 2010. UKP-GW-GL-790 218 Revision 4 4.0 Non-Radioactive Waste Management Systems UK AP1000 Environment Report 4-4 “Reference Document on the Application of Best Available Techniques to Industrial Cooling Systems,” European Commission, December 2001. 4-5 Summerhayes, C. P., and S. A. Thorpe, “Oceanography: Chapter 11, 165-181, 1996. UKP-GW-GL-790 219 An Illustrated Guide,” Revision 4 <1,000 <600 Carbon Monoxide Hydrocarbons UKP-GW-GL-790 220 Notes: 1. Emissions are based on 4 hours per month operation for each of the generators <12,000 <2,500 Sulfur Oxides Nitrogen Oxides <800 lb <5443 <272 <454 <1134 <363 kg Two 4000 kW Standby Diesel Generators(1) Particulates Pollutant Discharged Table 4.1-1 UK AP1000 Environment Report <140 <11 <30 <5 <10 lb Revision 4 <63.5 <4.99 <13.61 <2.23 <4.54 kg Two 80 kW Ancillary Diesel Generators(1) ANNUAL EMISSIONS FROM DIESEL GENERATORS 4.0 Non-Radioactive Waste Management Systems Service water system cooling water Steam generator blowdown Condensate demineraliser startup bypass flow Reverse osmosis and electrodeionisation reject Turbine island waste water Strainer backwash Strainer backwash Fire testing drains Condensate polisher rinse Condensate demin rinses and backwashes Condenser water box drain SWS BDS BDS DTS Multiple CWS SWS BDS CPS WWS CDS UKP-GW-GL-790 Circulating water system cooling water Waste Description CWS System Table 4.2-1 UK AP1000 Environment Report 221 Demineraliser water with minor solids Off specification demineraliser water Secondary side coolant Non-contact seawater cooling (once through) Physical/Chemical Description 0 0.01 0.01 0.1 1 2 18 13 26 4 2385 250 466 466 170 681 413 74 41 82 42 4770 136,275 m3/h m3/h 136,275 Max Volume Normal Volume Estimated Quantities Revision 4 2.8 103 103 756 8,360 18,900 257,000 164,400 329,000 37,000 2.09E+07 1.194E+09 m3/y Annual Average AP1000 NPP ESTIMATED OPERATIONAL LIQUID CONVENTIONAL WASTE FROM SYSTEM OPERATIONS 4.0 Non-Radioactive Waste Management Systems Table 4.2-2 UKP-GW-GL-790 Steam generator blowdown Condenser water box drain CDS Steam generator blowdown BDS BDS Turbine island waste water Multiple Hydrazine (oxygen scavenger) Condenser water box drain CDS Ammonium hydroxide (pH control) Service water system cooling water Service water system cooling water SWS SWS Circulating water system cooling water Liquid Effluent Stream CWS System Ammonium chloride (algaecide) Sodium hypochlorite (biocide) Chemical (Chemical Use) 1.194E+09 2.09E+07 ≤0.2(1,2) ≤0.2(1,2) 222 10 10 ≤100 ≤100 ≤100 0.3 2.8 37,000 257,000 2.8 kg/y m3/y mg/l 0.03 370 ≤3700 ≤25700 ≤0.28 6270 ≤2090(2) 119400(2) Chemical Quantity Discharged Discharge Rate Typical System Concentration 0.3 ≤11(4) ≤200(2) µg/l Annual Average Discharge Concentration (at controlled waters) Revision 4 – – TRO 10(3) MAC µg/l Standard (saltwater) Environmental Quality UK AP1000 Environment Report AP1000 NPP ESTIMATED DISCHARGE OF CHEMICALS WITHIN THE LIQUID EFFLUENT STREAMS 4.0 Non-Radioactive Waste Management Systems WLS WLS All Lithium7hydroxide (pH control and tritium reduction) Zinc Acetate (corrosion inhibitor) Trace metals impurities from chemicals UKP-GW-GL-790 All Borated reactor coolant Borated reactor coolant Borated reactor coolant Condenser water box drain CDS WLS Steam generator blowdown Liquid Effluent Stream BDS System Boric Acid (chemical shim control) Monoethanolamine Chemical (Chemical Use) Notes: Table 4.2-2 (cont.) 223 Assume 1ppm contamination in all chemicals <0.04 ≤2.2 ≤2700 3 3 mg/l System Concentration 1.25E+09 <3.4E-05(7,8) 0.0027(9) <1.2(7) 3.3(9) ≤1.1(5) ≤0.005 ≤7884 2920(6) 0.09 µg/l ≤6.4 0.008 2.8 111 kg/y m3/y 37000 Chemical Quantity Discharged Discharge Rate Typical Annual Average Discharge Concentration (at controlled waters) – AD AD AD AD AD AD AD AD AD AD AT Revision 4 Hg 0.3 Cd 2.5 As 25 Pb 25 Cr 15 Zn 40 Cu 5 Ni 30 Fe 1000 Zn 40 B 7000 – µg/l Standard (saltwater) Environmental Quality UK AP1000 Environment Report AP1000 NPP ESTIMATED DISCHARGE OF CHEMICALS WITHIN THE LIQUID EFFLUENT STREAMS 4.0 Non-Radioactive Waste Management Systems System Liquid Effluent Stream mg/l System Concentration Chemical Quantity Discharged kg/y Discharge Rate Typical m3/y 224 Concentrations reported as total residual chlorine Hypochlorite is dosed into seawater only when seawater temperature >10C, assumed to be 6 months of the year Total residual oxidant Ammonium concentrations reported as nitrogen Concentrations reported as total dissolved boron Flow rate converted from LOP borated water discharge data in Table 3.4-1 Zinc removed by WLS ion exchange resins Concentration reported as total zinc Calculation based on 1ppm metal contamination present in all chemicals AD Annual average dissolved AT Annual average total MAC Maximum allowable concentration Chemical (Chemical Use) UKP-GW-GL-790 1. 2. 3. 4. 5. 6. 7. 8. 9. Table 4.2-2 (cont.) µg/l Annual Average Discharge Concentration (at controlled waters) Revision 4 µg/l Standard (saltwater) Environmental Quality UK AP1000 Environment Report AP1000 NPP ESTIMATED DISCHARGE OF CHEMICALS WITHIN THE LIQUID EFFLUENT STREAMS 4.0 Non-Radioactive Waste Management Systems Design and location of discharge point is normally based on extensive modelling taking into account the location of sensitive habitats and fish migration pathways. Design is made to ensure that the maximum dispersion of the thermal load whilst minimising the impact on ecology. Intake design to minimise the entrainment of fish, debris, organic and inorganic material including suspended solids. Location of discharge point. Reduction of fouling and corrosion which reduces the requirement for chemical additives. UKP-GW-GL-790 The cooling water abstraction point is situated in a location where it will minimise any potential impacts on habitats. Location of abstraction. On-line or off-line cleaning. 225 Use smooth surfaces and non-toxic coatings and paints to reduce fixation of the organisms, to reinforce the velocity effect and to facilitate cleaning. Stagnant zones and turbulence should be avoided and flow velocities maintained at a high enough level to avoid fixation of organic organisms. Velocity of flow should be more than the critical velocity. Once through systems for large capacity units >10MWth BAT Approach Coastal Area Criterion Table 4.2-3 Remarks UK AP1000 Environment Report Revision 4 This approach will reduce the concentrations of both residual oxidant and by-products being discharged to the receiving waters. Allow plume (typically buoyant due to lower density of warm water) to rise virtually unmixed to the surface and spread horizontally where it will lose heat to the atmosphere and slowly mix downwards. Aim of rapid initial mixing and dilution, typically using diffusers to create a large volume of slightly warmed water. Two approaches to maximise the dissipation of heat; It is designed to avoid disturbing sediments and hence avoids adverse impacts on the cooling water system and the mobilisation of pollutants. Avoid mixing local thermal plume near intake point, e.g., by deep water extraction below mixing zone using temperature stratification. BAT APPROACH FOR THE COOLING WATER SYSTEM 4.0 Non-Radioactive Waste Management Systems Table 4.2-3 (cont.) Targeted dosing at locations with a high fouling risk such as the heat exchanger inlet and outlet boxes. Biofouling treatment system. UKP-GW-GL-790 Re-circulating of dangerous substances. Avoid using prohibited substances (List I substances) such as chromium compounds, mercury compounds, organometallic compounds, mercaptobenzothiazole, and shock treatment substances other than chlorine, bromine, ozone, and H2O2. Use of less hazardous chemicals. 226 Constant monitoring programme to detect dangerous substances in system. Limitation of certain substances (List II substances) such as chlorine dioxide, chlorine and bromine, adsorbable organically bound halogens (AOX), chemical oxide demand (COD), zinc, and phosphorus compounds. Monitoring and control of cooling water chemistry. Reduction of chemical application. Monitoring of biofouling. Pulse-alternating chlorination, which is an optimum anti-fouling treatment with the minimum usage of chlorine. Optimisation of chemical monitoring and controlled (automatic) dosing to ensure the minimum required dose. Since the applied hypochlorite concentration will decrease through the cooling water system, chemical monitors ensure effective concentrations in the system. BAT Approach Criterion Remarks UK AP1000 Environment Report Revision 4 Sodium hypochlorite (biocide) is recognised as a List II substance. Current industry practice is to use biocide (sodium hypochlorite) which has the advantage over other biocides. The aim is to prevent biofouling from occurring, as once it does large doses for long periods are required. BAT APPROACH FOR THE COOLING WATER SYSTEM 4.0 Non-Radioactive Waste Management Systems UKP-GW-GL-790 Re-use of waste heat. Risk of bioaccumulation causing scale and corrosion. Criterion Table 4.2-3 (cont.) 227 Consider alternative uses for waste heat to decrease the thermal impact on the receiving water as well as optimising overall energy savings. This approach is considered as good environmental and energy management. Control of pathogens via periodic monitoring. Mechanical and chemical cleaning after outbreak. Reduce biological growth by avoiding stagnant zones (design) and optimised chemical treatment. Reduce algae formation by reducing light energy reaching the cooling water. BAT Approach Remarks UK AP1000 Environment Report Revision 4 This can only be assessed during site-specific analysis. This approach may not be beneficial if the waste heat is of low-grade heat. BAT APPROACH FOR THE COOLING WATER SYSTEM 4.0 Non-Radioactive Waste Management Systems 4.0 Non-Radioactive Waste Management Systems UK AP1000 Environment Report Table 4.2-4 HALOGENATED BY-PRODUCTS OF CHLORINATION IN SEAWATER Chemical CAS No Haloamines monobromamine 14519-10-9 dibromamine 14519-03-0 tribromamine – Haloacetonitriles Bromochloroacetonitrile 83463-62-1 Bromoacetonitrile 590-17-0 Dibromoacetonitrile 3252-43-5 Haloacids Bromoacetic acid 79-08-3 Dibromoacetic acid 631-64-1 Tribromoacetic acid 75-96-7 Bromochloroacetic acid 5589-96-8 Bromodichloroacetic acid 71133-14-7 Chlorodibromoacetic acid 5278-95-5 Halogenated phenols 2, 4-Dibromophenol 615-58-7 3, 5-Dibromophenol 626-41-5 2, 4, 6-Tribromophenol 118-79-6 Haloketones Bromopropanone 867-54-9 3-bromo-2-butanone 814-75-5 Trihalomethanes Bromodichloromethane 75-27-4 Bromoform 75-25-2 Chlorodibromomethane 124-48-1 UKP-GW-GL-790 228 Revision 4 Table 4.3-1 Once/7 y Reverse osmosis modules Once/5 y Once/12 y Once/60 y Once/5 y Once/10 y Valve Packing – compressible rigid plastic Electrodeionisation (resin/membrane module) Door/hatch gaskets (fibreglass cloth) Main feedwater pump seals (silicon carbide) Heat Exchanger gaskets (neoprene) 229 Once/10y HVAC filters (charcoal) Once/6 months Once/25 y Lube oil Electrodeionisation/reverse osmosis filter cartridges Once/20 y various Frequency Battery (lead acid) HVAC filters (fibreglass/metal) Description of Waste Radioactive Waste Classification UKP-GW-GL-790 UK AP1000 Environment Report 0.062 0.056 1.16 1.34 1.14 4.86 0.39 15.77 79.5 324 various Normal Volume per Unit Frequency (m3) 0.37 0.68 1.16 6.68 13.7 29.12 45.65 135.2 159 630 5209 Revision 4 Volume per Life of Plant (m3) SUMMARY OF MAIN SOLID NON-RADIOACTIVE WASTE PRODUCED BY THE AP1000 NPP 4.0 Non-Radioactive Waste Management Systems UKP-GW-GL-790 230 Figure 4.3-1. Conventional Solid Waste Treatment and Disposal Rout 4.0 Non-Radioactive Waste Management Systems Revision 4 UK AP1000 Environment Report 5.0 Environmental Impact 5.0 ENVIRONMENTAL IMPACT 5.1 Characteristics of the Generic Site UK AP1000 Environment Report Much of the AP1000 NPP design information presented in this document is independent of the location chosen for its construction. However, some assumptions about the characteristics of the plant’s environment must be considered in developing the design of certain safety and environmentally-related features. In the absence of the selection of a specific site and in order to allow early assessment of the proposed reactor designs, it is assumed that the site has characteristics of the generic coastal site established in Reference 5-1. The generic site characteristics are based on information obtained from five coastal nuclear power stations around the UK. These power stations are Dungeness (A), Hartlepool (B), Heysham (C), Hinkley (D), and Sizewell (E). These sites are considered typical of the range of nuclear coastal sites in the UK. The sites are located around the English coast (see Figure 5.1-1). The information obtained in this section has been largely derived from the government’s on-line geographical information system (Reference 5-2). Maps have been generated from the generic site data gathered in Reference 5-1 and, although not unique solutions to the generic site, are consistent with the information and help to visualize the generic site. Figure 5.1-2 shows the population centres for the generic design case. Figure 5.1-3 shows the land use and habitat areas within 5 km of the AP1000 NPP located on the generic site. Figure 5.1-4 shows the sites of special interest within 5 km of the site. 5.1.1 Human Population Analysis has been carried out on the centres of population within 20km of the five coastal power stations used as a basis of this assessment (Reference 5-1). It has been assumed that the generic site has the 80th percentile number of population centres within a given distance. For the purpose of the generic site, it is assumed that the population centres of a given size are located at the nearest distance recorded for the five existing nuclear power stations. The assumed number of population centres within 2km, 10km, and 20km of the generic site are shown in Table 5.1-1. The table also shows the number of individual farms and properties within 1km and 2km of the site, and the nearest population centre of a given size. 5.1.1.1 Exposed Population Groups Two exposure groups are considered at a generic coastal site – the local resident family and the fisherman family. The local resident family is selected to represent the exposure pathways associated with atmospheric releases from the AP1000 NPP point sources. The habit data which includes food consumption, breathing rates, and occupancy fraction for this group is described in Table 5.1-2. The fisherman family is selected to represent the exposure pathways associated with the discharges from the AP1000 NPP point to the coastal environment. The habit data associated with this group is described in Table 5.1-3. It is assumed that the members of the fisherman family exposure group consume fish, molluscs and crustaceans at higher consumption rates UKP-GW-GL-790 231 Revision 4 5.0 Environmental Impact UK AP1000 Environment Report than the local resident family. A fisherman family may be exposed to radiation through the following pathways: 5.1.2 internal irradiation from the consumption of seafood contaminated with radionuclides; external radiation from radionuclides in beach and shore sediment during bait collection. Reference Organisms It is assumed that various terrestrial and marine reference organisms are located within the vicinity of the plant (see Table 5.1-4). The reference organisms have been selected to be representative of all protected species within Europe (Reference 5-3). The reference organisms have precisely defined anatomical, physiological, and life history properties that can be used for the purposes of relating exposure to dose and dose to effects for other organisms with similar taxonomy. 5.1.3 Meteorology The meteorological data for the generic site is summarised in Table 5.1-5. The data set has been derived from the worst case maximum and minimum data and the average data from the five nuclear sites described in Reference 5-1. 5.1.3.1 Atmospheric Conditions For the purpose of the generic site it is assumed that the atmospheric conditions are as shown in Table 5.1-6 (Reference 5-4). The Pasquil Stability Category is a measurement of atmospheric turbulence; A = unstable and G = extremely stable. 5.1.3.2 Atmospheric Disposition Coefficients For the purpose of human health risk assessment, the deposition coefficients (a measure of the rate of transfer of pollution from the air to the earth’s surface) are proposed as follows (Reference 5-5): Dry deposition velocity: Default: Inorganic forms of iodine isotopes: Noble gases: 0.001m/s. 0.01m/s. zero Washout coefficient: Default: Noble gases: 0.0001s-1. zero 5.1.4 Terrestrial Environment 5.1.4.1 Topography The highest ground elevations within 2km and 10 km of the generic site are shown in Table 5.1-7. 5.1.4.2 Land Cover/Surface Roughness The main land cover within 5km of the sites is listed in Tables 5.1-8. A surface roughness of 0.3m is assumed for a typical rural location. UKP-GW-GL-790 232 Revision 4 5.0 Environmental Impact 5.1.4.3 UK AP1000 Environment Report Geology and Hydrogeology It is assumed that the land is stable and the presence of faults is minimal. It is assumed that the superficial geology is glacial clays with sands and gravel lenses. Discontinuous, perched groundwater is assumed to be 2m below the site surface. It is also assumed that the site overlies a major aquifer with groundwater level at 20m below ground level. The AP1000 NPP is designed for a normal groundwater elevation to within 0.6m of the plant grade elevation. 5.1.4.4 Seismology The following information has been obtained from the British Geological Survey website (Reference 5-6). Twenty to thirty earthquakes are felt by people every year in the UK. Most of these are very small and cause no damage. However, some British earthquakes have caused some damage, although nothing like the devastation caused by large earthquakes in other parts of the world. A magnitude 4 earthquake on the Richter scale happens in Britain roughly every two years. A magnitude 5 earthquake in the UK occurs roughly every 10 to 20 years. The largest recorded earthquake in the UK had a magnitude of 6.1 and occurred 60 miles off the Yorkshire coast beneath the North Sea. Research suggests that the largest possible earthquake in the UK is around magnitude 6.5. For the purpose of the generic site characterisation, it is assumed that the site has the potential to experience a magnitude 6.5 earthquake. The AP1000 NPP safe shutdown earthquake design is for a peak ground acceleration of 0.3g. This ground acceleration would be typical of a magnitude 6.7-8 earthquake. This design exceeds the largest recorded earthquake in the UK. 5.1.4.5 Natural Habitat/Nearest Sensitive Sites The characteristic semi-natural habitats within 5km of the site are identified in Table 5.1-9. The nearest sensitive sites to the generic site are assumed to be as shown in Table 5.1-10. 5.1.5 Coastal Environment 5.1.5.1 Tidal Range/Volumetric Exchange Rate The assumed tidal range for the generic site is shown in Table 5.1-11 (Reference 5-1). The volumetric exchange rate for the generic site is 130 m3/s (Reference 5-7). The generic site has been allocated the most conservative (lowest) exchange rate of the five nuclear coastal sites evaluated. 5.1.5.2 Intertidal Tidal Zone It is assumed that the generic site may have a wide range of intertidal substrates within 10km of the site. These may include sand, gravel, sand and gravel, rock platform, mud, sand and mud, and made ground. UKP-GW-GL-790 233 Revision 4 5.0 Environmental Impact 5.1.5.3 UK AP1000 Environment Report Bathymetry The assumed water depths off the coast of the generic site are shown in Table 5.1-12. The depths are based on Admiralty Chart datum. 5.1.5.4 Marine Biology The marine biological features assumed to be within 10km of the generic site are listed in Table 5.1-13. 5.2 Prospective Human Dose Assessment 5.2.1 Approach The following assessments of the effects of the AP1000 NPP aerial emissions and liquid discharges on members of the public have been made: annual individual dose to the most exposed members of the public for liquid discharges; annual individual dose to the most exposed members of the public for gaseous discharges; annual dose to the most exposed members of the public for all discharges from the facility; annual dose from direct radiation to the most exposed member of the public; annual dose to the critical group for the facility; a comparison of the calculated doses with the relevant dose constraints; potential short-term doses; collective dose for liquid discharges; collective dose for gaseous discharges; and an assessment of the build-up of radionuclides in the local environment. The assessment of annual individual doses has been made following the Initial Assessment Method, provided by the Environment Agency (Reference 5-7). This consists of three assessment stages. Firstly, a conservative scoping assessment is carried out applying default data (stage 1). If the resulting dose exceeds 20 μSv y-1 then the assessment is refined by applying more appropriate data (stage 2). If the resulting dose still exceeds 20 μSv y-1 then a detailed assessment is carried out (stage 3). 5.2.2 Initial Assessment of Doses Stage 1 5.2.2.1 Stage 1 Doses from Liquid Discharges Liquid discharges to the marine environment are based on data from Table 6.1-6. For the purpose of the dose assessment, cerium-144 was assigned as surrogate radionuclide for the ‘other radionuclides’ category. Doses were calculated for annual representative discharges as UKP-GW-GL-790 234 Revision 4 5.0 Environmental Impact UK AP1000 Environment Report well as for calculated annual limit discharges. Representative radionuclides and liquid discharge rates used for the dose assessment are shown in Table 5.2-1. The EA’s initial assessment methodology (Reference 5-7) was used to assess the potential doses from liquid discharges of the AP1000 NPP. It is based on generic Dose Per Unit Release (DPUR) values. For liquid discharges into the sea, the relevant exposure group is “fisherman family.” This group is assumed to be exposed to radioactive releases from the proposed AP1000 NPP through the following pathways: internal irradiation from the consumption of seafood contaminated with radionuclides; external irradiation from radionuclides in beach and shore sediments during bait digging. Detailed information on these pathways and associated habit data such as seafood consumption rates and sediment occupancy rates are listed in Table 5.1-3. Dose per unit intake factors for ingestion are shown in Table 5.2-2. Doses are assessed in the 50th year of discharge, the only available integration time option. The DPUR values used in this assessment are shown in Table 5.2-3. The results are shown in Table 5.2-4 for representative discharges and Table 5.2-5 for limit discharges by radionuclide and pathway. The total dose from liquid discharges is 3.0 μSv y-1 for representative discharges and 4.8 μSv y-1 for calculated annual limit discharges. The doses are dominated by carbon-14 which contributes 67 percent to the annual doses from liquid discharges, followed by cobalt-60 which contributes 29 percent. 5.2.2.2 Stage 1 Doses from Gaseous Discharges Atmospheric discharges were taken from Table 6.1-5. For the purpose of the dose assessment representative surrogate radionuclides were assigned to the following categories: Iodine-133 for “other iodines,” taken to be all radioiodines apart from iodine-131 for which doses have been assessed individually; Krypton-85 for “other noble gasses,” taken to be all isotopes of krypton and xenon apart from krypton-85 and xenon-133 for which doses have been assessed individually; Cobalt-58 for “other particulates,” taken to be all particulates apart from cobalt-60, strontium-90, and caesium-137, for which doses have been assessed individually. Doses were calculated for annual representative discharges as well as for annual limit discharges. Representative radionuclides and gaseous discharge rates used for the dose assessment are shown in Table 5.2-6. The EA’s initial assessment methodology (Reference 5-7) was used to assess the potential doses from atmospheric discharges of the AP1000 NPP. For atmospheric discharges, the relevant exposure group is “local resident family.” This group is assumed to be exposed to radioactive releases from the proposed AP1000 NPP through the following pathways: inhalation of radionuclides in the effluent plume at a distance of 100 m; internal irradiation from the consumption of terrestrial foodstuffs incorporating radionuclides deposited to the ground at a distance of 500 m; and UKP-GW-GL-790 235 Revision 4 5.0 Environmental Impact UK AP1000 Environment Report external irradiation from radionuclides in the effluent plume and deposited to the ground at a distance of 100 m. Detailed information on these pathways and associated habit data such as terrestrial food consumption rates, inhalation rates, building shielding factors, and occupancy times are listed in Table 5.1-2. The meteorological data applied is referred to as ‘50% stability category D’, as shown in Table 5.1-6. Dose per unit intake factors for ingestion and inhalation are shown in Table 5.2-7. Doses are assessed in the 50th year of discharge, the only available integration time option. Similarly, the location distance of 100 m for the local resident family is the only distance available as part of the EA’s initial assessment methodology. This distance leads to a conservative dose assessment in relation to the generic site distance to receptor of 280 m (200 m to site boundary + 80 m to nearest residential property, see Tables 3.3-4 and 5.1-1). The DPUR values used in this assessment are shown in Table 5.2-8. The results are shown in Table 5.2-9 for representative discharges and Table 5.2-10 for limit discharges by radionuclide and pathway. The total dose from aerial discharges is 51 μSv y-1 for representative discharges and 79 μSv y-1 for limit discharges. The doses are dominated by carbon-14 which contributes 86 percent to the annual doses from aerial discharges, followed by argon-41 at 8 percent. 5.2.2.3 Direct Radiation Doses Exposure to external radiation due to direct radiation from the AP1000 NPP design will result in a very small dose to members of the public. A direct radiation dose typically arises from a number of sources on a nuclear site, including the main reactor building and any waste processing or storage plants. Its magnitude varies greatly according to the distance and angle between these sources and the receptor. For the purposes of estimating dose to members of the public, a direct radiation dose is not normally modelled. Rather, a number of measurements are made around the site perimeter fence and these are used to estimate a public dose. The closest comparable design currently in operation in the UK is the Sizewell B PWR, which is based on an older WEC design. The measured direct shine dose at the Sizewell B perimeter fence was 4 μSv in 2007 (Reference 5-8). These measurements were taken after the Sizewell A station ceased power generation in December 2006 and before decommissioning activities commenced. Based on the existing Sizewell data, an annual dose contribution to the AP1000 NPP design critical group of 4 μSv y-1 has been applied here. 5.2.2.4 Total Stage 1 Doses The total assessment stage 1 dose is the sum of the dose resulting from liquid discharge, gaseous discharges and direct radiation. The total stage 1 dose is 58 μSv y-1 for representative discharges and 88 μSv y-1 for discharges at the proposed discharge limit. These doses are higher than 20 μSv y-1. As a result a stage 2 assessment was carried out. 5.2.3 Initial Assessment of Doses Stage 2 5.2.3.1 Stage 2 Doses from Liquid Discharges For the refined initial assessment for liquid discharges, the volumetric exchange rate of water between the local and regional marine compartments was changed from the default value of UKP-GW-GL-790 236 Revision 4 5.0 Environmental Impact UK AP1000 Environment Report 100 m3 s-1 to 130 m3 s-1 in accordance with the generic site information (see Section 5.1.5.1). The revised DPUR values used in this assessment are shown in Table 5.2-11. The results are shown in Table 5.2-12 for representative discharges and Table 5.2-13 for limit discharges by radionuclide and pathway. The total dose from liquid discharges is 2.3 μSv y-1 for representative discharges and 3.7 μSv y-1 for calculated annual limit discharges. The doses are dominated by carbon-14 which contributes 68 percent to the annual doses from liquid discharges, followed by cobalt-60 which contributes 29 percent. 5.2.3.2 Stage 2 Doses from Gaseous Discharges For the refined initial assessment for gaseous discharges, the release height was changed from the default value of 0 m to the effective release height of the main plant vent of the AP1000 NPP. The effective release height is a function of the physical stack height, an initial rise of the plume due to its momentum at the point of release and the characteristics of any nearby buildings. The presence of buildings can alter the structure of the wind field that the plume enters and can lead to the plume being entrained into the building wake, thus resulting in higher activity concentrations at ground level closer to the source. For the purpose of this assessment it has been assumed that all releases occur from the main plant vent. In order to derive an effective release height the atmospheric dispersion model ADMS (Reference 5-9) was applied. A distribution of meteorological conditions of ‘50% stability category D’ was applied, as shown in Table 5.1-6. Firstly, the model was run using the inbuilt plume rise and building modules. The relevant parameters used are shown in Table 5.2-14. With this set-up the model was run for a number of wind directions. Thus it was determined that the highest downwind activity concentrations at ground level occur when the bulk of the building is positioned upwind from the stack. In this configuration the plume becomes partially entrained in the building wake. Then an equivalent effective stack height was determined by re-running ADMS without the plume rise and building options but for a range of different physical stack heights. Resulting downwind activity concentrations were compared with those determined for the ‘building upwind’ configuration. For the distances of interest (100 m and 500 m) the lowest equivalent stack height is 40 m. As a result an effective release height of 40 m was used in the stage 2 dose assessment. The following release height scaling factors were applied to the dose per unit discharge factors (Figure 2 of Reference 5-7): food dose scaling factor of 0.15; inhalation and external dose scaling factor of 0.007. The revised DPUR values used in this assessment are shown in Table 5.2-15. The results are shown in Table 5.2-16 for representative discharges and Table 5.2-17 for limit discharges by radionuclide and pathway. The total dose from aerial discharges is 3.6 μSv y-1 for representative discharges and 5.6 μSv y-1 for limit discharges. The doses are dominated by carbon-14 which contributes 93 percent to the annual doses from aerial discharges, followed by iodine-131 at 4 percent. 5.2.3.3 Total Stage 2 Doses The total dose for assessment stage 2 is the sum of the stage 2 doses resulting from liquid discharge, gaseous discharges and direct radiation. The direct radiation dose has been taken to UKP-GW-GL-790 237 Revision 4 5.0 Environmental Impact UK AP1000 Environment Report be as determined for stage 1 (see Section 5.2.2.3). The total stage 2 dose is 9.8 μSv y-1 for representative discharges and 13 μSv y-1 for discharges at the proposed discharge limit. These doses are lower than 20 μSv y-1. As a result a stage 3 assessment was not carried out. 5.2.4 Total Individual Doses for Comparison with the Discharge Limit and Discharge Constraint In order to derive the annual dose from all discharges to the most exposed members of the public, the following have to be taken into account: Annual dose from liquid discharges (Section 5.2.3.1) Annual dose from atmospheric discharges (Section 5.2.3.2) From the results of the dose assessments for the fisherman family (exposed to liquid discharges from the proposed facility) and for the local resident family (exposed to aerial discharges), it can be seen that the local resident family potentially receives the highest dose. As a result, the local resident family is the individual exposure group receiving the highest dose in this assessment. However, it can not be ruled out at this stage that the fisherman family is not exposed to the aerial discharges from the facility and vice versa for the local resident family. Therefore, it is prudent to add the contribution from both discharge streams. Thus, the annual dose to the critical group for all continuous discharges from the AP1000 NPP design is 5.8 μSv y-1 for representative discharges and 9.2 μSv y-1 for limit discharges. In order to assess the total annual dose to the critical group, direct radiation also needs to be taken into account. Adding the direct radiation dose of 4 μSv y-1 (Section 5.2.2.3) to the dose from all discharges gives a total dose of 9.8 μSv y-1 for representative discharges and 13.2 μSv y-1 for limit discharges. These represents maximum critical group doses as it is assumed that members of this group are exposed to both discharge streams as well as the direct radiation dose expected at the site boundary fence. This value can be compared with the dose constraint of 300 μSv y-1 which is applicable to any single new source in the UK (Reference 5-10). The doses lie well below the dose constraint, by a factor of over 20. The total dose to the Sizewell critical group in 2007 was <5 μSv (Reference 5-8). It should be noted that this dose has been derived using different methods from those applied here; for example, radionuclide levels in terrestrial and marine foodstuffs were based on monitoring data rather than computer model calculations. 5.2.5 Potential Short-Term Doses 5.2.5.1 Approach When doses from routine discharges are assessed, it is normally assumed that these discharges occur continuously and uniformly over a year. However, during normal operations at nuclear sites, it is possible to have short-term enhanced releases, e.g., during routine maintenance operations of the plant. An assessment of the potential impact of short-term doses is typically carried out as part of a detailed stage 3 assessment. Although a full stage 3 dose assessment of operational discharges of the AP1000 NPP was not undertaken, an UKP-GW-GL-790 238 Revision 4 5.0 Environmental Impact UK AP1000 Environment Report assessment of the potential impact of short-term doses was carried to determine if the impact is significant in comparison with the doses from routine releases. Discharging radioactive material to the atmosphere over the short-term may lead to doses that are higher than would be expected if it were assumed that the same discharge took place uniformly over a year. This is mainly due to the fact that short-term releases can lead to peak activity concentrations in air and foodstuffs, which, combined with seasonal agricultural practices and variation in habit data, can lead to higher doses. For liquid discharges to the marine environment, effects from short-term releases are deemed to be much lower. This is mainly due to limited pumping capacity from discharge tanks, making it unfeasible to assume that a month’s liquid discharge volume can be released into the marine environment over a period of a few hours. Also, for marine discharges via a pipeline which discharges into the sea away from the near shore, the timescale of the release is less important than for atmospheric, marine near shore, or freshwater releases. This is because travel times to potential exposure locations are much longer. As a result, only the effects from short-term aerial releases are assessed here. A methodology published by the Health Protection Agency (HPA) has been adapted to assess the impact of short-term atmospheric releases from the AP1000 NPP design (Reference 511). 5.2.5.2 Atmospheric Dispersion Modelling for Short-Term Release The short-term discharges have been grouped into the same radionuclide categories used for the routine assessment (see Section 5.2.2.2). The maximum short-term planned discharge is taken to be the highest planned discharge in a single month, based on Table 6.1-3. The discharge period is conservatively set at 0.5 hours, the shortest period recommended in the HPA methodology. The discharge is data used in this assessment is shown in Table 5.2-18. The atmospheric dispersion model ADMS (Reference 5-9) was used to derive activity concentrations in air, deposition rates, and cloud gamma doses. The model set up was based on HPA’s recommendation to give a cautious estimate of atmospheric concentrations and deposition on the ground close to the discharge location (Reference 5-11). Details of meteorological conditions and deposition rates used are given in Table 5.2-19. To derive activity concentrations in air and deposition rates ADMS was run with the building and plume rise options enabled. The relevant model set up parameters are shown in Table 5.2-14. To derive cloud gamma dose factors ADMS was run using an effective release height, as the building module can not be run at the same time as the gamma dose module. The effective release height for short-term releases was derived similarly as described in Section 5.2.3.2 but using the meteorological data given in Table 5.2-19. The predicted activity concentrations in air and deposition rates per unit release for each radionuclide from the ADMS model run are shown in Table 5.2-20. For the cloud gamma pathway cloud gamma dose factors from gamma emitting radionuclide daughters were aggregated into the results for each parent radionuclide. The cloud gamma dose factors are shown in Table 5.2-21. 5.2.5.3 Dose Calculation for Short-Term Release The dose pathways and exposure locations assumed for these short-term releases were the same as for the atmospheric dose methodology for routine releases, described in Section 5.2.2.2. UKP-GW-GL-790 239 Revision 4 5.0 Environmental Impact UK AP1000 Environment Report The doses to adults, children, and infants were calculated separately for each pathway. The methodology used to calculate the dose from the modelled activity concentrations for each pathway is the same as the HPA’s. More information on the input data is given below: The breathing rates were taken from Table 4 in the HPA report (Reference 5-11), shown here in Table 5.2-22. The same dose per unit intake values for ingestion and inhalation were used as for the assessment for routine releases described in Section 5.2.2.2 and shown in Table 5.2-7. The crop and animal uptake concentrations per unit deposition were derived from runs of the FARMLAND module which is part of the PC CREAM08 modelling suite (Reference 5-12). The values were adjusted for a single, instantaneous deposition. That is: The concentration C in the food at time T following a continuous deposition rate of 1 Bq/m2/s is given by T CT cT t dt 0 where c(τ) is the concentration in the food at time τ after an instantaneous unit deposition. The average concentration over a period from an instantaneous deposition is the integrated concentration over the year divided by the length of period, i.e.: cT T 1 ct dt T 0 Reversing the integration limits (i.e., substitute t'=T-t) shows that this is equivalent to: T 1 cT cT t 'dt ' T0 Therefore, the average concentration in food over the year after an instantaneous deposition is: cT CT CT T 365 24 3600 That is, the average concentration in food over one year from an effectively instantaneous 1 Bq/m2 deposition is the Farmland output concentration following a continuous release for one year divided by 3.2 x 10⁷. For tritium and carbon-14, the values are for a continuous air concentration of 1 Bq m-3, and a similar argument applies. The final values are shown in Table 5.2-23. Note that the tritium and carbon-14 crop uptakes are based on air concentrations, rather than ground deposition rates. UKP-GW-GL-790 240 Revision 4 5.0 Environmental Impact UK AP1000 Environment Report The critical and average food intake rates are taken from Reference (5-22). Note that critical group intakes were only used for the two food groups giving the highest dose for each person; average intakes were used for other foods. The two foods leading to the highest ingestion dose are root vegetables and milk. The ingestion rates used for the short-term dose assessment are shown in Table 5.2-24. The annual external dose per unit surface deposition rates were taken from the ORNL Radiological Toolbox (Reference 5-13) and adjusted for radioactive decay over a year. The final dose rates are shown in Table 5.2-25. The shielding and occupancy factors were taken from Table 5 in the HPA report (Reference 5-11) and are reproduced here in Table 5.2-26. The results are shown in Table 5.2-27 for adults, Table 5.2-28 for children and Table 5.2-29 for infants by radionuclide and pathway. The highest dose to the local inhabitant exposure group from a single atmospheric short-term discharge release is 4.9 μSv. 5.2.6 Collective Dose Assessment 5.2.6.1 Assessment Approach Radionuclides discharged into the environment have the potential to disperse, allowing exposure of wider populations, albeit at much lower levels of individual exposure than to the individuals within the general population who would be expected to receive the highest doses (the critical group). This collective effective dose is defined as the sum of all the exposures from a given source to a defined group of people and has units of man-sieverts (manSv). The assessment of collective dose was carried out following guidance provided in Reference 5-10. Collective doses will arise from discharges of radionuclides to atmosphere and from liquid discharges to the marine environment. Collective doses were derived by combining discharge rates and collective dose per unit discharge factors. The collective dose per unit discharge factors for radionuclides discharged to atmosphere and sea were calculated using the PC CREAM08 model (Reference 5-12). The collective dose assessment is based on population and food production grids for the atmospheric assessment and seafood catch data for the marine assessment. PC CREAM also contains a model to estimate doses from the global circulation of released radionuclides. Some radionuclides, owing to the magnitude of their radioactive half-lives and their behaviour in the environment, may become globally dispersed and act as a long-term source of irradiation of both the regional and world populations. Such exposures would be in addition to the irradiation of the populations exposed during the initial dispersion of these radionuclides from their points of discharge. Of the radionuclides discharged by the AP1000 NPP design, tritium, carbon-14, and krypton-85 are affected by this characteristic. As a result, the UK and Europe doses presented here are the sum of the so-called “first pass” dispersion dose and the global circulation component for these radionuclides. Collective doses to the world population from atmospheric discharges were assumed to be equivalent to the first pass dispersion dose for Europe plus the global circulation component for the world population for tritium, carbon-14, and krypton-85. Where krypton-85 was used as surrogate radionuclide for “other noble gasses,” the global circulation part of the dose was not included, as all noble gasses listed under that category have half lives of a few days at most. UKP-GW-GL-790 241 Revision 4 5.0 Environmental Impact UK AP1000 Environment Report Collective doses were calculated for UK, European, and World populations, truncated at 500 years. Collective dose assessments from routine discharges tend to be site-specific as they rely on grids of population distribution, agricultural food production, and seafood catches that have been established for individual sites. In the absence of a specific site, the collective dose assessment was carried out for an AP1000 NPP located at each of the five representative coastal sites used to determine the generic site characteristics – Dungeness, Hartlepool, Heysham, Hinkley Point, and Sizewell (see Section 5.1). 5.2.6.2 Collective Doses from Liquid Discharges Liquid discharges to the marine environment are based on data from Table 6.1-6. For the purpose of the dose assessment, cerium-144 was assigned as surrogate radionuclide to the ‘other radionuclides’ category. Doses were calculated for annual representative discharges as well as for calculated annual limit discharges. Representative radionuclides and liquid discharge rates used for the dose assessment are shown in Table 5.2-1. Default PC CREAM model settings were applied. 5.2.6.3 Collective Doses from Gaseous Discharges Atmospheric discharges were taken from Table 6.1-5. For the purpose of the dose assessment representative surrogate radionuclides were assigned to the following categories: Iodine-133 for “other iodines,” taken to be all radioiodines apart from iodine-131 for which doses have been assessed individually; Krypton-85 for “other noble gasses,” taken to be all isotopes of krypton and xenon apart from krypton-85 and xenon-133 for which doses have been assessed individually; Cobalt-58 for “other particulates,” taken to be all particulates apart from cobalt-60, strontium-90, and caesium-137, for which doses have been assessed individually. Doses were calculated for annual representative discharges as well as for annual limit discharges. Representative radionuclides and gaseous discharge rates used for the dose assessment are shown in Table 5.2-6. Default PC CREAM model settings were applied with the following exceptions: 5.2.6.4 An effective release height of 40 m was applied, as described in Section 5.2.2.2. For the atmospheric assessment, an atmospheric stability distribution of 50 percent category D was applied (see Table 5.1-6). Collective Dose Assessment Results The collective doses per year of discharge and truncated to 500 years from the AP1000 NPP are shown in Tables 5.2-30 and 5.2-31 for discharges to atmosphere and in Tables 5.2-32 and 5.2-33 for liquid discharges to the marine environment. These tables provide maximum, averaged, and minimum summary statistics of the results obtained for the five sites evaluated. UKP-GW-GL-790 242 Revision 4 5.0 Environmental Impact UK AP1000 Environment Report For representative discharges to the atmosphere the maximum collective dose is 0.23 manSv for the UK population, 1.5 manSv for the European population and 8.8 manSv for the World population. For limit discharges to the atmosphere the maximum collective dose is 0.36 manSv for the UK population, 2.3 manSv for the European population and 14 manSv for the World population. For representative liquid discharges the collective dose is 0.001 manSv for the UK population, 0.0046 manSv for the European population and 0.033 manSv for the World population. For limit liquid discharges the collective dose is 0.0017 manSv for the UK population, 0.0072 manSv for the European population and 0.053 manSv for the World population. The total collective doses are dominated by doses from atmospheric discharges by more than two orders of magnitude. 5.2.7 Build-up of Radionuclides in the Environment The prospective build-up of radionuclides discharged from the facility in the local environment has been evaluated. For liquid discharges into the marine environment, the build-up in marine coastal sediments has been assessed. For aerial discharges, the build-up in undisturbed soil has been assessed. In order to take account of accumulation of radionuclides over the plant’s operational life span, the plant’s anticipated licensing period should be taken into account (Reference 5-10). Therefore it was assumed that build-up occurs over 60 years. For discharges to the atmosphere, predicted environmental concentrations of radionuclides in soil were obtained with the PLUME and FARMLAND modules of the PC CREAM08 model (Reference 5-12). For the build-up in the environment, radionuclides present in the discharge list have been assessed individually, rather than grouped into categories. The build-up of noble gases in soil and sediments was assumed to be negligible. Tritium and carbon-14 are not included in FARMLAND. The transfer of tritium and carbon-14 between the atmosphere and the terrestrial environment is more complex than that for other radionuclides, since hydrogen and carbon are fundamental to biological systems. A relatively simple “specific activity” approach is widely used in terrestrial foodchain modelling for these radionuclides. It is assumed that all foodstuffs come into rapid equilibrium with atmospheric carbon-14 and tritium in atmospheric water vapour, and thus, it is implicitly assumed that build-up does not occur. Discharge data used are based on data in Tables 3.3-6 to 3.3-8. These are average annual discharges based on average releases over the 18 month fuel cycle. The following assumptions were made for calculating soil concentrations as a result of aerial releases: Effective stack height of 67 m (derived for a distance of 500 m using the method described in Section 5.2.3.2) Distance from source 500 m Uniform windrose UKP-GW-GL-790 243 Revision 4 5.0 Environmental Impact UK AP1000 Environment Report Atmospheric stability category distribution of 50% D For discharges to the marine environment, predicted environmental activity concentrations of radionuclides in coastal sediments were obtained with the DORIS module of the PC CREAM08 model (Reference 5-12). As far as possible, radionuclides present in the discharge list have been assessed individually. Discharge data are based on the average annual data in Table 3.4-6. Any radionuclides in the discharge list for which model parameters were not available have not been assessed. These include rubidium-88, molybdenum-99 and tungsten-187. The following assumptions were made for calculating coastal sediment concentrations as a result of liquid discharges: Volumetric exchange rate of water between the local and adjacent regional compartments: 130 m3 s-1. Activity concentrations in soil after 60 years of atmospheric discharges from the AP1000 NPP design are shown in Table 5.2-34 for the radionuclides in the discharge list and their daughters. Activity concentrations in the soil range from 2.9 x 10⁻²⁰ Bq kg-1 for niobium-95m to 1.1 x 10⁻¹² Bq kg-1 for caesium-137. Activity concentrations in local coastal sediment after 60 years of liquid discharges from the AP1000 NPP design are shown in Table 5.2-35 for the radionuclides in the discharge list and their daughters. The activity concentration for tritium is 14 Bq kg-1 and that of carbon-14 is 1.1 Bq kg-1. The activity concentrations for all other radionuclides in the sediment range from 3.4 x 10⁻¹⁹ Bq kg-1 for daughters of plutonium-241 to 0.54 Bq kg-1 for nickel-63. Interpretation of these activity concentrations is not clear at present as no widely accepted guidance is available. However, the radiological impact of these is already covered in the dose assessments in Sections 5.2.2 to 5.2.4. The dose assessments also incorporate the buildup of the radionuclides in the environment as the doses have been assessed in the 60th year of discharge. 5.3 Radiological (Non-Human Dose Assessment) An assessment of the likely impact of radioactive discharges from the Westinghouse AP1000 NPP on non-human species has been made in UKP-GW-GL-033, “Assessment of Radioactive Discharges on Non-Human Species” (Reference 5-14). This report is summarized in this section. The predicted radioactive emissions and discharges from the AP1000 NPP are input into the ERICA tool (Reference 5-3) to determine the impact on the various reference organisms identified in Table 5.1-4. The Wildlife Dose Assessment Spreadsheet Version 1.20 (Reference 5-15) was used to address the impact of emissions of the inert gas isotopes – argon, krypton, and xenon. 5.3.1 ERICA Assessment The ERICA tool provides a recognized methodology for assessing the environmental exposure, effects, and risks from ionising radiation on ecosystems (Reference 5-3). The ERICA tool functions at three levels: Tier 1 – a concentration screening level UKP-GW-GL-790 244 Revision 4 5.0 Environmental Impact UK AP1000 Environment Report The Tier 1 output is expressed as a risk quotient (RQ) where: RQ = M/EMCL where M = EMCL = Estimated or measured activity concentration for a given radionuclide in Bq l-1 for water, Bq kg-1 dry wt for soil/sediment, or Bq m-3 for isotopes of C, H, P, and S within the terrestrial environment; Screening Dose Rate (10 μGy h-1)/F where F = the dose rate that a given organism will receive for a unit concentration of a given radionuclide in an environmental medium (μGy h-1 per Bq l-1 or kg-1 (dry weight) or m-3 of medium). The value of F depends upon the reference organism type, its position(s) within habitat, and the radionuclide. It is calculated by the ERICA tool. For the terrestrial environment, EMCL values always refer to soil activity concentrations, except for isotopes of H, C, S, and P that refer to air concentrations Tier 1 compares emissions and discharges against a default incremental dose rate of 10 μGy h-1 for all ecosystems and organisms. The overall RQ is the sum of the RQs for the most limiting reference organism for each radionuclide. If the sum of the RQs for all nuclides is less than one, there is a very low probability that the absorbed dose rate to any organism exceeds the screening dose rate, and the situation may be considered to be of negligible radiological concern. If the ratio exceeds unity, further Tier 2 assessment is required. Tier 2 – a dose rate screening level Tier 2 is a dose rate screening level. In Tier 2, the ERICA screening dose rate of 10 μGy h-1 is compared directly to the total estimated whole body absorbed dose rate for each individual organism. The RQ is calculated as follows: Whole Body Absorbed Dose Rate RQ = Screening Level Dose Rate In Tier 2, RQ for a given organism equals the sum of the radionuclide-specific RQs for that organism. Two RQs are reported in Tier 2 for every organism selected in the assessment; the expected RQ and the conservative RQ. The expected RQ uses the best estimate values for the input data and the parameters. The conservative RQ uses the 95th or 99th percentile input values to determine the 5 percent or 1 percent probability of exceeding the dose screening value. The significance of the Tier 2 output is determined based on the values of the expected RQ and the conservative RQ for each individual organism (see Table 5.3-1). The results are categorized as “negligible,” “insufficient confidence,” and “of concern.” UKP-GW-GL-790 245 Revision 4 5.0 Environmental Impact UK AP1000 Environment Report For results in the “insufficient confidence” and “of concern” category, it may be necessary to make more qualified judgments and/or to refine model inputs to complete the Tier 2 assessment. Alternatively, an in-depth Tier 3 assessment is required. Tier 3 – site-specific probabilistic level which is beyond the scope of work carried out in Reference 5-14. The ERICA assessment was carried out at the Tier 1 level for terrestrial organisms and at the Tier 1 and Tier 2 level for marine organisms. 5.3.1.1 Terrestrial Organisms The input data for the ERICA tool is shown in Tables 5.3-2 to 5.3-3 for the terrestrial ecosystem assessment that is impacted by air emissions. The Tier 1 output of the ERICA model is shown in Table 5.3-4. The Tier 1 results show that the sum of the RQs is substantially below unity indicating that the values are below the ERICA screening dose rate of 10 µGyh-1. This indicates that no further analysis at Tier 2 or Tier 3 is required. Sensitivity testing of the of the terrestrial ERICA assessment was carried out to determine whether changing wind speed, distance to receptor and stack height would affect the overall RQ. The results of the sensitivity tests are shown in Table 5.3-5 and are described below: Scenario A is a default scenario which matches the results in Table 5.3-4. Scenario B identifies the effect on the RQ if all emissions were released from the lower turbine vent stack. In practice, no more than 12 percent of the radioactivity emitted to the atmosphere from the plant is potentially released from the condenser air removal stack (see Table 3.3-7), so this is highly conservative. Scenarios C-F show the impact of changing the wind speed from 1 ms-1 to 10 ms-1. The RQ reduces as the wind speed increases. Scenarios G-J show the effect of changing the distance to receptor from 50 m to 300 m. The RQ reduces as the distance to receptor increases. Scenario K is a worst case scenario assuming emissions are from the lower stack height, the lowest wind speed, and the nearest receptor distance. Under these conditions, the overall RQ is 0.291 indicating that the screening dose rate of 10 µGyh-1 is not exceeded. It is concluded from the Tier 1 ERICA assessment that there is negligible risk to terrestrial organisms from the AP1000 NPP radioactive air emissions. 5.3.1.2 Marine Organisms The input data for the ERICA tool is shown in Tables 5.3-6 and 5.3-7 for the marine ecosystem assessment that is impacted by coastal discharges. The Tier 1 output of the ERICA model is shown in Table 5.3-8. The results indicate that the sum of the RQs exceeds 1. The screening dose to polychaete worms warrants a Tier 2 assessment. UKP-GW-GL-790 246 Revision 4 5.0 Environmental Impact UK AP1000 Environment Report A Tier 2 analysis was carried out with all isotope data sets to predict total dose rates for each reference organism. The Tier 2 results for the ERICA model are presented in Table 5.3-9. Based on the definition in Section 3.2.2, the Tier 2 results indicate “negligible risk” to wading birds, zooplankton, pelagic fish, and phytoplankton at distances greater than 100m from the point of release. The results for mammals and reptiles indicate “insufficient confidence” to be sure that there will be negligible effect on these organisms which live within the sediment. The results for polychate worms, macroalgae, sea anemonies or true corals – polyps and colonies, benthic molluscs, vascular plants, benthic fish, and crustaceans show that the ERICA screening dose rate of 10 µGyh-1 is exceeded. The maximum predicted dose rate for all organisms is 25.2 µGyh-1 for polychaete worms. Table 5.3-9 shows that the isotopes responsible for the ERICA screening dose rate being exceeded either Fe-59 or Fe-55. Iron partitions strongly into the sediment phase and the organisms experiencing dose rates greater than the ERICA screening dose rate of 10 µGyh-1 are the ones that have high occupancy factors in the sediment or at the sediment-water interface. The sensitivity of the Tier 2 results to changes in input parameters has been investigated for variations in water depth, distance between release point and shore, distance between release point and receptor, and coastal current. The results are shown in Table 5.3-10 and are described below: Scenario A represents the default scenario which matches the results in Tables 5.3-10 and 5.3-9. Scenarios A-D show the effect of changing water depth. The dose rate decreases with increasing water depth. At a depth of 7m, only polychaete worms dose date exceeds the ERICA screening dose rate of 10 µGyh-1 (Scenario C). At a depth of 13m, the dose rate to polychaete worms drops below the ERICA screening dose rate and changes to a “insufficient confidence” condition, where the conservative RQ exceeds 1. Scenarios A and E-G show that changing the distance between the release point and the shore has no effect on dose rates on organisms 100m from the discharge point at sea. Scenarios A and H-K show the effect of changing the distance between the release point and the receptor. The ERICA screening dose rate is exceeded for at least one organism at all distances between the release point and receptor up to 220m (Scenario J). At 220m, the most sensitive organism, polychate worms, falls into the “insufficient confidence” category together with seven other organisms. At 560m (Scenario K) and beyond, the dose rates for all organisms fall into the “negligible” category indicating negligible risk. Scenarios A and L-N show the effect of changing the coastal current. The predicted dose rates decrease slightly as the coastal current decreases from 0.5 ms-1 to 0.05 ms-1. The number of organisms receiving dose rates above the ERICA screening level falls from eight to six as the coastal current decreases. Scenario O shows the worst case combination of variables from the scenarios selected above (i.e., water depth 2m, the distance between the release point and the shore 150m, the distance between the release point and the receptor 50m, and the coastal current 0.5 ms-1). The results predict that the ERICA screening dose rate is exceeded for eleven UKP-GW-GL-790 247 Revision 4 5.0 Environmental Impact UK AP1000 Environment Report organisms with the highest predicted dose rate of 191 μGyh-1being experienced by polychaete worms. Scenario P shows the best case combination of variables from those selected above (i.e., water depth 13m, the distance between the release point and the shore 150m, the distance between the release point and the receptor 560m, and the coastal current 0.05 ms-1). The results produce a “negligible” risk condition for all organisms. The sensitivity analysis confirms that polychaete worms are the most vulnerable organism, experiencing the highest dose rates. This is because polychaete worms are the only organism that resides entirely within the sediment, and the dominant source of radioactive dose is from Fe-59 and Fe-55 (see Table 5.3-9), which partitions strongly into sediments. The range of dose rates predicted for polychaete worms in this sensitivity analysis is 3.27 μGyh-1 to 191 μGyh-1. Organisms with occupancy factors of 100% at the sediment water interface (benthic molluscs, crustacean, macroalgae, benthic fish, sea anemones, or true corals – colony, polyps, and vascular plants) experience the next highest dose rates ranging from 0.5 μGyh-1 to 103 μGyh-1. Mammals, wading birds, and reptiles have 100% occupancy factors in water, but food sources may be within the sediment or at the sediment – water interface. These organisms receive a range of dose rates under the scenarios considered of 0.1 μGyh-1 to 26 μGyh-1. The organisms which experience the lowest dose rates fall within the “negligible” risk category for all scenarios. These are pelagic fish, phytoplankton, and zooplankton which have 100 percent occupancy factors in water with no habitation within the sediment surface or sediment zones. These organisms receive a range of dose rates under the scenarios considered of 0.001 μGyh-1 to 0.2 μGyh-1. The predicted dose rates have been compared with reported effects on organisms in Reference 5-14. However, it is notable that the dose rates are well below the 400 µGyh-1, which is a benchmark derived from the IAEA (1992) and UNSCEAR (1996) reports below, which populations are unlikely to be significantly harmed based on reviews of the scientific literature (References 5-16 and 5-17). This also corresponds to the U.S. Department of Energy (DoE) dose limit of 10 mGyd-1 (≈ 400 µGyh-1) for native aquatic animals (Reference 5-18). The prediction that the ERICA screening dose rate of 10 µGyh- is exceeded for several organisms and the sensitivity analysis carried out indicates the importance of undertaking site-specific studies to optimize the selection of the effluent discharge point and minimize the impact on benthic organisms. 5.3.2 Wildlife Dose Assessment Spreadsheet The Wildlife Dose Assessment Spreadsheet (Reference 5-15) was developed in the UK and formed an important building block of the ERICA tool. This spreadsheet comes in three forms; the freshwater, marine, and terrestrial versions. The terrestrial spreadsheet was used to supplement the analysis carried out by the ERICA tool, because it enables the impact of emissions of Argon-41 and Krypton-85 to be assessed. These inert gases contribute approximately 80 percent of the radioactive releases from the AP1000 NPP to the atmosphere (see Tables 3.3-6 to 3.3-8). UKP-GW-GL-790 248 Revision 4 5.0 Environmental Impact UK AP1000 Environment Report The input data for the Wildlife Dose Assessment Spreadsheet includes the ground level concentrations of argon-41 and krypton-85 in Bqm-3 predicted at the assumed receptor distance of 200m. These have been calculated using the emissions data identified in Table 5.3-2 and the same Gaussian plume model equations as those built into the ERICA tool for an emission point that is in the lee of a building inside the wake zone [Ref. 5-8]. The ground level concentrations are shown in Table 5.3-11 together with other input data used in the Wildlife Dose Assessment Spreadsheet. The weighted output of the Wildlife Dose Assessment Spreadsheet for the air emissions of Argon-41 and Krypton-85 is shown in Table 5.3-12. For Argon-41 and Krypton-85, the total dose rate occurs entirely from external rather than internal dose rates. The highest total dose rate occurs for fungi and is 0.00027 µGyh-1. This is negligible when compared to the ERICA screening dose rate of 10 µGyh-1. This implies that the dose rate associated with noble gas emissions on terrestrial organisms is insignificant. 5.4 Accidental Release of COMAH Chemicals The AP1000 NPP site is a lower tier COMAH site because of storage of hydrazine (see subsection 2.9.2.1). The potential for a major accident to the environment (MATTE) resulting from the storage of hydrazine is minimal. 5.4.1 Causes of Hydrazine Spills Hydrazine is stored on the Turbine Island in tote tanks (see subsection 2.9.3.1 and Figures 2.9-2 and 2.9-3). Overflow from over filling the lower permanent storage tank from the tote container is not possible since there is no overflow connection. The worst case of misalignment results in filling vent pipes to the level of the hydrazine in the tank assembly. These vent pipes are directed up to a high elevation and cannot overflow. There is no manual handling of drums or carboys that can be overturned or running drum pumps that can be left unattended. The only credible cause of a major hydrazine spill is the puncturing of a tote container or lower permanent storage tank by a fork truck tine. The tote containers are rugged and have passed severe drop and vibration tests. Should a tine penetrate the protective outer shielding and tough inner wall, the leak rate would be limited by the size of the puncture. For a punctured tote container, the truck operator will be able to back up and tip the tote so that the hole is on the top, stopping the leak. A punctured permanent tank will drain the level of the hole in its side. The leak from a permanent storage tank will be contained within the spill barrier. However, the tough stainless steel walls of both the tote container and permanent tank are likely to bend and deform before they can be pierced. 5.4.2 Accidental Hydrazine Spills within the Turbine Building During tote container handling, it is possible for a tote container to be dropped by a fork truck. These containers are certified for retention of contents by having been tested to ensure unacceptable leakage does not occur when the container is full and dropped in a way that is most likely to cause damage. Dropping a tote container inside or outside the turbine building is expected to be so rare an event that it will not happen during the life of the plant. Failure of the container to permit release of its contents is not probable. A feature at most plants is to have a temporary secondary containment established at the truck delivery/loading point. This UKP-GW-GL-790 249 Revision 4 5.0 Environmental Impact UK AP1000 Environment Report should be large enough to contain the contents of a dropped tote. The AP1000 NPP intends to follow the best practices developed by the nuclear industry. Should there be a large spill in the turbine building during transport of the tote to the chemical storage area, the hydrazine will run into floor drains and flow to the building sump, part of the WWS. The wetted floor areas can be flushed with bleach (dilute sodium hypochlorite solution) to neutralize and wash the remaining hydrazine into the floor drain system (Reference 5-19). Additional bleach or concentrated sodium hypochlorite solution can then be added by pouring it into the floor drains. The sump is automatically pumped based on level into the WWS WWRB where waste water is held prior to its release to the plant outfall. The WWRB water is sampled and the chemical adjustment is made until it complies with discharge consents. When samples show the hydrazine has been reacted, the WWRB contents are disposed. Therefore, a liquid chemical release from the turbine building through the WWS to the plant out fall is not a credible scenario. 5.4.3 Accidental Hydrazine Spills outside the Turbine Building The worst case conceivable spill within the AP1000 NPP site is the release of the contents of a hydrazine tote container (400 gallons, 1.51 m3), due to overturning a trailer during transportation on the plant site roadway. In the event that a large spill occurs outside of the turbine building, the liquid should be contained within a temporary spill barrier. If a large amount of hydrazine is involved, the wetted area should be sowed with solid calcium hypochlorite and washed with bleach dilute sodium hypochlorite solution (Reference 5-19). A small spill should be treated with bleach only. Using solid calcium hypochlorite results in an insoluble gooey paste like semi-solid that will present problems for subsequent cleanup. An unmitigated spill unto an impermeable surface can be expected to behave in the same fashion as the Air Force hydrazine test samples that were left outside exposed to the environment. Hydrazine solutions evaporate in a similar fashion as does water when exposed (Reference 5-19). There is an initial high evaporation rate followed by a much slower evaporation rate. The density of the solution increases as hydrazine reacts with atmospheric carbon dioxide and the resulting product passes through stages described as oily, a syrupy consistency, and finally, a white semi-solid. Vapor-phase hydrazine is degraded in the atmosphere by reaction with photochemically-produced hydroxyl radicals and ozone with estimated half-lives of about 6 and 9 hours, respectively. A spill onto soil will result in rapid neutralization of hydrazine due to reactions with organic carbon and clay. Spills onto sand will penetrate more deeply and take longer to neutralize. 5.4.4 Hydrazine in the Marine Environment Hydrazine is dangerous for the environment and is toxic for aquatic organisms (Reference 5-20). Depending upon the species of fish, the toxicity levels and reproductive effects are likely to occur after a long exposure (24 to 96 hours) of hydrazine with concentrations on the order of 0.1 mg/liter and higher. Other marine organisms showed a wider range of tolerance to hydrazine than fish. In the event of accidental release of the contents of a hydrazine tote container (400 gallons, 1.51 m3) on the plant site roadway, the hydrazine will tend to drain toward the storm water drainage system or into the WWRB. The design of the storm water drainage system is siteUKP-GW-GL-790 250 Revision 4 5.0 Environmental Impact UK AP1000 Environment Report and utility operator-specific. Provisions for temporarily blocking flow from this drainage system into the sea are also site- and utility operator-specific. The portion of the large spill that works its way through the storm water drainage system into the sea will be promptly diluted to well below the toxic concentrations listed in the World Health Organisation (WHO) report (Reference 5-20). In the event of such a large spill, there is a risk of the hydrazine deoxygenating a quantity of water because oxygen is a neutralizing agent for hydrazine. Deoxygenation of sea water is hazardous to marine life. However, this risk is reduced because hydrazine will be in contact with the air above sea level with attendant vaporization, decomposition, and oxidation3 limiting the amount that reaches the sea. If some or the entire spill goes onto unpaved ground, research has shown that sand, soil, clay, and organic substances aid in the consumption of hydrazine. This reflects the results of two general processes; the chemical decomposition of hydrazine, and its reaction with soil components (Reference 5-21). The theoretical quantity of deoxygenated seawater due to mixing with 400 gallons (1.51 m3) of hydrazine is 17,400,000 gallons (66,000 m3), assuming a seawater oxygen concentration of 8.1 mg/l at 59°F or 15°C. This assumes a thorough dispersion of hydrazine throughout the body of water and reaction only with dissolved oxygen. It does not take into account the competing reduction due to dissolved cation catalytic decomposition and reactions of hydrazine with dissolved and suspended solids. Experimental studies have shown a slow decrease of very dilute hydrazine in seawater. Hydrazine can persist in seawater for days. Wave action at the seacoast produces a rapid rate of hydrazine dilution. Therefore, it is unlikely that the entire quantity of a tote container’s hydrazine or the turbine building’s hydrazine storage will spill into the sea and the consequential deoxygenation effect will be much less than the theoretical maximum. The potential effects on aquatic organisms will be of a minor, limited spatial extent, for a short duration, and local to the release point. 5.4.5 Summary of Accidental Hydrazine Release Control Measures In summary, the protective measures to prevent total release of hydrazine are: Primary containment within the turbine building Secondary containment within the turbine building Spill collection within the turbine building sumps Manual intervention can neutralize hydrazine spills in secondary containment, turbine building sumps, or the WWRB to prevent releases to the environment. WWRB Temporary spill barriers for outdoor spills A realistic spill is limited to an insignificant portion of the total hydrazine and the protective measures will be effective to prevent release into the sea. UKP-GW-GL-790 251 Revision 4 5.0 Environmental Impact 5.5 UK AP1000 Environment Report References 5-1 UKP-GW-GL-025, Rev. 1, “Generic Site Report,” Westinghouse Electric Company LLC, January 2010. 5-2 MAGIC: http://www.magic.gov.uk. 5-3 Contract Number: F16R-CT-2004-508847, “D-ERICA: An INTEGRATED APPROACH to the assessment and management of environmental risks from ionising radiation,” ERICA, January 2007. 5-4 “Generic Models for Use in Assessing the Impact of Discharges of Radioactive Substances to the Environment,” Safety Report Series No. 19, International Atomic Energy Agency, Vienna 2001. 5-5 Science Report SC030162/SR2, “Initial Radiological Assessment Methodology – Part 2 Methods and Input Data,” Environment Agency, May 2006. 5-6 “Earthquakes in the UK,” British Geological Survey website, 2009. 5-7 Science Report SC030162/SR1, “Initial Radiological Assessment Methodology – Part 1 User Report,” Environment Agency, May 2006. 5-8 ADMS 4.1, “Atmospheric Dispersion Modelling System,” Cambridge Environmental Research Consultants, June 2008. 5-9 RIFE-13, “Radioactivity in Food and the Environment, 2007,” Appendix 1, Environment Agencies, December 2008. 5-10 Smith, J.G., P. Bedwell, C. Walsh, S.M. Haywood, “A Methodology for Assessing Doses from Short-Term Planned Discharges to Atmosphere,” NRPB-W54, Issue 5, March 2004. 5-11 “Radiological Toolbox,” Version 2.0.0, ORNL, August 2006. 5-12 Mayall, A., T. Cabianca, C. Attwood, C.A. Fayers, J.G. Smith, J. Penfold, D. Steadman, G. Martin, T.P. Morris, J.R. Simmonds, “PC-CREAM Installing and Using the PC System for Assessing the Radiological Impact of Routine Releases,” EUR 17791 EN, NRPB-SR296, 1997. 5-13 “Authorisation of Discharges of Radioactive Waste to the Environment: Principals for the Assessment of Prospective Public Doses,” Environment Agency, Scottish Environmental Protection Agency, Northern Ireland Department of Environment, National Radiological Protection Board and Food Standards Agency, December 2002. 5-14 UKP-GW-GL-033 Rev. 2, “Assessment of Radioactive Discharges on Non-Human Species,” Westinghouse Electric Company LLC, 2011. 5-15 R&D Publication 128, “Impact Assessment of Ionising Radiation on Wildlife,” Environment Agency, June 2001. 5-16 Technical Report Series No. 332, “Effects of Ionising Radiation on Plants and Animals at Levels Implied by Current Radiation Protection Standards,” IAEA, Vienna, March 1992. UKP-GW-GL-790 252 Revision 4 5.0 Environmental Impact UK AP1000 Environment Report 5-17 UNSCEAR Report to the General Assembly with Scientific Annex, “Effects of Radiation on the Environment. In: Sources and Effects of Ionising Radiation,” United Nations Scientific Committee on the Effects of Atomic Radiation, United Nations, New York, 1996. 5-18 Order 5400.5, “Radiation Protection of the Public and the Environment,” U.S. Department of Energy, 1993. 5-19 CREEDO-TR-78-12, “Studies on Evaporation of Hydrazine and Procedures for Cleanup of Small Spills,” Civil and Environmental Engineering Development Office, Air Force Systems Command, Tyndall Air Force Base, Florida, August 1978. 5-20 “Hydrazine (Environmental Health Criteria S.),” World Health Organization, Geneva, 1987. 5-21 Braun, B. A., J. Zirrolli, “Environmental Fate of Hydrazine Fuels in Aqueous and Soil Environments,” Environics Division Environmental Sciences Branch, Air Force Engineering & Services Center, Florida, 1983. 5-22 Smith, K. R., A. L. Jones, “Generalised Habit Data for Radiogical Assessments”, NRPB-W41, National Radiolgical Protection Board, Chilton, 2003. UKP-GW-GL-790 253 Revision 4 5.0 Environmental Impact UK AP1000 Environment Report Table 5.1-1 NUMBER OF POPULATION CENTRES WITHIN 2KM OF THE GENERIC SITE <1km <2km <10km <20km Closest to Site Boundary >100000 – 0 0 1 8.5km >20000 – 1 3 5 5.2km >5000 – 1 1 6 3.0km >1000 – 0 3 14 3.5km ≤1000 – 0 0 0 – Farms/Properties 50 100 – – 80m Population UKP-GW-GL-790 254 Revision 4 5.0 Environmental Impact UK AP1000 Environment Report Table 5.1-2 HABIT DATA OF LOCAL RESIDENT FAMILY EXPOSURE GROUP Food Consumption Rates (kg/y) Infant (1y) Child (10y) Adult Green vegetables 15 35 80 Root vegetables 45 95 130 Fruit 35 50 75 Sheep meat 3 10 25 Sheep liver 2.75 5 10 Cow meat 10 30 45 Cow liver 2.75 5 10 Milk 320 240 240 Breathing Rates (m3/h) 0.22 0.64 0.92 Occupancy at Habitation (h/y) 8760 8760 8760 Fraction of Time Spent Indoors 0.9 0.8 0.5 Cloud Shielding Factor 0.2 0.2 0.2 Shielding Factor for Deposited Radionuclides 0.1 0.1 0.1 Table 5.1-3 HABIT DATA OF LOCAL FISHERMAN FAMILY EXPOSURE GROUP Food Consumption Rates (kg/y) Infant (1y) Child (10y) Adult Fish 5 20 100 Crustaceans 0 5 20 Molluscs 0 5 20 Occupancy on the Beach (h/y) 30 300 2000 UKP-GW-GL-790 255 Revision 4 5.0 Environmental Impact UK AP1000 Environment Report Table 5.1-4 REFERENCE ORGANISMS CONSIDERED IN THE VICINITY OF THE GENERIC SITE Terrestrial Marine Amphibian (frog) (Wading) bird (duck) Bird (duck) Benthic fish (flat fish) Bird egg (duck egg) Bivalve mollusc Detritivorous invertebrate Crustacean (crab) Flying insect (bee) Macroalgae (brown seaweed) Gastropod Mammal Grasses and herbs (wild grass) Pelagic fish Lichen and bryophytes Phytoplankton Mammal (rat, deer) Polychaete worm Reptile Reptile Shrub Sea anemones/true corals Soil invertebrate (earthworm) Vascular plant Tree (pine tree) Zooplankton UKP-GW-GL-790 256 Revision 4 5.0 Environmental Impact UK AP1000 Environment Report Table 5.1-5 METEOROLOGICAL DATA FOR THE GENERIC SITE Parameter Unit Generic Site Value Max C 37.7 Min C -6.9 Avg C 11.8 Max C 21.7 Min C -12.3 Avg C 7.3 Max % 100.0 Min % 12.0 Avg % 76.2 Max km/h 93.3 Min km/h 8.7 Avg km/h 18 Wind Speed Gust km/h 127.8 Wind Direction Avg Deg 200.5 Gust Deg 241.9 – 0.25 mm/y 998.5 Temperature Dew Point Humidity Wind Speed Maximum fraction of time in any one 30o sector Rainfall UKP-GW-GL-790 Max 257 Revision 4 5.0 Environmental Impact UK AP1000 Environment Report Table 5.1-6 ATMOSPHERIC CONDITIONS Pasquill Stability Category Frequency of Occurrence (%) Wind Speed at 10m Height (ms-1) A 1 1 B 9 2 C 21 5 D 50 5 E 8 3 F 10 2 G 2 1 Table 5.1-7 HIGHEST GROUND ELEVATIONS AROUND THE GENERIC SITE Distance from Site Highest Ground Elevation 2km 30m 10km 358m Table 5.1-8 MAIN LAND COVER WITHIN 5KM Main Land Cover Generic Site Arable and grassland + Arable, some grassland + Dune vegetation + Grassland and arable, some woodland + UKP-GW-GL-790 258 Revision 4 5.0 Environmental Impact UK AP1000 Environment Report Table 5.1-9 CHARACTERISTIC SEMI-NATURAL HABITATS WITHIN 5KM Characteristic Semi-Natural Habitats Generic Site Lowland seasonally wet pastures and woodland + Sand dune vegetation ranging from pioneer dune vegetation through to low shrub + Wet brackish coastal flood meadows and grazing marsh + Table 5.1-10 NEAREST SENSITIVE SITES Type Distance (m) Forestry Commission Woodland (England) 5460 Grassland Inventory (England) 700 Green Belt (England) 7000 Important Bird Areas (England) 250 Local Nature Reserves (England) 850 Lowland Grazing Marsh (England) 340 National Parks (England) 13000 Ramsar Sites (England) 290 RSPB Reserves (England) 1042 Sites of Special Scientific Interest (England) 180 Special Areas of Conservation (England) 330 Special Protection Areas (England) 300 UKP-GW-GL-790 259 Revision 4 5.0 Environmental Impact UK AP1000 Environment Report Table 5.1-11 TIDAL RANGE Tide Generic Site Highest Astronomical Tide 11.17m Mean High Water Springs 10.06m Mean High Water Neaps 7.75m Mean Low Water Springs 1.72m Mean Low Water Neaps 0.67m Lowest Astronomical Tide -0.06m Table 5.1-12 BATHYMETRY Distance from Site Depth (Max/Min) Depth* 1km Max 5m Min -15m Max 5m Min -15m Max 15m Min -15m 2km 10km Note: * Admiralty Chart Datum UKP-GW-GL-790 260 Revision 4 5.0 Environmental Impact UK AP1000 Environment Report Table 5.1-13 MARINE BIOLOGICAL FEATURES WITHIN 10KM Parameter Generic Site Biosphere Reserves 0 Grey Seal Colonies 0 Harbour Porpoise 0 Minke Whales 0 Seabird Nesting Colonies 6 Sensitive Fish Areas 1 Waders and Wildfowl Areas 1 White Beaked Dolphin 0 UKP-GW-GL-790 261 Revision 4 5.0 Environmental Impact UK AP1000 Environment Report Table 5.2-1 ANNUAL LIQUID DISCHARGES APPLIED FOR THE HUMAN DOSE ASSESSMENTS Representative liquid discharges Calculated annual limit liquid discharges Bq/y Bq/y Tritium 3.5E+13 6.0E+13 Carbon-14 4.4E+09 7.0E+09 Iron-55 6.4E+08 1.0E+09 Cobalt-58 5.4E+08 9.0E+08 Cobalt-60 3.0E+08 5.0E+08 Nickel-63 6.9E+08 1.0E+09 Strontium-90 3.2E+05 5.0E+05 Caesium-137 3.0E+07 5.0E+07 Plutonium-241 1.1E+05 2.0E+05 Cerium-144(1) 1.1E+09 2.0E+09 Radionuclide Notes: 1. Surrogate radionuclide for ‘other radionuclides’ category UKP-GW-GL-790 262 Revision 4 5.0 Environmental Impact UK AP1000 Environment Report Table 5.2-2 DOSE PER UNIT INTAKE FACTORS FOR THE ASSESSMENT OF DOSES FROM LIQUID DISCHARGES Dose per unit intake by ingestion (Sv/Bq) Radionuclide Adult Child Infant Tritium 1.8E-11 2.3E-11 4.8E-11 Carbon-14 5.8E-10 8.0E-10 1.6E-09 Iron-55 3.3E-10 1.1E-09 2.4E-09 Cobalt-58 7.4E-10 1.7E-09 4.4E-09 Cobalt-60 3.4E-09 1.1E-08 2.7E-08 Nickel-63 1.5E-10 2.8E-10 8.4E-10 Strontium-90 2.8E-08 6.0E-08 7.3E-08 Caesium-137 1.3E-08 1.0E-08 1.2E-08 Plutonium-241 4.8E-09 5.1E-09 5.7E-09 Cerium-144 5.2E-09 1.1E-08 3.9E-08 UKP-GW-GL-790 263 Revision 4 5.0 Environmental Impact UK AP1000 Environment Report Table 5.2-3 STAGE 1 DOSE PER UNIT RELEASE FACTORS FOR ANNUAL LIQUID DISCHARGES Dose per unit release factor (μSv/y per Bq/y) Radionuclide External Ingestion Total Tritium 0.0E+00 8.9E-16 8.9E-16 Carbon-14 1.6E-16 4.6E-10 4.6E-10 Iron-55 0.0E+00 3.0E-13 3.0E-13 Cobalt-58 5.4E-11 1.5E-11 6.9E-11 Cobalt-60 2.7E-09 7.5E-11 2.8E-09 Nickel-63 0.0E+00 3.6E-12 3.6E-12 Strontium-90 1.0E-15 6.1E-12 6.1E-12 Caesium-137 1.2E-10 2.8E-11 1.5E-10 Plutonium-241 2.4E-13 3.2E-11 3.2E-11 Cerium-144 1.4E-11 1.3E-12 1.5E-11 UKP-GW-GL-790 264 Revision 4 5.0 Environmental Impact UK AP1000 Environment Report Table 5.2-4 STAGE 1 DOSE TO FISHERMAN FAMILY EXPOSURE GROUP FROM REPRESENTATIVE ANNUAL LIQUID DISCHARGES Annual dose from representative discharges (μSv/y) Radionuclide External Ingestion Total Tritium 0.0E+00 3.1E-02 3.1E-02 Carbon-14 7.0E-07 2.0E+00 2.0E+00 Iron-55 0.0E+00 1.9E-04 1.9E-04 Cobalt-58 2.9E-02 8.1E-03 3.7E-02 Cobalt-60 8.1E-01 2.3E-02 8.4E-01 Nickel-63 0.0E+00 2.5E-03 2.5E-03 Strontium-90 3.2E-10 2.0E-06 2.0E-06 Caesium-137 3.6E-03 8.4E-04 4.5E-03 Plutonium-241 2.6E-08 3.5E-06 3.5E-06 Cerium-144(1) 1.5E-02 1.4E-03 1.7E-02 Total 8.6E-01 2.1E+00 3.0E+00 Notes 1. Surrogate radionuclide for ‘other radionuclides’ category UKP-GW-GL-790 265 Revision 4 5.0 Environmental Impact UK AP1000 Environment Report Table 5.2-5 STAGE 1 DOSE TO FISHERMAN FAMILY EXPOSURE GROUP FROM CALCULATED ANNUAL LIMIT LIQUID DISCHARGES Annual dose from limit discharges (μSv/y) Radionuclide External Ingestion Total Tritium 0.0E+00 5.3E-02 5.3E-02 Carbon-14 1.1E-06 3.2E+00 3.2E+00 Iron-55 0.0E+00 3.0E-04 3.0E-04 Cobalt-58 4.9E-02 1.4E-02 6.2E-02 Cobalt-60 1.4E+00 3.8E-02 1.4E+00 Nickel-63 0.0E+00 3.6E-03 3.6E-03 Strontium-90 5.0E-10 3.1E-06 3.1E-06 Caesium-137 6.0E-03 1.4E-03 7.5E-03 Plutonium-241 4.8E-08 6.4E-06 6.4E-06 Cerium-144(1) 2.8E-02 2.6E-03 3.0E-02 Total 1.4E+00 3.3E+00 4.8E+00 Notes 1. Surrogate radionuclide for ‘other radionuclides’ category UKP-GW-GL-790 266 Revision 4 5.0 Environmental Impact UK AP1000 Environment Report Table 5.2-6 ANNUAL GASEOUS DISCHARGES APPLIED FOR THE HUMAN DOSE ASSESSMENTS Representative gaseous discharges Calculated annual limit gaseous discharges Bq/y Bq/y Tritium 1.9E+12 3.0E+12 Carbon-14 6.4E+11 1.0E+12 Argon-41 1.3E+12 2.0E+12 Cobalt-60 3.2E+06 5.0E+06 Krypton-85 4.1E+12 7.0E+12 Strontium-90 4.4E+05 7.0E+05 Iodine-131 2.1E+08 3.0E+08 Xenon-133 1.3E+12 2.0E+12 Caesium-137 1.3E+06 2.0E+06 Iodine-133(1) 3.9E+08 7.0E+08 Krypton-85(2) 2.7E+12 4.0E+12 1.2E+07 2.0E+07 Radionuclide (3) Cobalt-58 Notes: 1. Surrogate radionuclide for ‘other radioiodines’ category 2. Surrogate radionuclide for ‘other noble gasses’ category 3. Surrogate radionuclide for ‘other particulates’ category UKP-GW-GL-790 267 Revision 4 Table 5.2-7 UK AP1000 Environment Report 5.8E-10 0.0E+00 3.4E-09 0.0E+00 2.8E-08 2.2E-08 0.0E+00 1.3E-08 4.3E-09 0.0E+00 7.4E-10 Carbon-14 Argon-41 Cobalt-60 Krypton-85 Strontium-90 Iodine-131 Xenon-133 Caesium-137 Iodine-133 Krypton-85 Cobalt-58 UKP-GW-GL-790 1.8E-11 Adult Tritium Radionuclide 1.7E-09 0.0E+00 1.0E-08 1.0E-08 0.0E+00 5.2E-08 6.0E-08 0.0E+00 1.1E-08 0.0E+00 8.0E-10 2.3E-11 Child 268 4.4E-09 0.0E+00 4.4E-08 1.2E-08 0.0E+00 1.8E-07 7.3E-08 0.0E+00 2.7E-08 0.0E+00 1.6E-09 4.8E-11 Infant Dose per unit intake by ingestion (Sv/Bq) 1.6E-09 0.0E+00 1.5E-09 4.6E-09 0.0E+00 7.4E-09 3.6E-08 0.0E+00 1.0E-08 0.0E+00 2.0E-09 1.8E-11 Adult 2.4E-09 0.0E+00 3.8E-09 3.7E-09 0.0E+00 1.9E-08 5.1E-08 0.0E+00 1.5E-08 0.0E+00 2.8E-09 2.3E-11 Child Revision 4 6.5E-09 0.0E+00 1.8E-08 5.4E-09 0.0E+00 7.2E-08 1.1E-07 0.0E+00 3.4E-08 0.0E+00 6.6E-09 4.8E-11 Infant Dose per unit intake by inhalation (Sv/Bq) DOSE PER UNIT INTAKE FACTORS FOR THE ASSESSMENT OF DOSES FROM GASEOUS DISCHARGES 5.0 Environmental Impact 5.0 Environmental Impact UK AP1000 Environment Report Table 5.2-8 STAGE 1 DOSE PER UNIT RELEASE FACTORS FOR ANNUAL GASEOUS DISCHARGES Dose per unit release factor (μSv/y per Bq/y) Radionuclide Ingestion Total external Inhalation Total Tritium 2.7E-13 0.0E+00 6.9E-13 9.6E-13 Carbon-14 3.3E-11 6.4E-17 3.5E-11 6.8E-11 Argon-41 0.0E+00 3.2E-12 0.0E+00 3.2E-12 Cobalt-60 5.3E-11 1.1E-08 2.2E-10 1.2E-08 Krypton-85 0.0E+00 1.3E-14 0.0E+00 1.3E-14 Strontium-90 6.4E-10 3.2E-15 8.0E-10 1.4E-09 Iodine-131 4.1E-09 3.8E-11 3.9E-10 4.5E-09 Xenon-133 0.0E+00 7.0E-14 0.0E+00 7.0E-14 Caesium-137 3.8E-10 6.5E-09 1.0E-10 7.0E-09 Iodine-133 7.2E-11 7.6E-12 9.7E-11 1.8E-10 Krypton-85 0.0E+00 1.3E-14 0.0E+00 1.3E-14 Cobalt-58 4.4E-12 2.7E-10 3.6E-11 3.1E-10 UKP-GW-GL-790 269 Revision 4 5.0 Environmental Impact UK AP1000 Environment Report Table 5.2-9 STAGE 1 DOSE TO LOCAL RESIDENT FAMILY EXPOSURE GROUP FROM REPRESENTATIVE ANNUAL GASEOUS DISCHARGES Annual dose from representative discharges (μSv/y) Radionuclide Ingestion Total external Inhalation Total Tritium 5.1E-01 0.0E+00 1.3E+00 1.8E+00 Carbon-14 2.1E+01 4.1E-05 2.2E+01 4.4E+01 Argon-41 0.0E+00 4.2E+00 0.0E+00 4.2E+00 Cobalt-60 1.7E-04 3.5E-02 7.0E-04 3.8E-02 Krypton-85 0.0E+00 5.3E-02 0.0E+00 5.3E-02 Strontium-90 2.8E-04 1.4E-09 3.5E-04 6.2E-04 Iodine-131 8.6E-01 8.0E-03 8.2E-02 9.5E-01 Xenon-133 0.0E+00 9.1E-02 0.0E+00 9.1E-02 Caesium-137 4.9E-04 8.5E-03 1.3E-04 9.1E-03 Iodine-133(1) 2.8E-02 3.0E-03 3.8E-02 7.0E-02 Krypton-85(2) 0.0E+00 3.5E-02 0.0E+00 3.5E-02 Cobalt-58(3) 5.3E-05 3.2E-03 4.3E-04 3.7E-03 Total 2.3E+01 4.4E+00 2.4E+01 5.1E+01 Notes: 1. Surrogate radionuclide for ‘other radioiodines’ category 2. Surrogate radionuclide for ‘other noble gasses’ category 3. Surrogate radionuclide for ‘other particulates’ category UKP-GW-GL-790 270 Revision 4 5.0 Environmental Impact UK AP1000 Environment Report Table 5.2-10 STAGE 1 DOSE TO LOCAL RESIDENT FAMILY EXPOSURE GROUP FROM CALCULATED ANNUAL LIMIT GASEOUS DISCHARGES Annual dose from limit discharges (μSv/y) Radionuclide Ingestion Total external Inhalation Total Tritium 8.1E-01 0.0E+00 2.1E+00 2.9E+00 Carbon-14 3.3E+01 6.4E-05 3.5E+01 6.8E+01 Argon-41 0.0E+00 6.4E+00 0.0E+00 6.4E+00 Cobalt-60 2.7E-04 5.5E-02 1.1E-03 6.0E-02 Krypton-85 0.0E+00 9.1E-02 0.0E+00 9.1E-02 Strontium-90 4.5E-04 2.2E-09 5.6E-04 9.8E-04 Iodine-131 1.2E+00 1.1E-02 1.2E-01 1.4E+00 Xenon-133 0.0E+00 1.4E-01 0.0E+00 1.4E-01 Caesium-137 7.6E-04 1.3E-02 2.0E-04 1.4E-02 Iodine-133(1) 5.0E-02 5.3E-03 6.8E-02 1.3E-01 Krypton-85(2) 0.0E+00 5.2E-02 0.0E+00 5.2E-02 Cobalt-58(3) 8.8E-05 5.4E-03 7.2E-04 6.2E-03 Total 3.5E+01 6.8E+00 3.7E+01 7.9E+01 Notes: 1. Surrogate radionuclide for ‘other radioiodines’ category 2. Surrogate radionuclide for ‘other noble gasses’ category 3. Surrogate radionuclide for ‘other particulates’ category UKP-GW-GL-790 271 Revision 4 5.0 Environmental Impact UK AP1000 Environment Report Table 5.2-11 STAGE 2 DOSE PER UNIT RELEASE FACTORS FOR ANNUAL LIQUID DISCHARGES Dose per unit release factor (μSv/y per Bq/y) Radionuclide External Ingestion Total Tritium 0.0E+00 6.8E-16 6.8E-16 Carbon-14 1.2E-16 3.5E-10 3.5E-10 Iron-55 0.0E+00 2.3E-13 2.3E-13 Cobalt-58 4.2E-11 1.2E-11 5.3E-11 Cobalt-60 2.1E-09 5.8E-11 2.1E-09 Nickel-63 0.0E+00 2.8E-12 2.8E-12 Strontium-90 7.7E-16 4.7E-12 4.7E-12 Caesium-137 9.2E-11 2.2E-11 1.1E-10 Plutonium-241 1.8E-13 2.5E-11 2.5E-11 Cerium-144 1.1E-11 1.0E-12 1.2E-11 UKP-GW-GL-790 272 Revision 4 5.0 Environmental Impact UK AP1000 Environment Report Table 5.2-12 STAGE 2 DOSE TO FISHERMAN FAMILY EXPOSURE GROUP FROM REPRESENTATIVE ANNUAL LIQUID DISCHARGES Annual dose from representative discharges (μSv/y) Radionuclide External Ingestion Total Tritium 0.0E+00 2.4E-02 2.4E-02 Carbon-14 5.4E-07 1.6E+00 1.6E+00 Iron-55 0.0E+00 1.5E-04 1.5E-04 Cobalt-58 2.2E-02 6.2E-03 2.9E-02 Cobalt-60 6.2E-01 1.7E-02 6.4E-01 Nickel-63 0.0E+00 1.9E-03 1.9E-03 Strontium-90 2.5E-10 1.5E-06 1.5E-06 Caesium-137 2.8E-03 6.5E-04 3.4E-03 Plutonium-241 2.0E-08 2.7E-06 2.7E-06 Cerium-144(1) 1.2E-02 1.1E-03 1.3E-02 Total 6.6E-01 1.6E+00 2.3E+00 Notes 1. Surrogate radionuclide for ‘other radionuclides’ category UKP-GW-GL-790 273 Revision 4 5.0 Environmental Impact UK AP1000 Environment Report Table 5.2-13 STAGE 2 DOSE TO FISHERMAN FAMILY EXPOSURE GROUP FROM CALCULATED ANNUAL LIMIT LIQUID DISCHARGES Annual dose from limit discharges (μSv/y) Radionuclide External Ingestion Total Tritium 0.0E+00 4.1E-02 4.1E-02 Carbon-14 8.6E-07 2.5E+00 2.5E+00 Iron-55 0.0E+00 2.3E-04 2.3E-04 Cobalt-58 3.7E-02 1.0E-02 4.8E-02 Cobalt-60 1.0E+00 2.9E-02 1.1E+00 Nickel-63 0.0E+00 2.8E-03 2.8E-03 Strontium-90 3.8E-10 2.3E-06 2.3E-06 Caesium-137 4.6E-03 1.1E-03 5.7E-03 Plutonium-241 3.7E-08 4.9E-06 5.0E-06 Cerium-144(1) 2.2E-02 2.0E-03 2.4E-02 Total 1.1E+00 2.6E+00 3.7E+00 Notes 1. Surrogate radionuclide for ‘other radionuclides’ category UKP-GW-GL-790 274 Revision 4 5.0 Environmental Impact UK AP1000 Environment Report Table 5.2-14 PARAMETERS APPLIED FOR PLUME RISE AND BUILDING WAKE MODELLING Parameter Value Height of reactor building 70 m Equivalent footprint of reactor building (rectangular shape assumed for modelling purposes) 43 m by 43 m Position of release point relative to reactor building On the roof, 7 m from the edge Physical stack height 75 m Equivalent diameter of the plant vent (circular shape assumed for modelling purposes) 2.44 m Release temperature Ambient Release velocity 8.15 m/s 38.13 m3/s Volumetric flow rate UKP-GW-GL-790 275 Revision 4 5.0 Environmental Impact UK AP1000 Environment Report Table 5.2-15 STAGE 2 DOSE PER UNIT RELEASE FACTORS FOR ANNUAL GASEOUS DISCHARGES Dose per unit release factor (μSv/y per Bq/y) Radionuclide Ingestion Total external Inhalation Total Tritium 4.1E-14 0.0E+00 4.8E-15 4.5E-14 Carbon-14 5.0E-12 4.5E-19 2.5E-13 5.2E-12 Argon-41 0.0E+00 2.2E-14 0.0E+00 2.2E-14 Cobalt-60 8.0E-12 7.7E-11 1.5E-12 8.6E-11 Krypton-85 0.0E+00 9.1E-17 0.0E+00 9.1E-17 Strontium-90 9.6E-11 2.2E-17 5.6E-12 1.0E-10 Iodine-131 6.2E-10 2.7E-13 2.7E-12 6.2E-10 Xenon-133 0.0E+00 4.9E-16 0.0E+00 4.9E-16 Caesium-137 5.7E-11 4.6E-11 7.0E-13 1.0E-10 Iodine-133 1.1E-11 5.3E-14 6.8E-13 1.2E-11 Krypton-85 0.0E+00 9.1E-17 0.0E+00 9.1E-17 Cobalt-58 6.6E-13 1.9E-12 2.5E-13 2.8E-12 UKP-GW-GL-790 276 Revision 4 5.0 Environmental Impact UK AP1000 Environment Report Table 5.2-16 STAGE 2 DOSE TO LOCAL RESIDENT FAMILY EXPOSURE GROUP FROM REPRESENTATIVE ANNUAL GASEOUS DISCHARGES Annual dose from representative discharges (μSv/y) Radionuclide Ingestion Total external Inhalation Total Tritium 7.7E-02 0.0E+00 9.2E-03 8.6E-02 Carbon-14 3.2E+00 2.9E-07 1.6E-01 3.3E+00 Argon-41 0.0E+00 2.9E-02 0.0E+00 2.9E-02 Cobalt-60 2.5E-05 2.5E-04 4.9E-06 2.8E-04 Krypton-85 0.0E+00 3.7E-04 0.0E+00 3.7E-04 Strontium-90 4.2E-05 9.9E-12 2.5E-06 4.5E-05 Iodine-131 1.3E-01 5.6E-05 5.7E-04 1.3E-01 Xenon-133 0.0E+00 6.4E-04 0.0E+00 6.4E-04 Caesium-137 7.4E-05 5.9E-05 9.1E-07 1.3E-04 Iodine-133(1) 4.2E-03 2.1E-05 2.6E-04 4.5E-03 Krypton-85(2) 0.0E+00 2.5E-04 0.0E+00 2.5E-04 Cobalt-58(3) 7.9E-06 2.3E-05 3.0E-06 3.4E-05 Total 3.4E+00 3.1E-02 1.7E-01 3.6E+00 Notes: 1. Surrogate radionuclide for ‘other radioiodines’ category 2. Surrogate radionuclide for ‘other noble gasses’ category 3. Surrogate radionuclide for ‘other particulates’ category UKP-GW-GL-790 277 Revision 4 5.0 Environmental Impact UK AP1000 Environment Report Table 5.2-17 STAGE 2 DOSE TO LOCAL RESIDENT FAMILY EXPOSURE GROUP FROM CALCULATED ANNUAL LIMIT GASEOUS DISCHARGES Annual dose from limit discharges (μSv/y) Radionuclide Ingestion Total external Inhalation Total Tritium 1.2E-01 0.0E+00 1.4E-02 1.4E-01 Carbon-14 5.0E+00 4.5E-07 2.5E-01 5.2E+00 Argon-41 0.0E+00 4.5E-02 0.0E+00 4.5E-02 Cobalt-60 4.0E-05 3.9E-04 7.7E-06 4.3E-04 Krypton-85 0.0E+00 6.4E-04 0.0E+00 6.4E-04 Strontium-90 6.7E-05 1.6E-11 3.9E-06 7.1E-05 Iodine-131 1.8E-01 8.0E-05 8.2E-04 1.9E-01 Xenon-133 0.0E+00 9.8E-04 0.0E+00 9.8E-04 Caesium-137 1.1E-04 9.1E-05 1.4E-06 2.1E-04 Iodine-133(1) 7.6E-03 3.7E-05 4.8E-04 8.1E-03 Krypton-85(2) 0.0E+00 3.6E-04 0.0E+00 3.6E-04 Cobalt-58(3) 1.3E-05 3.8E-05 5.0E-06 5.6E-05 Total 5.3E+00 4.7E-02 2.6E-01 5.6E+00 Notes: 1. Surrogate radionuclide for ‘other radioiodines’ category 2. Surrogate radionuclide for ‘other noble gasses’ category 3. Surrogate radionuclide for ‘other particulates’ category UKP-GW-GL-790 278 Revision 4 5.0 Environmental Impact UK AP1000 Environment Report Table 5.2-18 DISCHARGES APPLIED FOR THE SHORT-TERM DOSE ASSESSMENT Maximum monthly discharge (Bq) Discharge rate assuming 30 minute release (Bq/s) Tritium 2.4E+11 1.3E+08 Carbon-14 8.3E+10 4.6E+07 Argon-41 1.7E+11 9.5E+07 Cobalt-60 2.7E+05 1.5E+02 Krypton-85 1.3E+12 7.1E+08 Strontium-90 3.7E+04 2.1E+01 Iodine-131 1.7E+07 9.6E+03 Xenon-133 1.9E+11 1.0E+08 Caesium-137 1.1E+05 6.2E+01 Iodine-133(1) 3.2E+07 1.8E+04 Krypton-85(2) 5.8E+11 3.2E+08 Cobalt-58(3) 1.0E+06 5.7E+02 Radionuclide Notes: 1. Surrogate radionuclide for ‘other radioiodines’ category 2. Surrogate radionuclide for ‘other noble gasses’ category 3. Surrogate radionuclide for ‘other particulates’ category UKP-GW-GL-790 279 Revision 4 5.0 Environmental Impact UK AP1000 Environment Report Table 5.2-19 PARAMETERS APPLIED FOR SHORT-TERM RELEASE MODELLING Parameter Value Wind direction Single wind direction, from source to receptor Wind speed (at a height of 10 m) 3 m/s Rainfall rate 0.1 mm/h (continuous) Atmospheric stability condition Neutral Boundary layer height 800 m Surface roughness length 0.3 m Wet deposition rate for noble gasses, tritium and carbon-14 0 s-1 0.0001 s-1 Wet deposition rate for particulates Dry deposition rate for noble gasses, tritium and carbon-14 0 m/s Dry deposition rate for iodine isotopes 0.01 m/s Dry deposition rate for other particulates 0.001 m/s UKP-GW-GL-790 280 Revision 4 5.0 Environmental Impact UK AP1000 Environment Report Table 5.2-20 ACTIVITY CONCENTRATION IN AIR AND DEPOSITED TO THE GROUND PER UNIT RELEASED FOR A SHORT-TERM RELEASE Integrated air: Bq s m-3 per Bq released Deposited: Bq m-2 per Bq released Integrated air at 100 m Deposited at 100 m Integrated air at 500 m Deposited at 500 m Tritium 2.0E-06 0.0E+00 7.9E-06 0.0E+00 Carbon-14 2.0E-06 0.0E+00 7.9E-06 0.0E+00 Argon-41 2.0E-06 0.0E+00 7.9E-06 0.0E+00 Cobalt-60 1.9E-06 5.5E-07 7.9E-06 1.2E-07 Krypton-85 2.0E-06 0.0E+00 7.9E-06 0.0E+00 Strontium-90 1.9E-06 5.5E-07 7.9E-06 1.2E-07 Iodine-131 1.8E-06 5.7E-07 7.2E-06 1.9E-07 Xenon-133 2.0E-06 0.0E+00 7.9E-06 0.0E+00 Caesium-137 1.9E-06 5.5E-07 7.9E-06 1.2E-07 Iodine-133 1.8E-06 5.7E-07 7.2E-06 1.9E-07 Krypton-85 2.0E-06 0.0E+00 7.9E-06 0.0E+00 Cobalt-58 1.9E-06 5.5E-07 7.9E-06 1.2E-07 Radionuclide UKP-GW-GL-790 281 Revision 4 5.0 Environmental Impact UK AP1000 Environment Report Table 5.2-21 CLOUD GAMMA DOSE FACTORS FOR A SHORT-TERM RELEASE Radionuclide External dose (Sv per Bq released) Tritium 0.0E+00 Carbon-14 0.0E+00 Argon-41 1.8E-18 Cobalt-60 3.4E-18 Krypton-85 2.0E-21 Strontium-90 2.4E-30 Iodine-131 3.5E-19 Xenon-133 6.7E-20 Caesium-137 4.0E-19 Iodine-133 5.5E-19 Krypton-85 2.0E-21 Cobalt-58 7.2E-19 Table 5.2-22 BREATHING RATES FOR SHORT-TERM RELEASE ASSESSMENT Breathing rate (m3/h) Inhalation rate UKP-GW-GL-790 Adult Child Infant 3.0 0.87 0.31 282 Revision 4 1.7E-05 3.5E-03 3.6E-03 1.3E-03 4.2E-03 2.0E-04 2.9E-03 Carbon-14 Cobalt-60 Strontium-90 Iodine-131 Caesium-137 Iodine-133 Cobalt-58 UKP-GW-GL-790 3.2E-06 Green vegetables Tritium Radionuclide Table 5.2-23 6.4E-06 1.5E-06 3.9E-03 2.7E-04 3.3E-05 1.2E-05 1.7E-05 3.2E-06 Root vegetables 3.6E-05 2.2E-05 4.6E-02 1.0E-03 3.6E-04 9.7E-05 2.5E-05 2.8E-06 Sheep meat 283 3.6E-03 2.2E-05 4.6E-02 1.0E-03 3.6E-04 9.7E-03 2.5E-05 2.8E-06 Sheep offal 2.2E-05 3.5E-05 2.5E-02 7.8E-04 2.9E-04 6.1E-05 2.5E-05 2.8E-06 Cow meat 2.2E-03 3.5E-05 2.5E-02 7.8E-04 2.9E-04 6.1E-03 2.5E-05 2.8E-06 Cow offal H-3 and C-14: Bq/kg per Bq m-3 s air concentration Other radionuclides: Bq/kg per Bq m-2 instantaneous deposition 8.1E-05 1.2E-04 4.9E-03 1.8E-03 1.4E-03 9.4E-05 8.5E-06 3.6E-06 Cow milk Revision 4 4.7E-04 1.9E-05 1.1E-02 9.3E-04 7.3E-04 7.0E-04 1.7E-05 3.2E-06 Fruit UK AP1000 Environment Report ACTIVITY CONCENTRATIONS IN FOOD ONE YEAR AFTER A SHORT-TERM RELEASE 5.0 Environmental Impact 5.0 Environmental Impact UK AP1000 Environment Report Table 5.2-24 INGESTION RATES FOR SHORT-TERM RELEASE ASSESSMENT Ingestion rate (kg/y) Adult Child Infant Green vegetables 30 10 5 Root vegetables(1) 130 95 45 Sheep meat 3 1.5 0.6 Sheep offal 1 0.5 0.2 Cow meat 15 10 3 Cow offal 1 0.5 0.2 Cow milk(1) 240 240 320 Fruit 15 15 7.5 Notes: 1. High rate consumption assumed Table 5.2-25 ANNUAL EXTERNAL GAMMA DOSE PER UNIT SURFACE DEPOSITION External dose (Sv/y per Bq/m2 initial deposit) Radionuclide Cobalt-60 6.80E-08 Strontium-90 2.77E-08 Iodine-131 3.81E-10 Caesium-137 8.41E-07 Iodine-133 2.98E-09 Cobalt-58 3.81E-07 UKP-GW-GL-790 284 Revision 4 5.0 Environmental Impact UK AP1000 Environment Report Table 5.2-26 OCCUPANCY AND SHIELDING FACTORS FOR SHORT-TERM DOSE ASSESSMENT Parameter Value Indoor occupancy assumed for cloud gamma pathway 0 Indoor occupancy assumed for deposited gamma pathway (all ages) 0.9 Deposited gamma indoor shielding factor 0.1 Table 5.2-27 DOSE TO ADULTS FROM SHORT-TERM GASEOUS DISCHARGE Dose from short-term discharges to adults (μSv) Radionuclide Ingestion Total external Inhalation Total Tritium 5.1E-02 0.0E+00 7.1E-03 5.8E-02 Carbon-14 2.1E+00 0.0E+00 2.7E-01 2.4E+00 Argon-41 0.0E+00 3.1E-01 0.0E+00 3.1E-01 Cobalt-60 1.8E-05 1.9E-03 4.3E-06 1.9E-03 Krypton-85 0.0E+00 2.6E-03 0.0E+00 2.6E-03 Strontium-90 5.9E-05 1.1E-04 2.1E-06 1.7E-04 Iodine-131 3.9E-02 7.2E-04 2.0E-04 4.0E-02 Xenon-133 0.0E+00 1.3E-02 0.0E+00 1.3E-02 Caesium-137 4.6E-04 9.8E-03 8.2E-07 1.0E-02 Iodine-133(1) 9.4E-04 1.0E-02 7.4E-05 1.1E-02 Krypton-85(2) 0.0E+00 1.2E-03 0.0E+00 1.2E-03 Cobalt-58(3) 1.1E-05 4.1E-02 2.6E-06 4.1E-02 Total 2.2E+00 3.9E-01 2.8E-01 2.8E+00 Notes: 1. Surrogate radionuclide for ‘other radioiodines’ category 2. Surrogate radionuclide for ‘other noble gasses’ category 3. Surrogate radionuclide for ‘other particulates’ category UKP-GW-GL-790 285 Revision 4 5.0 Environmental Impact UK AP1000 Environment Report Table 5.2-28 DOSE TO CHILDREN FROM SHORT-TERM GASEOUS DISCHARGE Dose from short-term discharges to children (μSv) Radionuclide Ingestion Total external Inhalation Total Tritium 5.6E-02 0.0E+00 2.6E-03 5.9E-02 Carbon-14 2.3E+00 0.0E+00 1.1E-01 2.4E+00 Argon-41 0.0E+00 3.1E-01 0.0E+00 3.1E-01 Cobalt-60 2.8E-05 1.9E-03 1.9E-06 1.9E-03 Krypton-85 0.0E+00 2.6E-03 0.0E+00 2.6E-03 Strontium-90 1.1E-04 1.1E-04 8.8E-07 2.1E-04 Iodine-131 8.5E-02 7.2E-04 1.5E-04 8.6E-02 Xenon-133 0.0E+00 1.3E-02 0.0E+00 1.3E-02 Caesium-137 2.9E-04 9.8E-03 1.9E-07 1.0E-02 Iodine-133(1) 1.9E-03 1.0E-02 5.5E-05 1.2E-02 Krypton-85(2) 0.0E+00 1.2E-03 0.0E+00 1.2E-03 Cobalt-58(3) 1.3E-05 4.1E-02 1.1E-06 4.1E-02 Total 2.4E+00 3.9E-01 1.1E-01 2.9E+00 Notes: 1. Surrogate radionuclide for ‘other radioiodines’ category 2. Surrogate radionuclide for ‘other noble gasses’ category 3. Surrogate radionuclide for ‘other particulates’ category UKP-GW-GL-790 286 Revision 4 5.0 Environmental Impact UK AP1000 Environment Report Table 5.2-29 DOSE TO INFANTS FROM SHORT-TERM GASEOUS DISCHARGE Dose from short-term discharges to infants (μSv) Radionuclide Ingestion Total external Inhalation Total Tritium 1.2E-01 0.0E+00 2.0E-03 1.3E-01 Carbon-14 4.0E+00 0.0E+00 9.1E-02 4.1E+00 Argon-41 0.0E+00 3.1E-01 0.0E+00 3.1E-01 Cobalt-60 5.1E-05 1.9E-03 1.5E-06 2.0E-03 Krypton-85 0.0E+00 2.6E-03 0.0E+00 2.6E-03 Strontium-90 1.6E-04 1.1E-04 6.8E-07 2.6E-04 Iodine-131 3.6E-01 7.2E-04 2.0E-04 3.6E-01 Xenon-133 0.0E+00 1.3E-02 0.0E+00 1.3E-02 Caesium-137 3.2E-04 9.8E-03 1.0E-07 1.0E-02 Iodine-133(1) 1.1E-02 1.0E-02 9.2E-05 2.1E-02 Krypton-85(2) 0.0E+00 1.2E-03 0.0E+00 1.2E-03 Cobalt-58(3) 2.5E-05 4.1E-02 1.1E-06 4.1E-02 Total 4.5E+00 3.9E-01 9.4E-02 4.9E+00 Notes: 1. Surrogate radionuclide for ‘other radioiodines’ category 2. Surrogate radionuclide for ‘other noble gasses’ category 3. Surrogate radionuclide for ‘other particulates’ category UKP-GW-GL-790 287 Revision 4 3.8E-05 3.7E-06 2.4E-05 9.7E-07 8.5E-05 1.3E-05 2.7E-06 4.6E-05 1.2E-05 Argon-41 Cobalt-60 Krypton-85 Strontium-90 Iodine-131 Xenon-133 Caesium-137 Other radioiodines(1) Other noble gasses(2) 1.8E-01 2.1E-01 6.4E-07 1.4E-05 8.3E-05 3.7E-06 1.6E-05 1.9E-04 1.4E-06 2.8E-05 5.2E-06 9.3E-05 2.1E-01 2.0E-03 average UK (manSv) 2.3E-01 8.4E-07 1.7E-05 1.4E-04 4.3E-06 1.9E-05 3.3E-04 1.6E-06 3.1E-05 7.0E-06 1.9E-04 2.3E-01 2.4E-03 max 1.2E+00 8.7E-07 3.3E-05 6.6E-05 1.1E-05 3.1E-05 1.1E-04 4.7E-06 9.8E-05 6.9E-06 4.3E-05 1.2E+00 4.8E-03 min 1.3E+00 9.9E-07 3.7E-05 9.1E-05 1.3E-05 3.4E-05 1.4E-04 6.1E-06 1.0E-04 7.8E-06 9.0E-05 1.3E+00 5.2E-03 average Europe (manSv) UKP-GW-GL-790 288 Notes: 1. All radioiodines apart from iodine-131, assessed as iodine-133 2. All noble gasses apart from argon-41, krypton-85 and xenon-133, assessed as krypton-85 3. All particulates apart from cobalt-60, strontium-90, and caesium-137, assessed as cobalt-58 Total 4.8E-07 1.8E-01 Carbon-14 (3) 1.5E-03 min Tritium Radionuclide Other particulates Table 5.2-30 1.5E+00 1.1E-06 4.0E-05 1.4E-04 1.6E-05 3.9E-05 1.9E-04 7.9E-06 1.1E-04 8.7E-06 1.9E-04 1.5E+00 5.7E-03 max 8.5E+00 8.7E-07 3.3E-05 6.6E-05 1.1E-05 3.1E-05 1.1E-04 4.7E-06 1.1E-03 6.9E-06 4.3E-05 8.5E+00 5.3E-03 min 8.6E+00 9.9E-07 3.7E-05 9.1E-05 1.3E-05 3.4E-05 1.4E-04 6.1E-06 1.1E-03 7.8E-06 9.0E-05 8.6E+00 5.8E-03 average World (manSv) Revision 4 8.8E+00 1.1E-06 4.0E-05 1.4E-04 1.6E-05 3.9E-05 1.9E-04 7.9E-06 1.1E-03 8.7E-06 1.9E-04 8.8E+00 6.3E-03 max UK AP1000 Environment Report COLLECTIVE DOSE STATISTICS FOR AP1000 REPRESENTATIVE DISCHARGES TO ATMOSPHERE 5.0 Environmental Impact 5.7E-05 5.8E-06 4.1E-05 1.5E-06 1.2E-04 2.0E-05 4.1E-06 8.3E-05 1.7E-05 Argon-41 Cobalt-60 Krypton-85 Strontium-90 Iodine-131 Xenon-133 Caesium-137 Other radioiodines(1) Other noble gasses(2) Other particulates 3.3E-01 1.1E-06 2.1E-05 1.5E-04 5.6E-06 2.5E-05 2.8E-04 2.2E-06 4.7E-05 8.1E-06 1.4E-04 3.2E-01 3.2E-03 average UK (manSv) 3.6E-01 1.4E-06 2.5E-05 2.6E-04 6.5E-06 2.9E-05 4.8E-04 2.6E-06 5.4E-05 1.1E-05 2.9E-04 3.5E-01 3.9E-03 max 1.9E+00 1.4E-06 4.9E-05 1.2E-04 1.6E-05 4.6E-05 1.6E-04 7.4E-06 1.7E-04 1.1E-05 6.5E-05 1.9E+00 7.6E-03 min 2.1E+00 1.6E-06 5.4E-05 1.6E-04 1.9E-05 5.1E-05 2.0E-04 9.6E-06 1.8E-04 1.2E-05 1.4E-04 2.1E+00 8.4E-03 average Europe (manSv) UKP-GW-GL-790 289 Notes: 1. All radioiodines apart from iodine-131, assessed as iodine-133 2. All noble gasses apart from argon-41, krypton-85, and xenon-133, assessed as krypton-85 3. All particulates apart from cobalt-60, strontium-90, and caesium-137, assessed as cobalt-58 2.9E-01 7.9E-07 2.8E-01 Carbon-14 (3) 2.4E-03 min Tritium Radionuclide Total Table 5.2-31 2.3E+00 1.8E-06 6.0E-05 2.6E-04 2.4E-05 5.8E-05 2.8E-04 1.2E-05 1.9E-04 1.4E-05 2.8E-04 2.3E+00 9.2E-03 max 1.3E+01 1.4E-06 4.9E-05 1.2E-04 1.6E-05 4.6E-05 1.6E-04 7.4E-06 1.9E-03 1.1E-05 6.5E-05 1.3E+01 8.6E-03 min 1.4E+01 1.6E-06 5.4E-05 1.6E-04 1.9E-05 5.1E-05 2.0E-04 9.6E-06 1.9E-03 1.2E-05 1.4E-04 1.4E+01 9.4E-03 average World (manSv) Revision 4 1.4E+01 1.8E-06 6.0E-05 2.6E-04 2.4E-05 5.8E-05 2.8E-04 1.2E-05 1.9E-03 1.4E-05 2.8E-04 1.4E+01 1.0E-02 max UK AP1000 Environment Report COLLECTIVE DOSE STATISTICS FOR AP1000 CALCULATED ANNUAL LIMIT DISCHARGES TO ATMOSPHERE 5.0 Environmental Impact 2.7E-04 9.0E-07 1.2E-07 6.3E-07 1.1E-07 2.9E-11 5.3E-08 2.0E-10 5.8E-08 2.8E-04 Carbon-14 Iron-55 Cobalt-58 Cobalt-60 Nickel-63 Strontium-90 Caesium-137 Plutonium-241 Other radionuclides(1) Total 6.1E-04 2.2E-07 8.4E-10 2.0E-07 1.3E-10 2.0E-07 1.8E-06 4.5E-07 3.2E-06 5.9E-04 1.2E-05 average UK (manSv) 1.0E-03 6.3E-07 1.6E-09 3.6E-07 2.6E-10 3.3E-07 4.2E-06 1.2E-06 7.8E-06 1.0E-03 1.9E-05 max 1.4E-03 1.1E-07 1.0E-09 1.8E-07 9.4E-11 3.1E-07 1.3E-06 2.5E-07 1.7E-06 1.3E-03 4.6E-05 min UKP-GW-GL-790 290 Notes: 1. All other radionuclides apart from those already assessed, assessed as cerium-144 8.3E-06 min Tritium Radionuclide Table 5.2-32 3.2E-03 1.1E-06 4.7E-09 8.4E-07 5.8E-10 1.0E-06 7.8E-06 2.2E-06 1.8E-05 3.1E-03 7.0E-05 average Europe (manSv) 4.6E-03 1.8E-06 1.1E-08 1.3E-06 9.5E-10 2.1E-06 1.3E-05 3.5E-06 3.3E-05 4.4E-03 9.4E-05 max 2.8E-02 1.2E-07 1.1E-09 2.4E-07 1.3E-10 3.9E-07 1.4E-06 2.8E-07 1.7E-06 2.7E-02 1.2E-03 min 3.1E-02 1.2E-06 5.2E-09 1.5E-06 9.6E-10 1.5E-06 9.6E-06 2.7E-06 2.0E-05 3.0E-02 1.2E-03 average World (manSv) Revision 4 3.3E-02 2.0E-06 1.2E-08 2.4E-06 1.5E-09 3.0E-06 1.6E-05 4.6E-06 3.7E-05 3.2E-02 1.3E-03 max UK AP1000 Environment Report COLLECTIVE DOSE STATISTICS FOR AP1000 REPRESENTATIVE DISCHARGES TO SEA 5.0 Environmental Impact Table 5.2-33 4.3E-04 1.4E-06 1.9E-07 1.0E-06 1.6E-07 4.5E-11 8.8E-08 3.7E-10 1.1E-07 4.5E-04 Carbon-14 Iron-55 Cobalt-58 Cobalt-60 Nickel-63 Strontium-90 Caesium-137 Plutonium-241 Other radionuclides(1) Total 9.6E-04 4.1E-07 1.6E-09 3.3E-07 2.0E-10 2.8E-07 2.9E-06 7.4E-07 5.0E-06 9.3E-04 2.1E-05 average 1.7E-03 1.2E-06 2.9E-09 6.1E-07 4.0E-10 4.8E-07 7.1E-06 1.9E-06 1.2E-05 1.6E-03 3.2E-05 max UKP-GW-GL-790 291 2.2E-03 2.1E-07 1.9E-09 2.9E-07 1.5E-10 4.5E-07 2.1E-06 4.1E-07 2.6E-06 2.1E-03 7.9E-05 min Notes: All other radionuclides apart from those already assessed, assessed as cerium-144 1.4E-05 min Tritium Radionuclide UK (manSv) 5.0E-03 2.0E-06 8.7E-09 1.4E-06 9.0E-10 1.5E-06 1.3E-05 3.7E-06 2.8E-05 4.9E-03 1.2E-04 average Europe (manSv) 7.2E-03 3.3E-06 1.9E-08 2.2E-06 1.5E-09 3.1E-06 2.1E-05 5.8E-06 5.2E-05 7.0E-03 1.6E-04 max 4.5E-02 2.2E-07 2.0E-09 4.0E-07 2.0E-10 5.6E-07 2.4E-06 4.6E-07 2.7E-06 4.3E-02 2.0E-03 min 5.0E-02 2.2E-06 9.7E-09 2.5E-06 1.5E-09 2.1E-06 1.6E-05 4.5E-06 3.1E-05 4.8E-02 2.1E-03 average World (manSv) Revision 4 5.3E-02 3.7E-06 2.2E-08 3.9E-06 2.3E-09 4.3E-06 2.7E-05 7.6E-06 5.7E-05 5.1E-02 2.2E-03 max UK AP1000 Environment Report COLLECTIVE DOSE STATISTICS FOR AP1000 CALCULATED ANNUAL LIMIT DISCHARGES TO SEA 5.0 Environmental Impact 5.0 Environmental Impact UK AP1000 Environment Report Table 5.2-34 ACTIVITY IN SOIL IN 60TH YEAR OF ATMOSPHERIC DISCHARGES Radionuclide Activity Concentration at 500 m (Bq/kg) Chromium-51 8.1E-16 Manganese-54 7.0E-15 Cobalt-58 8.6E-14 Cobalt-60 7.1E-13 Strontium-89 7.6E-15 Strontium-90 3.5E-13 Yttrium-90 (daughter of strontium-90) 3.4E-20 Zirconium-95 3.3E-15 Niobium-95 (daughter of zirconium-95) 1.0E-19 Niobium-95m (daughter of zirconium-95) 2.9E-20 Niobium-95 4.3E-15 Iodine-131 7.9E-13 Iodine-133 1.4E-13 Caesium-134 8.1E-14 Caesium-137 1.1E-12 Barium-137m (daughter of caesium-137) 7.8E-20 Barium-140 2.5E-16 Lanthanum-140 (daughter of barium-140) 1.1E-19 UKP-GW-GL-790 292 Revision 4 5.0 Environmental Impact UK AP1000 Environment Report Table 5.2-35 ACTIVITY CONCENTRATION IN COASTAL SEDIMENTS IN 60TH YEAR OF LIQUID DISCHARGES Activity Concentration in Local Compartment (Bq/kg) Radionuclide Tritium 1.4E+01 Carbon-14 1.1E+00 Sodium-24 6.6E-09 Chromium-51 1.9E-04 Manganese-54 2.1E-03 Iron-55 8.7E-02 Iron-59 3.8E-05 Cobalt-58 5.7E-03 Cobalt-60 7.4E-02 Nickel-63 5.4E-01 Zinc-65 4.3E-04 Strontium-89 4.5E-06 Strontium-90 3.5E-05 Yttrium-91 1.0E-06 Zirconium-95 8.6E-05 Niobium-95 (daughter of zirconium-95) 9.7E-05 Niobium-95 3.7E-05 Technetium-99m 9.5E-10 Technetium-99 (daughter of technetium-99m) 1.1E-12 Ruthenium-103 7.0E-05 Silver-110m 2.7E-04 Iodine-131 3.2E-07 Xenon-131m (daughter of iodine-131) 3.8E-07 Iodine-132 1.0E-10 UKP-GW-GL-790 293 Revision 4 5.0 Environmental Impact UK AP1000 Environment Report Table 5.2-35 (continued) ACTIVITY CONCENTRATION IN COASTAL SEDIMENTS IN 60TH YEAR OF LIQUID DISCHARGES Activity Concentration in Local Compartment (Bq/kg) Radionuclide Iodine-133 1.1E-08 Xenon-133 (daughter of iodine-133) 4.4E-08 Iodine-134 4.3E-12 Iodine-135 9.7E-10 Xenon-135 (daughter of iodine-135) 2.1E-09 Caesium-135 (daughter of iodine-135) 3.3E-12 Caesium-134 4.7E-04 Caesium-136 6.0E-06 Caesium-137 7.2E-03 Barium-140 1.1E-05 Lanthanum -140 (daughter of barium-140) 1.4E-05 Lanthanum-140 8.9E-07 Cerium-144 4.9E-03 Promethium-144 2.3E-10 Plutonium-241 4.7E-05 Americium-241 (daughter of plutonium-241) 1.4E-06 Neptunium-237 (plutonium-241 decay chain) 6.1E-12 Uranium-233 (plutonium-241 decay chain) 3.2E-16 Thorium-229 (plutonium-241 decay chain) 3.4E-19 Actinium-225 (plutonium-241 decay chain) 3.4E-19 Bismuth-213 (plutonium-241 decay chain) 3.4E-19 Lead-209 (plutonium-241 decay chain) 3.4E-19 UKP-GW-GL-790 294 Revision 4 5.0 Environmental Impact UK AP1000 Environment Report Table 5.3-1 ERICA TOOL TIER 2 OUTPUT CLASSIFICATION Level of Concern Expected RQ Conservative RQ Negligible <1 <1 Insufficient Confidence <1 >1 Of Concern >1 >1 UKP-GW-GL-790 295 Revision 4 5.0 Environmental Impact UK AP1000 Environment Report Table 5.3-2 AIR EMISSION DATA USED IN THE ERICA TOOL Westinghouse Predicted Operating Data [c.f. Table 3.3-8] Value Used in ERICA Tool Value Used in Wildlife Dose Assessment Spreadsheet Bqs-1 Bqs-1 Bqs-1 Tritium 5.71E+04 5.71E+04 – Carbon-14 1.92E+04 1.92E+04 – Argon-41 3.99E+04 – 3.99E+04 Chromium-51 7.29E-03 – – Manganese-54 5.07E-03 5.07E-03 – Cobalt-58 2.70E-01 2.70E-01 – Cobalt-60 1.01E-01 1.01E-01 – – 2.12E+05 [1,2] Isotope Krypton-85 1.73E+05 [1] Krypton-85m 7.61E+02 – – Strontium-89 3.49E-02 3.49E-02 – Strontium-90 1.40E-02 1.40E-02 – Zirconium-95 1.17E-02 1.17E-02 – Niobium-95 2.95E-02 2.95E-02 – Iodine-131 6.66E+00 6.02E+00 – Iodine-133 1.11E+01 9.83E+00 – Xenon-133 4.12E+04 – [2] Caesium-134 2.70E-02 2.70E-02 – Caesium-137 4.12E-02 4.12E-02 – Barium-140 5.07E-03 – – Notes: 1. Krypton-85 value includes emissions of isotopes Krypton-87, Krypton-88, Xenon-131 m, Xenon-133 m, Xenon-135, Xenon-135m, Xenon-137 and Xenon-138 2. Xenon-133 included with Krypton-85 UKP-GW-GL-790 296 Revision 4 5.0 Environmental Impact UK AP1000 Environment Report Table 5.3-3 INPUT DATA FOR THE ERICA TIER 1 ASSESSMENT OF AIR EMISSIONS Parameter Input Comments Ecosystem Terrestrial Appropriate for evaluating impact of air emissions Media activity concentration IAEA SRS-19 air model Generic dispersion model within ERICA. Established internationally recognised methodology. Provides consistency, allowing comparison between different assessments. May be overly conservative. Release height 81.626 m Reactor Building Vent 74.926 m (Reference 1-1) + 6.7 m plume rise under neutral atmospheric conditions Distance to receptor 200 m Distance to generic site boundary Wind speed 5.0 m/s Average wind speed value assumed for generic site Fraction of time (wind blowing towards the direction of receptor) 0.25 Default value – conservative for generic site Dry deposition coefficient 500 m/d Wet deposition coefficient 500 m/d ERICA Default Value. These values are based on a recommendation that a total deposition coefficient for wet and dry deposition 1000 m/d is used for screening purposes for deposition of aerosols and reactive gases (Reference 5-4) Surface soil density 260 kg/m2 ERICA Default Value. Value typical for crops on non-peat soils with a rooting zone depth of 0-20cm (Reference 5-4). Actual values of surface soil density may vary depending on the origin, mineral content and classification of the soil, but uncertainties about soil density are relatively small. Duration of discharge 60 years Lifetime of Westinghouse PWR plant (Reference 1-1) Buildings nearby yes Reactor Building (Reference 1-1) Building Height 70m Reactor Building (Reference 1-1) Buildings Surface Area Wall 3000m2 Reactor Building (Reference 1-1) UKP-GW-GL-790 297 Revision 4 5.0 Environmental Impact UK AP1000 Environment Report Table 5.3-4 TIER 1 RESULTS OF ERICA TOOL ASSESSMENT ON AIR EMISSIONS Isotope Risk Quotient (unit less) H-3 2.26E-04 Detritivorous invertebrate C-14 2.38E-03 Mammal (deer) Mn-54 4.09E-09 Detritivorous invertebrate Co-58 7.17E-08 Mammal (rat) Co-60 1.51E-06 Mammal (rat) Sr-89 1.42E-07 Reptile Sr-90 7.10E-06 Reptile 1.72E-09 Detritivorous invertebrate, soil invertebrate (worm) Nb-95 2.53E-09 Mammal (rat) I-133 6.49E-06 Bird egg Cs-134 6.06E-07 Mammal (deer) Cs-137 2.55E-06 Mammal (deer) I-131 1.71E-05 Bird egg ∑ Risk Quotients 2.64E-03 Zr-95 UKP-GW-GL-790 298 Limiting Reference Organism Revision 4 5.0 Environmental Impact UK AP1000 Environment Report Table 5.3-5 SENSITIVITY OF THE TIER 1 RESULTS OF ERICA TOOL ASSESSMENT FOR AIR EMISSIONS Scenario Stack Height (m) Wind Speed (ms-1) Distance to Receptor (m) Sum of Risk Quotient (unitless) A 81.626 5 200 2.64E-03 B 39.8 5 200 2.99E-03 C 81.626 1 200 1.32E-02 D 81.626 2 200 6.60E-03 E 81.626 5 200 2.64E-03 F 81.626 10 200 1.32E-03 G 81.626 5 50 5.82E-02 H 81.626 5 100 5.82E-02 I 81.626 5 200 2.64E-03 J 81.626 5 300 1.56E-03 K 39.8 1 50 2.91E-01 UKP-GW-GL-790 299 Revision 4 5.0 Environmental Impact UK AP1000 Environment Report Table 5.3-6 WATER DISCHARGE DATA USED IN THE ERICA TOOL Westinghouse Predicted Operating Data [Reference 8] Value Used in ERICA Tier 1 Assessment Value Used in ERICA Tier 2 Assessment Bqs-1 Bqs-1 Bqs-1 Tritium 1.06E+06 1.06E+06 1.06E+06 Carbon-14 1.05E+02 1.05E+02 1.05E+02 Sodium-24 1.20E+00 – 1.20E+00 Chromium-51 1.46E+00 – 1.46E+00 Manganese-54 1.01E+00 1.01E+00 1.01E+00 Cobalt-58 1.30E+01 1.30E+01 1.30E+01 Iron-55 1.55E+01 – 1.55E+01 Iron-59 1.59E-01 – 1.59E-01 Cobalt-60 7.29E+00 7.29E+00 7.29E+00 Nickel-63 1.71E+01 1.71E+01 1.71E+01 Zinc-65 3.17E-01 – 3.17E-01 Rubidium-88 1.24E-02 – 1.24E-02 Strontium-89 7.61E-02 7.61E-02 7.61E-02 Strontium-90 7.93E-03 7.93E-03 7.93E-03 Yttrium-91 2.89E-03 – 2.89E-03 Zirconium-95 2.19E-01 2.19E-01 2.19E-01 Niobium-95 1.93E-01 1.93E-01 1.93E-01 Molybdenum-99 6.02E-01 – 6.02E-01 Technetium-99m 5.71E-01 – 5.71E-01 Ruthenium-103 3.81E+00 3.81E+00 3.81E+00 Silver-110m 8.24E-01 8.24E-01 8.24E-01 Iodine-131 4.76E-01 4.76E-01 4.76E-01 Iodine-132 6.34E-01 6.34E-01 6.34E-01 Iodine-133 9.20E-01 9.20E-01 9.20E-01 Isotope UKP-GW-GL-790 300 Revision 4 5.0 Environmental Impact UK AP1000 Environment Report Table 5.3-6 (cont.) WATER DISCHARGE DATA USED IN THE ERICA TOOL Westinghouse Predicted Operating Data [Reference 8] Value Used in ERICA Tier 1 Assessment Value Used in ERICA Tier 2 Assessment Bqs-1 Bqs-1 Bqs-1 Iodine-134 1.87E-01 – 1.87E-01 Iodine-135 7.61E-01 – 7.61E-01 Caesium-134 2.41E-01 2.41E-01 2.41E-01 Caesium-136 2.95E-01 2.95E-01 2.95E-01 Caesium-137 7.29E-01 7.29E-01 7.29E-01 Barium-140 4.44E-01 – 4.44E-01 Lanthanum-140 5.71E-01 – 5.71E-01 Cerium-144 2.54E+00 2.54E+00 2.54E+00 Praseodymium-144 2.54E+00 – 2.54E+00 Plutonium-241 2.54E-03 2.54E-03 2.54E-03 Isotope Note: Cl-36, Nb-94, As-76, Br-82, Rb-86, Tc-99, Ru-106, Sn-117m, Sb-122, Sb-124, Sb-125, I-129 U-234, U-235, U-238, Np-237, Pu-238, Pu-239, Pu-240, Pu-242, Am-241, Am-243, Cm-242, Cm244 and all others each < 1.17E-03 Bqs-1. UKP-GW-GL-790 301 Revision 4 IAEA SRS-19 coastal model ERICA Default Media activity concentration Concentration Ratios UKP-GW-GL-790 3 Uncertainty factor (UF) (Check boxes 1,2,3,5 and 7 activated ERICA dose rate screening value 10 Gyh-1 Dose rate screening value 302 Revision4 In order to completely populate the CR database for Tier 2 analysis with default ERICA values, it was necessary to check boxes that incorporated information from the following sources above: 1), 2), 3), 5), and 7). The activity concentrations of radionuclides in biota within the ERICA tool are predicted from media activity concentrations using equilibrium concentration ratios (CRs). For the marine environment, these are based on the ratio of whole body to filtered water activity concentrations. The default radioecology databases within the ERICA tool were used to provide CR values for all reference organisms. The CRs used in the ERICA default database are comprehensive, drawing on an extensive review of published literature and characterised by statistical information. Where there is no published data for particular reference organism-radionuclide combinations, the ERICA tool adopts a standard procedure to derive the best CR values. This procedure requires information to be selected from various other sources prioritised in the following order: 1) Similar taxonomy, 2) Similar reference organism, 3) From published reviews, 4) Specific activity models, 5) Similar biogeochemistry, 6) Similar biogeochemistry and taxonomy, 7) Similar biogeochemistry and reference organism, 8) Allometric or other modelling approaches, 9) Highest available value, 10) Reference organism in a different ecosystem, and 11) Combination of approaches. Generic dispersion model within ERICA. Established internationally recognised methodology. Provides consistency, allowing comparison between different assessments. May be overly conservative. The method using UFs is based on the assumption that the estimated doses, and RQs, are exponentially distributed, which is supported by the principle of maximum entropy. Under these circumstances a UF of 3 establishes a 5% probability of exceeding the dose screening value. Appropriate for evaluating impact of water discharges to sea Comments Marine Input Ecosystem Parameter Table 5.3-7 UK AP1000 Environment Report INPUT DATA IN THE ERICA TIER 1 AND TIER 2 ASSESSMENT OF WATER EMISSIONS 5.0 Environmental Impact 10.0 Radiation Weighting Factor 150 m 100 m 0.1 m/s Distance between release point and shore Distance between release point and receptor Coastal current UKP-GW-GL-790 5m 3.0 Water depth (Chart Datum) Low beta Radiation Weighting Factor Beta/Gamma Radiation Weighting Factor 1.0 ERICA Default Occupancy Factor Alpha ERICA Default Input Distribution Coefficients Parameter Table 5.3-7 (cont.) UK AP1000 Environment Report 303 Default value recommended for use when site-specific information is not available (Reference 5-4) Assumed distance to nearest population of marine organisms of concern Assumed value Generic site information [Reference 5-1] Revision4 For a given unweighted absorbed dose rate, α-radiation may result in a more significant effect than β- or γ-radiation. Radiation weighting factors are introduced to account for the relative biological effectiveness of these different types of radiation. The radiation weighting factors used in ERICA have been adopted from FASSET. They have always been considered provisional values, applied for demonstration purposes only, and therefore, their application is arguably unsubstantiated. They might be considered conservative values. The occupancy factor, the fraction of time that the aquatic organism spends at a specified location in its habitat (e.g., on water surface/in water/at water sediment interface/in sediment). The ERICA default occupancy factors have been selected to maximise the dose, such as those selected for the location in the habitat where highest doses might be expected. This may lead to an overestimation of the dose rate in some cases. For aquatic environments, the distribution coefficient (Kd) is used to relate equilibrium activity concentrations in sediments with those in water. However, it is recognised that the ERICA default Kd are mostly poorly defined statistically, but they are used in the absence of a specific site selection and site-specific Kd values. Comments INPUT DATA IN THE ERICA TIER 1 AND TIER 2 ASSESSMENT OF WATER EMISSIONS 5.0 Environmental Impact 5.0 Environmental Impact UK AP1000 Environment Report Table 5.3-8 TIER 1 RESULTS OF ERICA TOOL ASSESSMENT ON WATER DISCHARGES Isotopes Risk Quotient (unitless) H-3 1.78E-03 Phytoplankton C-14 9.61E-03 Wading bird, reptile Mn-54 1.70E-01 Polychaete worm Co-58 3.86E-01 Polychaete worm Co-60 5.50E-01 Polychaete worm Ni-63 2.31E-04 Benthic mollusc Sr-89 1.57E-06 Sea anemones or true corals – colony Sr-90 3.06E-07 Sea anemones or true corals – colony Zr-95 3.32E-02 Polychaete worm Nb-95 1.18E-02 Polychaete worm Ru-103 8.15E-03 Phytoplankton Ag-110m 2.83E-03 Reptile I-131 4.44E-05 Macroalgae I-132 1.33E-04 Vascular plant I-133 1.61E-04 Macroalgae Cs-134 1.50E-04 Polychaete worm Cs-136 2.51E-04 Polychaete worm Cs-137 1.71E-04 Polychaete worm Ce-144 2.69E-01 Polychaete worm Pu-241 4.35E-07 Phytoplankton ∑ Risk Quotients 1.44+00 UKP-GW-GL-790 304 Limiting reference organism Revision 4 5.0 Environmental Impact UK AP1000 Environment Report Table 5.3-9 TIER 2 RESULTS OF WATER DISCHARGES USING THE ERICA DOSE RATE SCREENING VALUE Organism Total Dose Rate per organism (Gyh-1) Dominant Sources of Dose Rate Isotope % Dose RQ (expected value) (unitless) RQ (conservative value) (unitless) Polychaete worm 2.52E+01 Fe-59 Co-60 Co-58 76% 7% 5% 2.52E+00 7.57E+00 Macroalgae 1.34E+01 Fe-59 Co-60 Co-58 72% 7% 5% 1.34E+00 4.02E+00 Sea anemones or true corals – polyp 1.31E+01 Fe-59 Co-60 Co-58 73% 7% 5% 1.31E+00 3.92E+00 Benthic mollusc 1.23E+01 Fe-59 Co-60 Co-58 77% 7% 5% 1.23E+00 3.70E+00 Vascular plant 1.22E+01 Fe-59 Co-60 Co-58 77% 7% 5% 1.22E+00 3.65E+00 Benthic fish 1.15E+01 Fe-59 Co-60 Co-58 78% 8% 5% 1.15E+00 3.44E+00 Sea anemones or true corals – colony 1.13E+01 Fe-59 Co-60 Co-58 77% 8% 5% 1.13E+00 3.39E+00 Crustacean 1.10E+01 Fe-59 Co-60 Co-58 79% 8% 5% 1.10E+00 3.30E+00 Mammal 3.51E+00 Fe-55 Fe-59 C-14 65% 34% 1% 3.51E-01 1.05E+00 Reptile 3.50E+00 Fe-55 Fe-59 C-14 65% 33% 1% 3.50E-01 1.05E+00 (Wading) bird 2.76E+00 Fe-55 Fe-59 C-14 83% 16% 1% 2.76E-01 8.28E-01 UKP-GW-GL-790 305 Revision 4 5.0 Environmental Impact UK AP1000 Environment Report Table 5.3-9 (cont.) TIER 2 RESULTS OF WATER DISCHARGES USING THE ERICA DOSE RATE SCREENING VALUE Organism Total Dose Rate per organism (Gyh-1) Dominant Sources of Dose Rate Isotope % Dose RQ (expected value) (unitless) RQ (conservative value) (unitless) Zooplankton 9.09E-02 Fe-55 C-14 Ru-103 56% 20% 6% 9.09E-03 2.73E-02 Pelagic fish 3.87E-02 Fe-55 H-3 C-14 57% 13% 12% 3.87E-03 1.16E-02 Phytoplankton 3.23E-02 Fe-55 H-3 Fe-59 88% 7% 4% 3.23E-03 9.69E-03 UKP-GW-GL-790 306 Revision 4 Table 5.3-10 5 2 7 13 5 5 5 5 5 A B C D E F G H I UKP-GW-GL-790 Water Depth (m) Scenario 150 150 200 100 50 150 150 150 150 Distance between Release Point and Shore (m) 80 50 100 100 100 100 100 100 100 Distance between Release Point and Receptor (m) 307 0.1 0.1 0.1 0.1 0.1 0.1 0.1 0.1 0.1 Coastal Current (ms-1) 32.9 57.5 25.2 9.71 18.0 63.1 25.2 Total Dose Rate (μGyh-1) 8 (PW, Ma, SAp, BM, VP, BF, SAc, Cr) 8 (PW, Ma, SAp, BM, VP, BF, SAc, Cr) 0 1 (PW) 8 (PW, Ma, SAp, BM, VP, BF, SAc, Cr) 8 (PW, Ma, SAp, BM, VP, BF, SAc, Cr) No. Organisms greater with than .ERICA Screening Value 3 (Mm, Re, WB) 2 (Mm, Re) 8 (PW, Ma, SAp, BM, VP, BF, SAc, Cr) 7 (Ma, SAp, BM, VP, BF, SAc, Cr) 3 (Mm, Re, WB) 2 (Mm, Re) No. Organisms “insufficient confidence” Revision 4 3 (Zo, PF, Ph) 4 (WB, Zo, PF, Ph) 6 (WB, Zo, PF, Ph, Mm, Re) 6 (WB, Zo, PF, Ph, Mm, Re) 3 (Zo, PF, Ph) 4 (WB, Zo, PF, Ph) No. Organisms “negligible risk” UK AP1000 Environment Report SENSITIVITY OF THE TIER 2 RESULTS OF ERICA TOOL ASSESSMENT FOR WATER DISCHARGES TO SEA 5.0 Environmental Impact Table 5.3-10 (cont.) 5 5 5 5 5 2 J K L M N O UKP-GW-GL-790 Water Depth (m) Scenario 150 150 150 150 150 150 Distance between Release Point and Shore (m) 50 100 100 100 560 220 Distance between Release Point and Receptor (m) 308 0.5 0.5 0.2 0.05 0.1 0.1 Coastal Current (ms-1) 191 33.9 28.7 22.1 3.27 9.87 Total Dose Rate (μGyh-1) 11 (PW, Ma, SAp, BM, VP, BF, SAc, Cr, Mm, Re, WB) 8 (PW, Ma, SAp, BM, VP, BF, SAc, Cr) 8 (PW, Ma, SAp, BM, VP, BF, SAc, Cr) 6 (PW, Ma, SAp, BM, VP, BF, SAc, Cr) 0 0 No. Organisms greater with than .ERICA Screening Value 0 3 (Mm, Re, WB) 2 (Mm, Re) 4 (Mm, Re, SAc, Cr) 0 8 (PW, Ma, SAp, BM, VP, BF, SAc, Cr) No. Organisms “insufficient confidence” Revision 4 3 (Zo, PF, Ph) 3 (Zo, PF, Ph) 4 (Zo, PF, Ph, WB) 6 (WB, Zo, PF, Ph, Mm, Re) All 6 (WB, Zo, PF, Ph, Mm, Re) No. Organisms “negligible risk” UK AP1000 Environment Report SENSITIVITY OF THE TIER 2 RESULTS OF ERICA TOOL ASSESSMENT FOR WATER DISCHARGES TO SEA 5.0 Environmental Impact UKP-GW-GL-790 BF PF Zo 13 P Wading Bird Mammal Vascular Plant Water Depth (m) Scenario WB Mm VP Table 5.3-10 (cont.) Benthic Fish Pelagic Fish Zooplankton 150 Distance between Release Point and Shore (m) BM Ph Sac 0.05 Coastal Current (ms-1) 309 Benthic Mollusc Phytoplankton Sea Anemones or true corals 560 Distance between Release Point and Receptor (m) Cr PW Sac 1.7 0 0 No. Organisms “insufficient confidence” Crustacean Ma Macroalgae Polychaete Worm Re Reptile Sea Anemones or true corals – polyp Total Dose Rate (μGyh-1) No. Organisms greater with than .ERICA Screening Value Revision 4 All No. Organisms “negligible risk” UK AP1000 Environment Report SENSITIVITY OF THE TIER 2 RESULTS OF ERICA TOOL ASSESSMENT FOR WATER DISCHARGES TO SEA 5.0 Environmental Impact 5.0 Environmental Impact UK AP1000 Environment Report Table 5.3-11 INPUT DATA IN THE WILDLIFE DOSE ASSESSMENT SPREADSHEET Parameter Input Comments Ecosystem Terrestrial Concentration Rations Spreadsheet Default Spreadsheet Default Value Occupancy Factor Spreadsheet Default Spreadsheet Default Value Radiation Weighting Factor Beta/Gamma 1.0 Spreadsheet Default Value Emission flow rate 38.13 m3s-1 Westinghouse Design (Reference 1-1) Argon-41 concentration at receptor -3 0.360 Bqm Calculated in Reference 5-8 using Equations 4 to 6 from Reference 5-4 Krypton-85 concentration at receptor 1.911 Bqm-3 Calculated in Reference 5-8 using Equations 4 to 6 from Reference 5-4 Distance to receptor 200 m Distance to generic site boundary Wind speed 5.0 m/s Default value – conservative for generic site Fraction of time (wind blowing towards the direction of receptor) 0.25 ERICA Default Value Building Height 70m Reactor Building (Reference 1-1) Buildings Surface Area Wall 3000m2 Reactor Building (Reference 1-1) UKP-GW-GL-790 310 Revision 4 5.0 Environmental Impact UK AP1000 Environment Report Table 5.3-12 OUTPUT DATA IN THE WILDLIFE DOSE ASSESSMENT SPREADSHEET Organism Sum of Ar-41 and Kr-85 Dose Rate per Organism (μGy h-1) Ant 1.1E-04 Bacteria 6.4E-08 Bee 2.3E-04 Bird 1.5E-04 Bird Egg 1.1E-04 Caterpillar 2.6E-04 Earthworm 3.1E-08 Fungi 2.7E-04 Herb 1.7E-04 Lichen 1.4E-04 Mammal (carnivore) 5.7E-05 Mammal (herbivore) 4.9E-05 Reptile 6.3E-05 Rodent 4.6E-05 Seed 2.0E-04 Shrub 1.7E-04 Tree 1.7E-04 Woodlouse 1.4E-04 UKP-GW-GL-790 311 Revision 4 5.0 Environmental Impact UK AP1000 Environment Report A – Dungeness, B – Hartlepool, C – Heysham, D – Hinkley, E – Sizewell Figure 5.1-1. Location of Nuclear Power Stations Used to Establish the Generic Design Case UKP-GW-GL-790 312 Revision 4 UKP-GW-GL-790 5.0 Environmental Impact 313 Figure 5.1-2. Population Centres for the Generic Design Case Revision 4 UK AP1000 Environment Report UKP-GW-GL-790 5.0 Environmental Impact 314 Figure 5.1-3. Land Use and Habitat Data for the Generic Design Case Revision 4 UK AP1000 Environment Report UKP-GW-GL-790 5.0 Environmental Impact 315 Figure 5.1-4. Sites of Special Interest for the Generic Design Case Revision 4 UK AP1000 Environment Report 6.0 Environmental Monitoring UK AP1000 Environment Report 6.0 ENVIRONMENTAL MONITORING 6.1 Proposed Regulatory Limits The EA has produced guidance to assist nuclear regulators in setting consistent radioactive discharge limits for nuclear-licensed sites (Reference 6-1). This guidance has been used to calculate annual discharge limits for radioactive atmospheric emissions and radioactive liquid effluents from the AP1000 NPP (Reference 6-2); this report is summarised below. 6.1.1 Selection of Isotopes In selecting which isotopes warrant discharge limit calculations, consideration was given to those radionuclides which: are significant in terms of their radiological impact, are significant in terms of activity, have long half lives and may persist or accumulate in the environment, are indicators of plant performance, or provide for effective regulatory control. The criteria for selection are shown in Table 6.1-1 for gaseous discharges and Table 6.1-2 for liquid discharges. 6.1.2 Limits Setting Procedure The EA has produced guidance to assist nuclear regulators in setting consistent radioactive discharge limits for nuclear-licensed sites (Reference 6-1). This guidance suggests the following steps: Step 1: Review all plants on the site that contribute to discharges, and identifying those where limits should be set. As no specific site has been selected for the GDA process, no assumptions have been made regarding emissions and discharges from other plants located on the generic site. The emission and discharge data used to calculate limits are for the AP1000 NPP alone. Step 2: Derivation of the worst case annual plant discharges (WCPD) using the following formula: WCPD = (1.5 x D x T x A x B) + C + L + N – I [1] where: UKP-GW-GL-790 1.5 = an EA-established factor which relates “worst case” to average discharges. D = the representative average 12-month plant discharge, excluding discharges due to faulty plant operation. T = a factor that allows for any future increases in throughput, power output, etc., relative to the review period. 316 Revision 4 6.0 Environmental Monitoring UK AP1000 Environment Report A = a factor that allows for plant ageing. This allows for increases in discharges which result from changes within the plant as it ages that cannot be remedied or controlled by the operator. B = a factor that allows for other future changes that are beyond the control of the operator. For example, in a reprocessing plant, these would include the need to deal with higher burn-up or shorter-cooled fuel; at a dockyard, the need to deal with wastes from a new class of submarines. C = an allowance for decommissioning work beyond that carried out in the review period (and included in D). L = an allowance for dealing with legacy wastes, beyond those dealt with in the review period (and included in D). N = an allowance for new plant. I = the reduction in discharges expected as a result of introducing improvement schemes before the new authorisation comes into force. Since the Westinghouse AP1000 NPP site is a new plant, allowances are not made for decommissioning work, legacy wastes, further new plant, or introduction of improvement schemes. Thus, factors C, L, N, and I become zero, and the worst case plant annual discharge becomes: WCPD = 1.5 x D x T x A x B 6.1.3 [2] Calculated Limits To estimate the worst case annual plant discharge, the parameters in equation [2] must be defined. The selection of parameters is discussed below: Representative 12-month plant discharge (D) The predicted annual average plant discharges for an AP1000 NPP site are given in Tables 3.3-6, 3.3-7, 3.3-8, and 3.4-6. These averages are broken down into monthly releases over the 18-month fuel cycle for air emissions and liquid discharges in Tables 6.1-3 and 6.1-4, respectively. The monthly breakdown accounts for periods of start-up, shutdown, and maintenance. To allow for periods when the discharge is likely to be higher than the predicted annual average, the 12 months at the end of each cycle (i.e., months 7-18) is used as the worst case representative 12-month plant discharge. Future Increase in Throughput (T) There are no plans to increase the AP1000 NPP throughput, power output, etc., within the foreseeable future. This parameter has been set to 1. Plant Ageing (A) A margin of 10 percent is considered suitable to allow for increases in discharge as the plant ages. Therefore, this parameter is set to 1.1. UKP-GW-GL-790 317 Revision 4 6.0 Environmental Monitoring UK AP1000 Environment Report Future Changes (B) There are no foreseen future changes beyond the control of the operator. This parameter has been set to 1. Therefore, the worst case annual plant discharge may be calculated for each air and liquid effluent to propose an annual limit as follows: WCPD = 1.5 x D x T x A x B [2] WCPD = 1.5 x D x 1 x 1.1 x 1 [3] The results are summarised in Table 6.1-5 for air emissions and Table 6.1-6 for liquid discharges. The calculated annual limits are rounded to one significant figure as per the guidance in Reference 6-1. 6.1.4 Proposed Limits It is appropriate that the AP1000 NPP is regulated in a similar way to the existing NPPs in the UK. In this respect, it is proposed that annual limits for the AP1000 NPP are restricted to those isotopes that already have established limits at UK NPPs (Reference 6-3). The proposed annual limits for the AP1000 NPP are compared directly against the limits for the Sizewell B PWR site air emissions in Table 6.1-7 and for liquid discharges in Table 6.1-8. The proposed limits for the AP1000 NPP are compared directly against the limits for the UK AGRs in Table 6.1-9 and for liquid discharges in Table 6.1-10. Figures 6.1-1 to 6.1-7 show how the predicted rolling annual average emissions for gaseous radioactive emissions compare with the proposed limits. Figures 6.1-8 to 6.1-10 show how the predicted rolling annual average emissions for liquid radioactive discharges compare with the proposed limits. 6.2 Monitoring Programmes There are six types of environmental monitoring programmes that are typically used in the AP1000 NPP system, as shown in Table 6.2-1. 6.2.1 Radiological Monitoring This section provides a summary of the report on the discharge monitoring arrangements included in the AP1000 NPP design (Reference 6-4). This report compared the AP1000 NPP monitoring techniques with relevant UK regulatory guidance (References 6-5 to 6-7). It concluded that both the aerial and liquid effluent streams monitoring systems are in good agreement with the guidance. The proposed AP1000 NPP monitoring systems are broadly equivalent to monitoring systems currently used in operating UK NPPs. This provides confidence that the AP1000 NPP monitoring techniques are in line with current best practice in the UK. During the detailed AP1000 NPP design, consideration will be given to any future Environment Agency MCERTS requirements for the monitoring of radioactive discharges. This may include sampling and monitoring equipment, qualifications of personnel involved in monitoring, and laboratory accreditation. None of the monitoring requirements require new technology or measurement techniques. This provides confidence that the AP1000 NPP UKP-GW-GL-790 318 Revision 4 6.0 Environmental Monitoring UK AP1000 Environment Report monitoring techniques can be designed and engineered to demonstrate BAT and meet applicable UK requirements. 6.2.1.1 Aerial Emissions Gaseous radioactive effluents arise from a number of processes and in a number of different areas of the AP1000 NPP. Discharges to the atmosphere from the plant are through two main vents: The main plant vent provides the release path for containment venting releases, auxiliary building ventilation releases, annex building releases, radwaste building releases and gaseous radwaste. The AP1000 NPP WGS receives, processes, and discharges radwaste gases received during normal modes of plant operation including power generation, shutdown, and refuelling. About 90 percent of total annual aerial discharges (in Bq/y) are through the main plant vent. The turbine building vent provides the release path for the condenser air removal system, land seal condenser exhaust, and the turbine building ventilation releases. Under ideal normal operation conditions, no radwaste is discharged through the turbine building vent. However, it is possible that a number of small leaks from the primary coolant to the secondary coolant cycle occur during the plant’s operations, resulting in the possibility of a small aerial release from the turbine building vent. Figure 6.2-1 provides a schematic overview of the aerial release points. The design of the stack monitoring system is still being developed; the requirements of M1 and M11 will be considered during this development. The instrument that will be used for flow rate measurement has not been specified. When the instrument is specified, the register of MCERTS-certified equipment will be reviewed to determine if a suitable instrument is available on the register. The exact locations of the monitoring point (MP), flow measurement point, upstream and downstream disturbances, and location of filtration have not been determined. A sample point will be chosen where the flow is well mixed and the velocity profile is relatively constant across the cross-section. The sample point will be sufficiently remote from the last disturbance in the stack. The rising stack is a straight run with no bends or disturbances in the line. Sample points will be chosen to ensure that the gas velocities across the ducts are approximately equal and that the gases are homogenous. Tables 6.2-2 and 6.2-3 list the monitors that are associated with the main plant vent and turbine building vent, respectively. The tables include information on the type of monitor, radionuclides monitored, and detection ranges. The MP numbers relate to Figure 6.2-1. The main plant vent radiation monitor (MP 8) is an off-line monitor for particulates, iodine and noble gases. All main plant aerial discharge streams have converged at this point and the main plant vent monitor provides the data needed for discharge reporting. Sampling is continuous under routine operating conditions by normal range noble gas, particulate, and iodine detectors. The particulate monitor uses a beta-sensitive scintillation detector that views a fixed filter. The iodine detector is a gamma-sensitive, thallium-activated, sodium iodide, scintillation detector that views a fixed charcoal filter. Krypton-85 and xenon-133 are monitored by an in-line beta-sensitive scintillation detector. In addition to the normal range krypton-85 and xenon-133 monitor, MP 8 also contains 2 accident range noble gas detectors, one for mid-range and one for high-range activity concentrations. These are beta/gamma-sensitive detectors with smaller sensitive volumes. Accident range particulate and iodine activity concentrations are monitored at MP 8 using particulate and iodine filters UKP-GW-GL-790 319 Revision 4 6.0 Environmental Monitoring UK AP1000 Environment Report which would be taken to the on-site laboratory for analysis. In the event that elevated activity concentrations are detected by the normal range detectors, the monitored air flow would be redirected from the normal range detectors to the accident range detectors. In this way, the normal range detectors would not be damaged and/or contaminated by higher activity concentrations and remain available to resume monitoring once activity concentrations fall subsequently. The main plant vent monitor uses an isokinetic sampling nozzle assembly that has flow and temperature sensors. Plant vent flow measurements are also provided to allow for calculation of total flow. The monitor at MP 8 also includes the capability to collect grab samples for further analysis in the on-site laboratory. The turbine building vent discharge monitor (MP 10) is an in-line monitor for krypton-85 and xenon-133, using two beta/gamma-sensitive Geiger-Mueller tubes with overlapping detector ranges. The main purpose of this monitor is to provide data for discharge reporting in the event of a primary-to-secondary coolant leak. In addition, MP 9 provides nitrogen-16 detectors that are sensitive for detecting primary-to-secondary coolant leakage and are located near the steam generator main steam outlet and upstream of the turbine. The facility to collect manual grab samples is provided at two points before the turbine vent effluents converge and are released to the atmosphere; at the condenser air removal system and at the gland seal system. The grab samples can be analysed in the on-site laboratory. The monitoring equipment and sample point will be located in the upper-most floors of the auxiliary building near the base of the main stack structure. They will be located on a purpose built skid, the design of which is still being developed. The design criteria are for the monitor installations and sample line connections to be located such that sufficient access is provided to easily service the monitor or sample line connection. The design of the skid will contain additional space around the front and rear of the equipment to allow access for maintenance activities. There are additional MPs (MPs 1-7) upstream of the main plant vent that provide information that allow operators to locate the origin of any abnormal releases prior to discharge to the main plant vent. In addition, these internal vent monitors function as backup monitors for the main plant vent. They are discussed in the following paragraphs. The radwaste building exhaust monitor (MP 1) and the health physics and hot machine shop exhaust monitor (MP 3) are off-line particulate monitors for measuring caesium-137 and strontium-90. Beta-sensitive scintillation detectors viewing fixed particulate filters are used in each. The monitors are located downstream of the exhaust fans. The primary purpose of these monitors is to alert the control room should activity concentrations exceed a predetermined set point. The annex building (MP 2), containment air filtration and exhaust (MP 4), auxiliary building (MP 5), and fuel handling area (MP 6) exhaust radiation monitors are in-line monitors for krypton-85 and xenon-133, using beta-sensitive scintillation detectors. The monitors are located upstream of isolation valves which, when triggered, can reroute the waste streams through filtration exhaust units. The primary purpose of these monitors is to alert the control room should activity concentrations exceed a predetermined set-point. The gaseous radwaste exhaust radiation monitor (MP 7) is an in-line monitoring detector for krypton-85 and xenon-133, using a beta-sensitive scintillation detector. The monitor is situated before the discharge reaches the plant vent or is diluted by any other flows. The detection range is higher than that of MP 2, 5, and 6. The primary purpose of this monitor is to alert the control room should activity concentrations exceed a predetermined set-point. UKP-GW-GL-790 320 Revision 4 6.0 Environmental Monitoring UK AP1000 Environment Report The monitoring of tritium and carbon-14 is currently not included in the design of the continuous monitoring systems. Typically, tritium and carbon-14 activity concentrations in the plant vent will be below minimum detectable levels of detectors. In order to determine their activity levels in aerial discharges from NPPs, off-line bubbler systems will be used to concentrate levels over several days or weeks to obtain measurable activity concentrations. The bubbler system, required for sampling of tritium and carbon-14, is currently will be incorporated into the design of the main stack sampling system. The laboratory equipment used to analyse these samples is utility-operator-specific. 6.2.1.2 Water Discharges There are two discharge streams for liquid effluents at the AP1000 NPP, all of which are released into the environment via the seawater cooling return outfall. 1. Liquid Radwaste System (WLS) Treated liquid radwaste is collected in one of six monitor tanks before discharge to the seawater cooling return (see subsection 3.4.3.6). Prior to discharge to the sea, a grab sample is taken from the filled monitoring tank to be discharged. In order to obtain a representative sample, each tank is equipped with a recirculation line which has a sampling point (W1, W2, W3, W4, W5, or W6). The pump suction is taken from the bottom of the tank and returned to the top as quickly as possible to minimize the time needed for mixing. This will ensure the contents of the tank are fully mixed prior to sampling and so ensuring a representative sample is obtained. The sample is dispatched for laboratory for analysis to confirm that radionuclide concentrations and activity levels are within acceptable limits. Effluent which does not meet the discharge limit can be returned to a waste holdup tank or recirculated directly through the filters and ion exchangers for further treatment. Effluent meeting discharge limits for radioactivity is pumped (design flow rate of ~22.7m3/h) from the monitor tanks, batchwise, to the sea water cooling return sump through a common discharge line. It is mixed with the cooling water return of the CWS. In addition, the discharge line contains a radiation monitor (W7) with diverse methods of stopping the discharge. The first method closes an isolation valve in the discharge line, which prevents any further discharge from the WLS. The valve automatically closes and an alarm is actuated if the activity in the discharge stream reaches the monitor set point. The second method stops the monitor tank pumps. It should also be noted that the AP1000 NPP design will be able to accommodate various systems such as administrative procedures and/or interlocks to avoid (a) an inadvertent discharge from the filled monitoring tank prior to sampling and confirmatory analysis and (b) discharge of the tank simultaneous to filling of the tank or other operations such as transfers between tanks or retreatment. The system chosen is site/utility operator-specific. 2. Waste Water System (WWS) The non-radwaste water, during normal plant operation and during plant outages, is handled by the WWS (see Section 4.2.6). Water is collected in the turbine building sumps, with a temporary storage capacity and a controlled source of fluid flow to the oil separator and WWRB. A radiation monitor (W9) located on the common discharge piping of the sump pumps provides an alarm upon detection of radioactivity in the waste water. In the event UKP-GW-GL-790 321 Revision 4 6.0 Environmental Monitoring UK AP1000 Environment Report radioactivity is present in the turbine building sumps, the waste water is diverted from the sumps to the WLS for processing and disposal. The radiation monitor also trips the sump pumps on detection of radioactivity to isolate the contaminated waste water. Provisions are included for sampling the sumps (W8). The waste water collected in the WWRB is sampled (W10) to confirm that radionuclide concentrations and activity levels are within acceptable limits. Waste water that complies with discharge limits will be released intermittently via the seawater cooling return sump for final discharge via the plant outfall to the sea. A further MP (W11) for the final monitoring of the liquid wastes from minor discharge routes will be part of the Waste Water Basin design which is site-specific. In addition to the waste water effluent streams, the sea water used to provide once-through non-contact sea water cooling for the SWS and the CWS will be sampled. Both cooling systems will allow grab samples (W12, W14) to be taken from the turbine building to enable chemical analysis of the sea discharge flows. The secondary side service water blowdown will be non-radioactive under normal operating conditions and will be discharged to the WWS or to the CWS. However, under a fault condition, the service water blowdown may become radioactive. If the radiation levels sensed by radiation monitor (W13) are above acceptable limits for sea discharge, it will require treatment (e.g., by the WLS). It should be noted that the design of the SWS and the CWS, including the location of the sampling and MPs, is site-specific. The radiation monitors at W7, W9, and W13 are expected to be gamma sensitive, thallium activated, silver iodide scintillation counters. These will be set to detect Cs-137 in a concentration range of 3.7E04 to 3.7E08 Bqm-3. Specifications for the precision, bias, and availability/reliability will be developed at a later stage in the design. Commercially available RMS equipment will be used in the design. The AP1000 NPP design will allow the data from the radiation monitors to be collected by the instrument and fed to the control system. The method by which the data is collated and reported to the EA is utility-operatorspecific. The method for determining how the alarm threshold will be set has not been determined. Each discharge line will be fitted with a flow meter. The instrument that will be used for flow rate measurement has not been specified. When the instrument is specified, the register of MCERTS certified equipment will be reviewed to determine if a suitable instrument is available on the register. The AP1000 NPP design will allow the data from the flow meter to be collected by the instrument and fed to the control system. The method by which the data is collated and reported to the EA is utility-operator-specific. The current AP1000 NPP design will be able to accommodate both grab sampling as well as a proportional sampling in order to obtain a representative sample. Although the specification for the flow proportional sampler is utility-operator-specific, the equipment required to take a representative sample from each of the discharge lines will include a commercially available stationary waste water sampler equipped with an ancillary signal connection and a pressurised pipeline interface. These commercially available samplers have a range of programmable options for setting the frequency and size of sample volume. These will be capable of providing a representative sample from each of the discharge lines over a suitable time period. The AP1000 NPP reactor design will be able to accommodate a separate proportional sampler for each discharge line, which can be secured to allow an independent sample to be taken for UKP-GW-GL-790 322 Revision 4 6.0 Environmental Monitoring UK AP1000 Environment Report regulatory purposes. Proportional samplers with a lockable cabinet are commercially available. All sampling and monitoring equipment will be housed in weather-shielded buildings and will be located in areas where access is controlled. The AP1000 NPP will have an on-site laboratory with the capability to be UKAS accredited to ISO17025. The utility operator will specify the equipment for the laboratory and implement the processes necessary to achieve ISO17025 accreditation. Tritium activity concentrations in the liquid effluent are likely to be below minimum detectable levels of online continuous detectors. The assessment of tritium can be carried out through analysis of grab samples. Figure 6.2-2 provides a schematic overview of the liquid effluent processes. The exact location and total number of sample and MPs are site-specific. Table 6.2-4 lists the monitors that are associated with each of the liquid discharge streams. The tables include information on the type of monitor, radionuclides monitored, and detection ranges. The MP (W) numbers relate to Figure 6.2-2. 6.2.1.3 Solid Waste LLW packages will be put through an LRGS in order to “fingerprint” each waste package. Fingerprint analysis is the common name used for the practice of determining the range of activities and isotopes present in a waste stream. By building up a “fingerprint” of the isotopes from measurements in a consistent waste stream, it is possible to measure one isotope (e.g., Co-60 or Cs-137) and infer the presence and relative proportion of a range of other isotopes. So, when an LRGS is used, although some active isotopes may have no or very low gamma emissions and the LRGS can not ‘see’ them, their presence can be inferred. Every ILW waste package will be “finger printed” using an HRGS within the ILW store to monitor its activity level before it is transferred to the ILW store. Waste package inventory records will be completed according to the required regulations to maintain an inventory record of each waste package and its location within the ILW store. The ILW store will be fitted with alpha and beta/gamma monitors to detect any leaks in activity. The facility will exist to visually observe the waste packages within the ILW store via CCTV. If a waste package shows evidence of deviating from the specification during storage, i.e., via corrosion or damage, it will be placed in an allotted area within the ILW store and potentially put into a SCV. There will be alpha and beta/gamma monitors within the auxiliary building to monitor the radioactivity during spent fuel handling operations and over the course of its storage within the cooling pond. 6.2.1.4 Dosimetry Authorised discharges from NPPs can result in a small increase in public radiation exposure because of external exposure, inhalation, and the incorporation of radionuclides into food. A monitoring programme will be established to monitor on-site worker and off-site populations on a regular basis to ensure that exposures to radioactivity are within limits. The programme for off-site monitoring will be established according to the site-specific conditions and the pathways that may result in people becoming exposed to radioactivity released into the environment. These pathways include: UKP-GW-GL-790 323 Revision 4 6.0 Environmental Monitoring UK AP1000 Environment Report In gaseous form inhalation of airborne radioactivity ingestion of food containing deposited radioactive materials external exposure from airborne radioactivity external exposure from radioactive material deposited on the ground In liquid form ingestion of radioactivity incorporated into seafood external exposure from radioactivity deposited on inter-tidal areas external exposure from handling contaminated items Examples of the type of environmental monitoring that may be carried out include analysis of milk, meat, grass, vegetables, soil, beach material, silt, sediment, fish, shellfish, and seaweed. Laboratory analysis of these samples will be dictated by the major releases The monitoring will include determination of the contribution to the annual total dose of the maximum exposed individual from radioactive emissions and other nearby radioactive sources. Comparisons will be made with theoretical dose calculations. 6.2.2 Hydrological Monitoring 6.2.2.1 Groundwater The groundwater monitoring scheme will be developed on the basis to the site-specific design and an understanding to the site-specific groundwater flow regime. The groundwater monitoring scheme would typically include the following features: Installation of groundwater monitoring boreholes encircling the power plant site a distance of 100-200m from the plant. Separation of boreholes by distances of 50m-100m on the down hydraulic gradient side of the site and 100m-200m on the up hydraulic gradient of the site. Location of an up hydraulic gradient borehole on the site boundary as a source of reference. Groundwater monitoring wells with monitoring response zones in all of the identified groundwater bodies. Groundwater monitoring locations positioned in the proximity to any site activities thought to represent a higher than normal contamination risk to the subsurface (e.g., diesel storage). Sampling from any surface water feature that was located within the catchment area of the proposed development. Samples would be required from one upstream and one downstream location from the site. A quarterly groundwater monitoring programme with the aim of detecting any emissions entering or leaving the site. UKP-GW-GL-790 324 Revision 4 6.0 Environmental Monitoring UK AP1000 Environment Report Areas of the site to be specifically considered for the groundwater monitoring program are: West of the auxiliary building in the area of the fuel transfer canal (which includes an outside wall) West and south of the radwaste building (which incorporates a curbed basemat, but does not have the monolithic basemat / wall nature of the auxiliary building) East of the auxiliary building rail bay and the radwaste building truck doors Close proximity to the diesel storage tanks All assumptions relating to potential groundwater flow and subsurface permeability will be as a direct result of a conceptual site model. A site-specific conceptual site model will be developed prior to any detailed design of the groundwater monitoring programme. 6.2.2.2 Surface Water There are no surface water features identified for the generic site; hence, no monitoring programme is proposed. A monitoring programme for adjacent surface water bodies may be developed if there is a potential impact at a specific site. 6.2.3 Ecological Monitoring The impact of aerial and liquid effluent discharges on sensitive ecological receptors will be monitored on a regular basis. This monitoring will be site-specific and take into account the presence of sensitive and indicator species present at the site. The types of organisms that may be monitored include those shown in Table 5.1-4. For example, polychaete worms inhabit marine sediments and provide the basis of the food chain for many higher marine species. As sessile species, they are predicted to receive the highest marine organism dose rate from the AP1000 NPP discharges (see Section 5.3.3). They are also valuable biomonitors, quickly showing sensitivity to contaminants such as heavy metals through bioaccumulation. Environmental impacts can therefore be monitored through changes in the species richness, abundance, and community composition of the polychaete worms. 6.2.4 Thermal Monitoring The temperature of cooling water discharges will be regularly monitored. The main cooling water will be returned to sea at a temperature differential of ~8C (see subsection 4.2.3.3). The heat will be dissipated as rapidly as possible by suitable design and location of the discharge point at each site. The dispersion of heat and the thermal plume will be characterised to identify the area where significant impacts may occur on benthic and pelagic species. 6.2.5 Chemical Monitoring A programme of laboratory testing of the waste water will be established. Typical parameters that would be monitored include: pH, Eh, conductivity, temperature, oil and grease, total organic carbon, trace metals (e.g., copper, nickel, zinc, chromium, iron, cadmium, and mercury), phosphate, and ammonia. UKP-GW-GL-790 325 Revision 4 6.0 Environmental Monitoring UK AP1000 Environment Report Chemical monitoring and controlled (automatic) dosing of sodium hypochlorite will be carried out to ensure the minimum required dose is applied to control biofouling in the cooling water systems. Since the applied hypochlorite concentration will decrease through the CWS, chemical monitors are needed to ensure effective concentrations at critical points in the system. The chlorine residual in the cooling water discharge will be monitored. Laboratory testing of by-products of chlorination will be carried out (e.g., trihalomethanes and halogenated acetic acids) to determine their concentrations in the seawater cooling outfall. Chemical monitoring will be used in conjunction with the MCERTS flow monitoring (see subsection 6.2.1.2) to determine mass releases of non-radioactive pollutants from the AP1000 NPP. 6.2.6 Meteorological Monitoring Meteorological monitoring carried out on site will typically involve continuous instrumental monitoring of wind speed and direction, dry-bulb temperature, dew point temperature and rainfall. 6.3 Ground Information Required Before Construction A variety of ground information will be gathered for the specific site before construction. This includes the following regional and site-specific geological, seismological, and geophysical information as well as conditions caused by human activities: Structural geology of the site Seismicity of the site Geological history Evidence of paleoseismicity Site stratigraphy and lithology Engineering significance of geological features Site groundwater conditions Dynamic behavior during prior earthquakes Zones of alteration, irregular weathering, or structural weakness Unrelieved residual stresses in bedrock Materials that could be unstable because of mineralogy or unstable physical properties Effect of human activities in the area In addition to establishing the geotechnical requirements of the site, the nature of the site will need to be characterised to identify the likely behaviour of past or potential future contamination. This will take the form of a desk study which will determine historical land UKP-GW-GL-790 326 Revision 4 6.0 Environmental Monitoring UK AP1000 Environment Report use (greenfield or brownfield) and to develop a conceptual site model which identifies contaminant-path-receptor relationships that may exist. The Phase 1 desk study would include: Historical land use of the site and surrounding area Geology and surface deposits Hydrogeology and hydrology of area (including flood risk) Characterisation of natural, historic, current, and potential future sources of ground contamination Pathways by which contaminants might migrate into, out of, and through the site Potential receptors that could be harmed by ground contamination (e.g., people, controlled waters, ecological, buildings, and building materials) Definition of the limitations and uncertainties relating to site information The conceptual model developed at Phase 1 would identify potentially significant contaminant-pathway-receptor linkages and these may require further investigation for existing issues. For potential future releases, the results of the Phase 1 work would be used to determine appropriate management and control strategies to prevent and minimise impacts. The desk study may need to be supplemented by a Phase 2 intrusive investigation to better define any existing site contamination and to improve understanding of the groundwater regime. This may include, but is not limited to: Investigation of ground by appropriate techniques e.g. trial pits, boreholes Collection and analysis of soil samples Determination particle size distribution, porosity, and permeability of soils and underlying bedrock Installation of standpipes for monitoring of gas and groundwater Baseline monitoring, sampling, and analysis of groundwater over appropriate time periods (typically 3 to 12 months) Use of groundwater level sensors to determine influences of groundwater level (e.g. rainfall and tidal effects) Baseline monitoring of gas over appropriate time periods (typically 6 to 24 months) Sampling and analysis of surface waters over appropriate time periods (typically 3 to 12 months) The results would identify the need for any site remediation and/or further management and control strategies for the proposed development. UKP-GW-GL-790 327 Revision 4 6.0 Environmental Monitoring 6.4 UK AP1000 Environment Report References 6-1 Science Report SC010034/SR, “Developing Guidance for Setting Limits on Radioactive Discharges to the Environment from Nuclear-Licensed Sites,” Environment Agency, December 2005. 6-2 UKP-GW-GL-028, Rev. 2, “Proposed Annual Limits for Radioactive Discharge,” Westinghouse Electric Company LLC, 2011. 6-3 “Decision Document and Authorisations for Future Regulation of Disposals of Radioactive Waste under the Radioactive Substances Act 1993 at British Energy Generation Limited’s Nuclear Sites: Dungeness B Power Station, Hartlepool Power Station, Heysham 1 Power Station, Heysham 2 Power Station, Hinkley Point B Power Station, Sizewell B Power Station,” Environment Agency, December 2006. 6-4 UKP-GW-GL-029, Rev. 0, “AP1000 Generic Design Measurement and Assessment of Discharges,” Westinghouse Electric Company LLC, 2009. 6-5 2004/2/Euratom, “Commission Recommendation 2004/2/Euratom of 18 December 2003 on standardized information on radioactive airborne and liquid discharges into the environment from nuclear power reactors and reprocessing plants in normal operation,” Official Journal of the European Communities, pp. 36-46, January 2004. 6-6 Technical Guidance Note M11, “Monitoring of Radioactive Releases to Atmosphere from Nuclear Facilities,” Environment Agency, 1999. 6-7 Technical Guidance Note M12, “Monitoring of Radioactive Releases to Water from Nuclear Facilities,” Environment Agency, 1999. UKP-GW-GL-790 328 Revision 4 6.0 Environmental Monitoring UK AP1000 Environment Report Table 6.1-1 ISOTOPIC SELECTION CRITERIA FOR AIR EMISSION LIMIT CALCULATION Selection Criteria Significant in terms of their radiological impact Isotopes Selected >1% contribution to fisherman family dose (uS/y): C-14, I-131, H-3, Ar-41 >1% contribution to 500y collective dose (manSv): C-14, H-3 Significant in terms of activity >10% activity (Bq/y): Kr-85, H-3, Xe-131m, Xe-133, Ar-41 Have long half lives and may persist or accumulate in the environment Half-life >10 years, concentration factors (terrestrial organisms) >1000 and release rates >3.7E+04Bq/y: C-14 Indicators of plant performance Indicative of particulate emissions: Co-60 Provide for effective regulatory control Main Vent: Sr-90/Cs-137, I-131, Kr-85/Xe-133 Turbine building vent: Kr-85/Xe-133 Internal vent monitors: Sr-90/Cs-137, Kr-85/Xe-133, N-16(1) Grab samples: noble gases, iodine, particulates, and tritium Summary H-3, C-14, N-16(1), Ar-41, Co-60, Kr-85, Sr-90, I-131, Xe-131m, Xe133, Cs-137 Note: 1. N-16 detectors are used to detect primary-to-secondary coolant leakage and are located near the steam generator main steam outlet and upstream of the turbine. N-16 has a very short half-life of 7.13 seconds and, as such, is not a suitable isotope for use as a regulatory emission standard to atmosphere. UKP-GW-GL-790 329 Revision 4 6.0 Environmental Monitoring UK AP1000 Environment Report Table 6.1-2 ISOTOPIC SELECTION CRITERIA FOR LIQUID DISCHARGE LIMIT CALCULATIONS Selection Criteria Significant in terms of their radiological impact Isotopes Selected >1% contribution to fisherman family dose (uS/y): C-14, Co-60, Co-58, H-3 >1% contribution to 500y collective dose (manSv) C-14, H-3 Significant in terms of activity >10% activity (Bq/y): H-3 Have long half lives and may persist or accumulate in the environment Half-life >10 years, concentration factors (aquatic organisms) >1000 and release rates >3.7E+04Bq/y: C-14, Ni-63, Cs-137, Pu-241 Indicators of plant performance Indicative of corrosion: Fe-55, Ni-63 Indicative of fuel leaks: Cs-137 Other particulates expressed as Co-60 Provide for effective regulatory control Continuously monitored isotopes: Cs-137 Summary H-3, C-14, Fe-55, Co-58, Co-60, Ni-63, Sr-90, Cs-137, Pu-241 UKP-GW-GL-790 Monitored isotopes grab samples: H-3, Co-60, Sr-90, Cs-137 330 Revision 4 10.001 4.96E-05 4.96E-05 4.96E-05 4.96E-05 4.96E-05 4.96E-05 4.96E-05 4.96E-05 4.96E-05 4.96E-05 4.96E-05 4.96E-05 4.96E-05 4.96E-05 4.96E-05 8.93E-04 4 5 6 7 8 9 10 11 12 13 14 15 16 17 18 Total UKP-GW-GL-790 2.031 4.96E-05 3 1.117 0.815 0.662 0.570 0.508 0.463 0.430 0.404 0.383 0.366 0.351 0.339 0.329 0.320 0.312 0.305 4.96E-05 2 0.298 Noble Gases 4.96E-05 Radio Iodines 1 Month Table 6.1-3 2.664 0.242 0.184 0.165 0.155 0.149 0.145 0.142 0.140 0.138 0.137 0.136 0.135 0.134 0.134 0.133 0.132 0.132 0.132 Tritium 0.910 0.083 0.063 0.056 0.053 0.051 0.050 0.048 0.048 0.047 0.047 0.046 0.046 0.046 0.046 0.046 0.045 0.045 0.045 C-14 1.887 0.171 0.130 0.117 0.110 0.105 0.103 0.101 0.099 0.098 0.097 0.096 0.096 0.095 0.095 0.094 0.094 0.094 0.093 Ar-41 4.85E-06 2.69E-07 2.69E-07 2.69E-07 2.69E-07 2.69E-07 2.69E-07 2.69E-07 2.69E-07 2.69E-07 2.69E-07 2.69E-07 2.69E-07 2.69E-07 2.69E-07 2.69E-07 2.69E-07 2.69E-07 2.69E-07 Co-60 4.662 1.269 0.644 0.437 0.330 0.267 0.224 0.194 0.171 0.153 0.138 0.127 0.117 0.108 0.101 0.095 0.090 0.085 0.081 Sr-90 6.66E-07 3.70E-08 3.70E-08 3.70E-08 3.70E-08 3.70E-08 3.70E-08 3.70E-08 3.70E-08 3.70E-08 3.70E-08 3.70E-08 3.70E-08 3.70E-08 3.70E-08 3.70E-08 3.70E-08 3.70E-08 3.70E-08 331 Kr-85 3.11E-04 1.73E-05 1.73E-05 1.73E-05 1.73E-05 1.73E-05 1.73E-05 1.73E-05 1.73E-05 1.73E-05 1.73E-05 1.73E-05 1.73E-05 1.73E-05 1.73E-05 1.73E-05 1.73E-05 1.73E-05 1.73E-05 I-131 2.054 0.492 0.259 0.183 0.144 0.120 0.105 0.0932 0.0847 0.0780 0.0727 0.0683 0.0647 0.0616 0.0589 0.0566 0.0546 0.0528 0.0513 Xe-131m Predicted Monthly Air Radiation Discharges (TBq) 1.887 0.187 0.136 0.119 0.111 0.105 0.102 0.100 0.098 0.096 0.095 0.094 0.093 0.093 0.092 0.091 0.091 0.091 0.090 Xe-133 2.00E-06 1.11E-07 1.11E-07 1.11E-07 1.11E-07 1.11E-07 1.11E-07 1.11E-07 1.11E-07 1.11E-07 1.11E-07 1.11E-07 1.11E-07 1.11E-07 1.11E-07 1.11E-07 1.11E-07 1.11E-07 1.11E-07 Cs-137 15.463 2.527 1.494 1.152 0.980 0.875 0.805 0.755 0.717 0.687 0.664 0.644 0.628 0.614 0.602 0.592 0.583 0.575 0.568 Total Revision 4 1.83E-05 1.02E-06 1.02E-06 1.02E-06 1.02E-06 1.02E-06 1.02E-06 1.02E-06 1.02E-06 1.02E-06 1.02E-06 1.02E-06 1.02E-06 1.02E-06 1.02E-06 1.02E-06 1.02E-06 1.02E-06 1.02E-06 Other Particulate UK AP1000 Environment Report PREDICTED MONTHLY AIR RADIATION EMISSIONS DURING 18-MONTH CYCLE 6.0 Environmental Monitoring Table 6.1-4 8.70E-03 2.489 2.498 2.509 2.522 2.536 2.554 2.574 2.599 2.631 2.671 2.724 2.798 2.909 3.092 3.453 4.548 50.061 3 4 5 6 7 8 9 10 11 12 13 14 15 16 17 18 Total UKP-GW-GL-790 2.43E-03 2.481 2 1.22E-03 8.25E-04 6.25E-04 5.03E-04 4.22E-04 3.61E-04 3.17E-04 2.83E-04 2.55E-04 2.32E-04 2.13E-04 1.97E-04 1.83E-04 1.71E-04 1.61E-04 1.52E-04 1.43E-04 2.473 1 NonTritium Tritium Month 5.00E-03 1.40E-03 7.07E-04 4.74E-04 3.59E-04 2.88E-04 2.41E-04 2.07E-04 1.82E-04 1.62E-04 1.46E-04 1.32E-04 1.22E-04 1.12E-04 1.04E-04 9.73E-05 9.14E-05 8.62E-05 8.14E-05 C-14 7.25E-04 2.03E-04 1.02E-04 6.88E-05 5.22E-05 4.18E-05 3.51E-05 3.02E-05 2.65E-05 2.36E-05 2.13E-05 1.94E-05 1.78E-05 1.65E-05 1.54E-05 1.44E-05 1.35E-05 1.27E-05 1.20E-05 Fe-55 6.14E-04 1.72E-04 8.66E-05 5.85E-05 4.40E-05 3.55E-05 2.97E-05 2.56E-05 2.25E-05 2.00E-05 1.81E-05 1.65E-05 1.51E-05 1.40E-05 1.30E-05 1.22E-05 1.14E-05 1.08E-05 1.02E-05 Co-58 332 3.41E-04 9.51E-05 4.81E-05 3.23E-05 2.45E-05 1.96E-05 1.65E-05 1.42E-05 1.24E-05 1.11E-05 9.99E-06 9.10E-06 8.36E-06 7.73E-06 7.18E-06 6.73E-06 6.33E-06 5.96E-06 5.62E-06 Co-60 8.33E-04 2.18E-04 1.10E-04 7.44E-05 5.62E-05 4.51E-05 3.77E-05 3.25E-05 2.85E-05 2.54E-05 2.29E-05 2.09E-05 1.92E-05 1.78E-05 1.65E-05 1.54E-05 1.45E-05 1.37E-05 1.30E-05 Ni-63 3.70E-07 1.03E-07 5.18E-08 3.49E-08 2.63E-08 2.12E-08 1.77E-08 1.52E-08 1.33E-08 1.18E-08 1.07E-08 9.73E-09 8.92E-09 8.25E-09 7.66E-09 7.14E-09 6.70E-09 6.33E-09 5.96E-09 Sr-90 Predicted Monthly Liquid Radiation Discharges (TBq) 3.42E-05 9.51E-06 4.81E-06 3.23E-06 2.45E-06 1.97E-06 1.65E-06 1.42E-06 1.24E-06 1.11E-06 9.99E-07 9.10E-07 8.36E-07 7.73E-07 7.22E-07 6.73E-07 6.33E-07 5.96E-07 5.66E-07 Cs-137 1.22E-07 3.43E-08 1.72E-08 1.16E-08 8.77E-09 7.07E-09 5.88E-09 5.07E-09 4.44E-09 3.96E-09 3.56E-09 3.24E-09 2.97E-09 2.75E-09 2.55E-09 2.38E-09 2.23E-09 2.11E-09 1.99E-09 Pu-241 9.44E-04 2.60E-04 1.31E-04 8.88E-05 6.73E-05 5.44E-05 4.59E-05 3.96E-05 3.47E-05 3.11E-05 2.81E-05 2.57E-05 2.37E-05 2.20E-05 2.05E-05 1.92E-05 1.81E-05 1.71E-05 1.63E-05 Other Isotopes Revision 4 50.070 4.550 3.455 3.092 2.909 2.799 2.724 2.671 2.631 2.600 2.574 2.554 2.537 2.522 2.509 2.499 2.489 2.481 2.473 Total UK AP1000 Environment Report PREDICTED MONTHLY LIQUID DISCHARGES OF RADIOISOTOPES DURING 18 MONTH FUEL CYCLE 6.0 Environmental Monitoring 6.0 Environmental Monitoring UK AP1000 Environment Report Table 6.1-5 CALCULATED ANNUAL LIMITS FOR AIR EMISSIONS Representative 12-Month Plant Discharge (D) (TBq/y) Worst Case Plant Annual Discharges (WCPD) (TBq/y) Calculated Annual Limit (TBq/y) Radioiodines(1) 5.95E-04 9.82E-04 1E-03 Noble Gases(2) 8.099 13.363 13 Tritium 1.867 3.081 3 Carbon-14 0.638 1.053 1 Argon-41 1.323 2.182 2 Cobalt-60 3.22E-06 5.32E-06 5E-06 4.070 6.716 7 Strontium-90 4.44E-07 7.33E-07 7E-07 Iodine-131 2.07E-04 3.42E-04 3E-04 Xenon-131m 1.76 2.91 3 Xenon-133 1.335 2.203 2 1.33E-06 2.20E-06 2E-06 1.22E-05 2.01E-05 2E-05 1.72E-05 2.84E-05 3E-05 11.928 19.681 20 Air Effluent Input Krypton-85 Caesium-137 Other particulates (3) Total Beta particulate Total Notes: 1. Radioiodines include I-131 and I-133. 2. Noble gases include Kr-85m, Kr-85, Kr-87, Kr-88, Kr-85, Xe-131m, Xe-133m, Xe-133, Xe-135m, Xe-135, Xe-137, Xe-138. 3. Total beta particulate include Co-60 + Sr-90 + Cs-137 + other particulates. UKP-GW-GL-790 333 Revision 4 6.0 Environmental Monitoring UK AP1000 Environment Report Table 6.1-6 CALCULATED ANNUAL LIMITS FOR LIQUID DISCHARGES Representative 12-Month Plant Discharge (D) (TBq/y) WCPD (TBq/y) Calculated Annual Limit (TBq/y) 35.09 57.90 60 Non-tritium 7.70E-03 1.27E-02 1E-02 Carbon-14 4.42E-03 7.30E-03 7E-03 Iron-55 6.42E-04 1.06E-03 1E-03 Cobalt-58 5.44E-04 8.97E-04 9E-04 Cobalt-60 3.01E-04 4.97E-04 5E-04 Nickel-63 6.91E-04 1.14E-03 1E-03 Strontium-90 3.24E-07 5.35E-07 5E-07 Caesium-137 3.01E-05 4.97E-05 5E-05 Plutonium-241 1.08E-07 1.78E-07 2E-07 Other isotopes(1) 1.07E-03 1.76E-03 2E-03 35.104 57.922 60 Liquid Effluent Input Tritium Total Note: 1. Other isotopes = Non-tritium isotopes – (C-14+ Fe-55+Co-58+Co-60+Ni-63+Sr-90+Cs-137+Pu-241). UKP-GW-GL-790 334 Revision 4 6.0 Environmental Monitoring UK AP1000 Environment Report Table 6.1-7 COMPARISON OF PROPOSED AIR EMISSION LIMITS WITH SIZEWELL B PWR AP1000 NPP Calculated Annual Limit (TBq/y) AP1000 NPP Proposed Annual Limit (TBq/y) Sizewell B Environment Agency New Limit [Reference 6-3] (TBq/y) 1E-03 1E-03 – 13 13 30 Tritium 3 3 3 Carbon-14 1 1 0.5 Argon-41 2 2 – Cobalt-60 5E-06 – – 7 – – Strontium-90 7E-07 – – Iodine-131 3E-04 3E-04 5.0E-04 Xenon-131m 3 – – Xenon-133 2 – – Caesium-137 2E-06 – – Other particulates 2E-05 – – Total Beta particulates(3) 3E-05 3E-05 1.0E-04 Air Emission Radioiodines(1) Noble Gases (2) Krypton-85 Notes: 1. Radioiodines include I-131 and I-133. 2. Noble gases include Kr-85m, Kr-85, Kr-87, Kr-88, Kr-85, Xe-131m, Xe-133m, Xe-133, Xe-135m, Xe-135, Xe-137, Xe-138. 3. Total beta particulate include Co-60 + Sr-90 + Cs-137 + other particulates. UKP-GW-GL-790 335 Revision 4 6.0 Environmental Monitoring UK AP1000 Environment Report Table 6.1-8 COMPARISON OF PROPOSED LIQUID DISCHARGE LIMITS WITH SIZEWELL B PWR AP1000 NPP Calculated Annual Limit (TBq/y) AP1000 NPP Proposed Annual Limit (TBq/y) Sizewell B Environment Agency New Limit [Reference 6-3] (TBq/y) 60 60 80 Non-tritium 1E-02 – – Carbon-14 7E-03 7E-03 – Iron-55 1E-03 – – Cobalt-58 9E-04 – – Cobalt-60 5E-04 – – Nickel-63 1E-03 – – Strontium-90 5E-07 – – Caesium-137 5E-05 – 0.02 Plutonium-241 2E-07 – – Other isotopes (1) 2E-03 – – 5E-03(2) 5E-03(2) 0.13(3) Air Emission Tritium All isotopes without other limits Notes: 1. Other isotopes = Non-tritium isotopes – (C-14+ Fe-55+Co-58+Co-60+Ni-63+Sr-90+Cs-137+Pu-241). 2. All isotopes without other limits = Non-tritium isotopes – C-14. 3. All isotopes without other limits = Non-tritium isotopes – Cs-137. UKP-GW-GL-790 336 Revision 4 6.0 Environmental Monitoring UK AP1000 Environment Report Table 6.1-9 COMPARISON OF AIR EMISSION LIMITS WITH UK AGR SITES AP1000 NPP Calculated Limits AP1000 NPP Proposed Limits Dungeness B Hartlepool Heysham 1 Heysham 2 Hinkley Point B (TBq/y) (TBq/y) (TBq/y) (TBq/y) (TBq/y) (TBq/y) (TBq/y) 1E-03 1E-03 1.50E-03 1.50E-03 1.50E-03 1.50E-03 1.50E-03 13 13 – – – – – Tritium 3 3 12 10 10 10 12 Carbon-14 1 1 3.7 4.5 4.5 3.7 3.7 Argon-41 2 2 75 150 150 75 100 Cobalt-60 5E-06 – – – – – – 7 – – – – – – Strontium-90 7E-07 – – – – – – Iodine-131 3E-04 3E-04 – – – – – Xenon-131m 3 – – – – – – Xenon-133 2 – – – – – – Caesium-137 2E-06 – – – – – – Other particulates(3) 2E-05 – – – – – – Beta particulates 3E-05 3E-05 – – – – – Air Emission Radioiodines(1) Noble Gases (2) Krypton-85 Notes: 1. Radiodine = I-131 + I-133. 2. Noble Gases = Kr-85m + Kr-85 + Kr-87 + Kr-88 + Xe-131m + Xe-133m + Xe-133 + Xe-135m + Xe-136 + Xe-137 + Xe-138. 3. Other particulate = Total beta particulate - Co-60 - Sr-90 - Cs-137. UKP-GW-GL-790 337 Revision 4 6.0 Environmental Monitoring UK AP1000 Environment Report Table 6.1-10 COMPARISON OF LIQUID DISCHARGE LIMITS WITH UK AGR SITES Air Emission AP1000 AP1000 NPP NPP Calculated Proposed Limits Limits Dungeness Hartlepool B Heysham 1 Heysham 2 Hinkley Point B (TBq/y) (TBq/y) (TBq/y) (TBq/y) (TBq/y) (TBq/y) (TBq/y) Tritium 60 60 650 650 650 650 650 Nontritium(1) 1E-02 – – – – – – Carbon-14 7E-03 – – – – – – Iron-55 1E-03 – – – – – – Cobalt-58 9E-04 – – – – – – Cobalt-60 5E-04 5E-04 0.01 0.01 0.01 0.01 0.01 Nickel-63 1E-03 – – – – – – Strontium-90 5E-07 – – – – – – Caesium-137 5E-05 5E-05 0.1 0.1 0.1 0.1 0.1 Plutonium241 2E-07 – – – – – – Other Particulates(2) 1E-03 1E-03 0.08 0.08 0.08 0.08 0.08 Notes: 1. Non-tritium = All isotopes – tritium. 2. Other particulate = Total beta particulate - Fe-55 - Co-58 - Co-60 – Ni-63 - Sr-90 - Cs-137 - Pu-241. UKP-GW-GL-790 338 Revision 4 6.0 Environmental Monitoring UK AP1000 Environment Report Table 6.2-1 MONITORING PROGRAMMES Monitoring Programme Radiological Monitoring Descriptions Collection of environmental samples (from air, water, sediment, fish and food products, as well as direct radiation levels) to determine the concentrations of radioactive constituents in the samples. Monitoring of annual total dose contributions to the maximum exposed individual from radioactive emissions and other nearby radioactive sources. Monitoring of on-site worker and off-site populations on a regular basis to ensure that exposures to radioactive are within limits. Hydrological Monitoring Periodic monitoring and subsequent sediment removal for maintenance from the cooling water system intake channel to minimise any impact to the raw water system operation. Bathymetric survey of the intake channel is expected after first year of operation to measure sediment build up and also to determine future dredging intervals. Monitoring of surface water and groundwater parameters are expected quarterly for the first year of operation, then annually. Operational monitoring concentrates on parameters are below: Surface water flow Groundwater flow Impact of sanitary and chemical waste retention methods on water quality Sediment transport Floodplain and wetlands Ecological Monitoring Procedures to monitor terrestrial species and habitats that could be adversely affected. Sampling and monitoring procedures on fish and aquatic species, and habitats that could be adversely affected by the intake or discharge of cooling water or other operational impacts. Thermal Monitoring Routine thermal monitoring of waste water discharges (specifically outfall, blow down, and electric power generation discharges). Chemical Monitoring Monitoring of discharges made through outfall for consistency. Monitoring of physical, biological, and chemical attributes. Monitoring of tanks containing oil or hazardous substances during tank filling operations. Monitoring procedures of continuous leak detection systems. Inspections to verify that hazardous waste is treated, stored, and disposed of. Meteorological Monitoring UKP-GW-GL-790 Collection and monitoring of data on-site conditions which includes wind speed and direction, dry-bulb temperature, dew point temperature, and rainfall. 339 Revision 4 Main Plant Vent Description I-131 noble gases iodine particulates tritium Gamma-sensitive thallium-activated, sodium iodide scintillation counter Manual removal of filter cartridges for analysis Manual collection of effluent sample for laboratory analysis Beta-sensitive scintillation detector Beta/gamma-sensitive detector Beta/gamma-sensitive detector Continuous off-line Continuous off-line Grab sample Continuous in-line Continuous in-line Continuous in-line VFS-JE-RE102 N/A N/A VFS-JE-RE103 VFS-JE-RE104A VFS-JE-RE104B Kr-85, Xe-133 Kr-85, Xe-133 Kr-85, Xe-133 I-131 Sr-90, Cs-137 Manual removal of filter cartridges for analysis Continuous off-line N/A Sr-90, Cs-137 Isotopes Beta-sensitive scintillation detectors viewing fixed particulate filters Type Continuous off-line Category VFS-JE-RE101 Detector 3.7E+03 Maximum (Bq/m3) 3.7E+09 3.7E+06 3.7E+03 3.7E+15 3.7E+12 3.7E+08 Accident (mid) range Accident (mid) range Normal operation range n/a Laboratory(1) Normal operation range Accident range 3.7E+04 Accident range Normal operation range Purpose Laboratory(1) 3.7E-01 Laboratory(1) 3.7E-02 Minimum (Bq/m3) Nominal Detection Range UKP-GW-GL-790 340 Revision 4 Note: 1. Samples will be taken to the on-site chemical laboratory for analysis. Laboratory equipment has not been specified at this stage of the design, as it will be determined by the future plant operator. 8 Monitor Point (Fig 6.2-1) Table 6.2-2 UK AP1000 Environment Report AP1000 NPP AERIAL EFFLUENT MONITORS AND DETECTION RANGES – MAIN PLANT VENT 6.0 Environmental Monitoring N/A N/A Gland Seal System TDS-JE-RE001 Detector Condenser Air Removal System Turbine Building Vent Description Grab sample Grab sample Continuous in-line Category Manual collection of effluent sample for laboratory analysis Manual collection of effluent sample for laboratory analysis Beta/gamma-sensitive Geiger-Muller tubes Type noble gases iodine tritium noble gases iodine tritium Kr-85, Xe-133 Isotopes N/A Laboratory(1) Accident Range Purpose N/A 3.7E+15 Maximum (Bq/m3) Laboratory(1) 3.7E+04 Minimum (Bq/m3) Nominal Detection Range UKP-GW-GL-790 341 Revision 4 Note: 1. Samples will be taken to the on-site chemical laboratory for analysis. Laboratory equipment has not been specified at this stage of the design, as it will be determined by the future plant operator. 10 Monitor Point (Fig 6.2-1) Table 6.2-3 UK AP1000 Environment Report AP1000 NPP AERIAL EFFLUENT MONITORS AND DETECTION RANGES – TURBINE BUILDING VENT 6.0 Environmental Monitoring Turbine building service water system W13 N/A SWS-JE-RE008 N/A WLS-JS-RE021 N/A WLS-JS-RE229 Detector Grab sample Continuous off-line Grab sample Continuous off-line Grab sample Continuous in-line Category Manual collection of effluent sample for laboratory analysis Gamma-sensitive thalliumactivated, sodium iodide scintillation counter Manual collection of effluent sample for laboratory analysis Gamma-sensitive thalliumactivated, sodium iodide scintillation counter Manual collection of effluent sample for laboratory analysis Gamma-sensitive thalliumactivated, sodium iodide scintillation counter Type H-3 Cs-137 Cs-137 H-3 Cs-137 Cs-137 H-3 Cs-137 Cs-137 Isotopes 3.7E+08 Maximum (Bq/m3) 3.7E+09 3.7E+09 Laboratory(1) 3.7E+03 Laboratory(1) 3.7E+03 Laboratory(1) 3.7E+04 Minimum (Bq/m3) Nominal Detection Range AP1000 NPP LIQUID EFFLUENT MONITORS AND DETECTION RANGES Table 6.2-4 N/A Normal and accident operation range N/A Normal and accident operation range n/a Normal and accident operation range Purpose UK AP1000 Environment Report UKP-GW-GL-790 342 Revision 4 Note: 1. Samples will be taken to the on-site chemical laboratory for analysis. Laboratory equipment has not been specified at this stage of the design, as it will be determined by the future plant operator. Turbine building waste water plant outfall Holding tanks Radwaste building plant outfall Description W9 W7 Monitor Point (Fig 6.2-2) 6.0 Environmental Monitoring 6.0 Environmental Monitoring UK AP1000 Environment Report 1.20E-03 1.00E-03 TBq/yr 8.00E-04 6.00E-04 4.00E-04 2.00E-04 0.00E+00 12 18 24 30 36 42 48 54 60 66 72 Month Representative Average 12-Month Plant Discharge Proposed Limit TBq/yr Figure 6.1-1. Comparison of Predicted Air Radioiodine Air Emission with Proposed Limits 14.00 13.00 12.00 11.00 10.00 9.00 8.00 7.00 6.00 5.00 4.00 3.00 2.00 1.00 0.00 12 18 24 30 36 42 48 54 60 66 72 Month Rolling Year Total Representative Average 12-Month Plant Discharge Proposed Limit Figure 6.1-2. Comparison of Predicted Noble Gas Air Emissions with Proposed Limits UKP-GW-GL-790 343 Revision 4 6.0 Environmental Monitoring UK AP1000 Environment Report 3.50 3.00 TBq/yr 2.50 2.00 1.50 1.00 0.50 0.00 12 18 24 30 36 42 48 54 60 66 72 Month Rolling Year Total Representative Average 12-Month Plant Discharge Proposed Limit Figure 6.1-3. Comparison of Predicted Tritium Air Emissions with Proposed Limits 1.20 1.00 TBq/yr 0.80 0.60 0.40 0.20 0.00 12 18 24 30 36 42 48 54 60 66 72 Month Rolling Year Total Representative Average 12-Month Plant Discharge Proposed Limit Figure 6.1-4. Comparison of Predicted Carbon-14 Air Emissions with Proposed Limits UKP-GW-GL-790 344 Revision 4 6.0 Environmental Monitoring UK AP1000 Environment Report 2.50 TBq/yr 2.00 1.50 1.00 0.50 0.00 12 18 24 30 36 42 48 54 60 66 72 Month Rolling Year Total Representative Average 12-Month Plant Discharge Proposed Limit Figure 6.1-5. Comparison of Predicted Argon-41 Air Emissions with Proposed Limits 3.50E-04 3.00E-04 TBq/yr 2.50E-04 2.00E-04 1.50E-04 1.00E-04 5.00E-05 0.00E+00 12 18 24 30 36 42 48 54 60 66 72 Month Representative Average 12-Month Plant Discharge Proposed Limit Figure 6.1-6. Comparison of Predicted Iodine-131 Air Emission with Proposed Limits UKP-GW-GL-790 345 Revision 4 6.0 Environmental Monitoring UK AP1000 Environment Report 3.50E-05 3.00E-05 TBq/yr 2.50E-05 2.00E-05 1.50E-05 1.00E-05 5.00E-06 0.00E+00 12 18 24 30 36 42 48 54 60 66 72 Month Representative Average 12-Month Plant Discharge Proposed Limit Figure 6.1-7. Comparison of Predicted Beta Particulate Air Emission with Proposed Limits 70.00 60.00 TBq/yr 50.00 40.00 30.00 20.00 10.00 0.00 12 18 24 30 36 42 48 54 60 66 72 Month Rolling Year Total Representative Average 12-Month Plant Discharge Proposed Limit Figure 6.1-8. Comparison of Predicted Tritium Liquid Discharge with Proposed Limits UKP-GW-GL-790 346 Revision 4 6.0 Environmental Monitoring UK AP1000 Environment Report 8.00E-03 7.00E-03 6.00E-03 TBq/yr 5.00E-03 4.00E-03 3.00E-03 2.00E-03 1.00E-03 0.00E+00 12 18 24 30 36 42 48 54 60 66 72 Month Rolling Year Total Representative Average 12-Month Plant Discharge Proposed Limit Figure 6.1-9. Comparison of Predicted C-14 Liquid Discharge with Proposed Limits 6.00E-03 5.00E-03 TBq/yr 4.00E-03 3.00E-03 2.00E-03 1.00E-03 0.00E+00 12 18 24 30 36 42 48 54 60 66 72 Month Rolling Year Total Representative Average 12-Month Plant Discharge Proposed Limit Figure 6.1-10. Comparison of Predicted Liquid Discharges of All Isotopes without Other Limits UKP-GW-GL-790 347 Revision 4 UKP-GW-GL-790 348 Revision 4 UK AP1000 Environment Report Figure 6.2-1. Schematic Illustrating Aerial Release Vents of the AP1000 NPP and Associated Monitors 6.0 Environmental Monitoring CWS Cooling System W14 W13 W12 W11 Waste Water Retention Basin W10 W9 Turbine Building Sumps W8 Waste Water System W1 W2 W7 W4 Discharge to Sea Seawater Cooling Return Basin W3 W5 Liquid Radwaste Monitor Tanks (6) Liquid Radwaste UKP-GW-GL-790 349 Revision 4 W6 UK AP1000 Environment Report Figure 6.2-2. Schematic Illustrating the Liquid Discharge Monitoring Points of the AP1000 NPP and Associated Monitors W# = Monitoring or Sampling Point Seawater Cooling Supply SWS Cooling System Seawater Cooling System 6.0 Environmental Monitoring 7.0 Selected Considerations for Specific Sites UK AP1000 Environment Report 7.0 SELECTED CONSIDERATIONS FOR SPECIFIC SITES 7.1 Commentary on Sites with Multpile AP1000 NPP Units For the purpose of GDA, it is assumed that the generic site will be occupied by one AP1000 NPP and the information in this Environment Report reflects this single-unit case. Systems related to the gaseous radwaste and liquid radwaste treatment will not be shared at a multi-unit site. A rough estimate of the impact and arrangements of a site with two, three, or more plants on the site could be made by multiplying the characteristic of interest by the number of units being evaluated. Note that the utilities may opt to use common circulating water abstraction and discharge points on a multiple-unit site. Systems related to solid radwaste management, for example for treatment, storage, and transportation, could be shared at the utilities option. This is already the case for several existing PWRs. Better utilization of space could be implemented by dedicating each of the multiple radwaste buildings to treating specific types of waste generated across the site. For example, one radwaste building could include equipment to treat site compactable waste, another to package site metallic waste, etc. Alternatively, a separate building could be constructed for treating site solid radwaste. Also, sharing of facilities would allow for operating experience to be shared across the AP1000 NPPs on a site. Locating multiple plants on the site does not affect the logistics of decommissioning the nuclear island, because each nuclear island on a site will operate independently and can be decommissioned independently. However, if the waste treatment facilities are shared, the decommissioning plan must ensure that the decommissioning waste does not affect units still operating and that the decommissioning waste does not exceed the capacity of the waste facility. Openings and accessways in the nuclear island are not affected by the number of AP1000 NPPs on a site and will not change when a single AP1000 NPP or multiple AP1000 NPPs are built on a site. Once the site is selected, the utility will specify the number of units that will be built and operated on the site and where they will be located. This will define the distance between release points and influence how waste handling and radiation protection will be managed and integrated. The existing GDA submissions and generic site descriptions are relevant to site permitting because they provide the basic inputs to the site analyses. 7.2 Use of Cooling Towers for the Service Water System The generic site is a coastal site (see Section 5.1) which abstracts seawater for once-through cooling of the CWS and SWS (see Section 4.2.3). This is acknowledged as a BAT solution for cooling at coastal nuclear power plants [Refs. 7-1 and 7-2]. However, the European DCD [Ref. 7-3] and PCSR [Ref. 7-4] also retain the option for using cooling towers for the SWS. This arrangement may be used in circumstances where the use of seawater is not practical and there is a suitable supply of fresh water (e.g., river, lake, groundwater or mains supply) for the Raw Water System (RWS). The RWS would be required to provide the makeup flow to the cooling tower basin at a rate sufficient to compensate for losses due to evaporation, drift, and blowdown (typically 48 – 182 m3h-1). Major elements of the SWS cooling tower arrangement include two 100% capacity service water pumps, automatic backwash strainers, a two-cell cooling tower with a divided basin UKP-GW-GL-790 350 Revision 4 7.0 Selected Considerations for Specific Sites UK AP1000 Environment Report and associated piping, valves, controls and instrumentation. The service water system is arranged into two trains of components and piping. Each train includes one service water pump, one strainer, and one cooling tower cell. Each train provides cooling to one CCS component cooling water heat exchanger. To maintain water quality in the SWS cooling towers, a range of chemicals may need to be injected into the SWS from the turbine island chemical feed system (CFS). These chemicals may include a biocide, algaecide, pH adjustor, corrosion inhibitor, scale inhibitor, and silt dispersant. The selection of chemicals and their dose rate is dependent upon the RWS water supply and is a site-specific design. A small blowdown flow is normally discharged from the SWS to the CWS or the WWS to control the level of solids concentration in the SWS inventory. Typically, this blowdown represents 0.2% – 0.75% of the main SWS flow (4700 m3h-1), which represents between 2 and 4 cycles of concentration. Any decision to use cooling towers would be taken at the site-specific design stage when the environmental implications of the design would be assessed. 7.3 References 7-1 “Cooling Water Options for the New Generation of Nuclear Power Stations in the UK,” SC070015/SR3, Environment Agency, June 2010. 7-2 UKP-GW-GL-034, Rev. 1, “Generic Assessment of the Impacts of Cooling Options for the Candidate Nuclear Power Plant AP1000,” Westinghouse Electric Company LLC, February 2010. 7-3 EPS-GW-GL-700, Rev. 1, “AP1000 European Design Control Document,” Westinghouse Electric Company LLC, January 2010. 7-4 UKP-GW-GL-793, Rev. 0, “AP1000 Pre-Construction Safety Report,” Westinghouse Electric Company LLC, 2011. UKP-GW-GL-790 351 Revision 4 Appendix A Waste Arisings UK AP1000 Environment Report APPENDIX A WASTE ARISINGS A1 Identification of Waste Arisings from Solid, Liquid, and Gaseous Radioactive Sources A2 Identification of Waste Arisings from Primary System Components A3 Estimated Radwaste Arising from Large-Volume Components at Decommissioning A4 Estimated Radwaste Arising from Small-Volume Components at Decommissioning A5 Key for Preconditioning and Disposal Methods A6 Steel and Concrete Rubble from Demolishing Various Modules UKP-GW-GL-790 352 Revision 3 CVS Mixed Bed Resin CVS Cation Bed SFS Demineraliser WLS unit 1 charcoal WLS unit 1 resin WLS units 2,3,4 Condensate polisher spent resin CVS RC filter cartridge SFS filter cartridge WLS inlet filter cartridge W LS outlet filter cartridge WSS resin fines filter cartridge WGS delay bed charcoal WGS guard bed charcoal makeup filter DAW DAW CVS CVS SFS WLS WLS WLS CPS CVS SFS WLS WLS WSS WGS WGS CVS WSS WSS UKP-GW-GL-790 Waste Description System(1) Appendix A Waste Arisings R/N R N R R R R R R R R R R R R R R Rad/ Nonrad LLW LLW LLW LLW ILW ILW ILW ILW ILW LLW ILW ILW ILW ILW ILW ILW LLW/ ILW/ HLW/ Mixed(2) Other non-compactable, metallic items, glass, wood Compactable paper, tape, clothing, plastic, elastomers Metallic cylinder Dry granular carbon Dry granular carbon Metallic cylinder Metallic cylinder Metallic cylinder Metallic cylinder Metallic cylinder Spherical bead/resin compound Spherical bead/resin compound Spherical bead/resin compound Wet granular carbon Spherical bead/resin compound Spherical bead/resin compound Spherical bead/resin compound Physical/Chemical Description 353 Solid Solid Solid Solid Solid Solid Solid Solid Solid Solid Solid Solid Solid Solid Solid Solid Solid Waste Form 234 4,750 1.12 5.3 5.3 1.12 1.12 2.24 1.12 1.12 136 135 40 20 50 16.7 33.3 cubic feet 6.63 134.52 0.03 0.15 0.15 0.03 0.03 0.06 0.03 0.03 3.85 3.82 1.13 0.57 1.42 0.47 0.94 cubic metres normal/yr 373 7,260 2.24 10.7 106.7 2.24 2.24 4.48 2.24 2.24 272 270 80 40 100 33.3 66.7 cubic feet 10.56 205.61 0.06 0.3 3.02 0.06 0.06 0.13 0.06 0.06 7.7 7.65 2.27 1.13 2.83 0.94 1.89 cubic metres maximum/yr Estimated Quantity 15,708 315,120 81 383 1,535 81 81 161 81 81 2,448 9,720 2,880 1,440 3,600 1,201 2,399 cubic feet 445 8,924 2 11 43 2 2 5 2 2 69 275 82 41 102 34 68 cubic metres total quantity per life of plant(3) IDENTIFICATION OF WASTE ARISINGS FROM SOLID, LIQUID, AND GASEOUS RADIOACTIVE SOURCES Appendix A1 If N: 9, If R: 8 & 3 3 9 3 or 13 3 or 13 2 or 4 2 or 4 2 or 4 2 or 4 2 or 4 1 1 1 1 1 1 1 PreConditioning(4) Revision 4 If N: C. If R: B B C B or F B or F A A A A A B A A A A A A Disposal Route(4) Disposability UK AP1000 Environment Report Strippable coatings Sludge CVS shim bleed (liquid) Equipment leaks Floor drains (dirty wastes) Sampling system drains Hot shower Hand wash Equip and area decon Chemical waste Laundry (processed offsite) Decon fluids RCDT drains CVS shim bleed (gas) RCS heatup Boron dilution near end-of–life (EOL) WSS SGS WLS WLS WLS WLS WLS WLS WLS WLS WLS WGS WGS CVS CVS UKP-GW-GL-790 WLS DAW Waste Description WSS System(1) Appendix A Waste Arisings R R R R LLW LLW LLW LLW LLW N/A N R LLW LLW LLW LLW LLW LLW LLW LLW LLW LLW Mixed LLW/ ILW/ HLW/ Mixed(2) R R R R R R R R R R R/N Rad/ Nonrad Borated reactor coolant Borated reactor coolant Gases containing hydrogen, nitrogen and fission gasses Gases containing hydrogen, nitrogen and fission gases Liquid/w decon chemicals N/A Spent samples containing analytical chemicals Detergent waste Gray water Gray water Dilute boric acid Dilute boric acid Dilute boric acid Diverted reactor coolant/dilute boric acid Wet granular particles Latex paint peelings Small batteries/corrosive Physical/Chemical Description 354 Liquid Liquid Gas Gas Liquid N/A Liquid Liquid Liquid Liquid Liquid Liquid Liquid Liquid Solid Solid Solid Waste Form 1,663 6 85 6,980 44,880 max gpd normal m3/d normal gpd 22,440 81.6 0.002742 1.05 max cc/min 1.24 N/A 14.28 400 2000 0 1000 5760 14400 776 maximum/gpd 3 10 cubic feet 26 66,520 1,077,120 gal/lop max m3/day 170 50,904 1,170 cft/lop 16,294 N/A 187,639 2,452,800 12,264,000 0 4,560,000 26,626,000 2,835,000 11,020,080 0.004896 0.000063 max m3/hr 0 N/A 0.05 1.51 7.57 0 3.79 21.8 54.5 2.94 gallons/lop maximum m3/d 360 cubic feet 84 0.28 cubic 252 4,077 m3/lop 3.05424 0.0702 m3/lop 62 N/A 710 9,284 46,419 0 17,260 100,780 10,731 41,711 m3/lop 2.38 10 cubic metres total quantity per life of plant2 0.085 maximum/yr 45.7 0 normal m3/hr normal cc/min 0 0 N/A 0.03 0.15 0.76 0 0.76 4.54 0.34 0.62 N/A 7.14 40 200 0 200 1,200 90 1.65 normal m3/d normal/gpd 435 0.028 0.14 cubic metres 1 5 cubic feet normal/yr Estimated Quantity IDENTIFICATION OF WASTE ARISINGS FROM SOLID, LIQUID, AND GASEOUS RADIOACTIVE SOURCES Appendix A1 (cont.) 10 10 6 6 10 N/A 14 5 or 14 14 14 10 10 10 10 15 3 If N: 9, If R: 8 & 3 PreConditioning Revision 4 G G E E G N/A I G or I I I G G G G J B If N: C. If R: B Disposal Route(6) Disposability UK AP1000 Environment Report Strainer backwash Condensate polisher rinse Circulating water system blow down CWS CPS Waste water from oil separator (underflow) WWS N N N N N N N N N N N N N/R Rad/ Nonrad LLW if R LLW/ ILW/ HLW/ Mixed(2) UKP-GW-GL-790 Appendix A1 (cont.) Oily water mostly water Oily water mostly oil Heat sink water body Demin water with minor solids Demin water with minor solids Demin water with minor solids Demin water with minor solids Demin water with minor solids Demin water with minor solids Off specification demin water Off specification demin water Demin water with minor solids Secondary side coolant Physical/Chemical Description Liquid Liquid Liquid Liquid Liquid Liquid Liquid Liquid Liquid Liquid Liquid Liquid Liquid Waste Form 355 0 0 4,719 0.052 9.48 4.2 0 80.04 0.38 58.32 116.65 0.052 18.6 normal gpm cubic feet 0 0 1071.69 0.01 2.15 0.95 0 18.18 0.09 13.24 26.49 0.01 4.22 normal m /hr 3 cubic metres normal/yr 199.7 0.3 14,159 2,050 1,820 3,000 1,102 325 750 180 360 2050 186 max gpm cubic feet 45.35 0.07 3215.52 465.56 413.32 681.3 250.26 73.81 170.33 40.88 81.76 465.56 42.24 3 cubic max m /hr maximum/yr Estimated Quantity 287568 432 148,818,384,000 1,639,872 298,961,280 132,451,200 44,080 4,069,153,152 11,983,680 2,606,639,616 5,213,531,520 1,639,872 586,569,600 gal/lop cubic feet 1088.45 1.64 563,279,273 6,207 1,131,572 501,329 167 15,401,791 45,358 9,866,161 19,733,276 6,207 2,220,173 m3/lop cubic metres Revision 4 D C 13(5) 10 D D D D D D D D D D If N; D. If R; Gradioactive Disposal Route(6) 10 10 10 10 10 10 10 10 10 10 If N; 10. If R; 5 PreConditioning Disposability UK AP1000 Environment Report total quantity per life of plant2 IDENTIFICATION OF WASTE ARISINGS FROM SOLID, LIQUID, AND GASEOUS RADIOACTIVE SOURCES Notes: 1. See Glossary for definition of terms. 2. Hazardous and radioactive wastes mixed together 3. Includes the maximum quantity column once per five years for most entries. 4. See Appendix A5 for key of pre-conditioning and disposal routes. 5. Non-radioactive oil and radioactive oil will be kept separate, i.e. they will not be collected in the same vessel. Waste oil from oil separator (overflow) WWS CWS Strainer backwash Fire testing drains BDS SWS Reverse osmosis and electrodeionisation DTS Condenser water box drain Condensate demin start-up bypass flow BDS CDS Condensate demin rinses and backwashes WWS Turbine island waste water Steam generator blow down BDS Multiple Waste Description System(1) Appendix A Waste Arisings Makeup miniflo hx A & B Letdown hx Letdown hx Reactor coolant drain tank CVS CVS CVS WLS Reactor coolant drain tank Spent fuel pool hx B Residual heat removal hx Residual heat removal hx Component cooling hx A Component cooling hx B Steam gen blow down hx SFS RHR RHR CCS CCS BDS Reactor coolant drain tank Waste hold-up tank A Waste hold-up tank B Waste monitor tank A Waste monitor tank B Waste monitor tank C Waste monitor tank D Waste monitor tank E Waste monitor tank F Effluent hold-up tank A Effluent hold-up tank B WLS WLS WLS WLS WLS WLS WLS WLS WLS WLS WLS UKP-GW-GL-790 hxs (other non-radioactive) various A&B Spent fuel pool hx A hx SFS WLS Makeup miniflo hx A & B CVS hx Regenerative hx Component CVS System Appendix A Waste Arisings Tank Tank Tank Tank Tank Tank Tank Tank Tank Tank Tank Heat Exchanger Heat Exchanger Heat Exchanger Heat Exchanger Heat Exchanger Heat Exchanger Heat Exchanger Heat Exchanger Heat Exchanger Heat Exchanger Heat Exchanger Heat Exchanger Heat Exchanger Heat Exchanger Heat Exchanger Type R R R R R R R R R R R N N N R R R R R R R R R R R Rad/ Nonrad 12172 12171 50355 50355 50355 12265 12365 12363 12167 12166 11104 various 20306 2000 2000 12362 12362 12275 12273 11104 11104 11209 12255 12255 12255 11209 Room/ Location Gasket replace Gasket replace Gasket replace Gasket replace Gasket replace Gasket replace Gasket replace Gasket replace Gasket replace Gasket replace Gasket replace Minimal waste Minimal waste Gasket replace Gasket replace Gasket replace Insulation replace Minimal waste Minimal waste Insulation replace Gasket replace Insulation replace Gasket replace Gasket replace Insulation replace Insulation replace Waste Source 356 Compressible rigid plastic Compressible rigid plastic Compressible rigid plastic Compressible rigid plastic Compressible rigid plastic Compressible rigid plastic Compressible rigid plastic Compressible rigid plastic Compressible rigid plastic Compressible rigid plastic Compressible rigid plastic Neoprene Neoprene Compressible rigid plastic Insulation Insulation Compressible rigid plastic Compressible rigid plastic Compressible rigid plastic Compressible rigid plastic Insulation Insulation Waste Description 3/lop 3/lop 3/lop 3/lop 3/lop 3/lop 3/lop 3/lop 3/lop 3/lop 3/lop 1/10 yrs 1/10 yrs 1/lop 1/lop 1/lop 1/lop 1/lop 1/lop 1/lop 1/lop 1/lop Frequency(1) 0.08 0.08 0.08 0.08 0.08 0.08 0.08 0.08 0.08 0.08 0.08 1.08 1.08 0.03 201.12 14.31 0.04 57.36 0.11 0.13 21.47 58.67 cubic feet each change 0.002 0.002 0.002 0.002 0.002 0.002 0.002 0.002 0.002 0.002 0.002 0.031 0.031 0.001 5.696 0.405 0.001 1.624 0.003 0.004 0.608 1.662 cubic metres each change 0.24 0.24 0.24 0.24 0.24 0.24 0.24 0.24 0.24 0.24 0.24 6.48 6.48 0.03 201.12 14.31 0.04 57.36 0.11 0.13 21.47 58.67 cubic feet plant life Waste Quantity(2) IDENTIFICATION OF WASTE ARISINGS FROM PRIMARY SYSTEM COMPONENTS Appendix A2 0.007 0.007 0.007 0.007 0.007 0.007 0.007 0.007 0.007 0.007 0.007 0.184 0.184 0.001 5.696 0.405 0.001 1.624 0.003 0.004 0.608 1.662 cubic metres plant life LLW LLW LLW LLW LLW LLW LLW LLW LLW LLW LLW LLW LLW LLW LLW LLW LLW LLW LLW LLW Radioactivity Solid Solid Solid Solid Solid Solid Solid Solid Solid Solid Solid Solid Solid Solid Solid Solid Solid Solid Solid Solid Solid Solid Waste Form 3 3 3 3 3 3 3 3 3 3 3 11 9 9 9 3 3 9 9 3 3 3 3 3 3 3 B B B B B B B B B B B C C or B C C B B B B B B B B B B B Disposal Route(3) Revision 4 PreConditioning(3) Disposability UK AP1000 Environment Report Boric acid batching tank Boric acid tank Chemical mixing tank Zinc addition tank Chemical waste tank Component cooling water CVS CVS CVS WLS WLS CCS Valves (potentially Reactor coolant filter A Reactor coolant filter B Makeup filter Waste pre-filter Waste after filter Resin fines filter Spent fuel system filter A Spent fuel system filter B Charcoal deep bed filter Guard bed Delay bed A Delay bed B Moisture separator Mixed bed demineraliser A Mixed bed demineraliser B CVS CVS CVS WLS WLS WLS SFS CCS WLS WGS WGS WGS WGS CVS CVS UKP-GW-GL-790 Valves (non-radioactive) radioactive) All Systems All Systems non-radioactive) Tanks (other Lube oil reservoir LOS various Chemical addition tank CCS surge tank Effluent hold-up tank C Component WLS System Appendix A Waste Arisings Ion exchanger Ion exchanger Small vessel Adsorber Adsorber Adsorber Adsorber Filter Filter Filter Filter Filter Filter Filter Filter Valve (3694) Valve (1461) Tank (160) Tank Tank Tank Tank Tank Tank Tank Tank Tank Type R R R R R R R R R R R R R R R N R N N N N R N N N N R Rad/ Nonrad 11209 11209 12155 12155 12155 12155 12151 12151 12151 12471 12151 12151 12156 11209 11209 various various various 20407 2000 20600 12264 2033 12255 381 40442 12172 Room/ Location Minimal waste Minimal waste Minimal waste Minimal waste Minimal waste Minimal waste Minimal waste Gasket replace Gasket replace Gasket replace Gasket replace Gasket replace Gasket replace Gasket replace Gasket replace Packing replace Packing replace Oil replace Minimal waste Minimal waste Gasket replace Minimal waste Minimal waste Minimal waste Minimal waste Gasket replace Waste Source 357 Compressible rigid plastic Compressible rigid plastic Compressible rigid plastic Compressible rigid plastic Compressible rigid plastic Compressible rigid plastic Compressible rigid plastic Compressible rigid plastic Compressible rigid plastic Compressible rigid plastic Depleted oil Compressible rigid plastic Compressible rigid plastic Waste Description once/yr once/yr once/yr once/yr once/yr once/yr once/yr once/yr once/5yrs once/5yrs once/25 yrs(4) once/18 mo 3/lop Frequency(1) 0.03 0.03 0.03 0.03 0.03 0.03 0.03 0.03 40.3 15.94 2807 0.02 0.08 cubic feet each change 0.001 0.001 0.001 0.001 0.001 0.001 0.001 0.001 1.141 0.451 79.496 0.001 0.002 cubic metres each change 1.8 1.8 1.8 1.8 1.8 1.8 1.8 1.8 483.6 191.28 5614 0.8 0.24 cubic feet plant life Waste Quantity(2) IDENTIFICATION OF WASTE ARISINGS FROM PRIMARY SYSTEM COMPONENTS Appendix A2 (cont.) 0.051 0.051 0.051 0.051 0.051 0.051 0.051 0.051 13.696 5.417 158.992 0.023 0.007 cubic metres plant life LLW LLW LLW LLW LLW LLW LLW LLW LLW LLW LLW LLW Radioactivity Solid Solid Solid Solid Solid Solid Solid Solid Solid Solid Liquid Solid Solid Waste Form 9 9 9 9 9 9 9 3 3 3 3 3 3 3 3 9 3 9 13(5) 9 9 3 9 9 9 9 3 B B B B B B B B B B B B B B B C B C C C C B C C C C B Disposal Route(3) Revision 4 PreConditioning(3) Disposability UK AP1000 Environment Report Waste ion exchanger B Waste ion exchanger C Spent fuel sys demin A Spent fuel sys demin B Makeup pump A Makeup pump/motor A Makeup pump B Makeup pump/motor B Zinc injection pump Residual heat removal pump CVS CVS SFS SFS CVS CVS CVS CVS WLS RNS Residual heat removal pump CCW pump B Spent fuel cooling pump A Spent fuel cooling CCS SFS SFS Effluent hold-up pump A B Degasifier discharge pump UKP-GW-GL-790 WLS WLS Degasifier discharge pump WLS A Degasifier separator pump B A Degasifier separator pump WLS WLS Spent fuel cooling SFS pump/motor B Spent fuel cooling pump B SFS pump/motor A CCW pump A B CCS RNS Waste ion exchanger A CVS A Cation bed demineraliser Component CVS System Appendix A Waste Arisings Pump Pump Pump Pump Pump Pump Pump Pump Pump Pump Pump Pump Pump Pump Pump Pump Pump Pump Ion exchanger Ion exchanger Ion exchanger Ion exchanger Ion exchanger Ion exchanger Type R R R R R R R R R R R R R N R R R R R R R R R R Rad/ Nonrad 12271 12158 12158 12156 12156 12274 12274 12272 12272 20300 20300 12163 12162 2033 12255 12255 12255 12255 12151 12151 11209 11209 11209 11209 Room/ Location diaphragms Replace diaphragms Replace diaphragms Replace Replace pump Replace pump Oil replace Mech seal 2/pmp Oil replace Mech seal 2/pmp Mech seal 2/pmp Mech seal 2/pmp Mech seal 2/pmp Mech seal 2/pmp Minimal waste Oil replace Mech seals 2/pmp Oil replace Mech seals 2/pmp Minimal waste Minimal waste Minimal waste Minimal waste Minimal waste Minimal waste Waste Source 358 Buna n Buna n Buna n Canned Pump Canned Pump Waste Oil Carbon/SiC Waste Oil Carbon/SiC Carbon/SiC Carbon/SiC Carbon/SiC Carbon/SiC Waste oil Carbon/SiC Waste Oil Carbon/SiC Waste Description once/5yrs once/5yrs once/5yrs once/lop once/lop once/5yrs once/5yrs once/5yrs once/5yrs once/5yrs once/5yrs once/5yrs once/5yrs once/5yrs once/10 yr once/5yrs once/10 yr Frequency(1) 0.1 0.1 0.1 1 1 1.34 0.1 1.34 0.1 0.1 0.1 0.1 0.1 1.34 0.1 1.34 0.1 cubic feet each change 0.003 0.003 0.003 0.028 0.028 0.038 0.003 0.038 0.003 0.003 0.003 0.003 0.003 0.038 0.003 0.038 0.003 cubic metres each change 1.2 1.2 1.2 1 1 16.08 2.4 16.08 2.4 2.4 2.4 2.4 2.4 16.08 1.2 16.08 1.2 cubic feet plant life Waste Quantity(2) IDENTIFICATION OF WASTE ARISINGS FROM PRIMARY SYSTEM COMPONENTS Appendix A2 (cont.) 0.034 0.034 0.034 0.028 0.028 0.455 0.068 0.455 0.068 0.068 0.068 0.068 0.068 0.455 0.034 0.455 0.034 cubic metres plant life LLW LLW LLW LLW LLW LLW LLW LLW LLW LLW LLW LLW LLW LLW LLW LLW LLW Radioactivity Plastic Plastic Plastic Solid Solid Liquid Solid Liquid Solid Solid Solid Solid Solid Liquid Solid Liquid Solid Waste Form 3 3 3 9 Revision 4 B B B C or B C or B F 7(5) 9 B F 7(5) 3 B B B B B 3 3 3 3 3 C F 7(5) 9 B F 7(5) 3 B B B B B B B Disposal Route(3) 3 9 9 9 9 9 9 PreConditioning(3) Disposability UK AP1000 Environment Report Effluent hold-up pump C Waste hold-up pump A Waste hold-up pump B Monitor pump A Monitor pump B Monitor pump C Monitor pump D Monitor pump E Monitor pump F Chemical waste pump RCDT pump A RCDT pump B Degasifier vacuum pump A Degasifier vacuum pump B Resin transfer pump Containment sump pump A Containment sump pump B Main Feedwater Pump A Main Feedwater Pump B Main Feedwater Pump A Main Feedwater Pump B WLS WLS WLS WLS WLS WLS WLS WLS WLS WLS WLS WLS WLS WLS WSS WLS WLS FWS FWS FWS FWS UKP-GW-GL-790 Effluent hold-up pump B Component WLS System Appendix A Waste Arisings Pump Pump Pump Pump Pump Pump Pump Pump Pump Pump Pump Pump Pump Pump Pump Pump Pump Pump Pump Pump Pump Pump Type N N N N R R R R R R R R R R R R R R R R R R Rad/ Nonrad 20300 20300 20300 20300 11104 11104 12372 12156 12156 11104 11104 12264 50355 50355 50355 12265 12365 12363 12268 12268 12268 12268 Room/ Location Replace oil/100 gal Replace oil/100 Mech seal 4/pmp Mech seal 4/pmp Mech seal 1/pmp Mech seal 1/pmp Replace pump Mech seal 2/pmp Mech seal 2/pmp Mech seal 1/pmp Mech seal 1/pmp diaphragms Replace diaphragms Replace diaphragms Replace diaphragms Replace diaphragms Replace diaphragms Replace diaphragms Replace diaphragms Replace diaphragms Replace diaphragms Replace diaphragms Replace Waste Source 359 Lube Oil Lube Oil carbon/SiC Carbon/SiC Carbon/SiC Carbon/SiC Screw Pump Carbon/SiC Carbon/SiC Carbon/SiC Carbon/SiC Buna n Buna n Buna n Buna n Buna n Buna n Buna n Buna n Buna n Buna n Buna n Waste Description once/5yrs once/5yrs once/5yrs once/5yrs 2/lop 2/lop once/10 yr 3/lop 3/lop 3/lop 3/lop once/5yrs once/5yrs once/5yrs once/5yrs once/5yrs once/5yrs once/5yrs once/5yrs once/5yrs once/5yrs once/5yrs Frequency(1) 13.37 13.37 1 1 0.1 0.1 0.1 0.1 0.1 0.3 0.3 0.1 0.1 0.1 0.1 0.1 0.1 0.1 0.1 0.1 0.1 0.1 cubic feet each change 0.379 0.379 0.028 0.028 0.003 0.003 0.003 0.003 0.003 0.008 0.008 0.003 0.003 0.003 0.003 0.003 0.003 0.003 0.003 0.003 0.003 0.003 cubic metres each change 160.44 160.44 12 12 0.2 0.2 0.6 0.6 0.6 0.9 0.9 1.2 1.2 1.2 1.2 1.2 1.2 1.2 1.2 1.2 1.2 1.2 cubic feet plant life Waste Quantity(2) IDENTIFICATION OF WASTE ARISINGS FROM PRIMARY SYSTEM COMPONENTS Appendix A2 (cont.) 4.544 4.544 0.34 0.34 0.006 0.006 0.017 0.017 0.017 0.025 0.025 0.034 0.034 0.034 0.034 0.034 0.034 0.034 0.034 0.034 0.034 0.034 cubic metres plant life LLW LLW LLW LLW LLW LLW LLW LLW LLW LLW LLW LLW LLW LLW LLW LLW LLW LLW Radioactivity Liquid Liquid Solid Solid Solid Solid Solid Solid Solid Solid Solid Plastic Plastic Plastic Plastic Plastic Plastic Plastic Plastic Plastic Plastic Plastic Waste Form Revision 4 C C 13(5) 13(5) B B B B C or B B B B B B B B B B B B B B B B Disposal Route(3) 3 3 3 3 9 3 3 3 3 3 3 3 3 3 3 3 3 3 3 3 PreConditioning(3) Disposability UK AP1000 Environment Report Compressor and vac pumps Shop and maint equipment NNS1 125V 60 Cell 8 Hour various various EDS1 2B Div C 125V 72 HR Battery 2A Div C 125V 72 HR Battery 1B Div C 125V 24 HR Battery 1A Div C 125V 24 HR Battery 2B Div B 125V 72 HR Battery 2A Div B 125V 72 HR Battery 1B Div B 125V 24 HR Battery 1A Div B 125V 24 HR Battery 1B Div A 125V 24 HR Battery 1A Div A 125V 24 HR Battery Bat 2 NNS2 125V 60 Cell 8 Hour Bat 2 NNS1 125V 60 Cell 8 Hour Bat 1 NNS2 125V 60 Cell 8 Hour UKP-GW-GL-790 IDSC IDSC IDSC IDSC IDSB IDSB IDSB IDSB IDSA IDSA EDS4 EDS3 EDS2 Other non-rad pumps various Bat 1 Component System Appendix A Waste Arisings Battery(6) Battery(6) Battery(6) Battery(6) Battery(6) Battery(6) Battery(6) Battery(6) Battery(6) Battery(6) Battery(6) Battery(6) N N N N N N N N N N N N N N Battery(6) Battery(6) N N N Tools Pump (18) Pump (34) Type Rad/ Nonrad 12202 12202 12102 12102 12204 12204 12104 12104 12101 12101 40309 40307 40309 40307 40358 various various Room/ Location Replace battery Replace battery Replace battery Replace battery Replace battery Replace battery Replace battery Replace battery Replace battery Replace battery Replace battery Replace battery Replace battery Replace battery Replace tools Replace parts Replace parts gal Waste Source 360 Lead/Acid/ Plastic Lead/Acid/ Plastic Lead/Acid/ Plastic Lead/Acid/ Plastic Lead/Acid/ Plastic Lead/Acid/ Plastic Lead/Acid/ Plastic Lead/Acid/ Plastic Lead/Acid/ Plastic Lead/Acid/ Plastic Lead/Acid/ Plastic Lead/Acid/ Plastic Lead/Acid/ Plastic Lead/Acid/ Plastic Metal/ Plastic Metal/ Plastic Waste Description once/20yrs(7) once/20yrs(7) once/20yrs(7) once/20yrs(7) once/20yrs(7) once/20yrs(7) once/20yrs(7) once/20yrs(7) once/20yrs(7) once/20yrs(7) once/20yrs(7) once/20yrs(7) once/20yrs(7) once/20yrs(7) Frequency(1) 39,000 39,000 39,000 39,000 39,000 39,000 39,000 39,000 39,000 39,000 39,000 39,000 39,000 39,000 mass in pounds each change cubic feet each change 18 18 18 18 18 18 18 18 18 18 18 18 18 18 mass in tonne each change cubic metres each change 78,000 78,000 78,000 78,000 78,000 78,000 78,000 78,000 78,000 78,000 78,000 78,000 78,000 78,000 mass in pounds plant life cubic feet plant life Waste Quantity(2) IDENTIFICATION OF WASTE ARISINGS FROM PRIMARY SYSTEM COMPONENTS Appendix A2 (cont.) 35 35 35 35 35 35 35 35 35 35 35 35 35 35 mass in tonne plant life cubic metres plant life Radioactivity Liquid Solid/ Liquid Solid/ Liquid Solid/ Liquid Solid/ Liquid Solid/ Liquid Solid/ Liquid Solid/ Liquid Solid/ Liquid Solid/ Liquid Solid/ Liquid Solid/ Liquid Solid/ Liquid Solid/ Liquid Solid/ Waste Form 9 9 9 9 9 9 9 9 9 9 9 9 9 9 9 9 9 C C C C C C C C C C C C C C C C C Disposal Route(3) Revision 4 PreConditioning(3) Disposability UK AP1000 Environment Report Active SPS Exhaust Supplemental Air Filtration VAS VBS UKP-GW-GL-790 Filters Unit A High Efficiency Active SPS Exhaust Cooler B RNS Pump Room Unit Cooler A RNS Pump Room Unit Cooler B CVS Pump Room Unit Cooler A CVS Pump Room Unit AHU B Fuel Handling Area Supply AHU A Fuel Handling Area Supply Supply AHU B Auxiliary/Annex Building Supply AHU A Auxiliary/Annex Building B Spare 125V 60 Cell Battery A Spare 125V 60 Cell Battery 1B Div D 125V 24 HR Battery VAS VAS VAS VAS VAS VAS VAS VAS VAS IDSS IDSS IDSD Div D 125V 24 HR Battery IDSD 1A Component System Appendix A Waste Arisings Battery(6) HVAC filter HVAC Filter HVAC Filter HVAC filter HVAC filter HVAC filter HVAC filter HVAC filter HVAC filter HVAC filter HVAC filter Battery(6) Battery(6) N R R N N N N N N N N N N N N Type Battery(6) Rad/ Nonrad 12501 Bldg Roof of Aux Bldg Roof of Aux 12163 12162 12255 12255 40503 40503 40601 40601 12103 12103 12105 12105 Room/ Location filter Replace filters 4 Replace 12 Filters Replace 12 Filters filter Replace filters 2 filter Replace filters 2 filter Replace filters 2 filter Replace filters 2 high efficiency pre-filters and 3 Replace filter 3 high efficiency pre-filters and 3 Replace filter 3 high efficiency pre-filters and 6 Replace filters 6 high efficiency pre-filters and 12 Replace filters 12 Replace battery Replace battery Replace battery Replace battery Waste Source 361 Fibreglass/ Metal Fiberglass / Metal Fiberglass / Metal Fibreglass/ Metal Fibreglass/ Metal Fibreglass/ Metal Fibreglass/ Metal Fibreglass/ Metal Fibreglass/ Metal Fibreglass/ Metal Fibreglass/ Metal Lead/Acid/ Plastic Lead/Acid/ Plastic Lead/Acid/ Plastic Lead/Acid/ Plastic Waste Description once/5yrs 3/ year Once / 2yrs 2/ year 2/ year 2/ year 2/ year 2/ year 2/ year 2/ year 2/ year once/20yrs(7) once/20yrs(7) once/20yrs(7) once/20yrs(7) Frequency(1) 16 48 48 8 8 8 8 24 24 48 96 cubic feet each change 39,000 39,000 39,000 39,000 cubic feet each change 0.45 1.36 1.36 0.23 0.23 0.23 0.23 0.68 0.68 1.36 2.72 cubic metres each change 18 18 18 18 cubic metres each change 192 8640 1440 960 960 960 960 2880 2880 5760 11520 cubic feet life of plant 78,000 78,000 78,000 78,000 cubic feet plant life Waste Quantity(2) IDENTIFICATION OF WASTE ARISINGS FROM PRIMARY SYSTEM COMPONENTS Appendix A2 (cont.) 5.44 244.68 40.08 27.19 27.19 27.19 27.19 81.56 81.56 163.13 326.25 cubic metres life of plant 35 35 35 35 cubic metres plant life LLW LLW Radioactivity Solid Solid Solid Solid Solid Solid Solid Solid Solid Solid Solid Liquid Solid/ Liquid Solid/ Liquid Solid/ Liquid Solid/ Waste Form 9 3 3 9 9 9 9 9 9 9 9 9 9 9 9 C B B C C C C C C C C C C C C Disposal Route(3) Revision 4 PreConditioning(3) Disposability UK AP1000 Environment Report A/C 1E Elect Room Supply VBS B/D 1E Elect Room Supply Efficiency Filter A Containment Supply High Low Efficiency Filter B Containment Supply AHU Low Efficiency Filter A Containment Supply AHU AHU D B/D 1E Elect Room Supply AHU C A/C 1E Elect Room Supply AHU B UKP-GW-GL-790 VFS VFS VFS VBS VBS VBS MCR/TSC Supply AHU B VBS AHU A MCR/TSC Supply AHU A Unit B Charcoal Filters Supplemental Air Filtration Unit A Charcoal Filter Supplemental Air Filtration Unit B HEPA Filters Supplemental Air Filtration Unit A HEPA Filters Supplemental Air Filtration Filters VBS VBS VBS VBS VBS Supplemental Air Filtration VBS Unit B High Efficiency Component System Appendix A Waste Arisings HVAC filter HVAC filter HVAC filter HVAC filter HVAC filter HVAC filter HVAC filter HVAC filter HVAC filter HVAC filter HVAC filter HVAC filter HVAC filter HVAC filter Type N N N N N N N N N N N N N N Rad/ Nonrad 40503 40503 40503 12405 12501 12505 12501 40500 12501 12501 12501 12501 12501 12501 Room/ Location 2 high efficiency 2 pre-filters and Replace filter 2 high efficiency 2 pre-filters and Replace filter 2 high efficiency 2 pre-filters and Replace filter 6 high efficiency 6 pre-filters and Replace filter 12 high efficiency 12 pre-filters and Replace filters 6 high efficiency 6 pre-filters and Replace filter 12 high efficiency 12 pre-filters and Replace filters 12 high efficiency 12 pre-filters and Replace filters 12 high efficiency 12 pre-filters and Replace filters Replace charcoal Replace charcoal 2 filter Replace filters filter Replace filters 2 filter Replace filters 4 Waste Source 362 Uncompacted fibreglass/metal Uncompacted fibreglass/metal Uncompacted fibreglass/metal Uncompacted fibreglass/metal Uncompacted fibreglass/metal Uncompacted fibreglass/metal Uncompacted fibreglass/metal Uncompacted fibreglass/metal Uncompacted fibreglass/metal Granulated charcoal Granulated charcoal Fibreglass/Metal Fiberglas/ Metal Fibreglass/ Metal Waste Description 2/year 2/year 2/year 2/year 2/year 2/year 2/year 2/year 2/year once/10 yrs once/10 yrs once/5 yrs once/5yrs once/5yrs Frequency(1) 16 16 16 48 96 48 96 96 96 85.7 85.7 8 8 16 cubic feet each change 0.45 0.45 0.45 1.36 2.72 1.36 2.72 2.72 2.72 2.43 2.43 0.23 0.23 0.45 cubic metres each change 1920 1920 1920 5760 11520 5760 11520 11520 11520 514.2 514.2 96 96 192 cubic feet plant life Waste Quantity(2) IDENTIFICATION OF WASTE ARISINGS FROM PRIMARY SYSTEM COMPONENTS Appendix A2 (cont.) 54.38 54.38 54.38 163.13 326.25 163.13 326.25 326.25 326.25 14.56 14.56 2.72 2.72 5.44 cubic metres plant life Radioactivity Solid Solid Solid Solid Solid Solid Solid Solid Solid Solid Solid Solid Solid Solid Waste Form 9 9 9 9 9 9 9 9 9 9 9 9 9 9 C C C C C C C C C C C C C C Disposal Route(3) Revision 4 PreConditioning(3) Disposability UK AP1000 Environment Report Cont exh downstream High VFS Radwaste Bldg Supply AHU A Radwaste Bldg Supply Filter Machine Tool Exhaust Fan Machine Shop AHU B Health Physics & Hot Machine Shop AHU A Health Physics & Hot Efficiency Filter B Cont exh downstream High UKP-GW-GL-790 VRS VRS VHS VHS VHS VFS Cont exh charcoal filter B VFS Efficiency Filter A Cont exh charcoal filter A Filter B Containment exh HEPA Filter A Containment exh HEPA High Efficiency Filter B Containment Exh Upstream High Efficiency Filter A Containment Exh Upstream Efficiency Filter B Containment Supply High Component VFS VFS VFS VFS VFS VFS System Appendix A Waste Arisings HVAC filter HVAC filter HVAC filter HVAC filter HVAC filter HVAC filter HVAC filter HVAC filter HVAC filter HVAC filter HVAC filter HVAC filter HVAC filter HVAC filter Type N N R N N R R R R R R R R N Rad/ Nonrad 50300 50300 40503 40503 40503 40552 40551 40552 40551 40552 40551 40552 40551 40503 Room/ Location 6 pre-filters and Replace filter 6 high efficiency 6 pre-filters and Replace filter Replace Filter 8 high efficiency 8 pre-filters and Replace filter 8 high efficiency 8 pre-filters and Replace filter 4 filters Replace filter 4 filters Replace filter Replace charcoal Replace charcoal 4 filters Replace filter 4 filters Replace filter 4 filters Replace filter 4 filters Replace filter 2 high efficiency 2 pre-filters and Replace filter Waste Source 363 Uncompacted fibreglass/metal Uncompacted fibreglass/metal Uncompacted fibreglass/metal Uncompacted fibreglass/metal Uncompacted fibreglass/metal Uncompacted fibreglass/metal Uncompacted fibreglass/metal Granulated charcoal Granulated charcoal Uncompacted fibreglass/metal Uncompacted fibreglass/metal Uncompacted fibreglass/metal Uncompacted fibreglass/metal Uncompacted fibreglass/metal Waste Description 2/year 2/year 2/year 2/year 2/year once/3 yrs once/3 yrs once/10 yrs once/10 yrs once/5 yrs once/5 yrs once/3 yrs once/3 yrs 2/year Frequency(1) 48 48 8 64 64 16 16 85.7 85.7 16 16 16 16 16 cubic feet each change 1.36 1.36 0.23 1.81 1.81 0.45 0.45 2.43 2.43 0.45 0.45 0.45 0.45 0.45 cubic metres each change 5760 5760 960 7680 7680 320 320 514.2 514.2 192 192 320 320 1920 cubic feet plant life Waste Quantity(2) IDENTIFICATION OF WASTE ARISINGS FROM PRIMARY SYSTEM COMPONENTS Appendix A2 (cont.) 163.13 163.13 27.19 217.5 217.5 9.06 9.06 14.56 14.56 5.44 5.44 9.06 9.06 54.38 cubic metres plant life LLW (.05 mSv/hr) than 5 mr/hr LLW less (.05 mSv/hr) than 5 mr/hr LLW less (.05 mSv/hr) than 5 mr/hr LLW less (.05 mSv/hr) than 5 mr/hr LLW less (.05 mSv/hr) than 5 mr/hr LLW less (.05 mSv/hr) than 5 mr/hr LLW less (.05 mSv/hr) than 5 mr/hr LLW less (.05 mSv/hr) than 5 mr/hr LLW less Radioactivity Solid Solid Solid Solid Solid Solid Solid Solid Solid Solid Solid Solid Solid Solid Waste Form 9 9 3 9 9 3 3 3 3 3 3 3 3 9 C C B C C B B B B B B B B C Disposal Route(3) Revision 4 PreConditioning(3) Disposability UK AP1000 Environment Report Turbine Bldg Personnel VTS AHU-D MSIV Compartment A AHU-C MSIV Compartment B AHU-B MSIV Compartment B AHU-A MSIV Compartment A Room AHU B Annex Bldg Equipment Room AHU A Annex Bldg Equipment AHU B Annex Bldg General Area AHU A Annex Bldg General Area Room AHU B Turbine Bldg Electrical Eqp Room AHU A Turbine Bldg Electrical Eqp Area AHU B Turbine Bldg Personnel UKP-GW-GL-790 VXS VXS VXS VXS VXS VXS VXS VXS VTS VTS VTS Radwaste Blgd Exhaust VRS Area AHU A Radwaste Blgd Exhaust AHU B Component VRS System Appendix A Waste Arisings HVAC filter HVAC filter HVAC filter HVAC filter HVAC filter HVAC filter HVAC filter HVAC filter HVAC filter HVAC filter HVAC filter HVAC filter HVAC pre1filter HVAC filter Type N N N N N N N N N N N N R R Rad/ Nonrad 12506 12504 12504 12506 40500 40500 40499 40499 20510 20510 20510 20510 50353 50353 Room/ Location 2 filters Replace filter 2 filters Replace filter 2 filters Replace filter 2 filters Replace filter 5 high efficiency 5 pre-filters and Replace filter 5 high efficiency 5 pre-filters and Replace filter 4 high efficiency 4 pre-filters and Replace filter 4 high efficiency 4 pre-filters and Replace filter 6 high efficiency 6 pre-filters and Replace filter 6 high efficiency 6 pre-filters and Replace filter 4 high efficiency 4 pre-filters and Replace filter 4 high efficiency 4 pre-filters and Replace filter 18 pre-filters Replace filter HEPA Repllace 18 6 high efficiency Waste Source 364 Uncompacted fibreglass/metal Uncompacted fibreglass/metal Uncompacted fibreglass/metal Uncompacted fibreglass/metal Uncompacted fibreglass/metal Uncompacted fibreglass/metal Uncompacted fibreglass/metal Uncompacted fibreglass/metal Uncompacted fibreglass/metal Uncompacted fibreglass/metal Uncompacted fibreglass/metal Uncompacted fibreglass/metal Uncompacted fibreglass/metal Uncompacted fibreglass/metal Waste Description 2/year 2/year 2/year 2/year 2/year 2/year 2/year 2/year 2/year 2/year 2/year 2/year 3/ year Once / 2yrs Frequency(1) 8 8 8 8 40 40 32 32 48 48 32 32 72 72 cubic feet each change 0.23 0.23 0.23 0.23 1.13 1.13 0.91 0.91 1.36 1.36 0.91 0.91 2.04 2.04 cubic metres each change 960 960 960 960 4800 4800 3840 3840 5760 5760 3840 3840 12960 12960 cubic feet plant life Waste Quantity(2) IDENTIFICATION OF WASTE ARISINGS FROM PRIMARY SYSTEM COMPONENTS Appendix A2 (cont.) 27.19 27.19 27.19 27.19 135.94 135.94 108.75 108.75 163.13 163.13 108.75 108.75 367.03 61.17 cubic metres plant life LLW LLW Radioactivity Solid Solid Solid Solid Solid Solid Solid Solid Solid Solid Solid Solid Solid Solid Waste Form 9 9 9 9 9 9 9 9 9 9 9 9 3 3 C C C C C C C C C C C C B B Disposal Route(3) Revision 4 PreConditioning(3) Disposability UK AP1000 Environment Report Switchgear Room AHU B Mechanical Equipment Area VXS VXS Mechanical Equipment Area FHS underwater camera sys FHS UKP-GW-GL-790 Underwater cameras FHS filtration system Refuelling pool under water Hatches various FHS Fire doors Engine Room AHU B VZS various Engine Room AHU A VZS Doors Service Module AHU B VZS various Service Module AHU A Room AHU B Valve/Piping Penetration Room AHU A Valve/Piping Penetration AHU B VZS VXS VXS VXS Switchgear Room AHU A VXS AHU A Component System Appendix A Waste Arisings Camera Camera (4) Filter Hatches (33) Doors (157) Doors (266) HVAC filter HVAC filter HVAC filter HVAC filter HVAC filter HVAC filter HVAC filter HVAC filter HVAC filter HVAC filter Type R R R N N N N N N N N N N N N N Rad/ Nonrad 1100 1100 1100 various various various 60310 60310 60310 60310 12306 12306 40503 40503 40500 40500 Room/ Location Minimal waste Minimal waste Replace cartridge Replace gaskets Replace gaskets Replace gaskets 3 high efficiency 3 pre-filters and Replace filter 3 high efficiency 3 pre-filters and Replace filter 2 high efficiency 2 pre-filters and Replace filter 2 high efficiency 2 pre-filters and Replace filter 1 filter Replace filter 1 filter Replace filter 2 high efficiency 2 pre-filters and Replace filter 2 high efficiency 2 pre-filters and Replace filter 5 high efficiency 5 pre-filters and Replace filter 5 high efficiency 5 pre-filters and Replace filter Waste Source 365 Pleated polyester Fibreglass cloth Fibreglass cloth Fibreglass cloth Uncompacted fibreglass/metal Uncompacted fibreglass/metal Uncompacted fibreglass/metal Uncompacted fibreglass/metal Uncompacted fibreglass/metal Uncompacted fibreglass/metal Uncompacted fibreglass/metal Uncompacted fibreglass/metal Uncompacted fibreglass/metal Uncompacted fibreglass/metal Waste Description once/yr once/lop once/lop once/lop 2/year 2/year 2/year 2/year 2/year 2/year 2/year 2/year 2/year 2/year Frequency(1) 2.95 5.51 13.08 22.17 24 24 16 16 4 4 16 16 40 40 cubic feet each change 0.08 0.16 0.37 0.63 0.68 0.68 0.45 0.45 0.11 0.11 0.45 0.45 1.13 1.13 cubic metres each change 177 5.51 13.08 22.17 2880 2880 1920 1920 480 480 1920 1920 4800 4800 cubic feet plant life Waste Quantity(2) IDENTIFICATION OF WASTE ARISINGS FROM PRIMARY SYSTEM COMPONENTS Appendix A2 (cont.) 5.01 0.16 0.37 0.63 81.56 81.56 54.38 54.38 13.59 13.59 54.38 54.38 135.94 135.94 cubic metres plant life LLW LLW LLW Radioactivity Solid Solid Solid Solid Solid Solid Solid Solid Solid Solid Solid Solid Solid Solid Solid Solid Waste Form 9 9 9 9 9 9 9 9 9 9 9 9 9 9 9 9 C or B C or B B C C C C C C C C C C C C C Disposal Route(3) Revision 4 PreConditioning(3) Disposability UK AP1000 Environment Report Resin slurry inlet camera Resin slurry recirc camera Resin slurry conditions WSS WSS WSS Control rod cluster Gray rod cluster Fuel assembly Wire and cable ac Wire and cable dc Power transformers Pressuriser heaters Boric acid tank immersion RXS RXS RXS all sys all sys various RCS CVS Boric acid batching tank immersion heater UKP-GW-GL-790 CVS Instrumentation elements all sys heater Fans blowers and drives glove box Hot machine shop decon system portable Hot machine shop decon all sys 4033 4033 Portable underwater light FHS monitor Fixed underwater light Component FHS System Appendix A Waste Arisings Heater Heater (2) Heater (31) Transformers (50) dc circuits (328) ac circuits (2498) RX control (157) RX control (16) RX control (53) Instruments (3337) Fans (122) Skid Skid Camera Camera Camera Light Light Type N N R R/N R/N R/N R R R R/N R/N R R R R R R R Rad/ Nonrad 40442 381 11403 none none none various 40358 40358 12253 12372 12471 1100 1100 Room/ Location Burn-up Replace elements Minimal waste Minimal waste Minimal waste Minimal waste Minimal waste Waste Source 366 Spent fuel rods Waste Description 40%/18 mos once/20 yrs once/20 yrs Frequency(1) 485 60 198.75 cubic feet each change 13.74 1.7 5.63 cubic metres each change 19400 180 596.25 cubic feet plant life Waste Quantity(2) IDENTIFICATION OF WASTE ARISINGS FROM PRIMARY SYSTEM COMPONENTS Appendix A2 (cont.) 549.42 5.1 16.9 cubic metres plant life HLW ILW ILW LLW LLW LLW LLW LLW LLW LLW LLW Radioactivity Solid Solid Solid Solid Solid Solid Solid Solid Solid Solid Solid Waste Form 9 9 Revision 4 C C C or B If R; B If R; 3 9 If N; C. If R; B If R; 3 If N; 9. If N; C. If R; B If R; 3 If N; 9. If N; C. H H If N; 9. 12 12 H If R; B If R; 11 12 If N; C. If R; B If R; 11 If N; 9. If N; C. C or B C or B C or B C or B C or B C or B C or B Disposal Route(3) If N; 9. 9 9 9 9 9 9 9 PreConditioning(3) Disposability UK AP1000 Environment Report Electrodeionisation filters BDS Reverse osmosis units 1&2 Ion-migration Filter (2) Ion-migration Filter (2) Ion migration Ion migration Filter (4) Heater (2) Type N N N N R R N R Rad/ Nonrad 20300 20300 20300 20300 2000 2000 2000 40601 Room/ Location Replace modules Replace cartridge Replace stack Replace cartridge Replace stack Replace stack Replace cartridge Waste Source Resin/membrane module Resin/membrane module Resin/membrane module Waste Description UKP-GW-GL-790 367 once/7 yrs once/6 mos once/12 yrs once/6mos once/5 yrs once/12 yrs once/6 mos Frequency(1) 557 3.36 47.25 3.36 31.67 27 6.72 cubic feet each change 15.77 0.1 1.34 0.1 0.9 0.76 0.19 cubic metres each change 4774 403 236 403 380 135 806 cubic feet plant life Waste Quantity(2) IDENTIFICATION OF WASTE ARISINGS FROM PRIMARY SYSTEM COMPONENTS Appendix A2 (cont.) Notes: 1. Frequency based on design engineer experience volume is actual size. 2. Volume is actual size 3. See Appendix A5 for key of pre-conditioning and disposal routes 4. Based on a 21,000 gallon tank. 5. Radioactive and non-radioactive oil will not be stored in the same vessel. 6. Each cell is 295 kg; of this weight, approximately 90% is lead. It is highly likely that the lead will be recycled and reused. 7. Two battery exchanges are used. The third will be included in determining decommissioning wastes. DTS Reverse osmosis filters DTS A&B Electrodeionisation unit A&B Electrodeionisation filters A&B (alternate supplier) Electrodeionisation units A&B Electrodeionisation units DTS DTS BDS BDS Containment exhaust elec ht VFS A&B Component System Appendix A Waste Arisings 135.2 11.41 6.68 11.41 10.76 3.82 22.83 cubic metres plant life LLW LLW Radioactivity Solid Solid Waste Form 9 9 9 9 1, possibly 13 1, possibly 13 9 9 C C C C B, Possibly F B, Possibly F C C or B Disposal Route(3) Revision 4 PreConditioning(3) Disposability UK AP1000 Environment Report Letdown HX Reactor coolant filter A Reactor coolant filter B Regenerative HX Pressuriser Pressuriser heaters (31) SG 1 Normal Rotation RX Coolant Pump SG 1 Reverse Rotation RX Coolant Pump SG 2 Normal Rotation RX Coolant Pump SG 2 Reverse Rotation RX Coolant Pump Core Barrel Core Barrel Hold Down Spring CVS CVS CVS CVS RCS RCS RCS RCS RCS RCS RXS RXS UKP-GW-GL-790 Spent fuel system filter B Component Waste Description CCS System Appendix A3 Internals Internals Pump Pump Pump Pump Heater Tank Heat exchanger Filter Filter Heat exchanger Filter Type ILW ILW ILW ILW ILW ILW ILW ILW ILW ILW ILW ILW ILW Waste Level 368 4.65 3,627 885 885 885 885 2 2,100 216 29 29 116 29 cubic feet 0.13 102.72 25.07 25.07 25.07 25.07 0.05 59.47 6.12 0.82 0.82 3.28 0.82 cubic metres Volume(1) 2,277 132,900 179,862 179,862 179,862 179,862 358 336,680 7,240 2,600 2,600 14,040 2,600 pounds 1.0 60.41 81.76 81.76 81.76 81.76 0.16 153.04 3.29 1.18 1.18 6.38 1.18 tonnes Mass 9&4 9&4 9&4 9&4 9&4 9&4 9&4 9&4 9&4 2 2 9&4 2 PreConditioning A A A A A A A A A A A A A (2) (2) (2) Revision 4 Disposal Route(5) Disposability Notes UK AP1000 Environment Report ESTIMATED RADWASTE ARISING FROM LARGE-VOLUME COMPONENTS AT DECOMMISSIONING Appendix A Waste Arisings Core Shroud Assembly Direct Vessel Injection A Deflector Direct Vessel Injection B Deflector Guide Tube Assemblies (69) Head and Vessel Pins Head Cooling Nozzles Irradiation Specimen Guide Tubes Lower Core Support Plate Lower Support Plate Fuel Alignment Pins Non-Threaded Fasteners Radial Supports (4) Reactor Cavity Neutron Shield lower (4) Reactor Cavity Neutron Shield middle (4) Reactor Lower Internals Reactor Upper Internals RXS RXS RXS RXS RXS RXS RXS RXS RXS RXS RXS RXS RXS RXS RXS UKP-GW-GL-790 Core Barrel Nozzle Component Waste Description RXS System Appendix A3 (cont.) Internals Internals Internals Internals Internals Internals Internals Internals Internals Internals Internals Internals Internals Internals Internals Internals Type ILW ILW ILW ILW ILW ILW ILW ILW ILW ILW ILW ILW ILW ILW ILW ILW Waste Level 0.354 0.354 0.06 – 0.01 4.07 – – 0.02 18.99 0.01 0.01 43.68 0.43 cubic metres 369 (see individual pieces) 12.5 12.5 2.28 – 0.37 144 – – 1 671 0.5 0.5 1,542 15 cubic feet Volume(1) 116,659 205,310 5,052 5,572 1,142 – 94.2 46,342 1,975 – 330 49,404 250 250 44,357 4,729 pounds 53.03 93.32 2.3 2.53 0.52 – 0.04 21.06 0.9 – 0.15 22.5 0.1 0.1 20.16 2.15 tonnes Mass 9&4 9&4 9&4 9&4 9&4 9&4 9&4 9&4 9&4 9&4 9&4 9&4 9&4 9&4 9&4 9&4 PreConditioning A A A A A A A A A A A A A A A A Revision 4 Disposal Route(5) Disposability Notes UK AP1000 Environment Report ESTIMATED RADWASTE ARISING FROM LARGE-VOLUME COMPONENTS AT DECOMMISSIONING Appendix A Waste Arisings Upper Support Plate Fuel Alignment Pins (314) Vortex Suppression Plate Spent fuel system filter A Resin fines filter Waste after-filter Waste prefilter Valves (potentially radioactive) (1461) RXS RXS SFS WLS WLS WLS All Sys UKP-GW-GL-790 Cation bed demineraliser Upper Core Plate Inserts (8) RXS CVS Upper Core Plate RXS Component cooling water pump B Threaded Structural Fasteners RXS CCS Support Columns (42) RXS Component cooling water pump A Secondary Core Support RXS CCS Reactor Vessel Component Waste Description RXS System Appendix A3 (cont.) Ion exchanger Pump Pump Valve Filter Filter Filter Filter Internals Internals Internals Internals Internals Internals Internals Tank Type LLW LLW LLW LLW ILW ILW ILW ILW ILW ILW ILW ILW ILW ILW ILW ILW Waste Level 370 74 – – – 29 29 29 29 11 1.27 0.25 65 – 361 70 11,603 cubic feet 2.1 – – – 0.82 0.82 0.82 0.82 0.3 0.04 0.01 1.85 – 10.23 1.99 328.61 cubic metres Volume(1) 17,200 5961.30 5961.30 – 2,600 2,600 2,600 2,600 3,195 314 116 7,105 – 9,257 4,464 600,166 pounds 7.82 2.70 2.70 – 1.18 1.18 1.18 1.18 1.45 0.1 0.1 3.2 – 4.2 2.03 272.8 tonnes Mass 9 9 9 9 2 2 2 2 9&4 9&4 9&4 9&4 9&4 9&4 9&4 9&4 PreConditioning C or B C or B C or B C or B A A A A A A A A A A A A (2) (2) (2) (2) Revision 4 Disposal Route(5) Disposability Notes UK AP1000 Environment Report ESTIMATED RADWASTE ARISING FROM LARGE-VOLUME COMPONENTS AT DECOMMISSIONING Appendix A Waste Arisings Makeup miniflow HX B Makeup pump A Makeup pump B Makeup pump/motor A Makeup pump/motor B Mixed bed demineraliser A Mixed bed demineraliser B Steam Generator 1 Steam Generator 2 Residual heat removal HX Residual heat removal pump A Residual heat removal pump B CVS CVS CVS CVS CVS CVS CVS RCS RCS RNS RNS RNS UKP-GW-GL-790 Makeup miniflow HX A Component Waste Description CVS System Appendix A3 (cont.) Pump Pump Heat exchanger Heat exchanger Heat exchanger Ion exchanger Ion exchanger Pump Pump Pump Pump Heat exchanger Heat exchanger Type LLW LLW LLW LLW LLW LLW LLW LLW LLW LLW LLW LLW LLW Waste Level 371 155.00 155.00 1,095 25,700 25,700 74 74 224.60 224.60 – – 5 5 cubic feet 4.39 4.39 31.01 727.84 727.84 2.1 2.1 6.36 6.36 – – 0.15 0.15 cubic metres Volume(1) – – 49,948 1,378,329 1,378,329 17,200 17,200 – – – – 538 538 pounds – – 22.7 626.51 626.51 7.82 7.82 – – – – 0.24 0.24 tonnes Mass 9 9 9 9 9 9 9 9 9 9 9 9 9 PreConditioning C or B C or B C or B C or B C or B C or B C or B C or B C or B C or B C or B C or B C or B Revision 4 Disposal Route(5) Disposability Notes UK AP1000 Environment Report ESTIMATED RADWASTE ARISING FROM LARGE-VOLUME COMPONENTS AT DECOMMISSIONING Appendix A Waste Arisings Reactor Integrated Head Package CRDM Cooling Fans Reactor Integrated Head Package including CRDM latch housing (closure head assembly) Reactor Integrated Head Package Radial Arm Hoist Reactor Integrated Head Package Remaining Items Reactor Integrated Head Package Shroud Reactor Integrated Head Package Top Plate Reactor Integrated Head Package Tripod Reactor Vessel Cavity Reflective Insulation Studs, Nuts, and Washers (45 sets) Spent fuel cooling pump A RXS RXS RXS RXS RXS RXS RXS RXS RXS SFS UKP-GW-GL-790 Integrated Head Package Dome Insulation Component Waste Description RXS System Appendix A3 (cont.) Pump Fasteners Insulation Integrated head Integrated head Integrated head Integrated head Integrated head Head Integrated head Insulation Type LLW LLW LLW LLW LLW LLW LLW LLW LLW LLW LLW Waste Level 372 38.30 133 625 22.5 14.2 90 58.2 20.1 7,685 26.9 140 cubic feet 1.08 3.765 17.7 0.637 0.402 2.552 1.648 0.569 217.64 0.762 3.96 cubic metres Volume(1) 1495.00 33,900 15,000 11,017 6,957 44,139 28,505 9,858 145,000 13,200 3,400 pounds 0.68 15.41 6.82 5.01 3.16 20.06 12.96 4.48 65.91 6 1.55 tonnes Mass 9 3 3 9 9 9 9 9 11 9 9 PreConditioning C or B B B C or B C or B C or B C or B C or B C or B C or B B Revision 4 Disposal Route(5) Disposability Notes UK AP1000 Environment Report ESTIMATED RADWASTE ARISING FROM LARGE-VOLUME COMPONENTS AT DECOMMISSIONING Appendix A Waste Arisings Spent fuel cooling pump/motor A Spent fuel cooling pump/motor B Spent fuel pool HX A Spent fuel pool HX B Spent fuel sys. demin A Spent fuel sys. demin B Containment exhaust upstream high-efficiency filter A and B, HEPA filter A and B, charcoal filter A and B, and downstream high-efficiency filter A and B Delay bed A Delay bed B Guard bed Moisture separator Waste gas system gas cooler SFS SFS SFS SFS SFS SFS VFS WGS WGS WGS WGS WGS UKP-GW-GL-790 Spent fuel cooling pump B Component Waste Description SFS System Appendix A3 (cont.) Heat Small vessel Adsorber Adsorber Adsorber HVAC filters Ion exchanger Ion exchanger Heat exchanger Heat exchanger Pump Pump Pump Type LLW LLW LLW LLW LLW LLW LLW LLW LLW LLW LLW LLW LLW Waste Level 373 4 0.53 8 88 88 1,224 95 95 67 67 84.70 84.70 38.30 cubic feet 0.11 0.02 0.23 2.49 2.49 34.66 2.69 2.69 1.9 1.9 2.40 2.40 1.08 cubic metres Volume(1) 194 51 511 3,423 3,423 17,900 2,455 2,455 3,327 3,327 3732.00 3732.00 1495.00 pounds 0.09 0.02 0.23 1.56 1.56 8.14 1.12 1.12 1.51 1.51 1.69 1.69 0.68 tonnes Mass 9 9 9 9 9 3 9 9 9 9 9 9 9 PreConditioning C or B C or B C or B C or B C or B B C or B C or B C or B C or B C or B C or B C or B (3, 4) Revision 4 Disposal Route(5) Disposability Notes UK AP1000 Environment Report ESTIMATED RADWASTE ARISING FROM LARGE-VOLUME COMPONENTS AT DECOMMISSIONING Appendix A Waste Arisings Chemical waste pump Chemical waste tank Containment sump pump A Containment sump pump B Degasifier discharge pump A Degasifier discharge pump B Degasifier vacuum pump A Degasifier vacuum pump B Effluent holdup pump A Effluent holdup pump B Effluent holdup pump C Effluent holdup tank A Effluent holdup tank B Effluent holdup tank C Monitor pump A Monitor pump B WLS WLS WLS WLS WLS WLS WLS WLS WLS WLS WLS WLS WLS WLS WLS WLS UKP-GW-GL-790 Charcoal deep bed filter Component Waste Description WLS System Appendix A3 (cont.) Pump Pump Tank Tank Tank Pump Pump Pump Pump Pump Pump Pump Pump Pump Tank Pump Adsorber exchanger Type LLW LLW LLW LLW LLW LLW LLW LLW LLW LLW LLW LLW LLW LLW LLW LLW LLW Waste Level 374 6.70 6.70 3,846 3,846 3,846 6.70 6.70 6.70 - - 6.70 6.70 4.60 4.60 268 6.70 68 cubic feet 0.19 0.19 108.93 108.93 108.93 0.19 0.19 0.19 - - 0.19 0.19 0.13 0.13 7.58 0.19 1.92 cubic metres Volume(1) 248.00 248.00 25,520 25,520 25,520 248.00 248.00 248.00 1400.00 1400.00 248.00 248.00 1300.00 1300.00 4,234 248.00 1,888 pounds 0.11 0.11 11.6 11.6 11.6 0.11 0.11 0.11 0.64 0.64 0.11 0.11 0.59 0.59 1.92 0.11 0.86 tonnes Mass 9 9 9 9 9 9 9 9 9 9 9 9 9 9 9 9 9 PreConditioning C or B C or B C or B C or B C or B C or B C or B C or B C or B C or B C or B C or B C or B C or B C or B C or B C or B Revision 4 Disposal Route(5) Disposability Notes UK AP1000 Environment Report ESTIMATED RADWASTE ARISING FROM LARGE-VOLUME COMPONENTS AT DECOMMISSIONING Appendix A Waste Arisings Monitor pump D Monitor pump E Monitor pump F RCDT pump A RCDT pump B Reactor coolant drain tank Reactor coolant drain tank HX Vapor condenser Waste holdup pump A Waste holdup pump B Waste holdup tank A Waste holdup tank B Waste ion exchanger A Waste ion exchanger B WLS WLS WLS WLS WLS WLS WLS WLS WLS WLS WLS WLS WLS WLS UKP-GW-GL-790 Monitor pump C Component Waste Description WLS System Appendix A3 (cont.) Ion exchanger Ion exchanger Tank Tank Pump Pump Heat exchanger Heat exchanger Tank Pump Pump Pump Pump Pump Pump Type LLW LLW LLW LLW LLW LLW LLW LLW LLW LLW LLW LLW LLW LLW LLW Waste Level 375 40 40 2,072 2,072 6.70 6.70 62 27 128 13.24 13.24 6.70 6.70 6.70 6.70 cubic feet 1.14 1.14 58.68 58.68 0.19 0.19 1.75 0.75 3.62 0.37 0.37 0.19 0.19 0.19 0.19 cubic metres Volume(1) 1,496 1,496 15,317 15,317 248.00 248.00 3,175 855 2,569 850.00 850.00 248.00 248.00 248.00 248.00 pounds 0.68 0.68 6.96 6.96 0.11 0.11 1.44 0.39 1.17 0.39 0.39 0.11 0.11 0.11 0.11 tonnes Mass 9 9 9 9 9 9 9 9 9 9 9 9 9 9 9 PreConditioning C or B C or B C or B C or B C or B C or B C or B C or B C or B C or B C or B C or B C or B C or B C or B Revision 4 Disposal Route(5) Disposability Notes UK AP1000 Environment Report ESTIMATED RADWASTE ARISING FROM LARGE-VOLUME COMPONENTS AT DECOMMISSIONING Appendix A Waste Arisings Waste monitor tank A Waste monitor tank B Waste monitor tank C Waste monitor tank D Waste monitor tank E Waste monitor tank F Resin transfer pump WLS WLS WLS WLS WLS WLS WSS Pump Tank Tank Tank Tank Tank Tank Ion exchanger Type LLW LLW LLW LLW LLW LLW LLW LLW Waste Level - 2,072 2,072 2,072 2,072 2,072 2,072 40 cubic feet - 58.68 58.68 58.68 58.68 58.68 58.68 1.14 cubic metres Volume(1) 2540.00 15,317 15,317 15,317 15,317 15,317 15,317 1,496 pounds 1.15 6.96 6.96 6.96 6.96 6.96 6.96 0.68 tonnes Mass 9 9 9 9 9 9 9 9 PreConditioning C or B C or B C or B C or B C or B C or B C or B C or B Disposal Route(5) Disposability Notes UKP-GW-GL-790 376 Revision 4 Notes: 1. Volume basis may include protruding appendages such as nozzles and brackets allowing the component to fit into an overpack for transport without modification. 2. These filters are assumed to be drained, crushed, and crud-contaminated. 3. Radiation from these filters is <5 mr/hr. 4. This mass and volume is for each of two containment air-handling units (A and B), each having overall dimensions of approximately 6' x 6' x 34' and consisting of a prefilter, a HEPA filter, a charcoal filter, and a post-filter with associated fans and enclosures. 5. See Appendix A5 for key of disposal routes. Waste ion exchanger C Component Waste Description WLS System Appendix A3 (cont.) UK AP1000 Environment Report ESTIMATED RADWASTE ARISING FROM LARGE-VOLUME COMPONENTS AT DECOMMISSIONING Appendix A Waste Arisings Appendix A Waste Arisings UK AP1000 Environment Report Appendix A4 ESTIMATED RADWASTE ARISING FROM SMALL-VOLUME COMPONENTS AT DECOMMISSIONING Disposability Waste Description System Component Type Waste Level PreConditioning Disposal Route(1) All Systems Fans, blowers, and drives (122) Fans LLW 9 C or B All Systems Instrumentation elements (3337) Instruments LLW 9 C or B All Systems Wire and cable ac (2498) ac circuits LLW 9 C or B All Systems Wire and cable dc (328) dc circuits LLW 9 C or B BDS Electrodeionisation units A and B Ionmigration equipment LLW 9 C or B FHS FHS underwater camera system Camera LLW 9 C or B FHS Fixed underwater light Light LLW 9 C or B FHS Portable underwater light Light LLW 9 C or B FHS Refueling pool underwater filtration system Filter LLW 2 or 15 B or J FHS Underwater cameras (4) Cameras LLW 9 C or B VFS Containment exhaust electric heater (2) Heaters LLW 9 C or B VHS Health Physics & Hot Machine Shop AHU A HVAC filter LLW 2 or 3 B VHS Health Physics & Hot Machine Shop AHU B HVAC filter LLW 2 or 3 B WSS Resin slurry conditions monitor Camera LLW 9 C or B WSS Resin slurry inlet camera Camera LLW 9 C or B WSS Resin slurry recirculation camera Camera LLW 9 C or B – Hot machine shop decon. glove box Skid LLW 9 C or B UKP-GW-GL-790 377 Revision 4 Appendix A Waste Arisings UK AP1000 Environment Report Appendix A4 (cont.) ESTIMATED RADWASTE ARISING FROM SMALL-VOLUME COMPONENTS AT DECOMMISSIONING Disposability Waste Description System Component Type Waste Level PreConditioning Disposal Route(1) – Hot machine shop portable decon. system Skid LLW 9 C or B – Power transformers (50) Transformers LLW 9 C or B Note: 1. See Appendix A5 for key of disposal routes. UKP-GW-GL-790 378 Revision 4 Appendix A Waste Arisings UK AP1000 Environment Report Appendix A5 KEY FOR PRECONDITIONING AND DISPOSAL METHODS Pre-Conditioning Method 1. Immobilisation in a cementitious grout within a 3m3 RWMD approved drum 2. Immobilisation in a cementitious grout within a 3m3 RWMD approved box 3. Compacted (Possible super compaction) into a 200L RWMD approved drum and placed into HHISO container 4. Placed in “baskets” in the RWMD approved box (possibly grouted), e.g., 4 m box 5. Collection and passed to monitoring and sampling tanks with filtration/IX 6. Passed to WGS delay beds 7. Collection and storage in oil tanks 8. Sorted dependent on size/type 9. Monitoring and swabbing (over period of time) with potential cleaning/decontamination or size reduction 10. Potential quenching, filtration, chemical treatment, and ion exchange, as necessary 11. Size reduction and placed in HHISO 12. Placed in HOLTEC flask 13. Collect and store 14. Collect in a chemical waste tank and de-water (cross flow filtration) 15. Collect in 200L Drum Disposal Method A. Site ILW store until UK repository becomes available B. Sent to LLW repository for storage C. Recycle or free issue D. Discharge to site drain E. Discharge to atmosphere F. Incineration G. Discharge via site effluent treatment H. Underground HLW storage facility I. Off-site contractor (e.g., NSG Environmental Ltd) J. Send to Inutec for drying and disposal at LLWR UKP-GW-GL-790 379 Revision 4 LLW Stainless Steel Concrete/Steel CA03 Carbon Steel LLW LLW LLW Solid Reinforced curved tank wall section Steel framework filled with concrete Lead encased titanium tubes Solid Solid Solid Solid Steel framework filled with concrete Barrel shaped octagonal structure houses reactor vessel Solid Waste Form Steel framework filled with concrete Physical/Chemical Description 62 4 31 210 33 1000 Ton 56 4 28 191 30 907 Tonne Steel Mass 258 11 129 875 138 4167 ft3 7 0 4 25 4 118 m3 Steel Volume(1) 295 N/A 526 N/A 157 4757 Ton 268 N/A 478 N/A 142 4315 Tonne Concrete Mass 3932 N/A 7028(2) N/A 2093 63423 ft3 111 N/A 199(2) N/A 59 1796 m3 Concrete Volume(1) UKP-GW-GL-790 380 Revision 4 2. Concrete volume based on the assumption that a concentric section around the reactor vessel cavity in the vicinity of the core will contain enough activation products to be treated as an LLW. Note: 1. Demolished volume is based on density of 480 pounds/ft3 (7700 kg/m3) for steel and 150 pounds/ft3 (2400 kg/m3) for concrete and 700 pounds/ft3 (11000 kg/m3) for lead filled titanium tubes. Provisions should be included in storage facilities to accommodate packaged waste that may require two to three times demolished volume. With proper decontamination prior to demolition, most of this waste will be essentially all VLLW. CA05 Lead/Titanium LLW Concrete/Steel CA02 LLW Concrete/Steel CA01 LLW/ILW/ HLW/Mixed Waste Description CA04 Appendix A6 UK AP1000 Environment Report Report STEEL AND CONCRETE RUBBLE FROM DEMOLISHING VARIOUS MODULES Module Appendix A Waste Arisings


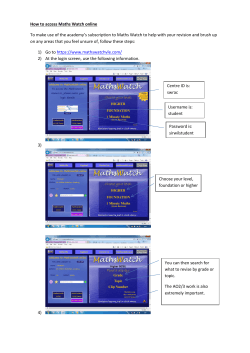


© Copyright 2026