
Project Implementation and Monitoring Report Cover Sheet e, +1 202.903.0717,
Project Implementation and Monitoring Report Cover Sheet i. Project name: Cordillera Azul National Park REDD Project ii. Project location: Peru, in the departments of San Martín, Ucayali, Huánuco, and Loreto iii. Project proponent: Centro de Conservación, Investigación y Manejo de Áreas Naturales – Cordillera Azul (CIMA-Cordillera Azul), Patricia I. Fernández-Dávila M., +51 1 2412291, [email protected] iv. Auditor: Rainforest Alliance, Campbell Moore, +1 202.903.0717, [email protected] v. Project start date, GHG accounting period and lifetime: The project start date is August 8, 2008. The GHG accounting period is August 8, 2008 – August 7, 2028 and the project lifetime is likely greater than 100 years. vi. Project implementation period covered by the PIR: August 8, 2008 – August 7, 2012. vii. History of CCB Status: The Project PDD completed CCB validation on February 19, 2013 when both the CCB Validation Report and the Validation Statement were issued. viii. Edition of the CCB Standards being used for this verification: Second Edition (CCBA 2008) ix. Brief summary of the climate, community and biodiversity benefits generated by the project since the project start date and during the current implementation period covered by the PIR: The project successfully reduced net GHG emissions by 6,413,412 metric tons CO2e over the monitoring period. If deductions for the VCS AFOLU pooled buffer account are also included, the net reductions are 5,772,071 metric tons CO2e. Community monitoring demonstrated the project’s successful efforts to build local capacity for sustainable land use and an improved quality of life for buffer zone communities through activities such as the development of economic and ecological zoning plans, development of community Quality of Life plans, development and use of individual technical skills relating to resource management and land use, project administration, and local governance, and increased participation of women in REDD project activities like gathering community data, developing community plans and forming formal production craft organizations. Monitoring data showed that biodiversity has remained about the same over the monitoring period with a significant decrease in the number of infractions for illegal use of the park area. These results are consistent with a successful avoided deforestation, conservation project and indicate that the project has had a net positive impact on biodiversity over the without project scenario. x. Which optional Gold Level criteria are being used and a brief summary of the exceptional benefits generated by the project to meet the requirements of each relevant Gold Level: The project meets the requirements for Exceptional Biodiversity Benefits. The success of the project’s activities in producing net positive impacts on the biodiversity means that the project activities have also protected the endemic and endangered species in the project area which include over 39 species new to science. xi. Date of completion of this version of the PIR, and version number as appropriate: December 19, 2013, Version 2.0 1 CORDILLERA AZUL NATIONAL PARK REDD PROJECT MONITORING AND IMPLEMENTATION REPORT Document Prepared By Centro de Conservación, Investigación y Manejo de Areas Naturales – Cordillera Azul Lima, Peru under a Total Management Contract with The National Service of State National Protected Areas - SERNANP and with technical assistance from The Field Museum Chicago, USA and TerraCarbon, LLC Peoria, USA Project Title Version Cordillera Azul National Park REDD Project Version 2.0 Report ID Date of Issue Project ID Monitoring Period Prepared By Contact December 19, 2013 985 August 8, 2008 – August 7, 2012 CIMA with technical assistance from The Field Museum, TerraCarbon and SERNANP Christina Magerkurth, The Field Museum 1400 South Lake Shore Drive, Chicago, IL 60605 [email protected], p: 630-947-9563 www.cima.org.pe 2 Table of Contents List of Maps ............................................................................................................................................... 6 List of Figures ............................................................................................................................................ 7 List of Tables ............................................................................................................................................. 8 1 1.1 General ................................................................................................................................................ 9 Summary Description of the Project (G3) ........................................................................................ 9 1.2 Project Location (G1 & G3) ............................................................................................................ 11 1.2.1 Soils and Geology ................................................................................................................. 13 1.2.2 Climatic Conditions ................................................................................................................ 16 1.2.3 Vegetation ............................................................................................................................. 18 1.3 Project Proponent (G4) .................................................................................................................. 31 1.4 Other Entities Involved in the Project (G4)..................................................................................... 31 1.5 Project Start Date (G3)................................................................................................................... 37 1.6 Project Crediting Period (G3) ......................................................................................................... 37 2.1 Implementation of Design .................................................................................................................. 38 Sectoral Scope and Project Type .................................................................................................. 38 2.2 Description of the Project Activity (G3) .......................................................................................... 38 2 2.2.1 Pre- Project Activities ............................................................................................................ 38 2.2.2 Planned Initial Project Activities ............................................................................................ 39 2.2.3 Project Activity Implementation ............................................................................................. 41 2.3 Management of Risks to Project Benefits (G3) .............................................................................. 55 2.4 Measures to Maintain High Conservation Values (G3) .................................................................. 56 2.5 Project Financing (G3 & G4) .......................................................................................................... 56 2.6 Employment Opportunities and Worker Safety (G4) ..................................................................... 56 2.7 Stakeholders (G3) .......................................................................................................................... 57 2.7.1 Primary Stakeholder Involvement ......................................................................................... 57 2.7.2 Secondary Stakeholder Involvement .................................................................................... 61 2.7.3 Stakeholder Communication Systems .................................................................................. 61 3 3.1 Legal Status....................................................................................................................................... 63 Compliance with Laws, Statues, Property Rights and Other Regulatory Frameworks (G4 & G5) 63 3.1.1 Worker Regulations ............................................................................................................... 67 3.1.2 Regulatory Additionality ......................................................................................................... 68 3.2 Evidence of Right of Use (G5) ....................................................................................................... 68 3.3 Emissions Trading Programs and Other Binding Limits (CL1) ...................................................... 69 3.4 Participation under Other GHG Programs (CL1) ........................................................................... 70 3.5 Other Forms of Environmental Credit (CL1) .................................................................................. 70 3 3.6 Projects Rejected by Other GHG Programs (CL1) ........................................................................ 70 3.7 Respect for Rights and No Involuntary Relocation (G5) ................................................................ 70 3.8 Illegal Activities and Project Benefits (G5) ..................................................................................... 70 4.1 Application of Methodology ............................................................................................................... 71 Title and Reference of Methodology .............................................................................................. 71 4.2 Deviations from the Monitoring Plan .............................................................................................. 71 4.3 Project Boundary (G1) ................................................................................................................... 71 4 4.3.1 4.4 Definition of geographic and temporal boundaries (CCB: G3.3) ........................................... 71 Baseline Scenario (G2) .................................................................................................................. 76 4.4.1 Baseline Identification and Justification ................................................................................ 76 4.4.2 Human Communities: Baseline Conditions (Without the Project) ......................................... 77 4.4.3 Biodiversity: Conditions Without the Project ......................................................................... 79 4.5 Additionality (G2) ............................................................................................................................ 81 4.5.1 Investment Analysis .............................................................................................................. 81 4.5.2 Common Practice .................................................................................................................. 82 4.5.3 Financial Plan ........................................................................................................................ 82 5 5.1 Monitoring Data and Parameters ...................................................................................................... 84 Description of the Monitoring Plan (CL3, CM3 & B3) .................................................................... 84 5.2 Data and Parameters Available at Validation (CL3) ...................................................................... 84 5.3 Data and Parameters Monitored (CL3, CM3 & B3) ....................................................................... 84 5.4 Description of the Carbon Monitoring Plan .................................................................................... 84 5.4.1 Revision of the baseline ........................................................................................................ 84 5.4.2 Monitoring of actual carbon stock changes and greenhouse gas emissions ........................ 85 5.4.3 Emissions due to deforestation and natural disturbance ...................................................... 85 5.4.4 Quality Assurance /Quality Control and Data Archiving Procedures .................................... 91 5.4.5 Emissions due to illegal degradation ..................................................................................... 92 5.4.6 Monitoring of leakage carbon stock changes ........................................................................ 94 5.4.7 Estimation of ex-post net carbon stock changes and greenhouse gas emissions. .............. 97 5.4.8 Organization and Responsibilities ......................................................................................... 97 5.5 Biodiversity Monitoring (CCB: B3.1, B3.2, B3.3) ........................................................................... 99 5.6 Monitoring of Human Communities in the Buffer Zone (CCB: CM3.1, CM3.2, CM3.3) ............... 104 5.6.1 Application of ROtI and Sustainable Livelihoods Framework ............................................. 105 5.6.2 Indicators and Methodologies ............................................................................................. 105 6 6.1 Quantification of GHG Emission Reductions and Removals (CLIMATE) ....................................... 107 Baseline Emissions (G2) .............................................................................................................. 107 6.2 Project Emissions ......................................................................................................................... 107 6.3 Leakage ....................................................................................................................................... 107 4 6.4 Summary of GHG Emission Reductions and Removals (CL1 & CL2) ........................................ 107 7.1 Community ...................................................................................................................................... 108 Net Positive Community Impacts (CM1) ...................................................................................... 108 7 7.1.1 Baseline Conditions (2008) ................................................................................................. 108 7.1.2 Project Conditions (2012) .................................................................................................... 109 7.1.3 Summary of Project Impacts ............................................................................................... 110 7.2 Negative Offsite Stakeholder impacts (CM2) ............................................................................... 111 8.1 Biodiversity ...................................................................................................................................... 111 Net Positive Biodiversity Impacts (B1) ......................................................................................... 111 8 8.1.1 Baseline Conditions (2008) ................................................................................................. 111 8.1.2 Project Conditions (2012) .................................................................................................... 112 8.1.3 Summary of Project Impacts ............................................................................................... 115 8.2 Negative Offsite Biodiversity Impacts (B2) ................................................................................... 115 8.2.1 8.3 9 10 Soil and Water Resources ................................................................................................... 117 Exceptional Biodiversity Benefits (GL3) ....................................................................................... 117 Additional Information ...................................................................................................................... 119 References ...................................................................................................................................... 120 5 List of Maps Map 1. Location of PNCAZ (Project) and buffer zone Map 2. Topographic Map of PNCAZ and buffer zone Map 3. Distribution of precipitation across PNCAZ and buffer zone in 1984, the wettest year on record. Map 3a. Structural habitats in the project zone Map 3b. Locations where biological assessments have been conducted Map 4. Locations of CIMA offices outside of Lima and PNCAZ park guard control posts and centers Map 5. Location of areas monitored by Park Guards: Patrol trails, patrol areas, and control posts Map 6. Locations of Intervention Areas in the buffer zone 6 List of Figures Figure 1. Vivian Formations - a distinctive geological formation in PNCAZ Figure 2. Average Annual Temperature at Selected Park Guard Posts Figure 3. Project Organizational Chart Figure 3b: Example of monitoring for degraded area recovery - Las Palmas Sector (2003, 2007, 2013) Figure 4. CIMA – Cordillera Azul FOCAL Model for intervention Figure 5. Reference region Figure 6. Districts included in the reference region Figure 7. General workflow for monitoring of forest cover change in the project area and leakage belt Figure 8. Forest cover benchmark map for project area, August 2008 Figure 9. Benchmark map of forest cover in 2008 in the leakage belt Figure 10. Data flow in CIMA Figure 11. The levels of the ICC 7 List of Tables Table 1.1 Numbers of species observed, estimated, and new to science in the project zone (PNCAZ and Buffer zone) through 2012 Table 2.1. Planned Initial Project Activities Table 2.2. Primary Project Stakeholders Table 2.2a: Additional Regional Government Authority Stakeholders Table 4.1. Temporal boundaries Table 4.2. GHG emission sources and justifications for exclusion Table 4.3. Selection of pools and reservoirs for inclusion in the project Table 4.4. Analysis of weighted average emissions Table 5.1. Example accuracy assessment results Table 5.2. Communities to be surveyed Table 5.3. Calculation format for area subject to activity shifting leakage in the leakage belt Table 5.4. Calculation format for area subject to activity shifting leakage outside the leakage belt Table 5.5. Estimates of GHG credits eligible for issuance as VCU’s Table 5.6. Variables for biological community monitoring Table 5.7. Index for biological community monitoring Table 5.8. Social monitoring indicators Table 7.1. Communal information, 2008 Data Table 7.2. Communal information, 2012 Data Table 8.1. 2008 Data and Index Rankings Table 8.2. 2012 Data and Index Rankings Table 8.2a New research conducted during the monitoring period Table 8.3. Wildlife Sightings in the PNCAZ Buffer Zone 8 1 1.1 GENERAL Summary Description of the Project (G3) Cordillera Azul National Park (PNCAZ) REDD Project protects a large, intact expanse of lower-montane forest remaining in Peru. PNCAZ is the easternmost outlier of the Andes at this latitude and covers portions of seven provinces in four departments in Peru: San Martín, Ucayali, Huánuco, and Loreto. The project area is 1,351,963.85 hectares within the boundaries of PNCAZ owned by the government of Peru, by order of its designation as a national park. The park’s buffer zone was officially recognized by the Peruvian government in a Supreme Decree establishing the park. In 2011 the buffer zone was redefined by legislation, resulting in an area of 2,303,414.75 ha hectares Each mountain range in the park is a separate, uplifted block of mostly Jurassic and Cretaceous strata, which predominate in the northeastern Peruvian Andes south of the Marañon River. Most of these tilted blocks are oriented north and south, but some curve to run east and west. A distinctive geological feature, the Vivian formation consists of rows of flat, sloping triangles of rock up to 7 km broad at the base and 4 km along the ridge resembling giant zigzags. They are well developed and almost perfectly symmetrical in two areas of the park. The possibility of non-contacted indigenous people from the Cacataibo group living in the southeast region of the park led to the establishment of a “strict protection zone” (Zona de Protección Estricta in Spanish) in the region that permits zero outside entry. Until these people come out of their own volition and request contact, the region remains closed to all entry or use. There are no organized human communities within the project area. The one known dweller inside the park – a cattle rancher – does not have legal land tenure but had an agreement with SERNANP and CIMA allowing him to remain on his land. He violated this agreement shortly before the project began. The ranch is discussed further in Section 3.2. The total population in the districts around and including the park in 2008 was 321,000. This population has access to the park for subsistence hunting and fishing. The population in the actual buffer zone is estimated at 180,000, with the remaining population residing beyond the buffer zone. Most of the parkneighboring communities are on the west, along the Huallaga valley. Most Huallaga residents are mestizo. The only officially recognized indigenous population on the Huallaga side (with land titles as a “native community”) is a small Quechua-Lamista community in the district of Chazuta. The Ucayali region on the park’s eastern side differs dramatically from the west. The population is sparse and predominantly indigenous—principally Shipibo, with some Piro/Yine and Kakataibo groups—each group conserving its cultural identity and mother language. The project area includes intact forests from the lowlands (at 300 meters) to mountain peaks (at 2,400 meters) and protects an eastern outlier of the Andes that has been isolated sufficiently long for massive speciation to occur. Scientists who conducted the Rapid Biological Inventory led by The Field Museum in 2000 estimated a total of 4000 – 6000 plant species in the park, with at least 12 probably new to science. (Alverson et al. 2001) In their three weeks in the field, the scientists observed 71 large mammal species including bush dogs, spectacled bears, 10 species of primates, and enormous herds of white-lipped peccaries. Bird diversity is extremely high, with more than 590 species already registered for the park and actual species richness probably exceeding 800 species. During the inventory, 58 species of amphibians and 26 of reptiles were registered, but these numbers are low because the inventory was conducted during the dry season when few species are calling and active. Inventories to date have confirmed 150 species of fish with total richness expected to be greater than 250 species. The project area consists of 1,351,963.85 hectares within the park that belongs to the national government of Peru. Upon its formation in 2002, Centro de Conservación, Investigación, y Manejo de Áreas Naturales– Cordillera Azul (CIMA) voluntarily signed an agreement with the Peruvian government 9 to support the management of the park. The agreement was renewed for one-to-two year terms until August 8, 2008 when CIMA and the Peruvian government signed a 20-year, full management contract. The 2008 management contract includes legal authorization for CIMA to use revenues from the sale of carbon credits from avoided deforestation for park activities for the 20-year term. CIMA is the only NGO with a contract with the Peruvian government for full management of the entire national park and buffer zone. CIMA and PNCAZ receive no or extremely limited funds from the government of Peru per the terms of the management contract, which further differentiates PNCAZ from other Peruvian national parks. As a result of a funding crisis in 2007, CIMA and its technical advisor, The Field Museum, sought a more sustainable source of funding than the foundation and USAID funding that they had been receiving to date for park protection and land-use management activities. The two organizations decided to pursue a REDD project for PNCAZ because no alternative, sustainable financing was available and CIMA would have to cease all protection and management activities in the park and buffer zone. Two protocols were identified to develop and monitor the project: Verified Carbon Standard (VCS) and the Community, Climate and Biodiversity (CCB) protocol. Under VCS, the project is using VM0007 REDD Methodology Modules (REDD-MF) for unplanned frontier deforestation for carbon stock and avoided emissions assessment. The signing of the 20-year management contract in 2008 served as the start of the carbon project. The project’s primary objective is to prevent deforestation in PNCAZ by focusing on three main types of project activities: Protecting the park. Building local capacity for sustainable land use and improving the quality of life in the buffer zone communities. Strengthening relationships with local, regional and national government agencies. All project activities support these goals and are designed to work together to simultaneously achieve net positive climate, social and biodiversity benefits as discussed throughout this document. 10 1.2 Project Location (G1 & G3) The project consists of the area within the boundaries of Cordillera Azul National Park (PNCAZ) owned by the government of Peru. The limits of the park were defined in the official Supreme Decree No. 031-2001AG, and lie between 0629’13.3” - 0854’07.5” south and 7520’52.3” - 7624’17.4” west. The park has an area of 1,353,190.85 hectares as defined in the Supreme Decree and an approximate perimeter of 974 km. A small amount of land within the park is privately owned, so the project area is 1,351,963.85 hectares and covers portions of seven provinces in four departments in the Republic of Peru, San Martín, Ucayali, Huánuco, and Loreto. Note that by mistake the supreme decree names only six provinces; however, subsequent documents for management of the area (the “master plans”) name all seven provinces. Additional information regarding the private land owners is located in Section 3.2. The park’s buffer zone was provisionally delineated by the Peruvian government in the Resolución Jefatural Nº 314-2001-INRENA on 13 December 2001, covering 2,061,259.79 hectares. In June of 2007 INRENA passed a resolution (Resolución Jefatural Nº 144-2007-INRENA) amplifying the buffer zone to more than 2.3 million hectares; making official the limits proposed in the Plan Maestro 2003-2008 (Resolución Jefatural Nº 245-2004-INRENA). During the Plan Maestro update conducted in 2008-2009, CIMA and SERNANP worked together to adjust the buffer zone limits as part of SERNANP’s change in geographical-spatial data management and policy for all of its protected areas. The changes focused on ensuring that consistent, accurate spatial data for the limits were used and maintained, especially where boundaries are defined by rivers or other natural features which may change over time due to erosion or other natural processes. The new limits were officially approved on April 14, 2011 in the Resolución Presidencial Nº 064 – 2001 – SERNANP (see Map 1), the change resulted in the buffer zone having a total area of 2,303,414.75 ha (CIMA 2011). To ensure a consistent understanding throughout the PD, the following definitions are provided: - Project area (VCS and CCB) – area within the boundary of PNCAZ owned by the government of Peru (Figure 1.2) that comprises the carbon project and over which CIMA has direct control. - Buffer zone – area surrounding the park as defined in the Supreme Decree and resolution (Figure 1.2). The buffer zone is the land within the boundaries of the surrounding communities that may be potentially affected by the project. - Project zone (CCB) – combination of the project area and the buffer zone (Figure 1.2). Because no human communities exist within the project area, communities within the buffer zone represent all communities within the project zone. - Offsite (CCB) – area beyond the project zone. The reference region for deforestation, the reference region for location, and the leakage belt are presented in Section 4.3.1 along with maps and justifications for the choices made. 11 Map 1. Location of PNCAZ (Project) and buffer zone Map of PNCAZ/project area (shaded in green) and its buffer zone (shaded in grey). The project zone consists of the entire shaded area (project area and buffer zone). The inset shows the park’s location in central Peru. 12 1.2.1 Soils and Geology The area within and surrounding the project zone—PNCAZ—encompasses unique geological formations (Alverson et al. 2001). These in turn influence the biological communities in the park. The Jurassic and Cretaceous strata that make up most of Cordillera Azul are formed from a mixture of very acidic continental and marine sediments. The substrate is primarily soft sandstones, but may include harder quartzites or granites and other rock that create acid soils. In contrast to the nutrient-poor strata that dominate the mountains, the lower slopes and lowlands have considerable exposure of rich strata such as limestones and rich alluvial terraces. These slopes date to the Cretaceous-Tertiary boundary and more recent Tertiary and Quaternary sources. They are sometimes interlaced with pockets of acid soil, usually displaced from above, just as some strata of more basic soil is perched higher on the mountains. The recent (Tertiary) hills extending from the mountains eastwards are mostly intermediate in acidity. The park protects the easternmost outlier of the Andes at this latitude (see Map 2), except possibly for the much lower Serranía de Contamana, just east of the Ucayali River. Each mountain range in the park is a separate, uplifted block of mostly Jurassic and Cretaceous strata, which predominate in the northeastern Peruvian Andes south of the Marañon River. Most of these tilted blocks are oriented north and south, but some curve to run east and west. The easternmost uplift, the most recent of all, is a long, remarkably uniform sinuous ridge system. This eastern escarpment of the Cordillera forms a sheer rock wall that blocks access to the southern two-thirds of the park from the eastern lowlands. Only the Pauya and Pisqui rivers penetrate this formidable wall of mountains (towering 1800 m above the adjacent lowlands) through a few narrow openings. To the north, this escarpment curves westward and ends at the northsouth running escarpment that terminates at the Pauya River. In the northeastern part of the park, a similar but lower escarpment faces northeast and is bisected by the Huallaga River to the north. In the broad gap between this steep, northeastern wall and the main escarpment to the south, the Cushabatay River penetrates into two low, broad, ridge-filled basins. Northward, these basins constrict into narrow necks, separated by a high north-south running mountain range with peaks of 1700 m and higher. The broader, western basin is an extraordinary geological formation, with long, low, flat anvil-shaped ridges sloping to the south and a virtually flat-bottomed center (elevation 450 m) with dozens of emerging small, steep ridges up to 400 m. Nestled in this landscape is a large, isolated blackwater lake. A tributary of the Chipurana River drains this northern part of the park, then plunges through a narrow canyon in the eastern wall and finally runs north to merge with the Huallaga River. In the central portion of the park, the eastern slopes of the peaks (reaching up to 2400 m) drain down narrow openings to the Ucayali River. The west slopes of these peaks drain into the straight, northward flowing valleys of the Biabo River and eventually to the Huallaga River. In the southern portion of the park, a small river passes through high-elevation swamps and into the upper Huallaga to the southwest. These high swamps (at 1400 m elevation) are an unexpected feature in such close proximity to steep mountains. A newer uplift of very hard rock may have formed these unusual swamps by blocking drainage. A distinctive geological feature, the Vivian formations, are rows of giant, flat, sloping triangles of rock up to 7 km broad at the base and 4 km along the ridge (but usually smaller), resembling “zigzags” (see Figure 1). They are well developed and almost perfectly symmetrical in two areas of the park. Smaller versions of similar, sloping rock triangles occur in the park. Recent uplift of erosion-resistant rock, such as quartzite, and concurrent erosion of much softer rock beneath it presumably created these Vivian formations. 13 Figure 1: Vivian Formations - a distinctive geological formation in PNCAZ Photo: by Álvaro del Campo Drainage from the higher mountain valleys above the Vivian formations continues to carve gaps between the segments, often resulting in spectacular waterfalls. North of the Pauya River are higher and presumably older rows of Vivians that are more eroded, but still maintain their basic “zig-zag” form. The high range of hills between the Ucayali River and the eastern border of the park appear to be the beginning of the uplift of the next mountain range, as the Nazca Plate at the bottom of the Pacific Ocean continues to slide eastwards under the South American continent. This uplift emphasizes the geologically dynamic nature of the eastern slopes of the Andes. Structures are formed from the accumulation of sea-salt deposits over 1000 m in some places, and is one part of the evidence that this portion of the Amazon was covered by the sea. In the Blue Mountains, a region of instability of the crust caused the marine invasion, allowing the accumulation of sediments occupying the Huallaga basin called the Chonta Formation. The marine invasion peaked during the Cenomanian (about 95 million years). The current geological structure of the Peruvian lowland formed during the Cenozoic evolution of the Andean mountains, and the present relief of the basin was developed in the Miocene-Pliocene (23 to 6 million years) and occurred in sub-subdivision the late phase of evolution. These changes in the earth layers above the rocks after suffering severe tectonic deformations form what is called a salt dome. The salt used in the area (white, pink and red) is the product of artisanal blocks arising from the cliffs at the edge of salt domes as a result of the action of exogenous processes. Salt can be white or crystalline, with red clay and greenish gray gypsum, as in the case of the Tiraco dome, or may be colored by the effect of impurities, such as the dome that occurs at Callanayacu which is reddish and gray. (INRENA 2006, Zarate et al. 1997) 14 Map 2: Topographic Map of PNCAZ and buffer zone PNCAZ and Buffer Zone (together forming the project zone). The area encompasses an elevation range of approximately 2000 meters. 15 1.2.2 Climatic Conditions The project area is subject to a highly seasonal climate, with marked wet (November – May) and dry (June – October) seasons. Precipitation and temperature in PNCAZ vary spatially and with altitude. In lowland areas (150 - 650 m), precipitation ranges from 2000 mm – 3500 mm annually. On steep mountain slopes and in cloud forests (600 – 2000 m), precipitation ranges from 3500 mm – 6500 mm annually (INRENA 1995). The northwest part of the project area is comparably drier at all elevations than the rest of PNCAZ due to walls of mountains along the eastern and southern borders of the park that block moisture coming from the Amazonian plains to the east and from Argentina and Bolivia to the south. The average annual temperature of the lowlands is 24 degrees Celsius, with a range of 19 to 27 degrees Celsius (INRENA 1995). Based on data from the control posts in PNCAZ, the average temperature at altitudes between 750 - 1250 m is 22 degrees Celsius with a range from 16 to 27 degrees Celsius. According to Young & León (1999), the average temperature in montane forests at altitudes between1500 to 2500 m is 17 degrees Celsius with a range from 15 to 19 degrees Celsius. Park guards record temperature and precipitation daily at 18 guard posts and centers. Map 4 in Section 1.4 shows the locations of these points. The figure below shows the average monthly temperature for eight of the posts that had four years of data in 2008 and demonstrates the correlation between elevation and temperature. These correlations are expected to be true for the buffer zone as well since most of the points are along the boundary of the park. Some of the control posts did not have enough data to produce meaningful averages. The precipitation data also come from averaging control-post data. The closest weather station of the Servicio Nacional de Meteorología e Hidrología (SENAMHI) is located in Picota just west of the buffer zone. This weather station is not in the park or the buffer zone and Picota is not of comparable topography so these data were not included. Figure 2. Average Annual Temperature at Selected Park Guard Posts. 16 Map 3. Distribution of precipitation across PNCAZ and the buffer zone in 1984, the wettest year on record (Zuñiga 2010) 17 1.2.3 Vegetation PNCAZ and its buffer zone, the project zone, comprise a heterogeneous landscape that includes 21 unique structural habitats (i.e., based on structure not vegetational composition). Only 18 of these habitats occur within the park itself. The buffer zone contains 19 of the 21 habitats and where deforestation and degradation have not occurred, the buffer zone is a continuum of the habitats found inside the park (Map 3a). Human activity has affected the quality of the habitats in the buffer zone, mainly on the west side of the park. The state of each area varies widely depending on how it is used. However, there are still some intact patches of forest in the headwaters of rivers near the northwest park boundary that form mosaics of natural and secondary vegetation, with fallow and crops. These areas do not have the richness and diversity of flora and fauna as other habitats described. 18 Map 3a: Structural habitats in the Project Zone 19 SYMBOL TYPE OF HABITAT DESCRIPTION Palm (Mauritia) Swamp Predominantly Mauritia flexuosa (palm tree) distributed in permanently wet areas with poor drainage and frequent flooding. Water bodies Mostly rivers and creeks. Shrub / grassland Mountain ridges in the high Pisqui area above 1800 masl, built by slow-growing plants, concentrated polyphenols that make them vulnerable to frequent natural wildfires that maintain the area with shrub formations. Rubiaceae and dwarf palms are common. Well-drained alluvial forest In Pisqui, large trees typically Ceiba pentandra, Dipterix micrantha, Matisia spp., etc. In Pauya they are juxtaposed with hills. Understory with mixed palms in greater numbers than in the hills having greater access to water and dominated by Attalea phalerata and Astrocaryum murumuru. Poorly-drained alluvial forest Older extensions are found in the middle reaches of Mystery River, between 600800 masl. In Pisqui in depressions and flat areas with poor drainage and semiswamp area. Open vegetation, dense forest with matted lianas, and prickly, stinging plants. High hill forest Low hill forest Low height hill forest Middle hill forest Mountain forest of intermediate height Between 160 and 240 masl on the western side of the park and between 1000 1250 in the highlands of Biavo. In Pauya deciduous species canopy (Bombacaceae and Fabaceae), understory dominated by palm trees and between hills the valleys have less dense canopy, higher richness of tree species, higher density and richness of lianas, shrubs, juvenile palms and grasses. In Pisqui the forest composition varies considerably from one hill to another, are softer and less eroded, covered in high closed-canopy forest, forest of Cedrelinga catanaeformis (trunks) stand out. Rise between 200 and 300 masl on the western side of the park and highest between 350 and 700 masl within. The hills closest to the mountain slopes have more moisture (morning mist), greater richness of species, more epiphytes on stems and species of grasses and ferns. Evergreen canopy and richer in species with fewer understory palms. In Pauya (600-900 masl) evergreen vegetation and large tree ferns. Understory dominated by small trees (Sanango racemosum). Clay soils, the roots deepen and do not grow superficially, presenting a layer of algae. Cedrelinga forests on some slopes. In Pisqui more sandy soils with extensive stands of palm trees, canopy composed of arboreal Rubiaceae. Abundant Melastomataceae, Rubiaceae, Lauraceae, and genus Inga. High terrace forest Between 5-25 m (low and middle terrace) until 40 meters (high terrace) above river Low terrace forest level. Characterized by a large diversity of species and plant communities within the forest which vary from place to place. Presence of complex of edging in the and floodplain floodplain. Middle terrace forest Vivian forest formations and plateaus Rugged landscape between 500 and 1000 m. The ridges are exposed to wind, lightning, mist and occasional severe droughts. In addition to humid elfin forests, there are large tracts of low, dry forests. present in Cushabatay. Very damp forest, with a canopy that reaches 45 m. High stratus cloud Only From 1200 masl (lower level cloudiness) forest has many epiphytes, orchids, forest mosses, ferns, seedlings. This could be the most isolated cloud forest of Peru. Low stratus cloud forest Low stratus forest on slopes and ridges above 900 masl and with lowest frequency in acidic sandstone soils, lacking nutrients; surface roots creating a spongy mat. 20 Few woody species, abundant epiphytes. Red and white eroded hills Between 500 and 900 masl. Due to weathering the rock and soils have red or white coloring. The vegetation can fall primary due to earthquakes or ground instability. Deforestation Mostly in the buffer zone of the Park. Consisting of intervened areas: crops, pastures, purmas and other secondary vegetation. Lagoon of tectonic origin Lentic body of water, almost inaccessible such as in the upper Cushabatay area. High Swamp High wetland located above 1350 masl, with open waters, floating vegetation, swamp forests, extensive stands of trees and Euterpe palms, extensive areas of rooted herbaceous vegetation, bamboo and liana forest. Without vegetation / recent collapse Areas with exposed rock, removed soils without vegetation or short scraggly vegetation. Also in areas of collapse or landslides caused by earthquakes. These structural habitats are largely distinguished by differences in underlying geology, soils, and hydrology. The vegetation in each habitat reflects these differences. Detailed descriptions of all 21 structural habitats are included in the 2003 – 2008 for management of the park (INRENA 2006). The four forest categories (or clusters of structural habitats with similar biomass and topographic position) described below are the forest strata used for the project’s biomass inventory. Certain habitats were not sampled because of low vulnerabilities and these areas were masked out. A detailed discussion of the forest inventory is provided in the validated Project Documentation. The 4 categories of forest and the cluster of structural habitats for each one are described below: 1.2.3.1 Alluvial Forests This structural habitat cluster includes those forests along rivers that are periodically flooded, and forests found on terraces up to ~40 meters above the river level. These habitats include well-drained alluvial forest, poorly drained alluvial forest, and medium-terrace forest. Typical successional species (Gynerium, Cecropia, Guazuma, Triplaris, Acacia, and occasionally Ficus and Cedrela) are characteristic of the vegetation in alluvial and terrace forests, as well as a palm-dominated understory (e.g., Attalea, Astrocaryum and Phytelephas). Swampy habitats dominate open areas. Denser forests have patches with many vines, and spiny plants. Floral and faunal diversity is very high, and species composition varies considerably from site to site. The large number of fruiting species in alluvial and terrace forests attracts ungulates. Structural habitats: 1.2.3.2 Well drained alluvial forest Poorly drained alluvial forest Medium-terrace forest Hill Forests This structural habitat cluster includes low, medium, and high hill forests and eroded red hills. This habitat cluster shares many plant species with alluvial forests and a palm-dominated understory. In areas not reached by illegal loggers prior to the park’s formation, Cedar (Cedrelinga) forests still exist. The highest hills are the most humid parts of this habitat cluster, experiencing morning mists and regular cloud cover, and maintaining a high diversity of epiphytes and ferns. Eroded red and white hills (the color is due to iron oxides and minerals) have steep slopes and exposed rocks as a result of landslides. Structural habitats: 21 1.2.3.3 Low-terrace forest and plain floodplains (only in buffer zone) High-terrace forest Low hill forest Low altitude hill forest Medium hill forest High hill forest Eroded red hills Mountain Forests This habitat cluster includes mountain forests, stunted forests, and cloud forests. Arborescent ferns (dominated by Metaxya) grow in some of the habitats. Tree species include Cedrelinga, Brosimum, Tachigali, Protium, Attalea. The highest elevations, in acidic soils, are poor in woody species but rich in epiphytes, bamboo, palms, and herbs. Here, superficial root systems form spongy, humid carpets. At lower limits of cloud levels, mountain forests are covered by algae, lichen, orchids, mosses, and ferns. The very tall mountain forests in the headwaters of the Cushabatay River are of particular importance, as the habitat is rare and shelters several endemic species. Structural habitats: 1.2.3.4 Medium altitude mountain forest Cloud forest of low stratum Cloud forest of high stratum (only in PNCAZ) Forest in Vivian formations and plateaus Wetlands (Aguajal) In depressed or low-lying areas of the park, Mauritia palm forests are often dominant. Other species associated with poorly drained areas include Eritrina poeppigiana, Ficus insipida, Ficus maxima, and Acacia loretensis. Structural habitats: High altitude swamps (only in PNCAZ) Palm forests In addition to these habitats described in the category of forests, the following habitats are included in the project area: 1.2.4 Shrub/herbal Lagoons due to tectonic activity Areas without vegetation due to recent landslides Deforestation Bodies of water (mostly rivers) Biodiversity PNCAZ protects a large, intact expanse of lower-montane forest remaining in Peru. Besides encompassing a wide range of habitat types— from lush lowland forests, to stunted vegetation on the rugged sandstone ridges, to elfin forests on the mountain tops—and rare geologic formations such as the 22 Vivians, the park offers intact forest cover from the lowlands at 150 meters to mountain peaks at 2,400 meters. The park protects an eastern outlier of the Andes that has been isolated for a sufficiently long period for massive speciation to occur. The initial knowledge of the project area’s impressive biodiversity and endemism comes from a Rapid Biological Inventory (RBI) led in 2000 by scientists from The Field Museum with Peruvian counterparts. However, since then there have been numerous studies which have enriched the knowledge about the project zone biodiversity and the relevance of this biodiversity to human populations surrounding the park. (See Map 3b) Full documentation of the findings of the initial inventory is in Alverson et al. 2001 and additional references are noted throughout the discussion. The highlights are provided here and have been amended since the PD discussion to include greater information on the entire project zone and to reflect new findings or species classifications since the project started. Appendix 2 of the Project PD contains a table of the endemic, endangered, and threatened species within the project zone, as classified by the following entities: IUNC Red List, CITIES, and the Peruvian government’s lists per Decreto Supremo N° 034-2004-AG. 23 Map 3b: Locations where biological assessments have been conducted (Shading indicates the relative quantity of data available and the area the investigations covered) 24 Plants—The project zone contains a variety of different habitats and life zones which is further described in Section 1.9.3 Vegetation. Plant communities vary spatially in the project zone, and among and within these general habitat types. In 2000, RBI scientists estimated a total of 4000 – 6000 plant species in the park, with at least 12 likely new to science registered in the inventory, along with new records for Peru and hundreds of range extensions. The project zone has an extraordinary richness of palms, for example, the 45 species found in the park represent 43% of the palm species known in Peru, including at least two species new to science or newly registered for Peru in 2000. The buffer zone includes many palm species that have economic and commercial importance to the towns around the park, such as the piazaba (Aphandra natalia) in the Chazuta (Meyer 2006) sector. Mammals—Richness and uniqueness of terrestrial fauna also contributes to the biological importance of the project zone. During the 2000 three-week inventory, RBI scientists observed 71 large mammal species including bush dogs, spectacled bears, 10 species of primates, and enormous herds of whitelipped peccaries. The sheer abundance of large mammals in the park is as striking as the richness of mammal species. Subsequent inventories in the montane forests (not including bats) increased the list to 91 species and the current projection is more than 120 species total (Alverson 2001 and Luna 2005). Where the buffer zone forests are intact, similar mammals are observed. Sightings of small mammals in crop fields have also occurred. Birds—Bird diversity is pronounced, with more than 600 species registered for the small portion of the park that has been inventoried (Alverson 2001), and the buffer zone (Dasmahapatra et al. 2006, Merkord et al 2009 y Stotz et al 2009). Total richness should exceed 800 species between PNCAZ and the buffer zone. Broadly speaking, forest birds in PNCAZ can be divided into three components: 1) those restricted to lowland forests, including floodplain forests (along rivers and large streams) and old river terraces, at elevations below 300-500 m above sea level; 2) those that occur in slope forests, including hills and ridges from approximately 300 to 1000-1100 m; and 3) those in crest forests -- tall cloud forests or mossy, short, and spongy forest, elfin forests, or high-elevation shrublands (~1100 m and higher). The biogeographic patterns of bird species from hill and crest forests in the park appear to be complex: some of the most characteristic birds of Andean hill forests seem to be absent from the park or present in low numbers, whereas poorly known and spatially constricted species are common at one or more sites. One species—the Scarlet-banded Barbet (Capito wallacei wallacei)—is known from a single range of cloud forests in PNCAZ. Amphibians and Reptiles—The herpetofauna of the park represents a mix of species typical of both montane and lowland forests, and of northern and central Peru. The 2000 inventory registered 58 species of amphibians and 26 of reptiles, these numbers undoubtedly underestimate the total number of amphibians—particularly frogs—since the RBI was conducted during the dry season when few species are calling and active (Alverson 2001). Subsequent inventories, mainly in the forests at the boundaries between PNCAZ and buffer zone (Martinez 2008 y Venegas 2011), have taken the totals to 70 amphibians and 41 reptiles, with more than 110 species in total. The higher slopes and crests are particularly important habitats, as are small, upper elevation streams and ravines. Fishes—Aquatic environments of the park include streams, rivers, lagoons, and swamps. Inventories to date have confirmed more than 175 species in the basin that flows from PNCAZ (Alverson 2001) to the buffer zone (Hidalgo et al, 2004, Hidalgo et al, 2006, Meza 2008) and lead in to the Huallaga and Ucayali rivers ;total richness should be more than 250 species. The fish community is particularly rich in species of Characiformes and Siluriformes. Many species encountered in the inventory were endemic, rare, or poorly known, often with conspicuous adaptations to life in clear, fast-flowing waters. Several large migratory fishes also make use of habitats in the park for spawning. 25 Around PNCAZ, between the Huallaga and Ucayali rivers, lies the buffer zone covering an area of over 2.3 million ha, with an altitude range of 100 to 1,200 meters. On the west side of PNCAZ, the buffer zone is quite affected by human activities. There are still some intact forests in the basin headwaters near the limits of the park and high hills. In these forests there are stands of commercial timber species such as tornillo, ishpingo, and others. To the east of PNCAZ, the buffer zone maintains large tracts of forest with commercially valuable timber such as bolaina, tornillo, ishpingo, estoraque, Lupuna, shihuahuaco, moena and others, in addition to the existence of about 10,700 hectares of wetlands (MINAG 2004). Also, the wildlife in these forests is very representative of the lowland biodiversity in the north-central part of Peru. 1.2.5 Endemism and Unique Species The project zone offers remarkable opportunities for protection of large numbers of endemic and rare species in all groups of organisms sampled in the Rapid Inventory—vascular plants, fishes, amphibians and reptiles, birds, and large mammals. The project zone also harbors many range-restricted species and unique assemblages of species. Plants - At least 12 species of plants likely new to science were recorded during the Rapid Inventory along with several new records for Peru and hundreds more that were range extensions. A list of all plant species identified during the inventory is included in Alverson et al. 2001. Rapid Inventory scientists also found plants with unusual biological features or behaviors, including more than 20 species that have obligate mutualism with ants. At least five tree species, all in the genus Tachigali, show evidence of monocarpy (i.e., flowering only once in their life, then dispersing seed and dying). Large, commercially valuable species—such as mahogany (Swietenia macrophylla) and tropical cedars (Cedrela odorata, Cedrela fissilis)—are now very rare and have nearly vanished from riparian and river floodplain areas due to selective harvesting elsewhere in the tropics. Large Mammals - The fauna of PNCAZ includes several endemic and rare mammals. Of the 71 species registered in 2000, 12 are of international concern because of their global rarity—three species of monkeys—Spider monkey (Ateles chamek), Woolly monkey (Lagothrix lagotricha), and Saki monkey (Pithecia monachus)—and nine other mammals are listed in CITES: Spectacled bears (Tremarctos ornatus), Neotropical otters (Lontra longicaudis), Giant river otters (Pteronura brasiliensis), Tapirs (Tapirus terrestris), White-lipped peccaries (Tayassu pecari), Jaguars (Panthera onca), Bush dogs (Speothos venaticus), Giant anteaters (Myrmecophaga tridactyla), and Giant armadillos (Priodontes maximus). The inventory team also found a likely new species of squirrel (Microsciurus “oscura”). Two species, the water opossum (Chironectes minimus) and the short-eared dog (Atelocynus microtis) are rare. Birds - The park’s stunted forests seem to be the center of distribution of three endemic, very poorly known species of birds—the Scarlet-banded Barbet (Capito wallacei) (O'Neill et al. 2000), Bar-winged Wood-Wren (Henicorhina leucoptera), and Royal Sunangel (Heliangelus regalis). The park also protects large populations of big gamebirds—threatened by hunting throughout their range: the Spix’s Guan (Penelope jacquacu), Blue-throated Piping-Guan (Pipile cumanensis), Wattled Guan (Aburria aburri), and importantly, the Razor-billed Curassow (Crax tuberosa), which is particularly vulnerable to local extinctions. 26 Scarlet-banded Barbet (Capito wallacei wallacei): locally fairly common in humid Montano forest in the northeast of the Cordillera Azul (1300-1550 masl) (Schulenberg et al. 2010), at the east bank of the upper Río Cushabatay, 77 km west-north-west of Contamana in Loreto. The ridge is long (>50 km) and narrow (O'Neill et al. 2000) and, in spite of searches at suitable elevations in the adjacent Cordillera Azul, this species remains known only from Peak 1538 (D. Lane and T. S. Schulenberg in litt. 2000), currently Cerro Cinco Puntas. Fuente del mapa: http://maps.iucnredlist.org/map.html?id=160030236 Bar-winged Wood-Wren (Henicorhina leucoptera): very local species, in isolated mountain chains, especially in low stature forests, such as those of sandy soils and poor nutrients, altitudinal range between 1350-2600 msnm (Schulenberg 2010); has a very restricted range in north Peru (La Libertad, San Martín, on the Cordillera del Cóndor in Cajamarca, with a single record from Amazonas) (Ridgely and Tudor 1989, Schulenberg and Awbrey 1997, Clements and Shany 2001) and extreme south Ecuador (the north end of the Cordillera del Cóndor [Krabbe and Sornoza 1994]). It was recorded in mountains of the Pauya camp during the RBI 2000. Although its habitats are reasonably intact (Schulenberg and Awbrey 1997), this species has a small, apparently disjunct range, with elfin forest in the south of its range readily accessible from the páramo and clearly vulnerable to grazing and burning (Stattersfield et al. 1998). 27 Fuente del mapa: http://maps.iucnredlist.org/map.html?id=106006980 Royal Sunangel (Heliangelus regalis) fairly common, but irregularly distributed in patches. Restricted to humid forests of low stature and shrubby areas, usually in sandy soils and rocks of sandstone, in isolated mountains; altitudinal ranges between the 1350 – 2200 masl. This species is now known from eight areas in northern Peru – Amazonas, San Martin, Cajamarca y Loreto) and southeastern Ecuador (Graves et al. 2011). San Martín (Davis 1986); the río Chipaota valley in the Cordillera Azul, San Martín (Merkord et al. 2009); and the río Pauya valley in the Cordillera Azul, Loreto (Schulenberg et al. 2001). In San Martín occurs the more striking johnsoni, recently described subspecies from a specimens collected at Pauya, Loreto, is as yet only known from the Cordillera Azul (Graves et al. 2011). Fuente del mapa: http://maps.iucnredlist.org/map.html?id=106006980 Reptiles and Amphibians - In terms of reptiles and amphibians, the park protects the habitat of a rare salamander (Bolitoglossa sp.), and several species of endemic, new, or geographically restricted frogs in the genera Pristimantis (Eleutherodactylus in RBI) and Ameerega (Epipedobates in the inventory report). It is worth noting that the Atelopus pulcher frog is a species considered by IUCN as Critically Endangered (CR) species. This species has a restricted range in the Andean foothills of Amazonian slope of the eastern Andes of northern Peru in the regions of Amazonas and San Martin (lotters et al. 2002). So far, few data are known natural history of A. pulcher and there are records of his disappearance in some 1 localities of San Martín (lotters et al. 2005). 1 One of the main causes of the decline of amphibians in the Neotropical region is chytridiomycosis, caused by the fungus Batrachochytrium dendrobatidis, linked primarily to the rapid disappearance of many species of Atelopus (La Marca et al. 2005). Chytridiomycosis is often the only explanation for the disappearance of Atelopus frogs in pristine places like national parks, where habitat destruction, pollution and overfishing are not possible (La Marca et al. 2005). 28 Atelopus pulcher. Fuente del mapa: http://maps.iucnredlist.org/map.html?id=54544 Fishes - Streams and rivers draining the park contain unique species assemblages of fishes, particularly in headwater areas (Weber et al. 2002, Rengifo 2007 and Lujan et al. 2010). In the 2000 inventory, scientists recorded 22 new species for Peru and ten probably new to science. Some examples are Hipostomus fonchii, a new species recorded during the RBI, and restricted to the Cushabatay River Basin, Tahuantinsuyoa macantzatza which is restricted to the Aguaytia basin and its tributaries, and the Crossoloricaria Pisqui (Alverson 2000). 29 Map of the distribution of the Hipostomus fonchii (blue star) y Tahuantinsuyoa macantzatza (yellow star) Fuente del mapa: http://www.fishwise.co.za/Default.aspx?TabID=110&GenusSpecies=Tahuantinsuyoa_macantzatza&SpecieConfigId=231800#distribution Fishes in headwater areas are adapted to life in shallow, fast-flowing water. Aquatic habitats in the park also provide spawning areas for migratory species, including large species consumed by riparian human communities: Colossoma macropomum (gamitana), Piaractus brachypomus (paco), Prochilodus nigricans (boquichico), Brycon cephalus (sábalo cola roja), Brycon melanopterum (sábalo cola negra), Salminus affinis (sábalo macho), Pseudoplatystoma punctifer (doncella), Zungaro zungaro (zúngaro), large Loriicarids (carachamas), and Potamotrygon spp. (rays), among others. 30 1.3 Project Proponent (G4) Project Proponent: Centro de Conservación, Investigación y Manejo de Áreas Naturales – Cordillera Azul (CIMA-Cordillera Azul) Contact: Patricia I. Fernández-Dávila M. Address: Calle José Gabriel Chariarse 420, San Antonio, Miraflores, Lima 18, Perú Telephone Number: +51 1 2412291 Email Address: [email protected] Responsibilities: Coordinate and oversee all project activities including interactions with national, regional and local governments, communications and relationships with buffer zone communities, input and review of project documentation, data collection and project monitoring and mapping. 1.4 Other Entities Involved in the Project (G4) The following organizations assisted in development of the project documentation: Additional Project Participant: The Field Museum Contact: Debra Moskovits Address: 1400 S. Lake Shore Drive, Chicago, IL 60605 USA Telephone Number: +1 312 665 7431 Email Address: [email protected] Responsibilities: Provide technical, strategic and administrative support to all areas of the project as requested by CIMA. Additional Project Participant: TerraCarbon LLC Contact: Scott Settelmyer Address: 5901 N. Sheridan Road, Peoria, IL 61614 U.S.A. Telephone Number: +1-309-693-9303 Email Address: [email protected] Responsibilities: Provide technical assistance in the application of REDD methodologies and development of portions of the project documentation. This project has been implemented and managed by the Peruvian non-government organization (NGO) CIMA in collaboration with partners in Peru and the United States. CIMA’s experience is tightly linked to the effective management of PNCAZ. CIMA was created to provide institutional, technical, and financial support to the Peruvian government for the administration and management of PNCAZ. CIMA’s success in its initial pre-project pilot efforts led the Peruvian government to sign a 20-year management contract with the NGO for full management of the park, ranging from field activities to strategic planning. Although CIMA has had the management contract since 2008, PNCAZ is a national park and all park guards are part of the national park system overseen by SERNANP. CIMA has been providing funding for the park guards and control infrastructure and activities, working closely with SERNANP to design annual work plans, and monitoring all park guard operations. In coordination with SERNANP, CIMA has also been designing and being responsible for implementing the strategies for managing the park outlined in the Plan Maestro. 31 CIMA employs approximately 100 professionals, technicians, and park guards located in five offices and 18 guard posts and centers. The map below (Map 4) illustrates the park-guard posts and other CIMA infrastructure to date. These have not changed since the start of the project. CIMA heads the parkmanagement activities from its field offices in Tarapoto, Tocache, Contamana, and Aguaytia. CIMA’s Headquarters in Lima oversees the activities of all field offices and coordinates directly with the relevant offices of the national government. Decentralizing activities into the field offices allows CIMA to hire individuals from the different regions that surround the project area, promoting greater knowledge of, and better interactions with, local and regional communities and governments. Decentralization also allows CIMA to tailor programs and communications to reflect the needs of the communities and reduce travel times and cost. 32 Map 4. Locations of CIMA offices outside of Lima and PNCAZ park guard control posts and centers 33 CIMA staff has extensive experience in a variety of fields required by the project including finance, administration, law, anthropology, education, biology, forestry, mapping and GIS. An organizational chart is provided in Figure 3 below for the REDD project. Figure 3: Project Organizational Chart Director of Finance and Administration Executive Director Peruvian Government Contact (MINAM and SERNANP) Program Director Information and Data Specialists (2) Technical Advisors (The Field Museum and TerraCarbon) The personnel most directly responsible for the project and a brief summary of their responsibilities are listed below. Executive Director - Patricia I. Fernández-Dávila - Reviews project progress through quarterly and annual reports and internal meetings covering the budget, programs, and communications - Ensures the resources needed for the project are obtained either through hiring or training of CIMA employees or through collaborations with, or retention of, outside organizations - Represents CIMA in high level discussions and contracting with SERNANP, other governmental agencies, media, stakeholders and supporting organizations or contractors - Ensures CIMA operates in accordance with all applicable regulations Director of Finance and Administration – Jorge Aliaga - Oversees all aspects of the project finances - Ensures revenue distribution is in accordance with the agreed upon revenue-sharing plan - Monitors annual project budget - Oversees accounting - Oversees all financial audits - Oversees benefits and contracts for CIMA personnel ensuring compliance with applicable regulations and CIMA policies 34 Program Director – Cinthia Mongylardi - Oversees the implementation of the 20-year park management contract - Oversees all aspects of the project including strategy and project activity development and implementation - Oversees programmatic activities of all regional offices and interfaces with local and regional partners - Tracks project progress through personal involvement and review of quarterly and annual reports and internal meetings covering the budget, programs, and communications - Represents CIMA in discussions regarding the project with SERNANP, other governmental agencies, media, stakeholders and supporting organizations or contractors - Ensures coordination and communication among regional offices - Ensures coordination and communication between regional offices and Lima office - Provides local contact for SERNANP’s Park Director - Ensures coordination of park guard activities, including scheduling, supplies, safety, and other functions - Implements activities supporting the park management contract - Ensures the project operates in accordance with all applicable regulations Information and Data Specialist – Tatiana Pequeño - Oversees collection, mapping, analysis, and storage of project data including project monitoring - Manages programs supporting the REDD project reviewing the schedule, budget and effectiveness of the programs - Coordinates training for park guards and CIMA personnel as needed including the development of training tools and programs, obtaining funds for training, and securing qualified trainers - Works with GIS group responsible for interpreting satellite imagery, mapping information, conducting analyses, and providing reports - Represents CIMA in technical discussions regarding the project with SERNANP, other governmental agencies, media, stakeholders and supporting organizations or contractors - Participates in Mesa REDD network and Climate Change National Commission’s REDD Technical Group Information and Data Specialist – Jorge Luis Martínez - Oversees collection, mapping, analysis, and storage of project data - Develops monitoring or status reports for funding institutions, government and internal uses - Coordinates training for park guards and CIMA personnel as needed including development of training tools and programs, obtaining funds for training, and securing qualified trainers - Works with GIS group responsible for interpreting satellite imagery, mapping information, conducting analyses, and providing reports - Reviews field reports and prepares summary documents 35 Technical Advisor – Debra Moskovits - Has provided and continues to provide support to the Executive Director and Program Director including financial, technical, strategic, and administrative assistance since prior to the Park’s inception - Assists in development of project documentation and models - Assists in searching for additional experts as needed for project work Peru Government Contact – Lucia Ruiz Ostoic - Represents MINAM in discusses regarding the revenue sharing plan - Coordinates the integration of the pilot project into the national REDD effort As indicated, CIMA has been collaborating with a wide range of institutions that bring a complementary set of skills to implement management activities in PNCAZ and the buffer zone. CIMA works with these diverse institutions through a variety of relationships, including some collaborative agreements and contracts. The range of CIMA collaborators includes: Academic institutions: local, national, and international universities and museums, such as The Field Museum, Centro de Datos para la Conservación (CDC) of the Universidad Nacional Agraria La Molina (UNALM), Herbario of the Universidad Nacional Agraria La Molina (Herbario MOL), Centro de Conservación y Sostenibilidad Ambiental (CSA) of the Universidad Peruana Cayetano Heredia (UPCH), Museo de Historia Natural (MUSM) of the Universidad Nacional Mayor de San Marcos (UNMSM). Schools and training centers: Administrative educational units (Unidades de Gestión Educativa Locales, UGEL), elementary and high schools, professional institutes. Community-based organizations: Federaciones nativas (Native federations), APAFA (parents/teachers association), rondas campesinas (local vigilance groups), various community committees (sports, other interest groups). Authorities and different government organizations at the national, regional, and local levels (including institutions that review/approve CIMA’s initiatives, as with master plans for the park, and zoning efforts for the buffer zone); Provincial and District Municipalities; and the Regional Governments of Loreto, Huánuco, Ucayali and San Martín. The Field Museum has been a key collaborator since before the park was established in 2001. Field Museum scientists led the Rapid Biological Inventory used to demonstrate the critical biological and ecological importance of the area (Alverson et al. 2001), which resulted in the interest to create a national park and the documents necessary for establishment of the park. In addition, The Field Museum helped CIMA develop and implement the Index of Conservation Compatibility (ICC) (Pequeño 2007) and the community asset mapping methodologies (in Spanish, Mapeo de Usos y Fortalezas or MUF) (Del campo et al. 2007) that are integral to CIMA’s planned project activities. The Field Museum team also brings carbon offset project documentation and implementation experience and will continue to collaborate with CIMA. TerraCarbon’s team of forestry and modelling experts provided CIMA with support on quantifying the amount of avoided deforestation, measuring the park’s carbon stock and properly documenting the process. TerraCarbon also provided advanced training to CIMA’s information management and GIS team so that CIMA can be a full participant in the methodologies used in the project proposal and complete future monitoring and project documentation activities. In addition, Terra Carbon trained PNCAZ park guards extensively on the prism methodology used to measure carbon stocks (Shoch et al. 2009). This technical knowledge enabled park guards to participate in the initial carbon stock assessment, to 36 participate in the validation and verification process in 2012, and will allow them to engage in future monitoring as needed. The trained park guards can now train others in measuring carbon stock with prisms building capacity in Peru for accurate REDD data collection and monitoring. TerraCarbon also provides expertise in developing the revised VCS baseline module used for this project and assisting in the double validation process. The team is dedicated to being a resource for CIMA moving forward. 1.5 Project Start Date (G3) The project began on August 8, 2008 with the signing of the management contract. 1.6 Project Crediting Period (G3) The project crediting period is twenty years long extending from August 8, 2008 – August 7, 2028, because this is the length of the management contract between CIMA and the Peruvian government. The project lifetime is likely greater than 100 years because the project area is a legally recognized national park and the government has shown a commitment to ensuring it continues to be privately managed and protected. CIMA has been able to renew its management agreements each renewal period to date since 2002 as described in Section 2.2.1. CIMA expects to be able to renew its management contract when the current one expires in 2028. Both CIMA and the government have agreed that a portion of the revenue obtained from the sale of carbon credits will be used to establish an endowment for the park’s protection as outlined in Section 4.5.3. This endowment will fund CIMA’s or any other future management contract holder’s park protection activities. 37 2 IMPLEMENTATION OF DESIGN 2.1 Sectoral Scope and Project Type The project falls under Sectoral Scope 14, Agriculture, Forestry and Other Land Use. It is an unplanned frontier deforestation REDD project and is not a grouped project. 2.2 Description of the Project Activity (G3) The project’s primary objective is to prevent all deforestation in PNCAZ. 2.2.1 Pre- Project Activities The project zone represents a large, diverse area. Prior to the project’s start, CIMA needed to develop a relationship with the national, regional, and provincial governments, as well as with the immigrant and indigenous communities in the project zone. Without these relationships in place, CIMA would not been able to obtain the management contract or receive meaningful input from communities to design the project activities. CIMA’s initial agreement with INRENA was signed in 2002. In this agreement, CIMA agreed to support the management of the park and was given responsibility for developing and implementing a Plan Maestro in conjunction with INRENA. CIMA’s agreement was renewed every one to two years until the 20 year contract was signed in 2008. A Plan Maestro was approved for 2003 – 2008, which outlines the strategy for this period. Work focused on implementing traditional park protection, used by the government in other national protected areas, and on beginning to meet and get to know the communities in the buffer zone, to involve them in the implementation of the park. During this initial period the infrastructure for park protection, such as boundary signs and guard posts, was installed along the periphery of the entire park, and park guards were hired. At CIMA’s urging, applicants from communities surrounding the park were interviewed and ultimately selected to be park guards. CIMA began to introduce itself to the communities surrounding the park, recognizing the essential role of the local residents in the long term protection of the park. CIMA worked hard to build strong and trusting relationships with the communities, essential to designing a park-implementation strategy that would build on the cultural values and aspirations of villagers neighboring the park. As often occurs, especially in regions with a history of failed outside projects, the communities were at first wary of a new non-profit group working in the area. The limited nature of CIMA’s agreements before 2008 presented a serious challenge as CIMA was unable to plan for more than one or two years at a time or to discuss a long-term vision with the communities. At the same time CIMA was also developing a relationship with INRENA and the regional and local governments around the park. By remaining consistent in its messages, delivering on its promises, and staying in the region rather than abandoning it after a few months, CIMA began to build deep trust with the communities and with the many levels of governments. Based on the analysis of available information, including the 2003 MUF, CIMA identified the river basins invaded by illegal loggers inside PNCAZ, and prioritized the intervention in the following order: · Northwest Sector (Biavo and Alto Pauya) · Northeast Sector (Cushabatay and Bajo Pauya) · Southeast Sector (Pisqui) · South Sector (Santa Ana – Shambo) In the North and Southwest sectors, illegal logging inside PNCAZ was not on a large enough scale to demand implementation of a structured strategy. Park guards designated in these areas were responsible for developing specific control actions whenever they encountered any illegal logging. The objective of the intervention—whether as a structured strategy or in isolated incidents—was to remove the illegal loggers in a peaceful manner by working directly with the illegal loggers and collaborating tightly with local communities. The program was devised by the Park Head and CIMA and 38 deployed local park guards and community assistants in targeted patrols, direct communications with the illegal loggers to organize their departure, and monitoring after the illegal logging activities were removed to ensure that no logger returned. Between April 2003 and November 2006, all illegal logging camps were dismantled peacefully. The watersheds are now free of illegal logging and both ground patrols and aerial surveillance have confirmed that the loggers did not return to the park. (Rubio 2007) This important groundwork laid the essential foundation with the communities and local governments that enabled the project to begin with effectiveness and high probability of long-term success. In August 2008, CIMA was granted a 20-year full management contract by INRENA. CIMA was no longer a technical advisor, but was now the responsible party for financing and managing the park and buffer zone for the next twenty years. This was the first time a contract of this nature and magnitude had been granted by INRENA for a national park, and the contract would not have been possible without the enormous work CIMA had conducted in the area and the close relationship developed between the two organizations for the initial five years, pre-project. 2.2.2 Planned Initial Project Activities With its new role as the full manager of the park, CIMA planned the following activities for the project beginning in 2008 and 2009 as stated in the validated PD. Table 2.1. Planned Initial Project Activities Activity Location 2008 2009 1. Park protection activities a. Current signage, park guard stations and control posts will be evaluated and expanded as appropriate. See Map 4 - perimeter of the park X X b. Signs and park guard stations will be maintained. See Map 4. - perimeter of the park X X PNCAZ (San Martin, Loreto, Huánuco and Ucayali); All CIMA offices X X d. The communal park guard program will be expanded. 1. Communities in the Aguaytía, Pisqui, Cushabatay and Chipaota valleys (indigenous communities) 2. Other communities near park guard checkpoints and shelters who wish to participate X X e. Park guard reports will be sent to both CIMA’s Tarapoto office and SERNANP. See Map 4., reports come from each checkpoint and shelter X X Lima (CIMA and MINAM attorney), Tarapoto (CIMA) and San Martin (Municipality of Bellavista) X X c. f. Strategies of protection and control inside the park will be updated and modified as needed A strategy for legally removing the cattle rancher from inside the park will be coordinated with SERNANP and steps will be taken to implement the strategy 39 g. Begin drafting a new Plan Maestro Lima, with support from all CIMA offices, SERNANP and communities in the buffer zone h. Begin quarterly reports to SERNANP to summarize CIMA’s activities Lima with information from all CIMA offices (Tarapoto, Contamana, Tocache and Aguaytia) X X 2. Buffer zone activities a. Implement the Zonificación Ecológica Económica in the districts of Shamboyacu, Pólvora, Campanilla y Alto Biavo; including 15 towns (centros poblados) and 1 indigenous community in the four districts. Shamboyacu, Pólvora, Campanilla and Alto Biavo districts b. Design a comprehensive extension strategy for involvement of buffer-zone communities in protecting the park. All CIMA offices (Lima, Tarapoto, Contamana, Tocache and Aguaytia) c. Analyze the 2008 MUF data to gather the socioeconomic information needed to plan activities and update the Plan Maestro. X X Tarapoto CIMA office X d. Implement Classroom in Action primary education modules in 3 towns in Shamboyacu. Shamboyacu district X e. Renew agreements with the UGELs (Education Districts) of Tocache, Contamana, and San Martin to continue working formally with the schools in these areas on environmental education. Tocache, Contamana, and San Martín X Tarapoto CIMA office, to be distributed mainly to the UGELs (Education Districts) of Tocache, Contamana, and San Martin X g. Implement a community outreach program: RARE Tarapoto CIMA office, to be implemented in Shamboyacu district, San Martin X h. Hold regional community meetings to identify regional land use and quality of life 20-year visions. Tarapoto, Tocache, Tingo María, Aguaytía, Contamana, Iquitos X f. i. Publish two formal environmental education guides: Classrooms in Action and Protecting Our Watershed. With the input from the meetings, identify community-wide activities that will achieve the goals of the communities, diminish deforestation in their lands, and avoid deforestation in PNCAZ, and define the best means to scale the pilot projects up to community or region-wide efforts. All CIMA offices (Lima, Tarapoto, Contamana, Tocache and Aguaytia) 40 X X X X j. Continue to gather data on the individual community characteristics, composition, backgrounds, values, and activities to inform, update, and revise activity planning. 89 2008-MUF communities and population centers and any new population centers X a. Relationships with local, regional, and national governments will be maintained and expanded strategically Lima (national government), San Martín, Ucayali, Huánuco, and Loreto (regional and local governments) X X b. CIMA will identify ways to support the government agencies in processing information, raising awareness of laws and regulations, and identifying threats to PNCAZ Lima (national government), San Martín, Ucayali, Huánuco, and Loreto (regional and local governments) X X Lima (national government), San Martín, Ucayali, Huánuco, and Loreto (regional and local governments) X X 3. Government agency relationships c. CIMA will continue to advocate for the park as necessary to mitigate threats from new roads; logging, mining, or oil concessions, and other impending events 2.2.3 Project Activity Implementation As planned in the PD, one of the very first project activities conducted was regional meetings with the communities to determine their vision for the future and solicit their input in developing specific activities. Out of these workshops came a set of three goals and associated sub-goals and activities. These were included in the Plan Maestro for 2011 – 2016. A companion document to the Plan Maestro outlines the updating process including the socio-economic and environmental information as an input to generate management strategies. Although the Plan Maestro was not officially published until 2011, CIMA had received SERNANP’s agreement on the content and began implementation well before the final document was published. As a result, the goals, sub-goals and activities presented in the Plan Maestro represent the project’s goals and activities for 2009-2016 and almost of these activities were begun in 2008, 2009, 2010, and 2011. These activities include continuation of some activities listed above as well as new activities developed from the feedback of communities and the evaluation of completed activities. 41 Goal 1: Strengthening the protection strategy for the park. Sub-goal Supporting Activities Enhance the prevention of illegal activities within PNCAZ and ensure the recovery of degraded areas 1. Monitoring through satellite images 2. Development of a plan for patrols to prevent incursions and invaders in the park 3. Field visits to verify recovery of degraded areas 4. Maintenance of patrol infrastructure Ensure resource use inside the park conforms to the Park zoning and the usage rules while respecting traditional uses by indigenous people and establishing consensus on appropriate uses with buffer zone communities 1. Review current approved uses for traditional communities 2. Monitor compliance with approved uses 3. Implementation of a plan for patrols to prevent activities not permitted inside the park Strengthen the involvement of organizations, authorities and local people in the control and surveillance systems for the park and buffer zone 1. Conduct training with local organizations and authorities on security and surveillance issues 2. Promote dissemination of lessons learned and share experiences among groups 3. Evaluate the advantages and disadvantages of the current communal park guard system, and implement the recommendations from the evaluation Goal 2: Using a participatory model to engage local communities and other stakeholders in the management and financial sustainability of the park. Sub-goal Project Activities Strengthen the participatory management model for PNCAZ 1. Coordinate planning to ensure the park management team shares their work schedules and evaluate work plans together 2. Develop and promote mechanisms for ongoing communication among parties involved in managing PNCAZ 3. Present experiences to colleagues in large-scale events 4. Coordinate with the Comité de Gestión (CG) to develop and implement the Plan Maestro Plan resources effectively to manage PNCAZ 1. Develop and implement a Plan de Control y Vigilancia, with proposed routes for park guards and locations of control posts 2. Implement the plan for the maintenance and management of infrastructure, property and equipment 3. Select, hire and strengthen capacities to ensure qualified personnel Ensure there is a consolidated system of production, dissemination and exchange of information regarding PNCAZ and the buffer zone 1. Implement the communications strategy 2. Publish reports on activities of PNCAZ institutional actors involved in the protection of the park and buffer zone 3. Implement information campaigns by sector 4. Update web pages 5. Present the experience of participatory management in PNCAZ 42 Ensure the financial sustainability of PNCAZ through projects aimed at supporting the activities concerning the management of the park and its buffer zone 1. Design and implement REDD+ project at PNCAZ including the modeling and monitoring required 2. Establish a network of cooperating institutions interested in strengthening the park’s management Promote scientific research in the park and its buffer zone to obtain relevant information for decision making in the area 1. Maintain updated databases and promote use of research results 2. Promote PNCAZ as an opportunity to develop research through presenting results at conferences, workshops, and courses 3. Strengthen ties with academic institutions Goal 3: Building local capacity for sustainable land use and improving the quality of life in the buffer zone communities. Sub-goal Project Activities Promote participatory processes for zoning and land use plan development that use both technical and local knowledge to enhance understanding of larger-scale processes 1. Promote delimitation of population centers 2. Lead development of ecological and economic land-use zoning processes, using a participatory tool called Zonificación Participativa Comunal – ZPC Promote economic activities for local people as part of land management processes 1. Identify economic activities compatible with zoning with communities, as a part of the Communal Strategic Plans, 2. Provide linkages with larger-scale processes that develop in the buffer zone (meso and macro zoning) Strengthen capacities of local people, authorities, local organizations and other actors in decision making aimed at the conservation and sustainable development, strengthening its cultural identity 1. Conduct environmental education programs in communities 2. Strengthen local organizational capacities 3. Develop plans for quality of life (Communal Strategic Plans) compatible with land use 4. Support development of conservation initiatives at local levels Almost all of these activities were begun during the August 2008-2012 monitoring period. Most of the activities are long-term activities and continue to be ongoing even after initial implementation. Specific updates on activities that have not yet started, have taken longer than expected, or that may require clarification are provided below. The next section presents an overview of the park protection and buffer zone activities with communities. These summaries discuss how activities evolved year by year during the monitoring period. Goal 1: Sub-goal: Enhance the prevention of illegal activities within PNCAZ and ensure the recovery of degraded areas Activity: 3. Field visits to verify recovery of degraded areas The degraded areas referenced in this activity are the areas inside the Park that were deforested by illegal loggers, farmers and ranchers prior to the project's start. Per CIMA's discussions with SERNANP, these areas are being left to recover on their own, given the small size of the disturbances and the ample 43 regeneration potential from the surrounding healthy forest. Monitoring conducted from 2008-2012 shows that the areas are recovering as expected. There are multiple means used to monitor the recovery of these areas. The first is an annual review of aerial imagery which can be used to track regrowth. An example of the imagery used is provided below (Figure 3b). Summaries of the reviews are provided each year in the Park’s annual report to SERNANP as this is one of the indicators that must be included. The second method of monitoring these areas is through direct inspection by park guards. The park guard patrol routes were designed to ensure these areas could be visually inspected as part of the regular monthly or annual patrols. During these inspections, park guards look for signs of incursions in the areas previously deforested and also look for signs of selective logging in the areas previously degraded by the illegal loggers. Any findings from the inspections are included on the daily park guard reports that will prompt immediate intervention action if required. The final method for monitoring these areas is also based on field-monitoring. If settlements, crops or other incursions are identified near one of these areas, additional special patrols are added to inspect the formerly deforested or degraded areas. 44 Figure 3b: Example of monitoring for degraded area recovery - Las Palmas Sector (2003, 2007, 2013) Dirt road for logging Cattle ranch of 20 ha In process of natural regeneration In process of natural regeneration Abandoned agricultural areas r In process of natural regeneration Sector Las Palmas (distrito Alto Biavo, provincia Bellavista, departamento de San Martín) Sector Las Palmas (distrito Alto Biavo, provincia Bellavista, departamento de San Martín) Name of image: MET_20030925_007_065_V11.tif Name of image: REPARADO_20070515_007_065.tif Name of image: LC80070652013199.img Satellite: Landsat Satellite: Landsat 5 Type: Landsat 8 Image date: September 25,2003 Image date: May 15, 2007 Image Date: September 9, 2013 Band combination: 752 Band combination: 543 Band combination: 762 45 Sector Las Palmas (distrito Alto Biavo, provincia Be departamento de San Martín) Goal 1: Sub-goal: Ensure resource use inside the park conforms to the Park zoning and the usage rules while respecting traditional uses by indigenous people and establishing consensus on appropriate uses with buffer zone communities Activities: 1. Review current approved uses for traditional communities 2. Monitor compliance with approved uses The review of current approved uses (especially hunting and fishing) for traditional communities has not yet taken place. This will take place in 2013 or 2014 in conjunction with the buffer zone communities. The review will focus on whether the traditional uses currently approved continue to be appropriate or whether changes should be made. Changes might be made based on additional uses needed or to provide support for community established rules such as bans on hunting certain species. Monitoring with currently approved uses is ongoing but monitoring with any revised uses will not be able to take place until the revision occurs. Goal 1: Sub-goal: Strengthen the involvement of organizations, authorities and local people in the control and surveillance systems for the park and buffer zone Activity: 3. Evaluate the advantages and disadvantages of the current communal park guard system, and implement the recommendations from the evaluation This is scheduled for 2013 and will be conducted in coordination with the Park Head. Goal 2:Sub-goal: Strengthen the participatory management model for PNCAZ Activity: 4. Coordinate with the Comité de Gestión (CG) to develop and implement the Plan Maestro The CG has participated in the development of the Plan Maestro but has not yet been fully integrated into the implementation of the Plan Maestro; however representatives from the CG participate in the Comisión de Seguimiento of the management contract. Not all members of the CG represent Primary Stakeholders, and therefore not all members have been equally trained regarding the REDD Project. The CG’s role will continue to increase following the implementation of the Secondary Stakeholder Communication Plan. Once all primary and secondary stakeholders are introduced to the REDD project process and the project activities, the CG will be able to play a greater role as an organization. Goal 2: Sub-goal: Plan resources effectively to manage PNCAZ Activity: 2. Implement the plan for the maintenance and management of infrastructure, property and equipment Park protection activities have not changed greatly during the monitoring period. The focus of this activity has been to maintain signs, control posts and park guard equipment. The conditions in the field are inhospitable to many delicate pieces of equipment. Equipment is often damaged or lost during routine use. To date, the project has not yet begun to receive revenues from the sale of carbon credits and is continuing to rely on bridge funding. The length of time needed to obtain REDD income for the project 46 has extended far past initial project estimates. Fortunately, the current funding allows the project to continue its activities but does require careful priority setting for which equipment to replace and maintain. The project has placed highest priority on equipment relating to safety, delineation of the park boundaries, and items without which personnel cannot complete their tasks. Control posts, shelters, park limit signs and equipment used for transportation and communication, such as GPS units and radios, receive first priority for replacement or repair. Additional equipment such as cameras and binoculars were initially provided to all park guards but are replaced or repaired as funds allow. These items help park guards perform their duties but are not essential for careful and consistent execution of park protection and monitoring activities. For example, park guards can document illegal incursions through collection of physical evidence or confiscation of illegally hunted game or timber. When park guards have not had cameras, there has been no associated decline in the reporting or recording of incursions. In fact, in some instances, having cameras has caused the confrontation between park guards and incursion parties to become more hostile as the individuals want to steal the camera or memory card. Similarly, lack of binoculars has not changed the detail or quantity of biodiversity monitoring. Most park guards are from the areas they patrol and have grown up identifying flora and fauna by sight and sound without the use of binoculars or other aids. As more funding becomes available, additional equipment will be provided and will be able to be replaced more frequently. It is anticipated that additional REDD funding will be available to the project in 2014. Goal 3: Sub-goal: Promote economic activities for local people as part of land management processes Activities: 1. Identify economic activities compatible with zoning with communities, as a part of the Communal Strategic Plans, 2. Provide linkages with larger-scale processes that develop in the buffer zone (meso and macro zoning) These project activities have evolved over time based on the effectiveness of the intervention and the commitment of the communities to building a sustainable community. Please see the summary of the buffer zone activities later in this section for an overview of the intervention model used and how it has changed during the monitoring period. The intervention process, similar to any social process, is slow and long term. The project is working towards generating all the desired changes of attitude and implementing all steps of the intervention model throughout the buffer zone. It is the long-term partnership between CIMA and each community that ensures the sustainability of the work and the conservation of the park in the long term. The gathering of initial social and physical environment data from communities requires a tremendous investment of time, resources and commitment from the project team. However, this investment allows mutual trust to develop between the project team and the communities and provides the knowledge foundation on which all subsequent steps must be based for long-term success to occur. Without this first intervention step, project activities for each community could not be meaningfully developed that tie communities to a larger-scale process or allow them to define what quality of life means for their community in a participatory manner. If there is not a sufficient social and organizational base and the support of organizations, institutions, and external authorities, planned activities will be developed that are isolated, are not supportive of a greater vision for the community and are not sustainable. The initial efforts have resulted in a noticeable change in the attitude of the communities regarding the importance of conserving the forest and managing use of their lands to have a positive impact on their quality of life. The changing attitudes in the communities are manifested in actions by the communities and communal decision-making based on the knowledge of the territory and a communal reflection to identify and promote activities that are sustainable and productive in the medium and long term. 47 Another key step in the approach is the community strategic planning process. This step has been completed in nearly 12% of the communities the project is currently working with. Additional communities are in the process currently. It is not expected that all communities in the buffer zone will have completed all intervention steps before the expiration of the current Plan Maestro in 2016. Instead, the team will ensure that sufficient time is spent with each community. CIMA continues to identify ways to streamline and consolidate the time-consuming process of developing excellent relationships with communities so that more communities can be included in the project. CIMA’s strategy has been successfully replicated in new communities but is currently limited by funds and the size of the team available to work with such a large number of communities over such a large geographical expanse. CIMA has had to prioritize communities based on their proximity to the park and the potential threats for deforestation. Another limiting factor is the amount of time it takes to develop the trusting relationship and community self-reflection on which this model is based. Initial project schedules significantly underestimated the length of time and resources needed for each step. But the results of the strategy have been exceptionally strong and CIMA will continue to pursue ways to build sound relationships in the entire buffer zone. Appendix 2 provides a tabular summary of the activities conducted with communities through the end of the monitoring period. As additional funds become available following the sale of carbon credits, CIMA’s field resources will be expanded allowing for work with additional communities. All other activities have occurred during the timeframe of this monitoring period. Summary of Park Protection Activities The approach to park protection has not changed over the four year monitoring period. The activities performed each year remain the same. The system of park guard control posts and routes remains the same and is being maintained. The park guards’ routes are defined but special patrols are done periodically in response to potential threats being reported. There are 18 control posts and park guard centers on or near the border of the project area, and routine park guard patrol routes total more than 2 thousand km (544.6 miles ) within PNCAZ. The total area to be routinely patrolled is located closest to communities with potential access to the park (i.e. highest potential pressure area for illegal harvest) and totals 1,779,984.7 ha (507,364.2 acres within PNCAZ), the density of patrol trails in the monitored area 2 within PNCAZ is 1 km per 10 km (see Map 4, for the location of patrol areas and park control posts). Feedback from park guards and CIMA has been used to improve and streamline the reporting system. Park guards continue to document key species observed (sightings or tracks) during their patrols to monitor the project’s impacts on biodiversity. The park guard’s role in biodiversity monitoring is evolving in 2013 and 2014 as new trainings and collection procedures have been identified and implemented. This is discussed further in the biodiversity monitoring section. Similarly park guards report any signs of illegal uses of the park found in the park or buffer zone. 48 Map 5. Location of areas monitored by Park Guards: Patrol trails, patrol areas, and control posts 49 Summary of Buffer Zone Activities The buffer zone activities are designed to slow or stop advancement of the agricultural frontier. Assisting communities in land-use zoning and development of sustainable agricultural practices allows families to use their land in ways that reduce erosion or depletion, permitting them to remain in the same location rather than move on and deforest additional lands every few years. Land tenure also helps stabilize land use: families with clear, uncontested title to their land are much less likely to migrate or deplete their soils. Developing specific activities for different communities requires close coordination with each community to ensure that the activities implemented address the threat of deforestation and at the same time, are closely aligned with the communities’ social, cultural, and economic values. Activities that do not align with the communities’ values do not lead to sustainable results. CIMA conducted pilot programs prior to the project beginning to learn which techniques work best in the region and to develop an understanding of community responses. In addition, CIMA has collected a significant amount of data on the characteristics of the communities. These efforts, combined with the significant amount of community input planned gathered over the first six months of the project, ensures that the project activities were designed and are continued to be designed to have the greatest possible positive impacts for communities and for avoiding deforestation. Given the size of the project region (equivalent to the state of Massachusetts), it was not possible for CIMA to work with all communities in the buffer zone from the start. Instead, CIMA focused its efforts initially on communities located in “critical areas,” which are characterized by their proximity to the park, ease of access into the park (using rivers, foot paths, or old logging roads), historic deforestation rates, or areas that represent a threat to communities because of illegal activities (including coca). Critical areas will change over time as new threats emerge or existing ones are mitigated. To be most efficient and cost-effective, CIMA will reassess the location of critical areas periodically. Since the project began, the use of the phrase “critical areas” has been phased out and replaced with “intervention areas”. Intervention areas are the critical areas plus areas where communities need assistance completing processes already begun. The terminology change was made to reflect CIMA’s ongoing support to communities even after the immediate threat was mitigated. While specific activities conducted in each area have evolved over time, the intervention areas have not been redrawn since the project began. (see Map 6). As CIMA works with each community in the critical areas, extension agents build local capacity in landuse zoning, working with local governments on infrastructure processes, and implementing and maintaining ecologically compatible agricultural practices. CIMA’s programs are designed to be facilitative in nature, allowing communities to guide the process and develop competencies. Once both CIMA and the community are comfortable with the level of competency and sustainability of the programs, CIMA will move to new communities. At no time will a community be “abandoned” by CIMA. CIMA will continue to lend support to communities as appropriate, with the goal of creating selfsufficiencies. The identification of new or growing threats may bring additional communities into priority intervention status. 50 Map 6. Location of Intervention Areas in the buffer zone 51 Evolution of Buffer Zone Activities CIMA’s work in the buffer zone has evolved over the monitoring period as CIMA was able to evaluate the effectiveness of its activities and learn new techniques and participatory processes. Based on its work in the region prior to the project’s start in 2008, CIMA initially focused on five strategies for stabilizing land use and improving quality of life in the buffer zone: Environmental Awareness, Strengthening Organizations, Strengthening Technical Support for community efforts, Monitoring and Evaluation. During this time, CIMA developed a number of conservation agreements with communities in line with the customary and traditional uses in the region where communities committed to using their resources in a sustainable manner. These agreements also include commitments by local people to participate in supporting the protection of PNCAZ (park guards and control posts), and their own resources in the buffer zone (rural patrols, self-defense committees). In 2009 and 2010, CIMA began a formal strategic planning effort with communities building on the efforts of the educational programs. Quality of Life plans specific to each community began to be developed allowing CIMA and the residents to better define the community’s needs and future desires and identify how these related to the park’s conservation and economic sustainability. These plans included setting objectives in three aspects: a. Strengthening local organizational capacities. b. Technical assistance and improving coordination for sustainable productive economic activities compatible with land-use zoning in the individual community, as well as coordination between communities with similar activities and values to reduce deforestation in the buffer zone and consequently contribute to improving the local quality of life. c. Consulting for communities to support their efforts to work with public or private institutions on local conservation, restoration or zoning projects. In 2011, CIMA’s leadership revised its strategy after a process of internal evaluation, developing an intervention model (Figure 4), called FOCAL, for its acronym in Spanish (Modelo para el Fortalecimiento de Capacidades Locales para la Gestion del Territorio y la Mejora de la Calidad de Vida), based on participatory thinking and information generation processes (diagnostic) which has helped to develop synergies among members of the same community; between the communities and its authorities; and between the communities and the park’s management, enabling both sides to settle their differences and include their agreed views in their strategic plans (Quality of Life Plans). This intervention model allows for more rapid implementation of these processes in intervention areas. 52 Figure 4. CIMA – Cordillera Azul FOCAL Model for intervention This model is based on the most successful participatory methodologies and tools CIMA had used previously and contains the following stages: (1) Development of the Baseline: the socioeconomic baseline with the Uses and Asset Mapping, or MUF (Mapeo de Usos y Fortalezas) also for monitoring and update information; and the geographical baseline using the Participatory Community Zoning, which is a tool that facilitates bringing contrary community positions and interests closer to each other, defining a knowledge-based consensus-built integrated management of their territory) to inform the next steps, (2) Development of Community Rules where the community produces and agrees to a set of rules of conduct (Normas de Convivencia)in order to meet their traditional domestic and social needs while integrating conservation and protection of the land and its resources. The results are communal arrangements that achieve stability within populations and lead to concerted community planning. (3) Development of a Quality of Life Plan, referred to the community strategic plans, which are developed on the basis of their own communal vision. (4) Implementation of the Strategic Planning in each community, bringing support in three fundamental aspects (same described above, development in 2009-2010): Organizational, Technical and Managerial Strengthening; but in the intervention model framework. CIMA guides and supports the communities through the process but the communities have an active role that grows with each step, resulting in local authorities and community organizations providing the leadership for ongoing activities. Other Project Activities 53 In the fourth quarter of 2011 and first quarter of 2012, a new MUF was conducted to continue the process of updating information on the socioeconomic conditions of the communities and neighboring towns to PNCAZ. The information resulting from MUFs is continuously being analyzed and compared to previous data, allowing CIMA to have a clear idea of the current situation of the communities. This latest MUF was designed to simplify the information gathering process and continue to involve as many people from the communities as possible. As described in the PD, facilitators were from the local communities and focus groups were used to ensure the entire population was represented. In 2012, social, biodiversity and climate monitoring events also took place. A discussion of these efforts can be found later in this document. The results of all monitoring events will be made available to stakeholders either through direct emailing or availability for review in the CIMA offices. In 2009, the cattle rancher inside the park expanded his operations in violation of the law and his agreement with CIMA and SERNANP allowing him to remain inside the park. This forced the Park Head and CIMA to develop a plan for his removal (Salazar 2009). In 2010, CIMA provided all requested documentation to a lawyer from the Peruvian Ministry of the Environment - MINAM (Oficio Nº 008-2010SERNANP-PNCAZ, with a request from SERNANP to begin the judicial process) to have the rancher legally removed from the park. The legal paperwork was filed during the third quarter of 2011 and MINAM initiated the legal process of removing the cattle rancher, which continues to date. The Juzgado Mixto de la Provincia de Bellavista published notices in the official El Peruano newspaper and in the popular daily newspaper in San Martín. In 2012 the Juzgado Mixto appointed a lawyer (curador procesal) since the rancher had not appeared in court. The lawyer continues to work to remove the rancher from PNCAZ. When he is removed, the rancher will be provided similar, suitable, already cleared land in the buffer zone for his use. 54 2.3 Management of Risks to Project Benefits (G3) CIMA has worked and will continue to work actively to mitigate these potential threats as detailed below each risk. Concessions in the buffer zone – The Peruvian government has granted timber, mining, and oil concessions in the buffer zone. Not all of these concessions are active but the concession owners do have the right to use the land. While these concessions are not in the park directly, they pose a risk to the park. Threats to the park may result from illegal operations in or misuse of the concessions, resulting in deforestation or pollution within the park and displacement of immigrants who move closer to or into the park, increasing pressure in the area. Mitigation strategy: CIMA has continued to build relationships and work closely with local, regional, and national government entities to monitor concession activities. In addition, CIMA has raised awareness of laws and regulations in the communities to enable community members also to monitor and report illegal activities to the proper authorities. CIMA has worked on strengthening forest control by supporting the rondas campesinas and park guard patrols in the buffer zone. CIMA’s process of land use zoning incorporates the forest concessions in order to strengthen rights of land use in the buffer zone. Lack of land tenure in the buffer zone – As discussed several times in the PD, most individuals in the buffer zone do not own their land. This results in immigrants having only weak ties to a specific location and no motivation to remain as erosion and soil depletion occurs. Instead they move to a new location. This advancing agricultural frontier presents one of the most severe threats to the park as waves of immigrants advance their deforestation and erosion-provoking practices closer to and eventually well into the park. Mitigation strategy: CIMA has worked to train local community members in sustainable land-use practices; to facilitate land-tenure processes; to ensure constant communication with as many communities as possible, and to strengthen and improve the quality of life in the communities. CIMA’s process of land use zoning incorporates the border definitions of communities in order to strengthen rights of land use in the buffer zone. Illegal activities in the buffer zone – Illegal activities in the buffer zone place additional deforestation pressure on the park by increasing deforestation in the buffer zone and pushing immigrants closer to and eventually into the park. Mitigation strategy: CIMA has raised awareness of laws and regulations in the communities to enable communities to also monitor and report illegal activities to the proper authorities. Because many illegal activities are driven by a need for additional resources, CIMA has worked to train local communities in sustainable land-use practices; to facilitate land-tenure processes; to ensure constant communication with as many communities as possible, and to strengthen and improve the quality of life in the communities (as mentioned above). Increased tensions between communities CIMA is initially working with and those that will be worked with in the future – There is a possibility that communities not located in the intervention areas will become jealous of the communities that have received priority. On the one hand, this would indicate a major success in that jealousy will only arise if CIMA’s activities are perceived as having value and improving the quality of life for buffer zone communities. On the other hand, increased tensions might be a negative issue and may pose a risk to the project if raids or land grabs occurred as a result. For example, some communities may become jealous of others who have been formally granted land tenure or zoning. Mitigation strategy: CIMA has worked to ensure constant communication with as many communities as possible to identify and address concerns as quickly as possible and to institute a strong, proactive communication program and complaint-resolution process. CIMA will never be able to work with all communities simultaneously but these measures will assist communities in understanding the prioritysetting process and to be able to voice concerns. The design of the project, including the government’s commitment discussed above and the project activities--emphasizing land tenure and sustainable land-use practices in the surrounding areas, and the creation of an endowment to ensure continued funding for park management activities well after the project’s end--serve to ensure the project’s benefits last beyond the project’s lifetime. The project area is 55 a national park so it will continue to have a SERNANP approved Plan Maestro beyond the project lifetime, which will outline activities and indicators that must be monitored and reported upon. CIMA has worked diligently to ensure that community indicators are included in the Plan Maestro for PNCAZ and this provides a means for community impacts (both positive and negative) to be monitored beyond the lifetime of the project. 2.4 Measures to Maintain High Conservation Values (G3) This project is a conservation project designed to maintain the project area’s High Conservation Values (HCVs) identified in PD Section 1.10.7. All of these activities will maintain the HCVs of the project area through physical preservation of the standing forests, communication with and engagement of the surrounding communities, and more sustainable land-use practices in the buffer zone. 2.5 Project Financing (G3 & G4) The validated financial plan has been used successfully to manage the project. Expenses and precarbon credit project funding have both been in line with projections and funding has remained stable. A current financial spreadsheet will be provided to the verification body for review. CIMA places a great emphasis on efficient and responsible use of resources including funds. Budgets, whether at the organization or project level, have been carefully monitored and reviewed through a series of tools. The Director of Finance and Administration closely monitors spending against approved budgets using a series of spreadsheets, regularly meets with project managers and provides reports to the Executive Director. The spreadsheet tools also allow the Director to identify trends in spending and make suggestions regarding improvements or best practices that can be shared across CIMA. Administrative procedures guide employees on financial matters including procedures on managing funds, expenses, cash advances and reimbursements. Oversight from donors provides an additional level of assurance that CIMA is fiscally responsible. An annual audit by an independent, USAID-selected auditor was conducted during the monitoring period along with two additional audits in 2011 by Watu/AEDIC. CIMA also conducts annual internal audits. When audits have findings, CIMA corrects the identified issues and implements measures to prevent the error from occurring again, as it has to date. 2.6 Employment Opportunities and Worker Safety (G4) For this project, CIMA continues its policy of recruiting professionals, technicians and others from the local communities they represent. The hiring policy outlines the general process and emphasizes that CIMA does not discriminate on any basis. The policy is included in the Internal Work Regulations. In the case of parkguards, CIMA usually makes all selections in tight coordination with the Park’s Head (Jefatura, SERNANP). Each position is advertised in multiple ways such as postings, social media announcements, and word of mouth in the communities to solicit as many applicants from as many backgrounds as possible. Applicants for park guards are accepted with a variety of backgrounds, considering minimal/basic knowledge and skills as long as they are willing and able to learn the skills necessary for the position. This provides a means for women, underrepresented minorities or other groups to have a fair chance for employment as well. For example, current park guards include former teachers, hunters, farmers, and a wide variety of other occupations. The minimum criteria for application are included in the announcement as well as the criteria for selection to ensure that the hiring process is understood by applicants. The criteria for selection depend on the specific position open. If applicants feel that unfair hiring practices have occurred, they are able to use the conflict resolution process described in Section 2.7.3. New employees attend an orientation appropriate to their position called “induction”. A training matrix has been developed to identify the type of training required for each position. Training of administrative and other personnel in Lima usually is conducted by the appropriate supervisor or team member. In the case 56 of field staff, such as field technicians and park guards, this orientation includes training in both the classroom and the field, and is conducted by CIMA personnel. CIMA and the Park’s Headquarters coordinate the training for all field, office, and park-guard personnel. Outside experts may be hired to train the team depending on the desired subject, such as the prism method for measuring carbon stock in the forest. Park guards attend training programs that include: Functions and Protocols of park guards, First Aid and Wilderness Survival, GPS and Cartography, Legal, Biodiversity, and Monitoring training among others. The training allows them to work more safely and enables them to provide assistance in their communities when emergencies occur. If employees desire additional training, they can request it from the field offices or Headquarters to be planned as possible depending on the topic, cost, and schedule. Periodic trainings have been conducted as refreshers, or to introduce new topics identified by Headquarters or the field offices. Cross training has been occurring as practical to ensure skills and project knowledge is retained in the event that personnel leave the project team. When needed - as in the case of soil analysis or forest evaluations for land zoning work in communities - CIMA’s network of professionals has been used to bring in outside experts to fill gaps while in-house personnel are trained. CIMA promotes the safety of all of its employees through (1) security protocols that include measures to prevent and respond to threats of violence or robbery and social unrest, accidents or illness, and natural disasters and (2) training and appropriate equipment such as facility location, first-aid kits including antivenom serums, GPS, and radios for park guards. In areas where employee safety may be at greater risk due to narcoterrorism or similar activities in the region, CIMA minimizes these risks by establishing offices and park guard stations in populated areas. During trainings, regional differences have been identified if appropriate to ensure all employees are knowledgeable about their potential risks and appropriate preventive actions. In addition, park guards use a system of daily reporting by radio to the Park Headquarters to ensure that all guards are present and safe and that any new risks or threats in the region are identified. CIMA’s security protocols are extensive and cover a wide range of potential risks from natural disasters to injuries to animal attacks to kidnapping. All employees receive specific training on the protocols relevant to their positions and are given access to all protocols. This serves to lower the risk of all CIMA field activities and allows technicians and park guards to assist communities in times of emergencies as well. 2.7 Stakeholders (G3) Two groups of stakeholders have been identified for the project: primary stakeholders are those with direct involvement in the project area. Secondary stakeholders are those in the buffer zone, who may be affected by some project activities but do not reside or have rights in the project area. 2.7.1 Primary Stakeholder Involvement Primary stakeholders were involved in project design and are knowledgeable about the project. Their names and their contact information are noted in Table 2.2. 57 Table 2.2: Primary Project Stakeholders Primary Stakeholder Contact Position Ministry of the Environment, Peruvian National Government Lucia Ruiz Ostoic SERNANP Pedro Gamboa Head PNCAZ Frank Oyola Head Regional Environmental Authority, San Martín Conservation, Management and Sustainable Use Program of Loreto’s Biodiversity (PROCREL), Loreto Moore Foundation USAID Advisor to the Minister Contact Information Oversees SERNANP, the national authority for protected areas Establishes environmental policies [email protected] (including REDD and other payments for ecosystem services) Leads the nested REDD approach with projects Oversees the implementation of CIMA’s contract, approves the Plan Maestro [email protected] and designates the Chief of the park Oversees ecosystem-service-payment policies in protected areas [email protected] Oversees all park protection activities 968218428 [email protected] Sylvia Reátegui Manager Jack Flores Manager (042) 56-4100 [email protected] (065) 60-7250 Avecita Chicchon Program Director Marilu Bacigalupo Program Director Key Involvement in the Project [email protected] [email protected] 618-1200 (central) [email protected] Major contact in the department of San Martín for implementation of project Major contact in the department of Loreto for implementation of project Early investor in PNCAZ and concerned about the long-term viability of the park Early investor in PNCAZ and concerned about the long-term viability of the park MacArthur Foundation Steve Cornelius Exelon Steve Solomon CIMA Board Member Marleni Ramirez Representatives of the park guards of PNCAZ Felix Ushiñahua Andrés Cenepo Park guards CP Key contacts with the communities in 15 and (042) 529844 (Jefatura) the buffer zone and were engaged in CP 11 the carbon stock inventory Hugo Che Piu President of Derecho, Ambiente y Recursos Naturales (DAR) Grupo REDD Peru Coordinator Program Officer CIMA Board Member Early investor in PNCAZ and concerned about the long-term viability of the park (312)726-8000 steve.solomon@exelonc Partial funder for the development of orp.com the PD [email protected] Reviews CIMA’s policies and strategies (57)24450029 anex 107 [email protected] 266-2063 (office) 58 DAR leads Mesa REDD and the Technical Group for the Climate Change National Committee SERNANP is integral to the discussions, work groups, presentations, and conferences that precede the development of each Master Plan for PNCAZ. In addition, SERNANP must approve the final Master Plan. The working relationship between CIMA and SERNANP allows SERNANP to provide ongoing input into the project’s implementation and any improvements that may be made over time as new information is obtained. During the monitoring period, CIMA has met with representatives of SERNANP or MINAM numerous times to discuss the project. Copies of the presentations made at these meetings are available. SERNANP also has participated in national conferences and meetings regarding REDD projects in Peru and CIMA shared information on the project design at those times. These meetings began in 2009 and samples of the presentations made by CIMA at these meetings are available. CIMA coordinates very closely with the PNCAZ Head. CIMA’s Tarapoto offices are located within PNCAZ’s Headquarters allowing for continuous communication. CIMA meets periodically with the Regional Environmental Authority, San Martín as part of the regional REDD roundtables and the Regional Environmental Commission (CAR San Martin). CIMA typically meets with PROCREL twice a year per the terms of the agreement with the Regional Government of Loreto. CIMA and The Field Museum have also briefed and sought input on project design from their major funding sources. Representatives of the Gordon and Betty Moore Foundation, the MacArthur Foundation, including Steve Cornelius, Exelon Corporation, and its representative Steve Solomon, and Lima-based, USAID staff members have been briefed about the project throughout the monitoring period. Marilu Bacigalupo acted as the USAID Program Director throughout the monitoring period and Steve Olive oversaw the initial USAID funding.. Copies of the meeting notes and presentations are available. CIMA’s Board meets periodically to review CIMA’s operations and program status. Minutes from the meetings are available. CIMA is involved in a network of private and public organizations called the REDD Bureau (Grupo REDD Peru), which supports the government in developing REDD policy based on real experiences. CIMA personnel coordinate the San Martin REDD Bureau, which is recognized by regional government decree (Resolución Ejecutiva Regional No.864-2009-GRSM/PGR, November 9, 2009). These meetings began in 2009 (August and November). Minutes or presentations from these meetings are available. The project has also been discussed with the park guards. Names and contact information of two representatives of the group of park guards who were trained and participated in the estimation of the carbon stock in the park in the August to December 2009 period are provided. These park guards interact with members of the off-site communities on a daily basis. Communications with these stakeholders continue today. Additional regional government agencies needing direct project communication were identified as a result of the fall 2013 CCB verification process and are outlined below. In December 2013, letters were sent to each individual listed as well as Sylvia Reátegui Garcia listed above. These letters included a link to project documents and requested an in-person meeting during which an overview of the project’s design, goals, objectives, and activities, and implementation status will be explained and any questions the organization has will be answered, In addition, these meetings will allow the project to identify the level of future communication that each organization desires. Project updates are frequently presented during regional and national REDD+ platforms (regional and national policy development meetings, workshops and other formats) among other opportunities for participation which the regional authorities attend, but the project will provide additional direct communications as requested. These contacts will also receive any future general project updates or documents distributed. 59 Table 2.2a: Additional Regional Government Authority Stakeholders Name Position or Organization Department Jose Panaifo Del Aguila Director Ejecutivo PRODATU II San Martin Cesar Torres Del Castillo Administrador Técnico Forestal y de Fauna Silvestre, Gobierno Regional de Huánuco Gerente de Recursos Naturales y Medio Ambiente; Gobierno Regional de Huánuco Huánuco Dirección Ejecutiva Forestal y de Fauna Silvestre; Gobierno Regional de Ucayali Gerente Regional de Recursos Naturales y Gestión del Medio Ambiente; Gobierno Regional de Ucayali Gerente Regional de Recursos Naturales y Medio Ambiente; Gobierno Regional de Loreto Ucayali Sub Director del Programa Regional de Manejo Derecursos Forestales y de Fauna Silvestre; Gobierno Regional de Loreto Gerente de Gestión del Medio Ambiente y Conservación del Gobierno Regional de Ucayali Loreto Nelino Florida Rofner Marcial Pezo Armas Franz Orlando Tang Jara Wilfredo Panduro Cárdenas Aldo Lozano Reategui Frank Orlando Tang Jara Huánuco Ucayali Loreto Ucayali Nelson Seijas Valderrama Subgerente de Gestión del Medio Ambiente y Conservación del Gobierno Regional de Ucayali Ucayali David Moreno Hernando coordinador del proyecto “Desarrollo de Capacidades para el Ordenamiento Territorial de la Región Ucayali” a la Gerencia Regional de Recursos Naturales y Gestión del Medio Ambiente Ucayali Miguel Alva Reategui Director Ejecutivo de Adm. Y Conservación de los RRNN; Gobierno Regional de San Martin San Martin Karla Mendoza Baylon Programa Nacional de Conservación de Bosques del MINAM San Martin 60 2.7.2 Secondary Stakeholder Involvement In order to meet the requirements for the CCB validation comment period, CIMA ensured that the key project document, the PD,) was translated into Spanish and was available to the public in each regional CIMA office. CIMA also sent letters and technicians to communities in the buffer zone to ensure that communities received direct notification of the location of the documents and were aware that CIMA welcomed their feedback. Any comments received were immediately addressed in writing. CIMA provided copies of the comments along with the responses to the CCB Validation VVB and no changes to the PD were required. Since CCB validation, CIMA has focused on implementing the communication strategy proposed in the PD. CIMA prepared special materials, including brochures, posters, and flip charts, designed to support this communication and the presentations. The poster contains project information including the objectives, types of activities, project impacts, supplementary material about conservation, causes and effects of deforestation, climate change adaptation and mitigation mechanisms, Environmental Governance, and displays ways of communicating with CIMA about any concerns, and the grievance process. The CIMA extension team distributed the posters during community assemblies along with materials explaining REDD and the project process. CIMA technicians and park guards received training in order to be able to effectively and accurately communicate: concepts of conservation, benefits and opportunities offered by the PNCAZ for community development, the scope of REDD+ for PNCAZ, operating mechanisms of REDD+, sector specific activities and other topics. In general, any questions, concerns or comments from community members are addressed at that time of identification if possible. If a community member has a suggestion, complaint or question that the technician cannot immediately settle, the item is handled in accordance with the process outlined in the next section 2.7.3. Community members have numerous opportunities to voice questions or concerns as the technicians frequently spend time in the communities. Community members wishing to submit comments to the CCB verification public comment period will be able to do so through CIMA or directly to the verification body conducting community visits. Copies of the PD, and Climate Monitoring reports have been made available in the regional CIMA offices for anyone who wishes to review them in more detail. Copies of the Project Implementation and Monitoring Report will be made available once it is completed and translated. Community concerns and aspirations have been critical in the design and implementation of project activities. One of the first project activities was to have regional meetings with all communities who wished to participate in establishing regional visions and plans. As described in Section 2.2 and throughout the PD, CIMA has worked and will work extensively with these communities to determine how the project can have the most positive impact on their lives. The desire for a participatory approach to park management is one of the primary goals of the project. 2.7.3 Stakeholder Communication Systems Key project documents such as the PD, monitoring reports, and validation and verification reports are posted on the VCS database and the CCB website. Final translated documents will also be posted as possible. Notices regarding the completion of the PD and the beginning of the CCB public comment period were emailed to primary stakeholders. Key project documents were and will continue to be made available to secondary stakeholders and the CCB public comment period was publicized as described above. Throughout the project, CIMA was able to draw upon several existing communications systems that had been developed for the initial park management activities. Using these systems, CIMA was able to gather and respond to data, questions, and comments both from internal and external sources. Primary stakeholders are most likely to contact CIMA via email, telephone, or in person during meetings, conferences, and workshops. 61 Monthly visits of CIMA’s technical field staff to communities provided an opportunity to present information and receive comments from the secondary stakeholders. Park guards have maintained logs at their posts and send daily radio reports and monthly written reports to the Head of the park, who coordinate the specific patrol routes with CIMA. The Head of the park is based in Tarapoto, is in steady communication with CIMA, and provides copies of park-guard reports to the CIMA Information Officers. Park guards continue to report on their activities and their observations of flora and fauna in the field. They also continue to report on information from the communities, which they obtain through direct discussions, letters, and attendance at local events or meetings. This information can be questions, comments, observations of flora or fauna, observations of illegal activities or rumors of illegal activities, notification of illegal activities being reported to the proper authorities, or other issues. Field offices have regularly communicated both in writing and verbally with Headquarters through meetings and periodic informal reviews to ensure smooth coordination among all offices. Electronic mail, meetings, and other means were used to disseminate information regarding new programs, policies, or reminders from Headquarters to all CIMA employees. As discussed, most comments from buffer zone communities went directly to park guards and the CIMA technical team, given their frequent interaction with the communities. Some comments, however, were sent to the CIMA field offices. Park guards forwarded questions they could not answer and concerns or complaints voiced by residents to the field offices. Most items were easily resolved by the field offices, but when necessary were forwarded to the Program Director or local law enforcement authorities, as appropriate. Concerns and comments have been handled in a consistent manner. Depending on the issue, conference calls, in-person meetings, interviews with the commenter or CIMA personnel, and other means have been used to obtain additional information as necessary, and appropriate actions were then taken. Some complaints have resulted in expanded training, new communications to buffer zone communities, and even the firing of an employee. There is no formal written procedure for this process but it was applied consistently and has built on CIMA's close relationship with the buffer zone communities. CIMA’s Executive Director is ultimately responsible for the resolution of all issues but questions, complaints, and comments may be addressed by several individuals within the organization, depending on the topic. To date, all issues have been satisfactorily resolved through this process and the grievance process has not been used. When issues are addressed immediately in the field by the park guard or technician, the interaction is documented in the park guard’s or technician’s report but no formal written summary of the response is provided to the individual with the question or concern. If the issue cannot be immediately resolved, it is forwarded to CIMA’s offices or Headquarters, where it is resolved directly by the Program Director (or Regional Coordinator) or Chief of the Park. . If any stakeholder feels that an issue cannot be or has not been addressed satisfactorily through this process, all stakeholders can also raise the issue to the Comité de Gestión (CG). This organization includes representation from all stakeholders involved in the management of the park including communities, local and regional governments, local organizations, the Park Head and CIMA. CIMA will be able to remove itself from all CG meeting items regarding these issues to ensure the impartiality of the review. This diverse representation provides natural pathways for reporting issues and for providing an independent, third-party review of any issues raised. Outcomes of the CG reviews will also be provided in writing to the submitting individual or community within 30 days. Minutes of the CG meetings, park guard reports and technician reports capture the input received from communities while emails, meeting minutes and phone logs capture input from primary stakeholders. In addition, reports to funders often summarize much of the same information. All of this information feeds into the ICC system to provide data on new threats (illegal activities, tensions between communities), suggestions or other issues. As appropriate, CIMA’s strategies and activities are adjusted to better achieve the project’s goals. Immediate threats may result in immediate changes in activities and do not require a quarterly ICC review. The ICC documentation and quarterly project reports capture how the plan has been revised as a result of stakeholder dialogues. The ICC process is explained in Section 5.5. 62 Regional meetings with communities and authorities occurred in 2008 and early 2009, as part of the updating process of the Plan Maestro, where consolidated PNCAZ visions, strategies and activities were defined. These inputs were used for project design and give guidelines for project implementation. 3 3.1 LEGAL STATUS Compliance with Laws, Statues, Property Rights and Other Regulatory Frameworks (G4 & G5) CIMA is committed to meeting or exceeding any regulation, standard, treaty, or international agreement that may cover its activities. The only regulation that affects the project area is the regulation establishing the national park and appropriate uses (Supreme Decree No. 031-2001-AG). The project exists to enforce these regulations and is therefore in compliance with them. CIMA continues to monitor new or changing regulations to identify any that may affect the project area. Many laws exist that govern activities by organizations and communities in the buffer zone. CIMA does not have authority to enforce any regulations in the buffer zone. Enforcement of these laws by the proper authorities is rare and is discussed further in Section 3.1.2. None of CIMA’s activities in the buffer zone are governed by these regulations but the laws are included for completeness to show what laws are in place. About the use of natural resources in the buffer zones of natural protected areas (ANP): The Constitución Política del Perú establishes in its artículo 68° that the State is required to promote the conservation of the biological diversity in the natural protected areas. Ley de Áreas Naturales Protegidas: Ley Nº 26834 Artículo 25º.- Buffer Zones are those adjacent to a nationally protected area that, because of their nature and location, require special treatment to guarantee the conservation of the protected area. The Plan Maestro of each area will define the extension of the buffer zone. Activities in the buffer zone should not threaten the natural protected area (ANP). Reglamento de la ley de Áreas Naturales Protegidas: Decreto Supremo Nº 038-2001-AG Artículo 4º.- About Buffer Zones Activities in the buffer zone should not threaten the objectives of the ANP; both public and private entities should recognize the special provisions of the buffer zone. Artículo 62º.- Activities in the buffer zone of ANPs 62.1 The following activities are encouraged in the buffer zone: ecotourism; management and restoration of flora and fauna; habitat restoration; agroforestry projects; issuance of Private Conservation Areas, Conservation Concessions, Concessions for Environmental Services; other activities that promote protection of the ANP. 62.2 The Plan Maestro establishes the criteria for implementing the activities in 62.1. Artículo 63º .- Forestry activity in the buffer zones of ANPs 63 For concessions, permits, and authorizations of forestry activities to be approved by INRENA (now SERNANP) in buffer zones, the activities must previously have an opinion issued from Headquarters, based on the existing regulations and the approach laid out in the Plan Maestro. Land-use planning in the buffer zone should incorporate the special considerations given the goal to make the buffer zone compatible with effective protection of the ANP. Ley Forestal y de Fauna Silvestre and its Reglamento: Ley Nº 27308 y Decreto Supremo Nº N° 0142001-AG. These also are relevant since they establish specific means for use of timber and non-timber forest resources, and for the establishment of timber and non-timber concessions in appropriate regions (which include ANP buffer zones). Artículo 64 º.- Environmental Impact Assessments (EIA) of activities in the buffer zone EIA and Programs of Environmental Management and Adjustment (Programas de Adecuación y Manejo Ambiental –PAMA) are required for activities that will alter the state of renewable natural resources (including water, soil, flora, and fauna) in buffer zones of ANPs, and must be reviewed by regional authorities and receive a favorable opinion from INRENA (now SERNANP). Ley del Sistema Nacional de Evaluación de Impacto Ambiental, Ley Nº 27446 and its Reglamento, approved by Decreto Supremo Nº 019-2009-MINAM. These also are relevant. Artículo 44º.- Technical opinions To evaluate requests (Solicitud de Clasificación) without undue delays, the proper authorities can request technical opinions from other experts to be considered in the reply. The official response must address all expert opinions, explaining why they were or not heeded. When the request is for activities inside the ANP or in its buffer zone, the proper authority must solicit a technical opinion from SERNANP (Servicio Nacional de Áreas Naturales Protegidas por el Estado). Artículo 53º.- About technical opinions When the competent authority desires, it can request expert opinion to review the EIA (the project solicitor can then be asked for as many copies as necessary of the plan under evaluation). Experts should comment only within their area of expertise. The competent authority will consider all expert opinions in making its decision. In case the project or activities are inside an ANP or its buffer zone, SERNANP must be review the project and give a favorable opinion before it can move forward. About the baseline of environmental studies: The baseline should address characteristics of the specific site where activities will be conducted, along with a definition of the areas to be affected—directly or indirectly—at the micro and macro levels. To the extent that they are affected, the following elements must be included in the report: (1) description of the location, extension, and timeframe of the project, (2) identification of the area influenced directly or indirectly by the project and definition of the impact, (3) studies of macro and micro locations, (4) position of the project relative to a nationally protected area or its buffer zone, if relevant. Determination of the area of influence will be allowed or modified by the competent authority when the terms of reference are issued. Artículo 88 º.- Management of natural resources in ANPs and their buffer zones All necessary measures must be considered by the State, so that the use of natural resources in ANPs and their buffer zones do not undermine the protection of these resources and of 64 environmental services; INRENA (now SERNANP) must first give a favorable opinion for the activity to move forward. Articulo 116 º.- Proceedings for Oil and mining activities Associated with the DECRETO SUPREMO Nº 003-2011-MINAM that modifies Artículo 116° and establishes the following: Artículo 1.- Modification of artículo 116 of the Reglamento de la Ley de Áreas Naturales Protegidas, approved by Decreto Supremo Nº 038-2001-AG. Change of artículo 116 del Reglamento de la Ley de Áreas Naturales Protegidas, which becomes the following: Artículo 116 º.- Issuance of Compatibility and of a Favorable Technical Opinion The soliciting entity—national, regional, or local—must receive from SERNANP a statement of compatibility with protection activities, as well as a favorable technical opinion to move forward with the proposal if the activities are to take place in an ANP. 116.1. The issuance of Compatibility is the binding technical opinion that consists of an evaluation of the activity’s impact on the conservation of a nationally protected area or regionally protected area, according the category of protection, zoning, Plan Maestro, and objectives for creation of the ANP. The compatibility of the activity with a national ANP’s buffer zone will depend on the specific ANP. Compatibility issuance will also include the general guidelines as well as the legal and technical conditions to operate in the ANP and its buffer zone. SERNANP will issue its opinion within 30 days of receiving the solicitation. 116.2. The favorable technical opinion is the binding technical opinion that consists of evaluating the environmental management unit of the activity to be done inside the ANP or its buffer zone, based on the viability of the unit. The unit will only be approved upon a favorable technical opinion from SERNANP. SERNANP will issue its favorable or negative opinion within 30 days of receiving the request. SERNANP also will be requested to review the terms of reference and will issue its opinion within 15 days of receiving the request. 116.3. Independently of the previous articles, the appropriate authorities should recognize the following: a. Rights granted to appropriate entities should be previously coordinated with the ANP Headquarters and communicated to them. b. Activities related to operation—such as access of personnel, transport of hazardous substances, and others—inside a national ANP or its buffer zone, or inside a regional ANP, must be coordinated previously with the ANP headquarters or with the Gestión de las Áreas Naturales Protegidas - DGANP, to put in place the appropriate measures. c. Reports on controlled activities, supervised by appropriate entities, must be copied to SERNANP About legislation that protects indigenous peoples in isolation or initial contact 65 Ley Nº 28736 para la Protección de Pueblos Indígenas u Originarios en Situación de Aislamiento y en Situación de Contacto Inicial (Law for the protection of Indigenous peoples in isolation or initial contact): Art. 2 º Categorization.A group of humans is recognized as Indigenous Peoples in Isolation or Initial Contact. To validate that category, a study must be undertaken by a Multi-sectoral Commission, presided by the Instituto Nacional de Desarrollo de Pueblos Andinos, Amazónicos y Afroperuanos – INDEPA and formed by the Defensoría del Pueblo, representatives of the regional and local governments, two Anthropology faculty members from Peruvian universities (one public, one private), and by others as determined by law. The study must be able to prove that the group exists and must provide some estimates of the size of its population and the lands the group uses. Art. 4º Rights of the peoples in isolation or initial contact The State guarantees the rights of indigenous peoples in isolation or initial contact, recognizing the following obligations: a. Protect their lives and health, primarily with protective actions given their vulnerability to diseases; b. Respect their decision in relation to the rest of society; c. Protect their culture and ways of life, recognizing their special, spiritual relationship with their habitat as part of their identity; d. Recognize their right to the lands that they occupy, restricting the entry of foreigners into their lands. The lands that they inhabit shall be theirs if they decide to establish contact and live sedentary lives; e. Guarantee their free access to extensive use of their lands and natural resources for their traditional activities and existence; and f. Establish indigenous reserves over the lands that they use, until they voluntarily decide to seek contact Regulations of the Ley Nº 28736, approved by Decreto Supremo Nº 008-2007-MIMDES. Establishes that the peoples in isolation or initial contact are entitled to the rights established by law and the national and supranational norms, being allowed to use the natural resources inside indigenous reserves without interference of outsiders – be they indigenous or not. Isolated peoples will remain so until they voluntarily decide to seek contact. Ministerial Resolution Nº 797-2007-MINSA, that approves the Guía Técnica: Relacionamiento para casos de interacción con Indígenas en Aislamiento o en Contacto Reciente. The technical guide aims to prevent situations that threaten the life or health of isolated indigenous peoples through accidental contact – violent or not – prescribing the adequate behavior in case of such contact. Ministerial Resolution Nº 798-2007-MINSA, that approves the Guía Técnica: Atención en Salud a Indígenas en Contacto Reciente y en Contacto Inicial en riesgo de alta morbimortalidad. This technical guide addresses how to minimize risk for peoples in initial contact. 66 Ministerial Resolution Nº 799-2007-MINSA, that approves the NTS Nº 059-MINSA/INS-CENSI: Norma Técnica de Salud: Prevención, Contingencia ante el Contacto y Mitigación de Riesgos para la Salud en escenarios con presencia de indígenas en aislamiento y en contacto reciente. This technical health norm explains what to do in case there are sightings of contact with isolated peoples and how to act with respect and minimize health risks. The norm focuses on human rights and especially rights to life and health. It attempts to minimize any possible contact. International Agreement Regarding Non-contacted Peoples Convention 169 from the International Labor Organization (text below from the ILO internet site http://www.ilo.org/indigenous/Conventions/no169/lang--en/index.htm) “Convention No.169 is a legally binding international instrument open to ratification, which deals specifically with the rights of indigenous and tribal peoples. Today, it has been ratified by 20 countries (including Peru). Once it ratifies the Convention, a country has one year to align legislation, policies and programmes to the Convention before it becomes legally binding. Countries that have ratified the Convention are subject to supervision with regards to its implementation.” Legal and Other Requirements Relating to Biodiversity Red List of endangered species and other (http://www.iucnredlist.org/search/search-expert) Convention on International Trade in Endangered Species of Wild Fauna and Flora - CITES (http://www.cites.org/eng/app/appendices.shtml) Peruvian law (Supreme Decree No. 034-2004-AG). 3.1.1 threats category - IUCN Red List Worker Regulations CIMA abides by and exceeds its obligations to workers based on laws, providing all social and health benefits established by law. In Peruvian law, workers are categorized by their type of work and different rights are given to different categories of work or types of contract (e.g., full-time vs. part-time staff, hourly vs. salaried). Salaries are based on a scale approved by CIMA’s board of directors, and minimum regional salaries are considered in defining the pay scale. CIMA has a Reglamento Interno de Trabajo that regulates internal human resource issues. In addition, staff has their internal Reglamento document that provides general information, guidelines, and defines expectations. In addition, CIMA has volunteers in protection activities. CIMA offers a small ‘incentivo’ for the time of work and specific activity. Communal park guards fall under this category. The volunteers are not staff and do not receive staff benefits; the relationships is purely of volunteerism and of learning through the activities. The communal park guards are members of the villages in the buffer zone and they work alongside the official park guards. CIMA provides these volunteers with training, equipment, and food for their rotations of up to two months. In addition to the staff available to CIMA, the institution enters into contracts with selected consultants, allowing CIMA to meet its commitments to PNCAZ. As appropriate, CIMA complies with all tax obligations that relate to these contracts. Specific regulations regarding worker rights include: 1. Current Constitution (Art.25) Workshop, resting right, regulating compensation. 2. D.S. N ° 003-97-TR, Competitiveness Act and Labor Productivity. (a) promoting job training and education of workers; (b) Provide transfer of persons engaged in urban and rural areas of low productivity and income to other more productive activities, (c) Ensure the incomes of workers 67 and protection against arbitrary dismissal; (d) Unify works procurement rules and strengthen existing social benefits. 3. D.S. N ° 007-2002-TR Amended Text of Legislative Decree. Act No. 854 Workshop, Modification by Law No. 27,671. 4. D.Leg. No. 910, General Law on Labour Inspection and Labor Defense 5. D. Leg. No. 728 Ley de Fomento al Empleo 3.1.2 Regulatory Additionality CIMA’s agreement to support the management of the park was a completely voluntary action; there was no regulatory obligation. Because of resource limitations, it is almost certain that the Peruvian government would not have designated PNCAZ as a national park if an organization had not been willing to fund and manage the park. Additional background regarding the creation of the park is provided in Section 4.5, Additionality. In the absence of this REDD project, the intense deforestation surrounding PNCAZ would overwhelm any weight that a national park designation carries when it is only a “paper park” and the intact forests of the park would succumb to fragmentation and deterioration. When the park was established, there were large-scale illegal logging settlements operating in the park. These operations were all removed from the park peacefully, in coordination and collaboration with surrounding communities. In addition, the regional governments’ resources are severely strained, especially given the rapid, large influx of immigrants. There is currently insufficient capacity to ensure awareness of and adherence to national, regional and local laws in the buffer zone. Without the project, land-use zoning and tenure processes would be limited to nonexistent and illegal activities would seldom be reported to the correct law enforcement authorities by community members 3.2 Evidence of Right of Use (G5) Land within the project area is a national park owned by the national government of Peru. The branch of the government responsible for national park oversight is the Servicio Nacional de Áreas Naturales Protegidas (SERNANP), a special technical agency of Ministerio del Ambiente (MINAM). SERNANP was created in May 2008. The branch of government formerly responsible for national parks was Instituto Nacional de Recursos Naturales (INRENA). Land use in national parks is limited by Law No. 26834 to non-commercial activities. The park is sub-divided into four zones, each with a range of restrictions, from areas with no permitted entry to ones that permit traditional and low-impact uses (INRENA 2006). With SERNANP, CIMA developed criteria for land use based on the history of traditional use and fragility of the land and then implemented programs to patrol and enforce the designated uses. CIMA and INRENA signed in August 8, 2008 a 20-year full management contract under the Peruvian Protected Areas legislation (a law passed on July 4, 1997 with its supporting regulation passed on June 26, 2001). When SERNANP was formed, it ratified the management contract with CIMA. The Peruvian government gave CIMA the right to develop an avoided deforestation carbon project for the park in 2008. The 2008 management contract includes legal authorization for CIMA to use revenues from the sale of carbon credits from avoided deforestation for park activities for the 20-year term. CIMA’s exclusive right to sell carbon credits from the project is further documented in a letter from the Peruvian government dated December 30, 2009. Copies of the relevant contracts and documentation will be provided to the validator There is a possibility that an uncontacted group of Kakataibo resides in or near the park, which led to the development of the intangible zone that permits no entry or use by anyone other than the Kakataibo in voluntary isolation. CIMA worked extensively with Kakataibo tribal leaders and the Peruvian government to identify the greatest possible range of these people when defining this intangible zone. Park guards, communal park guards and extension team personnel all receive training regarding how to respect the rights of these people to remain uncontacted and the best ways to react if contact accidentally happens in 68 the buffer zone. Any attempts to locate these people in voluntary isolation, to ask them for permission to develop a REDD project, would directly violate their right under Peruvian laws and the international agreements signed by Peru as described in Section 3.1.2 to remain uncontacted. However, through the efforts discussed, CIMA has taken every possible measure to ensure that the project design allows no project activity in any way to encroach on these people. In fact, the activities in this region are designed specifically to allow the uncontacted peoples to conduct their lives as they wish, with zero interference from outsiders. In late 2000, when CIMA’s predecessor organization APECO and The Field Museum were preparing the documents necessary to establish Cordillera Azul National Park, they partnered with Conservational International (CI). CI retained a law firm in Peru to research land ownership and claims in the area so that boundaries for the park could be designed to avoid any private properties inside. Due to an oversight, ownership claims filed in the district of Loreto were not investigated. As a result, the park was established with some private parcels acquired prior to the park’s formation, 1,227 hectares, inside the park boundaries. CIMA reached agreements with all 21 landowners to limit land-clearing activities in the park. Although there are no permanent residences in the park, the private parcels are not included in the project area and CIMA will not claim any avoided deforestation credits for these areas. When the project began, only one area inside the park continued to be incompatible with conservation: an estimated 220 hectare, cattle ranch on the southwest corner of the park that had not been detected when the park was established. Once it was detected, the cattle rancher was asked to leave the park (Carta Multiple Nº 002-2006-INRENA-IANP-PNCAZ/J) since he did not own the land. In a response letter, the rancher offered not to expand his operations and to help keep watch for illegal uses of land within the park (Carta de respuesta y compromiso from February 18, 2007), since he was there prior to the development of the Park. SERNANP and CIMA agreed to this and allowed the rancher to remain under these terms because he had been there prior to the Park’s establishment. Just prior to the start of the project, monitoring demonstrated that the cattle rancher had expanded his operations in violation of his agreement. The current status of the resulting legal proceedings is provided in Section 2.2.3. The Peruvian government has assigned rights or designated areas in the buffer zone for various uses including forestry concessions, petroleum lots, mining concessions and community lands. While the area assigned for a specific use is clearly delineated, designated lands often overlap with each other. The majority of people in the buffer zone do not legally own their land. They are squatters who live and work on land owned by the national government. These overlapping concessions and squatters lead to conflict when all try to work the same land. One of the project priorities is to work with the communities in critical areas where roads or rivers provide access into the park to establish community boundaries, obtain land tenure for residents, lessen land erosion, and strengthen interest in conservation and sustainable land use. The Field Museum has been providing technical support to CIMA and collaborating in the management of the park and its buffer zone since before CIMA was founded. For this project, The Field Museum has the authority to act on CIMA’s behalf to develop the project documentation, manage the validation and verification of the avoided deforestation carbon project and to provide advice on the sale of the carbon credits generated. This authority was initially outlined in a Memorandum of Understanding between the two organizations and was later formalized in a contract. A copy of the contract will be provided to the validator. 3.3 Emissions Trading Programs and Other Binding Limits (CL1) The avoided emissions from this project will not be used for compliance purposes in a regional or national compliance program or to demonstrate conformance with a binding limit on GHG emissions. Neither Peru nor regional or local governments have established a national target, a compliance program or a cap and trade system. 69 3.4 Participation under Other GHG Programs (CL1) This project is only seeking registration under the VCS and CCB programs. CCB does not issue carbon credits and the project is not seeking to register credits with any other program. 3.5 Other Forms of Environmental Credit (CL1) This project has not and will not seek to generate any other form of environmental credit. 3.6 Projects Rejected by Other GHG Programs (CL1) This project has not been rejected by any other GHG program. 3.7 Respect for Rights and No Involuntary Relocation (G5) The project has worked diligently to ensure the rights of all groups that may be affected by project activities are respected. The project will not encroach on other lands, or require the involuntary relocation of people or activities important for the livelihoods and cultures of the communities. In developing approved uses of the park, traditional community uses were identified and allowed. Every attempt has been made to ensure that project activities will not negatively affect the uncontacted Kakataibo people that may be living in or near the park, as was described in Section 3.2. Park conservation ensures the protection of indigenous people who may live in isolation while respecting their right to remain uncontacted. All the private parcels acquired prior to the park’s formation are respected by CIMA and SERNANP, with agreements voluntarily signed by all 21 landowners to limit land-clearing activities according to park zoning. The cattle rancher located inside the park has violated his agreement with SERNANP and CIMA that allowed him to remain inside the park. This situation is currently being addressed by MINAM through the Peruvian legal system. Further information regarding the rancher is provided in Section 2.2.3 and 3.2. 3.8 Illegal Activities and Project Benefits (G5) Illegal activities occur in the buffer zone. Even in departments with a highly efficient regional government, local law enforcement is not sufficiently ample and strong to enforce national and regional laws in the most remote areas, as is discussed in Section 3.1.2. The illegal activities tend to be small in scale and may include logging, hunting, and mining conducted by individuals or bands. CIMA’s activities raise awareness of the regulations and CIMA’s presence in the region discourages illegal activities. CIMA does not, however, have the authority directly to enforce regulations in the buffer zone. When illegal activities are detected, CIMA and park guards report immediately to the appropriate local authorities. CIMA’s land-use zoning and land tenure efforts with local residents further reduce illegal activities. Land owners aware of the regulations are much more likely to report illegal uses on or near their lands to the proper authorities and to refrain from conducting such activities themselves. No project activities are illegal or derive any benefit from illegal activities. 70 4 APPLICATION OF METHODOLOGY 4.1 Title and Reference of Methodology Two standards were used in developing and documenting this project: Verified Carbon Standard (Verified Carbon Standard, Version 3, 2011) and Climate, Community and Biodiversity Project Design Standards, Second Edition (CCBA 2008). This PIR follows the VCS/CCB documentation template for a combined monitoring and implementation report. The methodology used to quantify the avoided emissions is the framework and component modules of the modular REDD methodology VM0007 REDD Methodology Modules, Version 1.3 approved 20 November 2012. This project uses the following modules and tools: VM0007 REDD Methodology Module, REDD Methodology Framework (REDD-MF), version 1.3 CP-AB “VMD0001 Estimation of carbon stocks in the above- and belowground biomass in live tree and non-tree pools”, version 1.0 CP-D “VMD0002 Estimation of carbon stocks in the dead-wood pool”, v1.0 BL-UP “VMD0007 Estimation of baseline carbon stock changes and greenhouse gas emissions from unplanned deforestation”, version 3.1 LK-ASU “VMD0010 Estimation of emissions from activity shifting for avoided unplanned deforestation”, version 1.0 E-BB “VMD0013 Estimation of greenhouse gas emissions from biomass burning”, version 1.0 M-MON “VMD0015 Methods for monitoring of greenhouse gas emissions and removals” version 2.1 X -STR “VMD0016 Methods for stratification of the project area” version 1.0 X-UNC “VMD0017 Estimation of uncertainty for REDD project activities” version 2.0 T-ADD “VT0001 Tool for the Demonstration and Assessment of Additionality in VCS Agriculture, Forestry and Other Land Use (AFOLU) Project Activities”, version 3.0 T-BAR “Tool for AFOLU non-permanence risk analysis and buffer determination”, version 3.1 T-SIG CDM “Tool for testing significance of GHG emissions in A/R CDM project activities”, version 1.0 4.2 Deviations from the Monitoring Plan There were no deviations from the social or biodiversity monitoring plan. Please see the VCS verified Climate Monitoring Report in Appendix 1 for a description of the deviation used in the monitoring process. 4.3 4.3.1 Project Boundary (G1) Definition of geographic and temporal boundaries (CCB: G3.3) For the development of the baseline, spatial and temporal boundaries are set from which information on the historical rate of deforestation is extracted and projected into the future. The rate of deforestation is derived from the reference region for deforestation rate, (RRD) while the reference region for location 71 (RRL) is used in the spatial modeling component of the baseline, which are the same using the population driver approach. The leakage belt is the area in the RRD/RRL outside the project area, where activity shifting leakage (i.e., deforestation which was displaced from the project area due to implementation of the project activities) from local agents is monitored. 4.3.1.1 Spatial Boundaries Reference Region for Projecting Deforestation Rate The reference region for deforestation rate, RRD, (Figure 5) is defined as the consolidated area of the population census units that include and surround the project area. Figure 5. Reference region is defined by the boundaries of the districts included in the reference region The reference region is defined by the boundaries of the 16 included districts (Figure 6), and covers a combined area of 3.6 million hectares. The RRD as delineated includes all significant forest areas surrounding the project area that are accessible and attractive to local deforestation agents, with the exception of the southern/southwestern districts (Polvora, Tocache, Uchiza, Jose Crespo y Castillo and Padre Abad) and Sarayacu in the northeast. 72 Figure 6: Districts included in the reference region Sarayacu was excluded because it is a large district encompassing two deforestation frontiers (including one in the east affecting Sierra Divisor), and hence its population expansion is not solely directed toward the project area, and its inclusion would not be conservative. Padre Abad was excluded because it contains large indigenous community territories that are separated from the park by an area currently being proposed as a Territorial Reserve for Cacataibos in isolation (FENACOCA - IBC 2005). Populations on the far side of these territories would not expand toward the park. José Crespo y Castillo, Tochache and Uchiza contain topographical features along their northern edges which would preclude rapid population growth near or in the park. These mountains are known as the Padre Abad Boqueron. Pólvora has historically been isolated due to a history of narcotics production and violence in the valleys. Based on an oral history from longtime residents, between approximately 1985 and 1995, there was intense violence in the area between “terrorist" organizations (MRTA) and national police. This also involved the war on drugs. Between 1995 and 2000 terrorism quelled, but narco-traffic remained. During these two periods, there was a de-population as people fled the region. After 2000, USAID alternative development programs coupled with active coca eradication campaigns diminished narco activity but when the project began in 2008, the district was still fairly isolated due to the narcotics history. For some context, several previous studies of deforestation in Amazonian Peru, using demographic data and Landsat satellite imagery (1985, 1990 and 2000), have independently identified the San Martín and Loreto departments as having vast denuded landscapes and the highest ongoing rates of deforestation in the region, much of it taking place in protected areas (Dancé 1981, Reátegui 1996 and Portuguez and Huerta 2005). These two departments make up a substantial part of the reference region, and represent a classic agricultural frontier readily apparent from satellite imagery. 73 4.3.1.2 Temporal boundaries The reference timeframe was 1989 to 2003, which represents land use change dynamics in the reference region in the absence of CIMA’s activities. CIMA’s activities were implemented from 2003 to 2008 and would be suspended in the baseline from 2008 onward. When using the population driver approach, the historical reference period is defined as (1) the years between the two census data points used to project the rate of deforestation and (2) the years between the three spatial data points to project location of deforestation. To project rate of deforestation, forest cover and population change between 1989 and 2003 was assessed from a time series of classified Landsat imagery and from population estimates for each district for the years 1989 and 2003 interpolated from 1981, 1993 and 2007 Instituto Nacional de Estadística e Informática (INEI) official censuses (INEI 1989, 2002 and http://www.inei.gob.pe/biblioineipub/bancopub/Est/Lib0842/index.htm) The historical reference period for analyzing the location of deforestation is here defined by the dates of land-cover classifications of Landsat imagery: 1989, 1999 and 2003. The temporal boundaries are summarized in Table 4.1. Table 4.1: Temporal boundaries Project activity Date Start date and end date of the historical reference period (for both rate and location of deforestation). 1989-2003 (Represents regional dynamics in the absence of CIMA’s activities) August 8, 2008 Start date and end date of the REDD project crediting period. August 7, 2028 Date at which the project baseline will be reviewed. The baseline must be renewed every 10 years from the project start date. August 8, 2018 4.3.1.3 GHG emission sources The table below outlines the GHG emissions sources and justifications for exclusion. Table 4.2: GHG emission sources and justifications for exclusion Source Biomass burning Fossil Fuel Gas Included Justification/ Explanation CO2 No CO2 emissions are already considered in carbon stock changes. CH4 No N2O No Conservative to exclude because emissions from burning in the baseline exceed emissions from burning in the “with project” case. No biomass burning occurs as part of the project activity. CO2 No Emissions are small and negligible. 74 Source Gas Included Combustion CH4 No N2O No CO2 No CH4 No N2O No Justification/ Explanation Emissions are small and negligible. Use of fertilizers Emissions are small and negligible. Excluded. No increase in fertilizer use is contemplated in the project case as part of leakage mitigation or any other activity. No evidence of significant slash and burn agriculture (>1ha), motorized boat or vehicle fossil fuel use, or other sources of non-CO2 emissions have been observed within the park boundaries by CIMA technicians or park guards or in imagery analysis since the park was formed in 2001. Given the size of the project area and the total estimated baseline emissions, this would indicate that non-CO2 emissions are negligible and significantly less than 5% of the total projected baseline emissions. In addition, to be conservative, non-CO2 emissions are excluded from the baseline. Each monitoring period, non-CO2 emissions will be evaluated as described in the monitoring plan in Section 5.4 of this document. If during any period, these emissions exceed 5% of the total emissions reductions, the non-CO2 emissions will be included. Selection of pools for inclusion in the project is outlined and justified in the table below. Table 4.3: Selection of pools and reservoirs for inclusion in the project Carbon pools Included / Optional/ Excluded Justification / Explanation of Choice Aboveground Included Mandatory to include. Most significant carbon pool. Only live trees are included; woody non-tree vegetation (woody shrubs and understory) is conservatively not included because post deforestation stocks in this component are not greater than in the forest. Belowground Included Significant pool, often equivalent to ~25% of above-ground stocks. Dead-wood Included Significant pool, often equivalent to ~10% of live aboveground stocks. Harvested wood products Not included Harvest of wood products is not occurring in either the baseline or project scenario, hence can be conservatively omitted because this pool is neither significant nor greater in baseline than project scenario. There are no illegal loggers currently operating in the park, and hence recovery of harvested wood products is not expected to occur in the with-project case. It is always conservative to exclude wood products in the project case. Litter Not included Generally not significant (representing <5% of total stocks) and conservatively omitted per methodology option. 75 Soil organic carbon Not included Conservatively excluded because emissions are expected to be greater in baseline than project scenario and significant (see analysis below). Table 4.4: Analysis of weighted average emissions Source Cultivated Purma media (fallow) Purma baja (fallow) Pasture Percent area (CIMA post-deforestation landuse area data from zoning work conducted in San Martin) 67% 6% 18% 10% Soil carbon stock loss over 20 years (IPCC 2006) 20-36% 18% 18% 0% Emission in t C/ha (base stock 77 t C/ha for primary forest; source: Dr. Julio Alegre, National Agrarian University La Molina, unpublished data from Pucallpa) 15-28 14 14 0 Weighted average emission in t C/ha 8-15 Sinks of GHG emissions are conservatively omitted in project accounting of VCUs. Forest carbon stocks are assumed to be stable, although there is increasing evidence that many mature Amazonian forests are not steady state but are carbon sinks (Baker et al. 2004 and Chave et al. 2008). 4.4 Baseline Scenario (G2) 4.4.1 Baseline Identification and Justification The identification and selection of alternative land use scenarios for determination of the baseline and assessment of additionality was conducted in accordance with the VT0001 Tool for the Demonstration and Assessment of Additionality in VCS Agriculture, Forestry and Other Land Use (AFOLU) Project Activities, Version 3 and VM0007 methodology module BL-UP “VMD0007 Estimation of baseline carbon stock changes and greenhouse gas emissions from unplanned deforestation”, version 3.0. The project meets the applicability requirements of VT0001 as follows: The proposed project activities do not violate any applicable law whether it is or is not enforced. Additional details regarding relevant laws are provided in Section 3.1. The project is not proposing a new baseline methodology but is using VMD0007 Estimation of baseline carbon stock changes and greenhouse gas emissions from unplanned deforestation (BL-UP), Version 3.0, which includes a detailed step by step approach for development of the baseline. Step 1. Identification of alternative land use scenarios to the proposed VCS AFOLU project activity Sub-step 1a. Identify credible alternative land use scenarios to the proposed VCS AFOLU project activity The following alternative land use scenarios were identified for the project: Alternative 1: Continuation of deforestation activities taking place prior to CIMA’s work in the region. 76 Alternative 2: Creation of large agricultural (biofuel) projects. Alternative 3: Creation of logging, mining or oil concessions in part or all of the project area and subsequent use of these concessions. Alternative 4: Management and protection of the national park by the national government of Peru. Alternative 5: Project activities occurring without being registered as a VCS/CCBA project. Alternative 4 is not a plausible alternative. As discussed in Section 3.5.1, the Peruvian government does not have adequate funds to manage and protect this national park. In fact, it is not likely that the government would have created the national park if it were not for the agreement for management by the non-profit organization. Therefore this is not considered a plausible alternative. The remaining four alternatives will be considered further. Sub-step 1b. Consistency of credible land use scenarios with enforced mandatory applicable laws and regulations Alternative 1 includes the deforestation for subsistence agriculture, ranching and logging that was occurring for many years prior to CIMA becoming involved in the area or the national park being created. Information gathered during the MUFs, work CIMA conducted to remove illegal loggers, and discussions with local experts and communities indicate that these activities were widespread in the project zone (project area and buffer zone). Therefore, either these activities were considered legal or the laws were not being enforced. It is assumed that the activities would have been allowed to continue in the region, so this alternative remains plausible. Alternative 5 includes all project activities without being registered as a VCS/CCBA project. As outlined in Section 3.1, all project activities are in conformance with all applicable laws and regulations. Alternative 2 includes the granting of agricultural concessions or the development of large scale agricultural initiatives in the project area. Alternative 3 includes the granting of logging, mining or oil concessions within the project area. Because the project area is a recognized national park, it would be illegal for concessions to be granted in the project area. For this reason, Alternatives 2 and 3 are eliminated from further consideration. Alternatives 1 and 5 remain as plausible alternatives. Sub-step 1c. Selection of the baseline scenario: The investment analysis in Section 4.5, Additionality, demonstrates that Alternative 5 is much less financially attractive than Alternative 1, which indicates that Alternative 1 is the most likely baseline scenario, and is further elaborated in Section 3.1 of the PD applying methodology VM0007 module VMD0007, Estimation of baseline carbon stock changes and greenhouse gas emissions from unplanned deforestation (BL-UP), Version 3.0. 4.4.2 4.4.2.1 Human Communities: Baseline Conditions (Without the Project) Communities in the Project Area There is high risk without the project to the non-contacted indigenous peoples reported to use the southeastern portion of PNCAZ. The area these indigenous people reportedly use is highly vulnerable to illegal logging because of access from the Pisqui and the Aguaytía Rivers. The illegal logging operations were removed from this area after the park was established, and it is expected that without the project, the loggers would re-establish their logging camps. 77 4.4.2.2 Human Communities in the Buffer Zone Peruvian legislation restricts activities like timber harvesting, hunting, and fishing within park boundaries. A “without-project” scenario would simply mean less or no control over park boundaries because there would be no park guard posts or patrols at critical access points. As a result, there would be expansion of settlements and subsistence farming activities from the buffer zone into the park and an expected increase in illegal logging. In the absence of the project, extraction of park resources and deforestation could generate short-term economic gains for a few people, but these activities would be illegal and thus not without risk for most people doing the work. Expansion of agricultural lands into the park area would occur in the absence of the project, but without opportunity for land title, ownership, or stewardship. Without the project, there would be no sustainable funding to stabilize land use in these frontier communities for the long term. In general, there would be no funding for land-use planning in the buffer zone and reduced support to local and regional governments to enforce zoning. This would result in fewer hectares being under community generated management and being used in accordance with agreed upon land-use plans. Without the project, communities in the buffer zone, particularly those that lack authorized land-use zoning, would see continued increases in land speculation, and uncontrolled population growth with more in-migration, resulting in an increase in already severe erosion and soil loss, and aggravated droughts and reduced river flows. CIMA personnel have observed that communities that have not yet participated in the land-use zoning processes are witnessing increasing conflicts over land tenure and over boundaries between communities. This instability is affecting the ability of the communities to establish norms or rules for resource use and weakening community organization. The quality of life of residents will fall as they find themselves forced to move from location to location in search of less degraded forest lands, pushing them closer to or into the park. As the health of the environment drops, the need for cash to purchase basic necessities will rise, increasing intensification of land and natural resource use, furthering processes of environmental degradation. This vicious cycle has been well-documented elsewhere in the Amazon (Hecht et al 1990 and Colchester et al 1993). One indicator of similar processes occurring here comes from observation of events in 2005-2007, when temporary setbacks in funding resulted in the withdrawal of CIMA’s services from some communities, particularly Shamboyacu, Tres Unidos, and Biavo. Land speculation rose, migration increased and land became concentrated in fewer hands, pushing displaced people into more remote areas in the buffer zone, and closer to the park. On the Ucayali side, there is also clear evidence that when communities are not engaged, processes of land erosion accelerate. Such was the case in the North-East sector, near the Cushabatay River, where in 2006-2007 rumors of a road project connecting the region to Lima, resulted in a sudden rush to increase the monocultivation of corn. The migration of people from the Department of San Martín increased and significant deforestation occurred. Community residents reported to the technical team in the Contamana office that droughts have led to diminished harvests and people in the region have not capitalized on their investment. If CIMA can no longer operate in the region, then an important link between the communities and Municipal and Department level governments will be weakened. In the absence of the REDD project, neither the Department nor Municipal governments have the resources to maintain the current level of land-use zoning support. Municipal budgets are limited and there is typically only one person available to provide such technical support. As a result, communities will be increasingly vulnerable to displacement or to involvement with illegal extractive activities and illegal commercial activities (e.g., coca production). The livelihoods of rural residents are tightly linked to natural resources, and long-term availability and persistence of these resources requires appropriate management and protection, as afforded by the project. Without the project, a lower number of communities will have their needs met through sustainable economic activities and individuals will not be developing new technical skills in resource management, project administration and governance. Few communities will have the resources or skills to develop and implement quality of life plans and fewer women will be involved in planning and governance activities. 78 There would also be a reduction in temporary and long-term local employment as MUF facilitators, official and communal park guards and technical team members would no longer be needed. In addition, park guard station supplies are obtained locally, adding to the local economy. In sum, the evidence is clear that the work CIMA has undertaken to stabilize land use and improve quality of life has been successful and led to increased positive perceptions of the park. Without sustained funding, all of these gains could be lost as communities experience increased environmental degradation. Deforestation and forest degradation have serious implications for the region’s climate and for the provision of ecosystem services, something that also directly affects local populations. Deforestation can result in increased local temperature and changes in precipitation regimes, can lead to extreme soil erosion, and can negatively affect surface water resources that are crucial for local villagers. In the without project scenario, the increased deforestation and erosion would destroy many of the ecosystem services provided by the project, including the drying of rivers, severe floodings and droughts, loss of top soil, and pollution and sedimentation of watersheds. Many of these effects were already being observed by local residents in some of the regions most severely devastated by deforestation. Section 5.6 outlines the monitoring plan that was implemented, along with specific parameters that were measured, to track the project’s impact on the communities. Section 7.1 summaries the specific impacts of the project on the human communities. 4.4.3 Biodiversity: Conditions Without the Project The impact of deforestation on biodiversity is deleterious in any landscape. In PNCAZ the impact would be especially devastating because it would fragment one of the largest protected areas and one of the last remaining, intact altitudinal corridors in the eastern tropical Andes. Without the project, notable reductions in population sizes and declines in species numbers are expected in PNCAZ and the surrounding region. Most affected will be the endemic, rare, and already threatened species that characterize the park and represent a globally important array of natural communities of the tropical Andes, which are endangered or unprotected elsewhere and are fast disappearing. As a region, the tropical Andes is expected to experience the greatest loss of species in the near future, given present rates of deforestation and projected impact of climate change (Brooks et al 2002; Malcolm et al 2006). In the absence of enforcement of park boundaries and stabilization of land-use in the buffer zone, deforestation, and forest degradation will compromise the integrity of the park. The projected deforestation results show significant deforestation along rivers and in a path across the north portion of the park. Deforestation along this path would cut the park in two and decrease the effective size of the protected area. In addition, deforestation will increase the ease of access into the park and its resources. The habitat loss and fragmentation of the park would have cascading effects on biological communities. Deforestation and degradation would alter the basic structure of the landscape as a mosaic of habitats within which many faunal species move in search of habitat, food, or reproducing grounds. Habitat fragmentation and degradation is one of the primary drivers of faunal species declines worldwide, in both terrestrial and aquatic environments. A limited number of species would thrive in the newly cleared areas, but the majority, beginning with the rare and specialized species, would decline rapidly. Also, as deforestation occurs along the rivers, it will limit the water supply for species that are unable or will not travel through cleared spaces to reach the rivers. The fragmentation of the park would have a significant impact on the larger mammals, especially spectacled bears, tapir, spider monkeys, and the large herds of white-lipped peccaries. The implications of loss of species extend beyond reduction in numbers, as deforestation can negatively affect community structure. Of particular concern would be the decline of large carnivores, seed dispersers, and pollinators, based on their roles in ecosystems. The risk of faunal extinctions is also high in PNCAZ: the RBI found more than 30 species likely new to science and potentially restricted to the park (Table 8.4). Information provided by neighboring villagers through the MUF process, park guard reports and CIMA personnel indicate local residents have been suffering the effects of deforestation in the buffer zone. According to resource use information, it is known that hunters have to travel much farther to find game, 79 especially in the Huallaga populations when compared to the native communities of the Ucayali – where game species and fish are the principal source of protein- who live further from access routes and therefore have more intact forest. In some areas, people have forbidden hunting of certain species to protect them from local extinction, unless it is for traditional use such as in indigenous communities. The most vulnerable game animals in the park include tapir, spider monkey, and curassow. Aquatic systems suffer degradation as a result of deforestation. The direct consequences of deforestation for aquatic environments have been well documented (Pusey and Arthington 2003) and include increased sediment, increased water temperatures, greater runoff from rain events, changes to river channels, and pollution. Of most concern for aquatic biota is increased sediment loading, as it alters aquatic habitats and results in physiological stress for gill-breathing organisms. Deforestation in other parts of the tropical Andes has been linked to major reductions in fish species richness, and the elimination of migratory fishes, such as Brycon, Prochilodus, and Salminus (Winemiller et al. 2008). These same genera are known to occur in streams of PNCAZ. Through the MUF process and the work monitoring the effects of extraction activities in the buffer zone, fishermen in the buffer zone have indicated that they have observed declines in several catfish such as Zungaro (Zungaro zungaro), Dorado (Brachyplatystoma sp.), Doncella (Pseudoplatystoma fasciatum) and Carachamas (Chaetostoma and other Loricariids), as well as Boquichico (Prochilodus nigricans) among others, over the last ten years. The fact that PNCAZ encompasses the headwaters of two major Amazon tributaries deserves special mention, as the impacts of deforestation in this region under the baseline scenario would be exported to downstream areas. It is well known that ecological processes occurring in headwater streams influence biological communities and ecosystem function downstream, and for this reason river basins should be managed as a unit. Aquatic ecosystems in headwater streams are often driven by allochthonous inputs from terrestrial systems; deforestation in riparian areas would compromise the habitat, community structure, and ecosystem function of these streams. Several migratory species of fishes spawn within streams of the park: their survival depends on connectivity between upstream and downstream areas, and adequate habitat quality. Without the project, increased deforestation and absence of CIMA’s activities in the buffer zone will lead to a significant increase in human activity within the park. Increased hunting pressures, stemming from uncontrolled park access in the absence of the project, would compromise survival of the more vulnerable species in PNCAZ. Indiscriminate hunting would affect large mammals (tapirs, monkeys, peccaries, deer), game birds (curassows, guans), and favored fishes most quickly. But eventually, the entire biotic community would deteriorate. Tables outlining the specific impacts to biodiversity in the absence of the project were provided in Section 5.1 of the PD. The biodiversity monitoring plan, along with specific parameters to be measured, that was implemented is included in Section 5.5 of this document. The measured impacts to biodiversity by the project are presented in Section 8.4. 80 4.5 Additionality (G2) The project applied the steps outlined in the VCS Tool, VT0001, “Tool for the Demonstration and Assessment of Additionality in VCS Agriculture, Forestry and Other Land Use (AFOLU) Project Activities” to demonstrate the additionality of the project. The baseline scenarios discussed are presented more fully in Section 4.4. 4.5.1 Investment Analysis Sub-step 2a. Determine appropriate analysis method This project generates no financial or economic benefits other than VCS related income. Therefore, Option 1, a simple cost analysis, is the appropriate analysis method. This analysis focuses solely on revenues generated by the project that can be used for project activities. Sub-step 2b. – Option I. Apply simple cost analysis The annual management costs associated with Cordillera Azul National Park are roughly $1.7 million (USD). Based on 2011 data, an estimated 39% of these costs were for park protection (i.e., park guard salaries, patrols, guard posts, training) and 36% of the costs were in support of land use, communications, quality of life, and extension activities in the buffer zone communities. Approximately 13% of the costs are for information collection and data analysis (including GIS), program development, coordination and monitoring. The remaining 12% is used for government relations, fundraising efforts to obtain bridge funds, and finance and office administration. Detailed financial information for 2008 to 2011will be provided to the project validator. With the successful validation and verification of the project, the annual costs are expected to increase 20% to an estimated average of $2.1 million (USD) annually. The additional costs are necessary to expand the land use and extension activities to a larger number of communities in the buffer zone (roughly 35% of communities have benefited to date and that proportion would increase), undertake the carbon monitoring and verification of carbon credits, expand communication efforts of the project to the secondary stakeholders, undertake outreach and capacity building among other REDD proponents in Peru, and cover inflation on such costs as salaries, transportation, and equipment. A financial statement, highlighting projected expenses and revenues for the period 2012 through 2017, will be provided to the validator. Moving forward, revenues from the sale of carbon credits will be used directly to cover costs of park management activities, the additional activities relating to the carbon project as discussed in this document, and the establishment of an endowment to ensure long-term financing for Cordillera Azul. This will allow CIMA to continue its activities that ensure reduced emissions from deforestation. Any remaining revenues will be shared with the Peruvian government. A specific revenue-sharing agreement was reviewed and agreed to by the Peruvian government. Additional information regarding the financial plan for the project is provided in Section 4.5.3. No additional sources of revenue exist for the project. Given the specific conditions under which PNCAZ was designated a national park, there is no established government funding for management of the park and protection of its intact forests. The project area will not be used for any revenue generating purposes and the organizations that have financed the REDD project to date will not provide additional funds once verified carbon credits have been generated. Additional information regarding the bridge funding to date is provided in Section 4.5.3. In accordance with the management contract, the Peruvian government is not responsible for the financing of the park management activities. SERNANP did provide a small amount of funding directly to the PNCAZ Park Head for the hiring of two assistants in 2011 and a smaller amount in 2012 for their retention. However, SERNANP is not required to continue this funding, its use is decided by SERNANP and not CIMA, and it represents less than 2% of the park management costs, so it is not considered an additional source of project income. 81 Because the proposed project activity produces no financial benefits other than VCS related income, we proceed to the common practice assessment. 4.5.2 Common Practice Step 4: Common Practice Assessment There are twelve designated national parks in Peru. Two non-profit organizations have management contracts with the Peruvian government over two of these national parks. Cordillera Azul is managed by CIMA and Bahuaja-Sonene is managed by AIDER. However, the management contracts are markedly different. CIMA has a 20-year, full management contract for all of Cordillera Azul and the buffer zone. When the project began, Aider had a 7-year contract that was limited to biological research in a small area of the park, which roughly covers 27% of Bahuaja-Sonene. In 2011, the term of AIDER’s management contract increased to 20 years but the limited scope remains. In addition, CIMA is the only entity seeking to validate and verify a REDD project for the national park’s protection. Funding for support of natural protected areas in Peru is limited. Peru has 12 national parks, but PNCAZ received no federal funding from 2008-2010 and the park received less than 2% of its budget in public funding in 2011 and 2012 as discussed in the preceding section. In 2009, the SINANPE budget shows that $1.78 million dollars was spent on 62 Natural Protected Areas excluding Machu Picchu. The financial plan includes mention of the partnerships it has with CIMA and other organizations to assist in financing the protection services. CIMA, whose purpose is the conservation of the park’s ecosystems and the engagement of neighboring communities to ensure longterm success of the conservation efforts, spends roughly $1.7 million annually. In parks managed by the national government, there tend not to be extensive activities in the buffer zones on land use planning or environmental education and the overall funding available for protected areas is clearly limited. Because of CIMA’s unique management plan and CIMA’s much more extensive activities, this project is not common practice and shows essential distinction from other national parks and conservation projects in Peru. Therefore Alternative 1 is the most likely baseline scenario. 4.5.3 Financial Plan Sustained funding for appropriate management was an issue discussed prior to designation of Cordillera Azul National Park. INRENA (now SERNANP) had insufficient funds in its annual budget to manage existing national parks and no funds for additional parks, but INRENA recognized the importance of protecting regions of global importance. The Peruvian government decided to implement a new model for managing protected areas and identified Cordillera Azul National Park as a pilot for partnering with a nonprofit organization. Because of resource limitations, it is almost certain that the Peruvian government would not have designated PNCAZ as a national park if organizations had not been willing to fund and manage the park. The non-profit organization would bear full responsibility for park management and funding. APECO, a conservation NGO that was interested in the region and was member of a consortium (Red Ambiental Peruana) that had been advocating for protected status for the region, implemented basic protection programs for the park from 2001 – 2002, through an agreement with INRENA, technical and program support from The Field Museum, and grants awarded to the Museum for work in the park. In 2002, a team of scientists and other staff that had been dedicated to the management of the newly established PNCAZ, and had participated in the rapid inventory in 2000, founded a new conservation organization called Centro de Conservación, Investigación y Manejo de Áreas Naturales – Cordillera Azul, or CIMA. CIMA’s goal was to devote itself entirely to the management and sustainability of the new national park. INRENA closely reviewed CIMA’s activities in the park and buffer zone for the seven years following establishment of the park and continued to renew CIMA’s management contract every one or two years. In 2008, the Peruvian government signed a 20-year management contract with CIMA, indicating the national government’s belief that the model had been successful and allowing this pilot model to mature. SERNANP, as the successor to INRENA, will continue to monitor CIMA’s performance. 82 By 2007, grants received by The Field Museum and CIMA for operation of the park and conservationbased activities in the buffer zone were nearly exhausted. CIMA began limiting its activities in the first quarter of 2007 due to budget cuts. In July of 2007, all CIMA staff resigned because program funding ended. Some were rehired as new funding permitted. The Field Museum and CIMA had been aware of the need for a mechanism to provide sustainable funds for management of Cordillera Azul and its buffer zone. In 2007, the two institutions recognized that a REDD project may provide an option for sustainable funding for the park and buffer zone activities. After much investigation to learn more about REDD, the two organizations actively sought project sponsorship to provide funding for the development of the REDD project. The Field Museum and CIMA made numerous presentations to a variety of organizations regarding REDD and the need for the park to have a sustainable source of funding for the future. The goal was to provide funds to cover the operating costs for the park and to establish an endowment for the ongoing management of the park. Bridge funding came in through several grants in 2007 and 2008 from organizations such as USAID, the Gordon and Betty Moore Foundation, the MacArthur Foundation, the JRS Biodiversity Foundation and AECID, to assist with operations until a permanent source of funding for CIMA’s activities at PNCAZ could be found. These funds allowed CIMA to expand its park management programs back to full capacity. In 2008 The Field Museum received funds from Exelon Corporation and in 2009 from the Frankel Family Foundation to develop a REDD pilot project, including the documentation and modeling to generate carbon credits. When the bridge funds were provided, it was not understood how long it would take for the VCS methodologies to be approved and implemented. By August 2010, CIMA had insufficient funds to continue the full implementation of the project in the buffer zone. CIMA and The Field Museum negotiated with funders to obtain additional bridge funding. Additional funding was provided by USAID and the Gordon and Betty Moore Foundation. These funds have allowed the project to continue its protection activities and prepare the REDD project. CIMA will once again have insufficient funding in early 2013 however and these funders have indicated that they can no longer provide additional bridge funds. Therefore, success of the project is contingent on the sale of carbon credits. The sale of carbon credits from project is the major source of funding in 2013 and 2014 and the sole source of funding in following years. There are two factors affecting the potential revenues from the sale of the project’s carbon credits: the volume of carbon credits and the price received for those credits. To be conservative, the financial statements assumed that only 80% of the project’s carbon credits would be available for sale, that the leakage would be 20% and that the risk rating would also be 20%. These are very conservative assumptions. The financial statements also conservatively assume a carbon market price of $3 USD per tonne of CO2 for tons verified during the first monitoring period (2008-2012), $4 USD per ton for the second monitoring period, and an average of $4 - $5 USD per ton for the third and fourth monitoring periods. This assumption is based on current voluntary carbon market prices. It was also assumed in the financial statements that the sale of carbon credits would occur every two years to keep the costs of an external verifier manageable and to spread out the work load of CIMA staff that support carbon credit verification. The amount of revenues generated from the sale of carbon credits will dictate how revenues will be used. CIMA has an agreed upon revenue sharing plan with the Peruvian Government that will dictate the distribution of funds. A third party financial institution will be responsible for distributing the funds in accordance with the revenue sharing plan. Revenues will be shared in an order that reflects the priority of maintaining the project and park protection activities. While the exact details are confidential (and will be shared with the validator), the order of distribution is as follows: 1. PNCAZ protection activities 2. PNCAZ REDD project monitoring and registration 3. PNCAZ Endowment Fund 4. SERNANP (minimum amount) 5. Field Museum partial investment recovery (first two monitoring periods only) 83 6. CIMA Operational Reserve 7. SERNANP (any remaining funds) As stated earlier, the priority is to use any carbon revenues for the management of the park. In the event that either not all of the credits are sold each monitoring period or carbon offset prices are less than projected, then all of the money will be used for park management and there will be no payment of investment recovery costs to The Field Museum, no money put into an Operating Reserve, and no money shared with the Peruvian government. On the other hand, if carbon prices are higher than expected and all the carbon credits sold, then more money than indicated in the financial statements will be shared with the Peruvian government net of the stated payments to The Field Museum and CIMA’s contribution to its Operating Reserve. Given this arrangement, there is very low risk that the project cannot be fully funded with the sale of carbon credits. As described in Section 2.5, CIMA places a great emphasis on responsible management and use of its funds. CIMA will provide the validator with any records needed to demonstrate the financial health of the organization. 5 MONITORING DATA AND PARAMETERS 5.1 Description of the Monitoring Plan (CL3, CM3 & B3) The project monitoring plans are described in Sections 5.4: carbon monitoring plan, 5.5: biodiversity monitoring plan and 5.6: community monitoring plan. The project plans to conduct carbon monitoring events every two years and account for avoided emissions, project emissions and leakage at that time. Social and biodiversity monitoring events will occur every two or four years in conjunction with data collection. Dissemination of results and reports will occur in accordance with the plan outlined in Section 2.7.3. 5.2 Data and Parameters Available at Validation (CL3) Details on data and parameters available at validation are provided in the verified Carbon Monitoring Report in Appendix 1. 5.3 Data and Parameters Monitored (CL3, CM3 & B3) Details on carbon data and parameters monitored subsequent to the validation are provided in the verified Carbon Monitoring Report in Appendix1. Details on social and biodiversity parameters monitored subsequent to the validation are provided in Sections 7.3 and 8.3 respectively. 5.4 5.4.1 Description of the Carbon Monitoring Plan Revision of the baseline The baseline as outlined here in the Project Description is valid for 10 years, through August 7 2018. The baseline will be revised every 10 years from the project start date. 84 5.4.2 Monitoring of actual carbon stock changes and greenhouse gas emissions For accounting purposes the project conservatively assumes stable stocks and no biomass monitoring is conducted in areas potentially undergoing carbon stock enhancement, as permitted in the methodology monitoring module VMD0015, hence ∆CP,Enh,i,t is set to 0. Monitoring of actual emissions in the project area focuses on: ● Emissions due to deforestation and natural disturbance ● Emissions due to illegal degradation ● Emissions due to biomass burning Procedures and responsibilities for monitoring each of the above sources of emissions are detailed below. 5.4.3 Emissions due to deforestation and natural disturbance Forest cover change due to deforestation and natural disturbance is monitored through periodic assessment of classified satellite imagery covering the project area. Emissions (ÄCP,Def,i,t and ÄCP,DistPA,i,t for deforestation and natural disturbance, respectively) are estimated by multiplying area of forest loss detected (ADefPA,u,i,t and ADistPA,q,i,t, for deforestation and natural disturbance, respectively) by average forest carbon stock per unit area (conservatively assuming ÄCP,Dist,q,i,t and ÄCpools,Def,u,i,t = CBSL,i). Stock estimates from the initial field inventory completed in 2009, are valid for 10 years (per VM0007), so minimally through 2018. Post 2018, forest carbon stock estimates will be updated for any strata where deforestation or natural disturbance is detected. 5.4.3.1 Monitoring changes in forest cover The project boundary, as set in the PD, will serve as the initial “forest cover benchmark map” against which changes in forest cover will assessed over the interval of the first monitoring period; the entire project area has been demonstrated to meet the forest definition at the beginning of the crediting period. For subsequent monitoring periods, change in forest cover will be assessed against the preceding classified forest cover map marking the beginning of the monitoring interval. Data collection and analysis to determine forest cover change at each monitoring event will follow the procedures detailed below. The resulting classified image is compared with the preceding classified image (forest cover benchmark map marking the start of the monitoring interval) to detect forest cover change over the monitoring interval, and subsequently becomes the updated forest cover benchmark map for the next monitoring interval. Thus, the forest benchmark map is updated at each monitoring event. All changes in forest cover detected for the monitoring interval will be annualized (to produce estimates of ha for each year) by dividing the area by the number of years in the period. For each monitoring/verification date, satellite imagery for that year will be acquired and interpreted to produce a classified forest cover map in which forest and non forest are distinguished. A Minimum Mapping Unit (MMU) of 0.81 ha, corresponding to 3pixels by 3 pixels Landsat resolution (90m by 90m) will be used throughout the duration of the project crediting period. The general work flow for monitoring forest cover change is shown in Figure 7. Figure 7: General workflow for monitoring of forest cover change in the project area and leakage belt 85 Satellite Imagery Interpretation and Classification Pre-prosessing -Geo-referencing -Cloud detection -Radiometric correction -Topographic normalization -Classification -Land cover map production -Crosstabulation Post-processing -Map forest changes -Estimation of deforestation rates -Update of benchmark map The forest cover benchmark map for the project start date in August 2008 (Figure 8) establishes the extent and location of forest and non-forest at the beginning of the crediting period and the first verification interval. Figure 8: Forest cover benchmark map for project area, August 2008 86 Data collection and analysis to determine forest cover change at each monitoring event will follow the procedures detailed below. The resulting classified image is compared with the preceding forest cover benchmark map to detect forest cover change for the monitoring period, and becomes the updated forest cover benchmark map for the subsequent monitoring period. Thus, the forest benchmark map is updated at each monitoring event. 5.4.3.2 Data acquisition To estimate the change of forest cover within the project area, the benchmark map generated at the previous monitoring event (or at project start August 2008 for the first monitoring event) will be compared with a newly-generated classified forest cover map for the monitoring date. The new forest cover map for the project area will comply with the following requirements. Base satellite imagery will cover both the project area and leakage belt (i.e. monitoring of project area and leakage belt will use the same data source) and will be from a single year, though it may include a mosaic of scenes over several months. Landsat imagery has been used in historical analysis, and will likely be used in the future, but with the failure of Landsat 5 in 2011, and the sensor error with Landsat 7, a final determination of the which sensor will be used will hinge on the successful launch of the Landsat data continuity mission (LDCM) in early 2013. In the case that LDCM is not launched successfully, other medium resolution remotely sense data will be used that can calibrate to acceptable levels with the previous imagery. Imagery will be 90% cloud free. To achieve 90% classified area, where possible, clouded areas will be classified on the basis of other data sources (e.g. ground surveys in the year of interest, radar, overflights or classified imagery from a year subsequent to the monitored year). Per module M-MON, “If the areas with 10% cloud cover in either date in question do not overlap exactly, then the rate [will] come from areas that were cloud free in both dates in question.... estimated in % per year. Then, a maximum possible forest cover map [will] be made for the most recent time period [i.e. monitoring date]. The historical rate in % [will] be multiplied by the maximum forest cover area at the start of the period for estimating the total area of deforestation during the [monitoring] period.” The following cartographic data has also been collected to aid in geo-referencing and delineation of project area and leakage belt (all projected in UTM WGS 84 Zone 18 S): 5.4.3.3 - Carta Nacional 1:1 000,000 IGN (Hojas 13L, 14K, 14L, 19M, 15J, 15K, 15L, 15M, 16J, 16K, 16L, 16M, 17J, 17K, 17L, 17M, 18K, 18L, 18M) - Hidrografía y red vial - CIMA Cordillera Azul. - Project area - Leakage belt area Pre-processing As stated above Landsat moderate resolution imagery will be used preferentially. Landsat imagery is 30m multispectral data that is composed of 7 bands. One of these bands, band 6 is a thermal band, and is not used in image classification. The other 6 bands will be included in image analysis. Collected imagery will be prepared for processing and analysis to ensure that the imagery displays and overlays accurately. The following pre-processing tasks will be conducted and are detailed below: georeferencing, cloud and shadow removal. Each scene will be pre-processed and classified separately, eliminating need for radiometric corrections or topographic normalization where scenes must be mosaiced together. 87 The majority of Landsat imagery from USGS is obtained from EROS (Earth Resource Observation Systems) with multiple pre-processing steps completed. These processing steps are summarized below and more detail information can be found from NASA http://landsathandbook.gsfc.nasa.gov/level/. The 1G product available to users is both radiometrically and geometrically corrected. The correction algorithms employed model the spacecraft and sensor using data generated by onboard computers during imaging events and ground control points and a digital elevation model are also used to improve the overall geometric fidelity. The geometric correction process utilizes both ground control points ( GCP) and digital elevation models (DEM) to attain absolute geodetic accuracy. The WGS84 ellipsoid is employed as the Earth model for the Universal Transverse Mercator ( UTM) coordinate transformation. Associated with the UTM projection is a unique set of projection parameters that flow from the USGS General Cartographic Transformation Package. The end result is a geometrically rectified product free from distortions related to the sensor (e.g. jitter, view angle effects), satellite (e.g. attitude deviations from nominal), and Earth (e.g. rotation, curvature, relief). When using Level 1G processed imagery, pre-processing success must be confirmed, but frequently few extra pre-processing steps are necessary. The potential additional steps are detailed below. Radiometric correction Since change detection is conducted after classification, the only time radiometric correction is required is if severe atmospheric distortions are present in the only available imagery, or extreme topographic relief makes cloud shadows problematic. In these cases a haze reduction algorithm using a dark object subtraction may be used or a topographic normalization using a digital elevation model may be used. Geo-referencing For this procedure the August 2008 benchmark map will be used as a reference image from which all subsequent images will be geo-referenced. At least 7 well distributed ground control points (GCP) will be identified for the geo-referencing procedure. Each GCP will be known and recognizable in the source image and the reference image. A resampling operation using the nearest neighbor interpolation method, and a linear polynomial function will be used to ensure minimal distortion. The average geo-location error will not exceed 1 pixel. In the case that multiple images are mosaicked, a final image may be georeferenced to ensure accurate location. In the case that imagery is obtained with geo-rectification conducted by the image producer or provider, secondary geo-referencing is not necessary. Cloud and Shadow detection and removal Detection of clouds and shadows will be accomplished through visual inspection or combining automated cloud identification techniques and visual inspection. An unsupervised clustering technique or a post classification assessment will be used to identify all areas affected by clouds and cloud shadow. Other imagery from with 12 months of the image date may be used to fill in these cloud areas. 5.4.3.4 Interpretation and classification In this step, the scenes are interpreted by applying a classification algorithm to identify forest and nonforest categories. A two-step approach to classification will be used. In the first step, an unsupervised clustering algorithm technique will be used to classify each scene. Visual interpretation of clusters by an image analyst with knowledge of the land cover and/or with the assistance of high resolution imagery will be conducted to identify and then group all clusters into forest, non-forest, fire or fire scars, cloud and cloud-shadow and water classes. In the case of mixed classed, a second stage clustering may be employed on just the areas of confusion to see if clear classes may be identified. If clear categorization has been obtained (tested through the accuracy assessment) then step 2 can be skipped. If the classification accuracy using the unsupervised technique is not sufficient, or if the analyst prefers the use of supervised techniques, then a maximum likelihood algorithm will be used for supervised classification 88 using samples of known areas selected for training areas (AOI, Areas of Interest) for a minimum of the following classes: "non-forest" ,"forest" “fire scars” “water”. A final land use map with 2 categories (forest and non-forest) will be created to assess forest loss against the previous benchmark map. In the case of fire evidence, as can be detected through the distinct spectral signature of burn scars, typically for > 18 months, or naturally shaped ( as opposed to more typically geometrically shaped anthropogenic disturbance) patches of re-growth,or from field reports of fires that have been investigated and substantiated through remote sensing evidence, these areas will be maintained as a separate category to calculate parameter Aburn,i,t and for estimation of biomass burning emissions using the module E-BB – calculated emissions from biomass burning will be incorporated in project accounting only where they are not determined to be insignificant applying T-SIG. As mentioned above, each scene will be classified separately. The following guidelines will be taken into consideration for the imagery classification process. Each scene will be classified separately using a hard classification method. The geospatial analyst performing the classification will take into consideration the variety of features in the scene and reference training sites representing a range of categories (from within forest and non-forest) sufficient to facilitate the identification of forested locations from locations with no forest. Special attention will be given to grasslands or herbaceous wetlands, and especially old fallows and shade crops like coffee (which can be confused with forest) to avoid classification errors. Where necessary, corrections to the supervised classification will be made from visual interpretation of imagery. Once the classified map is produced, categories will be merged into two categories for change assessment: forest and non-forest. Following classification, classified scenes will then be joined to produce a final map that will be compared against the benchmark map. Post classification To ensure that the minimum forest definition is met the final classification will be filtered using a 3 by 3 mode filter. This will increase the MMU to 90m by 90 m to most closely meet the national forest definition. It will also improve any “speckle” in the classification due to small error. 5.4.3.5 Change detection Post-classification change detection techniques will be implemented for identifying forest cover change. Basic cross-tabulation techniques will be used to identify changes from forest to non-forest. Area data from the two maps (benchmark map at beginning of monitoring interval and newly-generated map for current monitoring year) will be cross-tabulated to identify locations that change from forest to non-forest during the monitoring period, which represent deforestation in the actual with-project case. The project area has many extreme topographic features- Including very steep slopes, and areas at high elevation that have minimal tree cover. These areas were removed from the spatial modeling due to their inaccessibility, and will also be removed from the change detection analysis since any land cover change in these areas is due to non-anthropogenic sources. GIS files that delineate these masked areas are archived so that each analysis will maintain the same masks. 5.4.3.6 Quality Assurance/Quality Control To ensure consistency and quality results, spatial analysts carrying out the imagery processing, interpretation, and change detection procedures will strictly adhere to the steps detailed above. All data sources and analytical procedures will be documented and archived (detailed under data archiving below). 89 Accuracy of the classification will be assessed by comparing the classification with ground truth points or samples of high resolution imagery (e.g. SPOT or Rapideye imagery). Any data collected from groundtruth points will be recorded (including GPS coordinates, identified land-use class, and supporting photographic evidence) and archived. Any sample points of high resolution imagery used to assess classification accuracy will also be archived. Samples used to assess classification accuracy should be well-distributed throughout the project area (as far as is possible considering availability of high resolution imagery and/or logistics of acquiring ground truth data), with a minimum sampling intensity of 50 points each for the forest and non forest classes. Results of the accuracy assessment will be presented and analyzed in a matrix in the format elaborated in the example below, such that the following errors are presented: Overall classification accuracy Error of omission of each land-use category (forest and non-forest) Error of commission of each land-use category (forest and non-forest) Table 5.1: Example accuracy assessment results Classification Land-use class as determined from ground-truth points Forest (100) Non-forest (100) Total Accuracy (%) Total User’s accuracy (# correct/ row total) Error of Commission (%) Forest Non-forest 95 5 100 95.0 5.0 9 91 100 91.0 9.0 104 96 200 91.3 94.8 8.7 5.2 Accuracy (%) Producer’s accuracy (# correct/ column total) Error of Omission (%) The classification will only be used in the forest cover change detection step if the overall classification accuracy, calculated as the total number of correct samples/ the total number of samples, is equal to or exceeds 90%. 90 5.4.3.7 Data Archiving All data sources and processing, classification and change detection procedures will be documented and stored in a dedicated long-term electronic archive maintained by CIMA at its main office in Lima as described in Section 5.4.8. Information related to monitoring deforestation maintained in the archive will include: ● Base (raw) imagery used (specifying type, source, resolution, imagery date, acquisition date) ● Any cartographic data used to geo-reference the image (source, base data) ● Data used for training classification ● Definition of land cover classes assessed ● Documentation of software type and procedures applied (including all pre-processing steps and corrections, spectral bands used in final classifications, and classification methodologies and algorithms applied) ● Classified images ● Data used in accuracy assessment - ground-truth points (including GPS coordinates, identified land-use class, and supporting photographic evidence) and/or sample points of high resolution imagery ● Accuracy assessment matrix with minimally the following errors presented: overall classification accuracy, error of omission of each land-use category (forest and non-forest), and error of commission of each land-use category (forest and non-forest) Data archived will be maintained through at least two years beyond the end of the project crediting period, through July 2030. Given the extended time frame and the pace of production of updated versions of software and new hardware for storing data, electronic files will be updated periodically or converted to a format accessible to future software applications, as needed. 5.4.3.8 Updating forest carbon stock estimates Forest carbon stock estimates used to calculate emissions from deforestation and natural disturbance will use estimates derived from field measurements less than or equal to 10 years old. In the event that any deforestation is discovered in the project area, forest carbon stock estimates older than 10 years will be updated for any strata where deforestation is detected. Initial above- and belowground biomass and dead wood stock estimates from the 2009 inventory are valid and treated as constant through 2018, after which they will be re-estimated from new field measurements. To re-assess forest carbon stocks, twenty (20) point samples (four clusters of five points) will be randomly located in each forest strata and measured (following field protocols in Appendix 8 of the PD) in 2018. Biomass will be estimated applying the allometric equations of Chave et al 2005 and otherwise maintain consistency with analytical procedures applied in the original 2009 inventory. For each strata, where the re-measured estimate of total forest biomass carbon (live and dead) is within the 90% confidence interval of the 2009 estimate, the 2009 stock estimate will continue to be used in the next 10 year baseline period. If the re-measured estimate is outside (i.e., greater than or less than) the 90% confidence interval of the 2009 estimate, then the 2018 stock estimate will be used in the next 10 year baseline period. 5.4.4 Quality Assurance /Quality Control and Data Archiving Procedures The following steps will be taken to control for errors in field sampling and measurements and data analysis: 91 5.4.5 1. Field crews with prior training in forest inventory will carry out all field data collection and adhere to field measurement protocols outlined in Appendix 8 of the PD. Pilot sample plots shall be measured before the initiation of formal measurements to train and appraise field crews and identify and correct any errors in field measurements. Field crew leaders will be responsible for ensuring that field protocols are followed to ensure accurate and consistent measurement. During the course of implementation, field crews were periodically apprised of measurement errors to assess progress. To ensure accurate measurements, the height of diameter at breast height (1.3 m) will be periodically re-assessed by personnel during the course of the inventory. Field crews will have fine scale forest strata maps for use in the field to precisely interpret strata/forest boundaries and identify potential areas of plot overlap. 2. Calibration of prisms will be confirmed prior to formal field measurements. All borderline trees will be measured and assessed against prism plot radius factor, which is standardized as distance to the centre of the tree: diameter at breast height. 3. An opportunistic sample of plots will be re-measured to assess measurement errors. Remeasurement for this purpose will be done by a different field crew. Measurement error will be assessed as 1/2 of the mean (absolute) percent difference between re-measured plot level biomass estimates (a valid assumption where teams are equally experienced and there are no systematic errors in measurement, which will also be appraised from the remeasurement results). Target measurement error is < 5%. 4. Field measurement data will be recorded on standard field data sheets (Appendix 8 in the PD) and transferred to electronic media (“entrada de datos PNCAZ inventario.xls”) following each return from the field. Original data sheets will be permanently archived at the CIMA office in Tarapoto and Lima, and the electronic database of all field measurements will be housed in the dedicated long-term electronic archive maintained on the CIMA server at its main office in Lima. The electronic database will also archive GIS coverages detailing forest and strata boundaries and plot locations. 5. Checks will be run for unusual (high or low) values to identify and correct any errors in recorded field data or transcription. Personnel involved in data analysis will consult with personnel involved in measurement to clarify any ambiguities in recorded field data. 6. For laboratory analysis of dead wood specific gravity, all balances for measuring dry weights will be calibrated against known weights prior to use. All calibration results will be documented and archived along with sample analysis results. 10% of samples will be reanalyzed/re-weighed to produce an error estimate Emissions due to illegal degradation Emissions due to illegal logging will be tracked by conducting MUF surveys in communities with access to the project area at least every three years. Communities surveyed will include, but not necessarily be limited to those listed in Table 5.2. 92 Table 5.2: Communities to be surveyed Region de Referencia (distrito) Centro Poblado Huimbayoc Pongo Isla Huimbayoc Pucallpa Chazuta Ricardo Palma Chazuta Callanayacu Shamboyacu Porvenir Pampa Hermosa Tahiti Pampa Hermosa Playa Hermosa Alto Biavo Los Cedros Bajo Biavo Selva Andina Alto Biavo Challual Alto Biavo Juanita Padre Abad Yamino Contamana La Cumbre Surveys will produce information on wood consumers (fuel wood and wood for construction and charcoal production) in the surroundings areas, as well as general indications on the areas where wood is sourced from and maximum depth of penetration of harvest activities from access points. In the event that any potential of illegal logging occurring in the project area is detected from the surveys (i.e. ≥ 10% of those interviewed/surveyed believe that degradation may be occurring within the project boundary), temporary sample plots will be allocated and measured in the area of the project indicated by the surveys as a potential source area for illegally-harvested wood. The potential degradation area within the project area (ADegW,i) will be delineated based on survey results, incorporating general area information and maximum depth of penetration. Rectangular plots 10 meters by 1 kilometer (1 ha area) will be randomly or systematically allocated in the area, sufficient to produce a 1% sample of the area, and any recently-cut stumps or other indications of illegal harvest will be noted and recorded. Diameter at breast height, or diameter at height of cut, whichever is lower, of cut stumps will be measured. In the event that the sample plot assessment indicated that illegal logging is occurring in the area, supplemental plots will be allocated to achieve a 3% sample of the area. Biomass will be estimated from measured diameters (conservatively assuming that diameters of stumps cut below breast height are equivalent to diameter at breast height) applying the allometric equation of Chave et al 2005 and otherwise maintain consistency with analytical procedures applied in the original 2009 PNCAZ inventory. Emissions due to illegal logging (ÄCP,DegW,i,t) are estimated by multiplying area (ADegW,i) by average biomass carbon of trees cut and removed per unit area (CDegW,i,t / APi). The more intensive 3% sample will be carried out once every 5 years where surveys and limited sampling continue to indicate possibility of illegal logging in the project area to produce an estimate of emissions resulting from illegal logging (ÄCP,DegW,i). Estimates of emissions will be annualized (to produce estimates in t CO2-e per year) by dividing the emission for the monitoring interval by the number of years in the interval. 93 The same quality assurance/quality control and archiving procedures as detailed above for updating estimates of forest carbon stocks will be adhered to in the field surveys of potential degradation areas. Within the project area and area bordering the park (PNCAZ buffer zone), routine patrols will be carried out throughout the year by park guards. Patrols will identify, and resolve where possible, any illegal wood harvest taking place in the PNCAZ and project area. There are 18 control posts and park guard centers on or near the border of the project area, from which guards will be routinely fielded on patrol routes totaling 2,041 km distance (544.6 km within PNCAZ). The total area to be routinely patrolled is located closest to communities with potential access to the park (i.e. highest potential pressure area for illegal harvest) and totals 1,779,984.7 ha (507,364.2 ha within PNCAZ). The density of patrol trails in the monitored area within PNCAZ is 1 km per 10 km^2. The location of patrol areas and park control posts are shown in Map 5, in Section 2.2.3. 5.4.6 Monitoring of leakage carbon stock changes Activity-shifting leakage in the leakage belt will be monitored by tracking forest cover change in the leakage belt (ADefLB,u,i,t), using classified satellite imagery produced following the same procedures outlined above in Section 5.4.3, referencing the 2008 forest cover benchmark map for the leakage belt (Figure 9). All changes in forest cover detected for the monitoring interval will be annualized (to produce estimates of ha for each year) by dividing the area by the number of years in the period. Note that the leakage belt includes private inholdings and ineligible areas (without forest >10 years old) within PNCAZ as well as planned deforestation areas for oil palm production in the northeast. The initial area of forest in the leakage belt is 1,920,311 ha. Figure 9: Benchmark map of forest cover in 2008 in the leakage belt 94 Parameter, ΔCpools,Def,u,i,t, (Net carbon stock changes in all pools in the project case in land use u in -1 stratum i at time t; t CO2-e ha ) is derived from estimates of CBSL,i (forest carbon stock in all pools in the baseline case in stratum i ) from PNCAZ forest inventory measurements, or for strata identified in the leakage belt but not represented in the PNCAZ inventory from peer-reviewed regional literature sources, as for initial estimates derived in Section 5.3 above. Parameter, CP,post,u,i (carbon stock in all pools in postdeforestation land use u in stratum) is assigned as the historical area-weighted average carbon stock for the converted (non forest) baseline land-use(s), the initial estimate derived in Section 5.3 above. Stock estimates will be re-assessed every < 10 years. Monitored parameters will be entered into the table format below to complete calculations of activity shifting leakage occurring in the leakage belt in the with-project case (∆CLK-ASU-LB). Table 5.3: Calculation format for area subject to activity shifting leakage in the leakage belt equation Year Derived in PD Sections 3.1 and 3.3 Derived from forest inventory estimates M-MON 4 LK-ASU 1 ΔCBSL,LK,unplanned ADefLB,u,i,t ΔCpools,Def,u,i,t ΔCP,DefLB,i,t ∆CLK-ASU-LB t CO2 ha t CO2/ha t CO2 t CO2 2009 6,910,840.7 2010 7,497,174.1 2011 9,658,074.5 Etc… 6,910,840.7 Activity shifting leakage outside the leakage belt will be tracked by monitoring deforestation in the project area (ADefPA,i,t) and leakage belt (ADefLB,i,t). The value of parameter, PROPIMM (Estimated proportion of baseline deforestation caused by immigrating population), 32.5%, as derived above in Section 5.3, will be employed for the first five years of the project. Subsequently, the parameter, PROPIMM, will be derived from the results of surveys conducted among neighboring communities every < 5 years. The same communities identified above for assessing potential for illegal degradation in the project area will be surveyed to determine for each interviewee how long the person has lived there and where did they come from prior to moving to the area. As there are sensitivities to assessing responsibility for deforestation in an interview context, the proportion of baseline deforestation caused by immigrating population will be assumed to be equal to the proportion of immigrants in the surrounding population. Immigrants are defined as someone who has lived in the area less than 5 years and came from an area outside the leakage belt. 95 Table 5.4: Calculation format for area subject to activity shifting leakage outside the leakage belt equation Derived in PD Section 3.1 LK-ASU 7 ABSL,PA,unplanned,t ALK-IMM,t ADefPA,i,t ha Ha ha LK-ASU 8 LK-ASU 9 ADefLB,i,t ALK-ACT-IMM,t ALK-OLB,t ha ha ha Derived in PD in Section 3.3 Year PROPIMM 2009 32.5% 4,256.82 1.049 2010 32.5% 5,420.34 1.049 2011 32.5% 3,216.33 1.049 Etc… Etc... Etc. Etc. 96 PROPCS LK-ASU 11 ∆CLK-ASU,OLB t CO2 MONITORING & IMPLEMENTATION REPORT VCS Version 3, CCB Standards Second Edition 5.4.7 Estimation of ex-post net carbon stock changes and greenhouse gas emissions. Estimates of GHG credits eligible for issuance as VCU’s will be calculated entering data into the table format below, where - Estimated GHG emission reduction credits = - Baseline emissions, fixed for 10 years at validation minus - Project emissions minus - Leakage minus - Non-permanence Risk Buffer withholding (calculated as a percent of net change in carbon stocks prior to deduction of leakage) Table 5.5: Estimates of GHG credits eligible for issuance as VCU’s Years Estimated baseline emissions or removals (tCO2e) 2009 1,834,510.1 2010 1,960,580.9 2011 1,337,026.1 Estimated project emissions or removals (tCO2e) Estimated leakage emissions (tCO2e) Risk buffer (%) Deductions for AFOLU pooled buffer account Estimated net GHG emission reductions or removals (tCO2e) Etc… 5.4.8 Organization and Responsibilities For all aspects of project monitoring, CIMA will ensure that data collection, processing, analysis, management and archiving are conducted in accordance with the monitoring plan. Remote sensing image analysis is conducted by CIMA’s GIS team periodically according to the procedures discussed in Appendix 4 of the PD. Field data is the result of CIMA technicians’ trips and the park guards routine and special patrols as part of their planning activities. Technicians and park guards are the key personnel in the generation of information - threats, social and environmental aspects of PNCAZ and buffer zone – and are trained to ensure that they are aware of the importance of the data they are generating. They are the first link in the chain of information flow (Figure 10). This data is recorded in the monthly reports of the technicians and park guards at the offices of the Head of PNCAZ and CIMA, and copies of the park guards’ reports are send to CIMA office in Lima headquarters. This information is analyzed by the CIMA Information and Data Specialists to provide quarterly and annual technical reports to SERNANP (or donors) about the progress in PNCAZ’s management activities, to report results and impacts of management to SERNANP, and for review by CIMA Management as appropriate. This critical information is systematized and analyzed annually by the technical staff of CIMA. Hard copies of all of the data is stored in Lima or Tarapoto. The most important information and data is converted to electronic format and placed on the server for sharing between the Lima and Tarapoto offices. This server is periodically backed up. v3.0 97 MONITORING & IMPLEMENTATION REPORT VCS Version 3, CCB Standards Second Edition Figure 10: Data flow in CIMA INFORMATION FLOW RESPONSIBLE Park guards and CIMA`s technicians Monitoring and Information responsible - CIMA GIS responsible-CIMA PNCAZ’s Management CIMA PNCAZ’s Head SERNANP MINAM Local and regional stakeholders Donors Others interested agents v3.0 Information produced in field - Monthly reports, stored al PNCAZ`s and CIMA office, in the 4 regional headquarters, with copies in Lima office. Information compilation - Data Base (digital format), in technicians computers Georeferenc. data base Monitoring, Information and SIG responsible - CIMA ARCHIVING PROCESS Data base (Excel or Access) Information analysis USERS - Data Base SIG and Thematic Maps (digital format), in technicians computers, and shared files. Periodically with a backup at CIMA’s server -Analyzed and compared data, in CIMA’s files, CIMA’s server, and periodically send to SERNANP office (reports) 98 MONITORING & IMPLEMENTATION REPORT VCS Version 3, CCB Standards Second Edition 5.5 Biodiversity Monitoring (CCB: B3.1, B3.2, B3.3) Because the park is essentially intact and sufficiently large to support basic ecological processes, the project’s primary biodiversity objective is to prevent the park’s effective size from decreasing. All biodiversity in the park will benefit given that this is a conservation project and the High Conservation Values relating to biodiversity will be maintained. The results of biological inventories conducted in the park and in the buffer zone provide an overview of the extraordinary biodiversity in the park. However, it is not practical to conduct such elaborate studies on a frequent basis, nor is the monitoring of populations of different species conducive to adaptive management. A different system of ongoing monitoring needed to be developed for fast and appropriate reaction to results in the field that relate directly to management (i.e., location and mitigation of threats and identification of opportunities). CIMA and The Field Museum developed a system called the Index for Conservation Compatibility (ICC), as mentioned in section 1.4 of the PD. It is an integrated planning and monitoring tool that incorporates social, biological, institutional, and operational aspects. The index has six levels, each denoting an incremental state of conservation success (Figure 11) and providing a recipe for reaching the next level. Holding the ICC together is a system of information management that allows CIMA to scale across geography and across levels of organization. Because the ICC is spatially based, the tool successfully depicts the heterogeneity of a site, showing areas of progress and areas of setbacks across the project zone. Figure 11: The levels of the ICC v3.0 99 MONITORING & IMPLEMENTATION REPORT VCS Version 3, CCB Standards Second Edition Complementing the ICC, CIMA will evaluate forest integrity in the project zone at two levels: landscape (hectares of forest conserved – i.e., intact forest cover) and biological community (assemblage of species that indicate lack of habitat degradation, including endemic and vulnerable species). At the landscape level, CIMA will analyze annually with satellite images (and aerial overflights when feasible) to confirm that there is no deforestation inside the park. Deforestation in the park is the best indicator readily available to the project, of any negative impact to biodiversity. Where incursions into the park are detected through review of images or park guard reports, cessation of the illegal activities and appropriate remediation become the highest management priority. In addition, CIMA will evaluate forest integrity at the landscape level using indirect information based on records of specific threats (violation of rules of use within the park) noted by park guards based on their findings or reports from communities. This information will further assist in defining threats or possible impacts to biodiversity. These proxy indicators at a landscape level were selected in instances where they were deemed to provide better data. For example, commercially valuable timber species are rare and patchily-distributed throughout the park, as can be seen on maps resulting from the project’s carbon stock inventory work. Effectively monitoring rare species, compounded with monitoring rare events (illegal logging via selective felling), is unrealistic and would be a prohibitive cost to the project (both money and time). Instead, the project chose to monitor the number of illegal incursions into the park and identify the incursions related with timber removal, a much more effective means to assess impacts on stocks of commercial tree species. The daily reporting of the park guards includes this information and allows CIMA to have realtime data on the severity of threats to these species and take specific, targeted action as needed. The additional proxy indicators in the monitoring plan were selected for similar reasons. At the biological community level CIMA will focus on organisms that indicate habitat health, range across several habitat types, and are easy to sight and identify. CIMA will specifically focus on sensitive game animals (tapir, deer, curassow, monkeys and big carnivores). Since the project began, regular observations (sightings and tracks) by park guards have occurred monthly along the regular patrol routes around 18 control posts and park guards’ centers that include a good sample of the habitat heterogeneity of the landscape. As evidenced in Map 5, the patrol routes cover areas both inside and outside of the park, ensuring monitoring of both the park and buffer zone. As discussed extensively in the PD, healthy, protected biological communities in the park will lead to improved biodiversity in the buffer zone. There are several benefits to using park guards to record information about flora and fauna, especially the species used by local villagers. Park guards routinely patrol large portions of the park and already have a system of reporting back to CIMA. Because most of the guards are from local communities, they usually have good knowledge of local flora and fauna and they receive additional training. Given the huge number of species in the buffer zone and the project’s inability to monitor every place due to its size, the MUF data collected from communities around the park also includes specific questions regarding perceptions on flora and fauna abundance and availability. Technicians and park guards collect comments on biodiversity during their rounds. This enables CIMA to gather additional data to be used in decision-making. Using the social network and involving the local communities in identifying issues provides a comprehensive, supplemental monitoring system for biodiversity issues in the buffer zone and allows CIMA to take appropriate and timely action when threats appear. When reports on biodiversity being affected are forwarded, whether from formal park-guard patrols or from perceptions of the communities, CIMA can investigate to determine the root cause and take immediate, appropriate actions before populations get affected. Finally, CIMA obtains copies of all scientific studies conducted in the park and buffer zone that include a biodiversity component. Some of the studies are conducted by CIMA but many are conducted by other university or non-profit institutions. Using all of these sources together allows CIMA to have the best possible, cost-effective information about biodiversity in the project zone. In reviewing the first set of monitoring data for biodiversity, the project identified that greater standardization and more detailed data collected during the park guard patrols would improve the quality of the data and conclusions that can be drawn. Beginning in 2013, park guards received new training and in 2014 will receive specific additional routes for biodiversity monitoring. The park guards will make v3.0 100 MONITORING & IMPLEMENTATION REPORT VCS Version 3, CCB Standards Second Edition quarterly observations in equivalent terrain in the park and in the adjacent buffer zone, within one week. These observations will occur in 2-3 hour long morning walks in the 18 control posts and park guards’ centers. Information will be collected on the key species, number of individuals, trail and specific location, time, habitat type, and weather conditions. Park guards have been, and continue to be trained in identifying and correctly reporting fauna encountered on their patrols. This process continues to evolve based on results and feedback from park guards. This new system of data collection will combine the routine routes and observations of the park guards with the new specific biodiversity monitoring routes that better control for consistent location, time of day and year, length of patrols, weather and other factors. This will improve the quality of data and the analysis that can be conducted. The changes reflect the project’s commitment to continual improvement. They do not invalidate the data from the first monitoring period but will lead to better data moving forward. Table 5.6 summarizes the variables to be used for landscape and biological community monitoring. Table 5.6: Variables for biological community monitoring VARIABLE INDICATOR DATA COLLECTION METHOD DATA SOURCE FREQUENCY Natural vegetation cover # of hectares of conserved forest (canopy cover) in the Project and in the Leakage Belt Satellite images analyzed by CIMA’s GIS team LANDSAT images, preferably in the dry season to reduce cloud cover Annual, during monitoring events (sep - oct) Presence of species locally threatened by hunting # of species registered by park guards (spp. of monkeys, tapir, deer, spectacle bear, jaguar and curassow) Park-guard reports and data from hunters Observations from park guards and hunters Monthly measurements and annual analysis Abundance of species locally threatened by hunting # of individuals by species (of monkeys, tapirs, jaguar, deer and curassow) registered by park guards Park-guard reports and data from hunters Observations from park guards and hunters Quarterly measurements and annual analysis # of unauthorized hunters, use of illegal methods of hunting, or hunting forbidden species Park-guard reports and data from hunters Observations from park guards and hunters Monthly measurements and annual analysis # of unauthorized loggers, or selective extraction of timber species (sightings or stumps) Park-guard reports and data from hunters Observations from park guards and hunters Monthly measurements and annual analysis # of exotic animal or Park-guard reports Observations from Monthly Rules of use violations or infractions according to the protection status and zoning of the park v3.0 101 MONITORING & IMPLEMENTATION REPORT VCS Version 3, CCB Standards Second Edition plant species introduced to PNCAZ and data from hunters park guards and hunters measurements and annual analysis To simplify comparisons from year to year, the index presented in Table 5.7 has been created. The final sum of the individual variable scores provides a qualitative analysis of the status of biological diversity in the PNCAZ and its buffer zone. v3.0 102 MONITORING & IMPLEMENTATION REPORT VCS Version 3, CCB Standards Second Edition Table 5.7: Index for biological community monitoring VARIABLE INDICATOR Rank 99-100% = 3 Natural vegetation cover # of hectares of conserved 96-98% = 2 forest (canopy cover) in the Project and in the Leakage Belt 91-95% = 1 80-90% = 0 # of species registered by park Presence of guards (spp. of monkeys, tapir, species locally deer, spectacle bear, jaguar threatened by and curassow). hunting (Annual Accumulated) Description Intact Forest Slightly disturbed Forest Disturbed Forest Very Disturbed Forest > 6 spp = 4 Intact Forest, low hunting activities 4-6 spp = 3 Medium hunting activities 2-4 spp = 2 High hunting activities 1-2 spp = 1 Almost extinction of sensitive spp 0 spp = 0 Extinction of sensitive spp # of individuals by species (of Abundance of monkeys, tapirs, jaguar, deer species locally and curassow) registered by threatened by park guards. hunting (By patrol event) > 10 ind.= Very high Intact Forest, low hunting activities 6-9 ind. = High Medium hunting activities 3-5 ind. = Medium High hunting activities < 2 ind. = Low Almost extinction of sensitive spp Intact Forest 0=0 # of unauthorized hunters, use 1 = -1 of illegal methods of hunting, or 2-4 = -2 hunting forbidden species > 5 = -3 Rules of use violations or infractions according to the protection status and zoning of the park Slightly disturbed Forest Disturbed Forest Very Disturbed Forest Intact Forest # of unauthorized loggers, or selective extraction of timber species (sightings or stumps) 0=0 1 = -1 2-4 = -2 > 5 = -3 Slightly disturbed Forest Disturbed Forest Very Disturbed Forest Intact Forest # of exotic animal or plant species introduced to PNCAZ 0=0 1 = -1 2-4 = -2 > 5 = -3 Slightly disturbed Forest Disturbed Forest Very Disturbed Forest Data will be compiled monthly and annually as noted, and beginning in 2014, comparisons will be formally made for sightings inside and outside the park. If a trend of lowering levels of sightings were to be detected inside the park, CIMA would first implement an immediate protection strategy to raise awareness v3.0 103 MONITORING & IMPLEMENTATION REPORT VCS Version 3, CCB Standards Second Edition and ensure that illegal activities are not occurring in the park and specifically in that area. Next, the CIMA information team would design appropriate research questions to identify the cause (threat) and to develop management activities appropriate to mitigate the threat. Data collection and information flow follows the process outlined in Section 5.4.8. The Data and Information Specialists are responsible for ensuring data collection occurs and is compiled in the appropriate time frame. They also are responsible for reporting the data to CIMA Management and other interested parties. Biodiversity data from park guard patrols and from community reports are used in numerous ways. As mentioned previously, all data collected is forwarded by park guards to CIMA daily. Precipitous changes in populations or incursions lead to immediate investigation. This may consist of special park guard patrols to investigate further or discussions with communities reporting the issues. Quarterly reports to funders include biodiversity data as do the annual SERNANP updates. The formal monitoring calculation is used annually to ensure a higher-level evaluation is conducted and no overall trends are missed. Past uses of data have included: Setting of communal use norms and standards (data used to show impact of excessive hunting or fishing). For example, records of hunting conducted within the park, wildlife sighting records, and additional studies on sustainable hunting were used to establish rules of use in communities like Chambirillo and Piquiyacu (San Martin). Identifying the need for specific research or biodiversity activities in the project zone: o Community identification of a decline in population and extraction of aquatic turtles led to the development of a repopulation program in several sectors of the buffer zone (Cushabatay y Pisqui: Loreto, Huimbayoc: San Martín). o Photographic record of Atelopus has enabled studies of their populations and the chytrid fungus that is threatening their populations in various parts of the world. o Areas with higher numbers of documented Tremarctos ornatus (spectacled bears) have been used for specific studies of this species (buffer zone and park). Developing appropriate ZEE plans for communities based on formal studies as well as community identified wildlife, hunting and fishing data to ensure plans are developed in an appropriate manner for sustainable use of the resources and in line with the community’s needs and Quality of Life plan. Establishing and supporting community conservation programs (identification of appropriate programs and monitoring of any resulting changes) Creating community communication and educational material specifically for the Protegiendo Nuestra Cuencas y Aulas en Acción including posters, brochures and other materials Direct, immediate management of infractions as well as use of data when planning special park guard patrol routes and future routine routes 5.6 Monitoring of Human Communities in the Buffer Zone (CCB: CM3.1, CM3.2, CM3.3) The monitoring of social impacts on buffer zone communities draws on guidelines offered in the Manual for Social Impact Assessment of Land Based Carbon Projects: Part II—Toolbox of Methods and Support Materials(Richards and Panfil, 2010). The project wants to ensure that it provides net benefits to local communities in a sustainable way, while minimizing risks or losses to the communities. To assess the social impact, the project follows the theory of change laid out in the Sustainable Livelihoods Framework approach, but also includes elements from the Review of Outcomes to Impact (ROtI) approach. The Sustainable Livelihoods Framework best fits the conditions on-the-ground of the majority of communities in the buffer zone because these are largely subsistence oriented, with high dependence on local natural resources for their livelihoods. Since 2002, when CIMA collaborating with The Field Museum began administration of the Park under an agreement with INRENA, a participatory methodology to design community-based conservation strategies and to measure the impact of these programs was used. Activities involve a technical team working closely with identified community leaders and organizations to implement land-use zoning, environmental education, and building of capacity to improve quality of life through strengthening the subsistence base and managing natural resources. Impacts of these programs are monitored through v3.0 104 MONITORING & IMPLEMENTATION REPORT VCS Version 3, CCB Standards Second Edition compilation of technical team reports and the MUF. In 2008, prior to the commencement of the REDD project, the technical team conducted the third MUF, which provides baseline data for measuring project impact going forward. 5.6.1 Application of ROtI and Sustainable Livelihoods Framework The ROtI Approach assesses project impact based on a “results chain” from outputs to outcomes to impacts (Richards and Panfil 2010). As such, it allows measure of progress towards goals with opportunity for iterative corrective action, as necessary. This is similar to the approach currently used by the PNCAZ team, through the Index of Conservation Compatibility (See Section 5.5). The ICC establishes the results chain through six levels (see Figure 11) that eventually indicate sustainability for the Park and its buffer zone. To measure impact using the ICC, CIMA analyzes specific outputs and determines whether the impact required to move up the ICC ladder has been achieved. The results of the analysis combining social and biological data are depicted in maps through GIS. Based on the results the team makes strategic decisions on how and where to reallocate efforts and resources, if necessary to improve efficiency and address rising threats or opportunities. To complement the ICC and assess project impact on improvements to the quality of life of off-site communities, CIMA measures specific indicators drawn from the sustainable-livelihoods framework. These indicators include several in the list approved by the Social Carbon Methodology. CIMA divides them into the five capital components that constitute “quality of life,” namely natural, social, human, physical, and economic. 5.6.2 Indicators and Methodologies Ongoing monitoring of the impact of the project on buffer zone communities is conducted in two main ways. Real-time monitoring occurs through the interaction of park guards and regional CIMA personnel and field staff directly with the communities. Complaints or suggestions can be addressed through the process described in Section 2.7.3 Stakeholder Communication Systems. Park guard and field staff reports are analyzed and synthesized quarterly and fed into the ICC monitoring system that allows for adaptive management of PNCAZ. Trends, changes, and suggestions or complaints will guide the development of new programs and modifications as necessary of existing ones. Every three years CIMA conducts a new MUF to get a more formal analysis of the status of communities and to detect positive or negative impacts of the project. The MUF is designed as a participatory data collection exercise, but data is validated through triangulation with CIMA field staff and CIMA’s technical advisors, who verify community-reported information and supplement it with quantitative surveys that address population heterogeneity and composition. To ensure high quality data collection, CIMA recruits and trains community-based facilitators who are also integral to the communications system. The MUF is redesigned as necessary to include a small and minimally intrusive household survey to be taken by a selected sample within each participating community. The survey collects household economic data on subsistence patterns and two additional exercises with focus groups capture community wide perceptions of project impacts on “quality of life.” The MUF efforts include all communities participating in the project, but samples are selected in the communities to reflect demographic and socio-economic composition. MUF data are the responsibility of and are collected through the field technical team based in each of the four regional offices. The data are stored in a database available via the Internet (Drupal software) that can be shared by the Park team and its collaborators. The data analysis is the responsibility of the CIMA Management Program, which establishes the mechanisms for internal review of information, analysis of this information, and the methodology for the return of the data to the people and its validation by the communities. Project impact will be assessed by measuring against the indicators listed in Table 5.8. These indicators were selected as the most appropriate to measure the implementation of CIMA’s activities designed to improve the quality of life in the buffer zone communities and stabilize land use through land-use zoning v3.0 105 MONITORING & IMPLEMENTATION REPORT VCS Version 3, CCB Standards Second Edition and land tenure programs. As discussed in Section 2.2, these activities directly mitigate the threats that lead to deforestation from advancing of the agricultural frontier and subsequent illegal activities. The deforestation in turn results in soil erosion, sedimentation and pollution of water, drying out of stream beds, weakened crop yields, and other negative impacts on the communities. Therefore, these indicators serve as the best measures of CIMA’s success in avoiding reduced ecosystem services and negative community impacts. Table 5.8: Social monitoring indicators VARIABLE INDICATOR DATA COLLECTION METHOD DATA SOURCE FREQUENCY Natural Capital # of hectares under community-generated management or used according to land-use plans Quarterly summaries of field staff reports and MUF MUF report and ICC maps Annually at time of ICC evaluation and more thoroughly every 3 years with MUF Social Capital # of communities implementing quality-of-life plans and sharing experiences with neighbors. MUF MUF report Every 3 years Social Capital (2) # of communities with women as active participants in REDD project interventions Quarterly summaries Annual Report Annual Human Capital # of REDD project participants applying new technical skills in resource management, project administration and governance Number of individuals certified in new skills and field staff reports ICC maps and data base Annual Physical Capital # of communities with infrastructure improvements and mechanisms for maintaining them sustainably MUF MUF report Every 3 years Economic Capital #of participating communities whose basic family and communal needs are satisfied through sustainable economic activities in accordance with land-use and quality-of-life plans MUF Economic analysis component of MUF Every three years v3.0 106 MONITORING & IMPLEMENTATION REPORT VCS Version 3, CCB Standards Second Edition 6 6.1 QUANTIFICATION OF GHG EMISSION REDUCTIONS AND REMOVALS (CLIMATE) Baseline Emissions (G2) Please see the Climate Monitoring Report in Appendix 1. 6.2 Project Emissions Please see the Climate Monitoring Report in Appendix 1. 6.3 Leakage Please see the Climate Monitoring Report in Appendix 1. 6.4 Summary of GHG Emission Reductions and Removals (CL1 & CL2) Please see the Climate Monitoring Report in Appendix 1. v3.0 107 MONITORING & IMPLEMENTATION REPORT VCS Version 3, CCB Standards Second Edition 7 COMMUNITY 7.1 Net Positive Community Impacts (CM1) As predicted in the PD, the project has had a net positive impact on all groups in the communities in the buffer zone and no high conservation values related to community well-being have been negatively affected. Details are provided in the following sections. 7.1.1 Baseline Conditions (2008) Table 7.1: Communal information, 2008 Data DATA COLLECTION METHOD 2008 DATA Natural Capital # of hectares under community-generated management or used according to land-use plans Quarterly summaries of field staff reports and MUF 21,094.14 hectares, Only 3 communities had completed the land use planning process in 2008. Social Capital # of communities implementing quality-of-life plans and sharing experiences with neighbors. MUF 0, Quality of Life Plans had not yet begun to be developed. Social Capital (2) # of communities with women as active participants in REDD project interventions Quarterly summaries 0, the field activities were limited at the project’s start and women’s groups were not yet involved specifically Human Capital # of REDD project participants applying new technical skills in resource management, project administration and governance Number of individuals certified in new skills and field staff reports 10 families were involved in learning agroforestry and technical training relating to farming MUF 0, Most communities had only basic and often insufficient infrastructure. Many had infrastructure needing repairs which the communities could not do due to the types of technology or materials needed to repair the infrastructure. MUF 0 communities, Only a few families were successfully practicing agriculture or economic activities sustainable over time VARIABLE INDICATOR Physical Capital # of communities with infrastructure improvements and mechanisms for maintaining them sustainably Economic Capital #of participating communities whose basic family and communal needs are satisfied through sustainable economic activities in accordance with land-use v3.0 108 MONITORING & IMPLEMENTATION REPORT VCS Version 3, CCB Standards Second Edition and quality-of-life plans 7.1.2 Project Conditions (2012) Table 7.2: Communal information, 2012 Data VARIABLE Natural Capital Social Capital INDICATOR # of hectares under community-generated management or used according to land-use plans # of communities implementing quality-of-life plans and sharing experiences with neighbors. DATA COLLECTION METHOD Quarterly summaries of field staff reports and MUF 2012 DATA 147,611.23 hectares, 26 communities have completed the Economic and ecological micro zoning and quality of life plans. 287 hectares, In addition, a forestry school and Botantical Gardens were created in Shamboyacu and El Biavo, San Martín; both now part of a Resolución Municipal. 9 Quality of Life Plans have been designed, finalized and implemented in the native communities of Loreto y el Ucayali; MUF 1 Quality of Life Plans are being implemented in Huánuco. 13 communities in San Martin are developing Community Rules (step prior to Quality of Life Plans). Social Capital (2) Human Capital # of communities with women as active participants in REDD project interventions Quarterly summaries # of REDD project participants applying new technical skills in resource management, project administration and governance Number of individuals certified in new skills and field staff reports 140 women of 6 native communities of La Cumbre, Manco Capac, Charashmaná, Yamino and Mariscal Cáceres, have formed formal organizations aimed at improving their quality of life by implementing production craft projects. Numerous women participated in the MUF process from a variety of communities and are participating in the development of Community Rules and Quality of Life Plans. 37 families While implementing Quality of Life Plans, individuals from Isolaya, Charashmaná, Manco Cápac and La Cumbre developed wetlands management. 30 families are now involved in v3.0 109 MONITORING & IMPLEMENTATION REPORT VCS Version 3, CCB Standards Second Edition learning agroforestry and technical training relating to farming. 1 In Yamino, infrastructure to provide local artisans a market for their goods was constructed. Physical Capital # of communities with infrastructure improvements and mechanisms for maintaining them sustainably MUF In addition the need for infrastructure usually related to drinking water and drainage was identified in the Quality of Life Plans for Puerto Adelina, Charashmaná, Yamino and Mariscal Cáceres. These have been presented for inclusion in the municipal budget for 2012-2013. The construction of the infrastructure uses local workers and materials to ensure the long term viability of the structures. 0 Economic Capital 7.1.3 #of participating communities whose basic family and communal needs are satisfied through sustainable economic activities in accordance with land-use and quality-of-life plans MUF It is too soon to state that this is occurring without projecting an outside perspective of satisfaction on to the communities. The Quality of Life Plans are being developed and implemented in order to allow the communities to define what it means for them to be satisfied and how they can do it in a sustainable manner. Several communities have started the process and are defining new opportunities for the communities as a result. Summary of Project Impacts It is clear from the variables above that the project activities to date have had a net positive impact on the communities around the project area and that the positive impacts have increased in magnitude since 2008. The MUF process enables monitoring of all community groups to evaluate whether all community groups are positively affected. To date, the MUF data has not identified any negatively affected community groups. The high conservation values associated with the communities continue to be maintained. Project activities will ensure the continuation of the ecosystem services provided to the communities by the project area, allow communities to meet their basic needs in a sustainable manner and allow for the project area to continue providing the ecosystem services needed for communities to retain their traditional cultural identities. In the expert judgment of both CIMA and The Field Museum professional staff, these benefits to communities will continue and expand with the continued implementation of the project because the sustained funding will allow the current work to continue and increased participation in targeted areas. Funding of the project will also allow CIMA to replicate activities in new communities as already v3.0 110 MONITORING & IMPLEMENTATION REPORT VCS Version 3, CCB Standards Second Edition participating communities are stabilized and empowered to continue with less intense technical assistance from CIMA. 7.2 Negative Offsite Stakeholder impacts (CM2) The project was not expected to have any direct impact, positive or negative, on communities outside the project zone and therefore defined as off-site. As a result, no mitigation plan for negative impacts was required. MUF data to date have not shown a decrease in immigration as a result of project activities indicating that no effect is being felt by source communities for immigrants. CIMA works with regional and local governments, SERNANP, MINAM, REDD groups and other protected areas to demonstrate and teach the skills needed to successfully develop and implement a REDD project. This work may have indirect positive benefits for off-site communities if similar project activities are implemented in their areas. 8 BIODIVERSITY 8.1 Net Positive Biodiversity Impacts (B1) As predicted in the PD, the project has had a net positive impact on biodiversity and no high conservation values related to biodiversity have been negatively affected. Details are provided in the following sections. 8.1.1 Baseline Conditions (2008) Table 8.1: 2008 Data and Index Rankings 2008 VARIABLE INDICATOR # of hectares of conserved forest Natural vegetation (canopy cover) in the Project and in the cover Leakage Belt Presence of species locally threatened by hunting # of species registered by park guards in the project zone(spp. of monkeys, tapir, deer, spectacle bear, jaguar and curassow) Abundance of species locally threatened by hunting # of individuals by species (of monkeys, tapirs, jaguar, deer and curassow) registered by park guards Rank 99.9 % of primary forest 3 Average: 8 key spp. 4 # of encounters: 672 Amount of rules of # of unauthorized hunters, use of illegal use violated methods of hunting, or hunting according to the forbidden species. protection status v3.0 Data # of Total individuals: 1472 # individuals/patrol: 8 2 High Abundance 30 infractions by hunters of fishers -3 111 MONITORING & IMPLEMENTATION REPORT VCS Version 3, CCB Standards Second Edition and zoning of the park # of unauthorized loggers, or selective extraction of timber species. # of exotic animal or plant species introduced to the PNCAZ 39 infractions by loggers or invaders (very small areas) -3 3 infractions by introduction of exotic species -2 Index 1 Natural vegetation cover: The analysis of the 2008 satellite imagery (For details please see the Climate Monitoring Report) shows 99.9 % intact primary forest inside the PNCAZ. Nearly one thousand hectares of deforestation are observed. Presence and abundance of species locally threatened by hunting: During 2008, park guards obtained data on the frequency (number of fauna encountered, groups of individuals counted as one encounter) and abundance (number of individuals by species, for flocks or grouped individuals) during a total of 185 routine patrols in which fauna registries were made. Park guards focused on key indicator species defined as those sensitive to hunting. A total of 1472 individuals were registered from a total of 8 indicator species. Amount of rules of use violated or infractions: The park guards look for signs of activities within the park and buffer zone inconsistent with the approved uses as defined in the law creating PNCAZ. They log information about the possible threats or infractions committed in the park on their monthly reports. For a detailed description of biodiversity prior to the project including data obtained from various scientific studies in the park and buffer zone, please refer to Section 1.2.4. 8.1.2 Project Conditions (2012) Table 8.2: 2012 Data and Index Rankings 2012 VARIABLE INDICATOR Natural vegetation cover # of hectares of conserved forest (canopy cover) in the Project and in the Leakage Belt Presence of species locally threatened by hunting # of species registered by park guards in the project zone(spp. of monkeys, tapir, deer, spectacle bear, jaguar and curassow) Abundance of species # of individuals by species (of locally threatened by monkeys, tapirs, jaguar, deer and hunting curassow) registered by park guards v3.0 Data Ranking 99-100 3 Average: 7 key spp. 4 # of encounters: 384 # of Total individuals: 895 3 # individuals/patrol: 11 112 MONITORING & IMPLEMENTATION REPORT VCS Version 3, CCB Standards Second Edition # of unauthorized hunters, use of illegal methods of hunting, or hunting forbidden species. Amount of rules of use violated according to # of unauthorized loggers, or the protection status selective extraction of timber and zoning of the park species. # of exotic animal or plant species introduced to the PNCAZ 15 infractions by hunters of fishers -3 1 infractions by loggers or invaders (very small areas) -1 0 infractions by introduction of exotic species 0 Index 6 Natural vegetation cover: The analysis of the 2012 satellite imagery (For details please see the Climate Monitoring Report) shows 99.9 % intact primary forest inside the PNCAZ. Approximately 650 hectares of deforestation are observed. Presence and abundance of species locally threatened by hunting: During January - July 2012, park guards obtained data on the frequency (number of fauna encountered, groups of individuals counted as one encounter) and abundance (number of individuals by species, for flocks or grouped individuals) during a total of 82 routine patrols in which fauna registries were made. Park guards focused on key indicator species defined as those sensitive to hunting. A total of 895 individuals were registered from a total of 11 indicator species. These numbers are especially impressive given that these compare favorably with the 2008 data, which covered an entire year and would have captured migrations or seasonal fluctuations. Amount of rules of use violated or infractions: The park guards look for signs of activities within the park and buffer zone inconsistent with the approved uses as defined in the law creating PNCAZ. They log information about the possible threats or infractions committed in the park on their monthly reports. Additional scientific studies conducted during the monitoring period that have a biodiversity component include those listed in Table 8.2a. The Plan de Investigaciones includes a list of all scientific investigations conducted in the park or buffer zone and is maintained by CIMA. Table 8.2a New research conducted during the monitoring period Date Institution Title 2009 - 2011 Museo de Historia NaturalUNMSM / Centro de Conservación, Investigación y Manejo de Áreas Naturales-CIMA APECO/ Centro de Conservación, Investigación y Manejo de Áreas Naturales-CIMA Determinación de la Linea Base para el monitoreo comunal de recursos naturales en las comunidades nativas de las cuencas del Pisqui y Aguaytia: Linea Base Hidrobiologica y Pesca (se continuo 2010 y 2011) 2009 - 2011 2009 - 2011 v3.0 Determinación de la Linea Base para el monitoreo comunal de recursos naturales en las comunidades nativas de las cuencas del Pisqui y Aguaytia: Linea Base caceria (se continuo 2010 y 2011) UNALM/ Centro de Conservación, Determinación de la Linea Base para el monitoreo comunal de recursos naturales Investigación y Manejo de Áreas en las comunidades nativas de las cuencas del Pisqui y Aguaytia: Linea Base Naturales-CIMA Etnobotanica (se continuo 2010 y 2011) 113 MONITORING & IMPLEMENTATION REPORT VCS Version 3, CCB Standards Second Edition 2008 CIMA - INRENA Registros de oso andino por guardaparques en el PNCAZ y su ZA 2008 CIMA Mapeo de Usos y Fortalezas MUF 2008 2009 Terra Carbon / UNALM Determinacion del stock de carbono en zonas vulnerables a la deforestación en el PNCAZ 2009 Ingeniero forestal consultor para CIMA Estudio (inventario) forestal y clasificación de tipos de cobertura en sector Pisqui 2009 Ingeniero forestal consultor para CIMA Estudio (inventario) forestal y clasif. de tipos de cobertura en sectro Cushabatay 2009 TFM Inventario rapido en el valle del Ponasa, Shamboyacu 2009 Pontificia Universidad Católica. Geografía y Medio Ambiente. Análisis de la distribución del oso de anteojos (Tremarctos ornatus) caso: PNCAZ 2009 UNALM - APECO - MUSM CIMA Linea Base y Monitoreo social y ambiental: uso de recursos naturales por CCNN. del Pisqui y Aguaytia 2009 CIMA Linea Base y Monitoreo social y ambiental: uso de recursos naturales por CCNN. del Pisqui y Aguaytia 2009 ICRAF - CIMA Arte Kakataibo 2009 IIAP, Consultor para CIMA Estudio de suelos y capacidad de uso mayor en sector Pisqui 2009 IIAP, Consultor para CIMA Estudio de suelos y capacidad de uso mayor en sector Cushabatay 2009 Universidad Nacional Federico Villareal / CIMA Evaluación de parámetros climáticos y diseño de sistema de monitoreo meteorológico 2010 CORBIDI Monitoreo poblacional y de quitridiomicosis en Atelopus andinus y A. pulcher, e inventario general de especies de herpetofauna en el Parque Nacional Cordillera Azul 2011 CIMA Diagnostico de PIA del PNCAZ y su ZA 2011 CIMA Aprovechamiento de aguaje en las comunidades tivas de Isolaya, Charashaná, La Cubre y Manco Capac. v3.0 114 MONITORING & IMPLEMENTATION REPORT VCS Version 3, CCB Standards Second Edition 2012 CIMA Mapeo de Usos y Fortalezas MUF 2012 The results of these studies were used in multiple ways as discussed in Section 5. Examples of use include: inputs for CIMA’s biodiversity monitoring and activity planning identification of new species or species ranges for the park or buffer zone which are highlighted in the summary of project biodiversity - inputs for a wide range of community activities (Quality of Life planning, zoning, communication and education programs) - provide new data to local, regional and national government authorities for their planning and monitoring use 8.1.3 Summary of Project Impacts As discussed in Section 5, park guard patrol routes used to collect the monitoring data include large areas both in the park and in the buffer zone, resulting in monitoring of the entire project zone. The data presented above shows a clear net positive impact on biodiversity as a result of the project activities. Forest cover inside the park remained about the same, but the overall Index Score jumped from a 1 in 2008 to a 6 in 2012. This was due to similar findings for number of species and average abundance, but a significant reduction in the number of infractions for illegal use of the park area and exotic species. Exotic species logged were animals such as dogs, which are used to assist hunters. These species left the project area when the hunters left. Communities did not report any new isolated negative biodiversity issues during the monitoring period and the scientific research provided supplemental data for use in project activities and monitoring. MUF data demonstrated a perception that flora and fauna both thrived when the park is protected and sustainable community activities are implemented. Therefore biodiversity has remained about the same over the monitoring period with a significant decrease in the number of infractions for illegal use of the park area. These results are consistent with a successful conservation project and indicate that the project has had a net positive impact on biodiversity over the without project scenario and maintained the High Conservation Values relating to biodiversity. As stated in the PD, no GMOs or invasive or exotic species were used in the project activities. Project activities lowered the number of incidents where exotic species were used by those not associated with the project. The Exceptional Biodiversity Benefits remain intact as well. 8.2 Negative Offsite Biodiversity Impacts (B2) This project is devoted to preventing negative biodiversity impacts inside the project area and in the surrounding lands (buffer zone). Project activities themselves generate positive, not negative impacts on biodiversity. Work with communities in the buffer zone focuses primarily on land-use stabilization and wildlife management. Both efforts benefit native biodiversity outside the park. In addition, stream recovery and agroforestry with native species is promoted in the buffer zone as well as reducing hunting pressure v3.0 115 MONITORING & IMPLEMENTATION REPORT VCS Version 3, CCB Standards Second Edition inside PNCAZ, further benefiting the native biota in the region which in turn benefits the local communities. For example, “huanganadas” (big herds of peccaries) have been seen entering the buffer zone as noted in Table 8.3. Similar positive impacts may also be felt beyond the buffer zone (offsite). Stream recovery and erosion prevention measures will have impacts on biodiversity all along the stream and downstream waters. Increases in herd size and habitat may allow biota to travel in wider ranges and some locations offsite might also notice increases in biota numbers. Table 8.3: Wildlife Sightings in the PNCAZ Buffer Zone (Source: CIMA Field Technical Team) ITEM Date Community 1 2006 El Paraíso (Tres Unidos) In the El Paraíso population center, a herd of 230 white lipped peccary was observed heading towards Paltaico. The population shot 23 with shotguns. No specific date Event 2 15/06/2008 Pilluana and Mishquiyacu A large herd of white lipped peccary was observed (about 300) passing through Pilluana, in the Mishquiyacu valley. The local population hunted about 30 with shotguns. 3 15/09/2008 Muralla (Alto Biavo) A herd of white lipped peccary was observed heading towards PNCAZ crossing from the right bank to the left bank of the Biavo River. 4 22/12/2008 Pueblo Libre Km. 45 A herd of approximately 250 white lipped peccary, including large and small animals, was seen coming from PNCAZ by Cedros heading towards Pueblo Libre (45 km). The population hunted them with shotguns and clubs. 5 20/05/2008 Chimbana A sighting was made of approximately 500 white lipped peccary at the first river crossing of the Yanayacu River in Chimbana y Santa Rosillo 6 25/02/2009 Pongo Isla A sighting of white lipped peccary in the afternoon crossing the Huallaga from left to right in the Cerro Escalera area heading towards PNCAZ. The White lipped peccaries use this area as a corridor. 7 15/06/2009 Lejía A herd of 200 white lipped peccary was seen in the lower part of Lejía 8 15/08/2009 Nuevo Loreto About 300 white lipped peccary were sighted 30 feet from the center of Nuevo Loreto in the Topasapa sector of the buffer zone 9 01/01/2010 El Porvenir A herd of 150 white lipped peccary was spotted leaving PNCAZ heading towards Porvenir. The entire herd did not pass through the town though due to the noise from villagers. 10 10/01/2010 Sector Chimbadillo A herd of 200 white lipped peccary was seen leaving PNCAZ and heading north east. v3.0 116 MONITORING & IMPLEMENTATION REPORT VCS Version 3, CCB Standards Second Edition In the worst-case scenario, the project’s efforts will result in unchanged conditions for biodiversity outside the project zone. More likely, results from project activities will greatly improve conditions for native biodiversity in the buffer zone, in accordance with the Source and Sink Model (Pulliam 1988) that has been described in the first Master Plan for PNCAZ (INRENA 2006), which in turn will positively impact the off-site biodiversity. Combined with the positive benefits for biodiversity in the park, the overall effect of project activities for biodiversity conservation will be extremely positive. Protection of species in the park will likely result in greater numbers of the species in the buffer zone as well. By providing a protected environment, especially for overhunted game animals such as deer, peccaries (white lipped and collared), tapir, several species of monkeys, guans and curassow, the park will allow the populations of the species to increase and stabilize. Larger populations inside the park will lead to larger populations in the buffer zone as animals travel or migrate. This benefits both the animals and the communities in the buffer zone. As discussed in Section 4.4.3 of the PD hunting provides an important source of protein for the communities. This concept is discussed in more detail in the wildlife management section of the 2003 Plan Maestro and in the PD. Because no negative impacts for offsite biodiversity are expected, no mitigation plans are required and none were implemented during this period.. 8.2.1 Soil and Water Resources Project activities inside the park will secure long-term protection of natural vegetative cover in Cordillera Azul. In the buffer zone, project activities will focus on land-use stabilization activities. Effective implementation of these efforts will promote integrated protection of soil and water resources through maintenance of forest cover. Project activities will help to preserve the integrity of headwater streams and their ability to provide the goods and services that provide the basis for human life in the Amazon and Andean foothills. The reliance of buffer zone communities and regional watersheds and ecosystems on the rivers in the park has been discussed further in the community and ecosystem services sections of the PD. 8.3 Exceptional Biodiversity Benefits (GL3) The success of the project’s activities in producing net positive impacts on the biodiversity means that the project activities have also protected the endemic and endangered species in the project area. In fact, the park was recognized by SERNANP as the protected area that exhibits the best conservation rate in the national protected area system. As described earlier in the PIMR, the project offers remarkable opportunities for protection of large numbers of endemic and rare species in all groups of organisms sampled in the Rapid Inventory— vascular plants, fishes, amphibians and reptiles, birds, and large mammals. The project zone also harbors many range-restricted species and unique assemblages of species. New species have been identified in the park since the PD was written and additional species have been classified more accurately. An updated summary of the exceptional biodiversity benefits of the project was presented in Section 1.2. Results of the extensive investigations conducted are summarized in Table 8.4. v3.0 117 MONITORING & IMPLEMENTATION REPORT VCS Version 3, CCB Standards Second Edition Table 8.4: Numbers of species observed, estimated, and new to science in the project zone Taxa Observed in the Rapid Inventory Total Species Observed (IBR and Other Inventories ) To 2008 To 2012 > 1600 Plants 1600 > 1600 Fishes 84 176 Amphibians 58 66 Estimated for the Region New to Science since 2000 6000 >12 200 > 15 71 8 210 Reptiles 26 41 59 Birds 575 611 617 Mammals 71 91 v3.0 2 800 1 120 1 118 MONITORING & IMPLEMENTATION REPORT VCS Version 3, CCB Standards Second Edition 9 ADDITIONAL INFORMATION Full details of the baseline deforestation model used and its results are presented in the PD. Additional detail regarding community characteristics, including socio-economic data is also presented in the PD. v3.0 119 MONITORING & IMPLEMENTATION REPORT VCS Version 3, CCB Standards Second Edition 10 REFERENCES Alverson, W.S., L.O. Rodríguez, and D.K. Moskovits (editors). 2001. Perú: Biabo Cordillera Azul. Rapid Biological Inventories Report 2. Chicago, Illinois: The Field Museum. Baker TR., Phillips OL., Malhi Y., Almeida S., Arroyo L., Di Fiore A., Killeen TJ., Laurance SG., Laurance, WF., Lewis SL., Lloyd J., Monteagudo A., Neill DA., Patiño S., Pitman NC., Silva JN., Vásquez Martínez R. Variation in wood density determines spatial patterns in Amazonian forest biomass. Global Change Biology. 2004; 10:545-562. Brooks A.J., R.J. Schmitt., S.J. Holbrook. 2002. Declines in regional fish populations: have species responded similarly to environmental change? Marine and Freshwater Research. Volume 53, Number 2 (2002), pp. 189-198. Brooks, T.M. et al. 2002. Habitat loss and extinction in the hotspots of biodiversity. Conservation Biology 16:909-23. Chave, J., Andalo, C., Brown, S., Cairns, M.A., Chambers, J.Q., Eamus, D., Folster, H., Fromard, F., Higuchi, N., Kira, T., Lescure, J.P., Nelson, B.W., Ogawa, B., Puig, H., Riera, B. and T. Yamakura. 2005. Tree allometry and improved estimation of carbon stocks and balance in tropical forests. Oecologia 145:87-99. Colchester, M. and Lohmann, (eds.), The Struggle for Land and the Fate of the Forest, 1993, Zed Books Dancé, J. 1981. Tendencias de la deforestación con fines agropecuarios en la Amazonía peruana. Revista Forestal del Perú 10 (1-2): 177-184. Del Campo, H. and A. Wali. 2007. Applying Asset Mapping to Protected Area Planning and Management in the Cordillera Azul National Park, Peru. Ethnobotany Research & Applications 5:025-036. FENACOCA/IBC. 2005. Propuesta de Creación de dos Reservas Territoriales a favor de los Cacataibos en aislamiento. Aguaytia-Lima, Peru. 275 pp. Hecht, Susanna and Cockburn, Alex, The Fate of the Forest: Developers, Destroyers and Defenders of the Amazon, 1990, Verso Press. INEI. 2002. Perú: Proyecciones de Población por años calendario, según departamentos, provincias y distritos (periodo 1990-2005). INEI-Dirección Técnica de Demografía e Indicadores Sociales. Boletín Especial Nº 16. 159 pp. INRENA. 1995. Mapa Ecológico del Perú. Guía Explicativa. Ministerio de Agricultura. República del Perú. Lima. INRENA 2006. Plan Maestro del Parque Nacional Cordillera Azul: 2003 – 2008. Editado por CIMA. Lima. 273pp. IPCC 2006 Guidelines for National Greenhouse Gas Inventories. Chapter 4 AFOLU (Agriculture, Forestry and Other Land-use). Lujan, N., M. Hidalgo and D. Stewart 2010. Revision of Panaque (Panaque), with Descriptions of Three New Species from the Amazon Basin (Siluriformes, Loricariidae). Copeia 2010, No. 4, 676–704 v3.0 120 MONITORING & IMPLEMENTATION REPORT VCS Version 3, CCB Standards Second Edition Malcolm, J.R., C. Liu, R.P. Neilson, L. Hansen, and L. Hannah. 2006. Global warming and extinctions of endemic species from biodiversity hotspots. Conservation Biology 20:538-48. O'Neill,J.P., D.F.Lane, A.W.Kratter, A.P.Capparella, and C.Fox J. 2000. A stricking new species of barbet (Capitoninae: Capito) from the eastern Andes of Peru. Auk 117:569-577 Pequeño, T. 2007. Camino a un Monitoreo Integral en el Parque Nacional Cordillera Azul y su Zona de Amortiguamiento. CIMA. Lima, Perú. 91 pp. Portuguez, H.; Huerta P. 2005. Mapa de deforestación de la Amazonía peruana. INRENA-CONAM. 101 p. Pusey, B.J. and A.H. Arthington. 2003. Importance of the riparian zone to the conservation and management of freshwater fish: a review. Marine and Freshwater Research 54(1):1-16. Reátegui, F. 1996. Monitoreo continuo de los procesos de deforestación en la Amazonía peruana. Trabajo profesional presentado para optar el título de ing. Forestal. UNALM. 84 p. Rengifo B., M. Hidalgo, N. Lujan, J. Armbruster, D. Stewart y H. Ortega. 2007. Notables especies nuevas de carachamas (Pisces, Siluriformes, Loricariidae) de la región Norte y Central de la Amazonía Peruana. Poster en la Reunión de Ictiólogos y Herpetólogos en Saint Louis - USA Richards, M. and S. Panfil, 2010. Manual for Social Impact Assessment of Land Based Carbon Projects: Part II—Toolbox of Methods and Support Materials. http://www.foresttrends.org/documents/files/doc_2437.pdf Shoch, D., V. Barrena y J. Rosero. 2009. Protocolos de campo para la Medición y Monitoreo de la Biomasa Forestal en el Parque Nacional Cordillera Azul. Terra Carbon, preparado para CIMA y The Field Museum. 20 pp. SERNANP 2009. Plan Financiero del SINANPE. 93 pp. http://www.sernanp.gob.pe/sernanp/archivos/documentos/Doc._Planificacion/plan_financiero_SINANPE %20OK.pdf Weber, C. and J. Montoya- Burgos. 2002. Hypostomus fonchii sp.n. (Silurifromes: Loricariidae) de Perú, Una Especie Clave que sugiere la Sinonimia de Cochliodon con Hypostomus. Revue Suisse de Zoologie 109 (2): 355- 368. 2002. Winemiller KO, López Fernández H, Taphorn DC, Nico LG, Barbarino-Duque A. 2008. Fish assemblages of the Casiquiare River, a corridor and zoogeographic filter for dispersal between the Orinoco and Amazon basins. Journal of Biogeography 35:1551-1563. Winemiller, K.O., A.A. Agostinho, and E. Pellegrini-Carasmachi. 2008. Fish ecology in tropical streams. In: D. Dudgeon (ed). Tropical Stream Ecology. Aquatic Ecology Series. London: Academic Press. Young, K. & B. León. 1999. Peru´s humid eastern montane forests: An overview of their physical settings, biological diversity, human use and settlement, and conservation needs. DIVA Technical Report N°5. Denmark. 97 p. Zarate, H., J. Galdós y P. Ticona. 1997. Geología de los Cuadrángulos de San Rafael, rio Cushabatay e Inahuaya. INGEMMET, Boletín 100, Serie A: Carta Geológica Nacional. Lima, Perú. 191 pp. v3.0 121


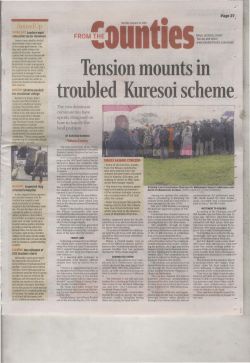
© Copyright 2026