
FIVE COUNTY ASSOCIATION OF GOVERNMENTS Consolidated Plan ANNUAL ACTION PLAN 2009
FIVE COUNTY ASSOCIATION OF GOVERNMENTS
Consolidated Plan
ANNUAL ACTION PLAN 2009
December 1, 2008
Table of Contents
CHAPTER 1. EXECUTIVE SUMMARY . . . . . . . . . . . . . . . . . . . . . . . . . . . . . .
A. EVALUATION OF CURRENT NEEDS . . . . . . . . . . . . . . . . . . . . . . . . . . . . . . .
B. EVALUATION OF PAST PERFORMANCE . . . . . . . . . . . . . . . . . . . . . . . . . . .
C. FUNDING PRIORITY DECISION MAKING PROCESS . . . . . . . . . . . . . . . . .
D. SUMMARY OF CITIZEN PARTICIPATION AND CONSULTATION . . . . . .
E. PRIORITIES . . . . . . . . . . . . . . . . . . . . . . . . . . . . . . . . . . . . . . . . . . . . . . . . . . . . .
1.
Housing . . . . . . . . . . . . . . . . . . . . . . . . . . . . . . . . . . . . . . . . . . . . . . . . . . . .
2. Community Development . . . . . . . . . . . . . . . . . . . . . . . . . . . . . . . . . . . . .
3. Economic Development . . . . . . . . . . . . . . . . . . . . . . . . . . . . . . . . . . . . . . .
4. Summary of One-year Performance Measures . . . . . . . . . . . . . . . . . . . .
1
1
2
3
3
4
4
5
5
6
CHAPTER 2. ANNUAL HOUSING & HOMELESS NEEDS ASSESSMENT . 8
A. MULTI-FAMILY RENTAL HOUSING, PUBLIC HOUSING AND OTHER
USES . . . . . . . . . . . . . . . . . . . . . . . . . . . . . . . . . . . . . . . . . . . . . . . . . . . . . . . . . . . 8
1.
Regional Housing Vision Statement . . . . . . . . . . . . . . . . . . . . . . . . . . . . . 8
2. Affordable Housing Defined . . . . . . . . . . . . . . . . . . . . . . . . . . . . . . . . . . . 8
3. Income Guidelines . . . . . . . . . . . . . . . . . . . . . . . . . . . . . . . . . . . . . . . . . . . 8
4. Income Data . . . . . . . . . . . . . . . . . . . . . . . . . . . . . . . . . . . . . . . . . . . . . . . . 10
5. Housing Market Analysis . . . . . . . . . . . . . . . . . . . . . . . . . . . . . . . . . . . . . . 11
6. Household Size . . . . . . . . . . . . . . . . . . . . . . . . . . . . . . . . . . . . . . . . . . . . . . 12
7. Fair Market Rents . . . . . . . . . . . . . . . . . . . . . . . . . . . . . . . . . . . . . . . . . . . . 13
8. Public Housing . . . . . . . . . . . . . . . . . . . . . . . . . . . . . . . . . . . . . . . . . . . . . . . 14
9. Low Income Housing Tax Credit (LIHTC) Program . . . . . . . . . . . . . . . . 16
10. Workforce Housing . . . . . . . . . . . . . . . . . . . . . . . . . . . . . . . . . . . . . . . . . . . 17
B.
SINGLE-FAMILY . . . . . . . . . . . . . . . . . . . . . . . . . . . . . . . . . . . . . . . . . . . . . . . . . 17
C.
DESCRIPTION AND STATUS OF REGIONAL HOMELESS COORDINATING
COUNCIL . . . . . . . . . . . . . . . . . . . . . . . . . . . . . . . . . . . . . . . . . . . . . . . . . . . . . . 18
1.
Continuum of Care Consistency Assessment.. . . . . . . . . . . . . . . . . . . . . 18
2. Needs Assessment . . . . . . . . . . . . . . . . . . . . . . . . . . . . . . . . . . . . . . . . . . . 19
3. Implementation Plan . . . . . . . . . . . . . . . . . . . . . . . . . . . . . . . . . . . . . . . . 22
D.
OVERALL HOUSING NEEDS ASSESSMENT . . . . . . . . . . . . . . . . . . . . . . . .
1.
Local Government Housing Needs Summary . . . . . . . . . . . . . . . . . . . .
2. Regional Analysis of Affordable Housing Needs . . . . . . . . . . . . . . . . . .
BARRIERS TO AFFORDABLE HOUSING . . . . . . . . . . . . . . . . . . . . . . . . . . .
1.
Affordable Housing Barriers and Strategies . . . . . . . . . . . . . . . . . . . . .
2. Evaluation of Current Fair Housing Legal Status . . . . . . . . . . . . . . . . .
3. Analysis of Impediments and Implementation . . . . . . . . . . . . . . . . . . .
HOMELESS PRIORITY NEEDS . . . . . . . . . . . . . . . . . . . . . . . . . . . . . . . . . . .
1.
Homeless Families . . . . . . . . . . . . . . . . . . . . . . . . . . . . . . . . . . . . . . . . . .
2. Chronically Homeless . . . . . . . . . . . . . . . . . . . . . . . . . . . . . . . . . . . . . . . .
3. Homeless Youth . . . . . . . . . . . . . . . . . . . . . . . . . . . . . . . . . . . . . . . . . . . . .
E.
F.
i
25
25
25
26
26
29
29
30
30
30
30
Table of Contents
CHAPTER 2.
G.
H.
I.
ANNUAL HOUSING AND HOMELESS NEEDS
ASSESSMENT (Cont.)
4. Homeless Chronic Substance Abusers . . . . . . . . . . . . . . . . . . . . . . . . . . 30
5. Homeless Veterans . . . . . . . . . . . . . . . . . . . . . . . . . . . . . . . . . . . . . . . . . . . 31
6. Homeless Seriously Mentally Ill . . . . . . . . . . . . . . . . . . . . . . . . . . . . . . . . 31
7. Victims of Domestic Violence . . . . . . . . . . . . . . . . . . . . . . . . . . . . . . . . . . 31
8. Persons with HIV/AIDS . . . . . . . . . . . . . . . . . . . . . . . . . . . . . . . . . . . . . . . 31
IMPLEMENTATION STRATEGY . . . . . . . . . . . . . . . . . . . . . . . . . . . . . . . . . . 32
SUMMARY OF SPECIFIC HOMELESS/SPECIAL NEEDS OBJECTIVES 33
HUD Table 1C . . . . . . . . . . . . . . . . . . . . . . . . . . . . . . . . . . . . . . . . . . . . . . 33
LEAD BASED PAINT STRATEGY . . . . . . . . . . . . . . . . . . . . . . . . . . . . . . . . . . 34
CHAPTER 3.
A.
B.
C.
ANNUAL NON-HOUSING COMMUNITY DEVELOPMENT
NEEDS ASSESSMENT . . . . . . . . . . . . . . . . . . . . . . . . . . . . 35
COMMUNITY DEVELOPMENT STATUS AND NEEDS ASSESSMENT . . 35
1.
Public Utilities . . . . . . . . . . . . . . . . . . . . . . . . . . . . . . . . . . . . . . . . . . . . . 35
2. Public Safety . . . . . . . . . . . . . . . . . . . . . . . . . . . . . . . . . . . . . . . . . . . . . . . 35
3. Community Facilities/Services . . . . . . . . . . . . . . . . . . . . . . . . . . . . . . . . 35
4. Permanent Housing . . . . . . . . . . . . . . . . . . . . . . . . . . . . . . . . . . . . . . . . . 35
5. Transportation . . . . . . . . . . . . . . . . . . . . . . . . . . . . . . . . . . . . . . . . . . . . . 35
6. Recreation . . . . . . . . . . . . . . . . . . . . . . . . . . . . . . . . . . . . . . . . . . . . . . . . . 36
7. Planning . . . . . . . . . . . . . . . . . . . . . . . . . . . . . . . . . . . . . . . . . . . . . . . . . . . 36
8. Economics . . . . . . . . . . . . . . . . . . . . . . . . . . . . . . . . . . . . . . . . . . . . . . . . . 36
ECONOMIC DEVELOPMENT NEEDS . . . . . . . . . . . . . . . . . . . . . . . . . . . . . . 40
SUMMARY OF SPECIFIC HOUSING/COMMUNITY DEVELOPMENT
OBJECTIVES . . . . . . . . . . . . . . . . . . . . . . . . . . . . . . . . . . . . . . . . . . . . . . . . . . . 42
CHAPTER 4.
A.
B.
C.
D.
E.
FOCUS COMMUNITIES/NEIGHBORHOODS
ASSESSMENT . . . . . . . . . . . . . . . . . . . . . . . . . . . . . . . . . . . 44
INDICATORS . . . . . . . . . . . . . . . . . . . . . . . . . . . . . . . . . . . . . . . . . . . . . . . . . . . 44
1.
Housing Quality . . . . . . . . . . . . . . . . . . . . . . . . . . . . . . . . . . . . . . . . . . . . . 44
2. Community Development Infrastructure, Facilities & Service Needs . 45
IDENTIFICATION OF FOCUS COMMUNITIES BY SELF-ASSESSMENT
OF COMMUNITY DEVELOPMENT INFRASTRUCTURE, FACILITIES
AND SERVICES NEEDS . . . . . . . . . . . . . . . . . . . . . . . . . . . . . . . . . . . . . . . . . . 46
GEOGRAPHIC DISTRIBUTION BASED ON NEED . . . . . . . . . . . . . . . . . . . 48
SOLUTION STRATEGY . . . . . . . . . . . . . . . . . . . . . . . . . . . . . . . . . . . . . . . . . . 48
PRIORITY BY LOCATION OR TYPE OF DISTRESS . . . . . . . . . . . . . . . . . . . 48
CHAPTER 5. METHOD OF DISTRIBUTION . . . . . . . . . . . . . . . . . . . . . . . . . 49
A. PROGRAM BY PROGRAM SUMMARY FOR ALL HUD PROGRAMS . . . . 49
B. RATING AND RANKING TIED TO IDENTIFIED NEED AND ACTION
PLAN CONTENT . . . . . . . . . . . . . . . . . . . . . . . . . . . . . . . . . . . . . . . . . . . . . . . . 49
FY 2009 RATING AND RANKING CRITERIA . . . . . . . . . . . . . . . . . . . . . . . . 51
ii
Table of Contents
CHAPTER 6.
ANNUAL PERFORMANCE MEASURES . . . . . . . . . . . . . . 66
CHAPTER 7. PUBLIC INVOLVEMENT . . . . . . . . . . . . . . . . . . . . . . . . . . . . . . 69
A. CONSULTATION . . . . . . . . . . . . . . . . . . . . . . . . . . . . . . . . . . . . . . . . . . . . . . . . 69
1.
Southwest Utah Continuum of Care Committee (Now part of the
Housing First Committee) . . . . . . . . . . . . . . . . . . . . . . . . . . . . . . . . . . . . 69
2. Other Groups . . . . . . . . . . . . . . . . . . . . . . . . . . . . . . . . . . . . . . . . . . . . . . . 69
3. Steering Committee . . . . . . . . . . . . . . . . . . . . . . . . . . . . . . . . . . . . . . . . . . 69
4. Jurisdictions . . . . . . . . . . . . . . . . . . . . . . . . . . . . . . . . . . . . . . . . . . . . . . . . 70
5. Association of Governments Newsletter . . . . . . . . . . . . . . . . . . . . . . . . . 70
B. COORDINATION . . . . . . . . . . . . . . . . . . . . . . . . . . . . . . . . . . . . . . . . . . . . . . . . 70
1.
Business Community . . . . . . . . . . . . . . . . . . . . . . . . . . . . . . . . . . . . . . . . 70
2. Other Agencies . . . . . . . . . . . . . . . . . . . . . . . . . . . . . . . . . . . . . . . . . . . . . . . 71
3. General Public . . . . . . . . . . . . . . . . . . . . . . . . . . . . . . . . . . . . . . . . . . . . . . 72
APPENDICES
A.
B.
C.
D.
E.
F.
TABLE 2A . . . . . . . . . . . . . . . . . . . . . . . . . . . . . . . . . . . . . . . . . . . . . . . . . . . . . . A-1
TABLE 2C . . . . . . . . . . . . . . . . . . . . . . . . . . . . . . . . . . . . . . . . . . . . . . . . . . . . . . B-1
ONE-YEAR CAPITAL IMPROVEMENTS LISTS . . . . . . . . . . . . . . . . . . . . . . C-1
2-5 YEAR CAPITAL IMPROVEMENTS LISTS . . . . . . . . . . . . . . . . . . . . . . . D-1
JURISDICTION SELF-ASSESSMENTS . . . . . . . . . . . . . . . . . . . . . . . . . . . . . E-1
FIVE COUNTY NEWSLETTER AND PUBLIC HEARING NOTICE . . . . . . F-1
LIST OF TABLES
Table 2-1
Table 2-2
Table 2-3
Table 2-4
Table 2-5
Table 2-6
Table 2-7
Table 2-8
Table 2-9
Table 2-10
Table 2-11
Table 2-12
Table 2-13
Number of Persons Per Household - Beaver County . . . . . . . . . . . . . . . 9
Number of Persons Per Household - Garfield County . . . . . . . . . . . . . . 9
Number of Persons Per Household - Iron County . . . . . . . . . . . . . . . . . . 9
Number of Persons Per Household - Kane County . . . . . . . . . . . . . . . . 10
Number of Persons Per Household - Washington County . . . . . . . . . . 10
Housing Inventory, 2000 . . . . . . . . . . . . . . . . . . . . . . . . . . . . . . . . . . . . . . 11
Housing Inventory, 2007 . . . . . . . . . . . . . . . . . . . . . . . . . . . . . . . . . . . . . . 12
Household Size 2000-2008 . . . . . . . . . . . . . . . . . . . . . . . . . . . . . . . . . . . . 13
FY 2009 Fair Market Rents . . . . . . . . . . . . . . . . . . . . . . . . . . . . . . . . . . . . 13
Renters Wages vs. Housing Wage . . . . . . . . . . . . . . . . . . . . . . . . . . . . . . . 14
Federal Low-Income Subsidies for Housing 2006 . . . . . . . . . . . . . . . . . 15
Public Housing Statistics, 2007 . . . . . . . . . . . . . . . . . . . . . . . . . . . . . . . . . 16
Utah Low Income Housing Tax Credit Units Placed in Service . . . . . . . 17
iii
Table of Contents
LIST OF TABLES (Continued)
Table 2-14
Table 2-15
Table 2-16
Table 2-17
Homeless and Special Needs Populations . . . . . . . . . . . . . . . . . . . . . . . 20
Point-in-Time Survey, January 31, 2008 . . . . . . . . . . . . . . . . . . . . . . . . . 21
Housing First Approach . . . . . . . . . . . . . . . . . . . . . . . . . . . . . . . . . . . . . . 23
Affordable Housing Barriers and Strategies . . . . . . . . . . . . . . . . . . . . . 26
Table 3-1
Table 3-2
Capital Investment Needs Summary . . . . . . . . . . . . . . . . . . . . . . . . . . . . 37
Summary of Specific Housing/Community Development Objectives 42
Table 4-1
Five County Association of Governments Regional Totals
(non-entitlement area) . . . . . . . . . . . . . . . . . . . . . . . . . . . . . . . . . . . . . . . 44
Focus Communities Based Upon Housing Stock Condition
Southwest Utah by County . . . . . . . . . . . . . . . . . . . . . . . . . . . . . . . . . . . . 45
Jurisdiction’s Self-Assessment Regional Tabulation
Cumulative Totals . . . . . . . . . . . . . . . . . . . . . . . . . . . . . . . . . . . . . . . . . . . 47
Table 4-2
Table 4-3
Table 6-1
Combined CD and ED Strategic Plan and Annual Report
Annual Action (AAP) Planned Projects Results
and Performance Measures for CDBG in 2008 . . . . . . . . . . . . . . . . . . . 66
iv
Five County Association of Governments
Consolidated Plan - Annual Action Plan 2009
CHAPTER I. EXECUTIVE SUMMARY
A.
EVALUATION OF CURRENT NEEDS
Local elected officials in southwestern Utah continue to foster a cooperative allocation of federal,
state, and local funds to address regional priorities. This cooperative spirit has been the norm for
more than 50 years. Community development and human services staff at the Association of
Governments have worked diligently to document 2009 priorities, as reflected in the
Consolidated Plan template. The complete document is available on the Five County AOG
website at: http://www.fcaog.state.ut.us/dep/community/consolidated.php
Housing
#
Regional officials have focused on workforce housing issues, with little acknowledgment
of traditional low income housing programs. The impression is that existing programs
cover the needs of low income clients. The facts outlined in this Action Plan document
that there is a need to strengthen both workforce housing and low income housing
programs.
#
Southwestern Utah leaders have become invested in efforts to end chronic homelessness,
although the issue is not as pressing as other priorities. The Housing First concept is
being implemented in the region.
#
Current efforts such as Vision Dixie (Washington County) and Iron Destiny (Iron
County) are focusing on means by which communities can help reduce housing costs by
improving permitting processing and re-evaluating impact fee structures. A key priority
will be the implementation of design standards for higher density housing models.
Current economic conditions are lowering housing costs, but tightening available credit.
Priorities for 2009 will focus on providing reasonable credit opportunities to educated
and prepared home buyers.
#
Administer the St. George City and regional Down Payment Assistance Programs.
Community Development
#
Basic infrastructure remains a key focus of regional investment of funding. Water and
emergency services are the two highest priorities. With the exception of housing, all
other priorties revolve around infrastructure needs.
#
A three-fold evaluation process has identified focus communities in the region. The 2004
Housing Condition Survey was compared with a voluntary community assessment and
staff expertise. Focus communities include:
#
#
#
#
#
Alton (Housing Conditions & Community Determination)
Big Water (Housing Conditions)
Enoch (Community Determination)
Enterprise (Community Determination)
Hatch (Housing Conditions & Community Determination)
1
#
#
#
#
Henrieville (Community Determination)
LaVerkin (Community Determination)
Minersville (Community Determination)
Orderville (Housing Conditions & Community Determination)
Economic Development
B.
#
Most local jurisdictions in southwestern Utah have invested in county/city economic
development programs for active business development. Regional priorities focus on the
regional Revolving Loan Fund and technical assistance.
#
2009 projects include the generation of on-site electrical power to Ticaboo/Bullfrog;
support of the regional Business Resource Center; a regional natural hazard mitigation
plan update; participation in the Neighborhood Stabilization Program; and workforce
housing program development and implementation.
EVALUATION OF PAST PERFORMANCE
In 2006-07 the following projects were accomplished:
Five County AOG - Region: 1) Five County staff provided regional planning including updating
the region’s Consolidated Plan; community planning for housing, community and economic
development; assistance through attendance at various meetings and review and development of
codes and ordinances; 2) Revolving Loan Fund program delivery was provided throughout the
region to expand economic development opportunities, primarily to low and moderate income
individuals and businesses by retaining existing jobs and/or creating additional employment. The
number of persons benefitting in 2008 through job retention/creation was 22 and 13 were LMI
individuals; and 3) Housing program delivery to foster decent and affordable housing throughout
the region. This includes opportunities for LMI persons through the down payment/closing cost
assistance program, HOME Rehabilitation Program and Emergency HOME program. The
number of households benefitting in 2007 was 114, all of which qualified as LMI.
Beaver County: 1) Beaver County Housing Authority– The housing authority purchased five
lots which will be made available for low-income housing units in Beaver City. The project
initially benefits five households to improve livability and sustainability by providing decent and
affordable housing in the community. As funds are rolled over to new projects it will continue to
benefit more families with the construction of affordable single-family homes. The housing
authority’s goal is to continue to provide more affordable housing for families in Beaver County.
Iron County: 1) Iron County Senior Citizens Center in Parowan-- A new facility was
constructed to better serve the population in the Parowan, Paragonah, Brian Head and the
unincorporated areas including Summit. The project benefits 674 persons, of which (51%) 344
are presumed LMI. This new facility serves to enhance the health and safety as well as
improving livability and sustainability in the community and surrounding area for the elderly
population.
Kane County: 1) Orderville Town– Engineering for new fire station. The project benefits 593
persons, of that total (63.9%) 378 persons are LMI. This new facility will provide fire protection
and enhanced safety capabilities to improve availability and sustainability of the community; 2)
Alton Town-- Engineering for construction of new fire station. The newly constructed facility
provides enhanced safety which improves livability and sustainability for community residents by
addressing fire protection. The total number of beneficiaries were 134, with 77 (57.8%) LMI.
2
Washington County: 1) Gunlock Special Service District-- Culinary water system
improvements were completed which provide safe and clean water to improve availability and
sustainability of the community through an enhanced and expanded culinary water system storage
and distribution network. Installation of 14 fire hydrants provides enhanced safety to residents by
addressing fire protection. The project benefits 136 persons, of which (58%) 79 are LMI; and 2)
Washington County Meals-on-Wheels Trucks and Parking Lot Improvements at the
Hurricane Senior Citizens Center-- Two new meals-on-wheels vehicles were procured for use
at the Hurricane and Enterprise senior citizens centers. Improvements were completed at the
Hurricane Senior Citizens Center parking lot to bring the facility into compliance with street
grading with installation of curb, gutter, and sidewalks. This project enhances the health and
safety of elderly clients receiving home delivered meals as well as those utilizing the facility.
The project benefits 3,135 persons, of which (51%) 1,603 are presumed LMI persons.
C.
FUNDING PRIORITY DECISION MAKING PROCESS
The Five County Association of Governments utilizes a comprehensive rating & ranking matrix
to determine the priority for funding of all applications for CDBG. The criteria is approved by the
local elected officials functioning as the Rating & Ranking Committee (RRC). The projects in
2008 were evaluated utilizing the matrix and recommendations for funding were presented to the
Rating & Ranking Committee for prioritization. A copy of the FY 2009 Rating & Ranking
Criteria, Policies and Guidelines is found in Chapter 5.
D.
SUMMARY OF CITIZEN PARTICIPATION AND CONSULTATION
Continued consultation and coordination with agencies in this region and the public took place in
the development of this one-year action plan. In addition, ongoing participation by the three
public housing authorities in the region was instrumental in the development of this plan.
The largest and most comprehensive public involvement tool used in the region is the annual
Public Forums. These forums are conducted in the spring of each year with a session held in each
of the five counties. Staff from both human services and community and economic development
facilitate the sessions which are designed to identify the most pressing needs as expressed by
local officials and residents. Information was presented at the forums and input solicited for the
Consolidated Plan update in community development efforts. Extensive efforts are employed to
bring out not only agency staff, but also clientele of social service agencies and programs and
residents with no particular connection beyond their interest in local programming. New topics
of discussion developed at the 2008 forums, by county, included:
Beaver County-- Affordable rental units, housing support to purchase homes, adequate housing
conditions, Horizon House needs, meth abuse, and adult day care for elderly;
Garfield County-- Housing that is affordable, need more rental units, clear yards &
communities, power line to Ticaboo, more economic development, support for persons with
disabilities and handicap accessibility;
Iron County-- Affordable single apartments, improved rental properties, transitional housing,
more Oasis House case managers, Housing in Place (Plan 9) Awareness, and home fuel
alternatives;
Kane County-- Better financial management, jobs that pay living wage, comprehensive health
care, promotion of Utah Saves, need more volunteers, and need funding to support transportation
for disabled persons;
Washington County-- Housing that is affordable, housing for elderly & disabled, transitional
housing, youth programs, increased emergency food, and health care for uninsured.
3
Chapter 7 contains specific discussion of projects resulting from issues raised during the forums.
A primary purpose of the Association of Governments is to coordinate federal, state and local
programs across southwest Utah. Much of this coordination involves aspects of the consolidated
planning process, with these efforts detailed in Chapter 7.
E.
PRIORITIES
The HOME program is administered by the state of Utah, Division of Housing and Community
Development, Olene Walker Housing Loan Fund and funding priorities are established by the
loan board. Table 6-1, Chapter 6 includes HOME services for southwestern Utah which are
provided through the Five County Association of Governments. Please refer to the following
website for detailed funding priorities and allocation process:
http://community.utah.gov/housing_and_community_development/index.html
Priorities for the Balance of State Continuum of Care can be found on the following website:
http://www.utahcontinuum.org/index.htm
Funding for the Balance of State Continuum of Care 2008 include the following projects in the
Five County region:
1) Iron County Care & Share-- Southwest Utah Homeless Outreach Supportive Services
program renewal in the amount of $37,229;
2) Iron County Care & Share-- La Casa Transitional Housing, Supportive Housing program
renewal in the amount of $105,222;
3) Cedar City Housing Authority-- Transitional Housing program renewal in the amount of
$27,826; and
4) Erin Kimball Memorial Foundation-- No Place Like Home, Transitional Housing Program
in the amount of $84,883.
Table 2-11 on page 15 contains regional information on federal low-income housing programs.
LIHTC housing information can be found on page 17, Table 2-13.
The Washington County School District receives McKinney Vinto Homeless funds in the amount
of $24,000 from federal funding to the State of Utah Education Department for homeless services
in Washington County. Funding is used to produce and disseminate brochures to students and
teachers.
1.
Housing
The regional priorities of the Five County Association of Governments relating to
housing will be in the rehabilitation of old housing stock, rehabilitation of existing rental
units, providing better availability of safe and adequate affordable rentals, providing
seasonal rental housing to support the tourism industry, and developing more water and
sewer capacity for housing development in high growth areas.
2.
Community Development
Based upon the locally identified Community Development capital projects submitted by
local jurisdictions, community development priorities for the region are outlined below:
# Public Utility Infrastructure-- Regional efforts will focus on increasing the
capacity of water and other utility systems to better serve the customers and/or
improve fire flow capacity. Includes wastewater disposal projects.
4
# Public Safety Activities-- Efforts will be concentrated on addressing projects related
to protection of property, including flood control or fire protection improvements in a
community.
# Community Facilities/Public Services- - Regional support will be provided to
jurisdictions undertaking construction of projects such as senior citizens centers;
health clinics; food banks/shelters; and/or public service activities. These activities
traditionally have no available revenue source for funding and have typically been
turned down by other funding sources. This does not include recreational facilities.
# LMI Housing Activities-- Regional efforts will continue to focus on projects
designed to provide for the housing needs of very low and low-moderate income
families. This may include the development of infrastructure for LMI housing
projects, home buyers assistance programs, land acquisition or the actual construction
of housing units for elderly, low-income and homeless individuals, housing
rehabilitation, CROWN rent-to-own homes; mutual self help, and LIHTC projects.
# Transportation- - Jurisdictions throughout the region will focus on transportation
related projects for streets/bridges, curb/gutter and sidewalks, public transit
operations and airport improvements.
# Parks and Recreation- - Jurisdictions will continue to foster projects designed to
enhance the recreational quality of a community i.e., new picnic facilities,
playgrounds, community recreation centers, trails, etc.
3.
Economic Development
Chapter 3 identifies the following economic development priorities:
# Provide regionally-focused services that complement county and community
economic development programs.
# Focus efforts on jurisdictions that do not have internal staff support to provide
day-to-day economic development outreach.
# Represent southwestern Utah interests at forums.
# Forge closer ties between economic development and public/higher education
initiatives in the region.
4.
# Champion regional projects that foster economic development.
Summary of One year Performance Measures
It is anticipated that the following projects will be completed during the upcoming year:
Five County Region: 1) Planning, Administration and Technical Assistance
(Program Delivery)-- AOG staff will provide planning assistance to eligible
communities in developing affordable housing plans, enhancing health and safety by
developing codes and ordinances and providing economic opportunity by assisting
communities in planning for commercial and industrial development. Staff efforts will
continue in the identification of focus communities/neighborhoods throughout the region;
2) Economic Development (Revolving Loan Fund Program Delivery)-- The RLF
5
program is designed to provide economic development opportunity primarily to low to
moderate income individuals and businesses by retaining existing jobs and/or creating
additional employment. The program job creating is set at 1 job for every $30,000 lent;
and 3) Housing Program Delivery-- Staff will continue to provide program delivery
(130-150 households) to foster decent, safe and affordable housing opportunities for lowincome persons by providing down payment/closing cost assistance, rehabilitation of
existing housing units, and enhance health and safety through rehabilitation addressing
health code and safety concerns.
Beaver County: 1) Beaver County Special Service District #1-- The Special Service
District is proposing to procure a new ambulance. Acquisition of this ambulance will
provide enhanced health and safety to area residents in addition to improving livability
and sustainability in the community and outlying county residents served by the SSD.
The proposed number of LMI persons benefitting is 3,503 of which 2,452 (70%) are
LMI.
Garfield County: 1) Cannonville Town-- The proposed project includes installation of
curb, gutter and sidewalks to address drainage issues throughout the community. The
project will improve livability and sustainability in the community by addressing
drainage issues. The proposed number of beneficiaries is 148 with 83 (56%) LMI persons
benefitting; and 2) Hatch Town-- Construction of a new community center to provide a
public facility, primarily benefitting low-income citizens to enhance health and safety, as
well as improve livability and sustainability in the community through provision of a
place to gather for home delivered meals and various other community functions. The
proposed number of beneficiaries is 121 with 75 (61.9%) LMI beneficiaries.
Iron County: 1) Cedar City on behalf of the Cedar Housing Authority-- Acquisition
of real property for construction of 18-24 units of low income housing for elderly persons
over the age of 62 and persons with a disability. Construction of these units will provide
decent affordable housing. The projected number of households benefitting from this
project is 18, with all low/moderate income beneficiaries; 2) Cedar City on behalf of
the Iron County Care & Share-- The applicant is proposing to construct Phase I of a
homeless shelter. The project will consist of _____ units of permanent housing for
chronically homeless individuals. This facility will provide the opportunity for decent,
safe, and affordable housing. The proposed number of households benefitting is ____,
all of which are LMI; and 3) Iron County-- Iron County is proposing to purchase two
new four wheel drive meals-on-wheels trucks capable of traversing outlying areas of the
county in and around Parowan and Cedar. Acquisition of these vehicles will provide
enhanced health and safety to elderly clients as well as improve livability and
sustainability of these individuals. The proposed number of beneficiaries is 3,002, with
1,532 (51%) presumed LMI.
Kane County: 1) Alton Town-- The town of Alton is proposing the acquisition of a
wildland fire truck capable of traversing wildland areas adjacent to the community.
Construction of a new fire station to serve Alton Town. The proposed acquisition will
address health and safety, improve livability and sustainability in the community through
enhanced availability of fire protection. The projected number of beneficiaries is 136,
with 77 (57.8%) LMI persons benefitting.
Washington County: 1) Ivins City-- The proposed project includes installation of curb,
gutter and sidewalk in a neighborhood in the inner portion of Ivins (400 South Street, 200
6
East Street, 600 South Street and Main Street). Proposed improvements will assist with
flood protection, pedestrian safety, and disability access. The proposed project will
benefit 374 persons, of which (56.4%) 211 are LMI persons.
7
Five County Association of Governments
Consolidated Plan - Annual Action Plan 2009
CHAPTER II. ANNUAL HOUSING AND HOMELESS NEEDS
ASSESSMENT
A.
MULTI-FAMILY RENTAL HOUSING, PUBLIC HOUSING AND OTHER USES
The regional housing plan was created to document the housing needs of the five county region.
Specifically it presents a long-range vision statement, addresses affordable housing issues for
low-income populations by assessing their housing needs, identifies barriers for obtaining
affordable housing, documents the physical condition of housing stock in the district and designs
strategies to realize the vision.
As part of the development of the Housing Element of the Consolidated Plan, emphasis was
placed on obtaining input at the local levels of government. The focus of this element is to
identify where the housing stock, primarily that generally available to those of low to moderate
income, is at risk due to physical deterioration. Association staff assessed the condition of the
region’s housing stock, which was compiled, analyzed, tabulated, and presented in this chapter.
1.
Regional Housing Vision Statement
The regional long-range vision of the Five County Association of Governments regarding
affordable housing is described as follows:
“We envision the Five County Region fortified with vital and healthy communities,
having residents housed in quality, safe and affordable dwellings in aesthetic
neighborhoods, for sanctuary and stability.”
2.
Affordable Housing Defined
Affordable housing simply means that a household is not paying more than thirty percent
(30%) of their total adjusted gross income (AGI) toward their monthly house payment,
including taxes, or for their monthly rent payment.
3.
Income Guidelines
The U.S. Dept. of Housing and Urban Development (HUD) generates annual household
income limits to determine low and moderate incomes. Income limits are based on a
county’s median income and size of household, “low” income limits are established at 80
percent of median income and “very low” limits at 50 percent. HUD income guidelines
are used to qualify participants for low-income housing programs; such as: HOME,
Community Development Block Grant programs, and other State and Federally funded
programs.
8
HUD income guidelines during FY 2008 for the five counties are as follows:
BEAVER
COUNTY
Table 2-1
Number of Persons Per Household
Median Income: $47,400
FY 2008
% of area
median income
1
2
3
4
5
6
7
8
80% (moderate
income)
$27,600
$31,550
$35,500
$39,450
$42,600
$45,750
$48,900
$52,050
50% (low income)
$17,250
$19,700
$22,200
$24,650
$26,600
$28,600
$30,550
$32,550
30% (very low
income)
$10,350
$11,850
$13,300
$14,800
$16,000
$17,150
$18,350
$19,550
7
8
GARFIELD
COUNTY
Table 2-2
Number of Persons Per Household
Median Income: $48,200
FY 2008
% of area
median income
1
2
3
4
5
6
80% (moderate
income)
$27,600
$31,550
$35,500
$39,450
$42,600
$45,750
$48,900
$52,050
50% (low income)
$17,250
$19,700
$22,200
$24,650
$26,600
$28,600
$30,550
$32,550
30% (very low
income)
$10,350
$11,850
$13,300
$14,800
$16,000
$17,150
$18,350
$19,550
IRON
COUNTY
Table 2-3
Number of Persons Per Household
Median Income: $44,500
FY 2008
% of area
median income
1
2
3
4
5
6
7
8
80% (moderate
income)
$27,600
$31,550
$35,500
$39,450
$42,600
$45,750
$48,900
$52,050
50% (low income)
$17,250
$19,700
$22,200
$24,650
$26,600
$28,600
$30,550
$32,550
30% (very low
income)
$10,350
$11,850
$13,300
$14,800
$16,000
$17,150
$18,350
$19,550
9
KANE
COUNTY
Table 2-4
Number of Persons Per Household
Median Income: $48,700
FY 2008
% of area
median income
1
2
3
4
5
6
7
8
80% (moderate
income)
$27,600
$31,550
$35,500
$39,450
$42,600
$45,750
$48,900
$52,050
50% (low income)
$17,250
$19,700
$22,200
$24,650
$26,600
$28,600
$30,550
$32,550
30% (very low
income)
$10,350
$11,850
$13,300
$14,800
$16,000
$17,150
$18,350
$19,550
WASHINGTON
COUNTY
Table 2-5
Number of Persons Per Household
Median Income: $51,500
FY 2008
% of area
median income
1
2
3
4
5
6
7
8
80% (moderate
income)
$28,850
$32,950
$37,100
$41,200
$44,500
$47,800
$51,100
$54,400
50% (low income)
$18,050
$20,600
$23,200
$25,750
$27,800
$29,850
$31,950
$34,000
30% (very low
income)
$10,800
$12,350
$13,900
$15,450
$16,700
$17,900
$19,150
$20,400
Source: HUD FY 2008 Income Limits Documentation System
4.
Income Data
The 2006 forecasted per capita personal income estimates for each county in the Five
County District is lower than the state average ($29,108). Iron County ranked the lowest
in the region, with a 2006 forecasted per capita personal income of $21,602. Washington
County was second lowest with $24,400 forecasted per capita income. Garfield County
had a forecasted per capita income of $24,431. Kane County had a forecasted per capita
income of $28,578. Beaver County had the highest forecasted per capita income in the
region at $29,065. (Sources: 2003-2005: U.S. Dept. Of Commerce, BEA, May 2007; 2006f:
Utah Dept. Of Workforce Services, Workforce Info., June 2007)
According to the HUD “Pre-approved LMI Community List”, concentrations of low-tomoderate income (LMI) populations exist in the towns of Alton, Antimony, Boulder, and
Cannonville as well as Hildale City. In addition, several communities were determined
as LMI communities based on results of CDBG income surveys. Those include: towns of
Glendale and New Harmony, as well as the cities of Escalante and Panguitch. Please
note that the determination of LMI status by surveys for community-wide projects is for a
limited period of eligibility only. In cases where the survey confirms a community’s
LMI percentage is greater than 60 percent, that community may use the survey results for
that and the next four CDBG program years. For those communities where the
10
percentage is between 51 percent and 60 percent, the results are valid for that year and
the following two program years.
5.
Housing Market Analysis
Tables 2-6 and 2-7 listed below provide a comparison of the regional housing inventory
for years 2000 and 2007. The Five County region has experienced a 23.3% increase in
housing inventory during the aforementioned timeline. Washington County exhibited the
highest amount of housing inventory increase, totaling 44.0%.
Table 2-6
Housing Inventory, 2000
Beaver
Garfield
Iron
Kane
Washington
Population
6,005
4,735
33,779
6,046
90,354
Total Housing
Units
2,660
2,767
13,618
3,767
36,478
Total Housing
Units
% Owned
59.3%
45.1%
51.7%
46.3%
60.7%
Total Housing
Units % Rented
15.7%
11.9%
26.3%
13.1%
21.4%
Total Housing
Units
% Vacant
25.0%
43.0%
22.0%
40.9%
17.9%
Source: U.S. Census Bureau, 2000 Census (SF 1)
As can be seen in Tables 2-6 and 2-7, the Five County region has a large number of units
classified as vacant. The housing units are not vacant in the sense that they are available
housing stock in the region for general use. On the contrary, the majority of these vacant
units are classified as vacant because they are seasonal, recreational or occasional use.
In general, these housing units are used by residents of other areas on a recreational or
seasonal basis.
The majority of the exhibited housing statistics remain relatively constant for the years
2000 and 2007. This being said, the most notable change occurred in Beaver County
where the percentage of rented housing units jumped to 25.3% in 2007 and vacancy
dropped to 15.5%.
In regards to the regional housing market, the current economic climate has exhibited
dramatic increases in foreclosure activity as well as stagnation in new construction.
Within the Five County region, Washington County has seen the majority of these
occurrences. Many economic projections indicate that a continuation of these factors
could occur in the short term. Naturally, the overall percentages of housing units owned,
rented, and vacant will adjust accordingly.
11
Table 2-7
Housing Inventory, 2007
Beaver
Garfield
Iron
Kane
Washington
Population
6,294
4,534
40,544
6,532
126,312
Total Housing
Units
2,824
3,246
17,110
4,648
52,527
Total Housing
Units
% Owned
59.3%
45.3%
52.1%
46.6%
61.8%
Total Housing
Units % Rented
25.3%
11.8%
26.3%
13.2%
20.3%
Total Housing
Units
% Vacant
15.5%
43.0%
21.7%
40.9%
17.9%
Source: U.S. Census Bureau, 2007 American Community Survey
6.
Household Size
The table below shows the variation in household sizes throughout the Five County
region of Southwestern Utah. The average household size for Southwest Utah has
decreased from 2.92 in 2000 to 2.81 in 2008. In comparison to the rest of the region, Iron
County exhibits larger household sizes, while Kane County tends to have smaller
household sizes. The Washington County 2035 Housing Study, proposes that the decrease
in household size is due to the increased in-migration of both retiree households and
younger family households without children who are employed in the expanding
construction, retail and services industry sectors of the economy (Strategic Planning
Group, February 2007).
12
Table 2-8
Household Size 2000 - 2008
County
2000
2001
2002
2003
2004
2005
2006
2007
2008
Beaver
2.94
2.93
2.91
2.89
2.89
2.89
2.88
2.87
2.84
Garfield
2.91
2.87
2.83
2.79
2.79
2.77
2.75
2.74
2.74
Iron
3.10
3.09
3.08
3.07
3.07
3.07
3.07
3.07
3.09
Kane
2.68
2.65
2.61
2.58
2.57
2.58
2.56
2.57
2.57
Washington
2.97
2.93
2.89
2.86
2.84
2.81
2.80
2.80
2.79
Source: 2008 Baseline Projections, Governor’s Office of Planning and Budget
7.
Fair Market Rents
HUD establishes area fair market rental rates. The table below gives the fair market rental
rates for the five counties as of October 1, 2008.
Table 2-9
FY 2009 Fair Market Rents
Number of Bedrooms Per Unit
County
Program
Efficiency
1
2
Beaver
Fair Market
Garfield
3
4
$512
$514
$628
$889
$946
Fair Market
$512
$514
$628
$889
$946
Iron
Fair Market
$475
$501
$577
$841
$1,014
Kane
Fair Market
$512
$514
$628
$889
$945
Washington
Fair Market
$536
$562
$667
$970
$1,091
Source: HUD 2009 Fair Market Rent - County Level Data File
Local government officials consider fair market rental rates when planning for affordable
housing in their jurisdictions. Fair market rental rates are a valuable tool when comparing
housing market prices/rental rates to what is established as affordable housing costs for
low-income residents. With this information a jurisdiction can plan accordingly and
encourage housing developments that will minimize deficiencies in their affordable
housing stock.
13
The following table details rent affordability in relation to mean renter wage by
comparing mean renter’s wages with the housing wage. The housing wage represents
what a full-time worker must earn per hour inorder to afford Fair Market Rent paying no
more than 30% of household income. While the mean renter’s wage is comparable to the
housing wage for a one-bedroom rental, the mean renter’s wage falls short of a twobedroom rental housing wage.
Table 2-10
Renter Wages vs. Housing Wage
2008 Renter Wage
Housing Wage
Area
2008 Estimated Mean
Renter Wage
Rent Affordable
with full-time job
paying Mean
Renter Wage
Wage required
to afford a
One-Bedroom
Wage required
to afford a
Two-Bedroom
State of Utah
$11.05
$575
$11.26
$13.52
Beaver
$8.99
$467
$9.56
$11.67
Garfield
$7.40
$385
$9.56
$11.67
Iron
$8.21
$427
$9.27
$10.67
Kane
$8.58
$446
$9.56
$11.67
Washington
$9.93
$516
$10.42
$12.38
Source: 2008 Out of Reach, National Low Income Housing Coalition
A comparison between the cost of existing homes on the market gives further concern for
how most low income and many median income families are no longer able to purchase a
home without expending far more than 30% of their income. In similar fashion as other
parts of Utah, the costs of home ownership and apartment rentals in Southwest Utah have
far outpaced the increase in income in the last decade. The simple fact that wages have
not kept up with the rapid increase in housing costs have forced many people out of the
market because they simply cannot afford to live here.
8.
Public Housing
An additional indicator of market conditions and demand for affordable housing is the
number of households on the waiting lists for Section 8 rental assistance and public
housing units. Cedar City Housing Authority, Beaver City Housing Authority and St.
George Housing Authority (St. George City is an entitlement community) have provided
the following information for the region:
# There are several different programs available through the Housing Authorities to
assist in affordable housing needs. These programs include:
Public Housing, Section 8 Vouchers, Farm Labor Program, Crown Homes, Apt’s
owned by the Housing Authorities that are rented, “Own a home in St. George”
(down payment and closing cost assistance), St. George City Down Payment
Assistance Program, subsidized and tax credit housing.
14
# There are approximately 48 public housing units throughout the Five County region
and 33 on the waiting lists for these units. The average wait list time varies from 3
months up to 1.5 years.
# There are approximately 402 Section 8 vouchers available throughout the region and
252 on the waiting lists for rental assistance.
Table 2-11
Federal Low-Income Subsidies for Housing 2006
Location
Properties with
Active Section
202/811 Loans
Properties with
Active Section 515
Loans
Properties with
Expiring* Section 8
Contracts
1233
1726
3000
Beaver County
0
12
0
Garfield County
0
0
0
Iron County
0
165
0
Kane County
0
39
0
Washington
County
0
86
88
Utah Totals
Source: National Housing Trust
* Expire before the end of the fiscal year 2012.
The Cedar City Housing Authority funds eligible affordable housing projects targeting
families and individuals earning less than 80% AMI, but preference is given to those
individuals earning less than 50% AMI. It is anticipated that funding for projects to be
constructed within the next 5 years will be provided by the following: State of Utah
Department of Community and Culture, Olene Walker Housing Trust Fund; U.S.
Department of Housing and Urban Development; Pamela Atkinson Trust Fund; Rural
Community Housing Assistance Corporation; Utah Community Reinvestment
Corporation; Five County Association of Governments, Community Development Block
Grant; Cedar City Corporation and the Cedar Housing Authority.
The Cedar City Housing Authority develops housing projects targeting families and
individuals earning less than 50% AMI. One year goals include: 1) Close on at least two
Section 8 Housing Choice Voucher for a family earning less than 30% AMI; 2) SUU and
the Cedar City Housing Authority will work together to construct two 3-4 bedroom
homes for sale to a family earning no more than 80% AMI; 3) Seek funding for the ongoing transitional housing program, currently housing 4 homeless individuals; 4)
Continue to administer the Section 8 program targeting 139 families earning less than
30% AMI; 5) Acquire land for the construction of a very-low income elderly/person with
disability 18-24 unit project; 6) Partner with Cedar City Corporation to provide a down
payment assistance program that would enable local residents up to $20,000 in down
payment assistance. To view the Cedar City Housing Authority plans please use the
following links; and 7) Cedar City Housing Authority will seek funding from HUD to
15
continue Housing Counseling Program, and obtain AARP Certification for a Reverse
Mortgage Counselor.
One Year Plan
http://www.fcaog.state.ut.us/info/consolidatedplan/planupdate/2008/cedarhousingauth/ccha2007plan1yr.pdf
Five Year Plan
http://www.fcaog.state.ut.us/info/consolidatedplan/planupdate/2008/cedarhousingauth/ccha2005-09plan.pdf
The Beaver City Housing Authority has developed 12 new units targeting families that
earn 40% AMI or lower. In the upcoming year, they are proposing to acquire 8 lots using
CDBG funds for part of the purchase. It is proposed that 20 additional lots be purchased
for construction of homes in the next 5 years. Some of these will be CROWN and others
could possibly be Mutual Self-Help if they are successful in obtaining funding from
USDA Rural Development. The Housing Authority will continue to make application
for additional Section 8 Vouchers should they become available. Assistance is targeted
to families at or below 30% AMI. The Housing Authority will also continue to apply for
special-purpose vouchers targeted to elderly and families with disabilities. Their 5-year
plan identifies elderly and disabled families as a priority to receive available Section 8
Vouchers. To view the Beaver City Housing Authority plan please use the following
link.
Five Year Plan
http://www.fcaog.state.ut.us/info/consolidatedplan/planupdate/2008/beaverhousingauth/bha2005-09plan.pdf
Table 2-12
Public Housing Statistics, 2007
Housing Needs
Agency
Public
Housing
PH
Waiting
List
Section
8
Section 8
Waiting
List
1
BR
2 BR
3+
BR
Beaver Housing Authority
18
5
19
24
-
-
-
Cedar Housing Authority
N/A
N/A
134
154
73
53
28
St. George Housing
Authority
30
28
244
163
67
43
31
Total
48
33
397
341
140
96
59
9.
Low Income Housing Tax Credit (LIHTC) Program
The Federal Low Income Housing Tax Credit (LIHTC) program funds are allocated by
the Utah Housing Corporation (UHC). LIHTC is a dollar for dollar credit or reduction of
tax liability for owners and investors in low income housing. The program is intended to
provide a fair and competitive means of utilizing the Credits to the fullest extent possible
each year as an effective stimulus for the development and rehabilitation of low-income
housing. Credits are generally allocated to projects that provide additional benefits,
including, but not limited to: additional affordable units, lower rents, special needs units
for handicapped tenants, or extended affordability periods. The following table depicts
completed LIHTC units in the Five County region as extrapolated from the Utah Housing
Corporation, Completed Housing Credit Projects by County.
16
Table 2-13
Completed Low Income Housing Tax Credit Projects (as of 11/08)
Location of Units
# of LIHTC Units
Utah Statewide Total
16,057
Beaver County
27
Garfield County
6
Iron County
565
Kane County
47
Washington County
1,108
Source: Utah Housing Corporation, Completed Housing Credit Projects by County;
http://b2b.utahhousingcorp.org/PDF/3.1.5.pdf
10.
Workforce Housing
Many working families/individuals cannot afford a home in southwestern Utah. For
example, in 2007 the average sales price of a home in Washington County was $274,900.
This represents a 93% increase in price since 2002 ($142,500). Further, the fact that
wages have not kept up with the rapid increase in housing costs have forced many people
out of the market because they simply cannot afford to live here. Additionally, many
families/individuals are forced to pay a higher percentage of their income for housing or
live in substandard conditions. Current economic conditions are lowering housing costs,
but tightening available credit. Priorities for 2009 will focus on providing reasonable
credit opportunities to educated and prepared home buyers.
Realizing this widening gap in housing affordability, Five County Association of
Governments has put an Ombudsman in place to assist the Dixie Area Workforce
Housing Affordability Committee (DAWHAC) in addressing these issues. Darren Janes,
Five County Community Planner, serves as the Ombudsman to assist local communities
throughout Beaver, Garfield, Iron, Kane and Washington counties in efforts to
accommodate workforce housing options and to aid individuals and families in their
quest for workforce housing alternatives. He can be reached at [email protected]
or by calling 435-673-3548.
B.
SINGLE-FAMILY
The approach of the Five County Association of Governments in regards to single family hosuing
is to maintain and improve single family housing stock in the region. Our agency is very active
in providing services through the Housing Rehabilitation and Weatherization programs that
enable persons, especially lower-income, elderly, and the disabled to maintain their homes. It has
also been the general policy of the AOG to leverage available funding, when and where
appropriate, for the development of single family subdivision infrastructure to enable the
development of affordable housing on a neighborhood scale rather than developing individual
single family properties.
17
C.
DESCRIPTION AND STATUS OF REGIONAL HOMELESS COORDINATING
COUNCIL
On October 22, 2008 a new elected official, Apple Valley Mayor Mary Reep, assisted in the
reorganization of the Homeless Coordinating Committee. The committee is prepared to take on
the challenges of updating and completing the 10 year plan and provide an avenue for
coordination and collaboration between organizations. There will continue to be the Housing
First Committee who will coordinate services and funding with the Continuum of Care in the
Balance of State and oversee the pilot projects for ending homelessness. The Five County
Homeless Coordinating Committee (FCHCC) will complete the 10 year plan to end Chronic
Homelessness and coordinate a unique partnership including elected officials, government
programs, non-profit organizations and other related individuals in the Five County area.
There are many agencies involved in the FCHCC including Dixie Care & Share, Iron County
Care & Share, Erin Kimball Memorial Foundation, DOVE Center, the Safety Net, Five County
Association of Governments, Washington County School District, Resource and Re-entry Center,
Housing First, Red Rock Center for Independence and Housing authorities. There will continue
to be additional outreach to all programs that work in connection with ending homelessness. The
need is also paramount to include more elected officials on the FCHCC and this expansion will be
an ongoing goal.
Listed below are the scenarios which were presented for consideration as possible pilots:
#
#
#
#
#
#
Permanent Supportive Housing for Chronically Homeless.
Drop-in Center for Homeless Youth.
Apartment Complex and Supportive Services for Homeless Youth.
More formal regional Support Service Case Management Collaborative.
Treatment Tracking and Follow-up (Jail/Prison).
Homeless Veterans Housing.
There is an ongoing project that is being monitored by the Housing First Committee. The pilot
project involved four (4) housing vouchers and wrap-around services for chronically homeless
individuals.
1.
Continuum of Care Consistency Assessment
The Balance of State Continuum of Care has not updated the assessment information for
2008. However, in 2007 they identified the following needs to end chronic homelessness
and move families and individuals to permanent housing:
# Create new public housing beds for chronically homeless persons.
# Increase percentage of homeless persons staying in public housing over 6 months to
at least 71%.
# Increase percentage of homeless persons moving from transitional housing to public
housing to at least 61.5%.
# Increase percentage of homeless persons employed at exit to at least 18%.
# Ensure that the Continuum of Care has a functional HMIS system.
18
# Carry out localized implementation of the State ten-year plan within each of the nine
local homeless coordinating committees.
# Decrease requests for HUD Supportive Service funds.
# Seek funding from the state of Utah to provide housing for homeless families in rural
areas.
Potential projects which may apply for funding from the Balance of State Continuum of
Care in 2009 include:
# Iron County Care & Share - Southwest Utah Homeless Outreach Supportive Services
($37,229.00)
# Iron County Care & Share - La Casa Transitional Housing, Supportive Housing
Program Renewal ($105,222.00)
# Erin Kimball Memorial Foundation - No Place Like Home, Supportive Housing
Program ($84,883.00)
# Southwest Utah Behavioral Health Center - Our Place, Permanent Supportive
Housing ($81,548)
# Cedar City Housing Authority - Transitional Housing ($27,826.00)
# Pilot project funding for Five County for two homeless individuals (4 beds)
2.
Needs Assessment
In coordination with the State of Utah’s Ten Year Plan to End Homelessness, the Five
County area agrees that the goal is “every person within southwest Utah will have access
to safe, decent, affordable housing with the needed resources and support for selfsufficiency and well being.”
The Housing First strategy is a key to ending chronic homelessness. As mentioned in the
State’s plan, housing is more a basic need. Living in one’s own home also brings new
freedoms and responsibilities and marks the transition to adulthood in contemporary
American culture. Finding and maintaining a home is a fundamental indicator of success
in community life. Placing the chronically homeless in permanent supportive housing is
less costly to the community than living on the street. There is a need to find affordable
housing that will accommodate previously homeless individuals.
19
Table 2-14
Homeless and Special Needs Populations
Continuum of Care: Housing Gaps Analysis Chart
(Balance of State 2007)
Current
Inventory in
2007
Under
Development in
2008
Individuals
Emergency Shelter
315
Transitional Housing
282
Permanent Supportive Housing
74
Total
671
Persons in Families With Children
Unmet
Need/
Gap
-0-0-0-0-
134
144
190
468
Emergency Shelter
269
-0Transitional Housing
287
-0Permanent Supportive Housing
-0-0Total
556
-0Continuum of Care: Homeless Population and Sub-populations Chart
Part 1: Homeless Population
Sheltered
Unsheltered
248
265
218
731
Beds
Beds
Emergency
1.
Number of Households with
Dependent Children
1a. Total Number of Persons in these
Households (adults and children)
2. Number of Households without
Dependent Children**
2a. Total Number of Persons in these
Households
Total Persons
(Add Lines 1a + 2a):
Part 2: Homeless Sub-populations
1. Chronically Homeless
2. Seriously Mentally Ill
3. Chronic Substance Abuse
4. Veterans
5. Persons with HIV/AIDS
6. Victims of Domestic Violence
7. Youth
Total
Transitional
42
39
-0-
81
128
118
-0-
246
225
158
86
469
226
158
86
470
354
276
86
716
86
14*
17*
8*
1*
12*
0*
Total
217
115
141
65
4
100
3
Sheltered
Unsheltered
131
101
124
57
3
88
3
* Optional for unsheltered homeless sub-populations
** Includes single individuals, unaccompanied youth, and other adults (such as married couple without children)
The Utah Point-in-Time survey was coordinated the evening of January 31, 2008 by the
state of Utah, with the help of homeless service providers, homeless clients and
volunteers. This county provides a single-day “snapshot” of homelessness in Utah. A
total of 54 agencies, spanning roughly 80 emergency shelter and transitional housing
programs participated. In addition, food pantries, walk-in service providers, libraries, and
numerous volunteers administered unsheltered street surveys for one week, February 1
through February 8, in an effort to identify homeless persons who were not sheltered on
20
the night of January 31. The Point-in-Time survey generated the following information
regarding homeless individuals in our region. The Housing First Committee members
assisted in collecting local data for the Point-in-Time survey according to the Utah Pointin-Time Count of Sheltered and Unsheltered Homeless Individuals for the night of
January 31, 2008, a collaborative effort between the Utah Department of Community &
Culture and homeless service providers in Utah.
Table 2-15
Point-In-Time Survey January 31, 2008
Homeless Persons Sheltered:
158
56
Homeless persons were sheltered that night
were considered Chronically homeless
Of the persons sheltered that night:
17
76
Persons were parents with a total of 30 children
Unaccompanied adults
56 of the sheltered persons were categorized as being Chronically Homeless
Of the Chronically Homeless in shelters:
25
26
1
10
Persons had serious Mental Illness
Persons with Substance Abuse
Persons had Developmental Disabilities, and
Individuals had Physical Disabilities
Children in School who are homeless
350
As indicated in the Poverty in Utah 2003 booklet, “Shelter is one of the most basic
necessities of life.....The lack of affordable housing is a major deterrent to selfsufficiency. The presence of adequate affordable housing can make or break a family
living on the edge of poverty.” Other housing issues include overcrowding and multiple
families in single household dwellings.
21
3.
Implementation Plan
A “HOUSING FIRST” approach for most families is the most advantageous (see table on
following page) solution for homelessness. The focus in this approach is to provide
homeless individuals and families a prompt, accessible pathway into housing and
connections with appropriate mainstream services. This process reduces the amount of
time an individual or family is homeless to an absolute minimum.
The components of such a plan are:
# Housing Services: to clear barriers such as poor tenant history, poor credit history,
identify landlords, negotiate with landlord, etc.
# Case Management Services: to ensure families are receiving public benefits, to
identify service needs, to connect tenants with community-based services.
# Follow-Up: To work with tenants after they are in housing to avert crises that
threaten housing stability and to solve problems.
The pilot project that is underway, supported by the Housing First Initiatives, is a
voucher program provided to the Cedar City Housing and St. George Housing
Authorities-- Each housing authority received two (2) housing vouchers and $7,500 to
assist chronically homeless individuals achieve self-sufficiency and break the cycle of
homelessness. Rent is provided each month to provide an apartment, laundry facilities,
case management services, etc. Clients establish self-sufficiency goals with a case
manager and work toward the achievement of those goals by participating fully in the
program and with their referring agency.
The Resource and Re-Entry Center (R&RC) was developed to provide wrap-around
services for inmates who are released from incarceration. The recidivism rate in
Washington County is eighty-two (82) to eighty-five (85) percent, which is much higher
that the State correctional recidivism rate. Mr. Frank Yoder, the founder of R&RC, said
that this project began August 2007 with thirty (30) to forty (40) volunteers. Since the
Dixie Care & Share only provides housing for twenty (20) days to homeless individuals
there was a great need for housing support for released inmates. For that reason, the
R&RC project will work to provide necessary transitional housing for inmates being
released from the Purgatory Correctional Facility. At this time, three (3) RV units are
currently in place to provide some housing and a request is being prepared to be
submitted to the Veterans Administration for fifty-four (54) apartment units for
transitional housing.
22
Table 2-16
Housing First Approach
23
The Southwest Utah Behavioral Health Center (SWBHC) received Continuum of Care
funds to construct Permanent Housing for persons who meet the criteria for chronically
mentally ill (including substance abuse disorders) and who are at risk for chronic
homelessness. Along with the Continuum of Care funds, they received Critical Needs
Housing monies to use as cash match. Three duplexes were constructed, known as
“Dixie View”, providing a total of 16 beds to provide housing for a combination of single
residents or single adults with children. Although treatment is received on an outpatient
basis, each resident receives case management and an individual treatment plan outlining
and addressing needs such as psychiatric needs including medication monitoring, medical
needs, counseling, employment and vocational needs, recreational, and any other
specialized need the resident might have. It is the hope of SWBHC to assist as many
individuals as possible in this target population and to decrease the risk of homelessness
as well as increase valuable skills needed to better manage their illness and become
satisfied members of the community.
The Erin Kimball Memorial Foundation has provided over 102,000 nights of shelter in
apartment settings for 92 homeless families, including 205 children, fleeing violence and
abuse since opening their doors in May 2002. Families are referred to the foundation by
the Department of Workforce Services, Five County Association of Governments, the St.
George Housing Authority, the DOVE Center, Dixie Care & Share, other regional
homeless and domestic violence shelters and a variety of churches, groups and
individuals. All of the families served are homeless prior to entering the program. Over
90% of the families sheltered have transitioned into permanent housing upon exiting the
program. In addition to the H.O.M.E. (Housing, Options, Mentoring, Empowerment)
program, the foundation offers supportive services including: 1) Advocacy and
specialized case management; 2) Life and job skills training in partnership with
LearnKey Corporation, including courses leading to certification in various LearnKey
Career Tracks; 3) Parenting, relationship and other life skills training through our
support group meetings; 4) Referral services for local resources and services; 5)
Partnerships, correspondence, and information sharing with other service providers; and
6) Monitoring of progress and celebration of success.
Iron County Care and Share provides many humanitarian services to individuals and
families needing assistance in Iron County. These services include:
Community Assistance
# Case Management
# Food Bank - Food Distribution
# Direct Food Stamp Application
# Rental/Mortgage Assistance
# Medical/Prescription Assistance
# Rehabilitation Assistance
# Budget & Life Skills Counseling
# Clothing Vouchers
# Gas Vouchers
# Bus Vouchers
# Other Community Service Referrals
24
Homeless Shelter Assistance
# Case Management
# Emergency Shelter
# Food - Hot Meals & Sack Lunches
# Homeless Outreach
# Shower Facilities
# Laundry Facilities
# Transitional Housing
# Housing First Pilot Program
# Rehabilitation Assistance
# SSD/SSI Application Assistance (Expedited)
D.
OVERALL HOUSING NEEDS ASSESSMENT
1.
Local Government Housing Needs Summary
Needs assessment forms submitted by local governments indicate the following general
needs in relationship to affordable housing:
•
•
•
•
•
2.
rehabilitation of deteriorated housing stock to standard condition
rehabilitation of rental units to standard condition
providing for the availability of safe and adequate rentals
a need for seasonal rental housing to support the tourism industry
developing additional water and sewer capacity for housing development in high
growth rate areas
Regional Analysis of Affordable Housing Needs
The Five County Association of Governments identifies the following needs and impacts
pertaining to affordable housing for the region:
# Partnerships between local communities to network, share information, and assist
each other in addressing affordable housing issues.
# Single parents with young children bear the greatest burden of affordable housing
problems.
# Local governments are over-burdened with providing adequate infrastructure to
support additional development, especially if they attempt to make housing more
affordable by reducing impact fees.
# The different arms of government need more coordination and cooperation with each
other to more effectively address issues and help people at the local level.
# Home buyers education programs should be used to help new home owners more
effectively manage their finances, learn life skills, and maintain their investments;
and, such programs help reduce mortgage interest rates with most banks.
# Many poverty-level households – primarily migrant workers, seasonal and minimum
wage service workers, and the elderly or physically/mentally impaired – are living in
substandard, unsafe housing. Housing stock for this income level is in short supply,
25
and what is available is frequently in substandard and unsafe condition. Many people
in these categories may be living out of automobiles, camp trailers or tents, living
with relatives, or remain homeless.
# While recognizing the need for following building codes, investigation into using
innovative ways of building and manufacturing homes need to be made in order to
lower the costs of construction.
# Legislative representatives need to be made aware of affordable housing issues for
low-income residents; their support is needed for housing programs, i.e., the Olene
Walker Housing Trust Fund, the Homeless Trust Fund, and the HOME program; and
they need to work to open funding opportunities for the Five County district.
E.
BARRIERS TO AFFORDABLE HOUSING
1.
Affordable Housing Barriers and Strategies
With the roles of federal, state, and local levels defined, Association staff, the Planning
Coordination Team, and the Housing Advisory Board have identified specific barriers
which institute affordable housing deficiencies in the Five County District. In addition,
designated strategies are provided to assist in overcoming the identified barriers (see
Table 2-17). Most strategies are written from a local government perspective.
Table 2-17
Affordable Housing Barriers and Strategies
Barriers
Lack of adequate infrastructure
(water, sewer, roads) and the high
development costs are passed onto
the consumer (impact fees)
Strategies
Local governments plan ahead and budget for growth and
diminishing resources
Local governments seek low-interest loans and/or grants to
reduce development costs
Encourage jurisdictions to enact measures to reduce or
waive such fees for projects that include affordable housing
opportunities.
Lack of ordinances which
specifically mandate the provision
of affordable housing
Encourage jurisdictions to enact “inclusionary zoning”
ordinances which ensure that housing developments
allocate a certain portion of the units to low and moderate
income homebuyers.
Municipal re-evaluation of subdivision ordinances in order
to update/modify regulations where possible.
26
Table 2-17
Affordable Housing Barriers and Strategies
Barriers
High cost of pre-development of
properties and on-site work
Strategies
Zone for higher densities to centralize services
Encourage infill development and adaptive reuse
Rehabilitate and preserve historical properties for lowincome housing purposes
Perform dual-purpose rehabilitation projects, i.e., retail
main street store fronts with upstairs low-income
apartments
Escalating costs of property
Reduce impact fees for low-income housing developments;
Zone for higher densities and allow for smaller building
lots, multi-family housing, and accessory dwelling units
Allow for flexibility in zoning ordinances for open space
requirements, parking provisions, etc. on low-income
housing projects
Purchase run-down properties and donate to low-income
housing developments to revitalize slum and blighted areas
Partnership with non-profits, Housing Authorities, Color
Country Community Housing, Inc., Habitat for Humanity
on low-income housing developments
Time delays in receiving project
approval
Streamline administrative development review and
permitting process
Rising costs of building
materials
Allow more efficient and innovative uses of building
materials, construction methods, and design
Support a second-hand building supply operation where
materials can be recycled and sold at reduced prices to lowincome customers
27
Table 2-17
Affordable Housing Barriers and Strategies
Barriers
Fragmentation of government
programs and other funding
sources
Strategies
Collaborate with other agencies and housing providers to
network information, resources and services
Partner on projects with other housing providers and
lenders to reduce costs to low-income consumers
Provide educational program to enlighten local
governments on their role in the scope of participation with
other entities
Inability of private sector to realize
their role in the provision of
affordable housing
Work with local employers to establish employer assisted
housing (EAH). Ultimately, EAH builds employee loyalty
and reduces turnover by offering homebuyer assistance or
rental assistance
Large minimum lot sizes which
inhibit the viability of building
affordable housing
Encourage jurisdictions to modify zoning/subdivision
regulations to allow density bonuses for projects which
provide affordable housing opportunities
Lending practices of for-profit
banks and lending institutions
Find innovative ways banks and lending institutions can
participate on projects at a lower rates of interest by
offering advertising perks, etc.
Take advantage of programs offered by other institutions
that can be dove-tailed into the scope of a project, i.e.,
reduced interest rates for completing a home buyer
education program (FHA sponsored)
Use Community Revitalization Act (CRA) points from
banking institutions for projects
Seek participation of local banks to participate in the
American Dream Down Payment Initiative Program
designed to help with down-payment and closing costs on
the purchase of a new home
28
Table 2-17
Affordable Housing Barriers and Strategies
Barriers
Low-income populations are
sometimes unable to overcome
personal hardships because a lack
of knowledge and/or training
Strategies
Offer down-payment and closing cost assistance to lowincome, first-time home buyers.
Encourage participation in First Time Home Buyers
education course.
Outreach to residents and tenants of public and
manufactured housing assisted by public housing agencies
to inform them of available down payment/closing cost
assistance.
Ensure the Fair Housing Laws are enforced to prevent
discrimination against minority groups, the elderly,
disabled, or single parent households.
Housing Rehabilitation & Home
Ownership
Work with the Utah Division of Housing and Community
Development to apply for rehabilitation funding for
substandard or dilapidated housing.
Limited Resources
Substandard or dilapidated housing
2.
Partner with other agencies/programs to best utilize funding
to meet housing repair need.
Evaluation of Current Fair Housing Legal Status
Utah’s Fair Housing Act (Utah Code Annotated §57-21-1) prohibits discrimination on the
basis of race, religion, color, sex, national origin, familial status, disability or source of
income in the rental, purchase and sale of real property. Because the Five County District
is made up of mostly rural areas and smaller communities, fair housing has not been an
issue in the region. Further, FCAOG staff has not become aware of any formal
complaints made in any of the jurisdictions in the district.
3.
Analysis of Impediments and Implementation
The Five County region has just begun to address the problem of fair housing. While
staff have been collecting information on general housing, fair housing has not been a
problem in the past, and therefore has not been a priority. However, community leaders
and planners in the region are beginning to recognize the need for in-depth studies on fair
housing and will in the near future begin research to identify specific problems
concerning fair housing. At this time, FCAOG staff is only aware of increasing problems
with overcrowding and lack of affordable housing for people in poverty.
29
F.
SPECIAL NEEDS HOMELESS HOUSING PRIORITIES
1.
Homeless Families: There continues to be increases in homelessness in the Southwest
region among families. According to service providers for homeless families, the most
immediate need for a homeless family is safe and secure shelter, including child care
provision and adequate food. Once housed on an emergency basis, attention can be
directed toward locating more permanent housing. The need for support to families was
expressed by the Washington County School District who has collected information on a
growing number of school age children who are homeless.
2.
Chronically Homeless: The first and most important group to address when seeking to
end homeless is the group that lives in the shelter system - the chronically homeless.
This category of homeless includes individuals with disabling conditions who have been
homeless for a year or more, or have experienced at least four episodes of homelessness
within three years. This group represents about 12% of the homeless population and
consumes up to 50% of the available resources. While some may have limited income
from wages and/or public benefits, they will require long term subsidization of both
housing and services. Many of the chronically homeless individuals deal with mental
health issues and because of their disability will additionally require long-term case
management to be successful in maintaining housing. Although the actual count of
chronically homeless individuals is not a high as in more densely populated areas there
remains a substantial need to avoid community decay and expenses locally. Permanent
supportive housing with appropriate and available services and supports is highly
successful in stabilizing this population. The need to make available more opportunities
by increasing the pilot program that is allowing four vouchers to provide housing in the
Washington and Iron County area is vital.
3.
Homeless Youth: Older youth still in Foster Care (usually over 16 or 17, mature, and
unattached to a Foster Family) can be transitioned out of Foster Care via an Independent
Living arrangements where they are housed in an apartment of student housing and
Foster Care payment is made directly to the youth - approximately $600 per month. The
Department of Child and Family Services is currently working with local apartment
complex owners to reserve four apartment for this type of transitional situation. The
Homeless Youth Drop-in Center is currently in transition from a residential program to a
day program only; however, a determination is still in process as to the survival of this
essential program. The need to provide case management to assist the homeless youth to
find housing, education and employment as well as meeting the psychosocial needs of
local homeless youth, including youth from the Fundamentalist Church of Jesus Christ of
Latter Day Saints (FLDS) is substantial. The St. George area has reports of homeless
youth staying in the public parks. The Regional Interagency Council (RIC) affirms the
need for services for a wide range of individuals, including the FLDS exiled youth and
those aging out of foster care youth. The Youth Crisis Center and the Juvenile Crisis
Center staff have voiced a need for additional day and residential supports. Additionally
although there are some supports for 16 year old to 18 year old and a Family Support
Center for juvenile 0-12, there is a gap in services for children 13-16 years old creating a
considerable deficient in services.
4.
Homeless Chronic Substance Abusers: These individuals have special needs that are
not met in the traditional shelter setting. Homeless substance abusers need rehabilitation
services in a safe and structured environment that provides therapy to enable them to
30
perceive the broader cases of substance abuse and understand addictive behavioral
patterns. After rehabilitation many homeless substance abusers need affordable
transitional housing which is not readily available. Mental health and chemical
dependency treatment services are organized on a regional basis, with offices locally.
5.
Homeless Veterans: In addition to the complex set of factors affecting all homelessness
a large number of displaced and at-risk veterans live with lingering effects of Post
Traumatic Stress Disorder and substance abuse, compounded by a lack of family and
social support networks. Homeless veterans need secure, safe, and clean housing that is
free of drugs and alcohol, and has a supportive environment. The Utah County Veterans
Council found the most effective programs for homeless and at-risk veterans are
community-based, nonprofit, vets helping vets groups. The Resource and Re-entry
Center is attempting to address some of the needs of the homeless veterans in the
Washington County area by providing mentors who assist in locating housing, services
and resources. There is also a need for funding to match funds for a 54 unit housing
complex which is being planned by the U.S. Department of Veterans Affairs and
community partners.
6.
Homeless Seriously Mentally Ill: Service providers have reported an increase in service
levels to the homeless over each of the past several years. When this is measured with
the relatively constant proportion of individuals who are mentally ill in the general
population, the assumption is that the need for services for homeless individuals who are
mentally ill will continue to increase. Local service providers indicate that financial
resources to provide supportive, community-based services needs to be made available to
homeless mentally ill. This population needs on-going support to help them with
vocational training, substance abuse treatment, money management, scheduling and
attending appointments, and assistance with applying for social security disability so they
can receive primary health care. They also need supportive care in an affordable housing
situation. Providing affordable housing opportunities alone will not be sufficient to
insure stable living conditions, as they often need someone else to monitor their physical
and medical needs.
7.
Victims of Domestic Violence: Homeless persons with children who have fled a
domestic violence situation need help in accessing safe and suitable transitional and
permanent housing, legal services, support groups, substance abuse classes,
transportation and job training. The DOVE Center, Canyon Creek Women’s Crisis
Center and Erin Kimball Memorial Foundation are working toward meeting the need of
victim’s of domestic violence. Kane, Beaver and Garfield counties do not currently have
crisis center services and have expressed the need to provide services within rural
counties.
8.
Persons with HIV/AIDS: According to data from the Utah Department of Health,
Bureau of Communicable Disease Control, HIV/AIDS Surveillance Program there were
2,350 cumulative AIDS cases in the state of Utah through June 30, 2008. In addition,
there were 967 HIV (non AIDS) cases reported. Of that total, 57 reported cases of AIDS
and an additional 18 individuals with HIV were in the Southwest Health District which is
comprised of Beaver, Garfield, Iron, Kane and Washington counties. According to the
Utah Department of Health, a majority of persons with AIDS living in rural areas travel
to the Wasatch Front for medical treatment. The St. George Housing Authority provides
limited assistance for persons with HIV/AIDS through HOPWA (Housing Opportunities
31
for Persons With Aids) vouchers and short-term rent, mortgage and utility assistance for
southwestern rural Utah, which includes the five counties.
G.
IMPLEMENTATION STRATEGY
Refer to section E, Barriers to Affordable Housing. In addition to identifying the barriers, Section
E outlines strategies that are currently being utilized or may be implemented to overcome the ever
increasing challenges faced in meeting affordable housing needs in the Five County region.
The Five County Association of Governments is a regional planning organization which provides
technical assistance to local governments which adopt local land use ordinances. The staff of the
Association will continue to work with local governments to identify and implement the
strategies identified in Table 2-17 in the local jurisdiction’s general plan, zoning, subdivision and
other land use ordinances and codes.
32
H.
SUMMARY OF SPECIFIC HOMELESS/SPECIAL NEEDS OBJECTIVES
HUD Table 1C
Summary of Specific Homeless/Special Needs Objectives
(Table 1A/1B Continuation Sheet)
Obj
#
Specific Objectives
Performance Measure
Expected
Units
Homeless Objectives
Create Decent Housing with new or improved
availability through development of
permanent supportive housing
# of supportive housing
units for the homeless
created over the next
five years.
2
Enhance Suitable Living Environment
through new/improved accessibility. Of the
homeless population, 95 percent will be
stabilized with access to some form of
housing along the continuum of care.
# of persons stabilized
through access to
housing at any point in
time during the next
five years.
200
3
Improve services and outcomes for Utah’s
homeless population by identifying their
specific needs.
# of agencies
participating in HMIS
by December 2007
5
4
Improve services and outcomes for homeless
individuals by better coordinating services
and policies
# of fully functioning
local homeless
coordinating
committees by
December 2008
1
# of accessible units
produced
# of disabled persons
assisted
3-5 units
1
30
Special Needs Objectives
1
2
3
Accessible housing for persons with physical
disabilities
Affordable housing for persons with mental
disabilities
# of units produced
specifically for persons
with disabilities
# of disabled persons
served
Adequate housing for persons with special
needs including housing for HIV/AIDS and
domestic abuse victims
# of housing units
produced for persons
with special needs
served
33
3-5 people
3-5 units
3-5 persons
10 Units
(domestic
violence)
Actual
Units
I.
LEAD BASED PAINT STRATEGY
It is the policy of the Five County Association of Governments to test only homes that were built
prior to 1978. The Home and Weatherization Program tests only those areas that might be
disturbed during weatherization or rehabilitation activities to determine if lead safe work practices
must be implemented. If lead is found, employees of the agency and any sub contractor will be
certified to do lead safe work practices. The home owner will be notified and will be given a
Protect Your Family From Lead in Your Home brochure. All homes built prior to 1978 will
receive this brochure even if there are no surfaces being disturbed.
34
Five County Association of Governments
Consolidated Plan - Annual Action Plan 2009
CHAPTER III. ANNUAL NON-HOUSING COMMUNITY
DEVELOPMENT NEEDS ASSESSMENT
A.
COMMUNITY DEVELOPMENT STATUS AND NEEDS ASSESSMENT
The following list shows the categories with the largest number of locally identified Community
Development capital projects taken from individual community, county and special service
district capital investment plans in the region. This list reflects regional needs as documented on
the community’s 1-year Capital Investment Plan. See Appendix C for one-year lists. Appendix
D contains 2-5 year lists. With that in mind, the region’s most common documented needs are:
1.
Public Utilities/Works-- Jurisdictions identified 24 public utilities/works projects to
address related issues. There are 21 culinary water improvement projects including
additional storage capacity; waterline replacement; security fencing; updated meter
reading equipment; well development and/or improvements; filtration systems; and
improvements to address improved fire flow. Jurisdictions also identified 1 secondary
water system project, 1 sewer improvement project and 1 power project.
2.
Public Safety/Protection-- There were 17 projects identified for public protection
including fire and EMT/EMS stations; procurement of fire trucks and/or ambulances;
medical equipment; housing for visiting medics; animal control and storm drain/flood
control. There were also 6 projects identified for jails and/or police facilities or
equipment. However, these projects are not eligible for CDBG funding.
3.
Community Facilities/Public Services-- There were 19 projects outlining rehabilitation
improvements, maintenance and/or construction of new senior citizens/community
centers; construction or improvements to community and/or county facilities;
construction of homeless shelter; and procurement of vehicles for aging program and/or
public transit operation. Four of these projects were identified to provide bulk OX pad
access installation; secondary emergency assess; EMR clinical computer system; and
procurement of an ambulance. One project was to construct a new building for the
Southwest Utah Public Health Department. The four projects identified by the Kane
County Human Services SSD and the health department will seek funding from the
Permanent Community Impact Fund Board.
4.
Permanent Housing-- Jurisdictions identified 11 projects to address affordable housing
for low to middle income families through assistance with down payment and/or closing
costs; land acquisition or construction of permanent housing for elderly, low income and
homeless individuals; CROWN rent-to-own homes; and mutual self help.
5.
Transportation-- Jurisdictions included 14 transportation related projects for
streets/bridges, curb/gutter and sidewalks. Two projects were also included to address
airport improvements and one for procurement of a 23 passenger bus for a transit
program.
35
6.
Recreation-- A total of 12 projects were identified by jurisdictions for improvements to
existing parks and/or playground equipment, as well as land acquisition for recreational
purposes. Nine of these projects were for construction of an aquatic center, ball fields,
repairs to a swimming pool; golf course rehabilitation; construction of a skate board park,
arena improvements and pavilion repairs. The majority of these projects are in
communities that are not currently eligible to fund community-wide projects with CDBG
funds. Due to the nature of the development in these communities, it appears unlikely
that a low to moderate income survey would be successful to qualify them for the use of
CDBG funding.
7.
Planning-- There were 14 projects for feasibility studies/plans including storm drainage,
library design, water system master plans, master park plans, courthouse renovation
design, senior citizen center, irrigation system, and capital facility plans.
8.
Economics-- One project related to economics was identified. This project proposes to
rehabilitate a museum.
36
Table 3-1 Capital Investment Needs Summary
Beaver County
1
1
1
Beaver
Milford
1
Minersville
1
Garfield County
1
2
1
2
1
1
Antimony
1
1
Boulder
1
1
Bryce Canyon
Cannonville
Escalante
1
1
1
1
1
Hatch
1
1
Henrieville
Panguitch
1
1
1
1
3
Tropic
Note: Those jurisdictions showing no project information did not return capital improvements lists for inclusion into the Consolidated Plan.
37
Other
Prof. Design/studies
Zoning/General
Plan
Rehabilitation
Permanent Housing
Rental\multi-family
LMI
Housing
Sports Facilities
Community Parks
Rec.
Museums
Parks/open space
Tourism
Industrial/commercial
Economics
Airport/public transit
Curb/gutter/sidewalks
Public
Trans.
Streets/Bridges
Cemeteries
Shelter/Food Bank
Senior/Comm. Center
Education/Libraries
Medical
Public Buildings/ Facilities
Administration
Animal Control
Storm Drain/Flood
Jails/Police
Fire/Ambulance
Solid Waste
Public Protection
Miscellaneous/equip.
Power/Nat. Gas
Secondary Water
Drinking Water
Jurisdictions:
Sewer
Public Utilities/Works
Table 3-1 Capital Investment Needs Summary
Brian Head
2
Cedar
3
Enoch
1
1
1
2
1
1
1
1
Parowan
2
1
1
1
1
3
1
1
1
2
1
1
1
1
4
1
1
1
1
Big Water
1
Glendale
Kanab
2
2
1
2
Orderville
Washington Co.
2
1
1
1
1
1
2
1
1
1
Apple Valley
Note: Those jurisdictions showing no project information did not return capital improvements lists for inclusion into the Consolidated Plan.
38
Other
Zoning/General
Prof. Deisgn/studies
1
1
1
1
Kane County
Plan
Rehabilitation
Permanent Housing
Rental\multi-family
LMI
Housing
Sports Facilities
Community Parks
Rec.
Museums
Parks/open space
Tourism
Industrial/commercial
Economics
Airport/public transit
Curb/gutter/sidewalks
Streets/Bridges
Cemeteries
Public
Trans.
Shelter/Food Bank
Senior/Comm. Center
Education/Libraries
Medical
Administration
1
Animal Control
2
Public Buildings/
Facilities
2
Paragonah
Alton
Storm Drain/Flood
Iron County
Jails/Police
Fire/Ambulance
Solid Waste
Public
Protection
Miscellaneous/equip.
Power/Nat. Gas
Secondary Water
Drinking Water
Jurisdictions:
Sewer
Public Utilities/Works
TOTALS
39
Springdale
Enterprise
Hildale
1
1
3
Leeds
New Harmony
Rockville
Santa Clara
2
1
Virgin
Washington City
Note: Those jurisdictions showing no project information did not return capital improvements lists for inclusion into the Consolidated Plan.
Other
Prof. Deisgn/studies
Zoning/General
LMI
Housing
14
1
Rehabilitation
Permanent Housing
Rental\multi-family
Sports Facilities
Rec.
11
1
7
1
Community Parks
Economics
5
Museums
Parks/open space
Tourism
Industrial/commercial
Airport/public transit
Curb/gutter/sidewalks
Public
Trans.
1
3
1
3
1
Streets/Bridges
Cemeteries
Shelter/Food Bank
Senior/Comm. Center
Education/Libraries
Medical
Administration
Animal Control
Storm Drain/Flood
Jails/Police
Fire/Ambulance
Miscellaneous/equip.
Solid Waste
Power/Nat. Gas
Public Buildings/ Facilities
8
1
1
6
1
4
Toquerville
Public Protection
7
1
1
2
6
Hurricane
6
LaVerkin
Secondary Water
Drinking Water
Public Utilities/Works
10
1
1
Ivins
1
21
Sewer
Jurisdictions:
1
Table 3-1 Capital Investment Needs Summary
Plan
B.
ECONOMIC DEVELOPMENT NEEDS
The Five County region of Southwestern Utah exhibits many positive economic factors, including
high labor skills, competent labor climate, Interstate-15 access, excellent natural recreational
opportunities, low unemployment rate, moderate real estate tax costs, and proximity of support
services. These and other positive economic factors have created one of the most dynamic regions
in the Intermountain West.
During 2008, Southwestern Utah leaders and economic development staff will focus on activities
that will encourage the best use of the existing economic diversity, traditional values and skilled
labor force; the support of local economic development boards; wise use of available funding
mechanisms; appropriate development standards and focused efforts in education; and greater
public involvement to attain a dynamic, cooperative and strong economic future .
The Comprehensive Economic Development Strategy Committee has adopted the following
major economic development objectives:
1.
Provide regionally-focused services that complement county and community economic
development programs. Specific services include:
# Revolving Loan Fund marketing and administration across the region, rather than
establishing other county or community-scale loan programs. Particular efforts will
be made to increase the number of loans closed in 2008 to at least six.
# Preparation of project-level Environmental Assessments within the capacity of
available staff resources.
# Delivery of technical planning assistance regarding workforce housing design and
construction.
# Development and delivery of up-to-date land use planning training modules
generated from the Vision Dixie and Iron Destiny processes.
# Author planning and feasibility studies for projects that transcend county or
community boundaries as directed by the Steering Committee.
# Maintain a dynamic and informative Internet web page.
# Continue to provide high quality grant writing and technical assistance.
2.
Focus efforts on jurisdictions that do not have internal staff support to provide day-to-day
economic development outreach. Specific activities include:
# Add information to the Sure Sites program.
# Participate in regional and state-wide initiatives such as Utah Small Cities, Inc., Utah
Economic Alliance, Governor’s Rural Partnership Board, etc.
40
3.
Represent southwestern Utah interests at forums such as:
# Western Region Workforce Services Council
# Color Country RC&D Council
# Color Country Travel Council
# Mormon Pioneer National Heritage Area Alliance
# Scenic Byway 12 Committee
# Utah’s Patchwork Parkway (Hwy 143) Committee
# Canyon Region Economic Development Alliance
# Grand Staircase-Escalante National Monument Advisory Committee
# County and community-level Economic Development Boards
4.
Forge closer ties between economic development and public/higher education initiatives
in the region. Two major 2008 initiatives include:
# Utah Business Resource Center development at Southern Utah University and Dixie
State College
# Support the Dixie State College initiative to create an alliance with the University of
Utah
# Support the Kanab Center for Education, Business and the Arts (CEBA)
5.
Champion regional projects that foster economic development, such as:
# Developing on-site power generation capacity to Ticaboo/Bullfrog
# Providing IT/Broadband redundancy across the region
# Establishing access to land banking, secondary financing, and other activities that
foster access to affordable workforce housing.
# Facilitate National Scenic Byway Planning for SR-143 and SR-9.
# Provide public lands planning expertise and capacity to local officials.
41
C.
SUMMARY OF SPECIFIC HOUSING/COMMUNITY DEVELOPMENT
OBJECTIVES
Table 3-2
Summary of Specific Housing/Community Development Objectives
Obj.
#
Special Needs Objectives
Performance
Measure
Expected Units
Development of affordable rental housing
units
Households
assisted, units
created
173 in
5 years
Accessible rental housing
Households
assisted,
accessible units
created
17 in
5 years
Households
assisted, units
preserved
185
in 5 years
Number of
persons served,
including low
income persons
Approx.1-5
projects per
year/# of LMI
beneficiaries
will vary
Number of
persons served,
including low
income persons
Approx.1-5
projects per
year/# of LMI
beneficiaries
will vary
Number of
persons served,
including low
income persons
Approx.1-5
projects per
year/# of LMI
beneficiaries
will vary
Rental Housing Objectives
Owner Housing Objectives
Preservation, rehabilitation/replacement,
down payment assistance and lead-based
paint removal
Community Development Objectives Safety, Transportation, ADA, Recreation
Creating suitable living environments
Outcome - Improve availability and promote
livability
Infrastructure Objectives
Creating suitable living environments
Outcome - Improve availability and promote
livability
Public Facilities Objectives
Creating suitable living environments
Outcome - Improve availability and promote
livability
42
Actual
Units
Public Services Objectives
Create suitable living environments
Outcome - Improve availability and promote
livability
Number of
persons served,
including low
income persons
1-3 projects in
5 years
# of LMI
beneficiaries
varies by type
of project
Number of jobs
created, including
jobs for low
income persons
20-30 loans in
5 years
(Average of 5
jobs per loan,
with 3 LMI
jobs per loan)
Number of
persons served,
including low
income persons
5 a year
Economic Development Objectives
Creating economic opportunity
Outcome - Improve availability and promote
livability
Other Objectives - Planning
Creating suitable living environments,
provide decent safe or affordable housing or
create economic opportunity
Outcome - Improve availability and promote
livability, enhance health and safety or
provide economic opportunity
43
Five County Association of Governments
Consolidated Plan - Annual Action Plan 2008
CHAPTER IV. FOCUS COMMUNITIES/NEIGHBORHOODS
ASSESSMENT
A.
INDICATORS
State requirements for the one year action plan included identification of one or more focus
communities in each region. In order to identify those focus communities, the staff at Five
County AOG assessed communities throughout southwestern Utah. The methodology included a
trilogy of methods to ascertain where regional focus should be directed. One of these was a
"self-assessment" which was developed by sending out a survey form that was completed by
willing incorporated jurisdictions. Another method utilized the results of the 2004 Housing Stock
Condition Survey which was carried out by the staff of the Five County Association of
Governments with the cooperation of incorporated communities as well as each of the five
counties for the unincorporated areas. The final portion of the trilogy of methods is the
institutional knowledge of the professional planning staff of the Five County Association of
Governments who have identified several areas with known concerns. It is not intended that the
more subjective nature of the institutional knowledge portion of the trilogy be the determining
factor, but to function as a means to confirm issues already identified and validate issues
identified in the first two. In addition to the focus communities there are other "areas" of concern
that are identified in this section which further study may be undertaken to better quantify.
1.
Housing Quality as Determined from the Regional 2004 Housing Stock Survey
Table 4-1
Five County Association of Governments Regional Totals
(non-entitlement area)
Number of
Homes
All Homes in Region (non-entitlement area)
Percentage of
Total Homes
29,311
100.00%
Single Family Homes in Dilapidated Condition
107
0.36%
Mobile Homes in Dilapidated Condition
126
0.43%
3
0.01%
105
0.36%
1
0.003%
199
0.67%
3
0.01%
28,767
98.15%
Apartment Units in Dilapidated Condition
Single Family Homes in Deteriorated Condition
Duplexes in Deteriorated Condition
Mobile Homes in Deteriorated Condition
Apartment Units in Deteriorated Condition
Homes in Excellent, Fair or Moderate Condition
44
When looked at from a district-wide perspective, 98.15 percent of the homes in the region
(non-entitlement area) are in excellent, fair or moderate condition, thus only 1.85 percent
of homes of any type would be considered as being deteriorated or dilapidated, a
seemingly small percentage. Instead of that more “global” perspective, and in order to
gain an accurate understanding of localized housing problems, it is necessary to look at
each community from a local perspective. Only by viewing the data from that scale can
one get a proper view of housing stock problems that currently exist in many of our
smallest rural communities, which in some cases are relatively significant. Please refer to
the tables at the end of this section for specific numbers and percentages of homes in the
various conditions in each individual city and town, the unincorporated area of each
county, as well as composite totals for each individual county.
While this section deals with the condition of housing stock in the district, the Continuum
of Care provides more specific information on special needs housing in the region, such
as resources and facilities available for the elderly, disabled, homeless, etc.
Focus Community Determination Based on Analysis of Housing Condition Survey:
An analysis of the Housing Condition Survey undertaken in 2004 identified several communities
whose percentage of housing in severely deteriorated or dilapidated condition was considerably
higher than all others. The following communities have been identified as focus communities
based upon their housing stock condition. Tables for individual communities are found in the
2005 Consolidated Plan, as amended.
Table 4-2
Focus Communities Based Upon Housing Stock Condition
Southwest Utah by County
Community/
County
Number of Homes in
Severely Deteriorated
or Dilapidated
Condition
Total Number of
Houses in the
Community
Percent of Homes in
Severely
Deteriorated or
Dilapidated
Condition
Big Water Town/
Kane County
39
207
18.82%
Hatch Town/
Garfield County
9
51
17.65%
Alton Town/
Kane County
6
34
17.64%
16
196
8.16%
Orderville Town/
Kane County
Source: Five County Regional Housing Condition Windshield Survey, 2004
2.
Community Development Infrastructure, Facilities and Service Needs
Lack of necessary infrastructure to support many forms of economic development is
lacking in many of rural Utah counties. Garfield and Kane counties are especially
affected due to the lack of access to redundant fiber access to the Internet as well access
45
to all forms of affordable utilities including natural gas. Even basic infrastructure such as
water source, storage and distribution are limiting factors.
B.
IDENTIFICATION OF FOCUS COMMUNITIES BY SELF-ASSESSMENT OF
COMMUNITY DEVELOPMENT INFRASTRUCTURE, FACILITIES AND
SERVICES NEEDS
In 2007, a community “self-assessment” form was sent out to each of the 37 cities and towns in
the five county region The purpose was to involve the local entities in identifying the community
development needs in their area from their perspective. It is anticipated that this will be done
every other year.
All but eight of those assessments were completed and returned (See Appendix E). The thirty that
responded were plotted on a table with each of the following type of community need identified:
#
#
#
#
#
#
#
#
#
#
#
#
#
#
#
#
Fire Department Facilities
Fire Department Equipment
Fire Department Staffing/Volunteers
Police/Public Safety Facilities
Police/Public Safety Staffing
Recreational Facilities
Community Sewer System
Culinary Water System Source
Culinary Water System Storage
Culinary Water System Distribution
Streets and Roads
Solid Waste Disposal
Health Care
Animal Control
Courts
Jails
The community was asked to assess the level in which those items listed above are addressed in
their community on a scale of 1-10, with one meaning that the item is completely inadequate to
ten meaning the issue is extremely well addressed. We did not differentiate between a service
provided by another entity, i.e. the County providing for jail services in the area. We asked the
local cities and towns to simply identify how those service, regardless of who provides them, are
addressing the services in the community.
Identification of Focus Areas based upon the Community Self-Assessment:
One of the factors in determining those communities which our region defines as a “Focus
Community” is the jurisdictions own self-assessment of its community development
infrastructure, facilities and service needs.
A cumulative total of the assessment sheets was created and from this averages based upon valid
responses was developed. An average value for each jurisdiction was calculated from the valid
responses. The table below was used to compute the averages for the valid responses for the
jurisdictions:
46
Recreational Facilities
Community Sewer System
Culinary Water System Source
Culinary Water System Storage
Culinary Water System Distribution
Streets & Roads
Streets & Roads Maintenance
Solid Waste Disposal
Health Care
Animal Control
Courts
10
5
10
10
2
9
8
9
8
9
6
9
9
8
10
10
10
10
10
10
1
4
9
9
8
1
1
4
2
9
10
10
6.941
7
7
5
x
x
5
9
8
6
8
6
6
x
x
5
x
x
6.545
5
5
1
5
5
4
x
8
9
7
5
5
7
8
8
8
8
6.125
8
6
7
8
8
5
x
8
8
5
7
7
8
x
x
x
x
7.083
x
x
x
x
x
x
x
x
x
x
x
x
x
x
x
x
x
NR
5
5
3
8
8
5
x
9
3
8
8
5
8
8
5
8
8
6.500
2
9
9
8
7
6
10
10
9
9
8
8
10
5
8
10
10
8.118
7
6
5
6
6
7
1
6
6
7
4
4
1
7
x
x
x
5.214
4
6
4
7
7
6
9
9
9
8
5
5
5
3
5
5
5
6.000
9
9
9
8
8
7
9
8
9
8
6
7
7
9
1
8
10
7.765
10
9
10
x
x
5
5
9
5
7
5
4
8
x
x
x
x
7.000
x
x
x
x
x
x
x
x
x
x
x
x
x
x
x
x
x
NR
6
6
6
10
8
6
8
7
8
6
7
7
9
9
7
x
x
7.333
7
7
7
6
5
2
8
7
6
7
5
5
8
2
7
x
x
5.933
5
8
5
x
x
9
x
9
9
9
8
7
9
x
x
x
x
7.800
10
10
10
4
4
7
x
8
10
9
7
7
x
x
x
x
x
7.818
8
8
8
3
7
8
9
7
8
4
5
5
8
7
5
8
3
6.529
3
4
6
1
1
6
x
4
8
9
6
6
9
x
x
x
x
5.250
x
x
x
x
x
x
x
x
x
x
x
x
x
x
x
x
x
NR
9
9
8
x
x
9
10
10
10
9
9
10
9
x
6
x
x
8.167
8
8
7
5
5
6
8
3
7
5
1
6
x
x
7
7
x
5.929
3
4
2
x
x
5
10
5
5
5
5
3
x
x
x
5
x
4.727
7
6
5
x
x
1
8
8
8
8
8
6
10
x
3
x
x
6.500
1
9
9
3
5
4
2
8
6
7
7
7
7
8
8
9
x
5.812
x
x
x
x
x
x
x
x
x
x
x
x
x
x
x
x
x
NR
6
7
4
3
8
4
6
8
6
6
4
5
8
6
8
7
x
6.000
3
7
6
4
7
5
9
10
8
7
6
6
10
x
5
7
3
6.437
8
2
5
6
7
4
8
8
5
5
6
4
6
3
3
4
5
5.235
x
x
x
x
x
x
x
x
x
x
x
x
x
x
x
x
x
NR
x
x
x
5
5
6
x
9
8
7
4
3
10
6
5
7
7
6.308
8
7
6
8
8
6
5
8
8
8
7
7
8
x
6
x
x
7.143
x
x
x
x
x
x
x
x
x
x
x
x
x
x
x
x
x
NR
8
8
6
8
9
9
8
8
8
8
7
7
7
6
7
8
1
7.235
x
x
x
x
x
8
10
10
9
8
5
7
10
x
1
x
x
7.556
x
x
x
x
x
x
x
x
x
x
x
x
x
x
x
x
x
NR
x
x
x
x
x
x
x
x
x
x
x
x
x
x
x
x
x
NR
6.5
7.1
6.2
6.2
6.7
5.5
7.5
7.9
7.5
7.2
5.9
5.7
7.8
6.1
5.7
7.6
6.7
Averages
Police/Public Safety Staffing
10
Jails
Police/Public Safety Facilities
X= No Response
Fire Department Staffing/ Volunteers
(Using a scale of 1 to 10 - 1 meaning completely
inadequate to 10 meaning extremely well-addressed)
Fire Department Equipment
Jurisdiction Needs Assessment
Fire Department Facilities
Table 4-3 Jurisdiction’s Self-Assessment
Regional Tabulation - Cumulative Totals
Beaver County
Beaver City
Milford City
Minersville
10
8.353
Garfield County
Antimony
Boulder
Bryce Canyon
Cannonville
Escalante City
Hatch
Henrieville
Panguitch City
Tropic
Iron County
Brian Head
Cedar City
Enoch City
Kanarraville
Paragonah
Parowan City
Kane County
Alton
Big Water
Glendale
Kanab City
Orderville
Washington County
Apple Valley
Enterprise City
Hildale City
Hurricane City
Ivins City
LaVerkin City
Leeds
New Harmony
Rockville
Santa Clara City
Springdale
Toquerville City
Virgin
Washington City
Average by Type:
47
Focus Community Determination Based on Summary of Community SelfAssessment:
From the tabulations, one or two communities in each county were selected as “focus
communities” based upon “Community Development/Services” needs identified. The following
are those communities:
#
#
#
#
#
#
#
#
C.
Minersville
Hatch
Henrieville
Enoch City
Alton
Orderville
LaVerkin City
Enterprise City
GEOGRAPHIC DISTRIBUTION BASED ON NEED
Identified focus communities are located in each of the five counties of southwestern Utah. Of
particular concern is Garfield and Kane Counties. Both of these counties have historically had
unemployment rates in excess of the state average with Garfield County for many years
exceeding the national average. These two counties are also geographically isolated from major
transportation, commercial airports, suppliers, etc. That geographical isolation, in conjunction
with lacking in many cases sufficient infrastructure and services necessary for industrial and
manufacturing, create unique needs, particularly in Garfield and Kane Counties.
D.
SOLUTION STRATEGY
Maintaining a tradition of focusing HUD CDBG funding to community facilities, basic
infrastructure and housing projects, with community planning and limited public services appears
to be an appropriate plan of action. A major impediment to significantly addressing local needs is
the fact that Community Development Block Grant funding is very inadequate at current levels.
Coupled with increased materials and transportation costs, current funding will continue to
decrease which will limit the ability of this funding to effectively meet the ever increasing
community needs identified in our region.
The approved Rating and Ranking criteria currently utilized in the Five County region assesses
the application quality, which includes how well qualitatively the project applied for addresses
the identified need. The Regional Review Committee (Steering Committee) 2009 Rating and
Ranking methodologies appear to adequately address the types of needs identified in these focus
communities. The consideration of additional points or preferences, based on being a “focus
community,” may be reconsidered during the development of updated rating and Ranking criteria
for the 2010 program year. Housing-related projects are already weighted, addressing the priority
nature of those needs, as appropriate.
E.
PRIORITY BY LOCATION OR TYPE OF DISTRESS
The priorities established historically by the elected officials in southwestern Utah who serve as
the rating and Ranking committee have focused almost exclusively on brick and mortar type
projects and housing related activities. This appears to be quite consistent with the identified
needs of these focus communities: Housing rehabilitation, renovation, and or reconstruction as
well as basic infrastructure and community facilities, i.e. fire stations, etc.
48
Five County Association of Governments
Consolidated Plan - Annual Action Plan 2009
CHAPTER V. METHOD OF DISTRIBUTION
A.
PROGRAM BY PROGRAM SUMMARY FOR ALL HUD PROGRAMS
Funding for Housing and Urban Development (HUD) programs is prioritized by the Balance of State
Continuum of Care and allocated directly through HUD. Agencies in the Five County Region that
have received allocations directly from HUD include: The Southwest Center, Erin Kimball Memorial
Foundation, Iron County Care and Share, Cedar City Housing Authority and Color Country
Community Housing, Inc.
The Division of Housing and Community Development manages the HOME and ADDI funds which
are allocated through the Olene Walker Housing Loan . These funds are used for activities including
multi-family rental property acquisition, rehabilitation and new construction, tenant based rental
assistance, single family owner occupied rehabilitation, down payment assistance, and payment of
mortgage assistance for low-income disabled persons in partnership with area mortgage lenders. The
Olene Walker Housing Loan Fund Board also has oversight over the HOWPA housing program and
funds, which are allocated by an established subcommittee. The Division of Housing and Community
Development also manages the Emergency Shelter Grant funds through the State Community
Services Office and has an established board with separate allocation policies. Please refer to the
following web link for additional information regarding the abovementioned programs administered
through the Division of Housing and Community Development:
http://community.utah.gov/housing_and_community_development/index.html
B.
RATING AND RANKING TIED TO IDENTIFIED NEED AND ACTION PLAN
CONTENT
The elected officials who constitute the Rating and Ranking Committee of the Five County
Association of Governments have a long tradition of prioritizing projects that have essentially
established guidance for applicants. Over the previous 26 years of the CDBG program the local
elected officials of Five County Association of Governments have primarily focused on brick and
mortar projects and improving basic infrastructure. Projects which eliminate an urgent health
threat or address public safety such as fire protection have been historically been positioned high
in regional priority. Projects which meet federally mandated requirements have been given
consideration such as special projects to eliminate architectural barriers have been accomplished.
In addition, several major housing projects have been undertaken to meet the need for decent,
affordable housing for those in the lowest income categories. A regionally common concern with
adequacy in the safe distribution of meals for home bound elderly was addressed in a
collaborative way by the elected officials in southwestern Utah through the procurement of
purpose-designed Meals on Wheels delivery vehicles.
The rating and ranking criteria approved for the 2009 program year has already been approved by
the Steering Committee of the Five County Association of Governments in August of 2008. The
anticipation is that the results of the analysis of this 1 year action plan will be considered and
evaluated in making staff recommendations to the local elected officials who will approve the
rating and ranking criteria and guidelines to be adopted next August for the 2010 program year.
At that time consideration of additional points or preference based upon being a “focus
community” will be considered.
49
For the 2009 year the regional prioritization is as follows with the justification(s) for that
prioritization listed below each respective type of project.
#1
LMI Housing Activities
Projects designed to provide for the housing needs of very low and low-moderate income
families. May include the development of infrastructure for LMI housing projects, home
buyers assistance programs, or the actual construction of housing units (including
transitional, supportive, and/or homeless shelters), and housing rehabilitation. Meets a
primary objective of the program: Housing. Traditionally CDBG funds leverage very
large matching dollars from other sources.
#2
Community Facilities
Projects that traditionally have no available revenue source to fund them, or have been
turned down traditionally by other funding sources, i.e., Permanent Community Impact
Fund Board (PCIFB). May also include projects that are categorically eligible for
Community Development Block Grant (CDBG) funding, i.e., senior citizens centers,
health clinics, food banks, and/or public service activities. Does not include recreational
centers.
#3
Public Utility Infrastructure
Projects designed to increase the capacity of water and other utility systems to better
serve the customers and/or improve fire flow capacity. Other funding sources usually
available. Adjusting water rates are a usual funding source. Other agencies also fund
this category. Includes wastewater disposal projects.
#4
Public Safety Activities
Projects related to the protection of property, would include activities such as flood
control projects or fire protection improvements in a community. Typically general fund
items but most communities cannot fund without additional assistance. Grants help lower
indebted costs to jurisdiction. Fire Protection is eligible for other funding i.e., PFCIB and
can form Special Service Districts (SSD's) to generate revenue stream.
#5
Projects to remove architectural barriers
Accessibility of public facilities by disabled persons is mandated by federal law but this
is an unfunded mandate upon the local government. A liability exists for the jurisdiction
because of potential suits brought to enforce requirements. Only CDBG and sometimes
PCIFB have stepped up to fund this mandate.
#6
Parks and Recreation
Projects designed to enhance the recreational qualities of a community i.e., new picnic
facilities, playgrounds, community centers, recreational centers, etc.
Five County Association of Governments Rating & Ranking Criteria for the 2009 program year is
outlined below.
50
FIVE COUNTY ASSOCIATION OF GOVERNMENTS
FY 2009 CDBG RATING AND RANKING CRITERIA and APPLICANT’S PROJECT SCORE SHEET
The Five County Association of Governments Steering Committee (RRC) has established these criteria for the purpose of rating and ranking fairly and equitably all Community Development Block Grant Pre-Applications received for funding during FY 2009. Only projects
which are determined to be threshold eligible will be rated and ranked. Eligibility will be determined following review of the submitted CDBG application with all supporting documentation provided prior to rating and ranking. Please review the attached Data Sources
Sheet for a more detailed explanation of each criteria.
1
2
3
4
5
A
5
B
5
C
5
D
Total
Score:
Data Range/Score (circle only one for each criteria)
Capacity to Carry Out The Grant: Performance history of capacity to
administer grant. Score comes from Worksheet #1.
(First-time & <5-yr grantees: default 2.5 points)
Excellent
(9-10 score)
4 points
Very Good
(7-8 score)
3 points
Good
(5-6 score)
2 points
Grant Administration: Concerted effort made by grantee to minimize grant
administration costs.
100% Other
Funds
3 points
1 - 5%
5.1 - 10%
2 points
1 point
> 4 Jobs
3-4 Jobs
2 Jobs
1 Job
4 points
3 points
2 points
1 point
6% or greater
5%
above state
average
4%
above state
average
3%
above state
average
2%
above state
average
1% above
state avg.
Equal to
or < state
average
3.5 points
3 points
2.5 points
2 points
1.5 points
1 point
0 points
> 10%
7.1 % - 10%
4.1% - 7%
1% - 4%
< 1%
5 points
4 points
3 points
2 points
1 point
> 20%
15.1 - 20%
10.1 - 15%
5.1 - 10%
1 - 5.0%
5 points
4 points
3 points
2 points
1 point
> 40%
30.1 - 40%
20.1 - 30%
10.1 - 20%
1 - 10%
5 points
4 points
3 points
2 points
1 point
> 50%
40.1 - 50%
30.1 - 40%
20.1 - 30%
1 - 20%
5 points
4 points
3 points
2 points
1 point
Job Creation: Estimated number of new jobs completed project will create or
number of jobs retained that would be lost without this project.
Unemployment: What percentage is applicant County’s unemployment
percentage rate above State average percentage rate?
%
Financial Commitment to Community Development (Self-help Financing)
- (Jurisdiction Population <500) Percent of non-CDBG funds invested in
total project cost.
%
Financial Commitment to Community Development (Self-help Financing)
- (Jurisdiction Population 501 - 1,000) Percentage of non-CDBG funds
invested in total project cost.
%
Financial Commitment to Community Development (Self-help Financing)
- (Jurisdiction Population 1,001 - 5,000)
Percentage of Non-CDBG funds invested in total project cost.
%
Financial Commitment to Community Development (Self-help Financing)
- (Jurisdiction Population >5,000) Percentage of non-CDBG funds invested
in total project cost.
%
51
Fair
(3-4 score)
1 point
Poor
(1-2 score)
0 points
1.0
1.0
1.5
.5
2.0
2.0
2.0
2.0
Total
Score
of
X Weight
CDBG Rating and Ranking Criteria Description
Five County Association of Governments
Ranking:
Score
Requested CDBG $'s
Data
Applicant:
6
7
T*
8
9
10
11
12
13
CDBG funds Requested Per Capita: CDBG funds requested divided by
population.
$1 - 100
5 points
$101-200
4 points
$201- 400
3 points
$401 - 800
2 points
$801 or >
1 point
Jurisdiction’s Project Priority: Project priority rating in Regional
Consolidated Plan, (Capital Investment Plan - One-Year Action Plan)
High # 1
High # 2
High # 3
High # 4
High # 5
High # >5
5 points
4 points
3 points
2 points
1 point
0 points
#1
#2
#3
#4
#5
#6 or >
5 points
4 points
3 points
2 points
1 point
0 points
#1
LMI Housing
Activities
#2
Community
Facilities
#3
Public Utility
Infrastructure
#4
Public Safety
Activities
#6 or >
Parks and Recreation
5 points
4 points
3 points
2 points
#5
Remove
Architectural
Barriers
(ADA)
1 point
> 20 Units
15 - 20 Units
10 - 14 Units
5-9 Units
5 points
4 points
3 points
2 point
YES
No
2 points
0 points
Regional
Multi-county
County-wide
6 points
5 points
70% or <
5 points
71 - 80%
4 points
County’s Project Priority: Prioritization will be determined by the three (3)
appointed Steering Committee members representing the county in which the
proposed project is located. The three (3) members of the Steering Committee
include:
one County Commission Representative, one Mayor’s
Representative, and one School Board Representative. (Note: for AOG
application, determination is made by the Steering Committee Chair, in
consultation with the AOG Executive Committee.)
Regional Project Priority: Determined by the Executive Director with
consultation of the AOG Executive Committee. The Executive Committee is
comprised of one (1) County Commissioner from each of the five counties.
LMI Housing Stock: Number of units constructed, rehabilitated, or made
accessible to LMI residents.
Affordable Housing Plan Implementation: City has adopted an Affordable
Housing Plan and this project specifically demonstrates implementation of
policies in the Plan (Criteria required by the State Legislature). Towns
applying for credit under this criteria may either meet a goal in their adopted
Affordable Housing Plan or the project meets a regional affordable housing
goal in the Consolidated Plan.
Project’s Geographical Impact: Area benefitting from project.
Applicant’s County Per Capita Income (PCI): as compared to State’s PCI
to target distressed areas from 2000 Census.
%
52
3-4 Units
1 point
1.0
2.5
2.5
2.5
0 points
2 Units
0.5 points
1.0
1.0
Community
Portion of Community
4 points
Multicommunity
3 points
2 points
1 point
1.5
8 1- 90%
3 points
90 - 100%
2 points
100-110%
1 point
> 110%
0 points
1.0
Total
Score
Data Range/Score (circle only one for each criteria)
X Weight
Score
Data
CDBG Rating and Ranking Criteria Description
Five County Association of Governments
14
15
16
17
18
19
20
Jurisdiction’s Property Tax Rate: In response to higher demand for
services, many communities have already raised tax rates to fund citizen
needs. The communities that maintain an already high tax burden (as
compared to the tax ceiling set by state law) will be given higher points for this
category. Property tax rate as a percent of the maximum allowed by law (3
point default for non-taxing jurisdiction).
%
Jurisdiction’s LMI Population: Percent of residents considered 80 percent
or less LMI (based on 2000 Census Data or Survey).
%
Extent of Poverty: If an applicant satisfactorily documents the percentage of
Low Income (LI - 50%) and Very Low Income (VLI - 30%)) persons directly
benefitting from a project; or can show the percentage of Low Income/Very
Low Income of the community as a whole; additional points shall be given in
accordance with the following. Percentage of total population of jurisdiction or
project area who are low income and very low income.
%
Presumed LMI Group: Project specifically serves CDBG identified LMI
groups, i.e. elderly, disabled, homeless, etc., as stipulated in the state of Utah
Small Cities CDBG Application Policies and Procedures.
%
61% or >
51 - 60%
41 - 50%
31 - 40%
21 - 30%
< 20%
5 points
4 points
3 points
2 points
1 point
0 points
91 - 100%
5 points
81 - 90%
4 points
71 - 80%
3 points
61 - 70%
2 points
51 - 60%
1 point
20% or More
15 - 19%
10 - 14%
5 - 9%
1 - 4%
5 points
4 points
3 points
2 points
1 point
100%
80 - 99%
60 - 79%
51 - 59%
5 points
4 points
3 points
2 points
Successful Participation in Quality Growth Community Planning:
Reflects on communities pro-active for growth and needs through planning and
land use in their communities; coordination and cooperation with other
governments; development of efficient infrastructure; incorporation of housing
opportunity and affordability in community planning; and protection and
conservation plan for water, air, critical lands, important agricultural lands and
historic resources. Score comes from Worksheet #18.
Very High
High
Fair
Low
4 points
3 points
2 points
1 point
Application Quality: Application identifies problem, contains a well-defined
scope of work and is cost-effective. Score comes from Worksheet #19.
Excellent
Very Good
Good
Fair
Acceptable
Poor
6 points
5 points
4 points
3 points
2 points
1 point
Excellent
Very Good
Good
Fair
Acceptable
Poor
6 points
5 points
4 points
3 points
2 points
1 point
Project Maturity: Project demonstrates capacity to be implemented and/or
completed in the 18 month contract period and is clearly documented. Score
comes from Worksheet #20.
PLEASE NOTE: Criteria marked with a T* is a THRESHOLD eligibility requirement for the CDBG Program.
Previously Allocated Pre-Approved Funding:
$150,000 – Five County AOG (Planning and Technical Assistance Grant)
$150,000 – Cedar City on behalf of Cedar Housing Authority, year 2 of multi-year project.
$150,000 - Ivins City, year 2 of multi-year project.
53
Total
Score
Data Range/Score (circle only one for each criteria)
X Weight
Score
Data
CDBG Rating and Ranking Criteria Description
Five County Association of Governments
1.0
1.0
1.0
1.0
0.5
2.0
2.0
< = Less Than > = More Than
Set-aside Funding:
Approximately $176,000 has been set-aside specifically for brick & mortar
focused on addressing homelessness. Applicants may apply for funds
up to the total amount of available set-aside funding.
CRITERIA 1 WORKSHEET
STATE OF UTAH DIVISION OF HOUSING & COMMUNITY DEVELOPMENT - GRANTEE PERFORMANCE RATING
10
9
8
7
6
Excellent ¹
(Circle One)
Person Providing Evaluation: (Circle)
Excellent
Very Good
Good
Fair
Poor
5
=
=
=
=
=
Keith
Cheryl
Glenna
9 to 10
7 to 8
5 to 6
3 to 4
1 to 2
54
4
3
2
1
¸ Poor
_________Total
(10 possible)
CRITERIA 18 WORKSHEET
SUCCESSFUL PARTICIPATION IN QUALITY GROWTH COMMUNITY PLANNING
Criteria
Support Documentation Provided
1. Has the local jurisdiction provided information demonstrating
pro-active planning and land use in their community in
coordination and cooperation with other governments?
Yes
1 point
2. Has the applicant documented that the project is in
accordance with an adopted master plan (i.e., water facilities
master plan, etc.)
Yes
3. Has the applicant documented an non-exclusionary policy for
housing affordability and opportunity in community planning (i.e.
General Plan housing policies, development fee deferral policies,
etc.)
Yes
4. Has the applicant documented adopted plans or general plan
elements addressing conservation of water, air, critical lands,
important agricultural lands and historic resources?
Yes____ 1 point
No
Score (4 Points Total)
0 points
1 point
1 point
No
0 points
1 point
1 point
No
0 points
1 point
No
0 points
1 point
Total Points
Very High
High
Fair
Low
=
=
=
=
4 points
3 points
2 points
1 point
55
CRITERIA 19 WORKSHEET
APPLICATION QUALITY
Criteria
1. Problem Identification
Support Documentation
Other Documentation
Additional written text provided?
Yes
1 point
No
0 points
1 point
2. Is proposed solution well defined in Scope
of Work? In other words, is solution likely to
solve problem?
Yes
1 point
No
3. Does the application give a concise
description of how the project will be
completed in a timely manner?
Yes
4. Proposed project does not duplicate any
existing services or activities already available
and provided to beneficiaries in that
jurisdiction through other programs, i.e. those
locally or regionally based.
Yes____ 5 points
(Does not Duplicate)
5 points
No____ 0 points
(Duplicates Services)
0 points
Score (10 Points Total)
Detailed Architectural/Engineering Report prepared?
Yes
2 points
No
0 points
2 points
0 points
1 point
1 point
No
0 points
1 point
Total Points
Excellent
Very Good
Good
=
=
=
10 points
9 points
8 points
Fair
Acceptable
Poor
=
=
=
7 points
6 points
5 points
56
CRITERIA 20 WORKSHEET
PROJECT MATURITY
Criteria
Status
1. Architect/Engineer already selected at time of application through formal RFP
process
Yes
1 point
No
2. Has application identified dedicated and involved project manager?
Yes
1 point
No
0 points
3. Is the proposed solution to problem identified in the Scope of Work ready to
proceed immediately?
(Well Defined)
Yes
1 point
No
0 points
Score (6 Points Total)
0 points
1 point
1 point
1 point
4. Has applicant identified all funding sources?
Yes
1 point
No
0 points
1 point
5. Funding Status (Maturity)
All other project funding is applied for but not committed.
Yes
1 point
No
0 points
1 point
(or)
All other project funding is in place for immediate use.
Yes
2 points
No
0 points
2 points
(or)
Is CDBG the only funding source for the project?
Yes
2 points
No
0 points
2 points
Total Points
Excellent
Very Good
Good
=
=
=
6 points
5 points
4 points
Fair
Acceptable
Poor
=
=
=
3 points
2 points
1 point
57
FIVE COUNTY ASSOCIATION OF GOVERNMENTS
COMMUNITY DEVELOPMENT BLOCK GRANT
GENERAL POLICIES
1.
Weighted Value utilized for Rating and Ranking Criteria: The Rating and Ranking
Criteria utilized by the Five County Association of Governments contains a weighted
value for each of the criteria. Points values are assessed for each criteria and totaled.
In the right hand columns the total points received are then multiplied by a weighted
value to obtain the total score. These weighted values may change from year to year
based on the region’s determination of which criteria have higher priority.
2.
Five County AOG staff will visit each applicant on site for an evaluation/review meeting.
3.
All applications will be evaluated by the Five County Association of Governments
Community and Economic Development staff using criteria approved by the Steering
Committee.
4.
Staff will present prioritization recommendation to the RRC (Steering Committee) for
consideration and approval.
5.
Maximum amount per year $150,000.00.
6.
Maximum years for multi-year is 2 years at $150,000 per year.
7.
All applications for multi-year funding must contain a complete budget and budget
breakdown for each specific year of funding.
8.
Applications on behalf of sub-recipients (i.e., special service districts, non-profit
organizations, etc.) are encouraged. However, the applicant city or county must
understand that even if they name the sub-recipient as project manager the city/county
is still responsible for the project’s viability and program compliance. The applying entity
must be willing to maintain an active oversight of both the project and the sub-recipient’s
contract performance. An inter-local agreement between the applicant entity and the
sub-recipient must accompany the pre-application. The inter-local agreement must
detail who will be the project manager and how the sponsoring entity and sub-recipient
will coordinate work on the project. A letter from the governing board of the subrecipient requesting the sponsorship of the project must accompany the pre-application.
This letter must be signed by the board chairperson.
9.
Projects must be consistent with the District’s Consolidated Plan. The project applied for
must be included in the prioritized capital improvements list that the entity submitted for
inclusion in the Consolidated Plan. Projects sponsored on behalf of an eligible subrecipient may not necessarily be listed in the jurisdictions capital investment plan, but the
sub-recipient’s project must meet goals identified in the region’s Consolidated Plan.
10.
Previously allocated pre-approved funding:
¾¾¾ $150,000 Five County AOG (Planning and Technical Assistance Grant)
¾¾¾ $150,000 Cedar City on behalf of Cedar Housing Authority - 2nd year of multi-year
project
¾¾¾ $150,000 Ivins City - 2nd year of multi-year project
Adopted by the Five County Association of Governments Regional Review Committee (Steering
Committee) August 14, 2002, as amended August 13, 2008.
58
11.
Set-aside Funding:
¾¾¾ Approximately $176,000 has been set-aside specifically for brick and mortar
projects focused on addressing homelessness. Applicants may apply for funds
up to the total amount of available set-aside funding.
12.
Emergency projects may be considered by the Regional Review Committee (FCAOG
Steering Committee) at any time. Projects applying for emergency funding must still
meet a national objective and regional goals and policies.
Projects may be considered as an emergency application if:
¾¾¾ Funding through the normal application time frame will create an unreasonable
risk to health or property.
¾¾¾ An appropriate third party agency has documented a specific risk (or risks) that;
in their opinion; needs immediate remediation.
¾¾¾ Cost overruns from a previously funded project may be funded only if the RCC
(Steering Committee) deems it an appropriate emergency.
If an applicant wishes to consider applying for emergency funds, they should contact the
Five County Association of Governments CDBG Program Specialist as soon as possible
to discuss the state required application procedure as well as regional criteria.
Emergency funds (distributed statewide) are limited on an annual basis to $500,000.
The amount of any emergency funds distributed during the year will be subtracted from
the top of the appropriate regional allocation during the next funding cycle.
13.
Public service providers, traditionally non-profit organizations, are encouraged to apply
for CDBG funds for capital improvement and major equipment purchases. Examples are
delivery trucks, furnishings, fixtures, computer equipment, construction, remodeling, and
facility expansion. State policy prohibits use of CDBG funds for operating and
maintenance expenses. This includes paying administrative costs, salaries, etc. No
more than 15 percent of the state’s yearly allocation of funds may be expended for
public service activities.
14.
State policy has established the minimum project size at $30,000. Projects less than the
minimum size will not be considered for rating and ranking.
15.
In accordance with state policy, grantees with open grants from previous years who
have yet to spend 50 percent of their previous grant are not eligible to be rated and
ranked with the exception of housing rehabilitation projects.
16.
It is the policy of the Five County Association of Governments RRC (Steering
Committee) that CDBG funds in this region be directed to the development of brick and
mortar LMI housing projects, or utilized for necessary infrastructure for that housing.
CDBG funds in this region shall not be utilized for LMI rental assistance.
Adopted by the Five County Association of Governments Regional Review Committee (Steering
Committee) August 14, 2002, as amended August 13, 2008.
59
FIVE COUNTY ASSOCIATION OF GOVERNMENTS
HOW-TO-APPLY CDBG APPLICATION WORKSHOP
ATTENDANCE POLICY
Attendance at one workshop within the region is mandatory by all prospective applicants
or an “OFFICIAL” representative of said applicant. [State Policy]
Attendance at the workshop by a county commissioner, mayor, city council member, or
county clerk satisfies the above referenced attendance requirement of the prospective
applicant‘s jurisdiction. In addition, attendance by a city manager, town clerk, or county
administrator also satisfies this requirement.
Jurisdictions may formally designate a third party representative (i.e., other city/county
staff, consultant, engineer, or architect) to attend the workshop on their behalf. Said
designation by the jurisdiction shall be in writing. The letter of designation shall be
provided to the Five County Association no later than at the beginning of the workshop.
Attendance by prospective eligible “sub-grantees”, which may include non-profit agencies,
special service districts, housing authorities, etc. is strongly recommended so that they may
become familiar with the application procedures. If a city/town or county elects to sponsor
a sub-grantee it is the responsibility of that jurisdiction to ensure the timely and accurate
preparation of the CDBG application on behalf of the sub-grantee.
Extraordinary circumstances relating to this policy shall be presented to the Executive
Director of the Five County Association of Governments for consideration by the Regional
Review Committee (Steering Committee).
Adopted by the Five County Association of Governm ents Regional Review Com m ittee (Steering
Com m ittee) October 9, 2002.
60
Proposed 2009 Regional Prioritization Criteria and Justification
Criteria # 9: Regional Project Priority Project priority rating with regional goals and policies. Regional prioritization
is determined by the Executive Director with consultation of the AOG Executive Committee.
#1 priority
#2 priority
#3 priority
#4 priority
#5 priority
#6 priority
5 points X 2.5 (weighting)
4 points X 2.5 (weighting)
3 points X 2.5 (weighting)
2 points X 2.5 (weighting)
1 point X 2.5 (weighting)
0.0 points
=
=
=
=
=
=
12.5 points
10.0 points
7.5 points
5.0 points
2.5 points
0.0 points
Regional Prioritization
Justification
#1
LMI Housing Activities
Projects designed to provide for the housing needs of very low and lowmoderate income families. May include the development of infrastructure
for LMI housing projects, home buyers assistance programs, or the actual
construction of housing units (including transitional, supportive, and/or
homeless shelters), and housing rehabilitation. Meets a primary objective
of the program: Housing. Traditionally CDBG funds leverage very large
matching dollars from other sources.
#2
Community Facilities
Projects that traditionally have no available revenue source to fund them,
or have been turned down traditionally by other funding sources, i.e.,
Permanent Community Impact Fund Board (PCIFB). May also include
projects that are categorically eligible for Community Development Block
Grant (CDBG) funding, i.e., senior citizens centers, health clinics, food
banks, and/or public service activities. Does not include recreational
centers.
#3
Public Utility Infrastructure
Projects designed to increase the capacity of water and other utility
systems to better serve the customers and/or improve fire flow capacity.
Other funding sources usually available. Adjusting water rates are a usual
funding source. Other agencies also fund this category. Includes
wastewater disposal projects.
#4
Public Safety Activities
Projects related to the protection of property, would include activities such
as flood control projects or fire protection improvements in a community.
Typically general fund items but most communities cannot fund without
additional assistance. Grants help lower indebted costs to jurisdiction.
Fire Protection is eligible for other funding i.e., PFCIB and can form
Special Service Districts (SSD’s) to generate revenue stream.
#5
Projects to remove architectural barriers
Accessibility of public facilities by disabled persons is mandated by
federal law but this is an unfunded mandate upon the local government.
A liability exists for the jurisdiction because of potential suits brought to
enforce requirements. Only CDBG and sometimes PCIFB have stepped
up to fund this mandate.
#6
Parks and Recreation
Projects designed to enhance the recreational qualities of a
community i.e., new picnic facilities, playgrounds, community
centers, recreational centers, etc.
Note: The Executive Director consulted with the Executive Committee to discuss and receive approval of the regional prioritization, which
were ratified by the Steering Committee on August 13, 2008.
61
Five County Association of Governments
CDBG Rating and Ranking Program Year 2009
Data Sources
1.
CAPACITY TO CARRY OUT THE GRANT: The grantee must have a history of successful grant administration inn order to
receive full points in this category. First time grantees or grantees who have not applied in more than 5 years are presumed to
have the capacity to successfully carry out a project and will receive a default score of 2.5 points. To adequately evaluate grantee
performance, the RRC must consult with the state staff. State staff will rate performance on a scale of 1-10 (Ten being best).
A grantee whose performance in the past was poor must show improved administration capability through third party
administration contracts with AOG’s or other capable entities to get partial credit. Worksheet #1 used to determine score.
2.
GRANT ADMINISTRATION: Grant administration costs will be taken from the CDBG pre-application. Those making a
concerted effort to minimize grant administration costs taken from CDBG funds will be awarded extra points.
3.
JOB CREATION: Information provided by applicant prior to rating and ranking. Applicant must be able to adequately support
proposed figures for job creation or retention potential. This pertains to permanent jobs created as a result of the project, not
jobs utilized in the construction of a project. Two part-time employees = 1 full-time.
4.
UNEMPLOYMENT: "Utah Economic and Demographic Profiles" (most current issue available prior to rating and ranking),
provided by Utah Office of Planning and Budget; or "Utah Labor Market Report" (most current issue with annual averages),
provided by Department of Workforce Services.
5.
FINANCIAL COMMITMENT TO COMMUNITY DEVELOPMENT (Self-Help Financing): From figures provided by applicant
in grant application. Documentation of the source(s) and status (whether already secured or not) of any and all proposed
"matching" funds must be provided prior to the rating and ranking of the application by the RRC. Any changes made in the dollar
amount of proposed funding, after rating and ranking has taken place, shall require reevaluation of the rating received on this
criteria. A determination will then be made as to whether the project's overall ranking and funding prioritization is affected by the
score change.
Use of an applicant’s local funds and/or leveraging of other matching funds is strongly encouraged in CDBG funded projects in
the Five County Region. This allows for a greater number of projects to be accomplished in a given year. Acceptable matches
include property, materials available and specifically committed to this project, and cash. Due to federal restrictions unacceptable
matches include donated labor, use of equipment, etc. All match proposed must be quantified as cash equivalent through an
acceptable process before the match can be used. Documentation on how and by whom the match is quantified is required.
"Secured" means that a letter or applications of intent exist to show that other funding sources have been requested as match
to the proposed project. If leveraged funds are not received then the points given for that match will be deducted and the project's
rating reevaluated.
A jurisdiction’s population (most current estimate provided by Utah Office of Planning and Budget) will determine whether they
are Category A, B, C or D for the purposes of this criteria.
62
6.
CDBG DOLLARS REQUESTED PER CAPITA: Determined by dividing the dollar amount requested in the CDBG application
by the population of the jurisdiction, using most current population estimate provided by Utah Office of Planning and Budget.
7.
LOCAL JURISDICTIONS COMMUNITY DEVELOPMENT OBJECTIVES: THRESHOLD CRITERIA: Every applicant is
required to document that the project for which they are applying is consistent with that community’s and the Five County District
Consolidated Plan. The project, or project type, must be a high priority in the investment component (Capital Investment Plan
(CIP) One-Year Action Plan). The applicant must include evidence that the community was and continues to be a willing partner
in the development of the regional (five-county) consolidated planning process. (See CDBG Application Guide.)
8.
COUNTY'S COMMUNITY DEVELOPMENT GOALS AND POLICIES: Prioritization will be determined by the three (3) appointed
Steering Committee members representing the county in which the proposed project is located. The three (3) members of the
Steering Committee include: one County Commission Representative, one Mayor’s Representative, and one School Board
Representative. (Note: for AOG application, determination is made by the Steering Committee Chair, in consultation with the
AOG Executive Committee.)
9.
REGIONAL COMMUNITY DEVELOPMENT GOALS AND POLICIES: Determined by the Executive Director with consultation
of the AOG Executive Committee. The Executive Committee is comprised of one County Commissioner from each of the five
counties.
10.
IMPROVEMENTS TO, OR EXPANSION OF, LMI HOUSING STOCK, OR PROVIDING AFFORDABLE HOUSING
ACCESSIBILITY TO LMI RESIDENTS:
Information provided by the applicant. Applicant must be able to adequately explain
reasoning which supports proposed figures, for the number of LMI housing units to be constructed or substantially rehabilitated
with the assistance off this grant. Or the number of units this grant will make accessible to LMI residents through loan closing
or down payment assistance.
11.
AFFORDABLE HOUSING PLAN IMPLEMENTATION: In January, 1999, the Community and Economic Development State
Legislative Committee passed a resolution requiring the Community Impact Fund and the Community Development Block Grant
Program to implement rating and ranking criteria that would award jurisdictions that had complied with HB 295 law and had
adopted their Affordable Housing Plans when they applied for funding from these two programs. The CDBG State Policy Board
adopted the following rating and ranking criteria to be used by each regional rating and ranking system: “Applications received
from communities and counties who have complied with HB 295 by the preparation and adoption of a plan, and who are applying
for a project that is intended to address some element of that plan will be given additional points.” Projects which actually
demonstrate implementation of a jurisdiction’s Affordable Housing Plan policies will be given points. Applicants must provide
sufficient documentation to justify their project does, in fact, comply with this criteria. Towns applying for credit under this criteria
may either meet a goal in their adopted Affordable Housing Plan or the project meets a regional affordable housing goal in the
Consolidated Plan.
12.
GEOGRAPHIC EXTENT OF PROJECT'S IMPACT: The actual area to be benefitted by the project applied for.
63
13.
PER CAPITA INCOME OF APPLICANT’S COUNTY RELATIVE TO STATE PER CAPITA INCOME: Utah Department of
Workforce Services; or more current source available prior to rating and ranking.
14.
PROPERTY TAX RATE FOR JURISDICTION: Base tax rate for community or county, as applicable, will be taken from the
"Statistical Review of Government in Utah", or most current source using the most current edition available prior to rating and
ranking. Basis for determining percent are the maximum tax rates allowed in the Utah Code: .70% for municipalities, and .32%
for counties.
15.
PERCENTAGE OF APPLICANT'S JURISDICTION WHO ARE LOW TO MODERATE INCOME: Figures from the most current
available census data provided by the State Department of Community and Economic Development. If a community or county
is not on the DCED provided "HUD Pre-approved List", the figures will be provided from the results of a DCED approved income
survey conducted by the applicant of the project benefit area households.
16.
EXTENT OF POVERTY: Based on information provided by applicant prior to rating and ranking that satisfactorily documents
the percentage of Low Income (LI - 50%) and Very Low Income (VLI - 30%) persons directly benefitting from a project.
17.
PRESUMED LMI GROUP: Applicant will provide information as to what percent of the proposed project will assist a presumed
LMI group as defined in the current program year CDBG Application Guide handbook.
18.
SUCCESSFUL PARTICIPATION IN QUALITY GROWTH COMMUNITY PLANNING: The State of Utah emphasizes the
importance of incorporating quality growth principles in the planning and operation of city government. Communities that
demonstrate their desire to improve through planning will receive additional points in the rating and ranking process.
In the rating and ranking of CDBG applications, the region will recognize an applicant’s accomplishments consistent with these
principles by adding additional points when evaluating the following:
** Demonstration of local responsibility for planning and land-use in their communities in coordination and cooperation w ith other
governments
** Development of efficient infrastructure including w ater and energy conservation
** Incorporation of housing opportunity and affordability into community planning
** Protection and conservation plan for w ater, air, critical lands, important agricultural lands and historic resources
Worksheet #18 will be used in the rating and ranking process for applicants who have taken the opportunity to provide additional
information and documentation in order to receive these additional points.
19.
Application Quality: Quality of the Pre-Application in terms of project identification, justification, and well-defined scope of work
likely to address identified problems.
64
20.
Project Maturity: Funding should be prioritized to those projects which are the most "mature". For the purposes of this process,
maturity is defined as those situations where: 1) the applicant has assigned a project manager; 2) has selected an engineer
and/or architect through a formal process in accordance with applicable laws and regulations; 3) knows who will administer the
grant; 4) proposed solution to problem is identified in the Scope of Work and ready to proceed immediately; and 5) identifies
all funding sources and funding maturity status. Projects that are determined to not be sufficiently mature so as to be ready to
proceed in a timely manner, may not be rated and ranked.
65
Five County Association of Governments
Consolidated Plan - Annual Action Plan 2008
CHAPTER VI. ANNUAL PERFORMANCE MEASURES
Table 6-1
Combined CD and ED Strategic Plan and Annual Report
Annual Action Plan (AAP) Planned Projects Results
and Performance Measures for CDBG in 2009
Program: CDBG - Community Facilities
Objective: Suitable Living Environment
Outcome: Sustainability and/or Availability
Outcome Statement: Provide public facilities and/or infrastructure, primarily benefitting low-income
citizens, to enhance health and safety, improve livability and sustainability in the communities through
improving the availability of facilities and services.
5 year goal
2005-2009
2008
Actual
Output
2009
Expected
Output
Number of persons benefitting
38,813
4,536
7,284
Number of LMI persons benefitting
19,044
2,402
4,430
Output Indicators: Based on number of people benefitting
from public facilities assisted with CDBG dollars
Program: CDBG - Housing
Objective: Decent and Affordable Housing
Outcome: Sustainability
Outcome Statement: Provide opportunities for low income persons for decent, safe and affordable
housing to ensure availability for LMI households; promote livability through the development of new
quality housing units and/or rehabilitation of existing units to promote quality living environments for
residents; and enhance health and safety through construction/rehabilitation of housing units built to
current code which address health and safety concerns. Ensure availability and sustainability for LMI
households by offering housing counseling and down payment assistance.
5 year goal
2005-2009
2008
Actual
Output
2009
Expected
Output
Number of households benefitting
424
5
24
Number of LMI households benefitting
379
5
24
Output Indicators: Based on number of households
benefitting CDBG funds
66
Program: CDBG - Water
Objective: Suitable Living Environment
Outcome: Sustainability
Outcome Statement: Provide safe and clean water, primarily to low income persons, to improve the
availability and sustainability of the community by expanding the culinary water storage and
distribution network.
5 year goal
2005-2009
2008
Actual
Output
2009
Expected
Output
Number of persons benefitting
915
136
-0-
Number of LMI persons benefitting
575
79
-0-
Output Indicators: Based on number of people benefitting
from water projects assisted with CDBG dollars
Program: CDBG - Economic Development
(Five County AOG Revolving Loan Fund)
Objective: Economic Opportunity
Outcome: Sustainability
Outcome Statement: Provide economic development opportunity primarily to low to moderate
income individuals and businesses by retaining existing jobs and/or creating additional employment.
Output Indicators: Based on number of people receiving
assistance or new jobs created and/or retained
Number of persons benefitting
Number of LMI persons benefitting
67
5 year goal
2005-2009
2008
Actual
Output
2009
Expected
Output
20-30 loans
in 5 years
(Average of 5
jobs per loan,
with 3 LMI
jobs per loan)
22
22 jobs
51% of jobs
created/
retained
for LMI
persons
13
13 LMI
Program: CDBG - Housing (Program Delivery)
Objective: Provide Decent and Affordable Housing
Outcome: Sustainability
Outcome Statement: Provide decent, safe and affordable housing opportunities for low-income
persons by providing down payment/closing cost assistance, rehabilitation of existing housing units,
and enhance health and safety through rehabilitation addressing health code and safety concerns.
Output Indicators: Based on number of households
benefitting from CDBG funds
Number of households benefitting
5 year goal
2005-2009
2008
Actual
Output
2009
Expected
Output
655
114
130-150
655
114
130-150
(Direct Program Services)
Number of LMI households benefitting
(Direct Program Services)
Program: HOME Rehabilitation/ADDI
Objective: Provide Decent Housing for Homeowners (State Priority 4 & 7)
Outcome: Sustainability
Outcome Statement: Create Decent Housing with Improved/New Availability and Sustainability.
Preservation and improvement of existing single-family affordable housing through rehabilitation and
replacement and/or new construction when necessary, including emergency home repair to address
health code and safety concerns. Also includes lead based paint removal as applicable.
5 year goal
2005-2009
2008
Actual
Output
2009
Expected
Output
Number of units rehabilitated/replaced
Number of LMI households becoming 1st time homeowners
75
75
14
11
10
5
Number of low-income homeowners (individuals) assisted
Number of low-income homeowners (individuals) assisted
180
225
26
48
20
15
Number of low-income households assisted
75
14
20
Number of units brought to Energy Star Standards
12
1
1
Output Indicators: Number of homes rehabilitated, replaced
or newly constructed (self-help) which are owned and
occupied by low-income homeowners.
68
Five County Association of Governments
Consolidated Plan - Annual Action Plan 2009
CHAPTER VII. PUBLIC INVOLVEMENT
A.
CONSULTATION
The following organizations and groups participated in the development of the 2009 Action Plan
in conjunction with the Five County Association of Government Regional Consolidated Plan:
1.
Southwest Utah Continuum of Care Committee (now part of the Housing First
Committee)
The Continuum of Care is a voluntary organization that includes many jurisdictions in the
region and non-profit organizations that represent and provide services to homeless
individuals and others with special needs. Five County Association of Governments
consulted with representatives from the Red Rock Center for Independence, Erin Kimball
Foundation, New Frontiers for Families, area housing authorities, Iron County Care and
Share, Beaver/Milford Care & Share, Hurricane Valley Food Network, Garfield County
Care & Share, Kanab Care and Share, Dixie Care are Share, the Dove Center, Canyon
Creek Women’s Crisis Center, Washington County Youth Crisis Center, Iron County
Youth Services Center, Department of Workforce Services Western Regional Council,
and Salvation Army Soup Kitchen - St. George in regard to homeless services
coordination. The above referenced organizations assisted in the development of this one
year action plan by providing statistical and service related data, program information
summaries and technical support on issues affecting the southwest regions homeless
population in support of and in coordination with ongoing regional planning efforts.
2.
Other Groups
Information and data from other non-profit organizations and groups which provide
services to low-income clientele were utilized in development of this Action Plan. These
include: Area Agency on Aging Services who provided information on the needs and
programs of the senior populations; Southwest Utah Mental Health Authority; Erin
Kimball Foundation; Cedar City Housing Authority; Beaver City Housing Authority;
Paiute Indian Tribe Housing Authority; St. George Housing Authority; Color Country
Community Housing, Inc., who gave technical support and data on developing affordable
housing; the Human Services Council, including coordination with local Emergency
Food and Shelter Board program efforts provided in the Five County Region; Youth
Corrections; Division of Child and Family Services; Elderly Care Facilities and
Providers; and the City of St. George Community Development Staff in regard to
entitlement funding received from the Community Development Block Grant program.
3.
Steering Committee
The Steering Committee has the responsibility for setting policy and directing the efforts
of the Association. The Steering Committee consists of one commissioner from each of
the five county commissions, a mayor representing the incorporated communities in each
county, and a representative of each of the five school districts within the region. In
addition, representatives from Southern Utah University and Dixie State College, as well
as State Legislators serve as ex-officio members. The Steering Committee meets
69
monthly on a rotating basis at various locations in each county. A presentation was made
to members outlining consolidated plan requirements, focus for the 2009 plan update,
rating and ranking criteria input and approval, as well as requesting input on the
community development element of the plan. This committee is responsible to formally
approve and adopt the Consolidated Plan.
4.
Jurisdictions
Information packets were provided to jurisdictions requesting updated information for the
needs assessment updates and capital investment lists. These jurisdictions included
communities (mayors, clerks), counties (commissioners, clerks, administrators), special
service districts, housing authorities, school districts, and economic development
professionals. Packets contained the previous year’s information contained in the
Community Development section, which the jurisdictions were asked to update. In
addition, many of the jurisdictions were contacted directly by AOG staff to assist in
completing required information. During calendar year 2008, Community and Economic
Development staff traveled to the following jurisdictions to meet with local elected
officials and staff to discuss community development needs of the jurisdiction and
development of their updated capital improvements lists:
Garfield County: Cannonville Town, Hatch Town and Escalante City;
Iron County: Enoch City and Cedar City;
Kane County: Alton Town, Big Water Municipal Corporation and Orderville Town;
Washington County: Enterprise City and LaVerkin City.
5.
Association of Governments Newsletter
The newsletter is published on a quarterly basis and distributed to a large mailing list
including jurisdictions, agencies, and special interest groups throughout the five county
area. The newsletter highlights activities of the Association, including activities
associated with the Consolidated Plan, Human Services Public Forums, and CDBG
program and is also posted on the AOG website. The newsletter is provided to various
state and federal agencies as a means of coordination. An article will be provided in the
4th Quarter newsletter in regard to the Consolidated Plan update and 30-day comment
period. Please reference Appendix F which includes a copy of the AOG Newsletter and
Public Hearing notice. To access the current Five County AOG newsletter as well as an
archive of all previous editions, please follow this link:
http://www.fcaog.state.ut.us/info/newsletter/index.php
B.
COORDINATION
1.
Business Community
The Consolidated Plan process incorporates a wide variety of existing public involvement
processes across southwest Utah. Many involve private sector business owners.
Examples of such involvement during the preparation of the 2009 Annual Action plan
include:
70
# Addition of a livestock operator (Henrie’s Herefords) and tourism and hospitality
facility manager (Ruby’s Inn) to the Comprehensive Economic Development
Strategy Committee pursuant to US Department of Commerce, Economic
Development Administration guidelines. These representatives assisted in the
development of regional economic development priorities.
# Private sector representation on numerous advisory committees:
Wells Fargo Bank, Village Bank, Lang & Company, Cedar Builders Supply
(Revolving Loan Fund Board - Assist in the approval and servicing of loans to
businesses that commit to the creation of jobs for low or moderate income
individuals)
# Applegate Home Health, Emerald Point Assisted Living, Southern Utah Home
Care, Zions Way Hospice, Home Instead Prime Senior Services (Caregiver
Advisory Council - Assist in the delivery of in-home case management services
to Medicaid-eligible clients)
# Learning Ladder, Gentle Jungle
(Child Care Resource & Referral Advisory Board - Assist in training qualified
child care providers and connecting families with quality child care providers)
# Savage, Esplin& Radmall CPAs, PayPal
(Senior Corps Advisory Councils - Assist in the delivery of Senior Corps
volunteer programs across the region)
#
# Pro Bono legal services to DAWHAC from the Southern Utah Bar Association
# Presentations to the St. George Area Chamber of Commerce and Southern Utah
Homebuilders Association regarding the Association of Governments, including the
consolidated planning process.
2.
Other Agencies
A primary purpose of the Association of Governments is to coordinate federal, state and
local programs across southwest Utah. Much of this coordination involves aspects of the
consolidated planning process. Efforts made during the preparation of the 2009 Annual
Action Plan include:
# Monthly reports from congressional staff as a standing agenda item at Steering
Committee meetings. These reports keep local officials informed of on-going
congressional actions, including housing and urban development initiatives.
# Reports from Utah State University Extension Services as a standing agenda item at
Steering Committee meetings Extension Services engaged in a new initiative to
expand economic development outreach services across the state.
# Reports from Southern Utah University Regional Services as a standing agenda item
at Steering Committee meetings. Regional Services has initiated a new effort to
sponsor a Business Resource Center that will serve all of southwest Utah.
# Representation as an ex-officio member of the Kanab Center for Eduction, Business
and the Arts (CEBA) Board of Directors.
# Ex-officio membership on the Color Country Resource, Conservation and
71
Development (RC&D) Council. The RC&D Council provides natural resource-based
technical assistance to local governments and other entities, as well as sponsoring
small seed grants for community projects.
# Representation as a member of the Southern Utah Planning Authorities Council
(SUPAC). SUPAC is chartered to provide a forum where state cabinet-level agency
heads or their representatives interact with federal land management agency directors
and local officials to coordinate land management activities.
# Representation as a member of the Canyon Region Economic Development Alliance
(CREDA). CREDA is a local initiative to expand economic development
collaboration across the Utah-Arizona state line into the Arizona Strip.
# Participation with the Governor’s Rural Partnership Board. The Board is the major
rural policy-making entity that works with the Governor and Legislature to champion
rural issues.
# Participation on the Utah Small Cities, Inc. Board. Utah Small Cities, Inc. provides
a forum where economic development professionals and elected officials track
legislation and develop coordinated rural policies.
# Membership in the Utah Economic Development Alliance. The Alliance allows
economic development professionals to meet regularly to discuss training
opportunities and coordinate stances of local professionals.
# Representation on the Utah Small Cities CDBG Policy Committee. The committee
develops policy for the implementation of the small cities CDBG program.
# Participation with the southwestern Utah Interagency Council. This council meets
regularly to coordinate program outreach to low income clientele across the region.
# Participation with the Forest Restoration Partnership Group. This group of federal,
state and local land managers and officials is working to establish a coordinated
approach to restoring the health of landscapes across jurisdictional boundaries.
# Membership on the Rural Life Foundation Board. The Rural Life Foundation is a
non-profit entity intended to foster land stewardship activities that improve the
landscape and offer new opportunities for business creation.
# Chapter 5 of the Consolidated Plan is the EDA- mandated Comprehensive Economic
Development Strategy. EDA has accepted the concept of combining the two efforts
into a truly consolidated planning approach.
3.
General Public Involvement
Public Forums
The largest and most comprehensive public involvement tool used in the region is the
annual Public Forums. These forums are conducted in the spring of each year. A session
is conducted in each of the five counties. Staff from both human services and community
and economic development conduct the sessions designed to elicit the most pressing
needs of local officials and residents. Information was presented and input solicited for
the Consolidated Plan update in community development efforts. Extensive efforts are
72
employed to bring out not only agency staff, but also clientele of social service agencies
and programs and residents with no particular connection beyond their interest in local
programming.
Over 225 persons attended the Spring 2008 Public Forum meetings. The meetings were
conducted by a member of the Five County Human Services Council. An estimated 30%
of the general public attending were Community Services Block Grant (CSBG) program
consumers. At least twenty-five state and community based agencies from across the
region were represented. There was strong support given by public officials including
Mayors, County Commissioners, and local School Board representatives. A State
Legislator attended the St. George meeting. Local staff representatives from our U. S.
Congressional delegates were also in attendance.
Topics of concern discussed at the forums include approximately 40 categories. New
topics not brought out in previous forums included:
# Beaver County-- No evening/weekend child care, affordable rental units, housing
support to purchase homes, adequate housing conditions, need for more medical
care....affordable prescriptions, Horizon House has unmet needs, substance abuse
assistance, meth abuse (including mothers), adult literacy and ESL, need public
transportation resources, get additional qualified senior drivers for bus, need
volunteers (including CASA), youth programs/community center, need adult day care
for elderly, encourage more seniors to participate in available services, information
and referral, and energy (utility) resource development.
# Garfield County-- Clean yards & communities, housing that is affordable, need
more rental units, hold national fishing contests & make more trails for hiking, more
economic development, rebuild Escalante Clinic, better technology at pantry sites,
develop Care and Share in Ticaboo, substance abuse assistance, public education,
literacy program, support for persons with disabilities & handicap accessibility, need
more volunteers, senior drive/walk way snow removal, need recreation for youth,
new senior citizens center (Panguitch), swimming pool improvements in Panguitch,
additional public forum (Escalante), train and use emergency senior meals, Utah
Food Bank transport of food to Ticaboo area, and power line to Ticaboo.
# Iron County-- Child care resources, affordable single apartments, improved rental
properties, transitional housing, Head Start public awareness, employment (seniors
too), day labor jobs without discrimination, crisis intervention training, affordable
health insurance for seniors, teen drug & alcohol prevention, more Oasis House case
managers, public transportation between Enoch/Parowan & Cedar, provide bus
passes, disability access to businesses, snow day meal plans for seniors, funds & staff
for Volunteer Center, recreational facilities for children, facility improvements for
senior citizens center, 911 cell phone bank, tuition assistance and scholarships,
housing in Place (Plan 9) awareness, disaster planning, and home fuel (utility)
alternatives.
# Kane County-- Better financial management, Depression Era pride is barrier to
receiving assistance, jobs that pay living wage, comprehensive health care, need
information about resources, Mother’s Day weekend is information fair, need public
transportation, need funding to support transportation for disabled persons, better
road access through Zion National Park, need more volunteers, youth recreation,
summer parks and recreation programs, and more promotion of Utah Saves.
73
# Washington County-- Budget management issues, housing that is affordable,
housing for elderly/disabled, transitional housing, emergency response procedures for
persons who are deaf, Human Service Program funding, health care for uninsured,
HIV awareness & testing, increased emergency food, more drug treatment and
prevention, more public transportation, more services for persons who are disabled,
more self advocacy, volunteer project data base, and youth programs.
Several projects resulted from issues raised during the public forums including:
# Beaver County - Increased senior transportation, medical care resources, adult
literacy and English as a second language (ELS).
# Garfield County - Community project to rebuild the Escalante Center received
support, updating technology in care & shares and support for new Panguitch Senior
Citizens Center.
# Iron County - Emphasis on dental health care is still being followed up through the
Rural Community Health Center at Southern Utah University, volunteer center
resources, disaster planning, and increasing information.
# Kane County - Increased funding to transport persons with disabilities, promoting
Utah Saves, and increasing information.
# Washington County - Affordable housing issues in Washington County are a major
focus. Work is continuing with the Dixie Area Workforce Housing Advisory
Committee in an attempt to address housing for school teachers, health care workers,
public safety workers, etc. The Workforce Housing Ombudsman, Darren Janes, is
actively working with jurisdictions to present workforce housing information and to
encourage ordinance revisions to accommodate additional workforce housing.
Assistance has also been provided for acquiring health care for uninsured, increased
emergency food, services for persons who are disabled, and budget management
issues.
The top ten community needs were prioritized by the Human Services Council as
follows:
Priority # 1: Education
Priority # 2: Economic/Industrial Development
Priority # 3: Jobs/Employment - Wages
Priority # 4: Affordable Housing
Priority # 5: Energy Development
Priority # 6: Health
Priority # 7: Aging
Priority # 8: Public Safety/Law Enforcement
Priority # 9: Youth/Family Recreation
Priority #10: Enforce Existing Immigration Laws/Services
74
Public Availability of Plan and 30-day Comment Period
A 30-day comment period soliciting public input of the draft document will commence
December 15, 2008 and extended through January 15, 2009. The Plan is available for
public review during the 30-day comment period at the Five County Association of
Governments offices: 1070 West 1600 South, Building B., St. George, UT and 88 East
Fiddlers Canyon Drive, Cedar City. The public is encouraged to review the Plan at one
of the AOG offices listed above or to access the document on the AOG website
(http://www.fcaog.state.ut.us).
A public notice advertising availability of the Plan for public comment is scheduled for
publication in The Spectrum newspaper on Sunday, December 14, 2008. In addition, an
article was included in the Five County AOG newsletter soliciting comment on the draft
document. The updated document, including the 2009 Action Plan, will be presented to
the Steering Committee on January 21, 2009 for adoption.
75


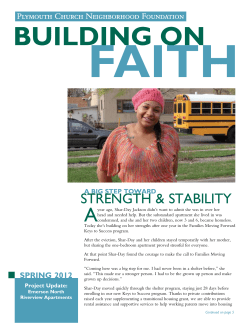
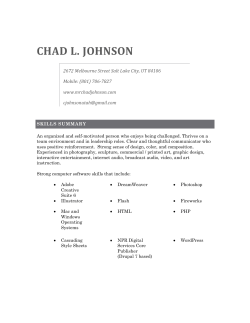


© Copyright 2026