
DRAFT ISSUED FOR REVIEW
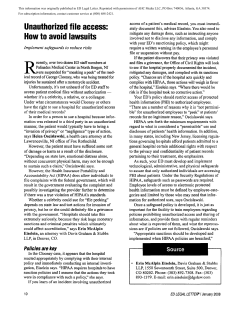
Revised 90% Design Submittal
DRAFT
ISSUED FOR REVIEW
Tennessee Valley Authority
Kingston Fossil Plant
Harriman, Roane County, Tennessee
Document Control Number
Calculation Package
March 18, 2011
Perimeter Containment
North Dredge Cell (Dike C) Segment 1
Sta. A161+50 to A179+50
RDP-0113-E
FPGKIFFESCDX00030020100006
Exhibit 15
Limit Equilibrium Stability Analyses
Purpose:
•
Evaluate the stability of the closed dredge cell outslopes for static and postseismic (post-liquefaction) load conditions.
Methods:
•
•
Conventional, two-dimensional, limit-equilibrium slope stability analyses.
Use Slope/W software, from GEO-SLOPE International, Ltd., of Calgary,
Alberta, Canada (www.geo-slope.com).
Results:
•
•
Four cross sections were analyzed; graphical results for the various load
conditions are included.
The design cross section was found to meet the design criteria for factors of
safety.
Calculation Performed by: Stantec Consulting Services, Inc.
Prepared by: YW 10-Nov-10
Revisions: 28-Jan-11
Reviewed by: AFR 16-Nov-10
Limit Equilibrium Slope Stability Analyses
1.
Design Criteria for Stability
The design criteria for the Kingston dredge cell closure are detailed in Exhibit 2. For this
design package, three criteria for slope stability apply:
•
For long-term conditions following construction, the factor of safety for slope stability
shall be no less than 1.5.
•
The post-earthquake factor of safety for slope stability shall be greater than 1.0.
•
Following the design seismic event, ash from the closed facility shall not displace
beyond the permitted boundary of the facility.
The deformation criteria probably cannot be met if the perimeter cross section exhibits a
factor of safety for slope stability (FS) close to 1.0 in the post-earthquake conditions (with
expected liquefaction in the ash and foundation sands). Hence, a minimum factor of safety of
1.1 was targeted for the post-earthquake stability analyses reported here. This decision does
not alter the design criteria for the project; the seismic performance will be judged on the
basis of predicted deformations. Slope deformations during the design earthquake were
modeled using dynamic FLAC simulations (Exhibit 23).
The perimeter design was thus advanced with a geometry having FS ≥ 1.5 for the long-term,
static condition, and FS ≥ 1.1 for the post-earthquake (liquefied) condition.
2.
Slope Stability Analyses
2.1.
Limit Equilibrium Methods in SLOPE/W
Limit equilibrium, slope stability analyses were carried out using the computer program
SLOPE/W, part of the GeoStudio 2007 suite (Version 7.14) available from Geo-Slope
International Ltd. (Calgary, Alberta, www.geo-slope.com). The stability of four cross sections
within the North Dredge Cell Perimeter Segment was evaluated for static and postearthquake conditions. The results were used to select design dimensions, verify
conformance with the design criteria, and identify the critical cross section for modeling in the
FLAC analyses.
Limit equilibrium methods for slope stability consider the static equilibrium of a soil mass
above a potential failure surface. In conventional, two-dimensional methods of analysis, the
slide mass above an assumed slip surface is split into vertical slices (the default slice number
in SLOPE/W is 30) and stresses are evaluated along the sides and base of each slice. The
factor of safety against a slope failure (FS) is defined as the ratio of soil shear strength over
equilibrium shear stress:
FS =
Shear Strength of Soil
Shear Stress required for Equilibrium
1
where the strength and stresses are computed along a defined slip surface, on the base of
each vertical slices. The shearing resistance at locations along the potential slip surface is
computed based on appropriate soil strength parameters as a function of the total or effective
normal stress.
A number of limit equilibrium methods have been implemented in SLOPE/W. Different
assumptions for the inter-slice forces are employed in these methods. Some methods only
satisfy one equilibrium equation (moment equilibrium or force equilibrium), while some
methods satisfy both. Spencer’s method was used in the analyses presented here. This
method is considered mathematically rigorous, because its formulation includes all inter-slice
forces and satisfies all equations of equilibrium.
A slope stability analysis must include a search for the most critical slip surface,
corresponding to the lowest FS. First, circular potential failure surfaces were generated using
the “Entry and Exit” method, where a wide variation of trial slip surfaces can be assessed
with defined ranges of possible entries and exits. After the most critical circular failure
surface was obtained, the optimization scheme available in SLOPE/W was used to alter
portions of the failure surface and check for a potentially lower factor of safety.
2.2.
Cross Sections
Stability analyses were carried out for four representative cross sections within the North
Dredge Cell Segment. The cross sections were selected to represent the range of
subsurface conditions and ground surface geometries expected within this design segment.
The analyzed cross sections are spaced 400 to 600 feet apart, and are located at Stations
A162+00, A168+00, A172+00, and A178+00.
2.3.
Failure Modes
Numerous parametric stability analyses completed during the conceptual design phase
demonstrated that the dredge cell perimeter is vulnerable to two distinct failure modes:
•
Deep failure, which involves a slip surface that cuts through the stabilized foundation
near the top of bedrock.
•
Shallow failure, which tends to occur on a slip surface in the outslope of the landfilled
ash embankment, behind the perimeter berm.
The shallow failure mechanism usually has a lower FS under both the long-term, static
condition and the post-earthquake condition. The established project stability criteria must be
met for both mechanisms.
2.4.
Material Properties
Materials in the analyzed cross sections include landfilled ash, hydraulically placed ash, lean
clay foundation soil, sandy silt to silty sand, earthen berm, coarse stone, shot rock, shale
bedrock, stabilized ash, stabilized lean clay, and stabilized silt/sand. For the post-earthquake
conditions, liquefaction is predicted in the landfilled ash within a zone of about eight feet
above the phreatic surface (Exhibit 12), the hydraulically placed ash, and the sandy silt to
silty sand (Exhibit 11).
Material properties used in the stability analyses are summarized in Table 1. Details on these
design properties are discussed in Exhibits 3 and 13. Composite strength parameters for the
2
stabilized ash, stabilized lean clay, and stabilized silt/sand were computed based on the
required mean soil-cement strength (f’sc = 200 psi) and area replacement ratio (0.26), using
the weighted average approach (Exhibit 14).
Table 1 – Material Parameters used in Stability Analyses
Post-Earthquake,
Undrained Strengths
Static Drained
Strengths
Unit Weights
Material Name
γm (pcf)
γsat (pcf)
φ’ (deg.)
c' (psf)
φ (deg.)
c (psf)
c/p
Unliquefied
Landfilled Ash
109
111
30
0
30
0
--
Liquefied
Landfilled Ash
--
111
30
0
--
--
0.06
100
107
25
0
--
--
0.06
Lean Clay
Foundation Soil
--
130
32
0
20
0
--
Sandy Silt to Silty
Sand
--
128
30
0
--
--
0.06
Earthen Berm
125
128
28
0
0
1,500
--
Coarse Stone
115
128
38
0
32
0
--
Shot Rock
115
128
38
0
38
0
--
--
140
20
3,000
20
3,000
--
Stabilized Ash*
100
107
19
2,995
2.5
2,995
--
Stabilized Lean
Clay*
--
130
25
2,995
15.1
2,995
--
Stabilized
Silt/Sand*
--
128
23
2,995
2.5
2,995
--
Hydraulically
Placed Ash
Shale
* Computed for ARR = 0.26 and f’sc = 200 psi
2.5.
Groundwater Pressures
Long-term groundwater levels were predicted with the three-dimensional groundwater model
discussed in Exhibit 5. For the long-term stability calculations, pore water pressures were
computed directly using the depth below this predicted phreatic surface on each cross
section. In the post-earthquake stability analyses, the long-term pore pressures were used to
compute consolidation pressures, consistent with the parameters for the shearing resistance
of each soil layer.
2.6.
Area Replacement Ratio and Soil-Cement Strength
During the conceptual phase of the design for the project, preliminary stability analyses were
used to estimate what soil-cement strength and area replacement ratio would be needed to
3
achieve perimeter stability. The conceptual-level analyses indicated that stability could be
achieved with a stabilized width of about 150 feet, an area replacement ratio of about 0.25,
and an unconfined strength of f’sc = 150 psi in the soil-cement. These preliminary parameters
were further refined in the design process.
Structural analyses of the three-dimensional soil-cement walls were accomplished in
FLAC3D (Exhibit 21). To meet the stability criteria without overstressing the soil-cement
elements, those calculations indicated the need for a mean, unconfined compressive
strength in the soil-cement of 200 psi, with an area replacement ratio of 0.26. These values
were adopted for the design and included in the slope stability analyses presented here.
3.
Stability under Seismic Conditions
3.1.
Capillary Break Layer in the Ash Landfill
Based on the analyses in Exhibit 12, about eight feet of saturated to nearly saturated ash
landfill above the water table in the closed dredge cell should be expected to liquefy in the
design earthquake. If these conditions develop too near the ground surface, the landfill
outslopes would be seismically unstable with respect to the shallow failure mode.
Hence, to meet the stability criteria, a zone of unsaturated, unliquefiable ash must be
maintained around the dredge cell perimeter. A capillary break (layer of coarse aggregate)
will be constructed within the ash landfill, to impede the accumulation of water from capillary
rise above the water table. The landfilled ash above the capillary break can then be assumed
to remain unsaturated and not subject to liquefaction.
Parametric calculations were carried out in SLOPE/W to determine the minimum lateral
extents of the capillary break that are needed to maintain a stable slope (target minimum
post-earthquake FS = 1.1 for the shallow failure mode). The results indicated that the
capillary break can be built on a slope fairly close to the perimeter berm, and does not need
to extend across the footprint of the ash landfill. This means the capillary break can be built
within the ash infill zone, in the area between the perimeter berm and ash stacking within the
dredge cell.
Design details for the capillary break layer (material specifications, thickness, slope, location,
etc.) will be developed later, as part of the final cover design package. For the present design
of the stabilized perimeter, the capillary break is assumed to start at the top of the inboard
soil cement wall, and rise on a gentle slope to an elevation eight feet above the phreatic
surface. The capillary break layer can be built on the sloping face of the stacked ash within
the dredge cell, so a 6H:1V slope was assumed.
3.2.
Seismic Performance of the Outer Rock Berm
The North Dredge Cell Segment of the perimeter includes a 2H:1V rock berm against the
outboard wall of the stabilized foundation at cross sections A162+00, A168+00, and
A172+00. As shown on the drawings, the surface of the existing ash will be excavated down
to the summer pool level in Watts Bar Lake (EL. 741), and then at a 2H:1V slope down to the
top of the lean clay soil. The rock berm will extend from an elevation four feet above the top
of the deep mixed wall out to the top of the lean clay in the embayment.
Substantial deformations are anticipated in the rock berm during and after the design
earthquake, due to liquefaction of the underlying alluvial sands. Note that the outer rock berm
4
will need to be re-built following the earthquake, to provide long-term protection of the
exposed outboard deep mixed wall. The post-earthquake global stability assessment of the
ash landfill requires an estimate of the final geometry of the deformed rock berm.
Deformation of the rock berm was predicted as documented in Exhibit 26. Static FLAC
analyses on the cross section at Station A162+00 indicated that the rock berm would settle
about 10 feet, resulting in six feet of exposed outboard deep mixed wall. These settlements
will be associated with compression and lateral squeezing of the underlying soils. A postearthquake rock berm surface slope of 13 percent was also estimated based on the FLAC
results. These results were then applied, using some engineering judgment, to predict the
post-earthquake geometries of the rock berms at Stations A168+00 and A172+00.
The cross section at Station A178+00 is in an area where the perimeter converges toward
Swan Pond Road. A sediment control pond is proposed for this general location. Existing ash
will be left in place in this area, and a large rock berm will not be constructed against the
outboard deep mixed wall. As described in Exhibit 26, the estimated ground deformations
might result in about 2.2 feet of exposed outboard deep mixed wall. The ash surface was
estimated to have a post-earthquake slope of about 2 percent. This surface slope was
judged to be a reasonable, rational assumption for the post-earthquake geometry at Station
A178+00.
3.3.
Stability under Post-Earthquake Conditions with Liquefaction
Based on the liquefaction triggering analyses (Exhibit 11), extensive liquefaction is expected
within the saturated ash deposits and the alluvial sands. Hence, for the evaluation of postearthquake stability, all of the hydraulically placed ash and alluvial sands, plus the landfilled
ash not underlain by an capillary break and less than eight feet above the phreatic surface,
were assumed to be liquefied and at their residual or steady state shearing resistances
Parametric calculations were carried out in SLOPE/W to determine the minimum stabilized
foundation width needed along the North Dredge Cell Segment of the perimeter. These
calculations targeted a minimum post-earthquake FS = 1.1 for slope stability, with
liquefaction. Assuming f’sc = 200 psi in the soil cement and an area replacement ratio of 0.26,
the results indicated a minimum foundation treatment width of 100 feet.
Since completing these parametric evaluations, the design slopes for the landfill have been
revised and additional soil borings have been advanced. The most recent borings indicated
an area near Sta. A178+00 where the top of bedrock is about 10 to 15 feet lower than
elsewhere in this design segment. Previously, the stability sections were drawn assuming a
level final cover at an elevation of 790 feet. The current design for the cover reflects the
surface slopes needed for drainage, which effectively reduces the height of the outslopes just
behind the perimeter berm. The updated closure geometry results in less lateral pressure on
the perimeter, resulting in post-earthquake factors of safety greater than 1.1 for slope
stability. The reserve capacity is needed, however, to maintain internal structural
performance (see Exhibits 18 and 21). The updated cross section geometries and the newly
obtained subsurface information have been incorporated into the stability analyses presented
here.
The calculated factors of safety with liquefaction and a deformed outer berm are summarized
in Table 2. The computer output plots are presented in Appendix A (Figures A.1 through
A.8). These results indicate that the shallow failure mode is more critical than the deep failure
mode for all four cross sections evaluated.
5
Table 2 – Results of Stability Analyses for Post-Earthquake Conditions
Cross Section
A162+00
A168+00
A172+00
A178+00
3.4.
Factor of Safety
Shallow Failure
1.58
1.55
1.50
1.51
Factor of Safety
Deep Failure
2.18
2.01
2.36
2.24
Critical Cross Section in the North Dredge Cell Segment
Another objective of the post-earthquake, limit equilibrium stability analyses is to identify the
critical cross section for numerical modeling in FLAC. The results shown in Table 2 indicate
that the shallow failure factors of safety are similar for all four evaluated cross sections
(around 1.5).
As shown in the computer output plots in Appendix A, the shallow failure surfaces do not
penetrate into the stabilized foundation. Hence, the shallow failure factors of safety are not
affected by the properties of the stabilized foundation. In the FLAC analysis, emphasis is
placed on the structural integrity and performance of the deep mixed panels; the critical
loading condition is represented by the lowest deep failure factor of safety. Therefore, the
cross section at Station A168+00 is the most critical among the four evaluated cross
sections.
It is noted that A162+00 was identified as the most critical cross section in the previous
parametric evaluations. With the reduced landfilled ash embankment heights and the
additional subsurface information obtained in the newly drilled borings, A168+00 has become
more critical; and was selected for further analyses in FLAC.
4.
Stability under Long-Term, Static Conditions
The above four representative cross sections (Stations A162+00, A168+00, A172+00, and
A178+00) within the limits of the first segment of the perimeter berm were also evaluated for
slope stability under long-term, drained conditions. The analyses used the methods,
assumptions, and material parameters outlined in Section 2.
Where the surface of the slope is composed of cohesionless (c’ = 0) materials, an infinite
slope failure (shallow sliding parallel to the slope surface) will be critical. The shallow,
surficial failures pose little risk to the overall stability of the slopes. Suction pressures in
unsaturated surface soils will often create enough apparent cohesion to prevent this type of
failure. Hence, to force the SLOPE/W search routine to evaluate only the deeper potential
failure surfaces, a minimum slip surface depth of 10 feet was specified in the analyses.
The calculated factors of safety are summarized in Table 3, and the computer output plots
are presented in Appendix B (Figures B.1 through B.8). These results indicate that the critical
slip surface occurs in the landfilled ash outslope for all four cross sections evaluated. Due to
the high composite strengths in the stabilized foundation, the critical failure surface is not
expected to cut through the stabilized foundation beneath the earthen berm.
6
The computed factors of safety for all four cross sections are greater than the required FS ≥
1.5, indicating that the slopes will perform satisfactorily under static, long-term, drained
conditions. This conclusion is anticipated, because the more critical (lower stability) design
condition is for the post-earthquake period with liquefied ash and alluvial sands.
Table 3 – Results of Stability Analyses for Long-Term Drained Conditions
Cross Section
A162+00
A168+00
A172+00
A178+00
Factor of Safety
Shallow Failure
3.51
2.62
2.71
2.74
7
Factor of Safety
Deep Failure
4.59
3.98
4.27
7.11
Appendix A
Stability Analysis
for PostEarthquake
Conditions with
Liquefaction
8
Material Name
Earthen Berm
Coarse Stone
Landfilled Ash
Liq. Landfilled Ash
Hydraulically Placed Ash
Lean Clay
Sandy Silt to Silty Sand
Shale
Stab. Hyd. Ash
Stab. Lean Clay
Stab. Silt to Silty Sand
Shot Rock
Model
Undrained (Phi=0)
Mohr-Coulomb
Mohr-Coulomb
S=f(overburden)
S=f(overburden)
Mohr-Coulomb
S=f(overburden)
Mohr-Coulomb
Mohr-Coulomb
Mohr-Coulomb
Mohr-Coulomb
Mohr-Coulomb
Unit Weight (Below/Above W.T.)
128; 125
128; 115
111; 109
111; 111
107; 100
130; N/A
128; N/A
140; N/A
107; 100
130; N/A
128; N/A
128; 115
Strength Parameters
c=1500; phi=0
c=0; phi=32
c=0; phi=30
Tau/Sigma=0.06
Tau/Sigma=0.06
c=0; phi=20
Tau/Sigma=0.06
c=3000; phi=20
c=2995; phi=2.5
c=2995; phi=15.1
c=2995; phi=2.5
c=0; phi=38
Factor of Safety (Opt.) = 1.58
Center = (-127.026, 869.323)
Radius = 80.5
DSM Zone Width = 100 feet
Area Replacement Ratio = 26%
850
Elevation (ft.)
Liquefied Landfilled Ash
Clay Cover
825
Rock Berm
800
Earthen Berm
775
Landfilled Ash
750
Hydraulically Placed Ash
725
Sandy Silt to Silty Sand
700
Shale
675
650
-600
-550
-500
-450
-400
-350
-300
-250
-200
-150
-100
-50
0
50
100
150
Distance (ft.)
Lean Clay Foundation Soil
Stabilized Foundation
File Name: 162+00_06_v01.gsz
Last Solved on 1/20/2011 at 4:11:28 PM
Figure A.1 -- Post-Earthquake Stability, A162+00, Shallow Failure
200
250
300
Material Name
Earthen Berm
Coarse Stone
Landfilled Ash
Liq. Landfilled Ash
Hydraulically Placed Ash
Lean Clay
Sandy Silt to Silty Sand
Shale
Stab. Hyd. Ash
Stab. Lean Clay
Stab. Silt to Silty Sand
Shot Rock
Model
Undrained (Phi=0)
Mohr-Coulomb
Mohr-Coulomb
S=f(overburden)
S=f(overburden)
Mohr-Coulomb
S=f(overburden)
Mohr-Coulomb
Mohr-Coulomb
Mohr-Coulomb
Mohr-Coulomb
Mohr-Coulomb
Unit Weight (Below/Above W.T.)
128; 125
128; 115
111; 109
111; 111
107; 100
130; N/A
128; N/A
140; N/A
107; 100
130; N/A
128; N/A
128; 115
Strength Parameters
c=1500; phi=0
c=0; phi=32
c=0; phi=30
Tau/Sigma=0.06
Tau/Sigma=0.06
c=0; phi=20
Tau/Sigma=0.06
c=3000; phi=20
c=2995; phi=2.5
c=2995; phi=15.1
c=2995; phi=2.5
c=0; phi=38
Factor of Safety (Opt.) = 2.18
Center = (-10.141, 1441.53)
Radius = 171.0471
DSM Zone Width = 100 feet
Area Replacement Ratio = 26%
850
Elevation (ft.)
Liquefied Landfilled Ash
Clay Cover
825
Rock Berm
800
Earthen Berm
775
Landfilled Ash
750
Hydraulically Placed Ash
725
Sandy Silt to Silty Sand
700
Shale
675
650
-600
-550
-500
-450
-400
-350
-300
-250
-200
-150
-100
-50
0
50
100
150
Distance (ft.)
Lean Clay Foundation Soil
Stabilized Foundation
File Name: 162+00_06_v01.gsz
Last Solved on 1/20/2011 at 4:17:22 PM
Figure A.2 -- Post-Earthquake Stability, A162+00, Deep Failure
200
250
300
Material Name
Earthen Berm
Coarse Stone
Landfilled Ash
Liq. Landfilled Ash
Hydraulically Placed Ash
Lean Clay
Sandy Silt to Silty Sand
Shale
Stab. Hyd. Ash
Stab. Lean Clay
Stab. Silt to Silty Sand
Shot Rock
Model
Undrained (Phi=0)
Mohr-Coulomb
Mohr-Coulomb
S=f(overburden)
S=f(overburden)
Mohr-Coulomb
S=f(overburden)
Mohr-Coulomb
Mohr-Coulomb
Mohr-Coulomb
Mohr-Coulomb
Mohr-Coulomb
Unit Weight (Below/Above W.T.)
128; 125
128; 115
111; 109
111; 111
107; 100
130; N/A
128; N/A
140; N/A
107; 100
130; N/A
128; N/A
128; 115
Strength Parameters
c=1500; phi=0
c=0; phi=32
c=0; phi=30
Tau/Sigma=0.06
Tau/Sigma=0.06
c=0; phi=20
Tau/Sigma=0.06
c=3000; phi=20
c=2995; phi=2.5
c=2995; phi=15.1
c=2995; phi=2.5
c=0; phi=38
Factor of Safety (Opt.) = 1.55
Center = (-101.687, 825.088)
Radius = 59.48399
DSM Zone Width = 100 feet
Area Replacement Ratio = 26%
850
Elevation (ft.)
825
Liquefied Landfilled Ash
Clay Cover
Earthen Berm
800
775
Landfilled Ash
750
725
Rock Berm
Hydraulically Placed Ash
Sandy Silt to Silty Sand
700
Shale
675
650
-600
-550
-500
-450
-400
-350
-300
-250
-200
-150
-100
-50
0
50
100
150
Distance (ft.)
Lean Clay Foundation Soil
Stabilized Foundation
File Name: 168+00_06_v01.gsz
Last Solved on 1/21/2011 at 8:37:36 AM
Figure A.3 -- Post-Earthquake Stability, A168+00, Shallow Failure
200
250
300
Material Name
Earthen Berm
Coarse Stone
Landfilled Ash
Liq. Landfilled Ash
Hydraulically Placed Ash
Lean Clay
Sandy Silt to Silty Sand
Shale
Stab. Hyd. Ash
Stab. Lean Clay
Stab. Silt to Silty Sand
Shot Rock
Model
Undrained (Phi=0)
Mohr-Coulomb
Mohr-Coulomb
S=f(overburden)
S=f(overburden)
Mohr-Coulomb
S=f(overburden)
Mohr-Coulomb
Mohr-Coulomb
Mohr-Coulomb
Mohr-Coulomb
Mohr-Coulomb
Unit Weight (Below/Above W.T.)
128; 125
128; 115
111; 109
111; 111
107; 100
130; N/A
128; N/A
140; N/A
107; 100
130; N/A
128; N/A
128; 115
Strength Parameters
c=1500; phi=0
c=0; phi=32
c=0; phi=30
Tau/Sigma=0.06
Tau/Sigma=0.06
c=0; phi=20
Tau/Sigma=0.06
c=3000; phi=20
c=2995; phi=2.5
c=2995; phi=15.1
c=2995; phi=2.5
c=0; phi=38
Factor of Safety (Opt.) = 2.01
Center = (16.201, 1403.81)
Radius = 174.2673
DSM Zone Width = 100 feet
Area Replacement Ratio = 26%
850
Elevation (ft.)
825
Liquefied Landfilled Ash
Clay Cover
Earthen Berm
800
775
Landfilled Ash
750
725
Rock Berm
Hydraulically Placed Ash
Sandy Silt to Silty Sand
700
Shale
675
650
-600
-550
-500
-450
-400
-350
-300
-250
-200
-150
-100
-50
0
50
100
150
Distance (ft.)
Lean Clay Foundation Soil
Stabilized Foundation
File Name: 168+00_06_v01.gsz
Last Solved on 1/21/2011 at 8:42:40 AM
Figure A.4 -- Post-Earthquake Stability, A168+00, Deep Failure
200
250
300
Material Name
Earthen Berm
Coarse Stone
Landfilled Ash
Liq. Landfilled Ash
Hydraulically Placed Ash
Lean Clay
Sandy Silt to Silty Sand
Shale
Stab. Hyd. Ash
Stab. Lean Clay
Stab. Silt to Silty Sand
Shot Rock
Model
Undrained (Phi=0)
Mohr-Coulomb
Mohr-Coulomb
S=f(overburden)
S=f(overburden)
Mohr-Coulomb
S=f(overburden)
Mohr-Coulomb
Mohr-Coulomb
Mohr-Coulomb
Mohr-Coulomb
Mohr-Coulomb
Unit Weight (Below/Above W.T.)
128; 125
128; 115
111; 109
111; 111
107; 100
130; N/A
128; N/A
140; N/A
107; 100
130; N/A
128; N/A
128; 115
Strength Parameters
c=1500; phi=0
c=0; phi=32
c=0; phi=30
Tau/Sigma=0.06
Tau/Sigma=0.06
c=0; phi=20
Tau/Sigma=0.06
c=3000; phi=20
c=2995; phi=2.5
c=2995; phi=15.1
c=2995; phi=2.5
c=0; phi=38
Factor of Safety (Opt.) = 1.50
Center = (-101.727, 824.922)
Radius = 60.44276
DSM Zone Width = 100 feet
Area Replacement Ratio = 26%
850
Clay Cover
Elevation (ft.)
825
Liquefied Landfilled Ash
Earthen Berm
800
775
750
725
Rock Berm
Landfilled Ash
Hydraulically Placed Ash
Sandy Silt to Silty Sand
700
Shale
675
650
-600
-550
-500
-450
-400
-350
-300
-250
-200
-150
-100
-50
0
50
100
150
Distance (ft.)
Lean Clay Foundation Soil
Stabilized Foundation
File Name: 172+00_06_v01.gsz
Last Solved on 1/21/2011 at 10:59:20 AM
Figure A.5 -- Post-Earthquake Stability, A172+00, Shallow Failure
200
250
300
Material Name
Earthen Berm
Coarse Stone
Landfilled Ash
Liq. Landfilled Ash
Hydraulically Placed Ash
Lean Clay
Sandy Silt to Silty Sand
Shale
Stab. Hyd. Ash
Stab. Lean Clay
Stab. Silt to Silty Sand
Shot Rock
Model
Undrained (Phi=0)
Mohr-Coulomb
Mohr-Coulomb
S=f(overburden)
S=f(overburden)
Mohr-Coulomb
S=f(overburden)
Mohr-Coulomb
Mohr-Coulomb
Mohr-Coulomb
Mohr-Coulomb
Mohr-Coulomb
Unit Weight (Below/Above W.T.)
128; 125
128; 115
111; 109
111; 111
107; 100
130; N/A
128; N/A
140; N/A
107; 100
130; N/A
128; N/A
128; 115
Strength Parameters
c=1500; phi=0
c=0; phi=32
c=0; phi=30
Tau/Sigma=0.06
Tau/Sigma=0.06
c=0; phi=20
Tau/Sigma=0.06
c=3000; phi=20
c=2995; phi=2.5
c=2995; phi=15.1
c=2995; phi=2.5
c=0; phi=38
Factor of Safety (Opt.) = 2.36
Center = (12.567, 1207.59)
Radius = 148.0043
DSM Zone Width = 100 feet
Area Replacement Ratio = 26%
850
Clay Cover
Elevation (ft.)
825
Liquefied Landfilled Ash
Earthen Berm
800
775
750
725
Rock Berm
Landfilled Ash
Hydraulically Placed Ash
Sandy Silt to Silty Sand
700
Shale
675
650
-600
-550
-500
-450
-400
-350
-300
-250
-200
-150
-100
-50
0
50
100
150
Distance (ft.)
Lean Clay Foundation Soil
Stabilized Foundation
File Name: 172+00_06_v01.gsz
Last Solved on 1/21/2011 at 11:07:44 AM
Figure A.6 -- Post-Earthquake Stability, A172+00, Deep Failure
200
250
300
Material Name
Earthen Berm
Coarse Stone
Landfilled Ash
Liq. Landfilled Ash
Hydraulically Placed Ash
Lean Clay
Sandy Silt to Silty Sand
Shale
Stab. Hyd. Ash
Stab. Lean Clay
Stab. Silt to Silty Sand
Shot Rock
Model
Undrained (Phi=0)
Mohr-Coulomb
Mohr-Coulomb
S=f(overburden)
S=f(overburden)
Mohr-Coulomb
S=f(overburden)
Mohr-Coulomb
Mohr-Coulomb
Mohr-Coulomb
Mohr-Coulomb
Mohr-Coulomb
Unit Weight (Below/Above W.T.)
128; 125
128; 115
111; 109
111; 111
107; 100
130; N/A
128; N/A
140; N/A
107; 100
130; N/A
128; N/A
128; 115
Strength Parameters
c=1500; phi=0
c=0; phi=32
c=0; phi=30
Tau/Sigma=0.06
Tau/Sigma=0.06
c=0; phi=20
Tau/Sigma=0.06
c=3000; phi=20
c=2995; phi=2.5
c=2995; phi=15.1
c=2995; phi=2.5
c=0; phi=38
Factor of Safety (Opt.) = 1.51
Center = (-116.126, 816.385)
Radius = 64.61251
DSM Zone Width = 100 feet
Area Replacement Ratio = 26%
850
Elevation (ft.)
825
Liquefied Landfilled Ash
Clay Cover
Earthen Berm
800
Landfilled Ash
775
750
Hydraulically Placed Ash
725
Sandy Silt to Silty Sand
700
Shale
675
650
-600
-550
-500
-450
-400
-350
-300
-250
-200
-150
-100
-50
0
50
100
150
200
Distance (ft.)
Lean Clay Foundation Soil
Stabilized Foundation
File Name: 178+00_06_v01.gsz
Last Solved on 1/21/2011 at 11:40:54 AM
Figure A.7 -- Post-Earthquake Stability, A178+00, Shallow Failure
250
300
Material Name
Earthen Berm
Coarse Stone
Landfilled Ash
Liq. Landfilled Ash
Hydraulically Placed Ash
Lean Clay
Sandy Silt to Silty Sand
Shale
Stab. Hyd. Ash
Stab. Lean Clay
Stab. Silt to Silty Sand
Shot Rock
Model
Undrained (Phi=0)
Mohr-Coulomb
Mohr-Coulomb
S=f(overburden)
S=f(overburden)
Mohr-Coulomb
S=f(overburden)
Mohr-Coulomb
Mohr-Coulomb
Mohr-Coulomb
Mohr-Coulomb
Mohr-Coulomb
Unit Weight (Below/Above W.T.)
128; 125
128; 115
111; 109
111; 111
107; 100
130; N/A
128; N/A
140; N/A
107; 100
130; N/A
128; N/A
128; 115
Strength Parameters
c=1500; phi=0
c=0; phi=32
c=0; phi=30
Tau/Sigma=0.06
Tau/Sigma=0.06
c=0; phi=20
Tau/Sigma=0.06
c=3000; phi=20
c=2995; phi=2.5
c=2995; phi=15.1
c=2995; phi=2.5
c=0; phi=38
Factor of Safety (Opt.) = 2.24
Center = (-20.069, 1431.94)
Radius = 226.1361
DSM Zone Width = 100 feet
Area Replacement Ratio = 26%
850
Elevation (ft.)
825
Liquefied Landfilled Ash
Clay Cover
Earthen Berm
800
Landfilled Ash
775
750
Hydraulically Placed Ash
725
Sandy Silt to Silty Sand
700
Shale
675
650
-600
-550
-500
-450
-400
-350
-300
-250
-200
-150
-100
-50
0
50
100
150
200
Distance (ft.)
Lean Clay Foundation Soil
Stabilized Foundation
File Name: 178+00_06_v01.gsz
Last Solved on 1/21/2011 at 11:46:28 AM
Figure A.8 -- Post-Earthquake Stability, A178+00, Deep Failure
250
300
Appendix B
Stability Analyses
for Long-Term,
Drained Condition
9
Material Name
Earthen Berm
Coarse Stone
Landfilled Ash
Hydraulically Placed Ash
Lean Clay
Sandy Silt to Silty Sand
Shale
Stab. Hyd. Ash
Stab. Lean Clay
Stab. Silt to Silty Sand
Shot Rock
Model
Mohr-Coulomb
Mohr-Coulomb
Mohr-Coulomb
Mohr-Coulomb
Mohr-Coulomb
Mohr-Coulomb
Mohr-Coulomb
Mohr-Coulomb
Mohr-Coulomb
Mohr-Coulomb
Mohr-Coulomb
Unit Weight (Below/Above W.T.)
128; 125
128; 115
111; 109
107; 100
130; N/A
128; N/A
140; N/A
107; 100
130; N/A
128; N/A
128; 115
Strength Parameters
c'=0; phi'=28
c'=0; phi'=38
c'=0; phi'=30
c'=0; phi'=25
c'=0; phi'=32
c'=0; phi'=30
c'=3000; phi'=20
c'=2995; phi'=19
c'=2995; phi'=25
c'=2995; phi'=23
c'=0; phi'=38
Factor of Safety (Opt.) = 3.51
Center = (-59.516, 796.601)
Radius = 20.87113
DSM Zone Width = 100 feet
Area Replacement Ratio = 26%
850
Clay Cover
Elevation (ft.)
825
800
Rock Berm
Earthen Berm
775
Landfilled Ash
750
Hydraulically Placed Ash
725
Sandy Silt to Silty Sand
700
Shale
675
650
-600
-550
-500
-450
-400
-350
-300
-250
-200
-150
-100
-50
0
50
100
150
200
Distance (ft.)
Lean Clay Foundation Soil
Stabilized Foundation
File Name: 162+00_LT.gsz
Last Solved on 1/21/2011 at 3:23:52 PM
Figure B.1 -- Long-Term, Drained Stability, A162+00, Shallow Failure
250
300
Unit Weight (Below/Above W.T.)
128; 125
128; 115
111; 109
107; 100
130; N/A
128; N/A
140; N/A
107; 100
130; N/A
128; N/A
128; 115
Model
Mohr-Coulomb
Mohr-Coulomb
Mohr-Coulomb
Mohr-Coulomb
Mohr-Coulomb
Mohr-Coulomb
Mohr-Coulomb
Mohr-Coulomb
Mohr-Coulomb
Mohr-Coulomb
Mohr-Coulomb
Material Name
Earthen Berm
Coarse Stone
Landfilled Ash
Hydraulically Placed Ash
Lean Clay
Sandy Silt to Silty Sand
Shale
Stab. Hyd. Ash
Stab. Lean Clay
Stab. Silt to Silty Sand
Shot Rock
Strength Parameters
c'=0; phi'=28
c'=0; phi'=38
c'=0; phi'=30
c'=0; phi'=25
c'=0; phi'=32
c'=0; phi'=30
c'=3000; phi'=20
c'=2995; phi'=19
c'=2995; phi'=25
c'=2995; phi'=23
c'=0; phi'=38
Factor of Safety (Opt.) = 4.59
Center = (6.002, 989.695)
Radius = 124.0921
DSM Zone Width = 100 feet
Area Replacement Ratio = 26%
850
Clay Cover
Elevation (ft.)
825
800
Rock Berm
Earthen Berm
775
Landfilled Ash
750
Hydraulically Placed Ash
725
Sandy Silt to Silty Sand
700
Shale
675
650
-600
-550
-500
-450
-400
-350
-300
-250
-200
-150
-100
-50
0
50
100
150
200
Distance (ft.)
Lean Clay Foundation Soil
Stabilized Foundation
File Name: 162+00_LT.gsz
Last Solved on 1/21/2011 at 3:28:18 PM
Figure B.2 -- Long-Term, Drained Stability, A162+00, Deep Failure
250
300
Material Name
Earthen Berm
Coarse Stone
Landfilled Ash
Hydraulically Placed Ash
Lean Clay
Sandy Silt to Silty Sand
Shale
Stab. Hyd. Ash
Stab. Lean Clay
Stab. Silt to Silty Sand
Shot Rock
Unit Weight (Below/Above W.T.)
128; 125
128; 115
111; 109
107; 100
130; N/A
128; N/A
140; N/A
107; 100
130; N/A
128; N/A
128; 115
Model
Mohr-Coulomb
Mohr-Coulomb
Mohr-Coulomb
Mohr-Coulomb
Mohr-Coulomb
Mohr-Coulomb
Mohr-Coulomb
Mohr-Coulomb
Mohr-Coulomb
Mohr-Coulomb
Mohr-Coulomb
DSM Zone Width = 100 feet
Area Replacement Ratio = 26%
Strength Parameters
c'=0; phi'=28
c'=0; phi'=38
c'=0; phi'=30
c'=0; phi'=25
c'=0; phi'=32
c'=0; phi'=30
c'=3000; phi'=20
c'=2995; phi'=19
c'=2995; phi'=25
c'=2995; phi'=23
c'=0; phi'=38
Factor of Safety (Opt.) = 2.62
Center = (-45.019, 827.942)
Radius = 31.00167
850
Elevation (ft.)
825
Clay Cover
Earthen Berm
800
775
Rock Berm
Landfilled Ash
750
Hydraulically Placed Ash
725
700
Sandy Silt to Silty Sand
Shale
675
650
-600
-550
-500
-450
-400
-350
-300
-250
-200
-150
-100
-50
0
50
100
150
Distance (ft.)
Lean Clay Foundation Soil
Stabilized Foundation
File Name: 168+00_LT.gsz
Last Solved on 1/21/2011 at 3:06:52 PM
Figure B.3 -- Long-Term, Drained Stability, A168+00, Shallow Failure
200
250
300
Material Name
Earthen Berm
Coarse Stone
Landfilled Ash
Hydraulically Placed Ash
Lean Clay
Sandy Silt to Silty Sand
Shale
Stab. Hyd. Ash
Stab. Lean Clay
Stab. Silt to Silty Sand
Shot Rock
Unit Weight (Below/Above W.T.)
128; 125
128; 115
111; 109
107; 100
130; N/A
128; N/A
140; N/A
107; 100
130; N/A
128; N/A
128; 115
Model
Mohr-Coulomb
Mohr-Coulomb
Mohr-Coulomb
Mohr-Coulomb
Mohr-Coulomb
Mohr-Coulomb
Mohr-Coulomb
Mohr-Coulomb
Mohr-Coulomb
Mohr-Coulomb
Mohr-Coulomb
DSM Zone Width = 100 feet
Area Replacement Ratio = 26%
Strength Parameters
c'=0; phi'=28
c'=0; phi'=38
c'=0; phi'=30
c'=0; phi'=25
c'=0; phi'=32
c'=0; phi'=30
c'=3000; phi'=20
c'=2995; phi'=19
c'=2995; phi'=25
c'=2995; phi'=23
c'=0; phi'=38
Factor of Safety (Opt.) = 3.98
Center = (21.351, 986.078)
Radius = 125.8996
850
Elevation (ft.)
825
Clay Cover
Earthen Berm
800
775
Rock Berm
Landfilled Ash
750
Hydraulically Placed Ash
725
700
Sandy Silt to Silty Sand
Shale
675
650
-600
-550
-500
-450
-400
-350
-300
-250
-200
-150
-100
-50
0
50
100
150
Distance (ft.)
Lean Clay Foundation Soil
Stabilized Foundation
File Name: 168+00_LT.gsz
Last Solved on 1/21/2011 at 3:09:30 PM
Figure B.4 -- Long-Term, Drained Stability, A168+00, Deep Failure
200
250
300
Material Name
Earthen Berm
Coarse Stone
Landfilled Ash
Hydraulically Placed Ash
Lean Clay
Sandy Silt to Silty Sand
Shale
Stab. Hyd. Ash
Stab. Lean Clay
Stab. Silt to Silty Sand
Shot Rock
Unit Weight (Below/Above W.T.)
128; 125
128; 115
111; 109
107; 100
130; N/A
128; N/A
140; N/A
107; 100
130; N/A
128; N/A
128; 115
Model
Mohr-Coulomb
Mohr-Coulomb
Mohr-Coulomb
Mohr-Coulomb
Mohr-Coulomb
Mohr-Coulomb
Mohr-Coulomb
Mohr-Coulomb
Mohr-Coulomb
Mohr-Coulomb
Mohr-Coulomb
DSM Zone Width = 100 feet
Area Replacement Ratio = 26%
Strength Parameters
c'=0; phi'=28
c'=0; phi'=38
c'=0; phi'=30
c'=0; phi'=25
c'=0; phi'=32
c'=0; phi'=30
c'=3000; phi'=20
c'=2995; phi'=19
c'=2995; phi'=25
c'=2995; phi'=23
c'=0; phi'=38
Factor of Safety (Opt.) = 2.71
Center = (-63.777, 823.478)
Radius = 30.38333
850
Clay Cover
Elevation (ft.)
825
Earthen Berm
Rock Berm
800
775
750
725
Landfilled Ash
Hydraulically Placed Ash
Sandy Silt to Silty Sand
700
Shale
675
650
-600
-550
-500
-450
-400
-350
-300
-250
-200
-150
-100
-50
0
50
100
150
200
Distance (ft.)
Lean Clay Foundation Soil
Stabilized Foundation
File Name: 172+00_LT.gsz
Last Solved on 1/21/2011 at 2:37:38 PM
Figure B.5 -- Long-Term, Drained Stability, A172+00, Shallow Failure
250
300
Material Name
Earthen Berm
Coarse Stone
Landfilled Ash
Hydraulically Placed Ash
Lean Clay
Sandy Silt to Silty Sand
Shale
Stab. Hyd. Ash
Stab. Lean Clay
Stab. Silt to Silty Sand
Shot Rock
Unit Weight (Below/Above W.T.)
128; 125
128; 115
111; 109
107; 100
130; N/A
128; N/A
140; N/A
107; 100
130; N/A
128; N/A
128; 115
Model
Mohr-Coulomb
Mohr-Coulomb
Mohr-Coulomb
Mohr-Coulomb
Mohr-Coulomb
Mohr-Coulomb
Mohr-Coulomb
Mohr-Coulomb
Mohr-Coulomb
Mohr-Coulomb
Mohr-Coulomb
DSM Zone Width = 100 feet
Area Replacement Ratio = 26%
Strength Parameters
c'=0; phi'=28
c'=0; phi'=38
c'=0; phi'=30
c'=0; phi'=25
c'=0; phi'=32
c'=0; phi'=30
c'=3000; phi'=20
c'=2995; phi'=19
c'=2995; phi'=25
c'=2995; phi'=23
c'=0; phi'=38
Factor of Safety (Opt.) = 4.27
Center = (14.859, 980.788)
Radius = 117.3768
850
Clay Cover
Elevation (ft.)
825
Earthen Berm
Rock Berm
800
775
750
725
Landfilled Ash
Hydraulically Placed Ash
Sandy Silt to Silty Sand
700
Shale
675
650
-600
-550
-500
-450
-400
-350
-300
-250
-200
-150
-100
-50
0
50
100
150
200
Distance (ft.)
Lean Clay Foundation Soil
Stabilized Foundation
File Name: 172+00_LT.gsz
Last Solved on 1/21/2011 at 2:47:04 PM
Figure B.6 -- Long-Term, Drained Stability, A172+00, Deep Failure
250
300
Material Name
Earthen Berm
Coarse Stone
Landfilled Ash
Hydraulically Placed Ash
Lean Clay
Sandy Silt to Silty Sand
Shale
Stab. Hyd. Ash
Stab. Lean Clay
Stab. Silt to Silty Sand
Shot Rock
Model
Mohr-Coulomb
Mohr-Coulomb
Mohr-Coulomb
Mohr-Coulomb
Mohr-Coulomb
Mohr-Coulomb
Mohr-Coulomb
Mohr-Coulomb
Mohr-Coulomb
Mohr-Coulomb
Mohr-Coulomb
Unit Weight (Below/Above W.T.)
128; 125
128; 115
111; 109
107; 100
130; N/A
128; N/A
140; N/A
107; 100
130; N/A
128; N/A
128; 115
Strength Parameters
c'=0; phi'=28
c'=0; phi'=38
c'=0; phi'=30
c'=0; phi'=25
c'=0; phi'=32
c'=0; phi'=30
c'=3000; phi'=20
c'=2995; phi'=19
c'=2995; phi'=25
c'=2995; phi'=23
c'=0; phi'=38
Factor of Safety (Opt.) = 2.74
Center = (-60.108, 802.485)
Radius = 27.10533
DSM Zone Width = 100 feet
Area Replacement Ratio = 26%
850
Elevation (ft.)
825
Clay Cover
Earthen Berm
800
775
Landfilled Ash
750
Hydraulically Placed Ash
725
Sandy Silt to Silty Sand
Shale
700
675
650
-600
-550
-500
-450
-400
-350
-300
-250
-200
-150
-100
-50
0
50
100
150
200
Distance (ft.)
Lean Clay Foundation Soil
Stabilized Foundation
File Name: 178+00_LT.gsz
Last Solved on 1/21/2011 at 1:50:22 PM
Figure B.7 -- Long-Term, Drained Stability, A178+00, Shallow Failure
250
300
Material Name
Earthen Berm
Coarse Stone
Landfilled Ash
Hydraulically Placed Ash
Lean Clay
Sandy Silt to Silty Sand
Shale
Stab. Hyd. Ash
Stab. Lean Clay
Stab. Silt to Silty Sand
Shot Rock
Model
Mohr-Coulomb
Mohr-Coulomb
Mohr-Coulomb
Mohr-Coulomb
Mohr-Coulomb
Mohr-Coulomb
Mohr-Coulomb
Mohr-Coulomb
Mohr-Coulomb
Mohr-Coulomb
Mohr-Coulomb
Unit Weight (Below/Above W.T.)
128; 125
128; 115
111; 109
107; 100
130; N/A
128; N/A
140; N/A
107; 100
130; N/A
128; N/A
128; 115
Strength Parameters
c'=0; phi'=28
c'=0; phi'=38
c'=0; phi'=30
c'=0; phi'=25
c'=0; phi'=32
c'=0; phi'=30
c'=3000; phi'=20
c'=2995; phi'=19
c'=2995; phi'=25
c'=2995; phi'=23
c'=0; phi'=38
Factor of Safety (Opt.) = 7.11
Center = (-33.803, 1021.29)
Radius = 163.8568
DSM Zone Width = 100 feet
Area Replacement Ratio = 26%
850
Elevation (ft.)
825
Clay Cover
Earthen Berm
800
775
Landfilled Ash
750
Hydraulically Placed Ash
725
Sandy Silt to Silty Sand
Shale
700
675
650
-600
-550
-500
-450
-400
-350
-300
-250
-200
-150
-100
-50
0
50
100
150
200
Distance (ft.)
Lean Clay Foundation Soil
Stabilized Foundation
File Name: 178+00_LT.gsz
Last Solved on 1/21/2011 at 2:10:34 PM
Figure B.8 -- Long-Term, Drained Stability, A178+00, Deep Failure
250
300


© Copyright 2026