
Document 257051
COVER SHEET
P W - 9 4
SEC Registration Number
P A L
H O L D I N G S ,
I N C .
A N D
S U B S I D I A R I E S
(Company’s Full Name)
7 t h
F l o o r
6 7 5 4
,
A y a l a
A l
l
i
e d
A v e n u e
B a n k
,
C e n t e r
M a k a t
i
C i
t y
(Business Address: No. Street City/Town/Province)
0 3
3 1
Month
Day
Daniel Ang Tan Chai
817-8710
(Contact Person)
(Company Telephone Number)
1 7 - A
(Form Type)
Month
(Fiscal Year)
Day
(Annual Meeting)
Not Applicable
(Secondary License Type, If Applicable)
Dept. Requiring this Doc.
Amended Articles Number/Section
Total Amount of Borrowings
6,745
Total No. of Stockholders
Domestic
Foreign
To be accomplished by SEC Personnel concerned
File Number
LCU
Document ID
Cashier
STAMPS
Remarks: Please use BLACK ink for scanning purposes.
1
SECURITIES AND EXCHANGE COMMISSION
SEC FORM 17-A
ANNUAL REPORT PURSUANT TO SECTION 17
OF THE SECURITIES REGULATION CODE AND SECTION 141
OF THE CORPORATION CODE OF THE PHILIPPINES
1. For the fiscal year ended
March 31, 2012
2. SEC Identification Number
PW- 94
3. BIR Tax Identification No. 430-000-707-922
4. Exact name of registration as specified in its charter
5.
Philippines
6.
(Province, country or other jurisdiction of
incorporation or organization)
PAL HOLDINGS, INC.
(SEC Use Only)
Industry Classification Code:
7.
7/F Allied Bank Center, 6754 Ayala Avenue, Makati City
Address of principal office
8.
(632) 816-3311 local 3687 / 817-8710
Registrant’s telephone number, including area code
9.
Not Applicable
Former name, former address, former fiscal year, if changed since last report
1200
Postal Code
10. Securities registered pursuant to Section 8 and 12 of the SRC
Title of Each Class
Number of Shares of Common Stock Outstanding
and Amount of Debt Outstanding
Common Stock
5,421,512,096 shares
2
11. Are any or all of these securities listed on the Philippine Stock Exchange?
Yes [ X ]
No [
]
12. Check whether the registrant:
(a) has filed all reports to be filed by Section 17 of the SRC and SRC Rule 17 thereunder or
Section 11 of the Revised Securities Act (RSA) and RSA Rule 11 (a)-1 thereunder and
Section 26 and 141 of the Corporation Code of the Philippines during the preceding 12
months (or for such shorter period that the registrant was required to file such reports);
Yes [ X ]
No [
]
(b) has been subject to such filing requirements for the past 90 days.
Yes [ X ]
No [ ]
13. Aggregate market value of the voting stock held by non-affiliates of the registrant is
= 1,011,174,129 as of March 31, 2012.
P
14. Not applicable
DOCUMENTS INCORPORATED BY REFERENCE
3
PART I - BUSINESS AND GENERAL INFORMATION
Item 1. Business
a) Corporate History
PAL Holdings, Inc., (the Company), was incorporated on May 10, 1930 as “Baguio Gold Mining
Company”. On September 23, 1996, the Philippine Securities and Exchange Commission (SEC)
approved the change in the Company’s name to “Baguio Gold Holdings Corporation” and the
change in its primary purpose to that of a holding company.
On May 30, 1997, the stockholders approved the increase in the Company’s authorized capital
stock from 200 million common shares to 4 billion common shares both at P1 par value per share.
On April 13, 1998, the stockholders amended the increase in the Company’s authorized capital
stock from 4 billion common shares to 2.8 billion common shares and 1.2 billion preferred shares
both at P1 par value per share. On August 30, 1999, the stockholders further amended the
authorized capital stock from 2.8 billion common shares and 1.2 billion preferred shares to 400
million common shares at P1 par value per share this was approved by the SEC on October 2,
2000.
On July 26 and September 19, 2006, the Board of Directors (BOD) approved the increase in
authorized capital stock of the Company from P400 million divided into 400 million common
shares with a par value of P1 per share to P 20 billion divided into 20 billion common shares.
On August 17, 2006, the BOD approved the acquisition of the following holding companies which
collectively control 84.67% of Philippine Airlines (PAL); Pol Holdings, Inc., Cube Factor
Holdings, Inc., Ascot Holdings, Incorporated, Sierra Holdings & Equities, Inc., Network Holdings
& Equities, Inc., and Maxell Holdings Corporation.
On January 19, 2007 the Philippine SEC approved the increase in authorized capital stock and
change in corporate name of Baguio Gold Holdings Corporation to PAL Holdings, Inc.
On August 13, 2007, the Company acquired directly from the Six Holding Companies
8,823,640,223 shares in PAL, which is equivalent to 81.57% of the issued and outstanding
common shares in the Airline. At the same time, it acquired from the Five Holding Companies
50,591,155 shares in PR Holdings, Inc., equivalent to 82.33% of the outstanding shares in PR
Holdings, Inc. Both acquisitions were made by way of a dacion en pago, whereby the total
acquisition price of PHP 12,550 million for the shares in PAL and PR Holdings, Inc. was satisfied
by an equivalent reduction of the liability owning to the Company from the Six Companies.
On August 14, 2007, the Company assigned its shares in each of the Six Holding Companies to
Trustmark Holdings Corporation.
On October 16, 2007, the Philippine SEC approved the Amended By-Laws of the Company,
which consist of the deletion of outdated provisions and the inclusion of the provisions required
under the Code of Corporate Governance provided by the SEC.
On October 17, 2007, the Philippine SEC approved the equity restructuring of the Company. This
allowed the Company to wipe out the deficit as of March 31, 2007 amounting to P253.73 million
using the Additional Paid-In Capital amounting to P4,029.3 billion subject to the condition that the
remaining additional paid-in capital will not be used to wipe out losses that may be incurred in the
future without prior approval of the SEC.
4
b. Description of Subsidiaries
Philippine Airlines, Inc.
Philippine Airlines, Inc. (PAL), a corporation organized and existing under the laws of the
Republic of the Philippines, was incorporated on February 25, 1941. It is the national flag carrier
of the Philippines and its principal activity is to provide air transportation for passengers and cargo
within and outside the Philippines.
PAL flies to the most popular domestic jet routes and international and regional points that are
either most visited by Filipinos or provide a good source of visitors to the Philippines. As of
March 31, 2012, PAL's route network covered 20 points in the Philippines and 30 international
destinations.
PR Holdings, Inc.
PR Holdings, Inc. (PR) was organized by a consortium of investors for the purpose of bidding for
and acquiring the shares of stock of PAL in accordance with the single-buyer requirement of the
bidding guidelines set by the seller, the National Government of the Republic of the Philippines.
PR acquired on March 25, 1992 67% of the outstanding capital stock of PAL.
PR was partially dissolved or liquidated on November 9, 1998 with a decrease in its authorized
capital stock and retirement of some of its shares in exchange of PAL shares to retiring
stockholders as return of capital.
As a holding company, PR’s primary purpose is to purchase, subscribe, acquire, hold, use,
manage, develop, sell, assign, exchange or dispose of real and personal property, including shares
of stocks, debentures, notes and other securities of any domestic or foreign corporation.
Principal products or services and their markets indicating their relative contributions to sales
or revenues of each product or service:
i) Percentage of sales or revenues and net income contributed by foreign sales
PAL's operations for FY2011-12 are described as follows:
During the year, PAL carried an average of 22,474 passengers (11,553 domestic and 10,921
international) and 333 tons of cargo (143 tons domestic and 190 tons international) per day.
Systemwide Operations: FY2011-12
Net Passenger Revenues Php millions
Net Cargo Revenues Php millions
Revenue Passenger Kms (‘000)
Available Seat Kms
(‘000)
Passenger Load Factor
No. of Passengers
Freight Kilograms
63,066.4
5,404.4
18,554,817
25,468,975
72.85%
8,225,314
121,958,561
5
Net Revenues by Route
Based on the results of operations for FY11-12, FY 10-11 and FY 09-10, the comparative revenue
contribution by route is shown below:
FY11-12
31.1%
51.4%
82.5%
17.5%
100.0%
Transpacific
Asia & Australia
Total International
Total Domestic
Total System
FY10-11
32.4%
47.3%
79.7%
20.3%
100.0%
FY09-10
32.6%
42.6%
75.2%
24.8%
100.0%
International Passenger Services
As of March 31, 2012, PAL's international route network covered 30 cities (including 5 under joint
service/code share arrangements with other international carriers) in 16 countries.
25 on-line points:
Guam, Honolulu, Las Vegas, Los Angeles, San Francisco,
Vancouver, Melbourne, Sydney, Delhi, Fukuoka, Nagoya, Osaka,
Tokyo, Pusan, Seoul, Hongkong, Macau, Beijing, Shanghai, Xiamen,
Taipei, Bangkok, Saigon, Singapore, Jakarta
5 points under joint
service/codeshare
arrangements:
Abu Dhabi, Bahrain, Doha, Dubai, Kuala Lumpur
Transpacific
During the year, PAL flew an average of 23 flights a week to North America utilizing B747-400s and
A340-300s: 9 times weekly non-stop flights to Los Angeles; 7 times weekly non-stop services to San
Francisco; and 7 times a week to Vancouver, four of which fly onward to Las Vegas and back.
Technical stops either in Guam or Honolulu are required on the return flights of Transpacific services
at certain times of the year to compensate for adverse wind conditions.
In addition, PAL also operates a regular thrice weekly direct service to Honolulu while Guam is
served five times a week.
The Airline is entitled to fly to 33 other U.S. cities for unlimited frequencies under certain terms and
conditions of the Philippines-US bilateral air transport agreement. However, the Category II rating
imposed on the Philippines by the U.S. Federal Aviation Administration prevents PAL from
increasing the number of flights it operates into the U.S. at this time.
India
PAL used to fly six times a week to Delhi, three times direct and three times via Bangkok. The direct
service was discontinued on September 26, 2011. The three times a week service via Bangkok was
maintained.
Asia and Australia
PAL operated 187 departures per week out of Manila and Cebu to 9 countries in Asia and Australia.
The Airline flew 35 times a week to Hongkong; 28 times a week to Singapore; 18 times a week to
Seoul; 14 times a week to Bangkok; 13 times a week to Tokyo; 8 times a week to Beijing; 7 times a
week each to Nagoya, Osaka, Pusan, Saigon, Shanghai, Taipei, and Xiamen; 5 times a week to
6
Fukuoka; and 4 times a week to Macau. Jakarta is served 4 times a week via Singapore and also 4
times a week direct service.
The Australia operations are composed of 4 times weekly service on the Manila-Melbourne-SydneyManila route and 3 times weekly on the Manila-Sydney-Melbourne-Manila route.
Domestic Passenger Services
PAL's domestic network covered twenty (20) cities and towns in the Philippines. PAL operated its jet
aircraft (B747-400, B777-300ER, A340-300, A330-300, A320-200, and A319-100) on its domestic
routes. It serves the following domestic destinations: Bacolod, Butuan, Cagayan, Cebu, Cotabato,
Davao, Dipolog, Dumaguete, General Santos, Iloilo, Kalibo, Legazpi, Laoag, Manila, Ozamiz, Puerto
Princesa, Roxas, Tacloban, Tagbilaran, and Zamboanga. Services to Ozamiz was discontinued on
March 23, 2012.
Joint Services and Code Share Agreements
The Airline continues to employ codesharing and tactical alliances to broaden its route network and
establish a presence in cities where it does not fly.
PAL maintains codeshare agreements with Malaysia Airlines (in place since February 1999) covering
a total of 21 weekly flights between Kuala Lumpur and Manila; with Emirates Airlines (in place since
September 1999) on 14 times weekly non-stop flights between Dubai and Manila; with Cathay Pacific
(in place since November 2001) on daily services between Hongkong and Cebu; with Qatar Airways
(in place since August 2002) on 14 times weekly service between Doha and Manila; with Gulf Air (in
place since March 2006) on 9 times weekly service between Bahrain and Manila; and with Etihad
Airways (in place since October 2007) on 14 times weekly services between Abu Dhabi and Manila.
PAL's daily services between Manila and Saigon are operated under a codeshare agreement with
Vietnam Airlines (in place since October 2001) with PAL as the operating airline. PAL also has
similar agreements with Garuda Indonesia (since March 2001) on PAL operated flights between
Manila and Jakarta, and with Air Macau (since October 2009) on PAL operated flights between
Manila and Macau.
PAL also codeshares with Air Philippines (in place since May 2002) on regular domestic services
which the latter operates.
Frequent Flyer Programs
The PAL Mabuhay Miles program provides opportunities for travel rewards through the accumulation
of mileage credits earned on flights with PAL and partner airlines. Members also earn miles through
purchases and availment of services from partner establishments including credit cards, banks,
telecommunications, hotels and resorts, tour operators, cruise services, insurance, car rentals, and other
merchandise companies. PAL Mabuhay Miles has a website, www.mabuhaymiles.com, which
provides members access to their account information, and details on promotions and offers.
Mabuhay Miles Elite or Premier Elite members enjoy exclusive travel privileges including priority
reservation waitlist, dedicated reservation telephone lines, priority check-in, additional free luggage
allowance, priority luggage handling, access to Mabuhay Lounges and participating VIP lounges, and
additional discounts and amenities from program partners.
The SportsPlus Card is a privilege card designed for sports enthusiasts, which grants members the
benefit of extra free baggage allowance for sports equipment.
7
(ii) Distribution Methods of Products or Services
PAL maintains a total of fourteen (14) sales and ticket offices in Manila, twenty four (24) in other
cities in the Philippines, and thirty (30) located in foreign stations. There are thirty one (31) general
sales agents in selected international points, Bank Settlement Plan member agents in twenty seven (27)
countries, Airline Reporting Corporation member agents in the United States, twelve (12) domestic
sales agents and 340 agents under the domestic ticketing program that handle the promotions and sales
of PAL's products and services.
The PAL website, www.philippineairlines.com, has a booking facility which provides interactive
booking of flights and ticket purchases. It also contains additional web pages that feature detailed
descriptions of PAL destinations and a calendar of destination festivities. Functionalities include fares
and tour modules, online training registration, route maps, flight schedules, dropdown lists, and online
cargo booking. Real time flight information of all PAL flights may also be accessed by logging on to
the PAL website.
The PAL Mobile site, www.philippineairlines.mobi, allows web-enabled mobile phones to access
flight schedules, track Mabuhay Miles mileage, and know more about the latest PAL news, advisories,
travel information, and promos.
(iii) Status of any Publicly-announced New Product or Service
All PAL aircraft are equipped with new interiors, state-of-the-art seats, and the latest in inflight
entertainment.
Complimentary meals and beverages, a variety of reading materials, and in-flight amenities are
provided in international and domestic flights. Special meals may be requested on all international
flights to satisfy the dietary requirements of passengers. Overnight kits and the ‘Junior Jetsetter’
activity kits are offered in long haul international flights
The Fiesta Boutique is a selection of duty free products offered in all international flights. The service
provides the convenience of duty free shopping during the flight. Products for sale include imported
and local liquor, cigarettes, perfumes, and other high quality gift items.
.
PAL Mabuhay Lounges are available in selected international and domestic stations for Mabuhay
class passengers and Mabuhay Miles Elite and Premier Elite members. Passengers can unwind, dine,
and freshen up in these facilities before boarding their flights.
The PAL Swingaround and PALakbayan are the Airline's tour programs which continue to offer
holiday packages in PAL's international and domestic destinations.
PAL's RHUSH (Rapid Handling of Urgent Shipments) is the airport-to-airport cargo service which
provides the fastest way to ship cargo domestically or overseas. It offers high priority in cargo,
guaranteed space, and quick acceptance and release time.
Express check-in counters for senior citizens and up to two traveling companions with no check-in
baggage are offered in Manila and Cebu.
(iv) Competitive business conditions and the registrant’s competitive positions in the industry
and methods of competition
PAL continues to maintain a strong market share in its international routes despite competition with
flag carriers of the host countries where PAL flies and with the 'sixth freedom' carriers which fly to the
Philippines en route to their final destinations.
8
The following table shows the PAL’s main competitors and PAL's total market and capacity share per
route.
PAL's Market and Capacity Share:
Route
Share
Market Capacity
Share
Airline Competitors
Transpacific
38.0%
36.7%
Delta Airlines, Hawaiian Airlines, Air
Canada, Korean Airlines, Asiana Airlines,
Japan Airlines, Cathay Pacific, Eva
Airways, China Airlines, Continental
Airlines
Asia and
Australia
29.2%
31.6%
Japan Airlines, Cathay Pacific, Singapore
Airlines, Thai Airways, Korean Airlines,
Asiana Airlines, China Airlines, Eva
Airways, Qantas Airlines, China Southern
Airlines, Dragon Air, Delta Airlines,
Royal Brunei, Kuwait Airways,
Jeju Airlines, Air China, Tiger Airways,
Cebu Pacific, All Nippon Airways,
Jetstar Asia, Hong Kong Express Airways,
Jetstar Airways, Airphil Express
PAL competes with the biggest carriers in the airline industry. Delta Airlines, China Southern
Airlines, Air China, Continental Airlines, and Qantas Airlines are among the world's biggest in terms
of passengers carried. Japan Airlines, Air China, Qantas Airways, Cathay Pacific, China Southern
Airlines, Singapore Airlines, Korean Air, and Thai Airways are still the leading carriers in the Asia
and Pacific region. Most of these international airlines belong to the largest alliances in the industry
(including the Star Alliance, Sky Team and One World).
PAL held a 28% share in the domestic market in the fiscal year ending March 2012. Competitors
include Cebu Pacific, Airphil Express, Zest Air, and Southeast Asian Airlines.
The continuous enhancement of products and services, competitive fares, and an excellent safety
record enables PAL to hold its market leadership. Over the TransPacific, PAL has the advantage of
providing the only nonstop service to mainland U.S. and Canada. The distinct Filipino flavor of the
PAL inflight service, which appeals strongly to Filipino ethnic passengers, is another advantage over
the non-Filipino carriers.
(v.) Sources and availability of raw materials and the names of principal suppliers
PAL’s jet fuel suppliers are: Air BP Limited, Petron Corporation, Pilipinas Shell Petroleum
Corporation, Chevron Products Company, PT Pertamina (Persero), World Fuel Services (Singapore)
Pte. Ltd., Win Both International Corporation, PTT Public Co. Ltd., China Aviation Oil Supply
Corporation, Shanghai Pudong International Airport Aviation Fuel Supply Co. Ltd., Hyundai Oilbank
Co. Ltd, S-Oil Corporation, Singapore Petroleum Co. Ltd., Sinopec (HK) Petroleum Co. Ltd., IP&E
Holdings, LLC (dba. IP&E Guam), Morgan Stanley Capital Group, Inc., Phoenix Petroleum
Philippines, Inc., JX Nippon Oil and Energy Corporation (Formerly Japan Energy Corporation), Vitol
Aviation Co. (Formerly Pacific Fuel Trading Corporation), Indian Oil Corporation Ltd., Vitol Asia
Pte.Ltd., Kangqi International Pte. Ltd., and Hyundai Oilbank Co.Ltd.
9
PAL’s inflight catering requirements are provided by SKYKITCHEN Philippines Inc., for all outgoing
flights ex- Manila except for flights bound for Japan, which are provided for by MIASCOR Catering
Services Corporation until July 31, 2012. For incoming flights, the major suppliers include Flying
Food Group (SFO), HACOR Inc. (LAX), International In-Flight Catering Co.Ltd. (HNL), Q Catering
(SYD and MEL), CLS Catering Services Ltd. (YVR), Taj SATS Air Catering Ltd.(DEL), Cebu
Pacific Catering Services Inc. (CEB), Fukuoka Inflight Catering (FUK), AAS Catering Services
(KIX), Nagoya Air Catering Co. Ltd. (NGO), TFK Corporation (NRT), Korean Air Catering (ICN and
PUS), Shanghai Eastern Air Catering Co. Ltd. (PVG), Beijing Airport Inflight Kitchen Ltd. (BJS),
Cathay Pacific Catering Services Ltd. (HKG), China Pacific Catering Services (TPE), Xiamen
International Airport Catering Co. Ltd. (XMN), LSG Sky Chefs (Thailand) Ltd. (BKK), Aerofoods
ACS Catering Service (CGK), LSG Sky Chefs Guam (GUM) and SATS Catering Pte. Ltd. (SIN).
(vi) Dependence on one or a few major customers and identify any such major customers
PAL has a large network of customers all over the world and is not dependent on one or a few major
customers.
(vii) Transactions with and/or dependence on related parties
The Company’s significant transactions with related parties are described in detail in Note 18 of the
Notes to Consolidated Financial Statements.
(viii) Patents, trademarks, licenses, franchises, concessions, royalty, agreements or labor
contracts, including duration;
PAL has a General Terms Agreement for Maintenance, Repair and Overhaul Services (GTA) with
Lufthansa Technik Philippines (LTP) covering its fleet of commercial aircraft. PAL's Aircraft
Engineering Department (AED) undertakes planning, monitoring and control of all maintenance
activities and technical compliance of aircraft, engines and accessories with airworthiness standards
and industry accepted standards for safety, reliability, and customer acceptability.
Man-hour rates for maintenance requirements are negotiated with LTP in accordance with the terms of
the GTA. Maintenance materials and parts are sourced from the original equipment manufacturers
which include Airbus Industrie, Boeing, General Electric, CFM International, Honeywell, Goodrich,
Nordam Singapore, Panasonic Aviation, Recaro Aircraft Seating, and Thales Avionics , among others.
The PAL Fleet is maintained in accordance with a Continuous Airworthiness Maintenance Program
(CAMP) that is approved by the Airworthiness Authorities (i.e. CAAP, FAA, IASA) and is based on
Aircraft Manufacturer’s / Original Equipment Manufacturer’s approved and recommended documents
and Airworthiness Authorities’ mandatory requirements. This ensures that PAL aircraft and equipment
are always in an airworthy condition, making them safe and reliable. AED established the General
Maintenance Manual (GMM) which describes the processes required to achieve the intent of the
CAMP, as required by the Airworthiness Authorities.
PAL subcontracts the maintenance of its aircraft to competent Maintenance Repair Organizations
(MRO), mostly to LTP for line, base, engine and component maintenance in the Philippines. Line
maintenance in overseas destination stations is subcontracted to other service providers. Nonetheless,
LTP and other service providers have to follow the requirements of PAL’s Maintenance Schedule and
GMM and AED exercises oversight responsibilities to ensure that this is done.
LTP and the other service providers have to follow the requirements of PAL’s Maintenance Schedule
and GMM and AED exercises oversight responsibilities to ensure compliance.
LTP’s responsibilities as PAL’s Maintenance, Repair and Overhaul service provider (MRO) include
10
the management and procurement of materials and spare parts and subcontracting service for
maintenance of certain types of PAL aircraft engines and most components. Heavy airframe
maintenance work is tendered to certified local or overseas vendors. These are done in accordance
with the PAL GMM and under AED oversight.
Engineering functions are mostly performed by AED with MRO related functions being handled by
LTP.
PAL also operates a small fleet of trainer aircraft that is managed by the PAL Aviation School.
Maintenance of these aircraft is performed by another MRO, Asian Aeronautics Services, Inc. (AASI).
PAL has a similar TSA with AASI was signed in November 2010. AED assists the Aviation School
in its oversight of the maintenance activities of the trainer fleet.
Development Plans
Despite the high fuel prices, and fierce competition from aggressive domestic carriers, PAL will
continue to focus its business activities on its key results areas, namely: product improvement, asset
and cost efficiency, business efficiency, and financial performance.
PAL will continue to look for other profitable markets and destinations, strengthen corporate accounts,
improve product and service offerings, and freshen up its communications campaigns. PAL will also
intensify its focus on the more stable higher yield traffic both on its international and domestic
networks.
To improve its financial position, the Airline will restructure operations and control cost without
compromising safety and customer satisfaction.
Franchise
PAL operates under a franchise, which extends up to the year 2034, granted by the Philippine
Government under Presidential Decree No. 1590. As provided for under the franchise, the Parent
Company is subject to:
a. corporate income tax based on net taxable income; or
b. franchise tax of 2% of the gross revenue derived from nontransport, domestic transport and
outgoing international transport operations, whichever is lower, in lieu of all other taxes, duties,
fees, and licenses of any kind, nature, or description, imposed by any municipal, city, provincial or
national authority or government agency, except real property tax.
As further provided for under its franchise, the Company can carry forward as a deduction from
taxable income, net loss incurred in any year up to five years following the year of such loss (see Note
23 of the Notes to the Consolidated Financial Statements). In addition, the payment of the principal,
interest, fees, and other charges on foreign loans obtained by the Company, and all rentals, interest,
fees and other charges paid by the Company to lessors for the lease of aircraft, engines, spares, other
flight or ground equipment, and other personal property are exempt from all taxes, including
withholding tax, provided that the liability for the payment of said taxes is assumed by the Company.
On May 24, 2005, the Expanded-Value Added Tax (E-VAT) law was signed as Republic Act (RA)
No. 9337 or the E-VAT Act of 2005. The E-VAT law took effect on November 1, 2005 following the
approval on October 19, 2005 of Revenue Regulation (RR) No. 16-2005 which provides for the
implementation of the rules of the E-VAT law. Under the provisions of RA No. 9337, the franchise
tax of the Company was abolished and the Company shall be subjected to the corporate income tax.
The Company remains exempt from any taxes, duties, royalties, registration license, and other fees and
11
charges, as may be provided by the Company’s franchise
ix) Need of any government approval of principal products or services
PAL’s operations are regulated by the Philippine Government through the Civil Aeronautics Board
(CAB) with regard to new routes, tariffs, and schedules; through the Civil Aviation Authority of the
Philippines (CAAP), formerly the Philippine Air Transport Office, for aircraft and operating
standards; and through airport authorities for airport slots. PAL also conforms to the standards and
requirements set by different foreign civil aviation authorities of countries where the airline operates.
In coordination with the different government air transport agencies - the CAAP and the Department
of Transportation and Communications (DOTC) - PAL initiates improvement programs for facilities
in the country's domestic and international airports to conform with international standards and
enhance safety of the Airline's operations. In particular, PAL is actively involved in and cooperating
with ongoing efforts by the government to address congestion problems at the Ninoy Aquino
International Airport. PAL is likewise cooperating with CAB, DOTC, and the Department of Industry
in efforts to better define and/or enhance passenger rights and protections.
x) Effects of existing or probable government regulations on the business
The U.S. Department of Transportation’s Federal Aviation Administration (FAA) had previously
assessed the CAAP in September 2002 and found it in compliance with the international safety
standards set by the International Civil Aviation Organization (ICAO). However, after consultation in
November 2007, the FAA determined that the Philippines was no longer overseeing the safety of its
airlines in accordance with international standards. The Philippines safety rating has been lowered
from Category 1 to Category 2 under the FAA’s International Aviation Safety Assessment program.
A Category 2 rating means a country either lacks laws or regulations necessary to oversee air carriers
in accordance with minimum international standards, or that civil aviation authority – equivalent to the
FAA – is deficient in one or more areas, such as technical expertise, trained personnel, record-keeping
or inspection procedures. This subpar ratings negatively affected PAL particularly on its planned flight
expansions. Because the country is in Category 2 status, PAL is prohibited from increasing its flights
to the U.S. and from changing the type or number of aircraft used in these services. Similarly, the
findings of ICAO Significant Safety Concern and the European Union Blacklist (E.U. Blacklist) show
that the CAAP does not meet minimum international aviation safety standards. Subject to the
exception noted below, airlines from countries under the E.U. Blacklist are completely prohibited from
operating commercial flights to/from Europe. Unlike FAA Category 2 - where airlines that already fly
to the U.S. at the time Category 2 is imposed are permitted to continue operating such flights under
enhanced FAA surveillance - an airline flying to/from Europe at the time its home country is placed on
the blacklist must cease all such flights unless the airline is able to obtain a specific exemption from
the E.U. that permits it to continue (or resume) such flights.
The Company strictly complies with and adheres to existing and probable government regulations.
xi) Estimate of the amount spent during each of the last three fiscal years on research and
development activities, and if applicable the extent to which the cost of such activities are borne
directly by customers;
NOT APPLICABLE
xii) Cost and effects of compliance with environmental laws
PAL has fully complied with the following major environmental laws:
1.
Republic Act (RA) 8749, the “Clean Air Act”.
12
Php 142,500 for the annual Stationary Source Emission Test for fifteen (15) generator sets
from Inflight Center (IFC), Maintenance Base Complex (MBC) and Data Center Building
(DCB)
2. DENR Administrative Order (AO) No. 34, the “Revised Water Usage and Classification”.
No cost to PAL for period covering FY2011-2012.
3. DENR Administrative Order No. 35, the “Revised Effluent Regulations of 1990”.
Cost: Php 60,843.16 annually for water quality analysis; approximately Php 1,200,000/annum
for electricity consumption for operation of the sewage treatment plant (STP); Php
720,000/annum for enzyme used to dissolve grease in the catering/kitchen area, control odor
and enhanced STP biological reaction.
4. Presidential Decree No. 1152, the “Philippine Environmental Code”.
No cost to PAL for period covering FY2011-2012.
5. Presidential Decree No. 1586, “Establishing an Environmental Impact Assessment System” and
DENR Administrative Order No. 96-37.
No cost to PAL. Certificate of Non-Coverage issued to Inflight Center (IFC), Maintenance
Base Complex (MBC) and Data Center Building (DCB)
6. Republic Act No. 6969, “Toxic and Hazardous Waste Management” and DENR Administrative
Order No. 90-29.
Cost: approximately Php 60,000 for disposal of busted fluorescent lamps.
7. Presidential Decree No. 1067, the “Water Code of the Philippines”.
Cost: Php 5,005.50 for renewal of annual Water Permit.
8. Republic Act 9003, the “Ecological Waste Management Act of 2000”.
No cost to PAL due to solid wastes with recyclable materials are segregated on-site , recycled
and properly disposed by an accredited service provider.
9.
Department of Health (DOH) Administrative Order 29, s. 1992, “License to Operate an Industrial
X-ray Facility”.
Cost: Php 6,400.00 permit application for eight (8) X-ray facilities nationwide (PAL Cargo
Terminal, Mactan-Cebu, Davao and General Santos Cargo Services).
The effects of PAL’s compliance with environmental laws are as follows:
1.
2.
3.
4.
5.
6.
Regulatory compliance;
Resource utilization;
Waste generation reduction;
Environmental cost reduction;
Improved public image and community relations;
Improved positive perception of regulators and non-governmental organizations (NGOs);
13
7. Enhancing the Airline’s commitment to continually improve its environmental performance in all
aspects of its operations;
8. Appreciation and recognition from the DENR for the company’s participation in Earth Day,
Environment Month and International Coastal Cleanup celebrations; and
9. Cost cutting through energy and resource conservation.
(xiii) Total number of employees and number of full time employees
The Company’s employees are only the 4 directors who are employed by the Company. The
Company does not have any plan of hiring employees within the ensuing twelve months.
PAL Employees :
As of March 31, 2012, PAL has a total workforce of 4,803 as follows:
Classification
Ground Employees
Philippine
Foreign
Flight Crew
Pilots
Cabin Crew
Number of Employees
2,488
226
463
1,626
PAL recognizes two local labor unions, one for the rank and file ground employees and another for the
cabin crew. In addition, it also recognizes foreign labor unions in the United States, Singapore, and
Japan.
PAL has 1,194 rank and file ground employees in the Philippines, United States, Singapore and Japan;
and 1,626 cabin crew who are covered by a collective bargaining agreement (CBA).
The 10 year moratorium on the PAL-PALEA CBA ended in September 2008, after which, PAL
reached an agreement with PALEA that any improvement on concerns/proposals on the CBA will be
discussed/implemented after October 2009. A new CBA is due for negotiation but this has not been
finalized due to intervening events (such as PAL’s losses due to the financial crisis and the spin-off
issue involving the outsourcing of the non-core airline functions for airport services, catering and
reservations), which PALEA elevated to the Court of Appeals after receiving unfavorable rulings from
the Department of Labor and Employment (DOLE) and the Office of the President. PAL maintains
that DOLE and the Office of the President were correct in its earlier rulings recognizing the planned
outsourcing of the non-core functions as a valid exercise of management prerogative and that any
CBA negotiation will eventually cover only those remaining employees not separated as a result of
the outsourcing. PALEA reacted by filing a Notice of Strike on the ground of unfair labor practice
(refusal to bargain) which was eventually certified by the Labor Secretary to the NLRC for
compulsory arbitration. The NLRC dismissed the certified case for lack of merit and the subsequent
motion for reconsideration filed by PALEA was denied.
The last PAL-FASAP CBA expired on July 13, 2005. Pending the final conclusion of the 2005-2010
PAL- FASAP CBA negotiations, PAL and FASAP had already agreed to resolve the first two (2)
years of the 2005-2010 PAL-FASAP CBA (July 14, 2005 – July15, 2007) by implementing economic
packages for the association’s members. When a deadlock in negotiations between PAL and FASAP
for the remaining three (3) years of their CBA ensued, DOLE assumed jurisdiction and ruled in favor
of FASAP by granting economic benefits and a higher compulsory retirement age for female cabin
attendants at 45 years old. PAL filed a motion for reconsideration arguing that the economic package
to be given FASAP be pegged at Php80 million and to fix the mandatory retirement age for cabin crew
at 45 years old. DOLE subsequently affirmed its earlier ruling with minor modifications. PAL elevated
14
the matter to the Court of Appeals where it is still pending resolution. On July 8, 2011, PAL
commenced preliminary talks with FASAP on the 2010-2015 PAL-FASAP CBA and subsequently,
submitted a CBA counter proposal covering the period July 16, 2010 to July 15, 2015. By way of
response, FASAP demanded from PAL a more reasonable proposal. Both parties are still in the
process of negotiations for a renewal of the CBA for the period 2010 to 2015.
Meanwhile, the CBA for PAL – International Association of Machinists and Aerospace Workers,
which covers employees in the United States, expired on June 30, 2011. Both parties are now in
the process of negotiations for the renewal of the CBA. PAL concluded its collective bargaining
agreement with the Singapore Manual And Mercantile Workers’ Union, which covers employees in
Singapore and will cover the period from January 1, 2012 to December 31, 2014. The CBA with the
Airline’s Labor Union – Japan expired on May 31, 2012 and PAL is in the process of renegotiating a
new CBA.
In FY 2011-2012, PAL gave its employees all benefit entitlements in accordance with stipulations in
the respective CBAs.
Major risk/s involved in each of the businesses of the Company and subsidiaries. and the
procedures being undertaken to identify, assess and manage such risks.
Investment risk – the Company has available-for-sale investment which has unpredictable
market prices.
Price risk- price fluctuations in cost of fuel which is based primarily in the international
price of crude oil. Substantial increases in fuel costs or the unavailability of sufficient
quantities of fuel is harmful to the business.
Regulatory risk – PAL is subject to extensive regulations which may restrict growth or
operations or increase their costs.
Competition - PAL is exposed to increased competition with major international and
regional airlines.
Security and safety risk - the impact of terrorist attacks on the airline industry severely
affects the overall air travel of passengers.
Financial market risk- fluctuations of interest and currency rates.
Economic slowdown – reduces the demand or need for air travel for both business and
leisure.
Procedures undertaken to manage risks
- PAL continues to comply with applicable statutes, rules and regulations pertaining to the
airline industry in order to maintain the required foreign and domestic governmental
authorizations needed for their operations.
- Increase in fuel cost and shortage in fuel can sometimes be offset by increase in
passenger fares or the curtailment of some scheduled services.
-Airlines have been required to adopt numerous additional security measures in an effort
to prevent any future terrorist attacks, and are required to comply with more rigorous
security guidelines.
15
- PAL sees to it that it has remain competitive in the areas of pricing, scheduling
(frequency and flight times), on-time performance, frequent flyer programs and other
services.
- Proper fund management and monitoring is being done to avoid the adverse effects in
the results of operations of the Company, cash flows and financial risks are managed to
provide adequate liquidity to the Company.
Item 2. Properties
The Company does not own any properties and equipments. It has an annual lease contract for its
office space with a monthly rental of P24,255. The lease contract was renewed for another two years,
which expires in May 2013. The Company has no plans of acquiring any property in the next twelve
months.
PAL’s properties and equipment include its aircraft fleet, various parcels of land, and buildings.
PAL’s fleet as of March 31, 2012 consists of:
Owned:
Airbus 340-300
Airbus 330-300
Bombardier DHC 8-400
Bombardier DHC 8-300
Under Finance Lease:
Boeing 747-400
Airbus 340-300
Airbus 330-300
Airbus 320-200
2
1
5
3
4
2
7
10
Under Operating Lease:
Boeing 747-400
Boeing 777-300-ER
Airbus 320-200
Airbus 319-100
Total
1
2
15
4
56
Aircraft covered by finance lease agreements that transfer substantially all the risks and give rights
equivalent to ownership are treated as if these had been purchased outright, and the corresponding
liabilities to the lessors, net of interest charges, are classified as obligations under finance leases
included under the caption long term obligations in the Consolidated Statements of Financial Position.
The finance leases provide for quarterly or semi-annual installments, generally ranging over 6 to 16
years including balloon payments for certain capital leases at the end of the lease term, at fixed rates
and/or floating interest rates based on certain margins over three-month or six-month London
Interbank Offered Rate (LIBOR), as applicable.
Aircraft covered by operating lease agreements contain terms ranging from 6 to 12.3 years. Total
operating lease payments amounted to US$ 89.7 million for 2012 and US$80.2 million for 2011.
Previously covered by finance lease agreements, PAL took ownership of one (1) Airbus 330-300
aircraft and two (2) Airbus 340-300 aircraft after exercising its purchase option. PAL also owns three
(3) Bombardier DHC 8-300 aircraft and five (5) Bombardier DHC 8-400 aircrafts which were dry
leased to Air Philippines Corporation (APC) commencing on October 2009 for a term of sixty (60)
months. Currently, there are eleven (11) eleven A320-200 aircraft subleased to APC with lease terms
16
ranging from sixty (60) to ninety (90) months.
PAL owns land and buildings located at various domestic and foreign stations.
A. Domestic Properties
1.
2.
3.
4.
5.
6.
7.
8.
9.
Bacoor, Cavite
Maasin, Iloilo City
Somerset Millennium Makati City
Malate
Ozamiz City
Quezon City
Bacolod City
Mandurriao, Iloilo City
Paranaque City
126 sq.m. (house and lot) & 212 sq.m. (parcel of land)
3,310 sq.m & 9,504 sq.m . (parcels of land)
39 sq.m. (condominium unit)
266.40 sq.m. (lot)
10,000 sq.m. (parcel of land)
627 sq.m. (parcel of land)
200,042 sq.m. (parcel of land)
1,300 sq.m. & 1,700 sq.m. (parcels of land)
375 sq.m. (parcel of land)
B. Foreign Properties
1.
2.
3.
4.
5,
6.
Glenn County, San Francisco, California
Hongkong
San Mateo, Daly City, California
Singapore
Singapore
Sydney, Australia
83 acres (walnut farm)
977 sq.ft & 3,701 sq.ft. (condominium units)
1,760 sq.ft. & 1,193 sq.ft. (condominium units)
85 sq.m.; 126 sq.m., and 68 sq.m. (office units)
65 sq.m. (shop unit)
177 sq.m. and 229 sq.m. (office units)
In addition, the Company owns cargo buildings located at the following domestic stations:
1.
2.
3.
4.
5.
6.
Zamboanga
Cebu
Puerto Princesa
Butuan
Kalibo
Legaspi
300 sq.m.
1,215 sq.m.
192 sq.m.
192 sq.m.
192 sq.m.
192 sq.m.
The land where these buildings are situated are leased from the CAAP.
PAL’s existing ground facilities service PAL’s own requirements and some of the requirements of
foreign airlines that fly to the Philippines. These major ground facilities as of March 31, 2012 are as
follows:
The PAL Learning Center (PLC) in Ermita, Manila is a modern training facility. The Center aims to
continue to provide world-class training to every employee regardless of area of specialization,
reinforce the culture of service, and develop every employee into a total PAL professional committed
to the Airline’s corporate values.
The facility serves as the home for the Airline’s Human Resource Training & Development SubDepartment, with the Airline’s six (6) training units, namely: Commercial Training & Development
Division, Flight Deck Crew Training Division, Inflight Services Training Division, Management &
People Development Division, Aviation School, External Training Administration & Logistics
Division.
Likewise, the PLC is the headquarters of PAL’s sales offices under the Office of the Country
Manager-Philippines, i.e., Passenger Sales Philippines, Agency Sales, Metro Manila and Luzon Sales
& Services, Corporate Sales Office, and the Ticket Office.
17
The PLC boasts of new and modern training equipment and facilities, such as thirteen (13) classrooms,
two (2) computer-based training (CBT) rooms; one (1) cockpit mock-up trainer (CMT) room as
follows: one (1) flight management system (FMS-747) and three (3) flight management guidance
system trainers (FMGS-Airbus); Frasca 172R simulator room; inflight service simulators for B747,
A340, B737 and cabin safety simulator; a grooming room, a speech laboratory for personality
development; and five (5) computer training rooms. Support facilities include an auditorium/
projection room, canteen and a medical clinic. The PLC building with a total floor area of 6,787.56
sq. m. is leased from the Tan Yan Kee Foundation.
The PAL Inflight Center (IFC) along MIAA Road corner Baltao St., Pasay City houses PAL’s
inflight kitchen which is capable of producing more than 3.6 million meals annually to service PAL’s
catering requirements.
PAL IFC has a total land area of 22,093.00 sq.m. of which 68% is allocated to Catering Services and
the remaining 32% for Cabin Services, warehouse and other offices. The land and the buildings are
leased from the Manila International Airport Authority (MIAA).
The modern NAIA Centennial Terminal 2 in Pasay City is where PAL’s entire flight operation is
housed in one (1) terminal for the first time since it was founded 71 years ago. This gives PAL a
genuine hub for its operations where passengers from domestic flights can connect seamlessly onto
international flights and vice versa.
The terminal boasts of complete facilities for PAL’s passengers’ comfort and convenience; two (2)
Mabuhay Lounges – one (1) each for domestic and international passengers, a big ticket office and
spacious check-in and pre-departure areas.
It is also the home of the Airport Operations Group and other support offices, i.e., Operations Control
Center, Aircraft Engineering Office, Flight Dispatch, Ticket Office, Treasury, Safety and Medical
Office.
Various airport support offices servicing PAL’s foreign airline customers were retained at the NAIA
Terminal 1 (NAIA 1), together with the Sampaguita Lounge.
The areas are leased from MIAA.
The PAL Cargo Terminal (PCT) near NAIA 1 in Pasay City which houses PAL’s domestic and
international cargo operations and sales offices at the NAIA measures 5,727.55 sq.m.(warehouse) and
1,050.88 sq.m. (office space). The land on which it stands is leased from the MIAA.
PAL’s Data Center Building (DCB) along Airport Road, Pasay City is the core of one of the most
extensive computer systems in the Philippines. It houses two (2) Mainframe Computers, one hundred
twenty (120) Unix systems, and PC servers. These equipment run sophisticated systems like the
Airline’s Reservations and Departure Control used in the daily operation of the Airline. The DCB is
also the center of applications development and maintenance, housing close to one hundred sixteen
(116) analysts and programmers. It is the hub of PAL’s domestic network, connecting the various
PAL ticket offices and airports. The DCB, comprising 3,588.35 sq.m., is likewise leased from MIAA.
Other major ground facilities include a Maintenance Base Complex (MBC) in Nichols, Pasay City. It
is composed of the North and South sectors which refer to the areas north and south of Andrews
Avenue, respectively. It covers an area of 104,531.87 sq.m. (open) and 1,768.01 sq.m. (covered)
leased from MIAA. It also covers a Local Area Network (LAN) and Wide Area Network (WAN) that
links together all of PAL’s domestic on-line and office stations as well as the other major offices in
Metro Manila.
18
MBC houses the Operations Group. Other facilities located in the MBC include Flight Operations and
the Flight Simulator Building, Aircraft Engineering, Quality Safety and Security, Communications
Operations, Fuel Management, Employee Benefits, Medical, Sports Complex, Corporate Logistics &
Services, Operations Accounting, Ground Property, Material Sales Management, Comat Handling, ,
Ground Equipment Management, Communications Maintenance, Network Management & Telecom
System, Construction and Facilities Management, , General Materials Warehouse, Central Finance
Records Warehouse, Aircraft Records Warehouse and other support offices. MBC also houses the K9 Kennel Facility.
PAL’s head office is located at the PNB Financial Center along President Macapagal Avenue, Pasay
City. It houses the Executive Offices, Commercial Group, Finance Group, Legal, Corporate
Secretary’s Office, Human Resources, Corporate Audit, Corporate Communications, Consular Affairs,
Government Relations, Domestic and International Ticket Offices, Facilities Management Division,
Satellite Office and Security Office of PAL. The total area being leased from Philippine National
Bank is 15,080.08 sq.m.
Item 3. Legal Proceedings
PAL is currently being investigated by the U.S. Department of Justice based in Washington D.C. for
possible violation of U.S. Anti-trust laws for both passenger and cargo services covering the period
January 1, 1999 to July 11, 2007. PAL is also a defendant in a case entitled In re Transpacific Air
Transportation Antitrust Litigation, a putative class action also for possible violation of U.S. Anti-trust
laws brought before the Northern District of California against air carriers operating passenger air
services to and from the U.S. Possible violations of U.S. Anti-trust laws may result in the imposition
of fines over Php 4,293.4 million or imprisonment not exceeding 10 years or both.
Similarly, PAL is also currently being investigated by the Competition Bureau of Canada for possible
violation of Canadian Anti-trust laws for passenger services which may carry fines not more than
PHP 440.8 million or imprisonment or both. Through a written notification dated April 25, 2012, the
Competition Bureau of Canada formally advised PAL that it was discontinuing the inquiry.
PAL is a petitioner in various cases pending before the Court of Tax Appeals (CTA) for the refund of
excise taxes paid by PAL under protest in connection with its importation of aviation fuel and
commissary items used for operations, involving the total amount of Php 3,091.9 million and Php
111.0 million, respectively. In its Decisions promulgated on April 17, 2012 and May 18, 2012, the
CTA has ordered the refund to PAL excise taxes involving importation of commissary items from July
2005 to February 2006 and October 2006 amounting to Php 4.6 million. The BIR is expected to appeal
the Decisions to the CTA En Banc, and ultimately to the Supreme Court, if denied by the CTA En
Banc.
There were deficiency Minimum Corporate Income Tax (MCIT) and Expanded Withholding Tax
(EWT) assessments amounting to PHP1,420.8 million that were already decided by the CTA in favor
of the Company. Except for an MCIT deficiency assessment amounting to Php 326.8 million
pertaining to March 2000, the foregoing deficiency assessments were already ordered cancelled and
withdrawn with finality by the Supreme Court.
Except for the foregoing, PAL or any of its subsidiaries or affiliates is not involved in, nor any of its
properties the subject of any legal proceeding and has no knowledge of any contemplated proceeding
by any government authority involving an amount exceeding PHP1,343.5 million (10% of its total
current assets) for fiscal year ended March 31, 2012.
19
Item 4. Submission of Matters to a Vote of Security Holders
There were no matters submitted to a vote of security holders during the fourth quarter of the fiscal
year ended March 31, 2012.
PART II - OPERATIONAL AND FINANCIAL INFORMATION
Item 5. Market for Registrant’s Common Equity and Related Stockholder Matters
a. Market Price of and Dividends on Registrant’s Common Equity and Related Stockholder
Matters
1. Market Information
The market for the registrant’s common equity is the Philippine Stock Exchange. The
high and low sales prices for each quarter for the past three years are as follows:
2012
Second Quarter
First Quarter
2011
Fourth Quarter
Third Quarter
Second Quarter
First Quarter
2010
Fourth Quarter
Third Quarter
Second Quarter
First Quarter
HIGH
Php
8.58
8.28
LOW
Php
7.05
6.80
7.43
7.15
5.65
7.94
5.85
4.60
4.49
4.00
5.65
5.60
3.10
3.70
3.90
3.00
2.65
2.70
As of July 16, 2012, the latest practicable trading date, PAL Holdings’ was traded at
P 7.38.
2. Holders
The number of shareholders of record as of June 30, 2012, was 6,745 and common shares
outstanding as of the same date were 5,421,512,096.
The top 20 stockholders as of June 30, 2012 are as follows:
20
1
2
3
4
5
6
7
8
9
10
11
12
13
14
15
16
17
18
19
20
Stockholders’ Name
Trustmark Holdings Corp.
Pan Asia Securities Corp.
Wonderoad Corporation
Abacus Securities Corp.
COL Financial Group, Inc.
Emmanuel P. Te
Lucky Securities, Inc.
BPI Securities Corp.
Ansaldo, Godinez & Co., Inc
Tower Securities, Inc.
Triton Securities Corp.
B.H. Chua Securities Corp.
Evergreen Stock Brokerage & Sec., Inc.
Eastern Securities Development Corp.
Mandarin Securities Corp.
Angping & Associates Securities, Inc.
Luys Securities Company, Inc.
R. Coyiuto Securities, Inc.
Accord Capital Equities Corp.
R. S. Lim & Company, Inc.
No. of Shares Held
5,297,280,230
36,943,576
10,251,679
8,130,534
5,829,761
5,000,000
2,519,574
1,878,652
1,791,095
1,550,408
1,254,561
1,233,460
1,207,204
961,732
923,907
922,922
901,178
821,675
794,044
765,000
% to Total
97.7075%
0.6814%
0.1891%
0.1500%
0.1075%
0.0922%
0.0465%
0.0347%
0.0330%
0.0286%
0.0231%
0.0228%
0.0223%
0.0177%
0.0170%
0.0170%
0.0166%
0.0152%
0.0146%
0.0141%
* The Company has no preferred shares.
1. Dividends
a.) The Company did not declare any cash dividends during the past three (3) years in the
period ended March 31, 2012. The Board of Directors may declare dividends only from
the surplus profits arising from the business of the Company and in accordance with the
preferences constituted in favor of preferred stock when and if such preferred stock be
issued and outstanding.
b.) There are no other restrictions that limit the ability to pay dividends on common equity
or that are likely to do so in the future.
2. Recent Sales of Unregistered or Exempt Securities, Including Recent Issuance of Securities
Constituting an Exempt Transaction (for the past three years)
On 22 January 2007, the Company issued 5,021,567,685 new shares to Trustmark
Holdings Corporation (Trustmark) as subscription to the increase in capital pursuant to a
debt-to equity transaction.
On 01 March 2007 the Securities and Exchange Commission confirmed that the issuance
of these new shares to Trustmark is exempt from the registration requirements of Section
8 of SRC.
Item 6. Management’s Discussion and Analysis (MDA)
Restatement to Philippine Peso
In line with the adoption of PAS 21, The Effects of Changes in Foreign Currency Rates, PAL
determined that its functional currency is the US dollar. On May 20, 2005, the Philippine Securities
and Exchange Commission approved PAL’s use its functional currency, the US dollar, as its
presentation currency. Accordingly, effective April 1, 2005, PAL proceeded in measuring its results of
21
operations and financial position in US dollar.
Since the functional and presentation currency of the Company is in Philippine peso, for purposes of
combination of the financial statements in accordance with PAS 27, Consolidated and Separate
Financial Statements, there is a need for PAL and its subsidiaries to restate its financial statements to
the Philippine peso.
Consolidation
The consolidated financial statements referred to consist of the financial statements of the Company
and its subsidiaries. The financial statements of the subsidiaries are prepared as of March 31 of each
year using consistent accounting policies as those of the Company. Companies included in the
consolidation are PAL and PR Holdings, Inc. As a result of the restructuring in fiscal year 2008 (see
note 2 of the consolidated financial statements), the Company still owns 84.67% of PAL, through a
direct ownership in 81.57% of PAL’s shares and an indirect ownership in 3.10% of PAL’s shares
through an 82.33% direct ownership in PR. Subsidiaries are consolidated from the date on which
control is transferred to the Company and cease to be consolidated from the date on which control is
transferred out of the Company. All intercompany accounts and transactions with subsidiaries are
eliminated in full.
Results of Operations
a.) FY 2012 vs FY 2011
For the fiscal year ended March 31, 2012, PAL Holdings’ showed a total comprehensive loss of Php
4,379.3 million, a significant decline from the total comprehensive income of Php 3,098.1 million of
the same period last year.
Total revenues for the current fiscal year totaled Php 74,053.1 million down by Php 554.2 million or
0.7% lower than last year’s same period figure of Php 74,607.3 million. The decrease in total revenues
was primarily brought about by the effect of the appreciation of the Philippine peso versus the US
dollar in converting the US dollar based figures to Philippine peso from an average rate of Php 44.54
per US$1.00 in 2011 to Php 43.12 per US$1.00 in 2012. Had there been no change in the exchange
rate, total revenues would be up by Php 1,893.0 million, attributable mainly to the increase in
passenger revenues as a result of higher yields generated from passenger seat offerings. Cargo
revenues on the other hand, dropped by Php 536.9 million over the same period last year as a result of
the decrease in cargo traffic. Revenues also include lease income arising from aircraft operating lease
arrangements with an entity under common control.
Total expenses rose by 11% or Php 7,819.7 million from a total of Php 71,567.8 million in FY 2011
to Php 79,387.5 million in FY2012. This was primarily due to higher expenses related to flying
operations, aircraft & traffic servicing, passenger service, maintenance, general & administrative
expenses and other operating charges offset by the reduction in financing charges.
The increase in flying operations by 16% was attributable mainly to higher fuel expenses and aircraft
lease rentals. Fuel, which remains to be the airline’s biggest operating expense, registered a 21.3%
increase over last year’s figure of Php 27,468.3 million. The increase was a result of the escalation in
jet fuel prices per barrel from an average of US$ 102.89 in 2011 to US$ 132.97 in 2012. Likewise,
the delivery of five (5) A320-200 aircraft subleased to an entity under common control in part had
the effect of decreasing aircraft lease charges by Php 1,495.8 million.
More international flights operated in 2012 contributed to the upward movement in Aircraft and
Traffic Servicing expenses by Php 317.7 million or 3% above the fiscal year 2011 figure of Php
9,324.5 million.
22
Growth in passenger traffic particularly on international flights operated had the effect of increasing
expenses related to passenger service to Php 5,295.4 million or 8%.
Higher aircraft, engine and component repair costs incurred during the current fiscal year increased the
maintenance cost by 2% to Php 8,900.2 million.
Costs incurred for the country to regain full compliance with International Aviation Safety Standards
as well as fees incurred related to certain loans contributed mainly to the increase in general &
administrative expenses by Php 220.2 million or 8.4% from the year ago’s figure of Php 2,646.0
million.
In the current fiscal year, the Company incurred “Other Expenses” of Php 303.7 million versus “Other
Income” of Php 384.7 million recognized during the last fiscal year. The reduction in income by Php
688.4 million was accounted for primarily by lower unrealized gains resulting from changes in the
fair valuation of outstanding derivative instruments which did not qualify for hedge accounting. The
decrease in other income, also, was brought about by the derecognition of accrued interest on related
finance lease agreements with entities under common control pertaining to three (3) Airbus 330-300
aircraft and net reversal of provisions on probable claims and other litigations. These, coupled with
the recognition of income from the sale of PAL’s Greenbelt property in 2011 likewise contributed to
the decrease in other income.
Debt servicing of various long term obligations resulted in lower financing charges of Php 295.8
million or a reduction of 18%.
The reassessment done on deferred tax assets and liabilities on all deductible temporary differences in
accordance with PAS 12, Income Taxes during the current fiscal year , resulted in the recognition of a
net income tax benefit of Php 1,045.6 million.
“Other Comprehensive Income” account dropped by 186% as compared with the previous year’s same
period total of Php 105.2 million. This was principally on account of the change in profile in the
Company’s fuel derivative instruments. Currently, there are no fuel derivative instruments that are
designated as cash flow hedges. All unrealized gains or losses resulting from changes in the fair
valuation of these derivative instruments are recognized directly under “Other Expenses” in the
Statement of Comprehensive Income. Revaluation increment in property arising from results of an
updated appraisal increase in 2011 likewise, had the effect of decreasing Öther Comprehensive
Income” account.
b.) FY 2011 vs FY 2010
PAL Holdings’ consolidated financial statements for the fiscal year ended March 31, 2011, showed a
total comprehensive income of Php 3,098.1 million, a significant turnaround from the previous fiscal
year’s total comprehensive loss of Php 862.9 million.
Total revenues for the current fiscal year amounted to Php 74,607.3 million, up by 16% over last
year’s same period figure of Php 64,087.8 million. The increase in revenues was attributable mainly
to higher passenger and cargo revenues earned during the period. Passenger and cargo traffic grew by
12% and 42% respectively over the same period the year before. An improvement by 9% in yields
generated from passenger seat offerings complemented the boost in passenger traffic. Revenues also
include lease income arising from aircraft operating lease arrangements with an entity under common
control, excess baggage revenues and ancillary revenues generated mainly from other passenger
transport services and charters.
23
Total expenses amounted to Php 71,567.8 million or an increase of 12% over last year’s same period
total of Php 63,689.3 million. This was primarily due to higher expenses related to flying operations,
aircraft & traffic servicing. reservation & sales, and passenger service offset in part by the decrease in
maintenance, and financing charges. Reduction in other income, likewise contributed to the increase in
expenses.
The increase in flying operations expenses by 15% was attributable mainly to higher fuel expenses
and aircraft lease rentals. Fuel costs grew 23% as a result of the significant rise in jet fuel prices per
barrel from an average of US$ 86.94 in 2010 to US$ 102.89 in 2011. The phase in of two (2) Boeing
777-300ER aircraft in November 2009 and January 2010 and of four (4) A320-200 aircraft in
September, October and November 2010 had the effect of increasing aircraft lease charges by Php
1,038.6 million.
Other direct operating expenses incurred in the transport of passengers and cargo such as landing and
take off fees and ground handling charges included under Aircraft and Traffic Servicing expenses rose
by 4.1% as a result of more international flights operated in 2011.
The growth in the volume of passenger traffic as well as in the number of flights operated in the
airline’s international operations, had the effect of increasing expenses related to reservation and
sales by 13%.
Maintenance expenses decreased by 19% as a result of lower aircraft, component and engine repair
costs incurred during the current period.
Debt servicing of various long term obligations resulted in lower financing charges by 35%.
Others-net decreased by 92%. The reduction was brought about mainly by lower unrealized gain
recognized in the current period resulting from changes in the fair valuation of outstanding derivative
instruments which did not qualify for hedge accounting. Further, in 2011, PAL also recognized
impairment losses for certain investment properties in accordance with the results of its recently
concluded property appraisal. These, coupled with the effect of the one time gain on debt buyback of
certain unsecured claims, realized in 2010, contributed to the decrease in Others-net.
As of the fiscal year ended March 2011, the Group recognized “Other Comprehensive Income” of Php
105.2 million compared with a Php1,050.1 million “Other Comprehensive Loss” in 2010. This
improvement in the account was prompted by the reduction in net changes in fair values of
outstanding fuel hedges recognized in equity as well as the increase in carrying values of certain
ground properties, net of the related deferred income tax, following the latest appraisal report as of
March 31, 2011.
Financial Condition
FY 2012 vs FY2011
As of March 31, 2012 PAL Holdings’ total consolidated assets amounted to Php 71,783.9 million,
lower by 1% from the March 31, 2011 balance of Php 72,565.4 million . The variance was mainly
attributable to the effect of the appreciation of the Philippine peso vis a vis the US dollar from Php
43.408 per US$ 1.00 in 2011 to Php 42.934 per US$ 1.00 in 2012. Had there been no change in the
exchange rate, the total consolidated assets balance would be slightly higher.
The increase in total current assets by Php 31.5million from the March 31, 2011 figure of Php
13,403.2 million was due in part to the increase in the receivables balance by 34% as a result of
higher ticket and cargo airway bill sales. These increases, however, were partly reduced by the
decrease in cash & cash equivalents by 34% due to servicing of debts and effect of lower cash
24
earnings generated from operations. Lower fuel inventory, likewise had the effect of decreasing the
expendable parts, fuel, materials & supplies balance by 10%.
Total noncurrent assets on the other hand, decreased by Php 813.0 million over the balance as of
March 31, 2011 of Php 58,349.2 million. The difference was mainly the result of the reduction in
other non current assets by 35% brought about by the reclassification of aircraft lease deposits as part
of the cost of the aircraft for three (3) Airbus 330-300 aircrafts thereby recognizing the related
depreciation expense, and derecognition of corresponding accrued interest on lease deposits. This
was offset in part by the additional standby letters of credit which serve as security deposits for
various aircraft under operating leases. This was further countered by the increase in property and
equipment by Php 640.7 million brought about by the aforementioned reclassification and increase in
deferred tax assets of Php 1,072.5 million or 130% resulting from the company’s reassessment of its
deferred tax position as of March 31, 2012.
Total liabilities rose to Php 70,777.8 million, from the March 31, 2011 balance of Php 67,188.4
million or 5%. This was attributable mainly to availment of various loans for working capital purposes
as well as to finance aircraft and aircraft related acquisitions thus increasing notes payable by 7% and
long-term obligations by 12%. These were offset in part by payments made for other existing loans
which resulted to the decrease in current portion of long-term obligations by 15%.
As of March 31, 2012, the Company’s stockholders’ equity balance amounted to Php 1,006.0 million,
down by 81% from the March 31, 2011 balance of Php 5,377.0 million. The decrease was brought
about mainly by the net loss recognized during the current fiscal year which increased deficit by 25%.
FY 2011 vs FY 2010
As of March 31, 2011 the Group’s consolidated total assets amounted to Php 72,565.4 million. A
decrease of 5% from the March 31, 2010 balance of Php 76,755.8 million.
The difference was on account of the downward movement in total noncurrent assets by 8% offset in
part by the increase in “Total Current Assets” by 9%.
The reduction in “Total Noncurrent Assets” was attributable mainly to the decrease in property and
equipment by 11% due to the depreciation expense recognized during the period, which had the effect
of reducing the carrying values of the assets. This was offset partly by the additional revaluation
increase on certain properties as a result of the valuation performed by an independent appraiser as of
March 31, 2011. Investment properties decreased by 40% due to the impairment losses recognized
on certain properties in accordance with the updated appraisal report as of March 31, 2011. “Other
Noncurrent Assets” increased by 65.4% mainly on account of additional collaterals required under
operating lease agreements for certain aircraft as well as for an ongoing case under litigation.
Total current assets increased by 9.4% from the March 31, 2010 figure of Php 12,246.6 million due in
part to the increase in cash and cash equivalents by 34% as a result of higher net earnings generated
from operations. Higher fuel inventory had the effect of increasing the expendable parts, fuel,
materials & supplies balance to Php P1,771.9 million, a 43.5% increase over the March 31, 2010
figure of Php 1,234.5 million.
Total liabilities decreased by 10%. This was attributable mainly to the decrease in the Group’s long
term obligations due to the principal payments made on various loans as well as the effect of payment
on unsecured claims.
As of March 31, 2011, the Group’s stockholders’ equity balance amounted to Php 5,377.0 million, up
by 217% from the March 31, 2010 balance of Php 1,695.5 million. The increase was brought about
mainly by the net income recognized during the current fiscal year.
25
TOP FIVE KEY PERFORMANCE INDICATORS OF PAL
Mission Statement
Key Performance Indicator
Measurement Methodology
To maintain aircraft with the Aircraft Maintenance Check
highest degree of airworthiness, Completion
reliability and presentability in
the most cost-effective manner
Number of checks performed
less number of maintenance
delays over number of checks
performed
To conduct & maintain safe, Number of aircraft related
reliable, cost & effective flight accidents/incidents
operations
By occurrence and
monitoring by Flight
Operations Safety Office
To achieve On-Time Performance Percentage Deviation from
on all flights operated
Industry Standards (OTP
Participation)
Number of flights operated
less number of flights delayed
over total flights operated
To provide safe, on time, quality Number of safety violations
and cost effective inflight service incurred by cabin crew
for total passenger satisfaction
Number of incidents of safety
violation incurred by cabin
crew per month
To maximize revenue generation Net Revenues generated from
in passenger and cargo sales passengers and cargoes carried
through increased yields by
diversifying market segments and
efficient management of seat
inventory and cargo space
Percentage Deviation from
Budget/Forecasted Revenues
26
In addition to the Qualitative Key Performance Indicators of PAL, the following comprise its
Quantitative Financial Ratios:
03/31/12
03/31/11
(5.96%)
4.03%
(5.50%)
4.81%
10.08
12.04
36.20
30.32
(2.90)
2.83
Profitability Factors:
1. Return on Total Assets
Net Income (loss)/Average Total Assets
2. Percentage of Operating Income
Operating Income (loss)/Total Revenues
Asset Management:
3. Receivable Turnover
Net Sales/Average Trade Receivables
4. Number of Days Sales in Receivables
( General Traffic)
# of Days in a year/Receivable turnover
Financial Leverage:
5. Interest Coverage Ratio
Earnings before interest & taxes/Interest Charges
Other than those that have already been disclosed, there are no known trends, demands, commitments,
events or uncertainties that may have a material impact on the Group’s liquidity.
i. On July 22, 2008, the Supreme Court rendered an adverse decision in the case entitled “Flight
Attendants and Stewards Association of the Philippines (FASAP) vs. the Philippine Airlines” ordering
PAL to reinstate the retrenched FASAP members and pay back wages inclusive of allowances and
other monetary benefits plus 10% attorney’s fees. PAL filed a motion for reconsideration. On October
2, 2009, the motion for reconsideration was denied with finality and affirmed the July 22, 2008
decision with modification in that the award of attorney’s fees and expenses of litigation is reduced to
Php 2.0 million. On November 3, 2009, PAL filed a second motion for reconsideration. On
September 7, 2011, the Supreme Court issued a resolution denying with finality PAL’s second motion
for reconsideration. On October 4, 2011, the Supreme Court issued an En Banc resolution recalling
the September 7, 2011 resolution and for the Supreme Court En Banc to take cognizance of the case.
To date, PAL is still awaiting the En Banc decision of the Supreme Court.
On September 9, 2010 FASAP filed a Notice of Strike for alleged Unfair Labor Practice on the
grounds of PAL’s refusal to submit counter proposal and/or conclude the remaining term of
2005-2010 CBA, address age and gender discrimination , salary increase & rice subsidy . Attempts by
the National Conciliation and Mediation Board (NCMB) to amicably settle the labor dispute failed.
Thus, on October 6, 2010 the DOLE Secretary assumed jurisdiction over the labor dispute and
directed the parties to submit their respective position papers and other pleadings.
On December 23, 2010, the DOLE issued a Decision in favor of FASAP granting salary increase and
monthly rice allowance for the period July 16, 2007 to July 15, 2010 and higher compulsory
retirement from 45 to 60 years old. On April 1, 2011 DOLE Secretary issued a Decision on the PAL’s
27
Motion for Partial Reconsideration and Motion for Clarification. The DOLE Secretary affirmed with
modification the December 23, 2010 DOLE Decision in that the award of monthly rice allowance for
the first year of the CBA effective July 16, 2007 was reduced from Php 1,800 to Php 1,500. PAL was
also directed to reinstate nine (9) flight pursers who were retired at age 55 during the pendency of the
case and to pay them full back wages and benefits. The nine (9) flight pursers who were retired at age
55 were reinstated and those active cabin attendants due for retirement at age 55 were allowed to
continue until age 60 without prejudice to further or other legal action on the issue. On May 17, 2011
PAL elevated the case to the CA via a Petition for Certiorari with prayer for issuance of a Temporary
Restraining Order and Preliminary Mandatory Injunction. To date, the Petition is pending resolution
before the CA.
In the interim, mediation conferences were called by the DOLE Secretary on the reinstatement aspect
for decision and other undisputed matters. On June 27, 2011 PAL agreed to pay the retro and
prospective rice allowance starting July 16, 2011; to issue the guidelines in crediting pregnancy and
maternity leave in the length of service of cabin attendants as well as in the computation of related
Company benefits and to commence preliminary talks on the 2010-2015 CBA negotiation on July
2011. On August 23, 2011, PAL agreed to release the back wages for one year specifically July 16,
2007 to July 15, 2008 at the end of September 2011. On August 31, 2011, without prejudice to the
petition pending before the CA, PAL made the following commitments before the DOLE as follows:
1.) backwages from July 16, 2008 to July 15, 2009 will be released at the end of October 2011 and
2.) backwages from July 16, 2009 to July 15, 2010 will be distributed at the end of November 2011.
On September 21, 2011, FASAP requested for the release of back wages for the period July 16, 2010
up to the present including the add-on benefits. On October 3, 2011, PAL manifested during the
conciliation conference before the DOLE to release on or before December 31, 2011 the adjustments
on the cabin attendants’ respective salary increases based on the December 23, 2010 decision of
DOLE. On December 21, 2011, PAL manifested before DOLE seeking a rescheduling of the
payment. FASAP agreed to the request for rescheduling of payment as follows: January 6, 2012 release of back wages equivalent to seven (7) months; March 2012 and May 2012 - release of the
remaining 13.5 months at 50% per release not later than the end of each month. As of June 26, 2012,
the total backwages for the period July 16, 2010 up to December 31, 2011 were already paid. Effective
January 2012, cabin attendants’ salaries have been adjusted to the level based on the December 23,
2010 DOLE Decision.
PAL also agreed to release the back wages of the thirteen (13) reinstated flight pursers who were
retired/resigned after December 23, 2010. On March 12, 2012 DOLE issued an Order granting with
qualification FASAP’s motion for issuance of writ of execution. The writ shall cover only the
reinstatement of FASAP members who were retired at ages 45 and 55 starting July 16, 2007, subject
to the grooming standards under the CBA and for as long as they have not yet reached the age of 60.
Further, they are entitled to adjusted back salaries and other incidental benefits in accordance with the
December 23, 2010 and April 1, 2011 DOLE Decisions, subject to offsetting of retirement benefits
already received. Accordingly, PAL moved for reconsideration of the March 12, 2012 DOLE Order.
On March 22, 2012, PAL filed before the CA a Manifestation and Urgent Motion reiterating the
prayer for the issuance of a temporary restraining order/writ of preliminary injunction. On June 11,
2012 FASAP filed a Supplement to their Motion for Issuance of Writ of Execution seeking the
enforcement of the March 12, 2012 DOLE Order.
In April 2010, PAL released a memorandum informing its employees and the general public of its plan
to spin-off/outsource PAL’s non-core airline functions for inflight catering, airport services and call
center reservations operations. Members of the employees’ union lobbied for reconsideration to the
DOLE. On June 15, 2010, PAL received a favorable decision from the DOLE confirming the legality
of the said spin-off/outsourcing program. On October 29, 2010, DOLE affirmed its earlier ruling on
PAL’s right to spin-off/outsource its Inflight Catering, Airport Services and Call Center operations.
On December 15, 2010, the Office of the President assumed jurisdiction over the PAL-PALEA labor
dispute. Accordingly, PALEA’s Petition for Presidential Intervention, the Labor Secretary’s Orders
28
dated June 15, 2010 and October 29, 2010 as well as all matters relating to the PAL-PALEA labor
dispute were deemed submitted to the jurisdiction of the Office of the President. On March 25, 2011,
PAL received a copy of the decision of the Office of the President of the Philippines affirming the
October 29 , 2011 order of the DOLE Secretary with the modification increasing the additional
gratuity from fifty thousand pesos (Php 50,000.00) to one hundred thousand (Php100,000.00). On
April 12, 2011, PALEA filed a motion for reconsideration. On August 11, 2011 the Office of the
President issued a resolution denying the motion for reconsideration of PALEA and reaffirming its
March 25, 2011 decision upholding the validity of PAL’s spin-off/outsourcing program. On August
24, 2011, notices of separation were sent to the affected employees of in-flight catering, airport
services and call center reservations operations. On October 1, 2011, PAL implemented the spinoff/outsourcing program and the workers of the outsourced operations ceased to be PAL employees.
On October 14, 2011, PAL commenced the release of the separation package of affected workers.
In April 2012, San Miguel Equity Investments Inc. (SMEII), a wholly owned subsidiary of San Miguel
Corporation, acquired 49% equity interest in Trustmark Holdings Corporation (Trustmark).
Trustmark owns 97.71% of PAL Holdings, Inc. (PHI), which in turn beneficially owns (directly and
indirectly, thru PR Holdings, Inc.) 84.67% of PAL. In May and June 2012, the proceeds from the
investment of SMEII to Trustmark flowed down to PAL with the subscription by Trustmark of 17
billion shares in PHI for Php 17 billion and subsequently, the subscription by PHI of 85 billion shares
in PAL for Php 17 billion with the requisite applications for the increase in the authorized capital stock
of PHI and PAL to be accordingly filed with the Securities and Exchange Commission (SEC) to fully
implement such flow down of funds.
Currently, there are other ongoing legal proceedings involving PAL (refer to Legal Proceedings on
page 19). Other than this, there are no known events that will trigger direct or contingent financial
obligation that is material to the Group, including any default or acceleration of an obligation.
ii. There are no known material off-balance sheet transactions, arrangements, obligations (including
contingent obligations), and other relationships of the Company with unconsolidated entities or other
persons created during the reporting period.
iii. Commitments for capital expenditures
On October 30, 2006, PAL finalized a Purchase Agreement with Boeing wherein PAL placed a firm
order for two Boeing 777-300ER aircrafts for delivery in fiscal year 2010 to fiscal year 2011 and
purchase rights for two (2) additional aircraft.
In May 2007, PAL finalized a supplemental agreement with Boeing relating to its exercise of purchase
rights for two (2) Boeing 777-300ER aircraft for delivery in fiscal year 2012. On June 2, 2009, PAL
and Boeing agreed to reschedule the deliveries of four (4) Boeing 777-300ER aircrafts from their
original delivery schedules of fiscal year 2010, 2011 and 2012 to fiscal years 2013 and 2014. On June
20, 2012, PAL took delivery of the first of four (4) Boeing 777-300ER aircrafts.
On May 28, 2011, PAL signed operating lease agreements for the lease of two (2) Airbus A320-200
aircrafts which PAL took delivery in March and May 2012. In November 2011, PAL entered into
operating lease agreements for the lease of additional two (2) Airbus 320-200 aircrafts for delivery in
October and November 2012.
iv. There are no known trends, events or uncertainties that have had or that are reasonably expected to
have material favorable or unfavorable impact on net sales or revenues or income from continuing
operations.
v .There are no significant element of income that did not arise from continuing operations.
29
vi. The causes for any material change from period to period which shall include vertical and
horizontal analyses of any material item:
Results of our Horizontal (H) and Vertical (V) analyses showed the following material
changes:
1.
2.
3.
4.
5.
6.
7.
8.
9.
10.
11.
12.
13.
14.
15.
16.
17.
18.
19.
20.
21.
22.
23.
Cash and cash equivalents- H- (34%)
Receivables-net- H- 34%
Expendable parts, fuel, materials & supplies- H- (10%)
Available-for-sale- investment- H– (7%)
Deferred tax assets- H- 130%
Other non-current assets- H- (35%)
Notes payable- H- 7%
Current portion of long-term obligations- H- (15%)
Accounts payable- H- 22%
Accrued liabilities- H- 8%
Due to related parties- H- (100%)
Unearned transportation revenue- H- 25%
Long-term obligations- net of current portion- H- 12%
Accrued employee benefits- H- (8%)
Reserves and other noncurrent liabilities- H- (40%)
Deficit- H- 25%
Minority interest- H- (83%)
Expenses – H- 11%
Income before income tax- H- (276%)
Provision for income tax- H- (2343%)
Net income- H- (243%) V- (10%)
Total Other Comprehensive income- H- (186%)
Total Comprehensive income- H- (241%) V- (10%)
All of these material changes were explained in the management’s discussion and analysis of
financial condition and results of operations stated above.
PAL experiences a peak in holiday travel during the months of January, April, May, June and
December.
B. Information on Independent Accountant and other Related Matters
(1) External Audit Fees and Services
a.
Audit and Audit-Related Fees
a. The audit of the Company’s annual financial statements or services that are normally
provided by the external auditor in connection with statutory and regulatory filings or
engagements for 2012 and 2011.
Yr. 2012 - Estimated at Php 500,000 exclusive of out-of-pocket expenses for the audit of
2012 financial statements.
Yr.2011 - Php 577,142 audit fee and out-of-pocket expenses for the audit of 2011 financial
statements.
b.
Tax Fees – None
30
c.
All Other Fees – None
d.
The audit committee’s approval policies and procedures for the above services:
Upon recommendation and approval of the audit committee, the appointment of the external
auditor is being confirmed in the annual stockholders’ meeting. On the other hand, financial
statements should be approved by the Board of Directors before its release.
Item 7. Financial Statements
See accompanying Index to Financial Statements and Supplementary Schedules
Item 8. Changes in and Disagreements With Accountants on Accounting and Financial
Disclosure
There are no changes in, and disagreements with the registrant’s accountants on any accounting and
financial disclosure during the three most recent fiscal years in the period ended March 31, 2012 or
in any subsequent interim period.
PART III - CONTROL AND COMPENSATION INFORMATION
Item 9. Directors and Executive Officers of the Company Registrant
1.
Directors, Executive Officers, Promoters and Control Persons
At present, the Company has eleven (11) directors. Hereunder are the Company’s incumbent
directors and executive officers, their names, ages, citizenship, positions held, term of office
as director/officer, period served as director/officer, business experience for the past five
years, and other directorships held in other companies:
Name
Age
Lucio C. Tan
77
Citizenship
Filipino
Position /Term of
Office/Period Served
Chairman/ 1 year/ 1 year
Business Experience/Other Directorship
within the last 5 years
Chairman of Philippine Airlines, Inc.,
Trustmark Holdings Corporation, Zuma
Holdings and Management Corporation,
Asia Brewery Inc., Fortune Tobacco
Corp., PMFTC Inc., The Charter House,
Inc., Grandspan Development Corp.,
Himmel Industries Inc., Lucky Travel
Corp., Eton Properties Philippines, Inc.,
Eton City, Inc., Belton Communities,
Inc.,
FirstHomes,
Inc.,
Tanduay
Holdings, Inc., Tanduay Distillers, Inc.,
Tanduay Brands International, Inc.,
Absolut Distillers, Inc., Progressive
Farms, Inc., Manufacturing Services &
Trade Corp., REM Development Corp.,
Foremost Farms, Inc., Basic Holdings
Corp., Dominium Realty & Construction
Corp., Shareholdings, Inc., Sipalay
Trading Corp., and Fortune Tobacco
31
International
Corp.;
Director
of
Philippine National Bank and Air
Philippines
Corporation,
majority
stockholder of Allied Banking Corp., and
Maranaw Hotels & Resort Corp.
Ramon S. Ang
58
Filipino
Director/President and
Chief Operating Officer/ 1
year/ Elected on 20 April
2012
Chairman of San Miguel Brewery Inc.
and San Miguel Brewery Hong Kong
Limited, Petron Corporation, Sea
Refinery Corporation, SMC Global
Power Holdings Corp., San Miguel
Foods, Inc., San Miguel Yamamura
Packaging Corporation, San Miguel
Properties, Inc., Anchor Insurance
Brokerage
Corporation,
Liberty
Telecoms Holdings Inc., Philippine
Diamond Hotel & Resort, Inc.,
Philippine Oriental Realty Development,
Inc., Atea Tierra Corporation and Cyber
Bay
Corporation;
Vice
Chairman/President and Chief Operating
Officer of San Miguel Corporation; Vice
Chairman and Director of Manila
Electric Company; Director/President
and Chief Operating Officer of
Philippine Airlines, Inc., Trustmark
Holdings Corporation, and Zuma
Holdings and Management Corporation;
Director of Ginebra San Miguel, Inc.,
San Miguel Pure Foods Company, Inc.,
Top Frontier Investment Holdings Inc.,
and Air Philippines Corporation;
Independent Director of Philweb
Corporation.
Harry C. Tan
66
Filipino
Director; Compensation
Committee Member;
Nomination and Election
Committee Member/ 1
year/ 1 year
Chairman
of
Air
Philippines
Corporation; Vice Chairman of Eton
Properties Philippines, Inc., Eton City,
Inc.,
Belton
Communities,
Inc.,
FirstHomes, Inc., Pan Asia Securities,
Inc., Lucky Travel Corp., and Tanduay
Holdings, Inc.; Managing Director of
The
Charter
House,
Inc.;
Director/Chairman for Tobacco Board of
Fortune
Tobacco
Corp.,
Director/President of Maranaw Hotels &
Resort Corp.; Director of Allied Banking
Corp., PMFTC Inc., Asia Brewery Inc.,
Basic Holdings Corp., Philippine
Airlines, Inc., Trustmark Holdings
Corporation, Zuma Holdings and
32
Management Corporation, Foremost
Farms, Inc., Himmel Industries, Inc.,
Absolut Distillers, Inc., Progressive
Farms, Inc., Manufacturing Services &
Trade Corp., REM Development Corp.,
Grandspan
Development
Corp.,
Dominium Realty & Construction Corp.,
Fortune Tobacco International Corp.,
Shareholdings, Inc., Sipalay Trading
Corp., Tanduay Brands International,
Inc., and Tanduay Distillers, Inc.
Lucio K. Tan, Jr.
46
Filipino
Director/ 1 year/ 1 year
Michael G. Tan
46
Filipino
Director; Audit
Committee Member/1
year/ 1 year
Director/President of Tanduay Distillers,
Inc., Director/EVP of Fortune Tobacco
Corp.; Director of AlliedBankers
Insurance Corp., Philippine Airlines,
Inc., Trustmark Holdings Corporation,
Zuma Holdings and Management
Corporation, Philippine National Bank,
Eton Properties Philippines, Inc.,
Tanduay Holdings, Inc., MacroAsia
Corporation, PMFTC Inc., Lucky Travel
Corp., Air Philippines Corporation,
Tanduay Brands International, Inc.,
Absolut Distillers, Inc., Eton City, Inc.,
Belton Communities, Inc., FirstHomes,
Inc., Asia Brewery, Inc., Foremost
Farms, Inc., Himmel Industries, Inc.,
Progressive Farms, Inc., The Charter
House, Inc., REM Development
Corporation, Grandspan Development
Corporation, Dominium Realty &
Construction Corp., Manufacturing
Services & Trade Corp., Fortune
Tobacco International Corp.,
and
Shareholdings, Inc.
Director/President of Tanduay Holdings,
Inc.; Director/Chief Operating Officer of
Asia Brewery, Inc., Director and
Treasurer of Air Philippines Corporation,
Director of Eton City, Inc., Allied
Banking Corporation, AlliedBankers
Insurance Corp., Eton Properties
Philippines,
Inc.,
PMFTC
Inc.,
Grandway Konstruct, Inc., Lucky Travel
Corp.,
Philippine
Airlines,
Inc.,
Philippine Airlines Foundation, Inc.,
Tanduay Brands International, Inc.,
Absolut Distillers, Inc., Shareholdings,
Inc., and Victorias Milling Company,
Inc.
33
Iñigo U. Zobel
55
Filipino
Director; Nomination and
Election Committee
Member/1 year/Elected
on 20 April 2012
Director/President and Chief Executive
Officer of Air Philippines Corporation,
Director of Philippine Airlines, Inc.;
Chairman of Top Frontier Investment
Holdings Inc., President and Chief
Executive Officer of E. Zobel, Inc.,
President of Ayala España S.A.,
Calatagan Golf Club, Inc., and Hacienda
Bigaa, Inc.; Director of San Miguel
Corporation, Calatagan Resort, Inc.,
Calatagan Gulf Realty, Inc., MERMAC,
Inc.; Former Independent Director of San
Miguel Brewery Inc., San Miguel Pure
Foods Company, Inc., San Miguel
Properties, Inc., and Ginebra San Miguel,
Inc.
Roberto V. Ongpin
75
Filipino
Director/ 1 year/ Elected
on 20 April 2012
Director of Philippine Airlines, Inc., San
Miguel Corporation, Petron Corporation,
Top Frontier Investment Holdings Inc.,
Araneta Properties, Inc., and Shangri-La
Asia (Hong Kong); Chairman of
PhilWeb
Corporation,
ISM
Communications Corporation, Alphaland
Corporation, Philippine Bank of
Communications, Atok-Big Wedge Co.,
Inc., and Acentic GmbH; Non-Executive
Director of Forum Energy PLC (UK)
and Shangri-la Asia Limited (Hong
Kong), and Deputy Chairman of South
China Morning Post (Hong Kong).
Ferdinand K.
Constantino
60
Filipino
Director; Compensation
Committee Member/ 1
year/ Elected on 20 April
2012
Director of Philippine Airlines, Inc.;
Director/Senior Vice President/Chief
Finance Officer and Treasurer of San
Miguel Corporation; President of Anchor
Insurance Brokerage Corporation; Vice
Chairman of SMC Global Power
Holdings Corp.; Director of San Miguel
Brewery Inc., San Miguel Yamamura
Packaging Corporation, Top Frontier
Investment Holdings Inc., Petron
Corporation; Former Chief Finance
Officer and Treasurer of San Miguel
Brewery Inc.; Former Director of San
Miguel Pure Foods Company, Inc.,
Ginebra San Miguel, Inc., and San
Miguel Properties, Inc.; and Former
Chief Finance Officer of Manila Electric
Company
34
Aurora T.
Calderon
58
Filipino
Director; Audit
Committee Member/ 1
year/ Elected on 20 April
2012
Senior Vice President-Senior Executive
Assistant to the President and Chief
Operating Officer of San Miguel
Corporation; Director of Philippine
Airlines,
Inc.,
Air
Philippines
Corporation,
Trustmark
Holdings
Corporation, Zuma Holdings and
Management
Corporation,
Petron
Corporation,
Petron
Marketing
Corporation,
Petron
Freeport
Corporation, Sea Refinery Corporation,
New Ventures Realty Corporation, Las
Lucas Construction and Development
Corp., Thai San Miguel Liquor Co.,
SMC Global Power Holdings Corp.,
Rapid Thoroughfares Inc., Trans Aire
Development Holdings Corp., Vega
Telecom,
Inc.,
Bell
Telecommunications Company, Inc.,
A.G.N. Philippines, Inc. and various
subsidiaries of San Miguel Corporation;
Treasurer of Top Frontier Investment
Holdings Corp.
Antonino L.
Alindogan, Jr.
73
Filipino
Independent Director;
Audit Committee
Chairman/ 1 year/ 1 year
Chairman of An-Cor Holdings, Inc.;
Chairman and President of Landrum
Holdings, Inc.; President of C55, Inc.;
Independent Director of Philippine
Airlines, Inc., Rizal Commercial
Banking
Corp.,
Eton
Properties
Philippines, Inc., and House of
Investments, Inc.
Enrique O. Cheng
79
Filipino
Independent Director;
Compensation Committee
Chairman; Nomination
and Election Committee
Chairman/ 1 year/ 1 year
Chairman of Landmark Corporation;
Chairman/President of Philippine Trade
Center; Director/Vice-Chairman of
Hideco Sugar Milling, Co., Inc.;
Independent Director of Philippine
Airlines, Inc.
Estelito P.
Mendoza
82
Filipino
Corporate Secretary/
appointed on 20 April
2012
Director of San Miguel Corporation
Petron Corporation, Manila Electric
Company, and Philippine National Bank;
Director and Corporate Secretary
Philippine Airlines, Inc.; Corporate
Secretary of Trustmark Holdings
Corporation, and Zuma Holdings and
Management Corporation
Ma. Cecilia L.
59
Filipino
Assistant Corporate
Corporate Secretary of Allied Banking
35
Pesayco
Secretary/ Appointed on
20 April 2012
Corp., Allied Savings Bank, Eton
Properties Philippines, Inc., Eton City,
Inc.,
Belton
Communities,
Inc.,
FirstHomes, Inc.; Tanduay Holdings
Inc., Flor De Caña Shipping, Inc., and
East Silverlane Realty and Dev’t Corp.;
Assistant Corporate Secretary of Air
Philippines Corporation, Trustmark
Holdings Corporation, and Zuma
Holdings and Management Corporation
Irene M. Cipriano
37
Filipino
Assistant Corporate
Secretary/ Appointed on
20 April 2012
Assistant Corporate Secretary of
Philippine Airlines, Inc. and Trustmark
Holdings Corporation; Associate Legal
Counsel in San Miguel Corporation’s
Office of the General Counsel; Corporate
Secretary and Assistant Corporate
Secretary of various subsidiaries of San
Miguel Corporation
Daniel L. Ang Tan
Chai
54
Filipino
Chief Finance Officer/
Appointed on 20 April
2012
Chief Financial Officer of Philippine
Airlines, Inc. and Air Philippines
Corporation; Former Chief Finance
Officer of Metrobank Card Corporation,
Former Vice President, Business
Planning and Analysis Unit Head of
Citibank, N.A.
Jaime J. Bautista
55
Filipino
President and Director/ 1
year/ 1 year
(Resigned as President
and Director on 20 April
2012)
Vice Chairman of the Board of Trustees
of the University of the East; Director
MacroAsia Corp., MacroAsia Airport
Services Corp., and MacroAsia Catering
Corp.; Member, Board of Trustees of
University of the East Ramon
Magsaysay Medical Center Foundation;
Treasurer of Tan Yan Kee Foundation;
Former President and Chief Operating
Officer of Philippine Airlines, Inc.
Domingo T. Chua
70
Filipino
Director/ 1 year/ 1 year
(Resigned as Director on
20 April 2012)
Chairman of Allied Banking Corp., and
PNB Securities, Inc.; Vice Chairman of
PNB General Insurers Co., Inc.;
Managing Director/Treasurer of Himmel
Industries, Inc.; Director/Treasurer of
Dominium Realty & Construction Corp.,
Asia Brewery, Inc., Manufacturing
Services & Trade Corp., Grandspan
Development Corp., Foremost Farms,
Inc., The Charter House, Inc.,
Progressive Farms, Inc., Fortune
Tobacco Corp., Fortune Tobacco
36
International Corp., Lucky Travel Corp.,
Eton Properties Philippines, Inc.,
Shareholdings, Inc., Sipalay Trading
Corp., Tanduay Holdings, Inc., Tanduay
Distillers, Inc., Tanduay Brands
International, Inc., Absolut Distillers,
Inc.,
Eton
City,
Inc.,
Belton
Communities, Inc. and FirstHomes, Inc.;
Director of Pan Asia Securities Corp.,
Allied Commercial Bank, Allied Bankers
Insurance Corp., Maranaw Hotels &
Resort Corp., Eurotiles Industrial Corp.,
and PNB Life Insurance Inc.; Former
Chairman of Air Philippines Corporation
and Former Director of Philippine
National Bank
Wilson T. Young
55
Filipino
Director/ 1 year/ 1 year
(Resigned as Director on
20 April 2012)
Managing Director/Deputy CEO of
Tanduay Holdings, Inc.; Chairman of
Victorias Milling Company, Inc.;
Director/President of Tanduay Brands
International, Inc.; Chief Operating
Officer of Tanduay Distillers, Inc.,
Absolut Distillers, Inc., and Total Bulk
Corp.; Director of Flor De Caña
Shipping, Inc., and Eton Properties
Philippines, Inc.; Vice Chairman of the
Board of Trustees of University of the
East Ramon Magsaysay Medical Center;
and Member, Board of Trustees of the
University of the East; Former Director
of Air Philippines Corp.
Juanita Tan Lee
69
Filipino
Director/1 year/ 1 year
(Resigned as Director on
20 April 2012)
Director of Eton Properties Philippines,
Inc..; Director/Corporate Secretary of
Asia Brewery, Inc., Dominium Realty
and
Construction
Corp.,
and
Shareholdings, Inc.; Corporate Secretary
of Absolut Distillers, Inc., The Charter
House, Inc., Foremost Farms, Inc.,
Fortune Tobacco Int’l Corp., Grandspan
Development Corp., Himmel Industries,
Inc., Lucky Travel Corp., Manufacturing
Services & Trade Corp., Marcuenco
Realty
&
Development
Corp.,
Progressive
Farms,
Inc.,
REM
Development Corp., Sipalay Trading
Corp., Tanduay Distillers, Inc., Tanduay
Brands International Inc., Tobacco
Recyclers Corp., Total Bulk Corp., Zebra
Holdings, Inc., Fortune Tobacco Corp.
37
and PMFTC Inc.; Assistant Corporate
Secretary of Basic Holdings Corp. and
Tanduay Holdings, Inc.; Former Director
of Air Philippines Corp.
Johnip G. Cua
55
Filipino
Independent Director/ 1
year/ 1 year
(Resigned as Director on
20 April 2012)
Chairman of Advertising Foundation of
the Philippines; Director of Banco De
Oro
Private
Bank,
MacroAsia
Corporation,
MacroAsia
Catering
Services, Board of Trustees Member of
Xavier School, and Xavier School
Educational & Trust Fund
Susan T. Lee
41
Filipino
Chief Finance Officer/ 1
year/ 1 year\
(Resigned as Chief
Finance Officer on 20
April 2012)
AVP and Asst. CFO of Tanduay
Holdings, Inc.
2. Significant Employees
There is no employee or person who is not an executive officer who is expected to make a
significant contribution to the business.
3. Family Relationship
Chairman Lucio C. Tan is the father of Mr. Lucio K. Tan Jr. and Mr. Michael Tan while
Messrs. Lucio C. Tan and Harry C. Tan are brothers. Mr. Domingo Chua is a brother-in-law of
Chairman Lucio C. Tan and Mr. Harry C. Tan.
4.
Pending Legal Proceedings (last 5 years)
The Directors and Executive Officers of the Corporation are not involved in any bankruptcy
petition by or against any business of which such person was a general partner or executive
officer either at the time of the bankruptcy or within two years prior to that time; any
conviction by final judgment, including the nature of the offense, in a criminal proceeding,
domestic or foreign, excluding traffic violations and other minor offenses; being subject to any
order, judgment or decree, not subsequently reversed, suspended or vacated, of any court of
competent jurisdiction, domestic or foreign, permanently or temporarily enjoining, barring
suspending or otherwise limiting his involvement in any type of business, securities,
commodities or banking activities; and being found by a domestic or foreign court of
competent jurisdiction ( in a civil action), the Commission or comparable foreign body, or a
domestic or foreign Exchange or other organized trading market or self regulatory
organization, to have violated a securities or commodities law or regulation, and the judgment
has not been reversed, suspended, or vacated.
Item 10. Executive Compensation
(a) CEO and Top Four Compensated Executive Officers
A fixed basic monthly salary was provided for the Corporation’s Chairman and CEO,
38
President and other officers of the Corporation and shall continue to be given in 2012. The
Corporation has no contract with any of its executive officers.
(b) Directors and Executive Officers
The directors of the Corporation are entitled to a per diem of Twenty Five Thousand Pesos
(P
=25,000.00) for their attendance in every board meeting and at the Annual Stockholders’
Meeting. Additionally, the Independent Directors are granted monthly transportation and
representation allowances of P
=30,000.00 while other directors are given the monthly
director’s allowance of P
=30,000.00. Moreover, attendance at a Board Committee meeting,
of which he is a member, entitles the director to a per diem of P
=15,000.00. The directors
and executive officers receive no other remuneration in cash or in kind. None of the
directors and executive officers holds any outstanding warrant or option.
Summary Compensation Table
CEO and Top Four (4)
Management
All other officers and
directors as a group
unnamed
Year
2012
(Estimate)
2011
2010
2012
(Estimate)
2011
2010
Salary
2,150,500
Bonus
N/A
Others
N/A
1,955,000
2,140,000
N/A
N/A
N/A
N/A
N/A
N/A
4,103,000
N/A
N/A
N/A
N/A
3,730,000
3,875,000
The following constitute the Corporation’s four (4) most highly compensated executive
officers (on a consolidated basis):
1. Mr. Lucio C. Tan is the Chairman of the Board of Directors and Chief Executive
Officer of the Corporation.
2. Mr. Jaime J. Bautista is the President of the Corporation.
3. Mr. Domingo Chua is the Treasurer of the Corporation.
4. Ms. Ma. Cecilia L. Pesayco is the Corporate Secretary of the Corporation.
a.) Standard Arrangements – Other than the stated salaries & wages and per diem of the
directors, there are no other standard arrangements to which the directors of the Company
are compensated, or are to be compensated, directly or indirectly, for any services
provided as a director, including any additional amounts payable for committee
participation or special assignments, for the last completed fiscal year and the ensuing
year.
b.) Other Arrangements – None
c.) Employment contract or compensatory plan or arrangement - None
Warrants and Options Outstanding: Repricing
a.) There are no outstanding warrants or options held by the Company’s CEO, the named
executive officers, and all officers and directors as a group.
b.) This is not applicable since there are no outstanding warrants or options held by the
Company’s CEO, executive officers and all officers and directors as a group.
39
Item 11. Security Ownership of Certain Beneficial Owners and Management as of
June 30, 2012
(1) Security Ownership of Certain Record and Beneficial Owners of more than 5%
Title of
class
Name, address of record owner
and relationship with Issuer
Common
Trustmark Holdings
Corporation*
SMI Compound, C. Raymundo
Ave., Maybunga, Pasig
City/(Shareholder)
Name of
Beneficial
Owner and
Relationship
with Record
Owner
No. of Shares
Held
Percent
5,297,280,230
97.708%
Citizenship
Filipino
*
* Trustmark Holdings Corp.(TMHC) is 51% owned by Buona Sorte Holdings, Inc. (BSHI) of the
Lucio Tan Group of Companies and 49% by San Miguel Equities Investment, Inc. effective April
3, 2012. Mr. Lucio Tan is expected to exercise the voting power of all the shares in BSHI.
(2)
Security Ownership of Management as of June 30, 2012
Title of class
Common
Common
Common
Common
Common
Common
Common
Common
Common
Common
Common
Name of beneficial
owner
Lucio C. Tan
Ramon S. Ang
Harry C. Tan
Iñigo Zobel
Lucio K. Tan, Jr.
Michael G. Tan
Roberto V. Ongpin
Aurora T. Calderon
Ferdinand K. Constantino
Antonino L. Alindogan, Jr.
Enrique O. Cheng
Amount and
nature of
record/beneficial
ownership *
1,000 “r”
1,000 “r”
1,000 “r”
1,000 “r”
1,000 “r”
1,000 “r”
500” r”
500 “r”
500 “r”
500 “r”
1,000 “r”
Citizenship
Percent of
Class
Filipino
Filipino
Filipino
Filipino
Filipino
Filipino
Filipino
Filipino
Filipino
Filipino
Filipino
Nil
Nil
Nil
Nil
Nil
Nil
Nil
Nil
Nil
Nil
Nil
* All shares held by management are of record.
Security ownership of all directors and officers as a group is 9,000 representing 0.00% of
the Company’s total outstanding capital stock.
3. Voting Trust Holders of 5% or More
The Company has no recorded stockholder holding more than 5% of the Company’s
common stock under a voting trust agreement.
4. Changes in Control
There are no arrangements which may result in a change in control of the registrant.
40
Item 12. Certain Relationships and Related Transactions
In addition to Note 18 of the Notes to the Consolidated Financial Statements on pages 100 to 105,
the following are additional relevant related party disclosures:
The Company’s cash and cash equivalents are deposited/placed with Allied Banking Corporation, an
affiliate, at competitive interest rates. The Company also has a lease and stock transfer agency
agreement with the said bank at prevailing rates. There are no preferential treatment in any of its
transactions with the Bank. There are no special risk or contingencies involved since the transactions
are done under normal business practice.
•
Business purpose of the arrangements:
We do business with related parties due to stronger ties which is based on trust and
confidence and easier coordination.
•
Identification of the related parties transaction business and nature of relationship:
•
•
Allied Banking Corporation – deposits, rental and stock transfer services
MacroAsia Corporation – investments
•
Transaction prices are based on prevailing market rates.
•
Transactions have been fairly evaluated since the Company adheres to industry standards and
practices.
•
There are no any ongoing contractual or other commitments as a result of the arrangement.
1.) Not applicable – there are no parties that fall outside the definition of “ related
parties” with whom the Company or its related parties have a relationship that enables
the parties to negotiate terms of material transactions that may not be available from
other, more clearly independent parties on an arm’s length basis.
2.) Not applicable – the Company has no transactions with promoters.
PART IV - EXHIBITS AND SCHEDULES
Item 13.
Exhibits and Reports on SEC Form 17-C
(a) Exhibits - The other exhibits, as indicated in the Index to Exhibits are either not applicable
to the Company or require no answer.
(b) Reports on SEC Form 17-C
SEC Form 17-C (Current Reports) which have been filed during the year are no longer filed
as part of the exhibits.
41
LIST OF ITEMS REPORTED UNDER SEC FORM 17-C (DURING THE LAST 6
MONTHS) – OCTOBER 2011 TO MARCH 2012
Date of Report
September 30, 2011
(Received by SEC on
October 4, 2011)
PART V -
Item 14.
Subject Matter Disclosed
1. The matters approved during the Annual Stockholders’
Meeting held last September 30, 2011
a. Minutes of the Annual Stockholders’ Meeting held on
September 30, 2010;
b. Audited Financial Statements of the Corporation as of
March 31, 2011;
c. Ratification of all acts, resolutions and transactions
entered into by the Board of Directors and Management
from the last stockholders’ meeting and up to the
present; and
d. Election of Directors
2. The matters approved during the Organizational Meeting of
the Board of Directors held on September 30, 2011
a. Election of Officers; and
b. Appointment of Members of Board Committees
CORPORATE GOVERNANCE
Evaluation System
The Compliance Officer is currently in charge of evaluating the level of compliance of the Board of
Directors and top-level management of the Corporation. The implementation of the Corporate
Governance Scorecard allows the Company to properly evaluate compliance to the Manual.
Item 15. Measures undertaken to Fully Comply
The Company has amended its Manual on Corporate Governance in accordance with SEC
Memorandum Circular No. 6, Series of 2009 to fully comply with the adopted leading practices on
good corporate governance.
Item 16. Deviations
The Company is substantially compliant with its Revised Manual on Corporate Governance Manual.
Item 17. Plan to improve
The Company continues to improve its Corporate Governance when appropriate and warranted, in its
best judgment.
42
43
PAL HOLDINGS, INC.
INDEX TO FINANCIAL STATEMENTS AND SUPPLEMENTARY SCHEDULES
SEC FORM 17-A
Page No.
FINANCIAL STATEMENTS
Statement of Management’s Responsibility for Financial Statements
Report of Independent Auditors
45-46
49-50
Statements of Financial Position - March 31, 2012 and 2011
Statements of Comprehensive Income for the Period Ended March 31, 2012, 2011 and
2010
Statements of Changes in Equity for the Years Ended March 31, 2012, 2011 and 2010
51-52
53-54
55-56
Statements of Cash Flows for the Years Ended March 31, 2012, 2011 and 2010
57-58
Notes to Financial Statements
59-126
SUPPLEMENTARY SCHEDULES
Report of Independent Auditors on Supplementary Schedules
127
A.
B.
128
C.
D.
E.
F.
G.
H.
I.
J.
K.
L.
M.
Financial Assets
Amounts Receivable from Directors, Officers, Employees, Related Parties,
and Principal Stockholders (Other than Related Parties)
Amounts Receivable from Related Parties which are Eliminated during the
Consolidation of Financial Statements
Intangible Assets and Other Assets
Long- Term Debt
Indebtedness to Related Parties
Guarantees of Securities of Other Issuers
Capital Stock
Reconciliation of Retained Earnings
Relationships between & among the Group and its parent
List Of Philippine Financial Reporting Standards Effective As At March
31, 2012
Financial Soundness Indicators
Index to Exhibits
129
*
*
130-132
133
*
134
135
136
137-140
141
*
* These schedules, which are required by Part IV(e) of SRC Rule 68, have been omitted because
they are either not required, not applicable or the information required to be presented is included in
the Group’s financial statements.
44
45
46
PAL Holdings, Inc.
(A Subsidiary of Trustmark Holdings Corporation)
and Subsidiaries
Consolidated Financial Statements
March 31, 2012 and 2011
and Years Ended March 31, 2012, 2011 and 2010
and
Independent Auditors’ Report
SyCip Gorres Velayo & Co.
47
COVER SHEET
P W - 9 4
SEC Registration Number
P A L
( A
H O L D I N G S ,
S u b s
I N C .
i d i a r y
H o l d i n g s
o f
C o r p o r a t
T r u s
t m a r k
i o n )
A N D
S U B S I D I A R I E S
(Company’s Full Name)
7 t h
F l
6 7 5 4
o o r
,
A y a l a
A l
l
i
e d
A v e n u e
B a n k
,
C e n t e r
M a k a t
i
C i
t y
(Business Address: No. Street City/Town/Province)
Daniel Ang Tan Chai
817-8710
(Contact Person)
(Company Telephone Number)
0 3
3 1
A A C F S
Month
Day
(Form Type)
Month
(Fiscal Year)
Day
(Annual Meeting)
Not Applicable
(Secondary License Type, If Applicable)
Dept. Requiring this Doc.
Amended Articles Number/Section
Total Amount of Borrowings
6,635
Total No. of Stockholders
Domestic
Foreign
To be accomplished by SEC Personnel concerned
File Number
LCU
Document ID
Cashier
STAMPS
Remarks: Please use BLACK ink for scanning purposes.
48
SyCip Gorres Velayo & Co.
6760 Ayala Avenue
1226 Makati City
Philippines
Phone: (632) 891 0307
Fax:
(632) 819 0872
www.sgv.com.ph
BOA/PRC Reg. No. 0001,
January 25, 2010, valid until December 31, 2012
SEC Accreditation No. 0012-FR-2 (Group A),
February 4, 2010, valid until February 3, 2013
INDEPENDENT AUDITORS’ REPORT
The Stockholders and the Board of Directors
PAL Holdings, Inc.
7th Floor, Allied Bank Center
6754 Ayala Avenue, Makati City
We have audited the accompanying consolidated financial statements of PAL Holdings, Inc. and its
subsidiaries, which comprise the consolidated statements of financial position as at March 31, 2012
and 2011 and the consolidated statements of comprehensive income, statements of changes in equity
and statements of cash flows for each of the three years in the period ended March 31, 2012, and a
summary of significant accounting policies and other explanatory information.
Management’s Responsibility for the Consolidated Financial Statements
Management is responsible for the preparation and fair presentation of these consolidated financial
statements in accordance with Philippine Financial Reporting Standards, and for such internal control
as management determines is necessary to enable the preparation of consolidated financial statements
that are free from material misstatement, whether due to fraud or error.
Auditors’ Responsibility
Our responsibility is to express an opinion on these consolidated financial statements based on our
audits. We conducted our audits in accordance with Philippine Standards on Auditing. Those
standards require that we comply with ethical requirements and plan and perform the audit to obtain
reasonable assurance about whether the consolidated financial statements are free from material
misstatement.
An audit involves performing procedures to obtain audit evidence about the amounts and disclosures
in the consolidated financial statements. The procedures selected depend on the auditor’s judgment,
including the assessment of the risks of material misstatement of the consolidated financial statements,
whether due to fraud or error. In making those risk assessments, the auditor considers internal
control relevant to the entity’s preparation and fair presentation of the consolidated financial
statements in order to design audit procedures that are appropriate in the circumstances, but not for the
purpose of expressing an opinion on the effectiveness of the entity’s internal control. An audit also
includes evaluating the appropriateness of accounting policies used and the reasonableness of
accounting estimates made by management, as well as evaluating the overall presentation of the
consolidated financial statements.
We believe that the audit evidence we have obtained is sufficient and appropriate to provide a basis for
our audit opinion.
49
A member firm of Ernst & Young Global Limited
50
PAL HOLDINGS, INC. AND SUBSIDIARIES
CONSOLIDATED STATEMENTS OF FINANCIAL POSITION
(Amounts in Thousands)
March 31
2012
2011
ASSETS
Current Assets
Cash and cash equivalents (Notes 5, 18, 27 and 28)
Receivables (Notes 7, 18, 27 and 28)
Expendable parts, fuel, materials and supplies (Note 8)
Other current assets (Notes 9, 27 and 28)
Total Current Assets
P
=2,980,945
7,214,887
1,591,606
1,647,235
13,434,673
=4,540,579
P
5,370,915
1,771,915
1,719,773
13,403,182
Noncurrent Assets
Property and equipment (Notes 10, 13, 15, 18, 24 and 25)
At cost
At appraised values
Available-for-sale investments (Notes 6, 18, 27 and 28)
Investment properties (Notes 11, 13 and 18)
Deferred income tax assets - net (Note 23)
Other noncurrent assets (Notes 12, 18, 27 and 28)
Total Noncurrent Assets
50,055,463
568,446
522,723
797,585
1,898,499
4,506,481
58,349,197
49,328,677
654,506
560,974
806,390
826,011
6,985,650
59,162,208
P
=71,783,870
=72,565,390
P
P
=5,979,805
6,698,829
12,958,898
–
8,502,864
=5,591,428
P
5,508,269
12,046,328
10,000
6,819,136
5,981,264
40,121,660
7,013,431
36,988,592
Noncurrent Liabilities
Long-term obligations - net of current portion
(Notes 15, 18, 25, 27 and 28)
Accrued employee benefits (Note 21)
Reserves and other noncurrent liabilities (Note 16 and 18)
Total Noncurrent Liabilities
23,444,111
4,891,943
2,320,110
30,656,164
20,996,623
5,312,184
3,890,963
30,199,770
Total Liabilities
70,777,824
67,188,362
TOTAL ASSETS
LIABILITIES AND EQUITY
Current Liabilities
Notes payable (Notes 13, 18, 27 and 28)
Accounts payable (Notes 18, 27 and 28)
Accrued expenses (Notes 14, 16, 18, 27 and 28)
Due to related parties (Notes 18, 27 and 28)
Unearned transportation revenue
Current portion of long-term obligations
(Notes 15, 18, 25, 27 and 28)
Total Current Liabilities
(Forward)
51
A member firm of Ernst & Young Global Limited
-2-
March 31
2012
Equity
Attributable to the equity holders of the parent:
Capital stock (Notes 2 and 17)
Additional paid-in capital (Notes 2 and 18)
Other components of equity (Note 17)
Deficit (Notes 2, 17, and 19)
Treasury stock - at cost (Note 17)
2011
Non-controlling interests
Total Equity
P
=5,421,568
18,008,373
(4,364,140)
(18,198,384)
(56)
867,361
138,685
1,006,046
P5,421,568
=
17,998,373
(4,233,626)
(14,613,528)
(56)
4,572,731
804,297
5,377,028
TOTAL LIABILITIES AND EQUITY
P
=71,783,870
=72,565,390
P
See accompanying Notes to Consolidated Financial Statements.
52
PAL HOLDINGS, INC. AND SUBSIDIARIES
CONSOLIDATED STATEMENTS OF COMPREHENSIVE INCOME
(Amounts in Thousands, Except Earnings Per Share)
Years Ended March 31
2011
2012
REVENUE
Passenger
Cargo
Others (Notes 18 and 20)
EXPENSES AND OTHER CHARGES
(INCOME) (Note 20)
Flying operations (Note 28)
Aircraft and traffic servicing (Note 18)
Maintenance (Note 18)
Passenger service (Note 18)
Reservation and sales
General and administrative (Note 7)
Financing charges (Notes 13, 15 and 18)
Others - net (Notes 11, 15, 16, 18 and 28)
P
=63,066,430
5,404,378
5,582,301
74,053,109
=
P62,667,001
5,941,290
5,999,029
74,607,320
2010
=
P54,427,666
4,606,314
5,053,800
64,087,780
46,652,228
9,642,216
8,900,202
5,295,429
4,361,718
2,866,213
1,365,785
303,721
79,387,512
40,301,308
9,324,494
8,754,940
4,881,594
4,382,572
2,646,022
1,661,570
(384,713)
71,567,787
INCOME (LOSS) BEFORE INCOME TAX
(5,334,403)
3,039,533
398,522
INCOME TAX EXPENSE (BENEFIT) (Note 23)
(1,045,581)
46,615
211,281
NET INCOME (LOSS)
(4,288,822)
2,992,918
187,241
(35,114)
39,934
(13,058)
–
(53,885)
OTHER COMPREHENSIVE INCOME (LOSS)
(Note 19)
Net changes in fair values of available-for-sale
investments, net of deferred income tax (Note 6)
Net realized gains on sale of available-for-sale
investments, net of deferred income tax (Note 6)
Net changes in fair values of cash flow hedges,
net of deferred income tax (Note 28)
Increase in revaluation increment due to appraisal, net
of deferred income tax (Note 10)
Effect of foreign exchange translation*
TOTAL OTHER COMPREHENSIVE
INCOME (LOSS)
TOTAL COMPREHENSIVE INCOME (LOSS)
Net income (loss) attributable to:
Equity holders of the parent
Non-controlling interests
–
–
–
(55,375)
34,928,708
8,957,125
10,856,593
4,777,994
3,868,047
2,621,065
2,569,540
(4,889,814)
63,689,258
(277,077)
(878,189)
453,087
(110,743)
–
(105,002)
(90,489)
105,201
(1,050,134)
(P
=4,379,311)
=
P3,098,119
(P
=862,893)
=
P2,533,394
459,524
=
P2,992,918
P
=157,743
29,498
P
=187,241
(P
= 3,631,943)
(656,879)
(P
= 4,288,822)
(Forward)
53
-2-
Years Ended March 31
2011
2012
Total comprehensive income (loss) attributable to:
Equity holders of the parent
Non-controlling interests
Basic/Diluted Earnings (Loss) Per Share**
Computed based on Net Income (Loss)
Computed based on Total Comprehensive
Income (Loss)
2010
(P
= 3,713,955)
(665,356)
(P
= 4,379,311)
=
P2,628,538
469,581
=
P3,098,119
(P
=733,418)
(129,475)
(P
=862,893)
(P
=0.6699)
=
P0.4673
P
=0.0291
(0.6850)
0.4848
(0.1353)
* Represent the effect of translating the US Dollar consolidated financial statements of Philippine Airlines, Inc., a
subsidiary, using the applicable year-end exchange rates of =
P 42.934, =
P 43.408 and =
P 45.291 to US$1 as of
March 31, 2012, 2011 and 2010, respectively, and the monthly average exchange rates for the years then ended. As of
July 13, 2012, the applicable exchange rate to US$1 is =
P 42.071.
**Computed using the weighted average number of issued and outstanding shares of stock of 5,421,512,096 in 2012, 2011
and 2010 (see Note 17).
See accompanying Notes to Consolidated Financial Statements.
54
PAL HOLDINGS, INC. AND SUBSIDIARIES
CONSOLIDATED STATEMENTS OF CHANGES IN EQUITY
FOR THE YEARS ENDED MARCH 31, 2012, 2011 AND 2010
(Amounts in Thousands)
Capital
Stock
(Notes 2
and 17)
BALANCES AT MARCH 31, 2009
Adjustment in capital stock issued
Net income for the year
Other comprehensive loss (Note 19)
Total comprehensive income (loss) for the year
Net effect of transfer of portion of revaluation
increment in property realized through
depreciation, net of deferred income tax
and foreign exchange adjustment
Additional
Paid-in
Capital
(Notes 2
and 18)
P
=5,421,568 P
= 17,517,283
–
–
–
–
–
–
–
–
–
Other Components of Equity (Note 17)
Net Changes
Cumulative in Fair Values
Translation of AvailableRevaluation
Adjustment
for-sale
Increment
(Notes 19
Investments
(Notes 10
and 28)
(Note 6)
and 11)
(P
= 3,510,311)
–
–
(832,458)
(832,458)
P
=125,143
–
–
(58,703)
(58,703)
–
–
–
BALANCES AT MARCH 31, 2010
P
=5,421,568 P
= 17,517,283
Net income for the year
–
–
Other comprehensive income (loss) (Note 19)
–
–
Total comprehensive income (loss) for the year
–
–
Reclassification of revaluation increment deemed
cost (Note 11)
–
–
Conversion of amounts due to a stockholder into
additional paid-in capital (Note 18)
–
481,090
Net effect of transfer of portion of revaluation
increment in property realized through
sale and depreciation, net of deferred income tax
and foreign exchange adjustment
–
–
(P
= 4,342,769)
–
(328,363)
(328,363)
P
=66,440
–
39,883
39,883
–
–
–
–
–
–
BALANCES AT MARCH 31, 2011
(P
= 4,671,132)
P
=106,323
P
=5,421,568 P
= 17,998,373
P
= 1,497,302
–
–
–
–
(188,143)
P
= 1,309,159
–
383,624
383,624
(1,120,877)
–
(240,723)
P
= 331,183
Deficit
(Notes 17
and 19)
Treasury
Stock
(Note 17)
(P
= 1,887,866) (P
=18,941,013)
–
–
–
157,743
(891,161)
–
(891,161)
157,743
(P
= 56)
–
–
–
–
Subtotal
(188,143)
188,143
(P
= 2,967,170) (P
=18,595,127)
–
2,533,394
95,144
–
95,144
2,533,394
(1,120,877)
–
(240,723)
–
(P
= 56)
–
–
–
Total Equity
Attributable
to Equity
Holders of
the Parent
P
= 2,109,916
–
157,743
(891,161)
(733,418)
Non-controlling
Interests
Total
P
=448,457
52
29,498
(158,973)
(129,475)
P
= 2,558,373
52
187,241
(1,050,134)
(862,893)
–
–
–
P
= 1,376,498
2,533,394
95,144
2,628,538
P
=319,034
459,524
10,057
469,581
P
= 1,695,532
2,992,918
105,201
3,098,119
1,120,877
–
–
–
–
–
–
481,090
–
481,090
327,328
–
86,605
15,682
102,287
P
= 4,572,731
P
=804,297
P
= 5,377,028
(P
= 4,233,626) (P
=14,613,528)
(P
= 56)
(Forward)
55
-2-
Capital
Stock
(Notes 2
and 17)
Additional
Paid-in
Capital
(Notes 2
and 18)
Other Components of Equity (Note 17)
Net Changes
Cumulative in Fair Values
Translation of AvailableRevaluation
Adjustment
for-sale
Increment
(Notes 19
Investments
(Notes 10
and 28)
(Note 6)
and 11)
= 17,998,373
BALANCES AT MARCH 31, 2011
P
=5,421,568 P
Net loss for the year
–
–
Other comprehensive loss (Note 19)
–
–
Total comprehensive loss for the year
–
–
Conversion of amounts due to a stockholder into
additional paid-in capital (Note 18)
–
10,000
Net effect of transfer of portion of revaluation
increment in property realized through
sale and depreciation, net of deferred income tax
and foreign exchange adjustment
–
–
(P
= 4,671,132)
–
(46,885)
(46,885)
–
–
BALANCES AT MARCH 31, 2012
(P
= 4,718,017)
P
=71,196
P
=5,421,568 P
= 18,008,373
–
P
=106,323
–
(35,127)
(35,127)
–
P
=331,183
–
–
–
–
(48,502)
P
= 282,681
Deficit
(Notes 17
and 19)
Treasury
Stock
(Note 17)
(P
= 4,233,626) (P
=14,613,528)
–
(3,631,943)
(82,012)
–
(82,012)
(3,631,943)
(P
= 56)
–
–
–
Subtotal
–
(48,502)
–
–
Total Equity
Attributable
to Equity
Holders of
the Parent
P
= 4,572,731
(3,631,943)
(82,012)
(3,713,955)
10,000
47,087
–
(1,415)
(P
= 4,364,140) (P
=18,198,384)
(P
= 56)
P
= 867,361
Non-controlling
Interests
P
= 804,297
(656,879)
(8,477)
(665,356)
–
(256)
P
=138,685
Total
P
= 5,377,028
(4,288,822)
(90,489)
(4,379,311)
10,000
(1,671)
P
= 1,006,046
See accompanying Notes to Consolidated Financial Statements.
56
PAL HOLDINGS, INC. AND SUBSIDIARIES
CONSOLIDATED STATEMENTS OF CASH FLOWS
(Amounts in Thousands)
Years Ended March 31
2011
2012
CASH FLOWS FROM OPERATING ACTIVITIES
Income (loss) be fore income tax
Adjustments for:
Depreciation, amortization and impairment losses
(Notes 10, 11 and 20)
Increase (decrease) in reserves and other noncurrent
liabilities (Note 16)
Financing charges (Note 20)
Net increase (decrease) in accrued employee benefits
(Note 21)
Unrealized foreign exchange loss (gain) - net
Dividend income (Note 20)
Realization of non-hedge derivatives (Note 28)
Interest income (Note 20)
Gain on disposal of available-for-sale investments
and settlement of liability (Note 15)
Loss (gain) on disposal of property and equipment,
and others
Operating income before working capital changes
Decrease (increase) in:
Receivables
Expendable parts, fuel, materials and supplies
Other current assets
Increase in:
Accounts payable
Accrued expenses
Due to related parties
Unearned transportation revenue
Net cash settlement on derivative transactions
Net cash generated from operations
Financing charges paid
Interest received
Income taxes paid (including final and withholding taxes)
Net cash flows from operating activities
CASH FLOWS FROM INVESTING ACTIVITIES
Additions to property and equipment (Notes 10 and 24)
Investments in available-for-sale investments
Proceeds from disposal of:
Property and equipment
Available-for-sale investments
Short-term investments
Dividend received
Payments for security deposits
Return of various deposits
Proceeds from return of predelivery
payments (Notes 10 and 13)
Net cash flows used in investing activities
2010
=
P3,039,533
P
=398,522
6,327,996
7,342,159
7,390,024
(1,366,622)
1,365,785
119,156
1,661,570
759,576
2,569,540
(P
= 5,334,403)
(456,841)
(190,971)
(106,038)
72,714
(47,721)
–
1,921,825
2,185,724
377,819
231,470
(187,774)
(248,626)
(240,163)
–
(203,414)
11,891,730
220,841
226,228
(303,232)
(1,935,664)
(240,499)
(1,650,868)
757,788
8,192,256
(1,594,805)
180,309
269,324
639,280
(537,418)
(328,214)
(1,954,915)
(295,691)
3,489,289
733,853
946,399
–
1,683,728
(198,502)
4,205,940
(1,195,937)
43,936
(204,143)
2,849,796
138,342
1,938,766
10,000
821,883
(481,321)
14,093,048
(1,360,746)
38,181
(174,402)
12,596,081
1,253,548
843,547
–
928,341
(2,927,711)
9,528,664
(1,879,689)
29,760
(102,460)
7,576,275
(6,374,367)
(2,460)
(3,098,601)
(358)
(2,627,688)
(326)
204,885
2,596
–
106,038
(901,505)
400,078
1,823,016
–
–
187,774
(1,786,421)
111,077
39,451
295,141
374,205
303,232
(309,492)
1,059,118
–
(6,564,735)
709,958
(2,053,555)
–
(866,359)
(Forward)
57
-2-
Years Ended March 31
2011
2012
CASH FLOWS FROM FINANCING ACTIVITIES
Availments of:
Notes payable (Note 13)
Long-term obligations (Notes 15, 18 and 24)
Payments of:
Notes payable (Note 13)
Long-term obligations (Notes 15, 18 and 24)
Net cash flows from (used in) financing activities
EFFECT OF EXCHANGE RATE CHANGES
ON CASH AND CASH EQUIVALENTS
P
= 2,122,350
8,595,150
(1,082,000)
(7,508,366)
2,127,134
=
P–
–
(280,836)
(9,256,954)
(9,537,790)
2010
P
=668,573
3,245,322
(1,057,753)
(12,248,669)
(9,392,527)
28,171
138,822
242,644
(1,559,634)
1,143,558
(2,439,967)
CASH AND CASH EQUIVALENTS
AT BEGINNING OF YEAR
4,540,579
3,397,021
5,836,988
CASH AND CASH EQUIVALENTS
AT END OF YEAR (Note 5)
P
= 2,980,945
=
P4,540,579
=
P3,397,021
NET INCREASE (DECREASE) IN CASH AND
CASH EQUIVALENTS
See accompanying Notes to Consolidated Financial Statements.
58
PAL HOLDINGS, INC. AND SUBSIDIARIES
NOTES TO CONSOLIDATED FINANCIAL STATEMENTS
1. Corporate Information
PAL Holdings, Inc. (the Parent Company) was incorporated in the Philippines on May 10, 1930
under the name “Baguio Gold Mining Company” originally to engage in mining and other mineral
exploration activities. On October 5, 1979, the Parent Company applied and was granted an
extension of its corporate life by the Philippine Securities and Exchange Commission (SEC) for
another 50 years from May 1980. On September 23, 1996, the Parent Company changed its
primary purpose to that of engaging in the business of a holding company and changed its
corporate name to Baguio Gold Holdings Corporation.
The Parent Company’s Board of Directors (BOD) and its stockholders approved the change of the
Parent Company’s name to PAL Holdings, Inc. in separate meetings held on October 20 and
December 13, 2000, respectively. The change of the Parent Company’s name was approved by
the Philippine SEC on January 19, 2007.
The Parent Company and its subsidiaries (collectively referred to herein as “the Group”), through
Philippine Airlines, Inc. (PAL), the Philippine national flag carrier and the major subsidiary of the
Parent Company, is primarily engaged in air transport of passengers and cargo within the
Philippines and between the Philippines and several international destinations. The Parent
Company is 97.71%-owned by Trustmark Holdings Corporation (Trustmark). Trustmark is a
wholly-owned subsidiary of Buona Sorte Holdings, Inc. (BSHI) as of March 31, 2012. BSHI and
Trustmark were likewise incorporated in the Philippines and are part of the Lucio Tan Group of
Companies. In April 2012, San Miguel Equity Investments Inc. (SMEII), a wholly owned
subsidiary of San Miguel Corporation, acquired 49% of the shares of stock of Trustmark through
an investment agreement with BSHI.
The Parent Company’s registered office address is 7th Floor, Allied Bank Center, 6754 Ayala
Avenue, Makati City.
The consolidated financial statements as at March 31, 2012 and 2011 and for each of the three
years in the period ended March 31, 2012 were authorized for issue by the BOD on
July 13, 2012.
2. Status of Operations and Reorganizations
b. Increase in capital stock of the Parent Company
On July 26 and September 19, 2006, at separate meetings, the Parent Company’s BOD, by a
vote of at least a majority of its entire membership, and the stockholders of at least two thirds
(2/3) of the outstanding shares of stock, approved the increase in authorized capital stock of
the Parent Company from =
P400.00 million divided into 400 million shares with par value of
=1.00 per share to P
P
=20.00 billion divided into 20 billion shares with par value of P
=1.00 per
share. Out of the increase in the authorized capital stock, 5.02 billion shares with a total par
value of P
=5.02 billion have been subscribed and in payment thereof, the Parent Company
agreed to convert to equity a part of its debt to Trustmark, in the amount of P
=9.04 billion, at a
rate of P
=1.80 per share. As a result of the conversion, Trustmark’s ownership over the Parent
Company increased from 69.16% to 97.71%.
59
The increase in authorized capital stock was approved by the Philippine SEC on
January 19, 2007.
As a result of the above transactions, the Parent Company had a P
=4.02 billion additional
paid-in capital as of March 31, 2007. On October 17, 2007, the Philippine SEC approved the
Parent Company’s request to undergo equity restructuring to wipe out the deficit of the Parent
Company as of March 31, 2007 amounting to P
=253.73 million against the additional paid-in
capital.
b. Group reorganizations
Transactions in Fiscal Year 2007
In fiscal year 2007, the Parent Company undertook the following business restructuring
activities that were accounted for under the pooling of interests method:
On August 17, 2006, the BOD of the Parent Company approved the acquisition of 100% of the
total voting shares of its then subsidiaries, Cube Factor Holdings, Inc., Ascot Holdings,
Incorporated, POL Holdings, Inc., Sierra Holdings & Equities, Inc., Network Holdings &
Equities, Inc. and Maxell Holdings Corp. (collectively, the Holding Companies) for
=136.00 million from the individual stockholders representing interests of LT Group of
P
Companies (Nominees of the LT Group). The Holding Companies collectively owned 81.57%
of PAL. These Holding Companies also owned 82.33% of PR Holdings, Inc. (PR), 3.76%
owner of PAL.
Also on August 17, 2006, the Parent Company’s BOD approved the Parent Company’s
assumption of a portion of the liabilities of the Holding Companies to Trustmark aggregating
to about P
=9.04 billion. The BOD of Trustmark accepted the said assumption by the Parent
Company on August 18, 2006.
On October 2, 2006, the Nominees of the LT Group assigned their interests in the Holding
Companies to the Parent Company. Following the assignment, the Parent Company
effectively owned 84.67% of PAL through the Holding Companies and PR.
Transactions in Fiscal Year 2008
In fiscal year 2008, the Parent Company’s management, realizing that the 2007 restructuring
may not have resulted in a corporate structure that is in line with their strategy, executed the
following additional series of corporate restructuring actions:
On June 27, 2007, the BOD of the Parent Company approved the assumption by the Parent
Company of the outstanding liability of the Holding Companies to Trustmark, amounting to
=14.08 billion as of June 27, 2007. Trustmark agreed to convert such receivable from the
P
Parent Company (after the assumption) into additional paid-in capital of the Parent Company.
On July 19, 2007, the Parent Company’s BOD approved the Parent Company’s acquisition of
the 81.57% aggregate ownership of the Holding Companies in PAL, and their 82.33%
ownership in PR. This gave the Parent Company the same effective ownership of 84.67% in
PAL that existed as of March 31, 2007.
60
As approved by the BOD, the acquisition will be made by way of a dacion en pago to pay-off
=12.12 billion out of the =
P
P23.12 billion liabilities of the Holding Companies to the Parent
Company (after the assumption by the Parent Company of the P
=14.08 billion receivable of
Trustmark from the Holding Companies). The remaining receivable of the Parent Company
from the Holding Companies after the dacion en pago, amounting to P
=11.00 billion, will be
converted into additional paid-in capital in the Holding Companies. The additional paid-in
capital resulting from the conversion into equity of the Parent Company’s obligation to
Trustmark will be used to wipe out the Parent Company’s deficit.
On August 2, 2007, the BOD of the Parent Company resolved to amend the June 27, 2007
resolution so that the Parent Company only assumes P
=3.08 billion (instead of P
=14.08 billion)
out of the P
=23.12 billion liabilities of the Holding Companies, as originally planned on
June 27, 2007. The remaining liabilities of the Holding Companies amounting to
=11.00 billion are thus retained with the Holding Companies as a result of the amendment.
P
Pursuant to the approval of the BOD on July 19, 2007 to acquire direct ownership in PAL and
PR, the Parent Company and the Holding Companies entered into various deeds of assignment
on August 13, 2007 for the Holding Companies to assign to the Parent Company their
respective ownerships in PAL and PR. As a result thereof, the Holding Companies assigned to
the Parent Company their respective investments in PAL and PR aggregating to
=12.44 billion and P
P
=108.66 million, respectively, in exchange for the full payment of the
Holding Companies’ liabilities to the Parent Company totaling P
=12.12 billion, including the
=9.04 billion receivables of the Parent Company from the Holding Companies, as of
P
March 31, 2007. This resulted in the recognition of a liability to Maxell Holding Corp.
(Maxell), one of the Holding Companies, amounting to P
=431.60 million as of March 31, 2008.
On August 2, 2007, the BOD approved, upon concurrence of Trustmark, that the Parent
Company shall sell/assign its shares in the Holding Companies to Trustmark. In payment
thereof, Trustmark agreed to assume the obligations of the Parent Company to the previous
stockholders of the Holding Companies aggregating to P
=136.00 million.
On August 14, 2007, the Parent Company and Trustmark executed a memorandum of
agreement and entered into a deed of assignment effecting the assignment of shares to and
assumption of liabilities by Trustmark.
As a result of the restructuring in fiscal year 2008, the Parent Company still owns 84.67% of
PAL, through direct ownership of 81.57% and an indirect ownership of 3.10% through PR.
The Parent Company owns 82.33% of PR, which in turn owns 3.77% of PAL shares.
The release of the investments in the Holding Companies to Trustmark was accounted for as a
disposal of “legal rights” to the Holding Companies as said investee companies did not have
assets that were derecognized in the process other than the investment in shares of stock of
PAL that has no carrying value at consolidated level. The disposal though relieved the Group
with the liabilities that were settled as they were assumed by Trustmark, the ultimate parent
company. Accordingly, the transaction was accounted for as an equity transaction where the
reduction in consolidated liabilities was treated as an additional equity investment (or
additional paid-in capital of the Parent Company) by Trustmark.
c. Status of PAL’s rehabilitation and operations
On June 7, 1999, the Philippine SEC confirmed its approval of PAL’s Amended and Restated
Rehabilitation Plan (Rehabilitation Plan) dated March 15, 1999.
61
On September 14, 2007, the members of the Permanent Rehabilitation Receiver endorsed
PAL’s application for exit from rehabilitation to the Philippine SEC and PAL went out of
rehabilitation, on September 28, 2007.
Subsequent to PAL’s exit from rehabilitation, PAL incurred consolidated total comprehensive
loss of P
=4.34 billion and P
=739.53 million in 2012 and 2010, respectively and generated
consolidated total comprehensive income of P
=3.06 billion in 2011. Moreover, PAL reported a
deficit of P
=8.57 billion and P
=4.34 billion, and total current liabilities exceeding total current
assets by P
=26.69 billion and P
=23.59 billion as of March 31, 2012 and 2011, respectively. To
improve its financial condition and results of operations, PAL has lined up various revenue
enhancement programs, cash generation strategies and cost control initiatives. Part of the cost
control initiatives is the outsourcing of the non-core activities such as catering, ground
handling and reservation services implemented in September 2011. Due to the significant
reduction in the number of employees resulting from the outsourcing, PAL recognized a
curtailment loss of P
=106.86 million in 2012 (see Note 21).
In May and June 2012, the proceeds from the investment of SMEII to Trustmark amounting to
$400.00 million were flowed down to PAL. These funds are expected to help strengthen and
enhance the operations of PAL (see Note 1).
3. Summary of Significant Accounting and Financial Reporting Policies
Basis of Preparation
The consolidated financial statements have been prepared using the historical cost convention,
except for buildings and improvements which are carried at revalued amounts, and
available-for-sale investments and derivative financial instruments which are carried at fair value.
The consolidated financial statements are presented in Philippine peso, the Parent Company’s
functional currency, and rounded to the nearest thousands, except when otherwise indicated.
Statement of Compliance
The consolidated financial statements have been prepared in accordance with Philippine Financial
Reporting Standards (PFRS).
Changes in Accounting Policies
The accounting policies adopted are consistent with those of the previous financial years except
for the adoption of the following amendments and improvements to existing standards and
Philippine Interpretations based on International Financial Reporting Interpretations Committee
(IFRIC) interpretations which became effective to the Group beginning April 1, 2011.
•
Amendment to PAS 24, Related Party Transactions. PAS 24 clarifies the definitions of a
related party. The new definitions emphasize a symmetrical view of related party
relationships and clarify the circumstances in which persons and key management personnel
affect related party relationships of an entity. In addition, the amendment introduces an
exemption from the general related party disclosure requirements for transactions with
government and entities that are controlled, jointly controlled or significantly influenced by
the same government as the reporting entity. The adoption of the amendment did not have
significant impact on the financial statements of the Group.
62
•
Philippine Interpretation IFRIC 19, Extinguishing Financial Liabilities with Equity
Instruments. The interpretation clarifies that equity instruments issued to a creditor to
extinguish a financial liability qualify as consideration paid. The equity instruments issued are
measured at their fair value. In case that this cannot be reliably measured, the instruments are
measured at the fair value of the liability extinguished. Any gain or loss is recognized
immediately in profit or loss.
•
Amendment to PAS 32, Financial Instruments: Presentation. The amendment alters the
definition of a financial liability in PAS 32 to enable entities to classify rights issues and
certain options or warrants as equity instruments. The amendment is applicable if the rights
are given pro rata to all of the existing owners of the same class of an entity’s non-derivative
equity instruments, to acquire a fixed number of the entity’s own equity instruments for a
fixed amount in any currency. The amendment has had no effect on the financial position or
performance of the Group because the Group does not have these types of instruments.
•
Amendment to Philippine Interpretation IFRIC 14, Prepayment of a Minimum Funding
Requirement. The amendment removes an unintended consequence when an entity is subject
to minimum funding requirements and makes an early payment of contributions to cover such
requirements. The amendment permits a prepayment of future service cost by the entity to be
recognized as a pension asset. The Group is not subject to minimum funding requirements in
the Philippines, therefore the amendment of the interpretation has no effect on the financial
position nor performance of the Group.
Improvements to PFRS
The omnibus amendments to PFRS issued in fiscal year 2011 were issued primarily with a view to
remove inconsistencies and clarify wordings. There are separate transitional provisions for each
standard. The adoption of these amendments did not significantly impact the financial position or
performance of the Group.
•
PFRS 3, Business Combinations. The improvement clarifies that the amendments to PFRS 7,
PAS 32 and PAS 39, eliminating the exemption for contingent consideration, do not apply to
contingent consideration that arose from business combinations whose acquisition dates
precede the application of PFRS 3. The amendment limits the scope of the measurement
choices for components of non-controlling interests that are present ownership interests and
entitle their holders to a proportionate share of the entity’s net assets, in the event of
liquidation. The amendment also requires an entity (in a business combination) to account for
the replacement of the acquiree’s share-based payment transactions (whether obliged or
voluntarily) and amendment specifies the accounting for share-based payment transactions
that the acquirer does not exchange for its own awards.
•
PFRS 7, Financial Instruments - Disclosures. The amendment intends to simplify the
disclosures provided by reducing the volume of disclosures around collateral held and
improving disclosures by requiring qualitative information to put the quantitative information
in context.
•
PAS 1, Presentation of Financial Statements. The amendment clarifies that an entity may
present an analysis of each component of other comprehensive income maybe either in the
statement of changes in equity or in the notes to the financial statements.
63
•
PAS 27, Consolidated and Separate Financial Statements. The amendment clarifies that the
consequential amendments from PAS 27 made to PAS 21, The Effect of Changes in Foreign
Exchange Rates, PAS 28, Investments in Associates and PAS 31, Interests in Joint Ventures,
apply prospectively for annual periods beginning on or after July 1, 2009 or earlier when
PAS 27 is applied earlier.
•
Philippine Interpretation IFRIC 13, Customer Loyalty Programmes. The amendment clarifies
that when the fair value of award credits is measured based on the value of the awards for
which they could be redeemed, the amount of discounts or incentives otherwise granted to
customers not participating in the award credit scheme, is to be taken into account.
Future Changes in Accounting Policies
The Group reasonably expects the following new and amended accounting standards and
interpretations that will become effective subsequent to fiscal year 2012 to be applicable at a
future date. The Group has not early adopted these standards, interpretations and amendments to
existing standards and unless otherwise indicated, does not expect the adoption to have an impact
on the consolidated financial statements. The relevant disclosures will be included in the
consolidated financial statements when these become effective.
Effective in fiscal year 2013
•
Amendment to PFRS 7, Financial Instruments: Disclosures - Transfers of Financial Assets.
The amendment will allow users of financial statements to improve their understanding of
transfer transactions of financial assets (for example, securitizations), including understanding
the possible effects of any risks that may remain with the entity that transferred the assets.
The amendments also require additional disclosures if a disproportionate amount of transfer
transactions are undertaken around the end of a reporting period.
•
Amendment to PAS 12, Income Taxes - Deferred Tax: Recovery of Underlying Assets. The
amendment provides a practical solution to the problem of assessing whether recovery of an
asset will be through use or sale. It introduces a presumption that recovery of the carrying
amount of an asset will normally be through sale.
Effective in fiscal year 2014
•
Amendments to PFRS 7, Financial Instruments: Disclosures - Offsetting Financial Assets and
Financial Liabilities. These amendments require an entity to disclose information about rights
of set-off and related arrangements (such as collateral agreements). The new disclosures are
required for all recognized financial instruments that are set off in accordance with PAS 32.
These disclosures also apply to recognized financial instruments that are subject to an
enforceable master netting arrangement or similar agreement, irrespective of whether they are
set-off in accordance with PAS 32. The amendment requires entities to disclose, in a tabular
format, unless another format is more appropriate, the following minimum quantitative
information. This is presented separately for financial assets and financial liabilities
recognized at the end of the reporting period.
a. the gross amounts of those recognized financial assets and recognized financial liabilities;
b. the amounts that are set off in accordance with the criteria in PAS 32 when determining
the net amounts presented in the statement of financial position;
c. the net amounts presented in the statement of financial position;
d. the amounts subject to an enforceable master netting arrangement or similar agreement
that are not otherwise included in (b) above, including:
i. amounts related to recognized financial instruments that do not meet some or all of the
offsetting criteria in PAS 32; and
64
ii. amounts related to financial collateral (including cash collateral); and
e. the net amount after deducting the amounts in (d) from the amounts in (c) above.
The amendment affects disclosures only and has no impact on the Group’s financial position
or performance.
•
PFRS 10, Consolidated Financial Statements. This standard replaces a portion of PAS 27 that
addresses accounting for consolidated financial statements. It also addresses issues raised in
SIC-12, Consolidation - Special Purpose Entities.
PFRS 10 establishes a single control model based on three elements: (1) power over the
investee, (2) exposure of rights to variable returns from involvements with the investee, and
(3) ability to use power over the investee to affect the amount of investor’s return. This model
applies to all entities including special purpose entities and will require management to
exercise significant judgment to determine which entities are controlled, and therefore, are
required to be consolidated by a parent.
•
PFRS 11, Joint Arrangements. This standard requires an entity to account for joint
arrangements based on its rights and obligations arising from the arrangements rather than
based on the structure of the arrangement as required in PAS 31, Interests in Joint Ventures. It
has also removed the option to account jointly controlled entities using either proportionate
consolidation or equity method. Instead, jointly controlled entities that meet the definition of
a joint venture must be accounted for using the equity method.
•
PFRS 12, Disclosure of Interests in Other Entities. This standard prescribes all the disclosure
requirements for interests in subsidiaries, joint arrangements, associates and unconsolidated
structured entities. It includes all of the disclosures that were previously in PAS 27, PAS 28
and PAS 31.
•
PFRS 13, Fair Value Measurement. This standard establishes a single source of guidance for
fair value measurement and eliminates inconsistencies dispersed in various existing PFRS. It
does not change when an entity is required to use fair value, but rather provides guidance on
how to measure fair value under PFRS when fair value is required or permitted. The Group is
currently assessing the impact of this standard on its financial position and performance.
•
Amendment to PAS 1, Presentation of Financial Statements - Presentation of Items of Other
Comprehensive Income. The amendment changes the grouping of items presented in other
comprehensive income. Items that could be reclassified (or recycled) to profit or loss at a
future point in time would be presented separately from items that will never be reclassified.
The amendment affects presentation only and has no impact on the Group’s financial position
or performance.
•
Amendment to PAS 19, Employee Benefits. Amendments to PAS 19 range from fundamental
changes such as removing the corridor mechanism and the concept of expected returns on plan
assets to simple clarifications and rewording. The Group is currently assessing the impact of
the amendment on its financial position and performance.
•
Amendment to PAS 27, Separate Financial Statements. The standard was amended to contain
requirements relating only to accounting for subsidiaries, jointly controlled entities and
associates in separate financial statements as a consequence of the new PFRS 10 and
PFRS 12.
65
Effective in fiscal year 2015
•
PAS 32, Financial Instruments: Presentation - Offsetting Financial Assets and Financial
Liabilities. These amendments to PAS 32 clarify the meaning of “currently has a legally
enforceable right to set-off” and also clarify the application of the PAS 32 offsetting criteria to
settlement systems (such as central clearing house systems) which apply gross settlement
mechanisms that are not simultaneous. While the amendment is expected not to have any
impact on the net assets of the Group, any changes in offsetting is expected to impact leverage
ratios and regulatory capital requirements. The Group is currently assessing impact of the
amendments to PAS 32.
Effective in fiscal year 2016
•
PFRS 9, Financial Instruments: Classification and Measurement. PFRS 9, as issued in 2010,
reflects the first phase of the work on the replacement of PAS 39 and applies to classification
and measurement of financial assets and financial liabilities as defined in PAS 39. In
subsequent phases, hedge accounting and impairment will be addressed. The completion of
this project is expected in 2012. The adoption of the first phase of PFRS 9 will have an effect
on the classification and measurement of financial assets. The Group will determine the effect
of this standard in conjunction with the other phases, when issued, to present the
comprehensive picture.
The Group decided not to early adopt PFRS 9 for its 2012 reporting ahead of its effectivity on
January 1, 2015 and therefore the consolidated financial statements as at and for the year
ended March 31, 2012 do not reflect the impact of the said standard.
Basis of Consolidation
The consolidated financial statements consist of the financial statements of the Parent Company
and its subsidiaries as at March 31, 2012 and 2011. The financial statements of the subsidiaries
are prepared using consistent accounting policies as those of the Parent Company.
The subsidiaries and the related percentages of ownership (see Note 2) of the Parent Company as
of March 31, 2012 and 2011 are as follows:
Percentages of Ownership
Direct
Indirect
81.57%
3.10%
PAL
Abacus Distribution
Systems Philippines, Inc. (ADSPI)
Synergy Services Corporation (SSC)
Pacific Aircraft Ltd.
Pearl Aircraft Ltd.
Peerless Aircraft Ltd
PR
–
–
–
–
–
82.33%
70.23%
54.19%
84.67%
84.67%
84.67%
–
66
The subsidiaries’ operations and principal activity are as follows: ADSPI engages in development
and marketing of computerized airline reservation system; SSC engages in sanitation and janitorial
services; and Pacific Aircraft Ltd., Pearl Aircraft Ltd. and Peerless Aircraft Ltd., used to be the
trustor or beneficiary in the lease of aircraft prior to the refinancing of the lease. ADSPI and SSC
are domiciled in the Philippines. The three other subsidiaries were incorporated in the Cayman
Islands.
Subsidiaries are consolidated from the date on which control is transferred to the Parent Company
and cease to be consolidated from the date on which control is transferred out of the Parent
Company. All intercompany accounts and transactions with subsidiaries are eliminated in full.
Noncontrolling interest represents the interest in a subsidiary, which is not controlled, directly or
indirectly through subsidiaries, by the Parent Company. Noncontrolling interests represent the
interests in PAL and PR not held by the Parent Company.
The equity and net income attributable to noncontrolling interests of the consolidated subsidiaries
are recognized and, where material, are shown separately in the consolidated statement of
financial position and consolidated statement of comprehensive income, respectively.
Cash and Cash Equivalents
Cash includes cash on hand and in banks. Cash equivalents are short-term, highly liquid
investments that are readily convertible to known amounts of cash with original maturities of three
months or less from dates of acquisition and that are subject to an insignificant risk of changes in
value.
Financial and Derivative Instruments
The Group recognizes a financial asset or a financial liability in the consolidated statement of
financial position when it becomes a party to the contractual provisions of the instrument. All
regular way purchases and sales of financial assets are recognized on the trade date, i.e., the date
the Group commits to purchase the assets. Regular way purchases or sales are purchases or sales
of financial assets that require the delivery of assets within the period generally established by
regulation or convention in the market place.
The fair value of financial instruments including derivatives traded in active markets at the end of
the reporting period is based on their quoted market prices or dealer price quotations (bid price for
long positions and ask price for short positions), without any deduction for transaction costs.
When current bid and ask prices are not available, the price of the most recent transaction is used
since it provides evidence of the current fair value as long as there has not been a significant
change in economic circumstances since the time of the transaction.
For all other financial instruments not listed in an active market, the fair value is determined by
using appropriate valuation techniques. Valuation techniques include discounted cash flow
methodologies, comparison to similar instruments for which market observable prices exist, option
pricing models, and other relevant valuation models. In the absence of a reliable basis of
determining fair value, investments in unquoted equity securities are carried at cost, net of
impairment.
Financial instruments are classified as debt or equity in accordance with the substance of the
contractual arrangement. Interest, dividends, gains, and losses relating to a financial instrument
classified as a debt, are reported as expense or income. Distributions to holders of financial
instruments classified as equity are charged directly to equity.
67
Financial assets are classified as either financial assets at fair value through profit or loss, loans
and receivables, held-to-maturity investments or available-for-sale investments, as appropriate.
Financial liabilities are classified as either financial liabilities at fair value through profit or loss or
other financial liabilities.
When financial assets and financial liabilities are recognized initially, they are measured at fair
value. In the case of financial assets not classified as at fair value through profit or loss and other
liabilities, fair value at initial recognition includes any directly attributable transaction cost. The
Group determines the classification of its financial instruments upon initial recognition and, where
allowed and appropriate, reevaluates this designation at the end of each reporting period.
Financial assets and financial liabilities carried in the Group’s consolidated statement of financial
position include cash and cash equivalents, receivables, available-for-sale investments, margin
deposits and lease deposits, notes payable, accounts payable, accrued expenses, short-term and
long-term obligations, and derivative instruments such as fuel, interest rate and currency derivative
instruments.
“Day 1” difference
Where the transaction price in a non-active market is different to the fair value from other
observable current market transactions in the same instrument or based on a valuation technique
whose variables include only data from observable market, the Group recognizes the difference
between the transaction price and the fair value (a “Day 1” difference) in the consolidated profit or
loss unless it qualifies for recognition as some other type of asset. In cases where data used is not
observable, the difference between the transaction price and model value is only recognized in the
consolidated profit or loss when the inputs become observable or when the instrument is
derecognized. For each transaction, the Group determines the appropriate method of recognizing
the “Day 1” difference amount.
Financial Assets and Financial Liabilities at Fair Value through Profit or Loss
Financial assets and financial liabilities at fair value through profit or loss include financial
instruments held for trading, derivative financial instruments or those designated upon initial
recognition as at fair value through profit or loss.
Financial assets and financial liabilities are classified as held for trading if they are acquired for
the purpose of selling in the near term. Derivatives, including separated embedded derivatives, are
also classified as held for trading unless they are designated as effective hedging instruments or a
financial guarantee contract. Gains or losses on investments held for trading are recognized in the
consolidated profit or loss. Interest earned or incurred and dividend income is recorded when the
right to received payment has been established.
Where a contract contains one or more embedded derivatives, the hybrid contract may be
designated as financial asset at fair value through profit or loss, except where the embedded
derivative does not significantly modify the cash flows or it is clear that separation of the
embedded derivative is prohibited.
Financial instruments may be designated as at fair value through profit or loss by management on
initial recognition if any of the following criteria are met:
•
The designation eliminates or significantly reduces the inconsistent treatment that would
otherwise arise from measuring the assets and liabilities or recognizing gains or losses on
them on a different basis;
68
•
•
The assets or liabilities are part of a group of financial assets or financial liabilities, or both
financial assets and financial liabilities, which are managed and their performance is evaluated
on a fair value basis, in accordance with a documented risk management or investment
strategy; or
The financial instrument contains an embedded derivative, unless the embedded derivative
does not significantly modify the cash flows or it is clear, with little or no analysis, that it
would not be separately recorded.
Financial assets and financial liabilities classified under this category are carried at fair value in
the consolidated statement of financial position, with any gain or loss being recognized in
consolidated profit or loss.
The Group accounts for its derivative transactions (including embedded derivatives) under this
category with fair value changes being reported directly to consolidated profit or loss, except when
the derivative is treated as an effective accounting hedge, in which case the fair value change is
reported in consolidated profit or loss with the corresponding adjustment from the hedged
transaction (fair value hedge) or deferred in equity (cash flow hedge) under “Cumulative
translation adjustment” account.
Loans and Receivables
Loans and receivables are nonderivative financial assets with fixed or determinable payments that
are not quoted in an active market. This category includes cash and cash equivalents, receivables
arising from operations, deposits for aircraft leases and security and refundable deposits. Such
assets are carried at amortized cost using the effective interest rate method. Gains and losses are
recognized in profit or loss when the loans and receivables are derecognized or impaired, and
through the amortization process. Loans and receivables (or portion of loans and receivables) are
included in current assets if maturity is within 12 months from the end of the reporting period.
Otherwise, these are classified as noncurrent assets.
The Group classified its cash and cash equivalents, receivables, margin deposits and lease deposits
as loans and receivables as of March 31, 2012 and 2011. Information regarding the Group’s
outstanding receivables is included under Note 7.
Held-to-maturity Investments
Held-to-maturity investments are quoted nonderivative financial assets with fixed or determinable
payments and fixed maturities are classified as held-to-maturity when the Group has the positive
intention and ability to hold them to maturity. Investments intended to be held for an undefined
period are not included in this classification. Where the Group sells other than an insignificant
amount of held-to-maturity investments, the entire category would be tainted and reclassified as
available-for-sale investments. Other long-term investments that are intended to be held-tomaturity, such as bonds, are subsequently measured at amortized cost. This cost is computed as
the amount initially recognized minus principal repayments, plus or minus the cumulative
amortization using the effective interest rate method of any difference between the initially
recognized amount and the maturity amount. This calculation includes fees paid or received
between parties to the contract that are an integral part of the effective interest rate, issuance costs
and all other premiums and discounts. For investments carried at amortized cost, gains and losses
are recognized in the consolidated profit or loss when the investments are derecognized or
impaired, and through the amortization process. Assets under this category are classified as current
assets if maturity is within 12 months from the statement of financial position date. Otherwise,
these are classified as noncurrent assets.
The Group has no held-to-maturity investments as of March 31, 2012 and 2011.
69
Available-for-sale Investments
Available-for-sale investments are nonderivative financial assets that are designated as
available-for-sale or are not classified in any of the three preceding categories. After initial
recognition, available-for-sale investments are measured at fair value with gains or losses being
recognized in the consolidated statement of comprehensive income and as a separate component
of equity until the investment is derecognized or until the investment is determined to be impaired
at which time the cumulative gain or loss previously reported in equity is included in consolidated
profit or loss.
The effective yield and (where applicable) results of foreign exchange restatement for
available-for-sale debt investments are reported immediately in the consolidated profit or loss.
These financial assets (or portion of these financial assets) are classified as noncurrent assets
unless the intention is to dispose such assets within 12 months from the consolidated statement of
financial position date.
Available-for-sale investments as of March 31, 2012 and 2011 represent the Group’s investment
in United States (US) Treasury bonds, shares of stock of MacroAsia Corporation (MAC) and other
equity instruments as shown in Note 6.
Other Financial Liabilities
Other financial liabilities pertain to financial liabilities that are not held for trading nor designated
as at fair value through profit or loss upon the inception of the liability. These include liabilities
arising from operations (e.g., payables and accruals) or borrowings (e.g., long-term obligations).
The liabilities are recognized initially at fair value and are subsequently carried at amortized cost,
taking into account the impact of applying the effective interest rate method of amortization (or
accretion) for any related premium, discount and any directly attributable transaction costs. Other
financial liabilities (or portion of other financial liabilities) are included in current liabilities when
they are expected to be settled within 12 months from the reporting date or the Group does not
have an unconditional right to defer settlement of the liabilities for at least 12 months from the
reporting date.
Included under this category are the Group’s accounts payable, accrued expenses, notes payable,
obligations under finance leases, other long-term obligations and other liabilities.
Derivatives and Hedge Accounting
Freestanding derivatives
For the purpose of hedge accounting, hedges are classified primarily either as: (a) a hedge of the
fair value of an asset, liability or a firm commitment (fair value hedge); (b) a hedge of the
exposure to variability in cash flows attributable to an asset or liability or a forecasted transaction
(cash flow hedge); or (c) hedge of a net investment in a foreign operation. The Group did not
designate its derivative Transactions as cash flow or fair value hedge for the fiscal year ended
March 31, 2012 and 2011.
At the inception of a hedge relationship, the Group formally designates and documents the hedge
relationship to which the Group wishes to apply hedge accounting and the risk management
objective and strategy for undertaking the hedge. The documentation includes identification of the
hedging instrument, the hedged item or transaction, the nature of the risk being hedged and how
the entity will assess the hedging instrument’s effectiveness in offsetting the exposure to changes
in the hedged item’s fair value or cash flows attributable to the hedged risk. Such hedges are
assessed on an ongoing basis to determine that they actually have been highly effective throughout
the financial reporting periods for which they were designated.
70
In cash flow hedges, changes in the fair value of a hedging instrument that qualifies as a highly
effective cash flow hedge are included in other comprehensive income, net of related deferred
income tax. The ineffective portion is immediately recognized in consolidated profit or loss.
For cash flow hedges with critical terms that match those of the hedged items and where there are
no basis risks (such as the pay-fixed, receive-floating interest rate swaps), the Group expects the
hedges to exactly offset changes in expected cash flows relating to the hedged risk
(e.g., fluctuations in fuel price and benchmark interest rates). This assessment on hedge
effectiveness is performed on a quarterly basis by the Group by comparing the critical terms of the
hedges and the hedged items to ensure that they continue to match and by evaluating the continued
ability of the counterparties to perform their obligations under the derivative contracts.
For cash flow hedges with basis risks (such as crude oil derivatives entered into as proxy hedges
for forecasted jet fuel purchases), the Group assesses the effectiveness of its hedges (both on a
prospective and retrospective basis) by using a regression model to determine the correlation of
the percentage change in prices of underlying commodities used to hedge jet fuel to the percentage
change in prices of jet fuel over a specified period that is consistent with the hedge time horizon or
30 data points whichever is longer.
If the hedged cash flow results in the recognition of an asset or a liability, gains and losses initially
recognized in equity are transferred from equity to profit or loss in the same period or periods
during which the hedged forecasted transaction or recognized asset or liability affect the
consolidated profit or loss.
When the hedge ceases to be highly effective, hedge accounting is discontinued prospectively. In
this case, the cumulative gain or loss on the hedging instrument that has been reported directly in
equity is recognized in the consolidated profit or loss.
For derivatives that are not designated as effective accounting hedges, any gains or losses arising
from changes in fair value of derivatives are recognized directly in the consolidated profit or loss.
Embedded derivatives
Embedded derivatives are separated from the hybrid contracts and accounted for at fair value
through profit or loss when the entire hybrid contracts (composed of the host contract and the
embedded derivative) are not accounted for at fair value through profit or loss, the economic risks
of the embedded derivatives are not closely related to those of their respective host contracts, and
a separate instrument with the same terms as the embedded derivative would meet the definition of
a derivative.
Changes in fair values are included in consolidated profit or loss. Derivatives are carried as assets
when the fair value is positive and as liabilities when the fair value is negative.
The Group assesses whether an embedded derivative is required to be separated from the host
contract and accounted for as a derivative when the entity first becomes a party to the contract.
Subsequent reassessment is prohibited unless there is a change in the terms of the contract that
significantly modifies the cash flows that otherwise would be required under the contract, in which
case reassessment is required. The Group determines whether a modification to cash flows is
significant by considering the extent to which the expected future cash flows associated with the
embedded derivative, the host contract or both have changed and whether the change is significant
relative to the previously expected cash flows on the contract.
71
Derecognition of Financial Assets and Financial Liabilities
A financial asset (or, where applicable, a part of a financial asset or part of a group of similar
financial assets) is derecognized when:
• the contractual right to receive cash flows from the asset has expired;
• the Group retains the right to receive cash flows from the asset, but has assumed an obligation
to pay them in full without material delay to a third party under a “pass-through” arrangement;
or
• the Group has transferred its right to receive cash flows from the asset and either (a) has
transferred substantially all the risks and rewards of ownership of the asset, or (b) has neither
transferred nor retained substantially all the risks and rewards of the asset, but has transferred
control of the asset.
When the Group has transferred its right to receive cash flows from an asset and has neither
transferred nor retained substantially all the risks and rewards of ownership of the asset nor
transferred control of the asset, the asset is recognized to the extent of the Group’s continuing
involvement in the asset.
A financial liability is derecognized when the obligation under the liability is discharged,
cancelled or has expired.
When an existing financial liability is replaced by another from the same lender on substantially
different terms, or the terms of an existing liability are substantially modified, such modification is
treated as a derecognition of the carrying value of the original liability and the recognition of a
new liability at fair value, and any resulting difference is recognized in consolidated profit or loss.
Impairment of Financial Assets
The Group assesses at the end of each reporting period whether there is objective evidence that a
financial asset may be impaired. If such evidence exists, any impairment loss is recognized in the
consolidated profit or loss.
Financial assets carried at amortized cost
For financial assets carried at amortized cost, whenever it is probable that the Group will not
collect all amounts due according to the contractual terms of receivables, an impairment loss has
been incurred. The amount of the loss is measured as the difference between the asset’s carrying
amount and the present value of estimated future cash flows discounted at the financial asset’s
original effective interest rate. The carrying amount of the asset is reduced either directly or
through the use of an allowance account. Any loss determined is recognized in consolidated profit
or loss.
The Group initially assesses whether objective evidence of impairment exists individually for
financial assets that are individually significant, and individually or collectively for financial
assets that are not individually significant. If it is determined that no objective evidence of
impairment exists for an individually assessed financial asset, whether significant or not, the asset
is included in a group of financial assets with similar credit risk characteristics and that group of
financial assets is collectively assessed for impairment. Assets that are individually assessed for
impairment and for which an impairment loss is or continues to be recognized are not included in
a collective assessment of impairment.
In relation to receivables, a provision for impairment is made when there is objective evidence
(such as the probability of insolvency or significant financial difficulties of the debtor) that the
Group will not be able to collect all of the amounts due under the original terms of the invoice.
The carrying amount of the receivable is reduced through the use of an allowance account.
Impaired receivables are derecognized when they are assessed as uncollectible.
72
If, in a subsequent period, the amount of the estimated impairment loss decreases because of an
event occurring after the impairment was recognized, the previously recognized impairment loss is
reversed. Any subsequent reversal of an impairment loss is recognized in consolidated profit or
loss, to the extent that the carrying value of the asset does not exceed its amortized cost at the
reversal date.
Assets carried at cost
If there is objective evidence that an impairment loss on financial assets carried at cost such as an
unquoted equity instrument that is not carried at fair value because its fair value cannot be
measured reliably, or on a derivative asset that is linked to and must be settled by delivery of such
an unquoted equity instrument has been incurred, the amount of the loss is measured as the
difference between the asset’s carrying amount and the present value of estimated future cash
flows discounted at the current market rate of return for a similar financial asset.
Available-for-sale investments
In case of equity investments classified as available-for-sale investments, impairment would
include a significant or prolonged decline in the fair value of the investments below their cost.
Where there is evidence of impairment loss, the cumulative loss, measured as the difference
between the acquisition cost and the current fair value, less any impairment loss on that financial
asset previously recognized in income, is removed from the consolidated equity and recognized in
the consolidated profit or loss. Impairment losses on equity investments are not reversed through
income. Increases in fair value after impairment are recognized as other comprehensive income in
the consolidated statement of comprehensive income and consolidated statement of changes in
equity.
In the case of debt instruments classified as available-for-sale, impairment is assessed based on the
same criteria as financial assets carried at amortized cost. Future interest income is based on the
reduced carrying amount and is accrued based on the rate of interest used to discount cash flows
for the purpose of measuring impairment loss. If, in subsequent year, the fair value of a debt
instrument increases and the increase can be related objectively to an event occurring after the
impairment loss was recognized against income, the impairment loss is reversed through
consolidated profit or loss.
Offsetting of Financial Instruments
Financial assets and financial liabilities are offset and the net amount reported in the consolidated
statement of financial position if, and only if, there is a currently enforceable legal right to offset
the recognized amounts and there is an intention to settle on a net basis, or to realize the asset and
settle the liability simultaneously. This is not generally the case with master netting agreements,
and the related assets and liabilities are presented gross in the consolidated statement of financial
position.
Expendable Parts, Fuel, Materials and Supplies
Expendable parts, fuel, materials and supplies are stated at the lower of cost and net realizable
value. Cost is determined using the moving weighted average method. Net realizable value
represents the amount expected to be realized from the use of the expendable parts, fuel, materials
and supplies, considering factors such as age and physical condition of these assets.
Asset Held-for-Sale
Noncurrent assets and disposal groups are classified as held-for-sale if their carrying amount will
be recovered principally through a sale transaction rather than through continuing use. This
condition is considered met only when the sale is highly probable and the asset (or disposal group)
is available for immediate sale at its present condition. Management must be committed to the
73
sale, which should be expected to qualify for recognition as a completed sale within one year from
the date of classification. However, events or circumstances may extend the period to complete the
sale beyond one year. An extension of the period required to complete a sale does not preclude an
asset (or disposal group) from being classified as held-for-sale if the delay is caused by events or
circumstances beyond the Group’s control and there is sufficient evidence that the entity remains
committed to its plan to sell the asset (or disposal group).
Property and Equipment
Property and equipment (except buildings and improvements) are stated at cost less accumulated
depreciation and any impairment in value. Buildings and improvements are stated at revalued
amounts less accumulated depreciation and any impairment in value. Revalued amounts were
determined based on valuations performed by various qualified and independent appraisers.
Revaluations are made with sufficient regularity. The latest appraisals reports are as of
March 31, 2011.
For subsequent revaluations, the accumulated depreciation at the date of the revaluation is
eliminated against the gross carrying amount of the asset and the net amount restated to the
revalued amount of the asset. Any resulting increase in the asset’s carrying amount as a result of
the revaluation is recognized as other comprehensive income credited directly to equity as
“Revaluation increment”, net of the related deferred income tax. Any resulting decrease is directly
charged against the related revaluation increment to the extent of the revaluation increment
previously recognized in respect of the same asset and any excess is charged against consolidated
profit or loss.
The initial cost of property and equipment comprises its purchase price, any related capitalizable
borrowing costs attributed to predelivery payments incurred on account of aircraft acquisition and
other significant assets under construction and other directly attributable costs of bringing the asset
to its working condition and location for its intended use. Manufacturers’ credits that reduce the
price of the aircraft, received from aircraft and engine manufacturers are recorded upon delivery of
the related aircraft and engines. Such credits are applied as a reduction from the cost of the
property and equipment (including those under finance lease).
Expenditures incurred after the property and equipment have been put into operation, such as
repairs and maintenance costs, are normally charged to income in the period in which the costs are
incurred. In situations where it can be clearly demonstrated that the expenditures have resulted in
an increase in the future economic benefits expected to be obtained from the use of an item of
property and equipment beyond its originally assessed standard of performance, the expenditures
are capitalized as additional cost of property and equipment.
Depreciation, which commences when the asset is available for its intended use, is computed on a
straight-line basis over the following estimated useful lives of the assets:
Passenger aircraft (owned and under finance lease)
Spare engines
Other aircraft
Buildings and improvements
Rotable and reparable parts
Other ground property and equipment
Number of Years
12 to 20
12 to 20
5 to 10
8 to 40
3 to 18
3 to 8
Leasehold improvements are amortized over the term of the lease or life of the improvements,
whichever is shorter.
74
Expenditures for heavy maintenance on passenger aircraft are capitalized at cost and depreciated
over the estimated number of years until the next major overhaul or inspection. Generally, heavy
maintenance visits are required every six to eight years for airframe and 10 to 12 years for landing
gear.
The estimated useful lives, depreciation and amortization method and residual values are reviewed
periodically to ensure that the periods, method of depreciation and residual values are consistent
with the expected pattern of economic benefits from items of property and equipment. Any
changes in estimate arising from the review are accounted for prospectively.
When assets are sold or retired, their costs, accumulated depreciation and amortization, any
impairment in value and related revaluation increment are eliminated from the accounts. Any gain
or loss resulting from their disposal is recognized as income and included in the consolidated
profit or loss.
The portion of “Revaluation increment, net of deferred income tax”, is transferred to deficit when
these are realized through depreciation or upon the disposal or retirement of the property.
Construction in progress represents predelivery payments and related borrowing costs on aircraft
under construction and aircraft modifications in progress and buildings and improvements and
other ground property under construction. Construction in progress is not depreciated until such
time when the relevant assets are completed and available for use.
Asset Retirement Obligation (ARO)
The Group is required under various aircraft lease agreements to restore the leased aircraft to their
original condition and to bear the cost of dismantling and restoration at the end of the lease term.
PAL provides for these costs over the terms of the leases through contribution to a maintenance
reserve fund, (MRF), based on aircraft hours flown until the next scheduled checks. If the
estimated cost of dismantling and restoration is expected to exceed the cumulative MRF, an
additional obligation is recognized over the remaining term of the leases. The amount of
obligation is carried at amortized cost using the effective interest rate method.
Investment Properties
Investment properties include parcels of land and building and building improvements not used in
operations.
Investment properties are measured initially at cost, including any transaction costs. The carrying
amount includes the cost of replacing part of an existing investment property at the time that cost
is incurred if the recognition criteria are met; and excludes the costs of day-to-day servicing of an
investment property.
Investment properties are subsequently measured at cost less accumulated depreciation (except
land) and any impairment in value. Land is subsequently carried at cost less any impairment in
value.
Depreciation and amortization of depreciable investment properties is calculated on a straight-line
basis over the estimated useful lives ranging from six to eight years.
Transfers are made to investment properties when, and only when, there is a change in use,
evidenced by cessation of owner-occupation, commencement of an operating lease to another
party or completion of construction or development. Transfers are made from investment
properties when, and only when, there is a change in use, evidenced by commencement of
owner-occupation or commencement of development with a view to sale.
75
When an item of property and equipment previously carried at revalued amount is transferred to
investment properties, the carrying value at the date of reclassification is retained as the new cost
of the investment property. The related revaluation increment is closed to retained earnings.
Investment properties are derecognized when they are either disposed of or permanently
withdrawn from use and no future economic benefit is expected from their disposal. Any gains or
losses on the retirement or disposal of an investment property are recognized in the consolidated
profit or loss in the year of retirement or disposal.
Impairment of Property and Equipment and Investment Properties
The carrying values of property and equipment and investment properties are reviewed for
impairment when events or changes in circumstances indicate that the carrying values may not be
recoverable. If any such indication exists and where the carrying values exceed the estimated
recoverable amounts, the assets or cash generating units are written down to their recoverable
amounts. The recoverable amount is the greater of fair value less costs to sell and value-in-use. In
assessing value-in-use, the estimated future cash flows are discounted to their present value using
a pretax discount rate that reflects current market assessments of the time value of money and the
risks specific to the asset. For an asset that does not generate largely independent cash inflows,
the recoverable amount is determined for the cash generating unit to which the asset belongs.
Impairment losses, if any, are recognized in the consolidated profit or loss.
Leases
The determination of whether the arrangement is, or contains a lease is based on the substance of
the arrangement at inception date of whether the fulfillment of the arrangement depends on the use
of a specific asset or assets or the arrangement conveys a right to use the asset. A reassessment is
made after the inception of the lease if any of the following applies: (a) there is a change in
contractual terms, other than a renewal or extension of the arrangement; (b) a renewal option is
exercised or extension granted, unless the term of the renewal or extension was initially included
in the lease term; (c) there is a change in the determination of whether fulfillment is dependent on
a specified asset; or (d) there is substantial change to the asset.
Where the reassessment is made, lease accounting shall commence or cease from the date when
the change in circumstances gave rise to the reassessment for scenarios (a), (c), or (d) above, and
at the date of renewal or extension period for scenario (b).
Group as Lessee
Finance leases, which transfer to the Group substantially all the risks and rewards incidental to
ownership of the leased item, are capitalized at the inception of the lease at the fair value of the
leased property or, if lower, at the present value of the minimum lease payments. Obligations
arising from aircraft under finance lease agreements are classified in the consolidated statements
of financial position as part of “Long-term obligations”.
Lease payments are apportioned between financing charges and reduction of the lease liability so
as to achieve a constant rate of interest on the remaining balance of the liability. Financing
charges are charged directly against consolidated profit or loss.
Leases where the lessor retains substantially all the risks and rewards of ownership of the asset are
classified as operating leases. Operating lease expense is recognized in the consolidated profit or
loss on a straight-line basis over the terms of the lease agreements.
A sale and leaseback transaction involves the sale of an asset and the leasing back of the same
asset. If a sale and leaseback transaction results in an operating lease, and it is clear that the
transaction is at fair value, any profit or loss is recognized immediately. If the sale price is below
76
fair value, any profit or loss is recognized immediately except that, if the loss is compensated for
by future lease payments at below market price, it is deferred and amortized in proportion to the
lease payments over the period for which the asset is expected to be used. If the sale price is
above fair value, the excess over fair value is deferred and amortized over the period for which the
asset is expected to be used. If a sale and leaseback transaction results in a finance lease, any
excess of sales proceeds over the carrying amount is deferred and amortized over the lease term.
Group as Lessor
Leases where the Group does not transfer substantially all the risks and rewards of ownership of
the assets are classified as operating leases. Initial direct costs incurred in negotiating operating
leases are added to the carrying amount of the leased asset and recognized over the lease term on
the same basis as the rental income. Contingent rents are recognized as revenue in the period in
which they are earned.
Provisions and Contingencies
Provisions are recognized when (a) the Group has a present obligation (legal or constructive) as a
result of a past event; (b) it is probable that an outflow of resources embodying economic benefits
will be required to settle the obligation; and (c) a reliable estimate of the amount of the obligation
can be made. Where the Group expects a provision to be reimbursed, for example under an
insurance contract, the reimbursement is recognized as a separate asset but only when the
reimbursement is virtually certain. If the effect of the time value of money is material, provisions
are determined by discounting the expected future cash flows at a pretax rate that reflects current
market assessments of the time value of money and, where appropriate, the risks specific to the
liability. Where discounting is used, the increase in the provision due to the passage of time is
recognized as interest expense.
Contingent liabilities are not recognized in the consolidated statement of financial position. They
are disclosed in the notes to consolidated financial statements unless the possibility of an outflow
of resources embodying economic benefits is remote. A contingent asset is not recognized in the
consolidated statement of financial position but disclosed in the notes to consolidated financial
statements when an inflow of economic benefits is probable. If it is virtually certain that an inflow
of economic benefits will arise, the asset and the related income are recognized in the consolidated
financial statements.
Equity
Capital stock is measured at par value for all shares issued. Incremental costs incurred directly
attributable to the issuance of new shares are shown in equity as a deduction from proceeds, net of
tax.
When the shares are sold at premium, the difference between the proceeds and the par value is
credited to the “Additional-paid in capital” account.
Deficit represents the cumulative balance of net income or loss, net of any dividend declaration
and other capital adjustments.
Revenue and Related Commissions
Passenger ticket and cargo waybill sales, excluding portion relating to awards under the Frequent
Flyer Program, are initially recorded as “Unearned transportation revenue” in the consolidated
statement of financial position until recognized as “Revenue” in the consolidated profit or loss
when the transportation service is rendered (e.g., when passengers and cargo are flown/lifted).
Revenue is measured at fair value of the consideration received or receivable, excluding sales
taxes, discounts and commissions. Revenue also includes recoveries from surcharges during the
year.
77
The related commission is recognized as expense in the same period when the transportation
service is provided and is included as part of “Reservation and sales” in the consolidated profit or
loss.
Liability Under Frequent Flyer Program
PAL operates a frequent flyer program called “Mabuhay Miles”. A portion of passenger revenue
attributable to the award of frequent flyer miles, estimated based on expected utilization of these
benefits, is deferred until utilized. The miles expected to be redeemed are measured at fair value
which is estimated using the applicable fare based on the historical redemption. The deferred
revenue is included under “Reserves and other noncurrent liabilities” in the consolidated statement
of financial position. Any remaining unutilized benefits are recognized as revenue upon
redemption or expiry.
Other Comprehensive Income
Other comprehensive income comprises items of income and expense (including items previously
presented under the consolidated statement of changes in equity) that are not recognized in the
consolidated profit or loss for the year in accordance with PFRS. Other comprehensive income of
the Group includes gains and losses on remeasuring available-for-sale investments, unrealized
gains and losses on sale of available-for-sale investments, any effective portion of gains and losses
on hedging instruments designated as cash flow hedges and changes in revaluation increment in
property.
Interest, Dividend and Lease Income
Interest on cash, cash equivalents and other short-term cash investments is recognized as the
interest accrues using the effective interest rate method. Dividend income from available-for-sale
equity investments is recognized when the Group’s right to receive payment is established. Lease
income is recognized on a straight-line basis over the lease term.
Retirement Benefits Cost
Retirement benefits cost under the defined benefit plan is actuarially determined using the
projected unit credit method. This method reflects services rendered by employees up to the date
of valuation and incorporates assumptions concerning employees’ projected salaries. Actuarial
valuations are conducted with sufficient regularity with option to accelerate when significant
changes to underlying assumptions occur. Actuarial gains and losses are recognized as income or
expense when the net cumulative unrecognized actuarial gains and losses for the plan at the end of
the previous reporting period exceeded 10% of the higher of the present value of defined benefit
obligation and the fair value of plan assets at that date. These gains or losses are recognized over
the expected average remaining working lives of the employees participating in the plan.
Past service cost is recognized as an expense on a straight-line basis over the average period when
the benefits become vested. If the benefits are already vested immediately following the
introduction of, or changes to, the retirement plan, past service cost is recognized immediately.
Retirement benefits cost includes current service cost, interest cost, amortization of unrecognized
past service costs, actuarial gains and losses, experience adjustments, effect of any curtailment or
settlement and changes in actuarial assumptions over the expected average remaining working
lives of covered employees. The defined benefit liability is the aggregate of the present value of
the defined benefit obligation and actuarial gains and losses not recognized, reduced by past
service cost not yet recognized, and the fair value of plan assets out of which the obligations are to
be settled directly. If such aggregate is negative, the asset is measured at the lower of such
aggregate or the aggregate of cumulative unrecognized net actuarial losses and past service cost
and the present value of any economic benefits available in the form of refunds from the plans or
reductions in the future contributions to the plan.
78
Where the Group is demonstrably committed to make a significant reduction in the number of
employees covered by the plan, a curtailment gain or loss is recognized. The amount of
curtailment gain or loss shall comprise any resulting change in the present value of the defined
benefit obligation, change in the fair value of the plan assets and any related actuarial gains and
losses and past service cost that were previously unrecognized.
Borrowing Costs
Borrowing costs are capitalized if they are directly attributable to the acquisition or construction of
a qualifying asset. Capitalization of borrowing costs commences when the activities to prepare the
asset are in progress and expenditures and borrowing costs are being incurred. Borrowing costs
are capitalized until the assets are substantially ready for their intended use. All other borrowing
costs are expensed as incurred.
Expenses
Expenses are recognized when incurred. These are measured at the fair value of the consideration
paid or payable.
Income Taxes
Current income tax
Current income tax assets and liabilities for the current and prior periods are measured at the
amount expected to be recovered from or paid to the taxation authorities. The tax rates and tax
laws used to compute the amounts are those that have been enacted or substantively enacted as of
the end of the reporting period.
Deferred income tax
Deferred income tax is provided, using the balance sheet liability method, on all temporary
differences at the statement of financial position date between the tax bases of assets and liabilities
and their carrying amounts for financial reporting purposes.
Deferred income tax liabilities are recognized for all taxable temporary differences, including
asset revaluations. Deferred income tax assets are recognized for all deductible temporary
differences, carry forward benefits of unused tax credits from the excess of minimum corporate
income tax (MCIT) over the regular corporate income tax and unused net operating loss carryover
(NOLCO), to the extent that it is probable that sufficient future taxable profits will be available
against which the deductible temporary differences and carry forward benefits of unused tax
credits and unused NOLCO can be utilized. Deferred income tax, however, is not recognized
when it arises from the initial recognition of an asset or liability in a transaction that is not a
business combination and, at the time of the transaction, affects neither the accounting profit nor
taxable profit or loss.
Deferred income tax liabilities are not provided on nontaxable temporary differences associated
with investments in domestic subsidiaries and associates. With respect to investments with other
subsidiaries and associates, deferred income tax liabilities are recognized except where the timing
of reversal of the temporary differences can be controlled by the parent or investor and it is
probable that the temporary difference will not reverse in the foreseeable future.
The carrying amount of deferred income tax assets is reviewed at each reporting period and
reduced to the extent that it is no longer probable that sufficient future taxable profits will be
available to allow all or part of the deferred income tax asset to be utilized. Unrecognized
deferred income tax assets are reassessed at each statement of financial position date and are
recognized to the extent that it has become probable that sufficient future taxable profits will allow
the deferred income tax asset to be recovered.
79
Deferred income tax assets and deferred income tax liabilities are measured at the tax rates that are
expected to apply to the period when the asset is realized or the liability is settled, based on tax
rates and tax laws that have been enacted or substantively enacted as of the end of reporting
period.
Income tax relating to items recognized directly in equity is recognized in consolidated equity and
not included as part of the consolidated profit or loss for the period.
Deferred income tax assets and deferred income tax liabilities are offset if a legally enforceable
right exists to set off current income tax assets against current income tax liabilities and the
deferred income taxes relate to the same taxable entity and the same taxation authority.
Functional Currency and Foreign Currency-denominated Transactions and Translations
Transactions in foreign currencies are initially recorded using the functional currency rate at the
date of the transaction. Outstanding monetary assets and liabilities denominated in foreign
currencies are translated using the functional currency rate of exchange at the end of reporting
period. All differences are taken to other comprehensive income. Non-monetary items that are
measured in terms of historical cost in a foreign currency are translated using the exchange rates at
the dates of the transactions. Non-monetary items measured at fair value in a foreign currency are
translated using the exchange rates at the date when the fair value was determined.
Each entity in the Group determines its own functional currency and the items included in the
separate financial statements of each entity are measured using the determined functional
currency. The results of operations and financial position of all Group entities (none of which has
the functional currency of a hyperinflationary economy) that have functional currencies different
from Philippine peso, which is the functional and presentation currency of the Parent Company,
are translated to Philippine peso as follows:
a. assets and liabilities for each statement of financial position presented are translated at the
closing rate at the end of reporting period;
b. comprehensive income items for each statement of comprehensive income presented are
translated at the monthly average exchange rates (unless this average is not a reasonable
approximation of the cumulative effect of the rates prevailing on the transaction dates, in
which case income and expenses are translated at the dates of the transactions);
c. capital stock and other equity items resulting from transactions with equity holders
(i.e., additional paid-in capital) and equity items resulting from income and expenses directly
recognized in equity (i.e., revaluation increment in property) are translated using the rates
prevailing on the transaction dates; and
d. all resulting exchange differences are recognized as other comprehensive income and a
separate component of the consolidated equity, in the account “Cumulative translation
adjustment”.
On consolidation, exchange differences arising from the translation of the net investment in
foreign operations are taken to the consolidated equity and recorded as other comprehensive
income. When a foreign operation is sold or disposed of, exchange differences that were
previously recorded in the consolidated equity are recognized in the consolidated profit or loss.
80
Basic/Diluted Earnings (Loss) Per Share
Basic earnings (loss) per share (EPS) is calculated based on net income (loss) and total
comprehensive income (loss) for the year. EPS is calculated by dividing net income (loss) before
other comprehensive income or total comprehensive income (loss) for the year by the weighted
average number of issued and outstanding shares of stock during the year, after giving retroactive
effect to any stock dividends declared or stock rights exercised. The Group has no dilutive
potential common shares.
Events After the Reporting Date
Post year-end events that provide additional information about the Group’s position at the
reporting date (adjusting events), if any, are reflected in the consolidated financial statements.
Post year-end events that are not adjusting events are disclosed in the notes to consolidated
financial statements when material.
4. Summary of Significant Accounting Judgments, Estimates and Assumptions
The preparation of the consolidated financial statements in accordance with PFRS requires the
Group’s management to make judgments, estimates and assumptions that affect the amounts
reported in the consolidated financial statements. These judgments, estimates and assumptions are
based on management’s evaluation of relevant facts and circumstances as of the end of the
reporting period. Future events may occur which will cause the assumptions used in arriving at
the estimates to change. The effects of any change in estimates are reflected in the consolidated
financial statements as they become reasonably determinable. Revisions to accounting estimates
are recognized in the period in which the estimate is revised if the revision affects only that period,
or in the period of the revision and future periods if the revision affects both current and future
periods.
Judgments
In the process of applying the Group’s accounting policies, management has made the following
judgments, apart from those involving estimations, which have the most significant effect on
amounts recognized in the consolidated financial statements.
Determination of functional currency
Judgment is exercised in assessing various factors in determining the functional currency of each
entity within the Group, including prices of goods and services, competition, cost and expenses
and other factors including the currency in which financing is primarily undertaken by each entity.
Additional factors are considered in determining the functional currency of a foreign operation,
including whether its activities are carried as an extension of that of the Parent Company rather
than being carried out with significant autonomy.
The Parent Company, based on the relevant economic substance of the underlying circumstances,
has determined its functional currency to be Philippine peso. It is the currency of the primary
economic environment in which it operates. The functional currency of PAL, its major subsidiary,
has been determined to be the US dollar (USD).
Classification of financial instruments
The Group exercises judgment in classifying a financial instrument, or its component parts, on
initial recognition as either a financial asset, a financial liability or an equity instrument in
accordance with the substance of the contractual arrangement and the definitions of a financial
asset, a financial liability or an equity instrument. The substance of a financial instrument, rather
than its legal form, governs its classification in the consolidated statement of financial position.
The classification of the Group’s financial assets and financial liabilities are presented in Note 28.
81
Derecognition of accounts receivable
In 2012, the Group sold its rights to the cash flows arising from its credit card receivables
including future credit card receivables to a third party for a payment of P
=2.15 billion
($50.00 million). The Group has determined that substantially all the risk and rewards of the
portfolio have been retained and consequently, the receivables were not derecognized. The Group
accounted for the transaction as a collateralized borrowing and recorded the cash received as a
financial liability (see Note 15).
Impairment of available-for-sale equity investments
The Group treats available-for-sale equity investments as impaired when there has been a
significant or prolonged decline in the fair value below its cost or where other objective evidence
of impairment exists. The determination of what is “significant” or “prolonged” requires
judgment. The Group considers the decline in value as significant when the value generally
decreased by 20% or more and prolonged if the decline persisted for a period greater than 12
months for quoted equity securities. In addition, the Group evaluates other factors, including
normal volatility in share price for quoted equity shares and financial performance of the investee
company for unquoted equity shares. No impairment on available-for-sale equity investments was
recognized in 2012 and 2011.
The carrying value of the Group’s available-for-sale equity investments amounted to
=522.72 million and P
P
=560.97 million as of March 31, 2012 and 2011, respectively (see Note 6).
Classification of leases - Group as lessee
Management exercises judgment in determining whether substantially all the significant risks and
rewards of ownership of the leased assets are transferred to the Group. Lease contracts, which
transfer to the Group substantially all the risks and rewards incidental to ownership of the leased
items are classified as finance leases. Otherwise, they are considered as operating leases.
The Group has lease agreements covering some of its aircraft where the lease terms approximate
the estimated useful lives of the aircraft or the present value of the minimum lease payments
amount to at least substantially all of the fair value of the leased aircraft, which indicate the risks
and rewards related to the asset are transferred to the Group. These leases are classified as finance
leases. The net carrying value of these aircrafts under finance lease amounted to P
=28.47 billion
and P
=35.79 billion as of March 31, 2012 and 2011, respectively (see Notes 10 and 25).
The Group also has lease agreements covering some of its aircraft and engines where it has
determined that the risks and rewards related to the properties are retained with the lessors
(e.g., no bargain purchase option and transfer of ownership at the end of the lease term). The
leases are, therefore, accounted for as operating leases (see Notes 18 and 25).
Classification of leases - Group as lessor
The Group has lease agreements where it has determined that it has retained substantially all the
risks and rewards incidental to ownership of the leased assets. These leases are classified as
operating leases (see Note 18).
Contingencies
The Group is involved in various labor disputes, litigations, claims, and tax assessments that are
normal to its business. Based on the opinion of the Group’s legal counsels on the progress and
legal grounds of these cases, the Group believes that it may have a present obligation arising from
a past event but that their likely outcome and estimated potential cash outflow cannot be
determined reasonably as of this time. As such, no provision was made for these contingencies.
82
Estimates
The key assumptions concerning the future and other key sources of estimation and uncertainty at
the end of the reporting period, that have a significant risk of causing a material adjustment to the
carrying amounts of assets and liabilities within the next financial year are discussed below.
Estimation of allowance for doubtful accounts
The Group maintains allowances for doubtful accounts at a level considered adequate to provide
for uncollectible receivables. The Group reviews the age and the status of receivables, designed to
identify account with objective evidence of impairment, and provide the appropriate allowance for
impairment.
The allowance for doubtful accounts relating to receivables which were individually assessed as
impaired is estimated as the difference between the carrying amount of the receivables (at
amortized cost) and the present value of estimated future cash flows (using the original effective
interest rate). Accounts which were not subject to specific impairment are collectively assessed for
impairment and the amount of allowance is determined based on historical loss rate and age of
receivables. The amount and timing of recorded expenses for any period could therefore differ
based on the estimates made.
The carrying value of receivables, net of allowance for doubtful accounts, as of March 31, 2012
and 2011 amounted to P
=7.21 billion and P
=5.37 billion, respectively. The allowance for doubtful
accounts as of March 31, 2012 and 2011 amounted to P
=4.71 billion and P
=4.40 billion, respectively
(see Note 7).
Application of effective interest rate method of amortization
and impact of revisions in cash flow estimates
The Group carries certain financial assets and financial liabilities at amortized cost, which is
determined at inception of the instrument, taking into account any fees, points paid or received,
transaction costs and premiums or discounts, along with the cash flows and the expected life of the
instrument. In cases where the Group revises its estimates of cash flow receipts or payments and
projection of change in its financial assets or financial liabilities, the Group adjusts the carrying
amounts to reflect actual and revised estimated cash flows. The Group recalculates the carrying
amount by discounting the estimated future cash flows using the financial asset or financial
liability’s original effective interest rate, with the resulting adjustment being recognized in profit
or loss.
Determination of fair value of financial instruments (including derivatives)
The Group initially records all financial instruments at fair value and subsequently carries certain
financial assets and financial liabilities at fair value, which requires use of accounting estimates
and judgment. Valuation techniques are used particularly for financial assets and financial
liabilities (including derivatives) that are not quoted in an active market. Where valuation
techniques are used to determine fair values (e.g., discounted cash flow, option models), they are
periodically reviewed by qualified personnel who are independent of the trading function. All
models are calibrated to ensure that outputs reflect actual data and comparative market prices. To
the extent practicable, models use only observable data as valuation inputs. However, other inputs
such as credit risk (whether that of the Group or the counterparties), forward prices, volatilities
and correlations, require management to develop estimates or make adjustments to observable data
of comparable instruments. The amount of changes in fair values would differ if the Group uses
different valuation assumptions or other acceptable methodologies. Any change in fair value of
these financial instruments (including derivatives) would affect either the consolidated statement
of comprehensive income or consolidated statement of changes in equity.
83
The Group uses the following hierarchy for determining and disclosing the fair value of financial
instruments by valuation technique: (a) Level 1 - quoted (unadjusted) prices in active markets for
identical assets or liabilities; (b) Level 2 - other techniques for which all inputs which have a
significant effect on the recorded fair value are observable, either directly or indirectly; and
(c) Level 3 - techniques which use inputs which have a significant effect on the recorded fair value
that are not based on observable market data.
The fair values of the Group’s financial assets and financial liabilities are presented in Note 28.
Determination of net realizable value of expendable parts, fuel, materials and supplies
The Group’s estimates of the net realizable values of expendable parts, fuel, materials and supplies
are based on the most reliable evidence (e.g., age and physical condition of the inventory)
available at the time the estimates are made, of the amount that these assets are expected to be
realized. A new assessment is made of the net realizable value in each subsequent period. When
the circumstances that previously caused expendable parts, fuel, materials and supplies to be
written down below cost no longer exist or when there is a clear evidence of an increase in net
realizable value because of change in economic circumstances, the amount of the write-down is
reversed so that the new carrying amount is the lower of the cost and the revised net realizable
value. The carrying amount of expendable parts, fuel, materials and supplies as of March 31, 2012
and 2011 amounted to P
=1.59 billion and P
=1.77 billion, respectively (see Note 8).
Valuation of property and equipment under revaluation basis
The Group’s buildings and improvements are carried at revalued amounts, which approximate
their fair values at the date of the revaluation, less any subsequent accumulated depreciation and
any accumulated impairment losses. The valuations of property and equipment are performed by
professionally qualified independent appraisers using generally acceptable valuation techniques
and methods. Revaluations are made regularly to ensure that the carrying amounts do not differ
materially from those which would be determined using fair values at end of reporting period.
The resulting revaluation increment, net of related deferred income tax, in the valuation of these
assets based on appraisal reports amounted to P
=282.68 million (net of non-controlling interests’
share amounting to P
=51.19 million) and P
=331.18 million (net of non-controlling interests’ share
amounting to P
=59.97 million) as of March 31, 2012 and 2011, respectively (see Note 17). This is
presented as “Revaluation increment - net of deferred income tax” in the equity section of the
consolidated statement of financial position and the portion transferred to deficit resulting from its
realization and change in classification (e.g., reclassification to investment property) in the
consolidated statement of changes in equity. Increase in the value of property resulting from
revaluation is treated as other comprehensive income. The carrying value of property and
equipment carried at appraised value amounted to P
=568.45 million and P
=654.51 million as of
March 31, 2012 and 2011, respectively (see Note 10).
Recognition of ARO
Property and equipment includes the excess of estimated cost of heavy maintenance on the leased
aircraft required on the redelivery to the lessor over the cumulative MRF contribution. The
amount of obligation is carried at amortized cost using the effective interest rate method. ARO
included as part of “Other noncurrent liabilities” amounted to P
=72.82 million and P
=58.25 million
as of March 31, 2012 and 2011, respectively.
Estimation of useful lives and residual values of property
and equipment and investment properties
The Group estimates the useful lives of property and equipment and investment properties based
on internal technical evaluation and experience with similar assets. The estimated useful lives and
84
residual values are reviewed periodically and updated if expectations differ from previous
estimates due to physical wear and tear, technical and commercial obsolescence and other limits
on the use of the assets. The carrying amount of property and equipment, net of accumulated
depreciation, amounted to P
=50.62 billion and P
=49.98 billion as of March 31, 2012 and 2011,
respectively (see Note 10). The carrying amount of investment properties, net of accumulated
depreciation and impairment, amounted to P
=797.59 million and P
=806.39 million, as of
March 31, 2012 and 2011, respectively (see Note 11).
Impairment of property and equipment and investment properties
The Group determines whether its property and equipment and investment properties are impaired
when events or changes in circumstances indicate that the carrying values may not be recoverable.
If any such indication exists and where the carrying values exceed the estimated recoverable
amounts, the assets are written down to their recoverable amounts. The recoverable amount is the
greater of its fair value less cost to sell and value-in-use. Determination of impairment requires an
estimation of the value-in-use of the cash-generating units to which the assets belong. Estimating
the value-in-use requires the Group to make an estimate of the expected future cash flows from the
cash-generating unit and also to choose a suitable discount rate in order to calculate the present
value of those cash flows. In discounting, the Group uses a discount rate based on the weighted
average cost of capital adjusted to reflect the way that the market would assess the specific risks
associated with the cash flow and exclude risks that are not relevant to the cash flow. Other
assumptions used in projecting the future cash flows include passenger load factor, passenger
yield, fuel surcharge rate and fuel costs, among others. As of March 31, 2012 and 2011, the
aggregate net carrying value of the Group’s property and equipment and investment properties
amounted to P
=51.42 billion and P
=50.79 billion, respectively (see Notes 10 and 11). Impairment
losses for investment properties were recognized in 2011 amounting to P
=489.77 million based on
the most recent appraisal reports rendered for the properties (see Note 11). No impairment loss
was recognized in 2012.
Estimation of liability under the Frequent Flyer Program
A portion of passenger revenue attributable to the award of frequent flyer miles is deferred until
they are utilized. The deferment of the revenue is estimated based on historical trends of breakage
and redemption, which is then used to project the estimated utilization of the miles earned. Any
remaining unredeemed miles are recognized as revenue upon expiration. The remaining
unredeemed miles is measured at fair value estimated using the applicable fare based on the
historical redemption. Changes in the estimates of expected redemption could have a significant
effect on the Group’s financial results. Deferred revenue included as part of “Other noncurrent
liabilities” amounted to P
=132.54 million and P
=146.98 million as of March 31, 2012 and 2011,
respectively.
Estimation of retirement and other long-term benefits cost
The Group’s retirement and other long-term benefits cost relating to its defined benefit plan are
actuarially computed. These entail using certain assumptions like salary increases, return on plan
assets and discount rates. Accrued employee benefits as of March 31, 2012 and 2011 amounted to
=4.89 billion and P
P
=5.31 billion, respectively. Unrecognized net actuarial gain (loss) amounted to
(P
=1.06 billion) and P
=804.74 million as of March 31, 2012 and 2011, respectively (see Note 21).
Provisions
The Group provides for present obligations (legal or constructive) where it is probable that there
will be an outflow of resources embodying economic benefits that will be required to settle the
said obligations. Management exercises judgment in assessing the probability of the Group
becoming liable. An estimate of the provision is based on known information at the end of
reporting period. The amount of provision is being reassessed at least on an annual basis to
consider new and relevant information. Provisions recognized amounted to P
=1.60 billion and
=3.04 billion as of March 31, 2012 and 2011, respectively (see Note 16).
P
85
Recognition of deferred income tax assets
The Group assesses at the end of each reporting period and recognizes deferred income tax assets
to the extent of probable future taxable profits and reversing taxable temporary differences that
will allow the deferred income tax assets to be utilized. Management uses judgment and estimates
in assessing the probability of future taxable profits, including the timing of reversal of deferred
income tax liability, aided by forecasting and budgeting techniques. Deferred income tax assets
recognized amounted to P
=4.27 billion and P
=3.75 billion as of March 31, 2012 and 2011,
respectively (see Note 23).
5. Cash and Cash Equivalents
Cash on hand and in banks (Note 18)
Cash equivalents (Note 18)
2011
2012
(In Thousands)
=3,869,578
P
P
=2,630,045
671,001
350,900
=4,540,579
P
P
=2,980,945
Cash in banks and cash equivalents earn interest, at the respective bank deposit rates, totaling
P21.73 million, P
=
=37.41 million and P
=26.77 million in 2012, 2011 and 2010, respectively (see Note
20).
6. Available-for-sale Investments
The Group’s available-for-sale investments include investments in MAC (amounting to
P246.40 million and P
=
=281.60 million as of March 31, 2012 and 2011, respectively), certain quoted
equity investments and club shares (amounting to P
=6.96 million and P
=6.90 million as of March 31,
2012 and 2011, respectively) and unquoted equity investments (amounting to P
=269.36 million and
=272.47 million as of March 31, 2012 and 2011, respectively) and earned interest totaling
P
=0.30 million in 2012, P
P
=0.33 million in 2011 and P
=0.81 million in 2010 (see Note 20).
The carrying value of these investments includes accumulated unrealized loss of P
=71.20 million
and P
=106.32 million (net of related deferred income tax) as of March 31, 2012 and 2011,
respectively, that is reflected as “Net changes in fair values of available-for-sale investments - net
of deferred income tax” under “Other components of equity” in the consolidated statements of
financial position.
The movements in “Net changes in fair values of available-for-sale investments - net of deferred
income tax” pertaining to quoted equity investments and club shares are as follows:
2012
Balance at beginning of year
Movements during the year recognized as other
comprehensive income:
Mark-to-market gain (loss)
Amount in equity transferred to
consolidated profit or loss
Less share of non-controlling interests
Balance at end of year
P
=106,454
(35,114)
−
(35,114)
71,340
144
P
=71,196
2011
2010
(In Thousands)
=66,520
P
=133,463
P
39,934
(13,058)
−
(53,885)
(66,943)
66,520
80
66,440
39,934
106,454
131
=106,323
P
86
The fair values of investments in MAC were determined based on published prices in the active
market while other quoted equity investments were determined based on quoted prices and
published club share quotes that are publicly available from the local dailies and from the website
of club share brokers. Available-for-sale investments with no market prices are measured at cost,
net of impairment losses, if any. The unquoted equity investments include the Group’s
investments in shares of stocks of various companies. The Group has no intention to dispose these
investments in the near future.
Dividend received from investments in MAC amounted to P
=5.72 million in 2012 and 2011 and
=5.28 million 2010, included as part of “Others” in the revenue section of the consolidated
P
statements of comprehensive income (see Note 18).
7. Receivables
2011
2012
(In Thousands)
General traffic:
Passenger
Cargo
International Air Transport Association (IATA)
Others
Receivable from related parties (Note 18)
Non-trade*
Less allowance for doubtful accounts
P
=4,682,253
847,689
330,077
37,438
941,500
5,083,643
11,922,600
4,707,713
P
=7,214,887
=3,461,745
P
718,663
199,850
40,325
122,541
5,228,190
9,771,314
4,400,399
=5,370,915
P
* Non-trade receivables include accounts under litigation, accounts of defaulted agents, dividend receivable
and receivables from lessors.
Movements in allowance for doubtful accounts, presented by class, are as follows:
General Traffic
Passenger
Cargo
2012
Receivable from
Others Related parties Non-trade
(In Thousands)
P
= 45,319
P
=5,469 P
= 3,939,840
43
3,622
85,723
Total
Balance at beginning of year
Charges for the year
Reversal and other
adjustments
Foreign exchange difference
Balance at end of year
P
=131,309
335,174
P
= 278,462
11,642
(5,304)
(2,859)
P
=458,320
(31,952)
(7,719)
(2,953)
(461)
= 37,182
P
= 255,199 P
−
(34,324)
(75)
(43,243)
P
=9,016 P
= 3,947,996
(79,299)
(49,591)
P
= 4,707,713
Collective impairment
Individual impairment
Balance at end of year
P
=129,403
328,917
P
=458,320
P
=96,086
159,113
P
=255,199
P
=9,016
P
=163,321
− 3,784,675
P
=9,016 P
= 3,947,996
P
=435,008
4,272,705
P
= 4,707,713
P
= 37,182
−
P
= 37,182
P
= 4,400,399
436,204
87
Balance at beginning of year
Charges for the year
Reversal and other adjustments
Foreign exchange difference
Balance at end of year
=
P151,815
27,485
(42,051)
(5,940)
=
P131,309
2011
Receivables from
Others
Related parties
(In Thousands)
=
P87,910=
P50,816
=
P12,138
199,296 535
−
(4,009)
(6,325)
(8,744)(2,023)
(344)
=
P278,462=
P45,319
=
P5,469
Collective impairment
Individual impairment
Balance at end of year
=
P79,740
51,569
=
P131,309
=
P123,626=
P45,319
154,836
−
=
P278,462=
P45,319
General Traffic
Passenger Cargo
=
P5,469
−
=
P5,469
Non-trade
Total
=
P3,803,946P
=4,106,625
313,244 540,560
(11,493) (63,878)
(165,857) (182,908)
=
P3,939,840P
=4,400,399
=
P168,466 =
P422,620
3,771,374 3,977,779
=
P3,939,840P
=4,400,399
Impairment assessment
The main considerations for impairment assessment include whether any payments are overdue or
if there are any known difficulties in the cash flows of the counterparties. The Group assesses
impairment into two areas: (a) individually assessed allowances and (b) collectively assessed
allowances.
The Group determines allowance for each significant receivable on an individual basis. Among
the factors that the Group considers in assessing impairment is the inability to collect from the
counterparty based on the contractual terms of the receivables. Receivables included in the
specific assessment are the accounts that have been endorsed to the legal department, nonmoving
accounts receivables, accounts of defaulted agents and accounts from closed stations.
For collective assessment, allowances are assessed for receivables that are not individually
significant and for individually significant receivables where there is no objective evidence of
individual impairment. Impairment losses are estimated by taking into consideration the age of
the receivables, collection experience and other factors that may affect collectability.
The net provision for (reversal of) impairment losses on the receivables (excluding recoveries of
previously written-off accounts) recognized in the consolidated statements of comprehensive
income under “General and administrative expenses” amounted to P
=360.36 million,
=540.56 million and (P
P
=55.83 million) in 2012, 2011 and 2010, respectively.
8. Expendable Parts, Fuel, Materials and Supplies
2011
2012
(In Thousands)
At cost:
Fuel
Materials and supplies
Expendable parts
At net realizable value - expendable parts (Note 20)
P
=968,033
229,568
290,620
1,488,221
103,385
P
=1,591,606
=1,239,993
P
247,382
255,152
1,742,527
29,388
=1,771,915
P
The cost of expendable parts carried at net realizable value amounted to P
=275.08 million and
=85.86 million as of March 31, 2012 and 2011, respectively.
P
88
9. Other Current Assets
2011
2012
(In Thousands)
=148,498
P
P
=380,524
269,887
298,032
Derivative assets (Notes 27 and 28)
Deposits
Prepayments and others - net of allowance
for probable losses of P
=2,881 in 2012 and
=2,567 in 2011 (Notes 10 and 18)
P
968,679
P
=1,647,235
1,301,388
=1,719,773
P
In line with the various purchase agreements and fuel hedging transactions (see Note 28), PAL has
short-term standby letters of credit amounting to =
P80.13 million as of March 31, 2011, which
serve as security or margin deposits to the various fuel suppliers and hedging counterparties.
There were no similar short-term standby letters of credit as of March 31, 2012. Prepayments and
others pertain to advance payments of materials and supplies, various prepaid rentals, properties
classified as held for sale and miscellaneous prepayments.
10. Property and Equipment
2012
April 1,
2011
At Cost
Cost:
Passenger aircraft
(Notes 15 and 25)
Other aircraft
Spare engines (Note 15)
Rotable and reparable parts
(Notes 13 and 15)
Ground property and
equipment
Accumulated Depreciation:
Passenger aircraft
Other aircraft
Spare engines
Rotable and reparable parts
Ground property and
equipment
Net book value
Construction in progress
Predelivery payments
(Notes 13 and 25)
Total
At Appraised Value
Buildings and improvements:
Appraised value
Accumulated depreciation and
amortization
Net Book Value
Disposals/ Reclassifications
Additions Retirements
and Others
(In Thousands)
Foreign
Exchange
Difference
March 31,
2012
P
=84,562,691
437,856
4,851,278
P
=422,856
–
–
(P
=179,785)
–
–
P
=2,211,202
32
1,706,962
(P
=1,120,283)
(4,899)
(58,161)
P
=85,896,681
432,989
6,500,079
7,256,906
679,117
(506,847)
805,840
(67,509)
8,167,507
9,538,474
106,647,205
634,712
1,736,685
(1,200,420)
(1,887,052)
13,515
4,737,551
(100,918)
(1,351,770)
8,885,363
109,882,619
(46,091,005)
(280,112)
(2,589,374)
(3,874,598)
(5,200,159)
(35,185)
(338,182)
(405,375)
179,785
–
–
226,047
(1,417,268)
185
(1,142,536)
(826,152)
531,838
3,325
33,266
47,169
(51,996,809)
(311,787)
(4,036,826)
(4,832,909)
(8,709,034)
(61,544,123)
45,103,082
149,454
(269,551)
(6,248,452)
(4,511,767)
41,612
1,187,536
1,593,368
(293,684)
–
11,060
(3,374,711)
1,362,840
(111,462)
85,529
701,127
(650,643)
(434)
(7,694,460)
(68,872,791)
41,009,828
79,170
4,076,141
P
=49,328,677
4,948,541
P
=478,386
–
(P
=293,684)
–
P
=1,251,378
P
=675,515
P
=–
(21,009)
P
=654,506
(79,544)
(P
= 79,544)
(58,217)
8,966,465
=50,055,463
(P
=709,294) P
P
=–
(P
=17,125)
(P
=7,296)
P
=651,094
–
P
=–
17,441
P
=316
464
(P
= 6,832)
(82,648)
P
=568,446
89
2011
April 1,
2010
At Cost
Cost:
Passenger aircraft
(Notes 15 and 25)
Other aircraft
Spare engines (Note 15)
Rotable and reparable parts
(Notes 13 and 15)
Ground property and
equipment
Accumulated Depreciation:
Passenger aircraft
Other aircraft
Spare engines
Rotable and reparable parts
Ground property and
equipment
Net book value
Construction in progress
Predelivery payments
(Notes 13 and 25)
Total
Additions
Disposals/ Reclassifications
Retirements
and Others
(In Thousands)
=89,240,979
P
309,564
5,919,896
P78,056
=
141,730
135,057
(P
=42,586)
(379)
(674,866)
7,722,297
1,347,321
(1,533,772)
10,137,937
113,330,673
189,922
1,892,086
(396,319)
(2,647,922)
(43,400,961)
(280,306)
(2,901,206)
(4,075,284)
(5,608,066)
(12,167)
(298,716)
(579,775)
42,463
379
202,178
607,973
(9,008,425)
(59,666,182)
53,664,491
15,082
(293,178)
(6,791,902)
(4,899,816)
141,495
2,721,400
=56,400,973
P
At Appraised Value
Buildings and improvements:
Appraised value
Accumulated depreciation and
amortization
Net Book Value
218,298
1,071,291
(1,576,631)
−
2,456,339
−
(P
=2,301,982) (P
=1,576,631)
Foreign
Exchange
Difference
(P
=1,004,621) (P
=3,709,137)
1,623
(14,682)
(315,559)
(213,250)
–
March 31,
2011
=84,562,691
P
437,856
4,851,278
(278,940)
7,256,906
(404,522)
(4,620,531)
9,538,474
106,647,205
930,563
−
284,003
−
1,944,996
11,982
124,367
172,488
(46,091,005)
(280,112)
(2,589,374)
(3,874,598)
−
1,214,566
(92,535)
(5,901)
374,271
2,628,104
(1,992,427)
(1,222)
(8,709,034)
(61,544,123)
45,103,082
149,454
11,456
(1,307,101)
(130,175)
(971,423)
4,076,141
=49,328,677
(P
=1,069,859) (P
=2,123,824) P
=385,698
P
=310,486
P
(P
=4,825)
=−
P
(P
=15,844)
(316,856)
=68,842
P
(60,129)
=250,357
P
513
(P
=4,312)
340,603
P340,603
=
14,860
(P
=984)
P
=675,515
(21,009)
=654,506
P
If buildings and improvements were carried at cost less accumulated depreciation, the amounts as
of March 31 would be as follows:
Cost
Accumulated depreciation
2011
2012
(In Thousands)
=7,206
P
P
=7,471
(3,473)
(4,036)
=
P
3,733
P
=3,435
Property and equipment used to secure notes payable and obligations under finance leases are
described in Notes 13 and 15.
Outstanding liabilities pertaining to purchases of property and equipment amounted to
P321.40 million and P
=
=300.82 million as of March 31, 2012 and 2011, respectively.
90
Fleet (see Notes 15, 18 and 25)
2012
Owned:
Bombardier DHC 8-400
Bombardier DHC 8-300
Airbus 340-300
Airbus 330-300
Boeing 737-300
Under finance lease:
Boeing 747-400
Airbus 340-300
Airbus 330-300
Airbus 320-200
Under operating lease:
Boeing 777-300ER
Boeing 747-400
Airbus 320-200
Airbus 319-100
5
3
2 –
1 –
–
2011
5
3
1
4
2
7
10
4
4
8
10
2
1
15
4
56
2
1
9
4
51
Airbus 320-200
PAL redelivered to the lessors three Airbus 320-200 aircraft upon expiration of their operating
lease terms in fiscal year 2011. In the same year, PAL took delivery of four Airbus 320-200
aircraft under operating lease arrangement. These newly acquired Airbus 320-200 aircraft were
subleased to Air Philippines Corporation (APC), an entity under common control, upon delivery
(see Notes 18 and 25).
In fiscal year 2012, PAL took delivery of six Airbus 320-200 aircraft under operating lease
arrangement. Five of these newly acquired Airbus 320-200 aircraft were subleased to APC upon
delivery (see Notes 18 and 25).
Airbus 340-300 and Airbus 330-300
On July 30, 2011 upon settlement of the remaining obligations, the ownership of two Airbus
340-300 aircraft and one Airbus 330-300 aircraft under finance leases were assigned to PAL after
exercising its purchase option (see Note 15).
Boeing 737-300
As of March 31, 2011, the Group reclassified its Boeing 737-300 aircraft with carrying value of
=105.26 million from property and equipment to asset held for sale (included under “Other current
P
assets” see Note 9). In November 2011, PAL sold the aircraft to a third party for
=112.65 million, resulting in a gain of P
P
=6.85 million.
Buildings and Improvements
Buildings and improvements are carried at appraised values determined based on valuations
performed by various qualified and independent appraisers. In the valuation process, the
appraisers compared the fair market value of similar assets and considered the best use of the
properties at hand. The additional revaluation increase recorded in 2011 amounted to
=647.27 million. Amount presented under “Increase in revaluation increment due to appraisal” in
P
the 2011 consolidated statement of comprehensive income is net of the related deferred income tax
of P
=194.18 million.
91
11. Investment Properties
2012
April 1,
2011
Cost
Land (Note 13)
Buildings and improvements
Accumulated Depreciation
and Impairment Losses
Land
Buildings and improvements
Net Book Value
= 1,295,599
P
34,509
1,330,108
(489,209)
(34,509)
P
= 806,390
Additions
(In Thousands)
Foreign
Exchange
Difference
P
=–
–
–
(P
=14,148)
(376)
(14,524)
–
–
P
=–
5,343
376
(P
=8,805)
March 31,
2012
P
=1,281,451
34,133
1,315,584
(483,866)
(34,133)
P
= 797,585
2011
April 1,
2010
Cost
Land (Note 13)
Buildings and improvements
Accumulated Depreciation and
Impairment Losses
Land
Buildings and improvements
Net Book Value
=
P1,351,800
36,007
1,387,807
−
(35,644)
=
P1,352,163
Additions
(In Thousands)
=
P–
–
–
(489,772)
(356)
(P
=490,128)
Foreign
Exchange
Difference
(P
=56,201)
(1,498)
(57,699)
563
1,491
(P
=55,645)
March 31,
2011
=
P1,295,599
34,509
1,330,108
(489,209)
(34,509)
=
P806,390
Investment properties pertain to assets not used in operations and are carried at cost. The
aggregate fair value of investment properties amounted to P
=856.02 million and P
=867.42 million as
of March 31, 2012 and 2011, respectively. These have been determined based on valuations
performed by various qualified and independent appraisers. The valuation undertaken considered
the sales of similar or substitute properties and related market data and established estimated value
by processes involving comparison.
In 2011, PAL recognized impairment losses amounting to P
=489.77 million (included under
“Others - net” in the 2011 consolidated statement of comprehensive income) for investment
properties with carrying value higher than their fair values. Moreover, revaluation increment
amounting to P
=1.42 billion of certain properties previously carried at revalued amounts in property
and equipment, treated as deemed cost upon its reclassification to investment properties, were
transferred to “Deficit” net of the related deferred income tax of P
=92.60 million.
In April 2009, a parcel of land previously carried as investment property was reclassified to asset
held for sale when management was authorized to finalize the terms of the sale of the property. In
June 2010, the related Deed of Absolute Sale was executed (see Note 18) and the asset was
derecognized accordingly.
Direct costs related to these investment properties (e.g., depreciation, property taxes, etc.)
amounted to P
=3.28 million, P
=3.56 million and P
=7.55 million in 2012, 2011 and 2010, respectively.
Investment properties with carrying value of P
=751.56 million and P
=759.86 million as of
March 31, 2012 and 2011 were used to secure notes payable as described in Note 13.
92
12. Other Noncurrent Assets
Long-term security deposits (Note 18)
Deposits on aircraft leases (Notes 18, 25, 27 and 28)
Others
2011
2012
(In Thousands)
=3,318,759
P
P
=3,926,056
3,215,361
22,240
451,530
558,185
=6,985,650
P
P
=4,506,481
As of March 31, 2012 and 2011, long-term security deposits include cash and cash equivalents
amounting to P
=819.35 million and P
=819.15 million, respectively, set aside to collateralize various
surety bonds issued (as required under the legal proceedings) in connection with certain litigations
and earned interest totaling P
=22.20 million, P
=1.00 million and P
=4.17 million in 2012, 2011 and
2010, respectively. PAL has short-term standby letters of credit amounting to P
=355.06 million and
=282.07 million as of March 31, 2012 and 2011, respectively, and earned interest totaling
P
=2.31 million, P
P
=2.85 million and P
=12.22 million in 2012, 2011 and 2010, respectively.
Deposits on aircraft leases totaling P
=1.82 billion as of March 31, 2011 were reclassified as part of
the cost of the related aircraft in 2012 while the related accrued interests that were deemed
unrecoverable were derecognized (see Note 18).
Other noncurrent assets include other security deposits and miscellaneous receivable from aircraft
manufacturer.
13. Notes Payable
The Group has an omnibus credit facility with Allied Banking Corporation (ABC), an entity under
common control (see Note 18), which is covered by a real estate mortgage on some real properties
and chattel mortgage on some land having an aggregate net carrying value of P
=751.56 million and
=759.86 million as of March 31, 2012 and 2011, respectively.
P
In May 2011, PAL availed of additional short-term loans amounting to P
=432.45 million from
ABC. Total outstanding notes payable with ABC as of March 31, 2012 and 2011 amounted to
=1.99 billion and P
P
=1.58 billion, respectively (see Note 18).
In 2012, PAL also availed of short-term loans from Philippine National Bank (PNB), an entity
under common control, amounting to P
=1.67 billion, which remained outstanding as of
March 31, 2012 (see Note 18).
Notes payable as of March 31, 2012 also includes short-term loans from other local banks. PAL
renewed matured loans amounting P
=3.88 billion in 2012 and P
=5.59 billion in 2011 for another one
year term, and P
=598.93 million in 2012 for four year term (see Note 15). Total principal payments
made by PAL amounted to P
=199.49 million in 2012 and P
=280.84 million in 2011. Total
outstanding notes payable with these local banks amounted to P
=2.32 billion and P
=4.01 billion as of
March 31, 2012 and 2011, respectively.
Interest rates on these notes payable range from 3.19% to 8.00% in 2012 and 3.75% to 8.00% in
2011. The related interest expense pertaining to all notes payable amounted to P
=342.03 million in
2012, P
=342.02 million in 2011 and P
=391.15 million in 2010. Interest payable relating to
short-term notes payable amounted to P
=14.94 million and P
=15.76 million as of March 31, 2012
and 2011, respectively, included in “Accrued expenses - others” (see Note 14).
93
14. Accrued Expenses
2011
2012
(In Thousands)
Landing and take-off fees and
ground handling charges (Note 16)
Maintenance (Note 18)
Derivative liabilities (Note 28)
Others (Notes 13 and 18)
P
=6,338,175
3,833,577
117,553
2,669,593
P
=12,958,898
=5,943,640
P
3,522,907
10,288
2,569,493
=12,046,328
P
Other accrued expenses pertain to accruals for the following expenses: passenger food/supplies,
salaries and wages, foreign station expenses, interest expense and other operating expenses.
15. Long-term Obligations
2011
2012
(In Thousands)
Obligations under aircraft finance leases
(Notes 18 and 25)
Long-term debts (Note 18)
Less current portion
P
=16,399,800
13,025,575
29,425,375
5,981,264
P
=23,444,111
=21,655,253
P
6,354,801
28,010,054
7,013,431
P
=20,996,623
Note 27 presents the undiscounted contractual maturity analysis of financial liabilities, including
long-term obligations.
Obligations Under Aircraft Finance Leases
Relating to Boeing 747-400 Aircraft
In fiscal year 2009, PAL sold all of its four owned Boeing 747-400 aircraft and immediately
leased them back under finance lease agreements. PAL recognized P
=4.69 billion liability arising
from the four Boeing 747-400 aircraft under finance leases. Interests on the finance leases are
paid based on three-month LIBOR plus margin. Annual principal payments amounted to
=699.27 million and P
P
=718.90 million in 2012 and 2011, respectively.
Relating to Airbus 340-300 and Airbus 330-300 Aircraft
Finance lease agreements pertaining to Airbus 340-300 and Airbus 330-300 aircraft provide for
semi-annual installments, with restructured maturities of 15 years, including balloon payments for
certain finance leases at the end of the lease term, at fixed rates ranging from 7.71% to 7.96%
and/or floating interest rates based on certain margins over six-month LIBOR, as applicable.
As a result of the restructuring of the finance leases, the differences between the actual amount of
principal and interest under the original agreements and the principal, including capitalized
interest payable amounting to an aggregate of P
=5.21 billion, were treated as a separate tranche.
Interests on these amounts are paid based on three-month or six-month LIBOR plus margin.
Contractual interest rates under the original agreements remain unchanged.
94
PAL assigned to the lessor its rights and interest over the Japanese yen (JPY)-denominated
deposits with the initial deposit amount aggregating to JPY6.39 billion or P
=3.43 billion and
JPY6.39 billion or P
=3.36 billion as of March 31, 2012 and 2011, respectively, and all interest
accruing thereon maintained by PAL to secure the payment of the obligations for Japanese
Leveraged Lease (JLLs) on two Airbus 340-300 and one Airbus 330-300 aircraft.
PAL paid in full the remaining obligations under finance lease related to the two Airbus 340-300
and one Airbus 330-300 aircraft. Consequently, ownership of these aircraft were transferred to
PAL in July 2011 after exercising its purchase option (see Note 10).
Relating to Airbus 320-200 Aircraft
Obligations under finance leases as of March 31, 2012 and 2011 include obligations covering
eight Airbus 320-200 aircraft acquired in accordance with the Purchase Agreement signed with
Airbus as discussed in Note 25. As of March 31, 2012 and 2011, the aggregate present value of
future minimum lease payments for these leases amounted to P
=8.57 billion (with current portion of
=1.51 billion) and P
P
=9.67 billion (with current portion of P
=1.01 billion), respectively. These
finance leases require rental payments over the lease term of 12 years. The outstanding obligations
also include obligations covering two Airbus 320-200 aircraft acquired in 1997 with lease terms
maturing in August 2012 and November 2012.
The finance lease agreements covering the Airbus 320-200 aircraft provide for aircraft purchase or
remarketing options. It also provides for quarterly or semi-annual installments, with maturities
generally ranging from 12 to 15 years, including balloon payments for certain finance leases at the
end of the lease term, at fixed rates ranging from 2.30% to 6.58% and/or floating interest rates
based on certain margins over three-month or six-month LIBOR, as applicable.
The original lease agreements contain, among other things, provisions regarding merger and
consolidation, disposal of all or substantially all of PAL’s assets and ownership and control by the
present managing stockholder company.
The present value of minimum lease commitments for PAL’s obligations under finance leases are
as follows:
Year Ending March 31
2012
2013
2014
2015
2016 and thereafter
Net minimum lease payments
Interest and others
Present value of net minimum lease payments
2011
2012
(In Thousands)
=5,643,431
P
P
=–
2,945,146
2,856,528
7,651,355
7,478,072
1,850,830
1,817,010
6,317,383
6,236,636
24,408,145
18,388,246
(2,752,892)
(1,988,445)
=21,655,253
P
P
=16,399,801
As of March 31, 2012 and 2011, the current portion of obligations under finance lease amounted
to P
=2.32 billion and P
=5.02 billion, respectively (see Note 25).
95
Long-term Debts
Secured loans (Note 18)
Terminated operating lease claims
Unsecured claims (Note 18)
Other unsecured loans (Note 18)
Less current portion
2011
2012
(In Thousands)
P
=5,072,181
P
=11,737,555
119,372
–
1,163,248
–
–
1,288,020
6,354,801
13,025,575
1,990,257
3,661,841
=4,364,544
P
P
=9,363,734
Secured Loans
$125 million syndicated loan
Long-term debts totaling P
=5.66 billion ($125.00 million) pertain to loans obtained from a local
bank and a syndicate of local banks in 2009. The loan from a local bank amounting to
=2.86 billion ($66.50 million) consists of two tranches [P
P
=2.72 billion ($63.25 million) for tranche
one and P
=138.59 million ($3.25 million) for tranche two] and is secured by aircraft and various
aircraft engines with total carrying value of P
=2.34 billion and P
=2.53 billion as of March 31, 2012
and 2011, respectively (see Note 10). The loan agreement requires quarterly payments of
principal and interest based on three-month LIBOR plus margin. The first and second tranche will
mature in 2015 and 2013, respectively, inclusive of a two-year grace period.
The loan with the syndicate of local banks (including affiliate banks, see Note 18) amounting to
=2.51 billion ($58.50 million) also requires quarterly payments of principal and interest based on
P
three-month LIBOR plus margin and will mature in September 2015. Aircraft and various aircraft
engines with carrying value of =
P1.54 billion and =
P1.73 billion and as of March 31, 2012 and 2011,
respectively, were used as collateral for this syndicated loan.
As of March 31, 2012 and 2011, the outstanding balance of the loan amounted to P
=4.32 billion and
=5.07 billion (with current portion amounting to =
P
P699.91 million and P
=707.64 million),
respectively. Total financing charges related to this loan amounted to P
=181.67 million in 2012,
=209.50 million in 2011 and P
P
=234.22 million in 2010.
$120 million syndicate loan
In various dates from September 2011 to October 2011, PAL obtained loans from a syndicate of
local banks totaling P
=5.15 billion ($120.00 million) to finance predelivery payments related to the
acquisition of three Boeing 777-300ER aircraft due for delivery in November 2012, April 2013
and November 2013. As of March 31, 2012, portion of these loans were used to finance
predelivery payments amounting to P
=3.71 billion (see Notes 10 and 25). The loans are secured by
aircraft, various aircraft engines, and certain real properties with aggregate carrying value of
=7.51 billion as of March 31, 2012. These loans require quarterly principal and interest payments
P
based on three-month LIBOR plus spread with maturity on September 2015. Cumulative interest
relating to these loans amounted to P
=133.27 million in 2012, of which P
=77.45 million was
capitalized as part of property and equipment in the same year (see Note 10).
As of March 31, 2012, outstanding balance of this loan amounted to P
=5.15 billion with current
portion amounting to P
=1.72 billion.
The loans, as discussed above, provide for certain affirmative and negative covenant, such as the
use of the proceeds of the loan and maintenance of a certain ownership percentage and net debt to
earnings before income tax, depreciation and amortization ratio, among others.
96
As of March 31, 2012 and 2011, PAL was in compliance with the loan covenants. As discussed in
Note 1, the effective ownership of Lucio Tan Group of Companies in PAL was reduced to less
than 51% subsequent to March 31, 2012 due to the investment of SMEII in Trustmark.
$50 million loan with foreign bank
On July 11, 2011, PAL obtained P
=2.11 billion ($50.00 million) loan from foreign bank for
additional working capital. The loan is secured by future collections from passenger sales made in
the United States through designated credit card companies. The loan agreement requires equal
monthly installments until July 11, 2014 with a fixed interest rate.
As of March 31, 2012, outstanding balance of this loan amounted to P
=1.67 billion with current
portion amounting to P
=715.58 million. Total financing charges related to this loan amounted to
=100.82 million in 2012.
P
$13.95 million loan with local bank
In fiscal year 2012, PAL renewed P
=598.93 million of its short-term notes with a local bank for
four-year term. The loan requires quarterly principal and interest payments based on three-month
LIBOR plus spread and will mature in September 2015. Aircraft and various aircraft engines with
carrying value of P
=2.43 billion as of March 31, 2012 were partially used as collateral for this loan.
Current portion of this loan amounted to P
=99.82 million as of March 31, 2012. The related
financing charges for fiscal year 2012 amounted to P
=16.21 million.
Terminated Operating Lease Claims
In accordance with the Rehabilitation Plan, PAL terminated 26 operating leases relating to
Boeing 747-200, Airbus 340-200, Airbus 300-B4, Fokker 50, and Shorts 360 aircraft. Any claims,
net of security deposits and maintenance reserves held by the lessors, resulting from the
termination of operating leases were treated as unsecured claims. These claims were fully paid as
of March 31, 2012. Total financing charges related to these claims amounted to P
=2.59 million in
2012, P
=17.24 million in 2011 and P
=43.65 million in 2010.
Unsecured Claims
The restructured unsecured claims are noninterest-bearing and constitute 100% of the principal
and 100% of accrued but unpaid interest as of June 23, 1998.
For purposes of valuation of the unsecured claims (including Terminated Operating Lease
Claims)4, PAL used a discount rate of 12% per annum (PAL’s estimated borrowing cost for
instruments of similar type and tenor at the time of the deemed issuances of the restructured
unsecured claims) to restate the unsecured claims (including Terminated Operating Lease Claims)
to present value. Adjustments in present value resulting from the passage of time and the interest
portion of prepayments made amounted to P
=24.71 million in 2012, P
=165.80 million in 2011 and
=427.39 million in 2010 and were recognized as part of “Financing charges” in the consolidated
P
statements of comprehensive income.
In May 2009, Trustmark purchased certain unsecured claims against PAL from various debt
holders amounting to P
=5.26 billion in face value for a consideration amounting to P
=3.25 billion.
These claims are carried in the books at amortized cost amounting to P
=4.73 billion. In June 2009,
PAL purchased these unsecured claims from Trustmark at the same price that they were bought by
Trustmark (see Note 18). The difference of P
=1.53 billion between the carrying amount of the
liability settled and the purchase price of the unsecured claims was recognized as income under
“Others - net” in the 2010 consolidated statement of comprehensive income.
97
All unsecured claims were fully paid on June 7, 2011 in accordance with the restructured
schedule.
The amounts payable on the unsecured claims (including Terminated Operating Lease Claims)
under the restructured terms as of March 31, 2011 are as follows:
Maturity Dates
June 7, 2010
June 7, 2011
Face value
Less imputed interest
Percentages of
Face Value
32
32
Less current portion
2011
(In Thousands)
=–
P
1,309,359
1,309,359
26,739
1,282,620
1,282,620
=–
P
Other Unsecured Loan
In August 2011, PAL obtained a long-term loan from a related party for additional working capital
amounting to P
=1.27 billion ($30,000), which remained outstanding as of March 31, 2012. The
loan is payable in three years with the first installment due on August 1, 2012. The loan is subject
to interest of 2.0% per annum. The related interest charges for the fiscal year 2012 amounted to
=5.74 million (see Note 18).
P
Excess Cash Flow Recapture Mechanism of the Rehabilitation Plan
Under the Excess Cash Flow Recapture mechanism of the Rehabilitation Plan, at the end of any
six-month period starting September 30, 1999, any Excess Cash Flow (the remaining cash
balance, excluding certain funds, in excess of the greater of $50,000 and the average of the
preceding six months’ revenue of PAL) will be used to prepay Eligible Creditors on a pro rata
basis. Such prepayments in respect of indebtedness will be applied in inverse order of maturity of
claims.
PAL made prepayments under the Excess Cash Flow Recapture mechanism totaling P
=7.52 billion
(covering the years 2001, 2003, 2006, 2007 and 2008). The last payment relating to the Excess
Cash Flow Recapture mechanism amounted to P
=2.34 billion in 2008. There were no similar
payments made in fiscal years 2012, 2011 and 2010.
PAL’s obligations under the Excess Cash Flow Recapture mechanism shall terminate on the last to
occur of: (a) June 7, 2004 (five years after the implementation date of the Rehabilitation Plan);
(b) PAL’s public offering (as defined in the Rehabilitation Plan) of its shares; and (c) the end of
the fiscal year in which PAL has achieved profits calculated on a cumulative basis over the
preceding three fiscal years. With respect to each participating creditor class, rights to receive
prepayments under the Excess Cash Flow Recapture mechanism would also terminate on the date
on which creditors of that creditor class have been returned to their original pre-restructuring
repayment profiles.
98
16. Reserves and Other Noncurrent Liabilities
Provisions
Other noncurrent liabilities (Note 18)
2011
2012
(In Thousands)
=3,039,689
P
P
=1,598,261
851,274
721,849
=3,890,963
P
P
=2,320,110
Provisions
Provisions consist substantially of probable claims and other litigations involving PAL. The
timing of the cash outflows of these provisions is uncertain as it depends upon the outcome of
PAL’s negotiations and/or legal proceedings, which are currently ongoing with the parties
involved.
In 2012, additional provision amounted to P
=302.88 million (P
=1.12 billion in 2011), reversal of
provisions recognized in prior years amounted to P
=951.06 million (P
=681.46 million in 2011) and
settlement of closed cases amounted to P
=723.78 million (P
=2.41 million in 2011). Revaluation due
to difference in exchange rates decreased the balance of provisions by P
=69.47 million
(P
=3.83 million in 2011).
Disclosure of additional details beyond the present disclosures may seriously prejudice PAL’s
position and negotiating strategy. Thus, as allowed by PAS 37, Provisions, Contingent Liabilities
and Contingent Assets, only general descriptions were provided.
Claims by Manila International Airport Authority (MIAA)
PAL and MIAA entered into a Compromise Agreement on November 14, 2006, which was
approved by the Court of Appeals on March 26, 2007. Under the Compromise Agreement, PAL
agreed to pay MIAA the total amount of P
=2.93 billion, including the related Value-Added Tax
(VAT), through equal monthly installments over a period of seven years. These payments will
serve as full and final settlement of MIAA’s claim against PAL for landing and take-off fees,
parking fees, lighting charges and tacking charges for the period December 1, 1995 to
March 31, 2006.
As of March 31, 2012 and 2011, accrued expenses payable to MIAA, excluding the related VAT,
amounted to P
=802.27 million and P
=1.13 billion, respectively. Of the amount, P
=667.62 million and
=774.49 million was included as part of “Accrued expenses - landing and take-off fees and ground
P
handling charges” (see Note 14) classified under “Current liabilities”, and P
=134.64 million and
=355.51 million was included as part of “Other noncurrent liabilities” in the consolidated
P
statements of financial position as of March 31, 2012 and 2011, respectively.
17. Equity Items
The following summarizes the capital stock account as of March 31, 2012 and 2011:
Authorized (Note 2)
Issued
Treasury stock - 55,589 shares, at cost
Issued and outstanding
Number of
Shares
20,000,000,000
5,421,567,685
(55,589)
5,421,512,096
Amount
(In Thousands)
=20,000,000
P
=5,421,568
P
(56)
=5,421,512
P
99
a. The issued and outstanding shares are held by 6,635 and 6,684 equity holders as of
March 31, 2012 and 2011, respectively.
b. The Parent Company has 55,589 treasury shares amounting to P
=0.06 million. Future earnings
are restricted from dividend declaration to the extent of the cost of these treasury shares.
c. Details of other components of equity are as follows:
2011
2012
(In Thousands)
Cumulative translation adjustment - net of related
deferred income tax (Notes 19 and 28)
Net changes in fair values of available-for-sale
investments - net of related deferred income
tax (Note 6)
Revaluation increment - net of related deferred
income tax (Notes 10 and 11)
(P
=4,718,017)
71,196
282,681
(P
=4,364,140)
(P
=4,671,132)
106,323
331,183
(P
=4,233,626)
d. The Parent Company’s track record of registration of securities under the Securities
Regulation Code is as follow:
Date of approval
August 2, 1930
August 2, 1930
January 6, 1951
December 4, 1957
March 25, 1970
April 14, 1975
March 7, 1977
Number of Shares
Licensed
18,000
2,000,000
7,000,500
30,000,000
200,000,000
5,000,000,000
12,500,000,000
Issue/Offer Price
=100.00
P
0.10
0.10
0.10
0.10
0.01
0.01
In 1996, the SEC approved the Parent Company’s decrease in authorized capital stock from
20 billion shares to 200 million shares while the par value was increased from P
=0.01 per share
to P
=1.00 per share. In 2000, the SEC approved a further increase in the Parent Company’s
authorized capital stock from 200 million shares to 400 million shares with P
=1.00 par value per
share. Further, as discussed in Note 1, the Parent Company’s authorized capital stock was again
increased from 400 million shares to 20 billion shares in 2007.
18. Related Party Transactions
Parties are considered to be related if one party has the ability, directly or indirectly, to control the
other party or exercise significant influence over the party in making financial and operating
decisions. Parties are also considered to be related if they are subject to common control. In
considering each possible related party relationship, attention is directed to the substance of the
relationship and not merely its legal form. The Group, in the normal course of business, has
transactions with its stockholders, entities under common control, associated companies and other
related parties pertaining to leases of aircraft and ground properties, availment of loans, temporary
investments of funds, and purchases of goods and services, among others.
100
The significant related party transactions are as follows:
a. On August 9, 2010, the Parent Company’s BOD confirmed and agreed to the assignment by
Maxell of its receivable from the Parent Company amounting to P
=431.60 million to
Trustmark. On the same meeting, the BOD also approved the conversion of this assigned
receivable and Trustmark’s existing receivable from the Parent Company totaling
=481.09 million into additional paid-in capital.
P
b. As of March 31, 2010, the Parent Company’s liability to Maxell amounted to P
=431.60 million.
This resulted from the Parent Company’s August 2, 2007 BOD resolution that resolved to
amend its June 27, 2007 resolution so that the Parent Company only assumes P
=3.08 billion,
instead of P
=14.08 billion, out of the P
=23.12 billion liabilities of the Holding Companies, as
originally planned. The P
=3.08 billion assumed liability was converted to additional paid-in
capital, as approved by the BOD on the same date. This also resulted in a total of
=12.12 billion receivables of the Parent Company from the Holding Companies, which were
P
used in exchange for the Parent Company’s acquisition of the Holding Companies’ investment
in PAL and PR amounting to P
=12.44 billion and P
=108.66 million, respectively (see Note 2).
On August 9, 2010, Maxell assigned the said liability to Trustmark (see Note 18.a).
c. The Parent Company’s advances from Trustmark amounting to P
=10.00 million as of
March 31, 2011 that were used for working capital purposes and P
=49.49 million as of
March 31, 2010 that were used to pay filing fees and other expenses relating to the acquisition
of the Holding Companies and the Parent Company’s change in corporate name and increase
in the authorized capital stock, were converted to additional paid-in capital on
February 28, 2012 and August 9, 2010, respectively (see Note 18.a).
d. As of March 31, 2012 and 2011, the Parent Company owns 88 million common shares
(7.04% equity interest) of MAC. Certain members of the Company’s BOD are also officers
and members of the BOD of MAC. Dividends received from this investment amounted to
=5.72 million in 2012 and 2011 and P
P
=5.28 million 2010 (see Note 6).
e. Accounting, statutory reporting and compliance, and administrative services are provided by
an affiliate at no cost to the Parent Company.
f.
PAL has finance lease agreements with entities under common control pertaining to three
Airbus 330-300 aircraft. Deposits on leases of said aircraft amounted to P
=3.19 billion as of
March 31, 2011 (included under “Other noncurrent assets”). In 2012, PAL reclassified
=1.37 billion of the deposit as part of the cost of the aircraft and the remaining accrued interest
P
was derecognized. Outstanding obligations under finance lease of the said aircraft amounted to
=1.81 billion and P
P
=2.95 billion as of March 31, 2012 and 2011, respectively (see Note 15).
Financing charges attributable to these finance lease obligations amounted to P
=37.34 million
in 2012, P
=49.40 million in 2011 and P
=128.09 million in 2010. Related accrued interest
amounted to P
=5.54 million and P
=7.90 million as of March 31, 2012 and 2011, respectively.
g. PAL has a Technical Services Agreement (TSA) with Lufthansa Technik Philippines (LTP),
an entity under common control, which took effect on September 1, 2000 and was effective
for a period of 10 years until September 1, 2010, including the Heavy Maintenance Service
Agreement.
Upon expiration of the TSA in 2010, PAL and LTP entered into a General Terms and
Agreement for Maintenance, Repair and Overhaul Services (GTA) effective September 2010.
Under the GTA, the scope of LTP’s service was limited to line maintenance, component
101
maintenance, C check of certain aircraft and other support services. The GTA was for a
period of one year, renewable upon consent of both parties. The latest renewal was made for
another year commencing in September 2011.
In February 2009, PAL and LTP also entered into an Engine Maintenance Services (EMS) for
CFM56-5B Engines agreement for a period of twelve years. LTP has the option to extend the
agreement for another two years by giving six month prior notice.
Total LTP-related maintenance and repair costs charged to operations amounted to
=4.64 billion, P
P
=5.73 billion and P
=9.04 billion in 2012, 2011 and 2010, respectively. In
addition, related expendable parts sold to LTP amounted to P
=11.12 million in 2012,
=26.33 million in 2011 and =
P
P32.85 million in 2010. As of March 31, 2012 and 2011, PAL has
outstanding amounts payable to and estimated unbilled charges from LTP totaling
=2.69 billion and P
P
=2.94 billion, respectively, net of revolving fund, unapplied credits from and
advance payments to LTP amounting to P
=51.69 million and P
=241.96 million as of
March 31, 2012 and 2011, respectively.
In connection with the sale of maintenance and engineering facilities to LTP in 2000, PAL and
LTP entered into several transition services agreements whereby PAL will render to LTP
various services such as training and medical services, among others. Revenue earned from
the said transition services agreements (included under “Others” in the revenue section of the
consolidated statement of comprehensive income) amounted to P
=75.03 million in 2012,
=66.28 million in 2011 and P
P
=60.88 million in 2010. Receivables from LTP amounted to
=95.61 million and P
P
=66.59 million as of March 31, 2012 and 2011, respectively.
h. The transactions of PAL with APC include joint services and code share agreements, and
endorsements of passengers during flight interruptions. In March 2010, PAL, APC and
Trustmark entered into an arrangement whereby PAL assigned P
=1.36 billion of its receivables
from APC to Trustmark. PAL has net receivable from APC (shown as part of “Receivable
from related parties”) amounting to P
=765.56 million as of March 31, 2012, and net payable to
APC (shown as part of “Accounts payable”) amounting to P
=211.70 million as of
March 31, 2011.
In January 2008, PAL entered into an operating lease agreement with APC covering the
owned Boeing 737-300 aircraft at a fixed monthly rate, for a period of 36 months. In relation
to this, certain spare parts and tools of the said aircraft were also leased to APC. In April
2010, PAL and APC agreed to amend the rate of lease charges from a fixed amount to
power-by-the-hour basis. The said aircraft was grounded starting 2010; hence, no lease
income was recognized. On October 28, 2011, the parties executed a lease termination
agreement effective upon closing of the sale of the aircraft by PAL to a third party. The sale
of the aircraft was executed in November 2011 (see Note 10).
In October 2009, PAL leased out to APC three Bombardier DHC 8-300 aircraft and five
Bombardier DHC 8-400 owned aircraft under operating lease arrangement for 60 months.
In March 2010, PAL also subleased to APC two of its Airbus 320-200 aircraft for a period of
74 and 75 months. In 2012 and 2011, PAL subleased additional five and four Airbus 320-200
aircraft, respectively, to APC under operating lease arrangements for 72 to 92 months. As of
March 31, 2012 and 2011, the related deposit from APC amounted to P
=326.38 million and
=265.31 million, respectively, (included under “Reserves and other noncurrent liabilities” in
P
Note 16). The outstanding security deposits as of March 31, 2012 cover the deposits on eight
Bombardier aircraft and 11 Airbus 320-200 aircraft which were already delivered to APC, and
two Airbus 320-300 aircraft for delivery in fiscal year 2013 and to be leased out to APC upon
delivery (see Note 25).
102
The future minimum lease income receivables from these contracts are as follows:
2011
2012
(In Thousands)
Due within one year
=1,453,821
P
P
=2,379,316
Due after one year but within five years
4,908,880
7,463,045
More than five years
316,184
1,461,946
=6,678,885
P
P
=11,304,307
On April 30, 2008, PAL and APC entered into a five-year TSA effective May 1, 2008. The
TSA provides that all required maintenance (all aircraft-related technical services and
management) related to the Bombardier aircraft will be handled by APC. When APC assumed
the operations of all the flights that use the Bombardier aircraft starting October 27, 2009, it
discontinued charging PAL the maintenance cost under the TSA. Total APC-related
maintenance and repair costs amounted to P
=84.53 million in 2010 (nil in 2012 and 2011).
In June 2010, PAL sold to APC the spare engines, rotable and reparables, expendable parts
and maintenance tools of Bombardier aircraft for a consideration equal to its net book value
amounting to P
=1.13 billion. On March 31, 2011, the same spare engines and maintenance
tools and all rotable and reparable parts as of such date were bought back from APC for
consideration amounting to P
=826.97 million, excluding the related VAT.
i.
The P
=5.66 billion ($125.00 million) syndicated loan of PAL, presented under “Secured loans”,
includes loans obtained from banks under common control, PNB and ABC, amounting to
=1.81 billion and P
P
=611.43 million, respectively. As of March 31, 2012, the outstanding
balance of these loans with PNB and ABC amounted to P
=1.40 billion and P
=470.94 million,
respectively, and P
=1.63 billion and P
=549.37 million, respectively as of March 31, 2011 (see
Note 15). The related financing charges on these loans obtained from related parties amounted
to P
=78.22 million, P
=89.94 million and P
=100.24 million in 2012, 2011 and 2010, respectively.
The accrued interest on these loans amounted to P
=1.03 million and P
=1.39 million as of March
31, 2012 and 2011, respectively.
The P
=5.15 billion ($120.00 million) syndicated loan availed in fiscal year 2012, presented
under “Secured loans,” includes loan from PNB amounting to P
=1.50 billion (see Note 15).
The related financing charges on these loans amounted to P
=14.32 million in 2012. The
accrued interest on these loans amounted to P
=14.98 million as of March 31, 2012.
j.
Unsecured claims of PAL include loans from stockholders amounting to P
=108.22 million as of
March 31, 2011 (nil as of March 31, 2012). The related financing charges on these loans
amounted to P
=2.03 million, P
=13.85 million and P
=28.41 million in 2012, 2011 and 2010,
respectively (see Note 15).
k. As discussed in Note 13, PAL has outstanding short-term notes payable to ABC amounting to
=1.99 billion and P
P
=1.58 billion as of March 31, 2012 and 2011, respectively. The related
financing charges amounted to P
=87.62 million and =
P89.36 million in 2012 and 2011,
respectively. Also, the retirement funds of PAL is being managed by ABC.
As of March 31, 2012 and 2011, the Group’s cash and cash equivalents (included under
“Cash and cash equivalents” and “Other noncurrent assets” in the consolidated statements of
financial position) with ABC amounted to P
=1.44 billion and P
=1.86 billion, respectively. The
related interest income on these investments and cash deposits amounted to P
=24.23 million in
2012, P
=15.01 million in 2011 and P
=17.37 million in 2010.
103
l.
PAL maintains checking accounts and money placements with PNB. As of March 31, 2012
and 2011, total cash and cash equivalents maintained with PNB amounted to P
=306.25 million
and P
=383.08 million, respectively.
As discussed in Note 13, PAL availed of short-term loan from PNB amounting to
=1.67 billion, which remained outstanding as of March 31, 2012. The related financing
P
charges amounted to P
=39.71 million in 2012.
PAL has an operating lease agreement with PNB for the lease of a portion of the PNB
Financial Center Building. The lease is for a period of 10 years commencing on
November 1, 2007 and may be renewed upon mutual agreement of the parties. There is no
outstanding rental liability relating to the said lease contract as of March 31, 2012 and 2011.
Minimum rental commitments under this lease contract are as follows:
Due within one year
Due after one year but within five years
More than five years
2011
2012
(In Thousands)
=28,996
P
P
=29,582
127,533
133,911
57,559
21,596
=214,088
P
P
=185,089
m. In June 2009, PAL obtained on demand noninterest-bearing advance from Trustmark
amounting to P
=3.26 billion. Total settlement in 2010 amounted to P
=2.25 billion, of which
=835.19 million was paid in cash while P
P
=1.36 billion was paid via assignment of receivable
(see also Note 18.h). The remaining P
=905.82 million was settled in 2011.
n. In April 2009, PAL’s BOD authorized management to finalize the terms of the sale of one of
its parcels of land with a carrying value of P
=323.37 million to an entity under common control.
The related Deed of Absolute Sale was executed in June 2010 and the proceeds from sale were
collected in May 2010.
o. As of March 31, 2012 and 2011, PAL has cash and money placements for standby letters of
credit with Oceanic Bank, an entity under common control, amounting to P
=221.07 million and
=194.34 million, respectively.
P
p. As discussed in Note 15, PAL has outstanding loan from Fortune Tobacco Corporation
amounting to P
=1.29 billion ($30.00 million) as of March 31, 2012, with related financing
charges of P
=5.74 million in 2012.
q. PAL and Macroasia Catering Services, Inc. (MCSI), a subsidiary of MAC, entered into a
catering and service agreement effective December 14, 2010, which shall remain in full force
until terminated by either party upon provision of written notice under the agreement. MCSI
will provide to aircraft operated by PAL ordered food, services, bonded items and other
catering supplies as well as storage facilities for PAL’s catering supplies, equipment and
inflight sales items. In March and September 2011, the parties executed the addendums to the
service agreement increasing the scope of services. Related catering expenses amounted to
=98.31 million in 2012 and P
P
=0.04 million in 2011. Outstanding liability to MCSI amounted to
=68.78 million and P
P
=0.04 million as of March 31, 2012 and 2011, respectively.
104
PAL has a ground handling agreement with Macroasia Airport Services Corporation (MASC),
another subsidiary of MAC. On October 1, 2011, the parties executed a supplement to the
agreement specifying the locations, agreed services and charges. The supplement is effective
for a period of five years. Related ground handling expenses amounted to P
=56.79 million in
2012. Outstanding payable to MASC amounted to P
=9.88 million as of March 31, 2012.
r.
The compensation of key management personnel of the Group, consisting mainly of
short-term employee benefits amounted to P
=29.49 million, P
=31.54 million and P
=39.93 million
in 2012, 2011 and 2010, respectively, and retirement benefits of P
=5.95 million, P
=5.84 million
and P
=6.09 million in 2012, 2011 and 2010, respectively.
19. Other Comprehensive Income
Comprehensive income consists of net income or loss for the year, together with other gains and
losses that are not recognized in profit or loss for the year as required or permitted by PFRS
(collectively described as “Other comprehensive income”).
Other comprehensive income includes the following:
• Unrealized mark-to-market gains (losses) on available-for-sale investments of
(P
=35.11 million) in 2012, P
=39.93 million in 2011 and (P
=13.06 million) in 2010. These
amounts are net of the related deferred income tax of P
=0.04 million in 2012, P
=0.09 million in
2011 and 2010. On the other hand, the realized mark-to-market gains removed from equity
and transferred to profit and loss in 2010 amounted to P
=53.90 million, net of the related
deferred income tax of P
=23.13 million.
• Net changes in fair value of cash flow hedges comprise (i) net changes in the fair values of
derivative assets and derivative liabilities designated by management as cash flow hedging
instruments amounting to deferred loss of P
=4.58 million in 2010 (nil in 2012 and 2011), and
(ii) amount transferred from equity to profit and loss amounting to P
=277.08 million in 2011
and (P
=878.19 million) in 2010 (nil in 2012). Of these amounts P
=277.08 million in 2011 and
(P
=1.28 billion) in 2010, pertain to preterminated cash flow hedges (see Note 28). The related
deferred income tax on these net changes in fair value of cash flow hedges amounted to
=66.73 million, P
P
=376.37 million in 2011 and 2010, respectively.
• Increase in revaluation increment in property arising from the results of an updated appraisal
amounted to P
=453.09 million in 2011. This amount is net of the related deferred income tax
of P
=194.18 million. The latest appraisal reports are as of March 31, 2011.
• Effect of foreign exchange losses arising from the translation to Philippine peso of the assets
and liabilities of PAL amounting to P
=55.38 million, P
=110.74 million, P
=105.00 million in 2012,
2011 and 2010, respectively.
• Included under “Cumulative translation adjustment - net of deferred income tax” in the
consolidated statement of changes in equity as of March 31, 2010 are unrealized after-tax
gains on hedging contracts aggregating to P
=277.08 million, which were realized in 2011. As
discussed in Note 28, certain derivative instruments (i.e., fuel derivatives and interest rate
swaps) that were designated as effective hedging instruments were expected to protect PAL
against the impact of rising fuel prices and increasing interest rates. The related hedging gains
or losses were to be recognized in profit or loss at the same time as the corresponding hedged
items are recognized in profit or loss.
105
20. Revenue and Expenses
Details of other revenue are as follows:
2012
Transport-related revenue
Lease income (Note 18)
Non-transport revenue
Others (Notes 5, 12 and 18)
P
=3,336,518
1,792,550
297,461
155,772
P
=5,582,301
2011
(In Thousands)
=3,971,738
P
1,188,346
438,682
400,263
=5,999,029
P
2010
=3,802,690
P
313,159
397,828
540,123
=5,053,800
P
The significant components of expenses by nature are as follows:
2011
(In Thousands)
=27,468,265
P
=33,332,322 P
8,394,158
8,900,202
2010
2012
Fuel and oil (Note 28)
Repairs and maintenance (Note 18)
Depreciation, amortization and
obsolescence (Notes 8, 10 and 11)
Crew and staff costs (Note 21)
Ground handling charges
Aircraft lease rentals (Note 25)
Landing and take-off fees
Passenger food
Financing charges (Notes 13, 15 and 18)
6,723,180
4,499,269
4,220,651
2,074,602
3,007,453
1,575,880
1,365,785
6,852,387
6,985,966
3,762,738
3,570,382
2,621,841
1,672,154
1,661,570
=22,363,479
P
10,441,625
7,390,024
7,304,860
3,467,515
2,531,820
2,276,526
1,561,801
2,569,540
21. Employee Benefits
As of March 31, the Group’s accrued employee benefits consisted of the following:
Regular retirement benefits
Other long-term benefits
2010
2012
(In Thousands)
=3,840,435
P
P
=3,217,365
1,471,749
1,674,578
=5,312,184
P
P
=4,891,943
PAL has funded noncontributory defined benefit retirement plans covering all its permanent and
regular employees with benefits based on years of service and latest compensation.
The following tables summarize the components of the retirement benefits cost recognized in the
consolidated profit or loss and the amounts recognized in the consolidated statements of financial
position.
106
The details of net retirement benefits cost under the defined benefit plans are as follows:
2011
(In Thousands)
=315,255
P
P
=240,948
435,048
280,439
(40,513)
(19,832)
=283,161
P
496,095
(55,347)
255,457
106,859
–
P
=863,871
(268,339)
–
–
=441,451
P
(301,783)
94,216
117,608
=633,950
P
(P
=50,483)
=34,350
P
=99,909
P
2012
Current service cost
Interest cost on benefit obligation
Expected return on plan assets
Net actuarial loss (gain) recognized
during the year
Curtailment loss (Note 2)
Retirement premiums
Actual return (loss) on plan assets
2010
The details of net retirement benefits liability are as follows:
Defined benefit obligation
Fair value of plan assets
Unrecognized net actuarial gain (loss)
Net retirement benefits liability
2011
2012
(In Thousands)
=3,880,302
P
P
=4,845,301
(844,609)
(564,221)
3,035,693
4,281,080
804,742
(1,063,715)
=3,840,435
P
P
=3,217,365
Changes in present value of defined benefit obligation are as follows:
Defined benefit obligation, beginning of year
Current service cost
Interest cost
Benefits paid
Effect of curtailment
Actuarial loss (gain) on obligation
Defined benefit obligation, end of year
2011
2012
(In Thousands)
=4,686,011
P
P
=3,880,302
315,255
240,948
435,048
280,439
(175,996)
(263,946)
–
(933,178)
(1,380,016)
1,640,736
=3,880,302
P
P
=4,845,301
Changes in fair value of plan assets are as follows:
Fair value of plan assets, beginning of year
Expected return on plan assets
Actual contributions to the plan
Benefits paid
Actuarial loss on plan assets
Fair value of plan assets, end of year
2011
2012
(In Thousands)
=810,259
P
P
=844,608
40,513
19,832
175,996
1,486,941
(175,996)
(1,716,845)
(6,163)
(70,315)
=844,609
P
P
=564,221
107
The major categories of plan assets as a percentage of the fair value of total plan assets are as
follows:
2011
69%
30%
1%
100%
2012
66%
32%
2%
100%
Cash and cash equivalents
Investments in government securities
Receivables
The overall expected return on the plan assets is determined based on the market prices prevailing
on the date applicable to the period over which the obligation is to be settled.
The principal assumptions used at the beginning of the fiscal year in determining retirement
benefits cost for PAL’s plans are as follows:
2012
7.20% to 8.73%
2.00% to 2.40%
10% to 11%
Discount rate per annum
Expected annual rate of return on plan assets
Future annual increase in salary
2011
8.54% to 9.65%
5%
10%
As of March 31, 2012, following are the information with respect to the above assumptions:
discount rate per annum of 5.50% to 6.66%, expected annual rate of return on plan assets of 2.79%
to 3.96% and future annual increase in salary of 10.00%.
There are 4,568, 6,967 and 7,237 employees covered in the plans as of March 31, 2012, 2011 and
2010, respectively.
Relevant amounts for the current and prior periods are as follows:
2012
Defined benefit obligations
Fair value of plan assets
Deficit
Experience adjustment on plan
liabilities - loss (gain)
Experience adjustment on plan
assets - gain (loss)
P
=4,845,301
(564,221)
4,281,080
413,649
(70,315)
2011
=3,880,302
P
(844,609)
3,035,693
2010
2009
(In Thousands)
=4,686,011
P
=4,318,578
P
(810,259)
(1,327,979)
3,875,752
2,990,599
2008
P5,149,365
=
(1,121,355)
4,028,010
(595,766)
506,156
(140,569)
(318,793)
(6,163)
44,562
114,133
(85,908)
The Group’s expected contribution to the retirement fund in fiscal year ending March 31, 2013 is
about P
=708.45 million.
22. PAL’s Franchise
PAL operates under a franchise, which extends up to the year 2034, granted by the Philippine
Government under Presidential Decree No. 1590. As provided for under the franchise, PAL is
subject to:
a. corporate income tax based on net taxable income; or
b. franchise tax of 2% of the gross revenue derived from nontransport, domestic transport and
outgoing international transport operations, whichever is lower, in lieu of all other taxes,
duties, fees, and licenses of any kind, nature, or description, imposed by any municipal, city,
provincial or national authority or government agency, except real property tax.
108
As further provided for under its franchise, PAL can carry forward as a deduction from taxable
income, net loss incurred in any year up to five years following the year of such loss (see
Note 23). In addition, the payment of the principal, interest, fees, and other charges on foreign
loans obtained by PAL, and all rentals, interest, fees and other charges paid by PAL to lessors for
the lease of aircraft, engines, spares, other flight or ground equipment, and other personal property
are exempt from all taxes, including withholding tax, provided that the liability for the payment of
said taxes is assumed by PAL.
Under Republic Act (RA) No. 9337 or the E-VAT Act of 2005, which took effect on
November 1, 2005, the franchise tax of PAL was abolished and PAL shall be subjected to the
corporate income tax. PAL remains exempt from any taxes, duties, royalties, registration license,
and other fees and charges, as may be provided by PAL’s franchise.
23. Income Taxes
a. The income tax expense (benefit) consists of the following:
2011
(In Thousands)
=216,099
P
P
=42,342
(169,484)
(1,087,923)
=46,615
P
(P
=1,045,581)
2010
2012
Current income tax
Deferred income tax
=100,872
P
110,409
=211,281
P
b. The Group’s recognized net deferred income tax assets, all relating to PAL, are as follows:
2012
(In Thousands)
Deferred income tax assets on:
NOLCO
Accrued retirement benefits cost and
unamortized past service cost contribution
Allowance for inventory losses
MCIT
Unrealized foreign exchange adjustments - net
Reserves and others
Deferred income tax liabilities on:
Prepaid commission and others
Changes in exchange rates related to
nonmonetary assets and liabilities - net
Revaluation increment in property
Investment properties carried at deemed cost
Cumulative translation and fair value
adjustments - net
Unrealized foreign exchange adjustments - net
Net present value adjustments on
financial liabilities
Net deferred income tax assets
2011
P
=2,618,654
=1,742,216
P
1,558,118
51,521
–
–
39,757
4,268,050
1,235,435
16,929
317,222
391,985
44,103
3,747,890
(915,696)
(1,203,791)
(853,270)
(172,938)
(87,800)
(1,310,140)
(197,029)
(88,769)
(80,158)
(221,564)
(42,670)
–
(38,125)
(2,369,551)
P
=1,898,499
(79,480)
(2,921,879)
=826,011
P
109
c. As of March 31, 2012 and 2011, the Parent Company did not recognize deferred income tax
asset on provision for probable loss amounting to =
P2.88 million and P
=2.57 million, and
carryforward benefits of NOLCO amounting to P
=26.75 million and P
=26.48 million,
respectively, as management believes that the Parent Company may not have sufficient future
taxable profits to allow all or part of the deferred income tax assets to be utilized in the future.
As of March 31, 2012, the Parent Company’s NOLCO that are available for deduction against
future taxable income are as follows:
Incurred during fiscal year
ended March 31
2009
2010
2011
2012
Amount
Expired
=8,848
P
8,678
8,951
9,121
=35,598
P
(P
=8,848)
–
–
–
(P
=8,848)
Balance as of
March 31, 2012
(In Thousands)
=–
P
8,678
8,951
9,121
=26,750
P
Available until
fiscal year
ending March 31
2012
2013
2014
2015
As of March 31, the deferred income tax assets on the following deductible temporary
differences were not recognized by PAL because management believes that PAL may not have
sufficient future taxable income against which these deductible temporary differences and
MCIT may be utilized.
Allowance for doubtful accounts (Note 7)
Provisions (Note 16)
Accrued retirement benefits
MCIT
2011
2012
(In Thousands)
=4,400,399
P
P
=4,707,713
3,039,689
1,598,261
2,119,613
1,398,446
−
359,393
In 2011, PAL’s NOLCO incurred in 2009 amounting to P
=5.63 billion was claimed as
deduction against taxable income. PAL’s remaining NOLCO amounting to P
=2.92 billion
incurred in 2012, P
=1.37 billion incurred in 2010 and P
=4.44 billion incurred in 2009 can be
used as deduction against taxable income until 2017, 2015 and 2014, respectively. The MCIT
amounting to P
=42.17 million incurred in 2012, P
=215.99 million incurred in 2011 and
=101.23 million incurred in 2010 can be used as credit against the regular income tax payable
P
until 2015, 2014 and 2013, respectively.
110
d. The reconciliation between the statutory tax rate and the Group’s effective tax rate follows:
Statutory income tax rate
Adjustments resulting from:
Movement in deductible temporary
differences for which no
deferred income tax assets
were recognized
Interest income subjected to final tax
or exempted from tax
Nondeductible portion of interest
expense
Deductible temporary differences
used/recognized in current year
but for which no deferred income
tax assets were recognized in
prior years
Nondeductible expenses and
others - net
Effective income tax rate
2012
(30.00%)
2011
30.00%
2010
30.00%
(8.36%)
7.17%
955.74%
(0.18%)
(0.27%)
(2.22%)
0.06%
0.09%
0.73%
16.43%
(529.69%)
(51.89%)
1.53%
(401.55%)
53.01%
–
18.88%
(19.60%)
e. RR No. 10-2002 defines expenses to be classified as entertainment, amusement and recreation
(EAR) expenses and sets a limit for the amount that is deductible for tax purposes, i.e., 1% of
net revenue for sales of services and 0.50% of net sales for sales of goods. EAR expenses
amounted to P
=11.67 million in 2012, P
=10.96 million in 2011 and P
=9.89 million in 2010.
24. Note to Consolidated Statements of Cash Flows
Noncash investing activities consist of purchases of property and equipment on account amounting
to P
=321.40 million in 2012, P
=300.82 million in 2011 and P
=790.52 million in 2010. The increase in
property and equipment in 2012 also includes a reclassification from deposit on aircraft leases
amounting to P
=1.40 billion.
The noncash financing activity in 2010 pertains to the P
=1.36 billion assignment of various
receivables discussed in Note 18.h.
25. Aircraft Lease Commitments and Purchases
Aircraft Purchases and Finance Leases
Airbus aircraft
On December 6, 2005, PAL finalized a Purchase Agreement with Airbus wherein PAL placed a
firm order for nine Airbus 320-200 aircraft and options for five aircraft for delivery in fiscal years
2010 to 2013. All nine aircraft on firm order were delivered to and accepted by PAL during fiscal
years 2008 to 2009. One of these aircraft was financed through a Japanese Operating Lease (JOL)
structure.
111
On July 28, 2008, PAL exercised its right to purchase two of the five option aircraft for delivery in
fiscal year 2011 by virtue of an amendment agreement to the Purchase Agreement with Airbus.
PAL did not exercise its right, which lapsed in July 2009, to purchase the remaining three of the
five option aircraft. The two option aircraft were acquired through sale and leaseback transaction
with a buyer/lessor under operating lease agreements. Gain recognized from the sale is included
under “Others - net” in the 2011 consolidated statement of comprehensive income.
As presented in Note 10, PAL also existing finance lease agreements for seven Airbus 330-300
aircraft, two Airbus 340-300 aircraft and ten Airbus 320-200 aircraft as of
March 31, 2012 and 2011. Carrying values of these passenger aircraft under finance lease
amounted to P
=28.47 billion and =
P35.79 billion as of March 31, 2012 and 2011, respectively.
Boeing aircraft
On October 30, 2006, PAL finalized a Purchase Agreement with Boeing wherein PAL placed a
firm order for two Boeing 777-300ER aircraft for delivery in fiscal years 2010 to 2011 and
purchase options for two additional aircraft. In May 2007, PAL finalized a supplemental
agreement with Boeing relating to its exercise of purchase options for two Boeing 777-300ER
aircraft for delivery in fiscal year 2012. On June 2, 2009, PAL and Boeing agreed to reschedule
the deliveries of four Boeing 777-300ER aircraft from their original delivery schedules of fiscal
years 2010, 2011 and 2012 to fiscal years 2013 and 2014. As of March 31, 2012 and 2011,
predelivery payments relating to the acquisition of four Boeing 777-300ER amounted to
=8.89 billion and P
P
=4.08 billion, respectively (see Note 10).
As presented in Note 10, PAL has existing finance lease agreement for four Boeing 747-700
aircraft as of March 31, 2012.
Operating Leases
Airbus aircraft
In March 2010, PAL signed operating lease agreements for the lease of two brand new
Airbus 320-200 aircraft which were delivered in October and November 2010. Additional
Airbus 320-200 aircraft were also delivered in September and November 2010, representing the
two option aircraft covered by Purchase Agreement with Airbus.
On various dates in fiscal year 2011, PAL also signed operating lease agreements for the lease of
seven Airbus 320-200 aircraft. PAL accepted the delivery of five aircraft in fiscal year 2012 and
one aircraft in April 2012. These six aircrafts were subleased to APC upon delivery. The
remaining aircraft is due for delivery in September 2012 and PAL also intends to sublease this
aircraft to APC.
On May 28, 2011, PAL agreed to acquire two Airbus 320-200 from GECAS under operating lease
arrangements. PAL accepted the delivery of these aircrafts in March and May 2012 for use in its
operations.
In November 2011, PAL entered into operating lease agreements with a lessor covering two
Airbus 320-200, which are due for delivery in October and November 2012, for a period of six
years. PAL’s management intends to use these aircraft in its operations. As of June 26, 2012
PAL’s management has not yet elected the rent payment scheme for the said aircraft.
Boeing aircraft
In December 2006, PAL signed operating lease agreements for the lease of two brand new
Boeing 777-300ER aircraft, also as part of its refleeting program initiated in the October 2006
purchase agreement. The two aircraft were delivered in November 2009 and January 2010
(see Note 10).
112
The future minimum lease payments related to the operating lease agreements are shown in the
following table:
Year Ending March 31
2012
2013
2014
2015
2016 and thereafter
2011
2012
(In Thousands)
=3,813,653
P
P
=−
4,403,525
5,172,130
4,263,273
5,041,439
3,676,875
4,474,453
15,040,525
18,136,910
=31,197,851
P
P
=32,824,932
Aircraft engine
In May 2010, PAL sold an aircraft engine and leased back the same under operating lease
arrangement for 96 months with the buyer/lessor. In December 2011, PAL sold and leased back
an additional engine also for a period of 96 months.
Capital Expenditure Commitments
PAL’s capital expenditure commitments relate principally to the acquisition of aircraft fleet
aggregating to P
=50.92 billion, =
P51.48 billion and P
=60.33 billion as of March 31, 2012, 2011 and
2010, respectively.
26. Capital Management
The primary objective of the Group’s capital management is to ensure that it maintains a strong
credit rating and healthy capital ratios in order to support its business and maximize shareholder
value.
The Group considers its equity of P
=1.01 billion and P
=5.38 billion as of March 31, 2012 and 2011,
respectively, presented in the consolidated statements of financial position as its capital. The
Group manages its capital structure and makes adjustment to it, in light of changes in economic
conditions. To maintain or adjust capital structure, the Group may issue new shares or return
capital to shareholders. The Group manages its capital by monitoring its cash flows and debt
levels. No changes were made in the objectives, policies or processes from March 31, 2010 to
March 31, 2012.
27. Financial Risk Management Objectives and Policies
Risk Management Structure
BOD
The BOD is mainly responsible for the overall risk management approach and for the approval of
risk strategies and policies of the Group.
Treasury Risk Committee
The Treasury Risk Committee has the overall responsibility for the development of financial risk
strategies, principles, frameworks, policies and limits. It establishes a forum of discussion of the
Group’s approach to financial risk issues (fuel price and foreign exchange risk, in particular) in
order to make relevant decisions.
113
Treasury Risk Office
The Treasury Risk Office is responsible for the comprehensive monitoring, evaluation and
analysis of the Group’s financial risks in line with the policies and limits set by the Treasury Risk
Committee. The Treasury Risk Office conducts marking-to-market of derivative positions and
daily calculation and reporting of Value-at-Risk (VaR) amounts.
Financial Risk Management
The Group’s principal financial instruments, other than derivatives, consist of loans, cash and cash
equivalents, investments in equities, and deposits. The main purpose of these financial
instruments is to raise financing for the Group’s operations. The Group has various other financial
assets and financial liabilities such as receivables, accounts payables, and accrued expenses, which
arise directly from its operations.
The main risks arising from the use of financial instruments are market risks (consisting of foreign
exchange risk, cash flow interest rate risk, fuel price risk and equity price risk), liquidity risk,
counterparty risk and credit risk.
PAL uses derivative financial instruments to manage its exposures to currency, interest and fuel
price risks arising from PAL’s operations and its sources of financing. The details of PAL’s
derivative transactions, including the risk management objectives and the accounting results, are
discussed in this note.
Market risks
The Group’s operating, investing, and financing activities are directly affected by changes in
foreign exchange rates, interest rates, and fuel prices. Increasing market fluctuations in these
variables may result in significant equity, cash flow and profit volatility risks for the Group. For
this reason, the Group seeks to manage and control these risks primarily through its regular
operating and financing activities, and through the execution of a documented hedging strategy.
Management of financial market risk is a key priority for the Group. The Group generally applies
sensitivity analysis in assessing and monitoring its market risks. Sensitivity analysis enables
management to identify the risk position of the Group as well as provide an approximate
quantification of the risk exposures. Estimates provided for foreign exchange risk, cash flow
interest rate risk, price interest rate risk, fuel price risk and equity price risk are based on the
historical volatility for each market factor, with adjustments being made to arrive at what the
Group considers to be reasonably possible.
Foreign exchange risk
The Group is exposed to foreign exchange rate fluctuations arising from its revenue, expenses and
borrowings in currencies other than its functional currency. The Group manages this exposure by
matching its receipts and payments for each individual currency. Any surplus is sold as soon as
practicable. PAL also uses foreign currency forward contracts and options to hedge a portion of
its exposure. PAL’s significant foreign currency-denominated monetary assets and liabilities (in
Philippine peso equivalents) as of March 31 are as follows:
2011
2012
(In Thousands)
Financial Assets and Financial Liabilities
Financial assets:
Cash
=2,426,377
P
P
=1,900,817
Receivables
5,748,521
7,214,243
Others*
1,164,029
1,623,034
=9,338,927
P
P
=10,738,094
(Forward)
114
2012
(In Thousands)
Financial liabilities:
Accounts payable
Accrued expenses
Others**
(P
=1,529,309)
(4,456,377)
(617,477)
(6,603,163)
Net foreign currency-denominated
financial assets
Nonfinancial Liabilities
Accrued employee benefits
Provisions
Net foreign Currency-denominated Monetary
Liabilities
2011
(P
=1,361,926)
(4,360,854)
(888,258)
(6,611,038)
4,134,931
2,727,889
(4,891,943)
(1,598,261)
(6,490,204)
(5,312,184)
(3,039,689)
(8,351,873)
(P
=2,355,273)
(P
=5,623,984)
* Includes miscellaneous deposits and security deposits.
** Substantially pertaining to notes payable to a local bank.
The Group recognized P
=34.93 million foreign exchange gain in 2012 and P
=209.23 million and
=96.61 million foreign exchange loss in 2011 and 2010, respectively, included under
P
“Others - net” in the consolidated statement of comprehensive income, arising from the translation
and settlement of these foreign currency-denominated financial instruments.
PAL’s foreign currency-denominated exposures comprise primarily of PHP and JPY. Other
foreign currency exposures include Canadian Dollar (CAD), Euro (EUR), Australian Dollar
(AUD), Singaporean Dollar (SGD), Chinese Yuan (CNY), Thai Baht (THB), and Hong Kong
Dollar (HKD).
Shown below is the impact on the Group’s income before income tax of reasonably possible
changes in the exchange rates of foreign currencies against the USD, PAL’s functional currency,
with all other variables held constant.
Currency
PHP
JPY
Others*
Net
Movement in Foreign
Exchange Rates
6.85%
8.08%
0.03% to 14.86%
2012
Net Loss (Gain) Effect on Income Before Tax
Increase in Foreign
Decrease in Foreign
Exchange Rates
Exchange Rates
(In Thousands)
P
=110,899
(P
=110,899)
(43,621)
43,621
(201,833)
201,833
(P
=134,555)
P
=134,555
*Includes various currencies (i.e. CAD, AUD, EUR, HKD, SGD and others).
Currency
PHP
JPY
Others*
Net
Movement in Foreign
Exchange Rates
7.40%
10.66%
0.14% to 14.41%
2011
Net Loss (Gain) Effect on Income Before Tax
Increase in Foreign
Decrease in Foreign
Exchange Rates
Exchange Rates
(In Thousands)
=
P199,677
(P
=199,677)
(90,810)
90,810
(104,223)
104,223
=
P4,644
(P
=4,644)
*Includes various currencies (i.e. CAD, AUD, EUR, HKD, SGD and others).
115
The Group’s major currency derivatives consist of options and forwards to buy USD and sell JPY.
Before taking into account the effect of income taxes, income for the years ended March 31, 2012 and
2011 would have either increased by P
=46.71 million and P
=99.32 million or decreased by P
=20.52 million
and P
=76.88 million, respectively, had the volatility of JPY/USD been at 8.08% and 10.66%,
respectively.
Other currency derivatives consist of options and forward contracts in AUD, CAD and SGD.
Before taking into account the effect of income taxes, income for the years ended
March 31, 2012 and 2011 would either increase by P
=4.47 million and P
=11.37 million and decrease
by P
=5.62 million and P
=15.45 million, respectively, had the various foreign exchange rates changed
with the range of 0.03% to 14.86% in 2012 and 6.07% to 10.71% in 2011. There is no other
impact on the Group’s equity other than those affecting profit or loss.
Cash flow interest rate risk
The Group’s exposure to cash flow interest rate risk arises from the regular repricing of interest on
its floating-rate loans and interest rate swaps. The Group’s policy on interest rate risk is designed
to limit the Group’s exposure to fluctuating interest rates. The ratio of floating rate to the total
borrowings is 0.71:1 and 0.68:1 as of March 31, 2012 and 2011, respectively. There were no
outstanding swap agreements entered into as of March 31, 2012 and 2011.
Income before income tax as of March 31, 2012 and 2011 would either decrease or increase by
=74.53 million and P
P
=80.00 million, respectively, if the USD interest rate for the periods had been
higher or lower by 38 basis points and 35 basis points, respectively. There is no other impact on
the Group’s equity other than those already affecting profit or loss. The Group assumes
concurrent movements in interest rates and parallel shifts in the yield curves.
Fuel price risk
PAL is exposed to price risk on jet fuel purchases. This risk is managed by a combination of
strategies with the objective of managing price levels within an acceptable band through various
types of derivative and hedging instruments. In managing this significant risk, PAL has a
portfolio of swaps, collars, and compound structures with sold options or option combinations
with knock-out features. PAL implements such strategies to manage and minimize the risks
within acceptable risk parameters.
PAL’s fuel derivatives are viewed as economic hedges and are not held for speculative purposes.
Short-term exposures are hedged primarily with fuel derivatives indexed to jet fuel. On long-term
exposures, PAL also uses fuel derivatives indexed to crude oil as proxy hedges due to liquidity
constraints in the refined oil products market (i.e., jet fuel). PAL uses a VaR computation to
estimate the potential three-day loss in the fair value of its fuel derivatives. The VaR computation
is a risk analysis tool designed to statistically estimate the maximum potential loss at a given
confidence interval from adverse movement in fuel prices.
Assumptions and limitations of VaR
The VaR methodology employed by PAL uses a three-day period due to the assumption that not
all positions could be undone in a single day given the size of the positions. The VaR computation
makes use of Monte Carlo simulation with multi-factor models. Multi-factor models ensure that
the simulation process takes into account mean reversion tendency and seasonality of fuel prices.
It captures the complex dynamics of the term structure of commodity markets, such as contango
and backwardation. The VaR estimates are made assuming normal market conditions using a 95%
confidence interval and are determined by observing market data movements over a 90-day
period.
116
The estimated potential three-day losses on its fuel derivative transactions, as calculated in the
VaR model amounted to P
=48.77 million, P
=66.28 million and P
=50.59 million as of March 31, 2012,
2011 and 2010, respectively.
The high, average and low VaR amounts are as follows:
High
April 1, 2011 to March 31, 2012
April 1, 2010 to March 31, 2011
April 1, 2009 to March 31, 2010
P
=182,960
102,722
153,806
Average
Low
(In Thousands)
P
=92,450
P
=41,396
54,568
23,030
86,884
9,958
Equity price risk
Equity price risk is the risk that the fair values of equity securities decrease as the result of changes
in the levels of equity indices and the value of individual stocks. The prices of these investments
are monitored based on their current fair values.
Sensitivity analysis
Before taking into account the effect of taxes, equity as of March 31, 2012 and 2011 would either
decrease or increase by P
=1.45 million and P
=1.60 million, respectively, had the indices in MAC
shares changed by 0.59% in 2012 and 0.57% in 2011. The impact on the Group’s equity already
excludes the impact of transactions affecting profit or loss.
Liquidity risk
Liquidity risk arises from the possibility that the Group may encounter difficulties in raising funds
to meet commitments from financial instruments (e.g., long-term obligations) or that a market for
derivatives may not exist in some circumstances.
The Group’s objectives to manage its liquidity profile are: (a) to ensure that adequate funding is
available at all times; (b) to meet commitments as they arise without incurring unnecessary costs;
(c) to be able to access funding when needed at the least possible cost; and (d) to maintain an
adequate time spread of refinancing maturities.
The tables below summarize the maturity analysis of the Group’s financial liabilities based on
contractual undiscounted payments (principal and interest):
As of March 31, 2012
Accounts payable and accrued
expenses
Notes payable
Obligation under finance lease
Other long-term liabilities
Other liability
(under “Accrued expense” and
“Other noncurrent liabilities”)
(Note 16)
Derivative instruments:
Contractual receivable
Contractual payable
Fuel derivatives
<1 Year
>1-<2
Years
P
= 17,324,135
6,004,578
23,328,713
2,856,528
3,778,578
P
=−
−
−
7,478,072
3,460,781
P
=−
−
−
1,817,010
2,577,414
414,012
414,013
−
−
−
11,352,866
P
= 11,352,866
(792,175)
649,935
(248,717)
6,658,161
P
= 29,984,590
>2-<3
>3-<4
Years
Years
(In Thousands)
>4-<5
Years
>5
Years
Total
P
=−
−
−
1,107,826
3,090,733
P
=−
−
−
1,105,894
−
P
=−
−
−
4,022,916
−
P
= 17,324,135
6,004,578
23,328,713
18,388,246
12,907,506
34,518
−
−
−
862,543
−
−
−
4,428,942
P
= 4,428,942
−
−
−
4,198,559
P
= 4,198,559
−
−
−
1,105,894
P
= 1,105,894
−
−
−
4,022,916
P
= 4,022,916
(792,175)
649,935
(248,717)
31,767,338
P
= 55,093,767
117
As of March 31, 2011
Accounts payable and accrued
expenses
Due to related parties
Notes payable
Obligation under finance lease
Other long-term liabilities
Other liability
(under “Accrued expense” and
“Other noncurrent liabilities”)
(Note 16)
Derivative instruments:
Contractual receivable
Contractual payable
Fuel derivatives
<1 Year
>1-<2
Years
=15,213,603
P
10,000
5,616,561
20,840,164
5,643,431
2,199,049
P
=–
−
–
−
2,945,146
903,190
P
=–
−
–
−
7,651,355
889,387
414,025
414,026
−
−
−
4,262,362
P
=4,262,362
(982,583)
973,381
(124,624)
8,122,679
=28,962,843
P
>2-<3
>3-<4
Years
Years
(In Thousands)
>4-<5
Years
>5
Years
Total
P
=–
−
–
−
1,850,830
852,056
P
=–
−
–
−
1,122,227
2,395,948
P
=–
−
–
−
5,195,156
–
=
P15,213,603
10,000
5,616,561
20,840,164
24,408,145
7,239,630
414,025
34,509
−
−
1,276,585
−
−
−
8,954,767
P
=8,954,767
−
−
−
2,737,395
P
=2,737,395
−
−
−
3,518,175
P
=3,518,175
−
−
−
5,195,156
P
=5,195,156
(982,583)
973,381
(124,624)
32,790,534
=
P53,630,698
The Group’s total financial liabilities due to be settled currently amounting to P
=29.99 billion and
P28.96 billion as of March 31, 2012 and 2011, respectively, include liabilities aggregating to
=
=23.33 billion and P
P
=20.84 billion, respectively, that management considers as working capital.
Accounts payable and accrued expenses of P
=17.32 billion and P
=15.21 billion, as of March 31,2012
and 2011, respectively and due to related parties of P
=10.00 million as of March 31, 2011, include
liabilities that are payable on demand but are expected to be renegotiated in the future. For the
other liabilities amounting to P
=6.66 billion and =
P8.12 billion, as of March 31, 2012 and 2011,
respectively, management expects to settle these from the Group’s cash to be generated from
operations.
The following tables summarize the Group’s financial assets used to manage liquidity risk:
As of March 31, 2012
Cash
Loans and receivables:
Cash equivalents
Receivables - net
<1 Year
>1-<2
Years
>2-<3
Years
= 2,630,045
P
P
=–
>3-<4
Years
(In Thousands)
P
=–
P
=–
350,900
6,672,588
= 9,653,533
P
–
–
P
=–
–
–
P
=–
<1 Year
>1-<2
Years
>2-<3
Years
=3,869,578
P
=
P–
>3-<4
>4-<5 Years
Years
(In Thousands)
=
P–
=
P–
=
P–
671,001
4,975,642
=9,516,221
P
–
–
=
P–
–
–
=
P–
–
–
P
=–
>4-<5
Years
>5
Years
Total
P
=–
P
=–
P
=2,630,045
–
–
P
=–
–
–
P
=–
350,900
6,672,588
P
=9,653,533
>5
Years
Total
=
P–
=
P3,869,578
–
–
=
P–
671,001
4,975,642
=
P9,516,221
As of March 31, 2011
Cash
Loans and receivables:
Cash equivalents
Receivables – net
–
–
=
P–
–
–
=
P–
Counterparty risk
The Group’s counterparty risk encompasses issuer risk on investment securities, credit risk on
cash in banks, time deposits and security deposits, and settlement risk on derivatives. The Group
manages its counterparty risk by transacting with counterparties of good financial condition and
selecting investment grade securities. Settlement risk on derivatives is managed by limiting
118
aggregate exposure on all outstanding derivatives to any individual counterparty, taking into
account its credit rating. PAL also enters into master netting arrangements and implements
counterparty and transaction limits to avoid concentration of counterparty risk.
The table below shows the maximum counterparty exposure after taking into account any
collateral and other credit enhancements of the Group as of March 31:
2012
Gross
Maximum
Exposure
Cash in banks and cash equivalents,
excluding cash on hand
Receivables - net
Derivative instruments
Margin deposits, lease deposits and others
P
=2,731,375
6,672,673
380,523
4,255,833
P
=14,040,404
Financial
Effect of
Collateral
Fair
Net
or Credit
Value of Exposure to
Collateral Credit Risk Enhancements
=2,731,375
P
=– P
1,157,114
5,540,418
–
380,523
4,255,833
–
P
=1,157,114 P
=12,908,150
=
P–
1,132,255
–
–
P
= 1,132,255
2011
Gross
Maximum
Exposure
Cash in banks and cash equivalents,
excluding cash on hand
Receivables - net
Derivative instruments
Margin deposits, lease deposits and others
=
P4,425,055
4,975,642
148,499
6,803,944
=
P16,353,140
Financial
Effect of
Collateral
Fair
Net
Value of
Exposure to
or Credit
Collateral Credit Risk Enhancements
=
P–
940,000
80,131
=
P4,425,055
4,035,642
68,368
6,803,944
–
=
P1,020,131 =
P15,333,008
P
=–
940,000
80,131
–
P
=1,020,131
Credit risk
The Group’s exposure to credit risk arises from the possibility that agents, financial institutions
and other counterparties may fail to fulfill their agreed obligations and that the collaterals held
may not be sufficient to cover the Group’s claims. To manage such risk, the Group, through its
Credit and Collection Department, employs a credit evaluation process prior to the accreditation or
re-accreditation of its travel and cargo agents. The Group considers, among other factors, the size,
paying habits and the financial condition of the agents. To further mitigate the risk, the Group
requires from its agents financial guarantees in the form of cash bonds, letters of credit and
assignment of time deposits. The carrying value of these collaterals held as of March 31, 2012 and
2011 amounted to P
=1.16 billion and P
=1.02 billion, respectively.
The Group, to the best of its knowledge, has no significant concentration of credit risk with any
counterparty.
Credit quality per class of financial assets
The credit quality of receivables is managed by the Group using internal credit quality ratings.
High grade accounts consist of passenger and cargo receivables from agents with good financial
condition and which management believes to be reasonably assured to be recoverable. Standard
grade accounts consist of passenger and cargo receivables from agents with relatively low
defaults. Substandard grade accounts, on the other hand, are receivables from agents with history
of defaulted payments. Accounts from these agents are consistently monitored in order to identify
119
any potential adverse changes in the credit quality. Receivables from IATA which consist of
receivables from other airlines through the IATA clearing house are deemed high grade accounts
as the expectation of default is minimal.
The Group considers its other financial assests as high grade as they consist of accounts with good
financial standing and with relatively low defaults.
Past due accounts include those accounts that are past due by a few days. An analysis of past due
accounts, by age, is discussed in the succeeding section.
The tables below show the credit quality of receivables and an aging analysis of past due accounts:
General traffic:
Passenger
Cargo
IATA
Others
Receivable from related
parties
Non-trade*
Total
High
Grade
Standard
Grade
Substandard
Grade
= 1,735,907
P
593,133
330,077
−
P
=2,197,534
40,487
−
−
P
=16,014
12,580
−
1,288
2012
Past Due but not Impaired
Over 30
Over 60
Over 90
Days
Days
Days
(In Thousands)
Impaired
Financial
Assets
Others
Total
P
=57,102
7,642
−
1,331
P47,743
=
11,249
−
1,030
P49,846
=
10,948
−
859
P
=429,168
171,650
−
32,930
P
=148,939
−
−
−
P
=4,682,253
847,689
330,077
37,438
−
−
254,641
148,638
−
−
291,779
22,369
P
=2,659,117
P
=2,238,021
P
= 576,302
P
=237,082
*Excludes receivables arising from statutory requirements amounting to P3,345,202.
65,947
10,648
P
=136,617
459,823
1,245
P
=522,721
12,451
1,088,162
P
=1,734,361
−
324,238
P
=473,177
941,500
1,738,441
P
= 8,577,398
Impaired
Financial
Assets
Others
Total
High
Grade
Standard
Grade
Substandard
Grade
2011
Past Due but not Impaired
Over 30
Over 60
Over 90
Days
Days
Days
(In Thousands)
General traffic:
Passenger
=
P3,053,189
=33,771
P
=35,508
P
=49,485
P
Cargo
389,630
24,482
−
13,022
IATA
199,850
−
−
−
Others
−
−
1,389
1,476
Receivable from related
parties
−
−
40,239
5,035
Non-trade*
−
−
159,741
99,231
Total
=3,642,669
P
=58,253
P
=236,877
P
=168,249
P
*Excludes receivables arising from statutory requirements amounting to P3,251,518.
=83,430
P
−
−
1,953
=30,776
P
13,067
−
434
=131,309
P
278,462
−
35,073
=44,277
P
−
−
−
=3,461,745
P
718,663
199,850
40,325
1,476
172,635
=259,494
P
7,640
152,623
=204,540
P
68,151
1,085,591
=1,598,586
P
−
306,851
=351,128
P
122,541
1,976,672
=6,519,796
P
28. Financial Instruments
Fair Values of Financial Instruments
The table below presents a comparison by category of the carrying amounts and fair values of the
Group’s financial instruments:
2011
2012
Fair Value
Carrying Value
Fair Value Carrying Value
(In Thousands)
Financial Assets
Cash
Loans and receivables:
Cash equivalents
Receivables - net
General traffic
Receivables from related
parties
Non-trade*
Margin deposits, lease deposits
and others
P
=2,630,045
P
=2,630,045
=
P3,869,578
=
P3,869,578
350,900
350,900
671,001
671,001
5,146,713
5,146,713
3,965,494
3,965,494
932,484
593,391
932,484
593,391
117,071
893,076
117,071
893,076
4,255,833
P
=11,279,321
4,262,015
P
=11,285,503
6,803,944
=
P12,450,586
6,663,780
=
P12,310,422
(Forward)
120
2011
2012
Fair Value
Carrying Value
Fair Value Carrying Value
(In Thousands)
Available-for-sale investments
Equity investments:
Quoted
Unquoted
Derivative assets - fair value
through profit or loss
Financial Liabilities
Financial liabilities carried at
amortized cost:
Accounts payable and accrued
expenses
Notes payable
Obligations under finance
leases
Other long-term debts
Due to related parties
Other liability
(under “Accrued
expenses” and “Other
noncurrent liabilities”)
Derivative liabilities - fair value
through profit or loss
P
=253,355
269,368
522,723
P
=253,355
269,368
522,723
=
P288,502
272,472
560,974
P
=288,502
272,472
560,974
380,524
P
=14,812,613
380,524
P
=14,818,795
148,498
=
P17,029,636
148,498
=
P16,889,472
P
=17,324,135
5,979,805
P
=17,324,135
5,979,805
=
P15,213,603
5,588,737
=
P15,213,603
5,588,737
16,399,801
11,355,914
−
17,392,220
10,046,771
−
21,655,253
6,354,801
10,000
22,220,468
6,281,224
10,000
802,265
51,861,920
833,048
51,575,979
1,129,997
49,952,391
1,202,011
50,516,043
117,553
P
=51,979,473
117,553
P
=51,693,532
10,288
=
P49,962,679
10,288
=
P50,526,331
*Excludes receivables arising from statutory requirements (net of allowance) amounting toP
=542,213 and =
P 395,273 as
of March 31, 2012 and 2011, respectively.
The following methods and assumptions are used to estimate the fair value of each class of
financial instruments:
Cash and cash equivalents and receivables
The carrying amounts of cash and cash equivalents approximate fair value. The carrying amounts
of receivables approximate fair value due to their short-term settlement period.
Other current financial instruments
Similarly, the historical cost carrying amounts of miscellaneous deposits, accounts payable and
accrued expenses and due to related parties approximate their fair values due to the short-term
nature of these accounts.
Equity investments (available-for-sale investments)
The fair values of quoted equity investments are based on market prices. Unquoted equity
investments are carried at cost (subject to impairment).
Margin deposits, lease deposits and others
The fair value of margin deposits, lease deposits and others is determined using discounted cash
flow techniques based on prevailing market rates. Discount rates used are 1.36% to 1.99% and
1.46% to 3.86% for March 31, 2012 and 2011, respectively.
121
Long-term obligations and short-term, fixed rate notes payable
The fair value of long-term obligations (whether fixed or floating) is generally based on the
present value of expected cash flows with discount rates that are based on risk-adjusted benchmark
rates (in the case of floating rate liabilities with quarterly repricing, the carrying value
approximates the fair value in view of the recent and regular repricing based on current market
rates). The discount rates used for USD-denominated loans ranged from 1.26% to 4.42% and
1.12% to 3.29% in 2012 and 2011, respectively. The discount rates used for PHP-denominated
loans amounted to 5.03% in 2011 (nil in 2012). The discount rates used for JPY-denominated
loans amounted to 1.35% in 2012 and 1.60% in 2011.
The carrying value of the short-term, fixed rate notes payable approximates its fair value due to
the short-term settlement period of the notes (i.e., effect of discounting is minimal).
Derivatives
The fair value of forward exchange contracts is calculated by reference to current forward
exchange rates for contracts with similar maturity profiles.
The fair value of interest rate swap transactions is the net present value of estimated future cash
flows.
The fair values of fuel derivatives that are actively traded in an organized and liquid market are
based on published prices. In the absence of an active and liquid market, and depending on the
type of instrument and the underlying commodity, the fair value of fuel derivatives is determined
by the use of either present value methods or standard option valuation models. The valuation
inputs on these fuel derivatives are based on assumptions developed from observable information,
including (but not limited to) the forward curve derived from published or futures prices adjusted
for factors such as seasonality considerations and the volatilities that take into account the impact
of spot prices and the long-term price outlook of the underlying commodity. The fair values of
fuel derivatives with extendible or cancelable features are based on quotes provided by
counterparties.
Derivative Financial Instruments
The derivative financial instruments set out in this section have been entered into to achieve
PAL’s risk management objectives, as discussed in Note 27. PAL’s derivative financial
instruments are accounted for at fair value through profit or loss.
The following table provides information about PAL’s derivative financial instruments
outstanding as of March 31, 2012 and 2011 and the related fair values:
2011
2012
Asset
Fuel derivatives
Currency forwards
Structured currency derivatives
P
=366,270
558
13,696
P
=380,524
Asset
(In Thousands)
=130,701
P
P
=117,553
17,797
−
−
−
=148,498
P
P
=117,553
Liability
Liability
=6,077
P
4,211
−
=10,288
P
As of March 31, 2012 and 2011, the positive and negative fair values of derivative positions that
will be settled in 12 months or less are classified under “Other current assets” (P
=380.52 million in
2012 and P
=148.50 million in 2011) and “Accrued expenses” (P
=117.55 million in 2012 and
=10.29 million in 2011), respectively. The negative fair values of derivative positions that will
P
settle in more than 12 months are classified under “Other noncurrent liabilities” (nil in 2012 and
2011). The derivative asset (liability) balances include amounts arising from derivative
settlements that are currently due to PAL which amounted to P
=40.44 million and P
=45.06 million as
of March 31, 2012 and 2011, respectively.
122
Fuel derivatives
PAL is dependent on jet fuel to run its operations, and jet fuel costs have become a larger portion
of PAL’s expenses due to the increase in all energy prices over the years. Approximately 43.76%,
39.58% and 33.89% of its operating expenses represent jet fuel consumption for 2012, 2011 and
2010, respectively. In order to hedge against adverse market condition and to be able to acquire
jet fuel at the lowest possible cost, PAL enters into fuel derivatives. PAL does not purchase or
hold any derivative financial instruments for trading purposes.
PAL accounts for some of its fuel derivatives as cash flow hedges. However, there are no
outstanding fuel derivatives accounted for as cash flow hedges as of March 31, 2012 and 2011.
PAL’s fuel derivatives not accounted for as cash flow hedges still provide economic hedges
against jet fuel price risk. These derivatives include leveraged collars, spreads, written calls,
swaps and other structures with extendible, cancelable or knock-out features. These fuel
derivatives are carried at fair values in the consolidated statement of financial position, with fair
value changes reported immediately in the statements of comprehensive income. As of March 31,
2012 and 2011, the outstanding notional amounts of fuel derivative assets and liabilities not
accounted for as cash flow hedges totaled 480,000 and 290,000 barrels and 360,000 and 120,000
barrels, respectively.
Currency forwards
PAL’s currency forwards are carried at fair value in the consolidated statements of financial
position, with the fair value changes being reported immediately in statement of comprehensive
income. PAL’s outstanding currency forwards consist of short term buy USD and sell various
currencies (i.e., JPY, SGD, CAD). The aggregate notional amount in USD is equal to $1.02
million and $22.64 million as of March 31, 2012 and 2011, respectively. The net positive fair
value of these forwards amounts to P
=0.56 million and P
=13.59 million as of March 31, 2012 and
2011, respectively.
Structured currency derivatives
PAL enters into structured currency derivatives consisting of option structures with combination of
long calls and short put. These contracts are carried at fair value in the consolidated statements of
financial position and the fair value changes from these derivatives are recognized directly in profit
or loss. Outstanding structured currency derivatives as of March 31, 2012 and 2010 are composed
of options to buy USD and sell various currencies (i.e., AUD, JPY, CAD and SGD). As of March
31, 2012, the contracts have bought and sold options with translated notional amounts of $14.12
million and $17.43 million, respectively. As of March 31, 2010, the contracts have bought and sold
options with translated notional amounts of $21.22 million and $17.20 million, respectively. The
net fair value of these option structures as of March 31, 2012 and 2010 amounts to P
=13.70 million
and (P
=7.79 million), respectively. There are no outstanding structured currency derivatives as of
March 31, 2011.
Cash flow hedges
For the year ended March 31, 2010, the effective portion of the positive fair value changes on
PAL’s cash flow hedges that were deferred in equity amounted to P
=277.08 million (net of tax),
which is the effective fair value changes on fuel derivatives previously designated as cash flow
hedges and which were preterminated in fiscal year 2009. These amounts were recognized in
profit or loss at the same time as the corresponding hedged items are recognized in profit or loss.
123
Below is a rollforward of PAL’s “Cumulative translation adjustments” on cash flow hedges for the
year ended March 31, 2011 (in thousands):
Beginning of year
Items recognized as other comprehensive income:
Transferred to profit or loss*
Tax effects of items taken directly to or
transferred from equity
Foreign exchange difference
=277,077
P
(222,415)
66,729
(121,391)
(277,077)
=−
P
End of year
* The amount from fuel derivatives transferred to profit or loss is included in flying operations expense as mark-to-market
gain or loss and the amount from interest rate swaps is included as part of financing charges as swap income or cost.
Fair value changes on derivatives
The net changes in the fair values of all derivative instruments for the years ended March 31 are as
follows:
Beginning of year
Net changes in fair values of derivatives not
designated as accounting hedges
Fair value of settled instruments**
Foreign exchange difference
End of year*
2011
2012
(In Thousands)
(P
=200,186)
P
=93,154
307,189
(176,233)
(1,583)
P
=222,527
(66,818)
359,303
855
=93,154
P
* Excludes balances that are currently due to the Group amounting to =
P 40.44 million and =
P 45.06 million as
of March 31, 2012 and 2011, respectively.
** Includes fuel derivatives, interest rate swaps, currency forwards and structured currency derivatives.
Fair Value Hierarchy
As of March 31, 2012 and 2011, the Group’s quoted available-for-sale financial investments
measured at fair value under the Level 1 hierarchy amounted to P
=253.36 million and
=288.50 million, respectively. The Group’s financial assets measured at Level 2, which consist of
P
derivative assets, amounted to =
P380.52 million and P
=148.50 million as of March 31, 2012 and
2011, respectively, and financial liabilities measured at Level 2, which consist of derivative
liability of P
=117.55 million and P
=10.29 million as of March 31, 2012 and 2011, respectively.
There were no transfers between the levels of fair value hierarchies in 2012 and 2011.
29. Segment Information
The Group has one reportable operating segment, which is the airline business (system-wide).
This is consistent with how the Group’s management internally monitors and analyzes the
financial information for reporting to the chief operating decision-maker, who is responsible for
allocating resources, assessing performance and making operating decisions.
The revenue of the operating segment are mainly derived from rendering transportation services
and all sales are made to external customers.
124
Segment information for the reportable segment is shown in the following tables:
For the fiscal year ended March 31, 2012
Airline
Business
Revenue
Interest income
Interest expense
Depreciation, amortization
and obsolescence
Net loss
Reportable segment assets
Reportable segment liabilities
P
=71,018,762
47,653
(1,365,785)
Adjustments
and eliminations
(In Thousands)
P
=2,986,626
68
−
(6,723,180)
(3,914,856)
71,528,302
70,775,540
395,184
(373,966)
255,568
2,284
Airline
Business
Adjustments
and eliminations
(In Thousands)
=2,924,835
P
72
−
(37,409)
132,250
294,890
12,138
Consolidated
Financial
Statement
P
=74,005,388
47,721
(1,365,785)
(6,327,996)
(4,288,822)
71,783,870
70,777,824
For the fiscal year ended March 31, 2011
Revenue
Interest income
Interest expense
Depreciation and amortization
Net income
Reportable segment assets
Reportable segment liabilities
=71,442,322
P
240,091
(1,661,570)
(6,814,978)
2,860,668
72,270,500
67,176,224
Consolidated
Financial
Statement
=74,367,157
P
240,163
(1,661,570)
(6,852,387)
2,992,918
72,565,390
67,188,362
For the fiscal year ended March 31, 2010
Airline
Business
Revenue
Interest income
Interest expense
Depreciation and amortization
Net income (loss)
Reportable segment assets
Reportable segment liabilities
Adjustments
and eliminations
(In Thousands)
=61,714,270
P
=2,133,011
P
240,451
48
(2,569,540)
−
(7,359,557)
(30,467)
951,008
(763,767)
76,506,825
248,978
74,577,882
482,389
Consolidated
Financial
Statement
=63,847,281
P
240,499
(2,569,540)
(7,390,024)
187,241
76,755,803
75,060,271
125
The reconciliation of total revenue reported by reportable operating segment to revenue in the
consolidated statements of comprehensive income is presented in the following table:
Total segment revenue of reportable
operating segments
Nontransport and other revenue
Total revenue
2012
2011
(In Thousands)
P
=71,066,415
2,986,694
P
=74,053,109
=71,682,413
P
2,924,907
=74,607,320
P
2010
=61,954,721
P
2,133,059
=64,087,780
P
The reconciliation of total income (loss) reported by reportable operating segment to total
comprehensive income (loss) in the consolidated statements of comprehensive income is presented
in the following table:
2012
Total segment income (loss) of reportable
segments
Add (deduct) unallocated items:
Nontransport revenue and other income
Nontransport expenses and other charges
Income tax benefit (expense)
Net income (loss)
Other comprehensive income (loss)
Total comprehensive income (loss)
2011
(In Thousands)
2010
(P
= 3,914,856)
=2,860,668
P
=951,008
P
2,986,694
(4,406,241)
1,045,581
(4,288,822)
(90,489)
(P
=4,379,311)
2,924,907
(2,746,042)
(46,615)
2,992,918
105,201
=3,098,119
P
2,130,059
(2,682,545)
(211,281)
187,241
(1,050,134)
(P
=862,893)
The Group’s major revenue-producing asset is the fleet owned by the Group, which is employed
across its route network (see Note 10).
126
127
PAL HOLDINGS, INC. and SUBSIDIARIES
Schedule A Financial Assets
March 31, 2012
(Amounts in thousands)
Name of Issuing entity and
association of each issue
MacroAsia Corporation
Kepner Tregoe Philippines
HNL-Fuel Facilities
Aeronautical Radio STN
APO Golf Club
Phil Long Distance Tel Co
Davao Insurance Hotel
Club Donatello
Baguio Country Club
Sita Treasurer Advances
Pilipino TELCO-PTO PRNCSA
Orchard Golf and Country Club
Mimosa Golf and Country Club
Bacolod Golf and Country Club
Golf La Moraleja
Tanah Merah Country Club
Medical Doctors, Inc.
Tower Club, Inc.
Investment in Abacus Holdings
Number of shares
or principal amount of
bonds and notes
88,000 Php
2,988
1
101
57,748
6
1
30
300
1
1
1
2
10,164
1
1,109,495
Amount shown
in the
balance sheet
246,400 Php
1,760
43
43
172
258
472
1,288
687
14,512
172
429
86
4,036
5,410
8,544
558
237,854
Value based on
market quotation at
end of reporting period
Income received
and accrued
246,400
1,760
43
43
172
258
472
1,288
687
14,512
172
429
86
4,036
5,410
8,544
558
237,854
5,720
99,925
128
PAL HOLDINGS, INC. & SUBSIDIARIES
Schedule B Amounts Receivable from Directors, Officers, Employees, Related Parties and
Principal Stockholders
March 31, 2012
(Amounts in Thousand Pesos)
Name and Designation of debtor
Balance at
Beginning of Period
Amounts
Collected
Amounts
Written-off
Balance at
End of Period
Various Pilot Trainees - Employees
Receivable from various employees
36,107
2,233
8,372
86
-
27,735
2,147
38,340
8,458
-
29,882
129
PAL HOLDINGS, INC. & SUBSIDIARIES
Schedule E Long-term Debt
March 31, 2012
(Amounts in Thousand Pesos)
Type of Obligation
Obligations under finance leases relating to:
Boeing 747-400 aircraft
Airbus 320-200 aircraft
Airbus 340-300 aircraft
Airbus 330-300 aircraft
Long-term debts:
Secured loans $125M Domestic Sysndicated loan
$120M Domestic Sysndicated loan
Banco de Oro
Advances from sale of future receivables
Unsecured loans Fortune Tobacco Corporation
Amount
Authorized by
Indenture
-
Amount
Shown as
Current
Amount
Shown as
Long-term
Total
-
692,568
1,508,186
27,091
91,535
1,385,094
7,065,047
1,447,778
4,182,501
2,077,662
8,573,233
1,474,869
4,274,036
-
2,319,380
14,080,421
16,399,800
-
699,910
1,717,231
99,822
715,581
3,232,544
3,616,975
3,434,849
499,108
954,079
8,505,011
4,316,885
5,152,080
598,930
1,669,660
11,737,555
-
429,340
858,680
1,288,020
-
3,661,884
9,363,691
13,025,575
-
5,981,264
23,444,111
29,425,375
Remarks
See Annex I
See Annex II
130
PAL HOLDINGS, INC. & SUBSIDIARIES
Schedule E Long-term Debt - Annex I
March 31, 2012
(Amounts in Thousand Pesos)
Type of Obligation
Amount Shown Amount Shown as
as Current
Long-term
Floating
Interest Rate
Payment
Term
Issue
Date
Maturity
Date
$125 Million Syndicated Loan:
Banco de Oro
339,436
1,866,985 3 month LIBOR plus
margin of 3%
quarterly
2008
2015
46,497
23,270 3 month LIBOR plus
margin of 3%
quarterly
2008
2013
214,670
1,180,685 3 month LIBOR plus
margin of 3%
quarterly
2008
2015
Allied Banking Corporation
72,473
398,471 3 month LIBOR plus
margin of 3%
quarterly
2008
2015
Union Bank
26,834
147,564 3 month LIBOR plus
margin of 3%
quarterly
2008
2015
Banco de Oro (unsecured portion)
Philippine National Bank
699,910
3,616,975
131
PAL HOLDINGS, INC. & SUBSIDIARIES
Schedule E Long-term Debt - Annex II
March 31, 2012
(Amounts in Thousand Pesos)
Type of Obligation
Amount Shown
as Current
Amount Shown as
Long-term
Floating
Interest Rate
Issue
Date
Maturity
Date
$120 Million Syndicated Loan:
Banco de Oro
786,980
1,574,390 3 month LIBOR plus
margin of 4%
2011
2015
Philippine National Bank
500,911
1,001,779 3 month LIBOR plus
margin of 4%
2011
2015
China Bank
429,340
858,680 3 month LIBOR plus
margin of 4%
2011
2015
1,717,231
3,434,849
Payment terms:
33.3% due in December 2012
10.4% due in May 2013
56.3% payable quarterly commencing December 2013 to September 2015
132
PAL HOLDINGS, INC. & SUBSIDIARIES
Schedule F Indebtedness to Related Parties (Long-term Loans from Related Parties)
March 31, 2012
(Amounts in Thousand Pesos)
Name of Related Party
Philippine National Bank
Portion of $125 Million Syndicated Loan
Portion of $120 Million Syndicated Loan
Fortune Tobacco Corporation
Balance at
Beginning of Period
1,627,800
-
Balance at
End of Period
1,395,355
1,502,690
1,288,020
Allied Banking Corporation
Portion of $125 Million Syndicated Loan
549,372
470,943
Pili Aircraft Leasing Limited
987,705
608,546
Plaridel Aircraft Leasing Limited
986,403
607,430
Poro Aircraft Leasing Limited
971,905
597,384
Remarks
Remarks
mainly to finance predelivery
payments for three B777 aircraft
for additional working capital
Philippine National Government
48,530
-
fully paid in June 2011
Land Bank of the Philippines
37,635
-
fully paid in June 2011
Lucio Tan Group of Companies
22,095
-
fully paid in June 2011
5,231,445
6,470,368
133
PAL HOLDINGS, INC. AND SUBSIDIARIES
Schedule H CAPITAL STOCK
MARCH 31, 2012
Title of Issue
No. of shares
authorized
Common Stock
20,000,000,000
No. of shares issued
and outstanding
5,421,512,096
No. Of shares reserved
for options, warrants,
conversion and other
rights
-
Number of shares held by
Affiliates
5,297,280,230
Directors, Officers
and Employees
9,000
Others
124,222,866
134
PAL HOLDINGS, INC.
Schedule I RECONCILIATION OF RETAINED EARNINGS
MARCH 31, 2012
(Amounts in Thousands)
Deficit as of March 31, 2011
Add: Net loss during the year closed to retained earnings
Deficit as of March 31, 2012
P
P
(29,661)
(4,211)
(33,872)
135
PAL HOLDINGS, INC. & SUBSIDIARIES
Schedule J Relationships between & among the Group and its parent
136
PAL HOLDINGS, INC. & SUBSIDIARIES
Schedule K LIST OF PHILIPPINE FINANCIAL REPORTING STANDARDS EFFECTIVE AS
AT MARCH 31, 2012
I. List of Philippine Financial Reporting Standards (PFRSs) [which consist of PFRSs, Philippine
Accounting Standards (PASs) and Philippine Interpretations] and Philippine Interpretations Committee
(PIC) Q&As effective as at March 31, 2012
PFRSs
PFRS 1, First-time Adoption of Philippine Financial Reporting
Standards
PFRS 2, Share-based Payment
PFRS 3, Business Combinations
PFRS 4, Insurance Contracts
PFRS 5, Non-current Assets Held for Sale and Discontinued
Operations
PFRS 6, Exploration for and Evaluation of Mineral Resources
PFRS 7, Financial Instruments: Disclosures
PFRS 8, Operating Segments
PAS 1, Presentation of Financial Statements
PAS 2, Inventories
PAS 7, Statement of Cash Flows
PAS 8, Accounting Policies, Changes in Accounting Estimates
and Errors
PAS 10, Events after the Reporting Period
PAS 11, Construction Contracts
PAS 12, Income Taxes
PAS 16, Property, Plant and Equipment
PAS 17, Leases
PAS 18, Revenue
PAS 19, Employee Benefits
PAS 20, Accounting for Government Grants and Disclosure of
Government Assistance
PAS 21, The Effects of Changes in Foreign Exchange Rates
PAS 23, Borrowing Costs
PAS 24, Related Party Disclosures
PAS 26, Accounting and Reporting by Retirement Benefit Plans
PAS 27, Consolidated and Separate Financial Statements
PAS 28, Investments in Associates
PAS 29, Financial Reporting in Hyperinflationary Economies
PAS 31, Interests in Joint Ventures
PAS 32, Financial Instruments: Presentation
PAS 33, Earnings per Share
PAS 34, Interim Financial Reporting
PAS 36, Impairment of Assets
PAS 37, Provisions, Contingent Liabilities and Contingent
Assets
PAS 38, Intangible Assets
PAS 39, Financial Instruments: Recognition and Measurement
PAS 40, Investment Property
PAS 41, Agriculture
Philippine Interpretation IFRIC–1, Changes in Existing
Decommissioning, Restoration and Similar Liabilities
Philippine Interpretation IFRIC–2, Members' Shares in Cooperative Entities and Similar Instruments
Philippine Interpretation IFRIC–4, Determining whether an
Arrangement contains a Lease
Adopted/Not adopted/Not applicable
Adopted
Adopted/Not applicable
Adopted
Adopted/Not applicable
Adopted
Adopted/Not applicable
Adopted
Adopted
Adopted
Adopted
Adopted
Adopted
Adopted
Adopted/Not applicable
Adopted
Adopted
Adopted
Adopted
Adopted
Adopted/Not applicable
Adopted
Adopted
Adopted
Adopted/Not applicable
Adopted
Adopted
Adopted/Not applicable
Adopted
Adopted
Adopted
Adopted
Adopted
Adopted
Adopted
Adopted
Adopted
Adopted/Not applicable
Adopted
Adopted/Not applicable
Adopted
137
PFRSs
Philippine Interpretation IFRIC–5, Rights to Interests arising
from Decommissioning, Restoration and Environmental
Rehabilitation Funds
Philippine Interpretation IFRIC–6, Liabilities arising from
Participating in a Specific Market - Waste Electrical and
Electronic Equipment
Philippine Interpretation IFRIC–7, Applying the Restatement
Approach under PAS 29, Financial Reporting in
Hyperinflationary Economies
Philippine Interpretation IFRIC–9, Reassessment of Embedded
Derivatives
Philippine Interpretation IFRIC–10, Interim Financial
Reporting and Impairment
Philippine Interpretation IFRIC–12, Service Concession
Arrangements
Philippine Interpretation IFRIC–13, Customer Loyalty
Programmes
Philippine Interpretation IFRIC–14, PAS 19 - The Limit on a
Defined Benefit Asset, Minimum Funding Requirements and
their Interaction
Philippine Interpretation IFRIC–16, Hedges of a Net Investment
in a Foreign Operation
Philippine Interpretation IFRIC–17, Distributions of Non-cash
Assets to Owners
Philippine Interpretation IFRIC–18, Transfers of Assets from
Customers
Philippine Interpretation IFRIC–19, Extinguishing Financial
Liabilities with Equity Instruments
Philippine Interpretation SIC–7, Introduction of the Euro
Philippine Interpretation SIC–10, Government Assistance - No
Specific Relation to Operating Activities
Philippine Interpretation SIC–12, Consolidation - Special
Purpose Entities
Philippine Interpretation SIC–13, Jointly Controlled Entities Non-Monetary Contributions by Venturers
Philippine Interpretation SIC–15, Operating Leases –
Incentives
Philippine Interpretation SIC–21, Income Taxes - Recovery of
Revalued Non-Depreciable Assets
Philippine Interpretation SIC–25, Income Taxes - Changes in
the Tax Status of an Entity or its Shareholders
Philippine Interpretation SIC–27, Evaluating the Substance of
Transactions Involving the Legal Form of a Lease
Philippine Interpretation SIC–29, Service Concession
Arrangements: Disclosures
Philippine Interpretation SIC–31, Revenue - Barter
Transactions Involving Advertising Services
Philippine Interpretation SIC–32, Intangible Assets - Web Site
Costs
PIC Q&A No. 2006-01: PAS 18, Appendix, paragraph 9 –
Revenue recognition for sales of property units under precompletion contracts
PIC Q&A No. 2006-02: PAS 27.10(d) – Clarification of criteria
for exemption from presenting consolidated financial
statements
PIC Q&A No. 2007-03: PAS 40.27 – Valuation of bank real
and other properties acquired (ROPA)
Adopted/Not adopted/Not applicable
Adopted
Adopted/Not applicable
Adopted/Not applicable
Adopted
Adopted
Adopted/Not applicable
Adopted
Adopted/Not applicable
Adopted/Not applicable
Adopted/Not applicable
Adopted/Not applicable
Adopted/Not applicable
Adopted/Not applicable
Adopted/Not applicable
Adopted
Adopted/Not applicable
Adopted
Adopted
Adopted/Not applicable
Adopted
Adopted/Not applicable
Adopted
Adopted
Adopted/Not applicable
Adopted
Adopted/Not applicable
138
PFRSs
PIC Q&A No. 2008-01 (Revised): PAS 19.78 – Rate used in
discounting post-employment benefit obligations
PIC Q&A No. 2008-02: PAS 20.43 – Accounting for
government loans with low interest rates under the amendments
to PAS 20
PIC Q&A No. 2009-01: Framework.23 and PAS 1.23 –
Financial statements prepared on a basis other than going
concern
PIC Q&A No. 2010-01: PAS 39.AG71-72 – Rate used in
determining the fair value of government securities in the
Philippines
PIC Q&A No. 2010-02: PAS 1R.16 – Basis of preparation of
financial statements
PIC Q&A No. 2011-01: PAS 1.10(f) – Requirements for a
Third Statement of Financial Position
Adopted/Not adopted/Not applicable
Adopted
Adopted/Not applicable
Adopted/Not applicable
Adopted/Not applicable
Adopted
Adopted/Not applicable
II. List of New and Amended Standards and Interpretations and Improvements to PFRS that became
effective as at January 1, 2011
PFRSs
New and Amended Standards and Interpretations
PAS 24 (Amended), Related Party Disclosures
PAS 32, Financial Instruments: Presentation (Amendment) –
Classification of Rights Issues
Philippine Interpretation IFRIC 14 (Amendment),
Prepayments of a Minimum Funding Requirement
PFRS 1, First-time Adoption of IFRS – Limited Exemption
from Comparative IFRS 7 Disclosures for First-time
Adopters
Improvements to PFRS
PFRS 1, First-time Adoption of IFRS:
• Accounting policy changes in the year of
adoption
Adopted/Not adopted/Not applicable
Adopted
Adopted/Not applicable
Adopted/Not applicable
Adopted
• Revaluation basis as ‘deemed cost’
• Use of ‘deemed cost’ for operations subject to rate
regulation
PFRS 3, Business Combinations:
• Transition requirements for contingent
consideration from a business combination that
occurred before the effective date of the
revised IFRS.
Adopted
• Measurement of non-controlling interests
• Un-replaced and voluntarily replaced sharebased payment rewards
PFRS 7, Financial Instruments: Disclosures – Clarification of
disclosures
PAS 1, Presentation of Financial Statements – Clarification of
statement of changes in equity
PAS 27, Consolidated and Separate Financial Statements –
Transition requirements for amendments made as a result of
IAS 27 Consolidated and Separate Financial Statements
Adopted
Adopted
Adopted
Adopted
139
PFRSs
PAS 34, Interim Financial Reporting – Significant events and
transactions
Philippine Interpretation IFRIC 13, Customer Loyalty
Programmes – Fair value of award credits
Philippine Interpretation IFRIC 19, Extinguishing Financial
Liabilities with Equity Instruments
Adopted/Not adopted/Not applicable
Adopted
Adopted
Adopted
140
PAL HOLDINGS, INC. & SUBSIDIARIES
Schedule L Financial Soundness Indicators
31-Mar-12
CURRENT RATIO
31-Mar-11
0.33
0.36
DEBT-TO-EQUITY RATIO
70.35
12.50
ASSET-TO-EQUITY RATIO
71.35
13.50
INTEREST RATE COVERAGE RATIO
(2.91)
2.83
0.10
0.33
PROFIT MARGIN
(0.05)
0.03
RETURN ON ASSETS
(0.05)
0.03
RETURN ON EQUITY
(1.14)
0.72
SOLVENCY RATIO
PROFITABILITY RATIO:
141


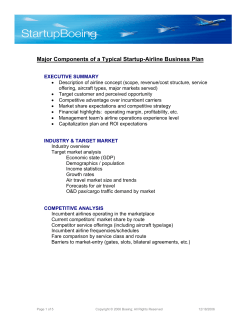

© Copyright 2026