
R 15c2-12 F C S
RULE 15c2-12 FILING COVER SHEET
This cover sheet is sent with all submissions to the Municipal Securities Rulemaking Board (the
Nationally Recognized Municipal Securities Information Repository) and any applicable State
Information Depository pursuant to Securities and Exchange Commission (SEC) Rule 15c2-12 or any
analogous state statute.
Issuer Name: Town of East Bridgewater, Massachusetts
Issue(s):
$
$
$
$
3,576,000
1,419,000
34,000,000
2,081,000
General Obligation Bonds Dated 8/15/01
General Obligation Municipal Purpose Loan of 2010 Bonds Dated 8/1/10
General Obligation Municipal Purpose Loan Unlimited Tax Series 2011 Dated 6/21/11
General Obligation Munical Purpose Loan of 2012 Bonds Dated 8/23/12
Filing Format X electronic ___ paper; If available on the Internet, give URL:_______________
CUSIP Numbers to which the information filed relates (optional):
X Nine-digit number(s) (see following page(s)):
___ Six-digit number if information filed relates to all securities of the issuer
* * *
Financial & Operating Data Disclosure Information
___ Annual Financial Report or CAFR
X Financial Information & Operating Data
___ Other (describe)
X Fiscal Period Covered: FYE 2012
___ Monthly ___ Quarterly X Annual ___Other:
* * *
I hereby represent that I am authorized by the issuer or its agent to distribute this information publicly:
Signature: /s/ Marilyn Thompson
Name:
Marilyn Thompson
Title:Treasurer/Collector
Employer: Town of East Bridgewater, Massachusetts
Voice Telephone Number: (508) 378-1604
Email Address:
[email protected]
DESCRIPTION OF ISSUES COVERED BY THIS REPORT
General Obligation Bonds Dated 8/15/01
Date
08/15/13
08/15/14
08/15/15
08/15/16
08/15/17
08/15/18
$
$
Principal
110,000
110,000
110,000
105,000
105,000
100,000
CUSIP
271227 JS0
271227 JT8
271227 JU5
271227 JV3
271227 JW1
271227 JX9
640,000
General Obligation Municipal Purpose Loan of 2010 Bonds Dated 8/1/10
Date
08/01/13
08/01/14
08/01/15
08/01/16
08/01/17
08/01/18
08/01/19
08/01/20
08/01/21
08/01/22
$
$
Principal
125,000
125,000
125,000
125,000
125,000
125,000
100,000
100,000
100,000
100,000
1,150,000
CUSIP
271227 KC3
271227 KD1
271227 KE9
271227 KF6
271227 KG4
271227 KH2
271227 KJ8
271227 KK5
271227 KL3
271227 KM1
General Obligation Municipal Purpose Loan Unlimited Tax Series 2011 Dated 6/21/11
Date
06/15/13
06/15/14
06/15/15
06/15/16
06/15/17
06/15/18
06/15/19
06/15/20
06/15/21
06/15/22
06/15/23
06/15/24
06/15/25
06/15/26
06/15/27
06/15/28
06/15/29
06/15/31
06/15/32
$
$
Principal
1,155,000
1,190,000
1,225,000
1,275,000
1,325,000
1,375,000
1,450,000
1,520,000
1,595,000
1,680,000
1,760,000
1,845,000
1,940,000
2,035,000
2,120,000
2,200,000
2,290,000
2,385,000
2,490,000
32,855,000
CUSIP
271227 KQ2
271227 KR0
271227 KS8
271227 KT6
271227 KU3
271227 KV1
271227 KW9
271227 KX7
271227 KY5
271227 KZ2
271227 LA6
271227 LB4
271227 LC2
271227 LD0
271227 LE8
271227 LF5
271227 LG3
271227 LH1
271227 LJ7
General Obligation Munical Purpose Loan of 2012 Bonds Dated 8/23/12
Date
08/15/13
08/15/14
08/15/15
08/15/16
08/15/17
08/15/18
08/15/19
08/15/20
08/15/21
08/15/22
08/15/23
08/15/24
08/15/27
08/15/32
$
$
Principal
91,000
95,000
95,000
100,000
105,000
105,000
105,000
110,000
110,000
115,000
120,000
120,000
370,000
440,000
2,081,000
CUSIP
271227LK4
271227LL2
271227LM0
271227LN8
271227LP3
271227LQ1
271227LR9
271227LS7
271227LT5
271227LU2
271227LV0
271227LW8
271227LZ1
271227ME7
ONTINUING
ISCAL
ISCLOSURE EPORT
OR HE
EAR NDED UNE
GENERAL OBLIGATION DEBT
FINANCIAL STATEMENTS
The audited financial statements for the Town for the fiscal year ended June 30, 2012 are being
separately filed directly with the Nationally Recognized Municipal Securities Information Repository
and any applicable State Information Depository, and are hereby incorporated by reference into this
Annual Continuing Disclosure Report.
SIGNATURE OF ISSUER
The information set forth herein has been obtained from the Town and other sources believed to be
reliable, but such information is not guaranteed as to accuracy or completeness and is not to be
construed as a promise or guarantee. This Annual Continuing Disclosure Report may contain, in part,
estimates and matters of opinion which are not intended as statements of fact, and no representation is
made as to the correctness of such estimates and opinions, or that they will be realized. The
information and expressions of opinion contained herein are subject to change without notice, and the
delivery of this Annual Continuing Disclosure Report will not, under any circumstances, create any
implication that there has been no change in the affairs of the Town or other matters described.
TOWN OF EAST BRIDGEWATER, MASSACHUSETTS
/s/ Marilyn Thompson
Marilyn Thompson
Treasurer/Collector
Approved for Submission:
03/18/2013
Date
CERTIFICATE OF SUBMISSION OF ANNUAL REPORT
Subject to the continuing disclosure requirements of SEC Rule 15c2-12, this Annual Continuing
Disclosure Report for the Town of East Bridgewater, Massachusetts with respect to the issues listed on
the report cover was submitted directly to the National Recognized Municipal Securities Information
Repository (“NRMSIR”) listed below as well as to any applicable State Information Depository
(“SID”).
NRMSIR
Municipal Securities Rulemaking Board ("MSRB")
via the Electronic Municipal Market Access ("EMMA") system
First Southwest Company
Signed by:
/s/ Henriqueta Da Costa
Annual Report
TOWN OF EAST BRIDGEWATER, MASSACHUSETTS
For The Fiscal Year Ended
June 30, 2012
TOWN OF EAST BRIDGEWATER, MASSACHUSETTS
/s/ Marilyn Thompson, Treasurer
Filing Date: March 25, 2013
1
TOWN OF EAST BRIDGEWATER, MASSCHUSETTS
General
East Bridgewater was incorporated as a Town in 1823 and is governed by the open town meeting form of government.
The Town has a population of approximately 13,794 (2010 census) and occupies a land area of 17.28 square miles.
Located in Plymouth County, approximately 25 miles south of Boston and 207 miles from New York City, it is bordered by
Hanson and Halifax on the east, Bridgewater on the south, West Bridgewater on the west, Brockton on the northwest and
Whitman on the north.
The following table sets forth the principal executive officers of the Town.
PRINCIPAL TOWN OFFICIALS
To wn Ti tle
Se lectme n, Chai rman
Se lectme n
To wn A dministrato r
Trea su rer/Colle ctor
To wn A ccoun tant
Assessor
Assessor
Assessor
Po lice Chi ef
Fire Chi ef, Actin g
DPW Director
To wn Clerk
To wn Modera tor
Scho ol Comm ittee, Chair
Su perintenden t of Schoo ls
Nam e
Term
Term Expi res
Martin Cro wley
Brian Co nnors
George G. Sami a
Mari lyn Thom pso n
Phyl lis Tirrell
Anthony Figueire do
Davi d Li ncoln Phil lips
Curtis C. Glu ck
Joh n E . Co wan
Timothy Harhen
Joh n B . Ha ines
Din a Li vingston
Robe rt T. Loo ney
Beth Haye s
Susan Cote
3 yrs.
3 yrs.
5 yrs.
3 yrs.
3 yrs.
3 yrs.
3 yrs.
3 yrs.
3 yrs.
N/A
3 yrs.
3 yrs.
3 yrs.
3 yrs.
3 yrs.
2015
2014
2014
2013
2015
2013
2015
2014
2015
N/A
2015
2015
2014
2014
2015
Municipal Services
The Town provides governmental services for the territory within its boundaries, including police and fire protection,
disposal of rubbish, public education in grades K-12, water services, street maintenance and recreational facilities. The
Southeastern Regional Vocational Technical School District provides technical education in grades 9-12.
The principal services provided by the county are a hospital, a jail and house of correction and registries of deeds and
probate.
Education
The Town’s public school facilities include one elementary school, one middle school and one comprehensive high school.
The Town of East Bridgewater has a PK-3, 4-8, 9-12 grade plan system. As of October 1, 2012, the total enrollment was
2,250 students. On May 13, 2010, the East Bridgewater School Committee voted to reorganize the school district if and
when the school building project was approved by the Town. Upon completion of the model school building project, the
Town’s public school facilities will include a PK-grade 2 early childhood school, a grade 3-6 intermediate school and a
grade 7-12 Jr./Sr. high school.
Construction began in late summer 2011 with occupancy is slated for September 2013. However, the total construction of
the project is expected to be finished by summer 2014. The new building will have a capacity of 950 students in grades 7 to
12, inclusive.
2
The following sets forth the trend in public school enrollments.
PUBLIC SCHOOL ENROLLMENTS – OCTOBER 1,
Projected
Actual
2008
2009
2010
2011
Elementary(Pre K-3)
Middle School(4-8)
Senior High(9-12)
808
1,007
611
Total
2,426
2012
2013 (1)
789
1,020
565
791
959
566
788
946
550
756
937
557
564
733
924
2,374
2,316
2,284
2,250
2,221
_____________
(1) Beginning in 2013, elementary covers pre-kindergarten through grade 2, middle school covers grades 3 through
6, and senior high school covers grades 7 through 12.
The Town of East Bridgewater is also a member of the Southeastern Regional Vocational Technical School District. The
School had a total enrollment, as of October 1, 2012, of 1,342 students, of which 117 were from the Town of East
Bridgewater.
Industry and Commerce
East Bridgewater is a residential suburb of Boston, located within the Brockton Primary Metropolitan statistical area. In
2011, 293 Town establishments were reported to the Massachusetts Division of Employment Security. These firms had an
average weekly wage of approximately $695.
Industry
Construction
Manufacturing
Trade, Transportation & Utilities
Information
Financial Activities
Professional and Business Services
Education and Health Services
Leisure and Hospitality
Other Services
Total Employment
Number of Establishments
Average W eekly W ages
Total W ages
2007
2008
183
262
379
33
286
572
494
329
2,538
285
$589
$83,244,958
Calendar Year Average
2009
137
259
366
26
35
291
570
455
326
2,465
272
$612
$83,437,519
145
248
370
28
36
266
570
398
338
2,399
270
$624
$82,241,455
2010
173
271
441
31
245
567
398
355
2,481
285
$678
$91,788,787
2011
188
280
474
25
245
525
432
349
2,518
293
$695
$95,892,011
_____________
Source: Massachusetts Department of Education and Training. Data based upon place of employment, not place of
residence. Due to reclassification the U.S. Department of Labor now uses the North American Industry
Classification System (NAICS) as the basis for the assignment and tabulation of economic data by industry.
3
The following table sets forth the largest employers in East Bridgewater, exclusive of the Town itself.
LARGEST EMPLOYERS
Name
Approxi mate
No. of E mployees
i n E ast Bridge water
P roduct/Functio n
Compass Med ical
Ridde r Country Cl ub
Sa ch em S ki lled
Medical Se rvices
Country Cl ub/Function Ha ll
Nursing Ho me
216
147
119
_____________
SOURCE: Individual employers listed.
Labor Force, Employment and Unemployment
According to the Massachusetts Department of Employment and Training preliminary data in November 2012, the Town
had a total labor force of 7,492 of which 7,032 were employed and 460 or 6.1% were unemployed as compared to 6.6% for
the Commonwealth.
The following table sets forth the Town's average labor force and unemployment rates for calendar years 2007 through
2011 and also the unemployment rates for the Commonwealth of Massachusetts and the United States for the same
period.
UNEMPLOYMENT RATES
Massachusetts
U nemployment R ate
Tow n of East Bridgewater
Labor Force
Unem ploym ent Rate
Ye ar
2011
2010
2009
2008
2007
7,526
7,776
7,742
7,560
7,514
8.2 %
8.9
8.9
5.6
4.4
U nited States
U nemployment R ate
7.4 %
8.5
9.3
5.3
4.5
9.0 %
9.6
10.1
5.8
4.6
_____________
SOURCE: Massachusetts Department of Employment and Training, Federal Reserve Bank of Boston and U.S. Bureau of Labor
Statistics. Data based upon place of residence, not place of employment. Monthly data are unadjusted.
Building Permits
The following table sets forth the trend in the number of building permits issued and the estimated dollar value of new
construction and alterations. Permits are filed for both private as well as for Town projects.
N ew Co nst ruc t ion
Valu e
Y e ar
No.
2012
2011
2010
2009
2008
37
29
37
27
23
$
5,0 92, 701
3,6 01, 350
6,4 95, 900
4,4 15, 600
2,4 73, 275
A ddit ions /A lt erati ons
N o.
V a lue
116
110
207
169
116
$
4
2, 024, 064
5, 253, 352
2, 874, 624
2, 472, 519
2, 130, 683
Tot al
No.
153
139
244
196
139
V alue
$
7 ,116 ,76 5
8 ,854 ,70 2
9 ,370 ,52 4
6 ,888 ,11 9
4 ,603 ,95 8
Transportation and Utilities
The principal highways serving the Town are State Routes 18 and 106. The Town’s proximity to the City of Brockton
enables it to share the City’s access to State Routes 24, 3, 495 and Interstate 95. The Town is within commuting and
trucking distance to harbor, air and rail terminals in both Boston and Providence, Rhode Island.
Gas and telephone services are provided by established private utilities.
Income Levels and Population
The following table compares changes in Median Age, Median Family Income, and Per Capita Income for the Town, the
Commonwealth and the United States, according to the Federal Census.
East Bridg ewater
Median Age:
2010
2000
1990
Massachusetts
41.8
35.9
32.2
39.1
36.5
33.6
United States
37.2
35.3
32.9
Median Family Income:
2010
2000
1990
$98,113
67,307
47,458
$81,165
61,664
44,367
$51,144
50,046
35,225
Per Capita Inco me:
2010
2000
1990
$31,802
23,532
15,056
$33,966
25,952
17,224
$27,334
21,587
14,420
_____________
SOURCE: Federal Bureau of the Census.
On the basis of the 2010 Federal census, the Town has a population density of approximately 800 persons per square mile.
POPULATION TRENDS OF THE TOWN
2 01 0
1 3 ,7 9 4
2000
1990
1980
12,974
11,104
9 ,9 4 5
_____________
SOURCE: Federal Bureau of the Census.
5
PROPERTY TAXATION
The principal revenue source of the Town is the tax on real and personal property. The amount to be levied in each
year is the amount appropriated or required by law to be raised for municipal expenditures less estimated receipts
from other sources and less appropriations voted from funds on hand. The total amount levied is subject to certain
limits prescribed by law; for a description of those limits, see "Tax Limitations" below.
The estimated receipts for a fiscal year from sources other than the property tax may not exceed the actual receipts
during the preceding fiscal year from the same sources unless approved by the State Commissioner of Revenue.
Excepting special funds the use of which is otherwise provided for by law, the deduction for appropriations voted from
funds on hand for a fiscal year cannot exceed the "free cash" as of the beginning of the prior fiscal year as certified by
the State Director of Accounts plus up to nine months' collections and receipts on account of earlier years' taxes after
that date. Subject to certain adjustments, free cash is surplus revenue less uncollected overdue property taxes from
earlier years.
Although an allowance is made in the tax levy for abatements (see "Abatements and Overlay," below), no reserve is
generally provided for uncollectible real property taxes. Since some of the levy is inevitably not collected, this creates
a cash deficiency which may or may not be offset by other items (see "Taxation to Meet Deficits," below).
The table below sets forth the tax levy computation for the following fiscal years.
TAX LEVY COMPUTATION
Fiscal 2009
Total Appropriations(1)
Additions:
State and County Assessments
Overlay Reserve
Other Additions(2)
Total Additions
Gross Amount to be Raised
Deductions:
Local Estimated Receipts
State Aid(3)
Available Funds(4):
Free Cash
Other Available Funds
Total Deductions
Net Am ount to be Raised (Tax Levy)
$
$
40,078,500
Fiscal 2010
$
39,614,293
Fiscal 2011
$
38,941,639
Fiscal 2012
$
40,552,977
Fiscal 2013
$
43,052,343
224,366
533,641
415,017
1,173,024
41,251,524
270,781
498,615
649,202
1,418,598
41,032,891
260,576
461,136
378,072
1,099,784
40,041,422
315,953
359,090
3,196,378
3,871,421
44,424,398
334,424
551,864
169,113
1,055,401
44,107,743
5,489,661
13,766,116
5,459,804
12,932,728
4,870,192
12,296,114
5,728,136
12,285,133
5,122,646
12,497,181
1,556,444
1,256,318
22,068,540
19,182,984
1,076,200
1,566,196
21,034,928
19,997,963
705,820
1,416,032
19,288,157
20,753,265
891,550
1,577,757
20,482,576
23,941,821
553,800
1,254,585
19,428,212
24,679,532
$
$
$
$
_____________
(1)
(2)
(3)
(4)
Includes additional appropriations from taxation voted subsequent to adoption of the annual budget but prior to setting of the tax
rate.
Includes additional educational aid from the Commonwealth as part of the Educational Reform Act.
Estimated by the State Department of Revenue and required by law to be used in setting of the tax rate. Actual state aid payments
may vary upward or downward from said estimates, and the State may withhold payments pending receipt of State and County
assessments. The Governor reduced state local aid in fiscal 2009, 2010, 2011 and most recently for fiscal 2012. East
Bridgewater received $181,537 less in fiscal 2009 than when it set its tax rate and levy as shown above and $350,309 less
than the fiscal 2009 original estimate in fiscal 2010. In the past, the Town absorbed these cuts through the use of free cash,
budget cuts and the use of reserves. The Town closed the gap created by fiscal 2011 and 2012 cuts through budget
reductions and wage freezes.
Transfers from federal revenue sharing and other available funds, including "free cash", generally made as an offset to a particular
appropriation item.
6
Assessed Valuations and Tax Levies
Property is classified for the purpose of taxation according to its use. The legislature has in substance created three
classes of taxable property: (1) residential real property, (2) open space land, and (3) all other (commercial, industrial and
personal property). Within limits, cities and towns are given the option of determining the share of the annual levy to be
borne by each of the three categories. The share required to be borne by residential real property is at least 50 per cent of
its share of the total taxable valuation; the effective rate for open space must be at least 75 per cent of the effective rate for
residential real property; and the share of commercial, industrial and personal property must not exceed 175 percent of their
share of the total valuation. A city or town may also exempt up to 20 percent of the valuation of residential real property
(where used as the taxpayer’s principal residence) and up to 10 percent of the valuation of commercial real property (where
occupied by certain small businesses). Property may not be classified in a city or town until the State Commissioner of
Revenue certifies that all property in the city or town has been assessed at its fair cash value. Such certification must take
place every three years, or pursuant to a revised schedule as may be issued by the Commissioner.
Related statutes provide that certain forest land, agricultural or horticultural land (assessed at the value it has for these
purposes) and recreational land (assessed on the basis of its use at a maximum of 25 percent of its fair cash value) are all
to be taxed at the rate applicable to commercial property. Land classified as forest land is valued for this purpose at five
percent of fair cash value but not less than ten dollars per acre.
In order to determine appropriate relative values for the purposes of certain distributions to and assessments upon
cities and towns, the Commissioner of Revenue biennially makes a redetermination of the fair cash value of the
taxable property in each municipality. This is known as the "equalized value."
The local assessed valuation for East Bridgewater for fiscal year 2010 is believed to be representative of full and fair cash
values of property in the Town for that year based upon a revaluation completed for use in fiscal 2010.
The following table sets forth the trend in the Town’s assessed valuations, tax rates, tax levies, and tax levies per capita.
Fiscal
Year
2013
2012
2011
2010
2009
Personal
Property
Valuation
Total
Assessed
Valuation
Tax
Rate
Tax
Levy
$ 35,170,590
44,090,600
38,671,480
37,705,220
28,344,420
$ 1,552,171,830
1,531,786,400
1,571,026,880
1,615,344,350
1,662,303,660
$ 15.90
15.63
13.21
12.38
11.54
$ 24,679,532
23,941,821
20,753,265
19,997,963
19,182,984
Real Estate
Valuation
$ 1,517,001,240
1,487,695,800
1,532,355,400
(2)
1,577,639,130
1,633,959,240
Tax Levy
Per Capita (1)
$
1,789
1,736
1,505
1,541
1,479
_____________
(1) Based on 2010 Federal Census (13,754).
(2) Revaluation year.
Classification of Properties
The following is a breakdown of the Town’s assessed valuations in fiscal 2011, 2012 and 2013.
Fiscal 2011
Assessed
Valuation
Residential
Commercial
Industrial
Personal
Total Real Estate
$
$
1,398,579,695
89,867,205
43,908,500
38,671,480
1,571,026,880
Fiscal 2012
Assessed
Valuation
% of
Total
89.0 %
5.7
2.8
2.5
100.0 %
$
$
1,355,343,577
89,857,523
42,494,700
44,090,600
1,531,786,400
7
% of
Total
88.5 %
5.9
2.8
2.9
100.0 %
Fiscal 2013
Assessed
Valuation
$ 1,382,964,391
89,857,849
44,179,000
35,170,590
$ 1,552,171,830
% of
Total
89.1 %
5.8
2.8
2.3
100.0 %
LARGEST TAXPAYERS
The following table lists the ten largest taxpayers in the Town based upon assessed valuations for fiscal 2013.
Name
2013
Assessed
Valuation
Nature of Business
Equity Industrial Southeast
LIT-South Shore, LLC
Equity Industrial
Ridder, Jon & Richard
Ridder Farm Inc.
Diletzia Development
White Pines Village Inc.
W K Development
Ventas Realty Limited
Memorial Drive LLC
TOTAL
Compass Medical
Supermarket Distribution Center
Harte Hanks
Country Club & Golf Course
Real Estate Development
Shopping Center
Real Estate Development
Warehouse
Nursing Home
Apartments
$
$
12,272,300
12,228,400
7,768,800
4,134,560
3,076,790
4,360,300
3,004,400
3,566,000
2,393,900
2,443,900
55,249,350
State Equalized Valuation
In order to determine appropriate relative values for the purposes of certain distributions to and assessments upon cities
and towns, the Commissioner of Revenue biennially makes a redetermination of the fair cash value of the taxable property
in each municipality. This is known as the "equalized value". The following table sets forth the trend in equalized valuations
of the Town of East Bridgewater.
January 1,
State
Equalized Valuations
2012
2010
2008
2006
2004
$ 1,617,775,200
1,701,806,500
1,845,073,900
1,643,271,400
1,335,302,000
Percent
Increase
(0.05) %
(0.08)
0.12
0.23
0.38
Local assessed valuations are determined annually as of January 1 and used for the fiscal year beginning on the next July
1.
Abatements and Overlay
A city or town is authorized to increase each tax levy by an amount approved by the State Commissioner of Revenue
as an "overlay" to provide for tax abatements. If abatements are granted in excess of the applicable overlay, the
excess is required to be added to the next tax levy.
Abatements are granted where exempt real or personal property has been assessed or where taxable real or personal
property has been overvalued or disproportionately valued. The assessors may also abate uncollectible personal
property taxes. They may abate real and personal property taxes on broad grounds (including inability to pay) with the
approval of the State Commissioner of Revenue. But uncollected real property taxes are ordinarily not written off until
they become municipal "tax titles" by purchase at the public sale or by taking, at which time the tax is written off in full
by reserving the amount of the tax and charging surplus.
8
The table below sets forth the recent trend in the amount of the overlay reserve and actual abatements and refunds granted
as of June 30, 2012.
Fiscal
Year
Net Tax
Levy(1)
2012
2011
2010
2009
2008
$ 23,582,732
20,292,129
19,499,348
18,767,967
16,849,381
Cumulative
Abatements
Granted as of
June 30, 2012
Overlay Reserve
Dollar
As a % of
Amount
Net Levy
$
359,090
498,615
498,615
415,017
544,412
1.52 %
2.46
2.56
2.21
3.23
$
89,165
31,606
69,576
92,859
86,607
_____________
(1)
Net after deduction of overlay for abatements.
Tax Collections
The taxes for each fiscal year are due in four installments on August 1, November 1, February 1 and May 1. Under this
statute preliminary tax payments are to be due on August 1 and November 1 with payment of the actual tax bill (after credit
is given for the preliminary payments) in installments on February 1 and May 1 if the actual tax bills are mailed by
December 31. Interest accrues on delinquent taxes at the rate of 14 percent per annum.
The table below compares the Town's net tax collections with its net (gross tax levy less overlay reserve for abatements)
tax levies for the following fiscal years.
TAX COLLECTIONS
Fiscal
Year
Gross
Tax
Levy
Overlay
Reserve for
Abatements
Net
Tax
Levy
2012
2011
2010
2009
2008
$ 23,941,821
20,753,265
19,997,963
19,182,984
18,335,097
$ 359,090
461,136
498,615
415,017
544,412
$ 23,582,732
20,292,129
19,499,348
18,767,967
17,790,685
Collections During
Fiscal Year Payable(1)
Dollar
% of Net
Amount
Levy
$ 22,617,205
19,861,883
18,936,394
17,949,014
17,543,799
Collections as of
6/30/12 (1)
Dollar
% of Net
Amount
Levy
95.9 % $ 22,617,205
97.9
20,243,197
97.1
18,962,328
95.6
19,182,457
98.6
18,334,604
95.9 %
99.8
97.2
102.2
103.1
_____________
(1) Actual dollar collections net of refunds. Does not include abatements, proceeds of tax titles or tax possessions
attributable to each levy or other non-cash credits.
Tax Titles and Possessions
Real property (land and buildings) is subject to a lien for the taxes assessed upon it, subject to any paramount federal
lien and subject to bankruptcy and insolvency laws. (In addition, real property is subject to a lien for certain unpaid
municipal charges or fees.) If the property has been transferred, an unenforced lien expires on the fourth December
31 after the end of the fiscal year to which the tax relates. If the property has not been transferred by the fourth
December 31, an unenforced lien expires upon a later transfer of the property. Provision is made, however, for
continuation of the lien where it could not be enforced because of a legal impediment.
The persons against whom real or personal property taxes are assessed are personally liable for the tax (subject to
bankruptcy and insolvency laws). In the case of real property, this personal liability is effectively extinguished by sale
or taking of the property.
9
Massachusetts law permits a municipality either to sell by public sale (at which the municipality may become the
purchaser) or to take real property for nonpayment of taxes. In either case the property owner can redeem the
property by paying the unpaid taxes, with interest and other charges, but if the right of redemption is not exercised
within six months (which may be extended an additional year in the case of certain installment payments), it can be
foreclosed by petition to the Land Court. Upon foreclosure, a tax title purchased or taken by the municipality becomes
a "tax possession" and may be held and disposed of in the same manner as other land held for municipal purposes.
The table below sets forth the trend in the amount of tax titles and possessions outstanding at the end of the following fiscal
years.
Tax Titles and
Year
Possessions
2012
2011
2010
2009
2008
$ 3,189,780
3,205,711
2,739,198
2,192,695
2,413,264
Sale of Tax Receivables
Cities and towns are authorized to sell delinquent property tax receivables by public sale or auction, either individually
or in bulk. The Town does not expect to utilize this option at the present time.
Taxation to Meet Deficits
As noted elsewhere (see “Abatements and Overlay” above) overlay deficits, i.e. tax abatements in excess of the overlay
included in the tax levy to cover abatements, are required to be added to the next tax levy. It is generally understood that
revenue deficits, i.e. those resulting from non-property tax revenues being less than anticipated, are also required to be
added to the tax levy (at least to the extent not covered by surplus revenue).
Amounts lawfully expended since the prior tax levy and not included therein are also required to be included in the annual
tax levy. The circumstances under which this can arise are limited since municipal departments are generally prohibited
from incurring liabilities in excess of appropriations except for major disasters, mandated items, contracts in aid of housing
and renewal projects and other long-term contracts. In addition, utilities must be paid at established rates and certain
established salaries, e.g. civil service, must legally be paid for work actually performed, whether or not covered by
appropriations.
Cities and towns are authorized to appropriate sums, and thus to levy taxes, to cover deficits arising from other causes,
such as “free cash” deficits arising from a failure to collect taxes. This is not generally understood, however, and it has not
been the practice to levy taxes to cover free cash deficits. Except to the extent that such deficits have been reduced or
eliminated by subsequent collections of uncollected taxes (including sales of tax titles and tax possessions), lapsed
appropriations, non-property tax revenues in excess of estimates, other miscellaneous items or funding loans authorized by
special act, they remain in existence.
Tax Limitations
Chapter 59, Section 21C of the General Laws, also known as Proposition 2½, imposes two separate limits on the annual
tax levy of a city or town.
The primary limitation is that the tax levy cannot exceed 2½ percent of the full and fair cash value. If a city or town exceeds
the primary limitation, it must reduce its tax levy by at least 15 percent annually until it is in compliance, provided that the
reduction can be reduced in any year to not less than 7½ percent by majority vote of the voters, or to less than 7½ percent
by two-thirds vote of the voters.
For cities and towns at or below the primary limit, a secondary limitation is that the tax levy cannot exceed the maximum
levy limit for the preceding fiscal year as determined by the State Commissioner of Revenue by more than 2½ percent,
subject to exceptions for property added to the tax rolls or property which has had an increase, other than as part of a
general revaluation, in its assessed valuation over the prior year’s valuation.
This “growth” limit on the tax levy may be exceeded in any year by a majority vote of the voters, but an increase in the
secondary or growth limit under this procedure does not permit a tax levy in excess of the primary limitation, since the two
10
limitations apply independently. In addition, if the voters vote to approve taxes in excess of the “growth” limit for the purpose
of funding a stabilization fund, such increased amount may only be taken into account for purposes of calculating the
maximum levy limit in each subsequent year if the board of selectmen of a town or the city council of a city votes by a twothirds vote to appropriate such increased amount in such subsequent year to the stabilization fund.
The applicable tax limits may also be reduced in any year by a majority vote of the voters.
The State Commissioner of Revenue may adjust any tax limit “to counterbalance the effects of extraordinary, non-recurring
events which occurred during the base year”.
The statute further provides that the voters may exclude from the taxes subject to the tax limits and from the calculation of
the maximum tax levy (a) the amount required to pay debt service on bonds and notes issued before November 4, 1980, if
the exclusion is approved by a majority vote of the voters, and (b) the amount required to pay debt service on any specific
subsequent issue for which similar approval is obtained. Even with voter approval, the holders of the obligations for which
unlimited taxes may be assessed do not have a statutory priority or security interest in the portion of the tax levy attributable
to such obligations. It should be noted that Massachusetts General Laws Chapter 44, Section 20 requires that the taxes
excluded from the levy limit to pay debt service on any such bonds and notes be calculated based on the true interest cost
of the issue. Accordingly, the Department of Revenue limits the amount of taxes which may be levied in each year to pay
debt service on any such bonds and notes to the amount of such debt service, less a pro rata portion of any original issue
premium received by the city or town that was not applied to pay costs of issuance.
Voters may also exclude from the Proposition 2½ limits the amount required to pay specified capital outlay expenditures or
for the city or town’s apportioned share for certain capital outlay expenditures by a regional governmental unit. In addition,
the city council of a city, with the approval of the mayor if required, or the board of selectmen or the town council of a town
may vote to exclude from the Proposition 2½ limits taxes raised in lieu of sewer or water charges to pay debt service on
bonds or notes issued by the municipality (or by an independent authority, commission or district) for water or sewer
purposes, provided that the municipality’s sewer or water charges are reduced accordingly.
In addition, Proposition 2½ limits the annual increase in the total assessments on cities and towns by any county, district,
authority, the Commonwealth or any other governmental entity (except regional school districts, the MWRA and certain
districts for which special legislation provides otherwise) to the sum of (a) 2½ percent of the prior year’s assessments and
(b) “any increases in costs, charges or fees for services customarily provided locally or for services subscribed to at local
option”. Regional water districts, regional sewerage districts and regional veterans districts may exceed these limitations
under statutory procedures requiring a two-thirds vote of the district’s governing body and either approval of the local
appropriating authorities (by two-thirds vote in districts with more than two members or by majority vote in two-member
districts) or approval of the registered voters in a local election (in the case of two-member districts). Under Proposition 2½
any State law to take effect on or after January 1, 1981 imposing a direct service or cost obligation on a city or town will
become effective only if accepted or voluntarily funded by the city or town or if State funding is provided. Similarly, State
rules or regulations imposing additional costs on a city or town or laws granting or increasing local tax exemptions are to
take effect only if adequate State appropriations are provided. These statutory provisions do not apply to costs resulting
from judicial decisions.
The table below sets forth the Town's tax levy and levy limits for the following fiscal years.
TAX LEVY AND TAX LEVY LIMITS
Fiscal
Year
Estimated
Full
Valuation (1)
Primary
Levy Limit
Secondary
Levy Limit
Actual
Tax Levy
Under(over)
Primary
Levy Limit
2013
2012
2011
2010
2009
$ 1,552,171,830
1,531,786,400
1,571,026,880
1,615,344,350
1,662,303,660
$ 38,804,296
38,294,660
39,275,672
40,383,609
41,557,592
$ 24,689,572
23,949,434
20,768,437
20,010,862
19,202,593
$ 24,679,532
23,941,821
20,753,265
19,997,963
19,182,984
$ 14,124,764
14,352,839
18,522,407
20,385,646
22,374,608
Under(over)
Secondary
Levy Limit
$
10,040
7,613
15,172
12,899
19,609
_____________
(1) Local assessed valuations.
Pledged Taxes
Taxes on the increased value of certain property in designated development districts may be pledged for the payment of
costs of economic development projects within such districts and may therefore be unavailable for other municipal
purposes. See “Tax Increment Financing Development Districts” below.
11
Community Preservation Act
The Massachusetts Community Preservation Act (the “CPA”) permits cities and towns that accept its provisions to levy
a surcharge on its real property tax levy and to receive state matching funds for the acquisition, creation, preservation,
rehabilitation and restoration of open space, historic resources and affordable housing. The provisions of the CPA
must be accepted by the voters of the city or town at an election after such provisions have first been accepted by
either a vote of the legislative body of the city or town or an initiative petition signed by 5% of its registered voters.
A city or town may approve a surcharge of up to 3% of the real property tax levy, and it may accept one or more
exemptions to the surcharge under the CPA, including an exemption for low-income individuals and families and for
low and moderate-income senior citizens, an exemption for $100,000 of the value of each taxable parcel of residential
real property, and an exemption for commercial and industrial properties in cities and towns with classified tax rates.
The surcharge is not counted in the total taxes assessed for the purpose of determining the permitted levy amount
under Proposition 2½ (see “Tax Limitations” under “PROPERTY TAX” above). A city or town may revoke its
acceptance of the provisions of the CPA at any time after 5 years from the date of such acceptance and may change
the amount of the surcharge or the exemptions to the surcharge at any time, provided that any such revocation or
change must be approved pursuant to the same process as acceptance of the CPA.
Any city or town that accepts the provisions of the CPA will receive annual state matching grants to supplement
amounts raised by its surcharge on the real property tax levy. The state matching funds are raised from certain
recording and filing fees of the registers of deeds. Those amounts are deposited into a state trust fund and are
distributed to cities and towns that have accepted the provisions of the CPA, which distributions are not subject to
annual appropriation by the state legislature. The amount distributed to each city and town is based on a statutory
formula which requires that 80% of the amount in the state trust fund be used to match an equal percentage of the
amount raised locally by each city and town, and that the remaining 20% of the amount in the fund be distributed only
to those cities and towns that levy the maximum 3% surcharge based on a formula which takes into account equalized
property valuation and population, resulting in larger distributions to those communities with low valuations and small
populations. The total state distribution made to any city or town may not, however, exceed 100% of the amount
raised locally by the surcharge on the real property tax levy.
The amounts raised by the surcharge on real property taxes and received in state matching funds are required to be
deposited in a dedicated community preservation fund. Each city or town that accepts the provisions of the CPA is
required to establish a community preservation committee to study the community preservation needs of the
community and to make recommendations to the legislative body of the city or town regarding the community
preservation projects that should be funded from the community preservation fund. Upon the recommendations of the
committee, the legislative body of the city or town may appropriate amounts from the fund for permitted community
preservation purposes or may reserve amounts for spending in future fiscal years, provided that at least 10% of the
total annual revenues to the fund must be spent or set aside for open space purposes, 10% for historic resource
purposes and 10% for affordable housing purposes.
The CPA authorizes cities and towns that accept its provisions to issue bonds and notes in anticipation of the receipt
of surcharge revenues to finance community preservation projects approved under the provisions of the CPA. Bonds
and notes issued under the CPA are general obligations of the city or town and are payable from amounts on deposit
in the community preservation fund. In the event that a city or town revokes its acceptance of the provisions of the
CPA, the surcharge shall remain in effect until all contractual obligations incurred by the city or town prior to such
revocation, including the payment of bonds or notes issued under the CPA, have been fully discharged.
The Town has not adopted the Community Preservation Act.
12
TOWN FINANCES
Budget and Appropriation Process
The annual appropriations of a town are ordinarily made at the annual meeting which takes place in February, March, April,
May or June. Appropriations may also be voted at special meetings. Every town must have an appropriation, advisory or
finance committee. The committee (or the board of selectmen if authorized by by-law) is required to submit a budget of
proposed expenditures at the annual town meeting.
A town meeting may at any time vote to transfer any amount previously appropriated to any other authorized use by
law, and, under certain circumstances and subject to certain limits and requirements, the selectmen of a town, with the
concurrence of the finance committee, may transfer amounts appropriated for the use of any department to any other
appropriation for the same department or to any other department.
Water and sewer department expenditures are generally included in the budgets adopted by city councils and town
meetings but electric and gas department funds may be appropriated by the municipal light boards. Under certain
legislation any city or town which accepts the legislation may provide that the appropriation for the operating costs of any
department may be offset, in whole or in part, by estimated receipts from fees charged for services provided by the
department. It is assumed that this general provision does not alter the pre-existing power of an electric or gas department
to appropriate its own receipts.
The school budget is limited to the total amount appropriated by the city council or town meeting, but the school committee
retains full power to allocate the funds appropriated. See “Revenues-“State Distributions” below.)
State and county assessments, abatements in excess of overlays, principal and interest not otherwise provided for, and
final judgments are included in the tax levy whether or not included in the budget. Revenues are not required to be set forth
in the budget but estimated non-tax revenues are taken into account by the assessors in fixing the tax levy. (See “Property
Taxation” above.)
Budget Trends
The following table sets forth the trend in operating budgets as voted at the annual town meeting. As such, said budgets
reflect neither revenues nor state and county assessments nor other mandatory items. Also said budgets do not reflect
expenditures authorized for non-recurring purposes under "special" warrant articles or transfers occurring subsequent to
the annual town meeting.
BUDGET COMPARISON
Fiscal 2009
Fiscal 2010
Fiscal 2011
Fiscal 2012
Fiscal 2013
General Government
$ 9,092,150
Public Safety
4,167,269
Education
17,775,350
Public Works
3,274,001
Human Services
1,341,044
Culture and Recreation
440,826
Debt Service
2,859,425
$ 9,481,996
4,236,614
17,967,781
3,369,930
1,282,431
427,901
2,094,756
$ 9,824,595
4,180,168
17,687,598
2,981,264
1,245,141
417,697
2,044,262
$ 10,189,999
4,118,439
17,655,752
3,286,715
1,303,736
413,707
2,084,684
$ 9,992,453
4,417,631
18,282,711
3,316,081
1,215,327
418,983
4,417,244
Total
$ 38,861,409
$ 38,380,725
$ 39,053,032
$ 42,060,430
$ 38,950,065
Revenues
Property Taxes: Property taxes are the major source of revenue for the Town. The total amount levied is subject to certain
limits prescribed by law; for a description of those limits see "PROPERTY TAXATION--Property Tax Limitation" above.
State Distributions: In addition to grants for specified capital purposes (some of which are payable over the life of
bonds issued for the projects), the Commonwealth provides financial assistance to cities and towns for current
purposes. Payments to cities and towns are derived primarily from a percentage of the State's personal income, sales
13
and use, and corporate excise tax receipts, together with the net receipts from the State Lottery. A municipality's state
aid entitlement is based on a number of different formulas, of which the "schools" and "lottery" formulas are most
important. Both of the major formulas tend to provide more state aid to poorer communities. The formulas for
determining a municipality’s state aid entitlement are subject to amendment by the state legislature and, while a
formula might indicate that a particular amount of state aid is owed, the amount of state aid actually paid is limited to
the amount appropriated by the state legislature. The state annually estimates state aid, but the actual state aid
payments may vary from the estimate.
In the fall of 1986, both the state legislature (by statute repealed as of July 1, 1999) and the voters (by initiative
petition) placed limits on the growth of state tax revenues. Although somewhat different in detail, each measure
essentially limited the annual growth in state tax revenues to an average rate of growth in wages and salaries in the
Commonwealth over the three previous calendar years. If not amended, the remaining law could restrict the amount of
state revenues available for state aid to local communities.
Motor Vehicle Excise: An excise is imposed on the registration of motor vehicles (subject to exemptions) at a uniform rate
of $25 per $1,000 of valuation. The excise is collected by and for the benefit of the municipality in which the motor vehicle is
customarily kept. Valuations are determined by a statutory formula based on manufacturer's list price and year of
manufacture. Bills not paid when due bear interest at 12 per cent per annum. Provision is also made for the non-renewal
of registration and operating license by the registrar of motor vehicles.
Water Rates and Services. In fiscal 2009, the Town established an enterprise fund for water services to approximately
95% of the industrial, commercial and residential users within the Town charging them on the basis of metered
consumption.
Trash Fees. In fiscal 2000, the Town established an enterprise fund for the collection and disposal of rubbish and
recyclable materials. Fees are charged on a pay-as-you-throw basis.
Massachusetts School Building Assistance Program: Under its school building assistance program, the
Commonwealth of Massachusetts provides grants to cities, towns and regional school districts for school construction
projects. Until July 26, 2004, the State Board of Education was responsible for approving grants for school projects
and otherwise administering the program. Grant amounts ranged from 50% to 90% of approved project costs.
Municipalities generally issued bonds to finance the entire project cost, and the Commonwealth disbursed the grants
in equal annual installments over the term of the related bonds.
Pursuant to legislation which became effective on July 26, 2004, the state legislature created the Massachusetts
School Building Authority (the “Authority”) to finance and administer the school building assistance program. The
Authority has assumed all powers and obligations of the Board of Education with respect to the program. In addition to
certain other amounts, the legislation dedicates a portion of Commonwealth sales tax receipts to the Authority to
finance the program.
Projects previously approved for grants by the State Board of Education are entitled to receive grant payments from
the Authority based on the approved project cost and reimbursement rate applicable under the prior law. The
Authority has paid and is expected to continue to pay the remaining amounts of the grants for such projects either in
annual installments to reimburse debt service on bonds issued by the municipalities to finance such projects, or as
lump sum payments to contribute to the defeasance of such bonds.
Projects on the priority waiting list as of July 1, 2004 are also entitled to receive grant payments from the Authority
based on the eligible project costs and reimbursement rates applicable under the prior law. With limited exceptions,
the Authority is required to fund the grants for such projects in the order in which they appear on the waiting list.
Grants for any such projects that have been completed or substantially completed have been paid and are expected to
continue to be paid by the Authority in lump sum payments, thereby eliminating the need for the Authority to reimburse
interest expenses that would otherwise be incurred by the municipalities to permanently finance the Authority’s share
of such project costs. Interest on debt issued by municipalities prior to July 1, 2004 to finance such project costs, and
interest on temporary debt until receipt of the grant, is included in the approved costs of such projects. Grants for any
such projects that have not yet commenced or that are underway have been and are expected to continue to be paid
by the Authority as project costs are incurred by the municipality pursuant to a project funding agreement between the
Authority and the municipality, eliminating the need for the municipality to borrow even on a temporary basis to finance
the Authority’s share of the project costs in most cases.
14
The range of reimbursement rates for new project grant applications submitted to the Authority on or after July 1, 2007
has been reduced to between 40% and 80% of approved project costs. The Authority promulgated new regulations
with respect to the application and approval process for projects submitted after July 1, 2007. The Authority expects to
pay grants for such projects as project costs are incurred pursuant to project funding agreements between the
Authority and the municipalities. None of the interest expense incurred on debt issued by municipalities to finance
their portion of the costs of new projects will be included in the approved project costs eligible for reimbursement.
Summary of Significant Accounting Policies
See attached audit.
Annual Audits
The Town’s fiscal 2011 audit was prepared by Thevenin, Lynch, Bienvenue, LLP, Certified Public Accountants, a copy of
which is attached hereto as Appendix A. Prior audits are available upon request from First Southwest Company.
The attached report speaks only as of its date, and only to the matters expressly set forth therein. The auditors have
not been engaged to review this Annual Report or to perform audit procedures regarding the post-audit period, nor
have the auditors been requested to give their consent to the inclusion of their report in Appendix A. Except as stated
in their report, the auditors have not been engaged to verify the financial information set out in Appendix A and are not
passing upon and do not assume responsibility for the sufficiency, accuracy or completeness of the financial
information presented in that appendix.
Financial Statements
Set forth on the following pages are Governmental Funds Balance Sheet for fiscal years ended June 30, 2012 (draft), June
20, 2011, June 30, 2010 and June 30, 2009, and Statements of Revenues and Expenditures, Changes in Fund Balance –
General Fund for fiscal years ended June 30, 2012 (draft), June 30, 2011, June 30, 2010, June 30, 2009, June 30, 2008,
and June 30, 2007. The financial statements were extracted from annual audits and combined for purposes of this
presentation, with the exception of fiscal 2012 which are from draft financials and are subject to change.
15
Town of East Bridgewater, Massachusetts
Balance Sheet - Governmental Funds
June 30, 2012 (1)
High School
Septic Loan
Buliding
Repayment
General Fund
Project
Fund
ASSETS
Cash and cash equivalents
Investments
Receivables
Due from other funds
Total Assets
LIABILITIES
Accounts payable, wages and
other current liabilities
Provision for refund of paid taxes
Deferred revenue
Notes payable
Total Liabilities
$
4,743,065
2,306,626
6,442,316
16,724
$ 13,508,731
$
$
$
708,397
241,091
6,262,371
7,211,859
$
7,950,617
10,097,083
4,376,802
22,424,502
$
983,258
4,376,802
5,360,060
$
FUND BALANCES
Nonspendable
Restricted
1,525,977
17,064,442
Committed
1,130,344
Assigned
48,859
Unassigned
3,591,692
Total fund balances
6,296,872
17,064,442
Total liabilities and fund balances
$ 13,508,731 $ 22,424,502
____________________
(1) Extracted from Town's Draft Financial Statements, subject to change.
16
$
$
Nonmajor
Governmental
Funds
Total
Governmental
Funds
2,112,385
1,583,501
3,695,886
$ 2,037,616
2,249,843
438,281
$ 4,725,740
$ 16,843,683
14,653,552
12,840,900
16,724
$ 44,354,859
1,583,501
800,000
2,383,501
$
$
1,312,385
1,312,385
3,695,886
96,271
96,271
3,060,321
22,963,125
899,941
2,030,285
48,859
(85,069)
3,506,623
3,971,464
28,645,163
$ 4,725,740 $ 44,354,859
315,995
438,281
754,276
2,007,650
241,091
12,660,955
800,000
15,709,696
Town of East Bridgewater, Massachusetts
Balance Sheet - Governmental Funds
June 30, 2011 (1)
High School
Buliding
General Fund
Project
ASSETS
Cash and cash equivalents
Investments
Receivables
Due from other funds
Total Assets
LIABILITIES
Accounts payable, wages and
other current liabilities
Provision for refund of paid taxes
Deferred revenue
Notes payable
Total Liabilities
$
$
$
2,757,511
3,693,278
6,772,734
37,906
13,261,429
$
863,118
39,407
6,687,538
7,590,063
$
FUND BALANCES
Nonspendable
Restricted
1,819,838
Committed
1,164,240
Assigned
79,750
Unassigned
2,607,538
Total fund balances
5,671,366
Total liabilities and fund balances
$ 13,261,429
____________________
(1) Extracted from Town's audited Financial Statements.
17
$
$
Nonmajor
Governmental
Funds
Total
Governmental
Funds
29,416,937
1,144,569
30,561,506
$
6,558,696
1,627,334
2,092,459
$ 10,278,489
$
1,144,569
800,000
1,944,569
$
$
1,153,191
39,407
9,924,566
1,600,000
12,717,164
96,271
6,254,513
1,042,557
(297,384)
7,095,957
$ 10,278,489 $
96,271
36,691,288
2,206,797
79,750
2,310,154
41,384,260
54,101,424
28,616,937
28,616,937
30,561,506
290,073
2,092,459
800,000
3,182,532
$
38,733,144
5,320,612
10,009,762
37,906
54,101,424
Town of East Bridgewater, Massachusetts
Balance Sheet - Governmental Funds
June 30, 2010 (1)
General
ASSETS
Cash and cash equivalents
Investments
Receivables
Due from other funds
Total Assets
LIABILITIES
Accounts payable, wages and
other current liabilities
Provision for refund of paid taxes
Deferred revenue
Notes payable
Total Liabilities
$
$
$
FUND BALANCES
Reserved for:
Encumbrances and continued appropriations
Unreserved
General Fund
Special revenue funds
Capital projects funds
Permanent funds
Total fund balances
Total liabilities and fund balances
$
____________________
(1) Extracted from Town's audited Financial Statements.
Total
Governmental
Funds
1,582,236
1,872,900
3,455,136
$ 1,364,126
1,227,643
538,328
$ 3,130,097
$
1,872,900
400,000
2,272,900
$
$
Septic Loan
Repayments
Stabilization
235,860
2,678,162
6,882,221
27,071
9,823,314
$
2,707,291
$ 2,707,291
$
879,114
154,056
6,649,514
7,682,684
$
$
-
Nonmajor
Governmental
Funds
$
473,282
-
-
1,667,348
2,140,630
9,823,314
2,707,291
2,707,291
$ 2,707,291
1,182,236
1,182,236
3,455,136
$
102,118
538,328
1,081,000
1,721,446
-
3,182,222
6,613,096
9,293,449
27,071
$ 19,115,838
981,232
154,056
9,060,742
1,481,000
11,677,030
473,282
1,667,348
2,556,155
6,445,682
(1,338,031)
(1,338,031)
190,527
190,527
1,408,651
7,438,808
$ 3,130,097 $ 19,115,838
Town of East Bridgewater, Massachusetts
Balance Sheet - Governmental Funds
June 30, 2009 (1)
General
ASSETS
Cash and cash equivalents
Investments
Receivables
Due from other funds
Total Assets
LIABILITIES
Accounts payable, wages, and other current liabilities
Provision for refund of paid taxes
Deferred revenue
Notes payable
Total Liabilities
FUND BALANCES
Reserved for:
Encumbrances and continued appropriations
Unreserved:
General fund
Special revenue funds
Capital project funds
Permanent fund
Total fund balances
Total liabilities and fund balances
Septic Loan
Repayments
Stabilization
$
1,149,592
2,668,639
7,370,262
46,523
$ 11,235,016
2,602,381
$ 2,602,381
$
$
$
$
1,263,405
409,871
7,313,546
8,986,822
$
-
$
-
1,543,923
1,594,655
3,138,578
1,594,655
200,000
1,794,655
Nonmajor
Governmental
Fund
Total
Governmental
Funds
$
$
$
$
1,871,406
825,993
1,308,127
4,005,526
278,340
1,308,127
1,231,000
2,817,467
$
$
4,564,921
6,097,013
10,273,044
46,523
20,981,501
1,541,745
409,871
10,216,328
1,431,000
13,598,944
679,658
-
-
-
679,658
1,568,536
2,248,194
$ 11,235,016
2,602,381
2,602,381
$ 2,602,381
1,343,923
1,343,923
3,138,578
1,781,723
(821,875)
228,211
1,188,059
4,005,526
1,568,536
5,728,027
(821,875)
228,211
7,382,557
20,981,501
___________________
(1) Extracted from Town's audited Financial Statements.
19
$
$
$
TOWN OF EAST BRIDGEWATER, MASSACHUSETTS
STATEMENT OF REVENUES, EXPENDITURES, AND CHANGES IN FUND BALANCES - GOVERNMENTAL FUNDS
FOR THE YEAR ENDED JUNE 30, 2012 (1)
High School
Building
Project
General
Septic Loan
Repayment
Fund
Other
Governmental
Funds
Total
Governmental
Funds
REVENUES:
Property Taxes
Excise Taxes
Licenses and Permits
Penalties and Interest
Investment Income
Charges for Services
Fees and Fines
Departmental and Other
Intergovernmental
Total Revenues
$ 23,493,073
1,414,175
203,474
241,892
231,245
162,354
247,118
16,971,215
42,964,546
$
9,868,908
9,868,908
$
386,683
386,683
$
82,217
1,999,961
5,802
483,737
2,000,385
4,572,102
$ 23,493,073
1,414,175
203,474
241,892
313,462
2,386,644
168,156
730,855
28,840,508
57,792,239
EXPENDITURES:
Current:
General Government
Public Safety
Education
Public Works
Human Services
Culture and Recreation
State and County Assessments
Debt Service:
Principal
Interest and other charges
Total Expenditures
Revenues over (under) expenditures
Other Financing Sources (Uses):
Proceeds from long-term debt
Transfers in from other Funds
Transfers out to other Funds
Total other financing sources (uses)
Revenues and other financing sources over
(under) expenditures and other financing uses
Fund Balance (Beginning of Year, Restated)
Fund Balance (End of Year)
13,905,733
4,172,268
17,974,002
1,130,861
385,526
439,943
312,649
21,421,403
-
157,384
191,055
2,872,989
217,115
2,709,790
49,571
-
14,063,117
4,363,323
42,268,394
1,347,976
3,228,199
489,514
312,649
21,421,403
132,883
152,045
284,928
2,718,433
1,787,686
42,827,101
6,197,904
2,870,478
1,787,686
70,731,336
137,445
(11,552,495)
101,755
(1,625,802)
(12,939,097)
1,082,611
(594,550)
488,061
-
200,000
200,000
407,050
(895,111)
(488,061)
200,000
1,489,661
(1,489,661)
200,000
625,506
(11,552,495)
301,755
(2,113,863)
(12,739,097)
5,671,366
28,616,937
1,010,630
6,085,327
41,384,260
$ 6,296,872
$ 17,064,442
$ 1,312,385
3,971,464
$ 28,645,163
(1) Extracted from draft financial statements of the Town, subject to change.
20
$
TOWN OF EAST BRIDGEWATER, MASSACHUSETTS
STATEMENT OF REVENUES, EXPENDITURES, AND CHANGES IN FUND BALANCES - GOVERNMENTAL FUNDS
FOR THE YEAR ENDED JUNE 30, 2011 (1)
High School
Building
Project
General
Other
Governmental
Funds
Total
Governmental
Funds
REVENUES:
Property Taxes
Excise Taxes
Licenses and Permits
Penalties and Interest
Investment Income
Charges for Services
Fees and Fines
Departmental and Other
Intergovernmental
Total Revenues
$ 20,246,277
1,327,708
197,435
209,597
111,830
174,104
204,436
16,873,337
39,344,724
$
360,488
360,488
$
34,756
2,311,214
9,258
204,340
2,376,025
4,935,593
$ 20,246,277
1,327,708
197,435
209,597
146,586
2,311,214
183,362
408,776
19,609,850
44,640,805
EXPENDITURES:
Current:
General Government
Public Safety
Education
Public Works
Human Services
Culture and Recreation
State and County Assessments
Debt Service:
Principal
Interest and other charges
Total Expenditures
13,695,084
4,211,525
17,958,471
1,518,303
420,165
419,029
304,836
2,243,551
-
460,418
185,990
3,211,115
359,354
883,660
46,944
-
14,155,502
4,397,515
23,413,137
1,877,657
1,303,825
465,973
304,836
1,497,657
373,150
40,398,220
2,243,551
151,832
5,299,313
1,649,489
373,150
47,941,084
Revenues over (under) expenditures
(1,053,496)
(1,883,063)
(363,720)
(3,300,279)
Other Financing Sources (Uses):
Proceeds from long-term debt
Proceeds from bond premiums
Transfers in from other Funds
Transfers out to other Funds
Total other financing sources (uses)
1,819,838
832,329
(775,226)
1,876,941
30,500,000
30,500,000
4,919,000
400,226
(450,436)
4,868,790
35,419,000
1,819,838
1,232,555
(1,225,662)
37,245,731
823,445
28,616,937
4,505,070
33,945,452
2,590,887
7,438,808
7,095,957
$ 41,384,260
Revenues and other financing sources over
(under) expenditures and other financing uses
Fund Balance (Beginning of Year, Restated)
Fund Balance (End of Year)
4,847,921
$ 5,671,366
(1) Extracted from audited financial statements of the Town.
21
$ 28,616,937
$
TOWN OF EAST BRIDGEWATER, MASSACHUSETTS
STATEMENT OF REVENUES, EXPENDITURES, AND CHANGES IN FUND BALANCES - GOVERNMENTAL FUNDS
FOR THE YEAR ENDED JUNE 30, 2010 (1)
General
Stabilization
Septic Loan
Repayments
Other
Governmental
Funds
Total
Governmental
Funds
$
$
67,251
1,787,525
8,656
91,085
2,322,429
4,276,946
$ 20,168,392
1,328,640
207,600
274,563
194,347
2,057,068
127,886
369,949
19,656,164
44,384,609
REVENUES:
Property Taxes
Excise Taxes
Licenses and Permits
Penalties and Interest
Investment Income
Charges for Services
Fees and Fines
Departmental and Other
Intergovernmental
Total Revenues
$ 20,168,392
1,328,640
207,600
274,563
22,186
119,230
278,864
17,333,735
39,733,210
$
104,910
104,910
269,543
269,543
EXPENDITURES:
Current:
General Government
Public Safety
Education
Public Works
Human Services
Culture and Recreation
State and County Assessments
Debt Service:
Principal
Interest and other charges
Total Expenditures
13,222,817
4,351,055
18,080,046
1,463,914
564,318
440,343
269,515
-
279,161
-
114,365
181,233
2,409,454
733,513
45,766
53,808
-
13,337,182
4,532,288
20,489,500
2,197,427
889,245
494,151
269,515
1,480,041
486,940
40,358,989
-
152,069
431,230
3,538,139
1,632,110
486,940
44,328,358
Revenues over (under) expenditures
(625,779)
104,910
(161,687)
738,807
56,251
Other Financing Sources (Uses):
Transfers in from other Funds
Transfers out to other Funds
Total other financing sources (uses)
721,384
(203,169)
518,215
-
-
203,169
(721,384)
(518,215)
924,553
(924,553)
-
Revenues and other financing sources over
(under) expenditures and other financing uses
(107,564)
104,910
(161,687)
220,592
56,251
2,248,194
2,602,381
1,343,923
1,188,059
7,382,557
2,707,291
$ 1,182,236
Fund Balance (Beginning of Year)
Fund Balance (End of Year)
$ 2,140,630
$
(1) Extracted from audited financial statements of the Town.
22
$
1,408,651
$
7,438,808
TOWN OF EAST BRIDGEWATER, MASSACHUSETTS
STATEMENT OF REVENUES, EXPENDITURES, AND CHANGES IN FUND BALANCES - GOVERNMENTAL FUNDS
FOR THE YEAR ENDED JUNE 30, 2009 (1)
General
Stabilization
Septic Loan
Repayments
Non-major
Governmental
Funds
Total
Governmental
Funds
REVENUES:
Property Taxes
Excise Taxes
Licenses and Permits
Penalties and Interest
Investment Income
Charges for Services
Fees and Fines
Departmental and Other
Intergovernmental
Total Revenues
$ 19,028,948
1,377,785
196,307
172,112
131,834
125,434
510,771
16,301,738
37,844,929
$
34,899
34,899
$
390,000
390,000
$
61,176
1,553,552
10,943
120,999
2,776,235
4,522,905
$ 19,028,948
1,377,785
196,307
172,112
227,909
1,943,552
136,377
631,770
19,077,973
42,792,733
$ 11,150,337
4,388,750
18,182,861
1,735,861
345,532
464,954
268,213
$
-
$
213,968
-
$
66,564
962,211
3,516,915
796,721
41,318
121,711
-
$ 11,216,901
5,350,961
21,699,776
2,532,582
600,818
586,665
268,213
EXPENDITURES:
Current:
General Government
Public Safety
Education
Public Works
Human Services
Culture and Recreation
State and County Assessments
Debt Service:
Principal
Interest and other charges
Total Expenditures
1,525,330
494,395
38,556,233
-
152,069
366,037
5,505,440
1,677,399
494,395
44,427,710
Revenues over (under) expenditures
(711,304)
34,899
23,963
(982,535)
(1,634,977)
Other Financing Sources (Uses):
Transfers in from other Funds
Transfers out to other Funds
Total other financing sources (uses)
402,875
(739,000)
(336,125)
-
(80,094)
(80,094)
739,000
(372,013)
366,987
1,141,875
(1,191,107)
(49,232)
Revenues and other financing sources over
(under) expenditures and other financing uses
(1,047,429)
34,899
(56,131)
(615,548)
(1,684,209)
Fund Balance (Beginning of Year)
3,295,623
2,567,482
1,400,054
1,803,607
9,066,766
2,602,381
$ 1,343,923
Fund Balance (End of Year)
$ 2,248,194
$
(1) Extracted from audited financial statements of the Town.
23
$
1,188,059
$
7,382,557
TOWN OF EAST BRIDGEWATER, MASSACHUSETTS
STATEMENT OF REVENUES, EXPENDITURES, AND CHANGES IN FUND BALANCES - GOVERNMENTAL FUNDS
FOR THE YEAR ENDED JUNE 30, 2008 (1)
General
Stabilization
Septic Loan
Repayments
Non-major
Governmental
Funds
Total
Governmental
Funds
$
$
37,433
1,481,405
9,012
109,331
1,724,966
3,362,147
$ 18,215,743
1,485,034
240,468
163,029
428,373
1,670,366
172,259
365,127
18,514,467
$ 41,254,866
REVENUES:
Property Taxes
Excise Taxes
Licenses and Permits
Penalties and Interest
Investment Income
Charges for Services
Fees and Fines
Departmental and Other
Intergovernmental
Total Revenues
$ 18,215,743
1,485,034
240,468
163,029
297,611
163,247
255,796
16,789,501
$ 37,610,429
$
$
93,329
93,329
188,961
$ 188,961
$
$
$
EXPENDITURES:
Current:
General Government
Public Safety
Education
Public Works
Human Services
Culture and Recreation
State and County Assessments
Debt Service
Principal
Interest and other charges
Total Expenditures
$ 11,037,678
4,147,711
17,849,575
1,557,746
334,925
439,581
221,502
$
1,604,021
546,808
37,739,547
-
-
-
-
51,440
190,657
2,128,218
862,059
198,949
31,263
-
$ 11,089,118
4,338,368
19,977,793
2,419,805
533,874
470,844
221,502
-
-
2,972
3,465,558
1,604,021
549,780
41,205,105
Revenues over (under) expenditures
(129,118)
93,329
188,961
(103,411)
49,761
Other Financing Sources (Uses):
Issuance of Long Term Debt
Transfers in from other Funds
Transfers out to other Funds
Total other financing sources (uses)
648,286
(501,563)
146,723
500,000
500,000
(112,068)
(112,068)
1,175,000
62,048
(576,094)
660,954
1,175,000
1,210,334
(1,189,725)
1,195,609
17,605
593,329
76,893
557,543
1,245,370
3,278,018
1,974,153
944,614
1,624,611
7,821,396
2,567,482
$ 1,021,507
Revenues and other financing sources over
(under) expenditures and other financing uses
Fund Balance (Beginning of Year)
Fund Balance (End of Year)
$ 3,295,623
$
(1) Extracted from audited financial statements of the Town.
24
$
2,182,154
$
9,066,766
TOWN OF EAST BRIDGEWATER, MASSACHUSETTS
STATEMENT OF REVENUES, EXPENDITURES, AND CHANGES IN FUND BALANCES - GOVERNMENTAL FUNDS
FOR THE YEAR ENDED JUNE 30, 2007 (1)
General
Non-major
Governmental
Funds
Stabilization
Total
Governmental
Funds
REVENUES:
Property Taxes
Excise Taxes
Licenses and Permits
Penalties and Interest
Investment Income
Charges for Services
Fines and Fees
Departmental and Other
Intergovernmental
Total Revenues
$ 17,041,227
1,425,589
323,672
139,828
417,496
187,546
192,220
15,410,479
$ 35,138,057
$
$
$
$
74,153
74,153
$
53,531
1,818,113
74,190
2,021,292
3,967,126
$
152,966
208,429
2,953,245
507,754
624,318
43,532
-
$
-
-
$
-
4,490,244
1,184,682
577,208
39,207,703
$
$
17,041,227
1,425,589
323,672
139,828
545,180
1,818,113
187,546
266,410
17,431,771
39,179,336
EXPENDITURES:
Current:
General Government
Public Safety
Education
Public Works
Human Services
Culture and Recreation
State and County Assessments
Debt Service
Principal
Interest and other charges
Total Expenditures
9,693,903
3,897,138
16,998,896
1,181,612
324,476
638,747
220,797
1,184,682
577,208
34,717,459
Revenues over (under) expenditures
Other Financing Sources (Uses):
Issuance of Long Term Debt
Transfers in from other Funds
Transfers out to other Funds
Total other financing sources (uses)
420,598
74,153
(523,118)
(28,367)
680,871
(1,189,483)
(508,612)
958,804
958,804
2,563,000
1,000
(576,192)
1,987,808
2,563,000
1,640,675
(1,765,675)
2,438,000
(88,014)
1,032,957
1,464,690
2,409,633
3,366,032
941,196
1,104,537
5,411,765
Revenues and other financing sources over
(under) expenditures and other financing uses
Fund Balance (Beginning of Year)
Fund Balance (End of Year)
$
9,846,869
4,105,567
19,952,141
1,689,366
948,794
682,279
220,797
3,278,018
(1) Extracted from audited financial statements of the Town.
25
$
1,974,153
$
2,569,227
$
7,821,398
Free Cash and Fund Balance
Under Massachusetts law an amount known as "free cash" is certified as of the beginning of each fiscal year by the State
Bureau of Accounts and this, together with certain subsequent tax receipts, is used as the basis for subsequent
appropriations from available funds, which are not required to be included in the annual tax levy.
The table below sets forth the trend in General Fund Equity (GAAP), Undesignated Fund Balance (GAAP), and Free
Cash as certified by the State Bureau of Accounts.
GAAP
Year
General
Fund
Balance
(June 30)
2012
2011
2010
2009
2008
$ 2,447,700
1,394,226
2,140,630
2,248,194
3,295,623
Unreserved
General Fund
Balance
(June 30)
$
600,000
596,418
1,667,348
1,568,536
2,836,618
Free
Cash
(July 1)
$ 1,099,444
556,327
892,202
729,691
1,080,479
Stabilization Fund
The Town maintains a stabilization fund that is accounted for in the Trust Funds. Funded by an appropriation, the
Stabilization Fund plus interest income may be appropriated at an annual or special town meeting for any project.
Stabilization
Fund
Balance
As of
June 30,
2012
2011
2010
2009
2008
$ 2,303,877
2,412,390
2,732,694 (1)
2,646,191
2,570,552
_____________
(1) Of which, the Town appropriated an aggregate of $375,000 for fiscal 2011.
Capital Stabilization Fund
The Town also maintains a Capital Stabilization Fund. The balance of this fund at June 30, 2011 was $1,441,715. The
balance of this fund at June 30, 2012 was $1,711,352.
Investment of Town Funds
Investments of funds of cities and towns, except for trust funds, are generally restricted by Massachusetts General Laws
Chapter 44, §55. That statute permits investments of available revenue funds and bond and note proceeds in term
deposits and certificates of deposits of banks and trust companies, in obligations issued or unconditionally guaranteed by
the federal government or an agency thereof with a maturity of not more than one year, in repurchase agreements with a
maturity of not more than 90 days secured by federal or federal agency securities, in participation units in the
Massachusetts Municipal Depository Trust (“MMDT”), or in shares in SEC-registered money market funds with the highest
possible rating from at least one nationally recognized rating organization.
MMDT is an investment pool created by the Commonwealth. The State Treasurer is the sole trustee, and the funds are
managed under contract by an investment firm under the supervision of the State Treasurer’s office. According to the State
Treasurer the Trust’s investment policy is designed to maintain an average weighted maturity of 90 days or less and is
limited to high-quality, readily marketable fixed income instruments, including U.S. Government obligations and highly-rated
corporate securities with maturities of one year or less.
26
Trust funds, unless otherwise provided by the donor, may be invested in accordance with §54 of Chapter 44, which permits
a broader range of investments than §55, including any bonds or notes that are legal investments for savings banks in the
Commonwealth. The restrictions imposed by §§54 and 55 do not apply to city and town retirement systems.
A breakdown of such investments may be obtained from the Town Treasurer.
Tax Increment Financing for Development Districts
Under recent legislation, cities and towns are authorized to establish development districts to encourage increased
residential, industrial and commercial activity. All or a portion of the taxes on growth in assessed value in such districts may
be pledged and used solely to finance economic development projects pursuant to the city or town’s development program
for the district. This includes pledging such “tax increments” for the payment of bonds issued to finance such projects. As a
result of any such pledge, tax increments raised from new growth properties in development districts are not available for
other municipal purposes. Tax increments are taken into account in determining the total taxes assessed for the purpose of
calculating the maximum permitted tax levy under Proposition 2½ (see “Tax Limitations” under “PROPERTY TAX” above).
The Town has not established any such districts.
27
INDEBTEDNESS
Authorization Procedure and Limitations
Serial bonds and notes are authorized by vote of two-thirds of the Town Meeting. Refunding bonds and notes are
authorized by the Selectmen. Borrowings for some purposes require State administrative approval.
When serial bonds or notes have been authorized, bond anticipation notes may be issued by the officers authorized to
issue the serial bonds or notes. Revenue anticipation notes and temporary notes in anticipation of authorized federal
and state aid generally may be issued by the Treasurer with the approval of the Selectmen.
Debt Limits
General Debt Limit. The General Debt Limit of the Town consists of a Normal Debt Limit and a Double Debt Limit.
The Normal Debt Limit of the Town is 5 percent of the valuation of taxable property as last equalized by the State
Department of Revenue. The Town can authorize debt up to this amount without State approval. It can authorize debt
up to twice this amount (the Double Debt Limit) with the approval of the Municipal Finance Oversight Board consisting
of the Attorney General, the State Treasurer, the State Auditor, and the Director of Accounts.
There are many categories of general obligation debt which are exempt from and do not count against the General Debt
Limit. Among others, these exempt categories include revenue anticipation notes and grant anticipation notes; emergency
loans; loans exempted by special laws; certain school bonds, sewer bonds, solid waste disposal facility bonds and
economic development bonds supported by tax increment financing; and subject to special debt limits, bonds for water
(limited to 10 percent of equalized valuation), housing, urban renewal and economic development (subject to various debt
limits), and electric, gas, community antenna television systems, and telecommunications systems (subject to separate
limits). Revenue bonds are not subject to these debt limits. The General Debt Limit and the special debt limit for water
bonds apply at the time the debt is authorized. The other special debt limits generally apply at the time the debt is incurred.
Revenue Anticipation Notes. The amount borrowed in each fiscal year by the issue of revenue anticipation notes is
limited to the tax levy of the prior fiscal year, together with the net receipts in the prior fiscal year from the motor
vehicle excise and certain payments made by the Commonwealth in lieu of taxes. The fiscal year ends on June 30.
Notes may mature in the following fiscal year, and notes may be refunded into the following fiscal year, to the extent of
the uncollected, unabated current tax levy and certain other items, including revenue deficits, overlay deficits, final
judgments and lawful unappropriated expenditures, which are to be added to the next tax levy, but excluding deficits
arising from a failure to collect taxes of earlier years. (See "Taxation to Meet Deficits" under "PROPERTY TAXATION"
above.) In any event, the period from an original borrowing to its final maturity cannot exceed one year.
Types of Obligations
General Obligations. Massachusetts cities and towns are authorized to issue general obligation indebtedness of these
types:
Serial Bonds and Notes. These are generally required to be payable in annual principal amounts beginning no later than
the end of the next fiscal year commencing after the date of issue and ending within the terms permitted by law. A level
debt service schedule, or a schedule that provides for a more rapid amortization of principal than level debt service, is
permitted. The principal amounts of certain economic development bonds supported by tax increment financing may be
payable in equal, diminishing or increasing amounts beginning within 5 years after the date of issue. The maximum terms
of serial bonds and notes vary from one year to 40 years, depending on the purpose of the issue. The maximum terms
permitted are set forth in the statutes. In addition, for many projects, the maximum term may be determined in accordance
with useful life guidelines promulgated by the State Department of Revenue (“DOR”). Serial bonds and notes may be
issued for the purposes set forth in the statutes. In addition, serial bonds and notes may be issued for any other public
work improvement or asset not specifically listed in the Statutes that has a useful life of at least 5 years. Bonds or notes
may be made callable and redeemed prior to their maturity, and a redemption premium may be paid. Refunding bonds or
notes may be issued subject to the maximum applicable term measured from the date of the original bonds or notes and
must produce present value savings over the debt service of the refunded bonds. Generally, the first required annual
payment of principal of the refunding bonds cannot be later than the first principal payment of any of the bonds or notes
being refunded thereby, however, principal payments made before the first principal payment of any of the bonds or notes
being refunded thereby may be in any amount.
28
Serial bonds may be issued as “qualified bonds” with the approval of the state Municipal Finance Oversight Board
composed of the State Treasurer, the State Auditor, the Attorney General and the Director of Accounts, subject to such
conditions and limitations (including restrictions on future indebtedness) as may be required by the Board. Qualified bonds
may mature not less than 10 nor more than 30 years from their dates and are not subject to the amortization requirements
described above. The State Treasurer is required to pay the debt service on qualified bonds and thereafter to withhold the
amount of the debt service paid by the State from state aid or other state payments; administrative costs and any loss of
interest income to the State are to be assessed upon the city or town.
Tax Credit Bonds or Notes. Subject to certain provisions and conditions, the officers authorized to issue bonds or notes
may designate any duly authorized issue of bonds or notes as “tax credit bonds” to the extent such bonds and notes are
otherwise permitted to be issued with federal tax credits or other similar subsidies for all or a portion of the borrowing costs.
Tax credit bonds may be made payable without regard to the annual installments required by any other law, and a sinking
fund may be established for the payment of such bonds. Any investment that is part of such a sinking fund may mature not
later than the date fixed for payment or redemption of the applicable bonds.
Bond Anticipation Notes. These generally must mature within two years of their original dates of issuance but may be
refunded from time to time for a period not to exceed five years from their original dates of issuance, provided that for each
year that the notes are refunded beyond the second year they must be paid in part from revenue funds in an amount at
least equal to the minimum annual payment that would have been required if the bonds had been issued at the end of the
second year. For certain school projects, however, notes may be refunded from time to time for a period not to exceed
seven years without having to pay any portion of the principal of the notes from revenue funds. The maximum term of
bonds issued to refund bond anticipation notes is measured (except for certain school projects) from the date of the original
issue of the notes.
Revenue Anticipation Notes. These are issued to meet current expenses in anticipation of taxes and other revenues. They
must mature within one year but, if payable in less than one year, may be refunded from time to time up to one year from
the original date of issue.
Grant Anticipation Notes. These are issued for temporary financing in anticipation of federal grants and state and county
reimbursements. Generally, they must mature within two years but may be refunded from time to time as long as the
municipality remains entitled to the grant or reimbursement.
Revenue Bonds. Cities and towns may issue revenue bonds for solid waste disposal facilities, for projects financed under
the Commonwealth’s Water Pollution Abatement or Drinking Water Revolving Loan Programs and for certain economic
development projects supported by tax increment financing. In addition, cities and towns having electric departments may
issue electric revenue bonds, and notes in anticipation of such bonds, subject to the approval of the State Department of
Telecommunications and Energy.
Debt Ratios
The following table sets forth the percentage of debt to full valuation and per capita debt ratios at the end of the five most
recent fiscal years. The table considers the principal amount of general obligation bonds of the Town of East Bridgewater
only. The table does not deduct anticipated state grant payments applicable to the principal amount of outstanding bonds
or debt that may be supported in whole, or part, by non-tax revenues. (See "Direct Debt Summary".)
Fiscal
Year End
2012
2011
2010
2009
2008
_____________
General
Obligation Bonds
Outstanding
$
55,062,536
58,158,819
20,908,444
22,996,591
25,119,282
Population
(Federal
Census) (1)
Equalized
Valuation (2)
13,794
13,794
13,794
12,974
12,974
$
1,701,806,500
1,701,806,500
1,845,073,900
1,845,073,900
1,643,271,400
Per Capita
Debt
$
3,992
4,216
1,516
1,773
1,936
Debt as a %
of Full
Valuation
3.24 %
3.42
1.13
1.25
1.53
(1) Source: U.S. Department of Commerce, Bureau of the Census, 2010 Federal Census.
(2) 2006 equalized valuation for fiscal year 2008; 2008 equalized valuation for fiscal years 2009 and 2010; 2010 equalized valuation for
fiscal years 2011 and 2012.
29
DIRECT DEBT SUMMARY
As of June 30, 2012 (Including Subsequent Issues) (1)
General Obligation Bonds:
Outstanding:
School (2)
Water (3)
Sewer (4)
MWPAT (5)
General (6)
Total Long Term Debt
$ 34,011,600
1,138,300
330,000
15,291,156
6,366,100
$ 57,137,156
Total Direct Debt
$ 57,137,156
_____________
(1) Principal amounts only.
(2)
(3)
(4)
(5)
(6)
Excludes interim loan notes, lease and installment purchase obligations, overlapping debt, unfunded pension liability and other
post-employment benefit liability.
$33,287,600 is not subject to the Town’s debt limit and is exempt from the limits of Proposition 2 ½. Does not reflect reimbursement received from the
Massachusetts School Building Authority.
Self-supporting. Not subject to the Town’s general debt limit.
Self-supporting. Subject to the Town’s general debt limit.
$14,869,354 is not subject to the Town's general debt limit and $2,774,304 is exempt from the limits of Proposition 2 1/2. Does not reflect subsidy from
the Massachusetts Water Pollution Abatement Trust.
$3,630,000 is exempt from the limits of Proposition 2 ½.
Debt Service Requirements
The following table sets forth the required principal and interest payments on outstanding general obligation bonds of the
Town of East Bridgewater, Massachusetts.
GENERAL OBLIGATION BONDS
DEBT SERVICE REQUIREMENTS
As of June 30, 2012 (Including Subsequent Issues)
Fiscal
Year
2013
2014
2015
2016
2017
2018
2019
2020
2021
2022
2023
2024
2025
2026
2027
2028
2029
2030
2031
2032
2033
Total
Total
Principal
$
$
3,313,810
3,502,726
3,549,685
3,649,345
3,022,833
2,635,491
2,724,530
2,683,851
2,703,479
2,782,622
2,877,825
2,861,793
2,972,616
3,068,759
3,155,225
3,232,026
2,627,023
2,726,636
2,836,341
105,256
105,286
57,137,156
Total
Principal
& Interest
Total
Interest
$
$
1,994,899
1,921,159
1,815,166
1,695,842
1,585,620
1,489,670
1,389,134
1,286,632
1,184,255
1,079,572
971,321
861,876
750,623
634,495
533,840
429,395
325,120
223,374
114,636
3,825
1,275
20,291,731
$
$
5,308,709
5,423,884
5,364,851
5,345,187
4,608,453
4,125,161
4,113,664
3,970,483
3,887,734
3,862,194
3,849,146
3,723,670
3,723,239
3,703,254
3,689,064
3,661,421
2,952,143
2,950,010
2,950,978
109,081
106,561
77,428,887
30
MWPAT
Subsidy
$
$
(72,792)
(67,978)
(61,917)
(56,196)
(50,551)
(44,849)
(40,092)
(34,217)
(7,250)
(4,366)
(2,414)
(1,125)
(375)
(444,120)
SBA
Payments
$
$
(798,106)
(798,106)
(798,106)
(798,106)
(3,192,424)
Total
Outstanding
Net Debt Service
$
$
4,437,811
4,557,800
4,504,828
4,490,885
4,557,902
4,080,313
4,073,572
3,936,266
3,880,484
3,857,828
3,846,732
3,722,545
3,722,864
3,703,254
3,689,064
3,661,421
2,952,143
2,950,010
2,950,978
109,081
106,561
73,792,343
Projected Principal Payments by Purpose (1)
The following table sets forth the projected principal payments by purpose for the Town's outstanding debt as of June 30,
2012, including subsequent issues.
GENERAL OBLIGATION BONDS
PRINCIPAL PAYMENTS BY PURPOSE
As of June 30, 2012 (Including Subsequent Issues)
Fiscal
Year
School (2)
Water (3)
Sewer (4)
2013
2014
2015
2016
2017
2018
2019
2020
2021
2022
2023
2024
2025
2026
2027
2028
2029
2030
2031
2032
2033
$
2,000,300
2,071,400
2,097,700
2,204,000
1,629,200
1,262,000
1,342,000
1,365,000
1,430,000
1,505,000
1,580,000
1,655,000
1,740,000
1,825,000
1,900,000
1,975,000
2,055,000
2,140,000
2,235,000
-
$
51,300
84,600
85,600
80,000
80,800
40,000
40,000
40,000
42,000
42,000
44,000
45,000
45,000
49,000
53,000
53,000
53,000
53,000
54,000
52,000
51,000
$
30,000
30,000
30,000
30,000
30,000
30,000
30,000
30,000
30,000
30,000
30,000
-
Total
$ 34,011,600
$
1,138,300
$
330,000
MWPAT (5)
$
General (6)
Tota l Outstanding
Princi pal
838,810
871,726
889,685
909,345
922,833
925,491
944,530
958,851
898,479
892,622
902,825
896,793
912,616
913,759
910,225
907,026
247,023
251,636
256,341
20,256
20,286
$
393,400
445,000
446,700
426,000
360,000
378,000
368,000
290,000
303,000
313,000
321,000
265,000
275,000
281,000
292,000
297,000
272,000
282,000
291,000
33,000
34,000
$
3,313,810
3,502,726
3,549,685
3,649,345
3,022,833
2,635,491
2,724,530
2,683,851
2,703,479
2,782,622
2,877,825
2,861,793
2,972,616
3,068,759
3,155,225
3,232,026
2,627,023
2,726,636
2,836,341
105,256
105,286
$ 15,291,156
$
6,366,100
$
57,137,156
_____________
(1) Principal amounts only.
(2) $33,287,600 is not subject to the Town’s debt limit and is exempt from the limits of Proposition 2 ½.
(3)
(4)
(5)
(6)
Does not reflect reimbursement received from the
Massachusetts School Building Authority.
Self-supporting. Not subject to the Town’s general debt limit.
Self-supporting. Subject to the Town’s general debt limit.
$14,869,354 is not subject to the Town's general debt limit and $2,774,304 is exempt from the limits of Proposition 2 1/2. Does not reflect subsidy from
the Massachusetts Water Pollution Abatement Trust.
$3,630,000 is exempt from the limits of Proposition 2 ½.
Authorized Unissued Debt and Prospective Financing
The Town has approximately $46.6 million in authorized unissued debt, all of which relates to the construction of a new
High School. The total borrowing authority for this school project is to be reduced by the expected MSBA grant
proceeds to be received, totaling approximately 64.94% of approved eligible project costs.
31
Overlapping Debt
The Town of East Bridgewater is located in Plymouth County and is a member of the Southeastern Regional Vocational
Technical School District and the Brockton Area Transit Authority and the Massachusetts Bay Transportation Authority
(“MBTA”). The following table sets forth the outstanding bonded debt, exclusive of temporary loans, of the overlapping
entities and the fiscal 2013 assessment to the Town by each.
Outstanding
Long-Term
Debt
Overlapping Entity
Plymouth County (3)
Southeastern Regional Vocational
Technical School District (4)
Brockton Area Transit Authority (5)
Massachusetts Bay Transportation Authority (6)
$
3,575,000
5,769,214,580
Fiscal 2013 Dollar
Assessment(2)
$
31,025
1,118,818
37,193
52,472
Town
Share (1)
2.00 %
6.11
1.41
0.04
_____________
(1) Estimated share based on operating expenses and debt service, if any.
(2) Estimated dollar assessment based upon total net operating expenses, inclusive (where applicable) of debt service.
(3) SOURCE: Plymouth County Treasurer. County expenses including debt service on county bonds are assessed
upon the cities and towns within the county in proportion to their taxable valuation as last equalized by the State
Commissioner of Revenue. Estimated share and dollar assessment shown here are based on the 2010 equalized
valuation. See "TOWN OF EAST BRIDGEWATER - Municipal Services" herein for a discussion of county
government.
(4) SOURCE: Southeastern Regional Vocational Technical School District. Towns may organize regional school
districts to carry out general or specialized educational functions. Pursuant to special laws a number of cities may
also participate in regional school districts, primarily for vocational education. The operating expenses and debt
service of regional school districts are apportioned among the member municipalities in accordance with the
agreements establishing the districts.
(5) SOURCE: Brockton Area Transit Authority. The municipal share is based on a percentage furnished by the
Brockton Area Transit Authority (B.A.T.) as that used in the most recent assessment of aggregate net cost of service
of B.A.T., including debt service and net operating expenses, although assessments for various categories of service
are separately calculated by different formulae. Shares vary from year to year. It has been state practice in recent
years to absorb a substantial percentage of the net costs of service of B.A.T., including debt service on B.A.T.
bonds. The remainder of the net cost of service is assessed on the cities and towns within the territory of the
Brockton Area Transit Authority.
(6) SOURCE: Massachusetts Bay Transportation Authority. Debt is as of June 30, 2012. Dollar assessment is based
on 2013 fiscal year. The MBTA was created in 1964 to finance and operate mass transportation facilities within the
greater Boston metropolitan area. Under its enabling act, the MBTA is authorized to issue bonds for capital
purposes, other than refunding bonds, and for certain specified purposes to an outstanding amount, which does not
exceed the aggregate principal amount of $3,556,300,000. In addition, pursuant to certain of the Commonwealth's
transportation bond bills, the MBTA is authorized to issue additional bonds for particular capital projects. The MBTA
also is authorized to issue bonds of the purpose of refunding bonds. Under the MBTA's enabling act as recently
amended, debt service, as well as other operating expenses of the MBTA, are to be financed by a dedicated
revenue stream consisting of the amounts assessed on the cities and towns of the MBTA and a dedicated portion of
the statewide sales tax. The amount assessed to each city and town is based on its weighted percentage of the total
population of the cities and towns in the MBTA as provided in the enabling act. The aggregate amount of such
assessments is not permitted to increase by more than 2.5 percent per year.
32
Contractual Obligations
Municipal contracts are generally limited to currently available appropriations. A city or town generally has authority to enter
into contracts for the exercise of any of its corporate powers for any period of time deemed to serve its best interests, but
generally only when funds are available for the first fiscal year; obligations for succeeding fiscal years generally are
expressly subject to availability and appropriation of funds. Municipalities have specific authority in relatively few cases to
enter long-term contractual obligations that are not subject to annual appropriation, including contracts for refuse disposal
and sewage treatment and disposal. Municipalities may also enter into long-term contracts in aid of housing and renewal
projects. There may be implied authority to make other long-term contracts required to carry out authorized municipal
functions, such as contracts to purchase water from private water companies.
Municipal contracts relating to solid waste disposal facilities may contain provisions requiring the delivery of minimum
amounts of waste and payments based thereon and requiring payments in certain circumstances without regard to the
operational status of the facilities.
Municipal electric departments have statutory power to enter into long-term contracts for joint ownership and operation of
generating and transmission facilities and for the purchase or sale of capacity, including contracts requiring payments
without regard to the operational status of the facilities.
Pursuant to the Home Rule Amendment to the Massachusetts Constitution, (see “CONSTITUTIONAL STATUS AND
FORM OF GOVERNMENT” above), cities and towns may also be empowered to make other contracts and leases.
The Town of East Bridgewater has one such long-term contractual obligation with Lucini Bus Lines, Inc. for student
transportation. This is a two year contract, with a 1 year option, that expires August 31, 2014. The cost of this contract in
fiscal 2012 was $899,100 and is $930,600 for fiscal 2013.
RETIREMENT PLAN
The Massachusetts General Laws provide for the establishment of contributory retirement systems for state employees, for
teachers and for county, city and town employees other than teachers. Teachers are assigned to a separate statewide
teachers’ system and not to the city and town systems. For all employees other than teachers, this law is subject to
acceptance in each city and town. Substantially all employees of an accepting city or town are covered. If a town has a
population of less than 10,000 when it accepts the statute, its non-teacher employees participate through the county system
and its share of the county cost is proportionate to the aggregate annual rate of regular compensation of its covered
employees. In addition to the contributory systems, cities and towns provide non-contributory pensions to a limited number
of employees, primarily persons who entered service prior to July 1, 1937 and their dependents. The Public Employee
Retirement Administration Commission (“PERAC”) provides oversight and guidance for and regulates all state and local
retirement systems.
The obligations of a city or town whether direct or through a county system, are contractual legal obligations and are
required to be included in the annual tax levy. If a city or town, or the county system of which it is a member, has not
established a retirement system funding schedule as described below, the city or town is required to provide for the
payment of the portion of its current pension obligations which is not otherwise covered by employee contributions and
investment income. “Excess earnings,” or earnings on individual employees’ retirement accounts in excess of a
predetermined rate, are required to be set aside in a pension reserve fund for future, not current, pension liabilities. Cities
and towns may voluntarily appropriate to their system’s pension reserve fund in any given year up to five percent of the
preceding year’s tax levy. The aggregate amount in the fund may not exceed ten percent of the equalized valuation of the
city or town.
If a city or town, or each member city and town of a county retirement system, has accepted the applicable law, it is
required to annually appropriate an amount sufficient to pay not only its current pension obligations, but also a portion of its
future pension liability. The portion of each such annual payment allocable to future pension obligations is required to be
deposited in the pension reserve fund. The amount of the annual city or town appropriation for each such system is
prescribed by a retirement system funding schedule which is periodically reviewed and approved by PERAC. Each
system’s retirement funding schedule is designed to reduce the unfunded actuarial pension liability of the system to zero by
not later than June 30, 2030, with annual increases in the scheduled payment amounts of not more than 4.5 percent. The
funding schedule must provide that the payment in any year of the schedule is not later than 95% of the amount
appropriated in the previous fiscal year. City, town and county systems which have an approved retirement funding
schedule receive annual pension funding grants from the Commonwealth for the first 16 years of such funding schedule.
33
City, town and county systems may choose to participate in the Pension Reserves Investment Trust Fund (the “PRIT
Fund”), which receives additional state funds to offset future pension costs of participating state and local systems. If a local
system participates in the PRIT Fund, it must transfer ownership and control of all assets of its system to the Pension
Reserves Investment Management Board, which manages the investment and reinvestment of the PRIT Fund. Cities and
towns with systems participating in the PRIT Fund continue to be obligated to fund their pension obligations in the manner
described above. The additional state appropriations to offset future pension liabilities of state and local systems
participating in the PRIT Fund are required to total at least 1.3 percent of state payroll. Such additional state appropriations
are deposited in the PRIT Fund and shared by all participating systems in proportion to their interests in the assets of the
PRIT Fund as of July 1 for each fiscal year.
Cost-of-living increases for each local retirement system may be granted and funded only by the local system, and only if it
has established a funding schedule. Those statutory provisions are subject to acceptance by the local retirement board
and approval by the local legislative body, which acceptance may not be revoked.
The Town provides retirement benefits to employees, other than teachers, through a contributory retirement system
administered by the Plymouth County Retirement System, a cost sharing, multiple-employer, public employee retirement
system. Public school teachers are covered by the Commonwealth of Massachusetts Teacher’s Retirement System to
which the Town does not contribute. For a summary of the Town’s pension plans, see the audited financial statements
attached hereto. The annual required contributions of the Town to the County contributory retirement system in recent
years are shown below.
Year Ending
Contributory
June 30,
2013 (budgeted)
2012
2011
2010
2009
2008
$1,754,175
1,548,420
1,633,654
1,416,487
1,396,265
1,329,776
As of January 1, 2011, the unfunded actuarial accrued liability (‘UAAL’) of the Plymouth County Retirement System was
$520,716,602 and the annual required contribution (‘ARC’) was $46,850,764 assuming an actuarial value of assets of
$66,730,812. The Town’s share of the System’s UAAL was $18,327,765.
Other Post-Employment Benefits
In addition to pension benefits, cities and towns may provide retired employees with health care and life insurance benefits.
The portion of the cost of such benefits paid by cities and towns is generally provided on a pay-as-you-go basis.
Fiscal
Year
2013 (budgeted)
2012
2011
2010
2009
2008
$
Benefit
Costs
1,495,360
1,494,998
1,231,030
1,168,954
205,725
182,558
The Governmental Accounting Standards Board (“GASB”) recently promulgated its Statement Nos. 43 and 45, which will
for the first time require public sector entities to report the future costs of these non-pension, post-employment benefits in
their financial statements. These new accounting standards do not require pre-funding the payment of these costs as the
liability for such costs accrues, but the basis applied by the standards for measurement of costs and liabilities for these
benefits is conservative if they continue to be funded on a pay-as-you-go basis and will result in larger yearly cost and
liability accruals than if the cost of such benefits were pre-funded in a trust fund in the same manner as traditional pension
benefits. Cities and towns that choose to self-insure all or a portion of the cost of the health care benefits they provide to
employees and retirees may establish a trust fund for the purpose of paying claims. In addition, cities and towns may
establish a trust fund for the purpose of pre-funding other post-employment benefits liability in the same manner as
traditional pension benefits.
34
As of July 1, 2010, the Town had an unfunded actuarial accrued OPEB liability of approximately $33,373,211
assuming a 4.0% investment rate of return, and the Town’s annual required contribution (ARC) was $2,853,663. At
the fiscal 2012 Annual Town Meeting, the Town voted to establish an OPEB Trust Fund to which it will appropriate
$5,000 annually commencing in fiscal 2013.
EMPLOYEE RELATIONS
The Town employs approximately 431 full and part-time workers, of whom 300 are employed by the School Department, 20
by the Fire Department, 19 by the Police Department and the balance by various other departments of the Town. Town
employees (other than managerial and confidential employees) are entitled to join unions and to bargain collectively on
questions of wages, hours and other terms and conditions of employment. Of the approximately 416 employees of the
Town, approximately 255 are represented by unions. The clerical union contract expired June 30, 2010 and is in the
process of negotiating a new contract. The teachers’ union contract expires June 30, 2014. The police union contract, the
fire union contract and DPW contract all expired June 30, 2011 and are currently in negotiations.
LITIGATION
At present there are a number of cases pending in various courts throughout the Commonwealth where the Town of East
Bridgewater is a defendant. In the opinion of the Town Counsel, none of the pending litigation is likely to result, either
individually or in the aggregate, in final judgments against the Town that would materially affect its financial position.
________________
TOWN OF EAST BRIDGEWATER, MASSACHUSETTS
/s/ Marilyn Thompson, Treasurer
March 25, 2013
35

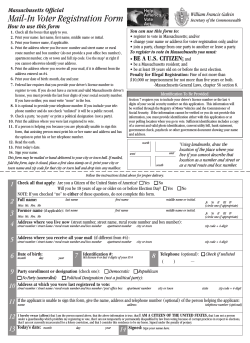
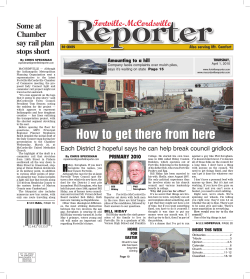


© Copyright 2026