
Cedar River Habitat Conservation Plan Annual Accomplishments Report Year 3
Cedar River Habitat Conservation Plan
Annual Accomplishments Report
Year 3
Seattle Public Utilities & Seattle City Light
June 2004
ii
TABLE OF CONTENTS
Executive Summary
1
HCP Program Element Summaries …………………………………………………………………
5
HCP Background …………………………………………………………………..
7
Watershed Management Background …………………………………………….
Biodiversity Initiative ……………………………………………………...
Volunteer Involvement …………………………………………………….
Watershed Road Decommissioning ………………………………………
Watershed Road Improvements …………………………………………..
Road Maintenance …………………………………………………………
Large Woody Debris Placement …………………………………………..
Streambank Stabilization ………………………………………………….
Streambank Revegetation …………………………………………………
Riparian Conifer Underplanting ………………………………………….
Riparian Restoration Thinning ……………………………………………
Stream Crossings for Peak Flows …………………………………………
Stream Crossings for Fish Passage ………………………………………..
Upland Restoration Thinning ……………………………………………..
Upland Ecological Thinning ……………………………………………….
Upland Restoration Planting ………………………………………………
Common Loon Monitoring ………………………………………………..
Bull Trout Surveys …………………………………………………………
Watershed Characterization ………………………………………………
Species/Habitat Relationship Modeling …………………………………..
Riparian Restoration Project Monitoring ………………………………...
Upland Forest Restoration Project Monitoring…………………………...
Information Resource Management……………………………………….
9
10
11
13
15
16
18
20
22
23
24
25
26
27
29
31
32
35
41
44
46
47
48
Landsburg Mitigation Background ……………………………………………….
Interim Mitigation for Coho, Chinook and Steelhead …………………..
Landsburg Fish Passage Improvements…….…………………………...
Operation of Passage Facilities…………………………………………….
Interim Sockeye Mitigation (Salmon Hatchery Program) ………………
Cedar River Sockeye Hatchery Design and Construction ………………
Cedar River Sockeye Hatchery Broodstock Collection Solutions and
Monitoring ………………………………………………………………….
Drinking Water Quality Monitoring ……………………………………...
Sockeye Fry Marking and Evaluation …………………………………….
Sockeye Fry Trapping and Counting ……………………………………..
Short-Term Sockeye Fry Rearing …………………………………………
Lake Washington Plankton Studies ……………………………………….
Adult Survival Distribution and Homing Studies ………………………..
Phenotypic and Genetic Studies …………………………………………...
Anadromous Fish Committee Annual Report …………………….……...
51
52
54
55
57
59
Instream Flow Background ………………………………………………………...
75
61
62
63
65
66
67
69
70
72
iii
Implementation of the Cedar River Instream Flow Agreement and
Workings of the Instream Flow Commission …………………………….
Supplemental Biological Studies and Steelhead Redd Monitoring ……..
Streamflow Gaging and Technical/Engineering Studies ………………...
Cedar Permanent Dead Storage Project Evaluation …………………….
Cedar Falls Powerhouse and Masonry Dam Improvements ……………
Conservation Messages for Fish …………………………………………...
Smolt Passage Improvements and Freshwater Conservation at Locks ..
Downstream Habitat Protection and Restoration ……………………….
76
81
84
87
89
91
93
94
Financial Overview …………………………………………………………………………………..
97
Appendix A - Annual Compliance Report -- Instream Flow Agreement
iv
Executive Summary
The accomplishments described in this Year 3 report chronicle the substantial progress that was
made last year in implementing the Cedar River Habitat Conservation Plan. With supporting
business and management systems well-established in HCP Years 1 and 2, efforts could be
focussed on the important “on-the-ground” work that moved us closer to the HCP’s biological
goals. Since implementation began in April 2000 with the signing of the agreements with Federal
and State agencies, the City of Seattle has implemented 31 capital projects and 30 research and
monitoring efforts under the HCP.
This report follows the format of previous years’ Accomplishments Reports. The report is
organized into three categories: Watershed Management, Landsburg Mitigation and Instream
Flows. Within each category, individual projects, and research and monitoring efforts are
described in brief program element summaries. Each summary provides information on work
accomplished in Year 3, work planned for Year 4, and a financial summary. In addition to the
individual program element summaries, this report also includes a Financial Monitoring Report,
which compares actual expenditures for each program element to the HCP financial
commitments.
HCP Program Management
Overall management of the HCP program during the third year was focused on budget and legal
challenges. The economic downturn and subsequent budget-tightening that occurred within all
City of Seattle departments during 2002 and 2003 resulted in deferred implementation of some
HCP activities. Deferred activities were those that allowed the City to remain in compliance with
HCP cost and schedule commitments, and did not compromise the City’s ability to meet the
HCP’s biological goals. Additionally, funding levels in 2005 and beyond will allow project and
activity managers to compensate for delays that occurred in 2003 and 2004 in order to meet HCP
schedule and performance commitments.
Legal challenges distinguished HCP Year 3. The citizen appeal of the Final Environmental
Impact Statement (FEIS) for the Cedar River Sockeye Hatchery occupied HCP program
management and Hatchery project staff for several months in 2003. The City Hearing Examiner
remanded the FEIS back to SPU for further analysis and issuance of a Supplemental EIS (SEIS).
The SEIS is under development and will be available for public review in Fall, 2004. (See
Landsburg Mitigation paragraph below). In December, the Muckleshoot Indian Tribe filed a
lawsuit against NOAA Fisheries for its issuance of the Incidental Take Permit (ITP) for the Cedar
River HCP. In its complaint, the MIT contended that NOAA Fisheries: 1) lacked sufficient
information about the impacts of the City’s existing or future increased water diversions on
chinook salmon to issue the ITP; 2) failed to quantify take specifically related to future increases
in water withdrawals; 3) should have evaluated an alternative that would provide greater
mitigation and minimization of take than the HCP does; 4) should have included the Ballard
Locks and Lake Washington Ship Canal in the action area, not just Cedar River and Lake
Washington; and 5) should have prepared an Environmental Impact Statement under NEPA. The
City filed a motion to intervene in this lawsuit, which was granted by the U.S. District Court. The
City and NOAA Fisheries are currently preparing their independent defenses. A hearing date has
been set for November 2004.
Watershed Management
HCP activities in the watershed continued on the two parallel tracks initiated in Year 1: planning
and implementing projects on the ground in the near term, and developing long-term, landscapelevel plans to guide the performance of work as the program progresses. Interdisciplinary teams
1
continued to develop long-term strategic plans for characterizing the watershed to support
restoration planning, monitoring projects and habitats, prioritizing areas for restoration, and
developing an information management system to support these activities. We made substantial
progress on many restoration projects, and had the able assistance of many volunteers in getting
projects done. More than 200 volunteers contributed a total to 1013 hours removing invasive
plants and planting conifers, deciduous trees, and shrubs.
The big event in the watershed in 2003 was the construction of a new Bonneville Power
Administration (BPA) transmission line adjacent to the existing line that transects the lower
watershed in a north-south alignment. After years of intense negotiations, BPA agreed to
significant provisions to protect the watershed and compensate for impacts of clearing and
construction. BPA conducted a model project that included many provisions for environmental
protection that greatly exceeded its normal procedures. BPA also transferred two parcels of land
and $6 million to SPU as compensation for impacts of the project. As part of an agreement for
mitigation and compensation for impacts, the City committed to assist BPA with the project.
Much City staff time and many resources were devoted to assisting BPA and making sure the
project’s environmental standards were met. This commitment of resources resulted in less
progress on HCP activities than planned.
As a result of considerable work on the BPA project, we decommissioned 5.1 miles of road in
2003. This brings the total for the first three years to approximately 28 miles, a little below the
10 miles per year average expected under the HCP. To reduce sediment loading from watershed
roads to water bodies, crews also did improvement work on 12.5 miles of road, including culvert
installations, road surfacing, ditching, and slope stabilization with “soil nailing,” a new technique
used to stabilize roads in a cost-effective manner. We initiated an extensive road inventory
project to provide accurate and complete information on roads and their potential environmental
effects to support long-term planning and prioritization, and began developing a strategic plan for
long-term road management. The inventory data will be used with a sediment model that will
allow the evaluation of potential road decommissioning and improvement projects, and
maintenance, as means to reduce sediment input to streams, thus supporting strategic planning for
roads.
Year 2003 was used to develop a system to identify and prioritize aquatic restoration sites and
develop a watershed-specific, instream habitat inventory system based on a U. S. Forest Service
methodology. In addition, two large woody debris projects were completed on Rock Creek in
2003, both associated with the BPA project. Streambank stabilization projects in 2003 consisted
of removing poorly designed or failed stream drainage structures and redesigning the channel to
provide long-term stability for approximately 100 linear feet of stream during road abandonment
projects. Streambank revegetation projects included planting 1,950 linear feet of bank with 721
native shrubs and trees using SPU staff, Earthcorp, and volunteers. Two riparian planting
projects were also implemented along the main stem of Taylor Creek in the lower watershed, with
western hemlock, western red cedar, and Sitka spruce seedlings planted in five different areas.
We also completed the Select Riparian Restoration Thinning project and thinned several other
small areas in the lower watershed, as well as thinning approximately 7 acres in riparian habitats
in the upper watershed in conjunction with upland restoration thinning.
In 2003 we removed a fish barrier on a tributary to Williams Creek at the 13 Road to allow fish
passage, designing the crossing to allow later access for restoration work using a temporary
crossing structure. A total of 18 other stream crossings were improved through culvert
2
replacement to allow 100-year flows to pass without damage to the road and consequent sediment
loading to the associated streams.
In 2003, an area of approximately 1,200 acres of young forest was thinned under the Upland
Restoration Thinning Program, well in excess of the 800-acre annual target. These areas were
primarily in the upper watershed with the Pacific Silver Fir Zone, where most of the younger
forest now exists. The first ecological thinning in older forest, the 45 Road Forest Restoration
Project, was completed in 2003 after ordinance approval in the fall of 2002. An area of
approximately 157 acres was thinned on this site in the lower watershed through use of a contract
with a private company. A total of 64 acres in the 45 Road project area was planted for diversity
under the Upland Restoration Planting program, which will further increase the species diversity
and structural complexity of the site. We also continued work on the next planned ecological
thinning project, the 700 Road Forest Restoration Project in the upper watershed. We began
work on developing a strategic framework for restoration planting that includes a landscape
perspective and the potential “planting” of such nonvascualr plants as mosses and organisms that
contribute to small-scale disturbances. This framework is being developed within the context of
such landscape-level processes as dispersal, colonization, and restoration of biodiversity across
the watershed.
In 2003, we added a new twist to the program for deploying floating nesting platforms for
common loons in both the Cedar and Tolt watersheds. Staff developed and installed non-rigid
frames over three platforms that were designed to deter bald eagles, which harass the nesting
loons and can kill chicks. Initial results of the platform modification experiment were somewhat
promising, as the only successful nests in either watershed were those that had been modified.
The adfluvial bull trout population present in Chester Morse Lake spawned in record numbers in
core spawning reaches of major lake tributaries during fall/early winter of 2002-03, despite record
low flow levels in the Cedar River and tributaries, as well as unusually low reservoir levels. Staff
found 504 redds in 2002-3, and 258 redds in 2003-04 (similar to the 236 redds found in several
years preceding 2002). For the fourth year in succession, the number of bull trout redds observed
in 2003-04 falls well within the range of numbers of redds that would be predicted for a viable,
adfluvial bull trout population of this size. In 2003, we also conducted surveying work as part of
the bull trout redd inundation study, which will examine the potential effect of reservoir refill on
bull trout eggs within the inundation zone of the Cedar and Rex rivers as they enter the reservoir.
With respect to forest habitats, we began installing permanent sampling plots in upland and
riparian areas as a means to track long-term changes in habitat over time and to provide sampling
data for use now with remote sensing data to characterize the condition of forest habitats. For
watershed characterization, we acquired, and began analyzing LiDAR data. LiDAR provides
detailed “surfaces for forest canopy and the ground. This data set, if we are able to acquire
coverage for the entire watershed, promises to be extremely valuable in characterizing upland
forest, riparian habitats, streams, and roads for the purpose of planning restoration work. We
also extended the use of effectiveness monitoring to more habitat restoration projects of all types,
conducted forest inventory work in the lower watershed to support planning, and continued the
development and application of modeling approaches to landscape connectivity.
Landsburg Mitigation
The Landsburg Fish Passage Project was completed in late summer and full operation of the
facilities began in time for the annual fall return of spawning salmon l, one year ahead of the
HCP-required scheduled. Completion was celebrated at a dedication event held in October.
Facilities include new protective water diversion intake screens, a fish ladder (including fish
3
holding, sorting and transport facilities), and a downstream fish passage gate at the diversion
dam, and rock-drop structures providing upstream and downstream passage at the Lake Youngs
aqueduct river crossing. Following commencement of operations on September 16, the first adult
chinook salmon passed through the facilities beyond the Landsburg Diversion Dam on September
19. During the 2003 brood year a total of 79 adult chinook and 47 adult coho salmon passed
upstream. In addition to passage operations, chinook and coho trapping facilities were
constructed as a project enhancement , and genetic samples were collected from chinook and
coho before being passed above the dam. Genetic sampling will allow for the tracking of family
groups in order to assess the relative success of early recolonization above the dam.
Efforts on the Cedar River Sockeye Hatchery project were focussed on design development and
environmental review. The project team brought the facility design to the 60% development
stage and conducted a formal value engineering (V.E.) process in October, 2003. The V.E.
analysis, conducted by a group of independent experts in fisheries and engineering disciplines
identified opportunities for project cost efficiencies, many of which were incorporated into the
project’s design. A Final Environmental Impact Statement and Response to Public Comments
document was released in March and was appealed to the City Hearing Examiner by a citizen in
April. A hearing was held in October, and in November the hearing examiner issued her
decision, which required SPU to issue a Supplemental Environmental Impact Statement (SEIS)
that provides additional analysis of environmental effects. Work on the SEIS began in September
and is scheduled to be available for public review in the Fall, 2004. The timeline for completion
of the facilities has been delayed by one year, to August 2007, as a result of the EIS appeal.
Research and monitoring continued on sockeye, chinook, coho and steelhead. For sockeye fry,
work included otolith marking and evaluation, trapping and counting, and short-term fry rearing
feasibility assessment in an effort to enable hatchery managers to better understand the
performance of the interim hatchery and improve management practices for the existing and
replacement hatchery operations. A fall survey of juvenile sockeye in Lake Washington was
conducted to enumerate and obtain growth information. For chinook, coho and steelhead,
research efforts included studying recolonization above the Landsburg Diversion Dam, study of
genetic relationships between rainbow and steelhead trout, and installation of PIT-tag readers at
the Ballard Locks to gather information about adult salmon returning to Lake Washington.
Instream Flows
The City manages the Cedar River water supply for multiple objectives: (1) to provide its
customers in the region with a high quality, reliable, and adequate supply of drinking water; (2) to
protect fisheries resources in the Cedar River and Lake Washington; and (3) to provide a measure
of flood protection compatible with the City’s primary water supply mission. The instream flow
management strategy commits the City to a binding instream flow regime designed to improve
habitat conditions for chinook, coho, sockeye, and steelhead in the regulated portio n of the Cedar
River. The flow regime includes not only minimum instream flow requirements but also adaptive
provisions for the allocation of supplemental flows above minimums in years when available,
through operation of a multi-agency commission.
The Cedar produced large numbers of juvenile chinook and sockeye in the spring of 2003,
indicating good conditions for salmon spawning, incubation and emigration. Although the return
of spawning adult steelhead in the spring was again disappointing, all steelhead redds were
protected from dewatering with the application of supplemental stream flows. Spring, summer
and fall instream flow management efforts were complicated by the need to mitigate the effects of
extremely poor snowpack, early snowmelt and an exceptionally warm and dry summer. This was
further complicated by the need to coordinate all activities with the construction of fish passage
4
facilities, construction and testing of fish and flow protection facilities at the Cedar Falls
powerhouse and the construction of new water treatment facilities at Lake Youngs.
Despite the difficult hydrologic conditions, sufficient storage was available to augment stream
flows to levels that were significantly higher than estimated natural unregulated flows during
much of the early portion of the salmon spawning season in the fall. With the fortunate timely
return of the fall rains in late October, we were able to continue to supply supplemental high
normal flows throughout the salmon spawning season. Flood storage capacity was maintained at
sufficient levels throughout the fall and early winter to moderate the detrimental effects of several
large storm events that caused substantial egg mortality in many river systems in the Puget Sound
region. Preliminary reports from WDFW indicate that the 2004 emigration of naturally produced
Cedar River sockeye fry may be the largest since the annual counts began in 1992.
The HCP directs SPU to manage average annual Cedar River diversions in the 98 to 105 mgd
range for the first five to ten years of the HCP. In calendar year 2003, mean annual diversion was
83 mgd; in calendar year 2002, mean annual diversion was 79 mgd; in 2001, with water use
curtailments in effect for the summer, mean annual diversion was 90 mgd; in 2000, mean annual
diversion was 93 mgd.
Work continued on Chinook/Supplemental Biological Studies to increase understanding of
relationships between streamflow and habitat. Information from these studies will be used to
adapt and improve future instream flow management practices. To this end, nineteen specific
study questions were developed, and a number of studies addressing these questions have been
conducted and are ongoing.
Seattle City Light completed installation of a fish flow valve at Masonry Dam to ensure
continuous minimum river flow between lower Cedar Falls and the powerhouse. At the Cedar
Falls powerhouse, City Light carried out testing and improvements to the new tailrace barrier that
was installed at the powerhouse in 2002. New downramping requirements below Masonry Dam
and Cedar Falls powerhouse were initiated in September with the passage of anadromous fish
above Landsburg Diversion Dam.
5
6
HCP PROGRAM ELEMENT SUMMARIES
HCP Background
The HCP, approved in April 2000, is a comprehensive, ecosystem based plan for the Cedar River
Municipal Watershed and areas downstream affected by river flows. The HCP incorporates more
than 10 years of scientific research and monitoring, and commits more than $90 million over the
next 50 years to improve conditions for fish and wildlife. The plan will substantially contribute to
ensuring that our region has an ample supply of high-quality drinking water well into the 21st
century by meeting the requirements of the Endangered Species Act with regard to 83 species of
fish and wildlife addressed in the HCP. It addresses many long-standing issues between the City
of Seattle and the State of Washington regarding the blockage to anadromous fish posed by the
Landsburg Diversion Dam. It also represents the completion of a long-running effort with state
and federal agencies to develop technically sound instream flows in the Cedar River to protect
salmon.
Because the Cedar River Municipal Watershed contains the headwaters of the major river that
discharges into Lake Washington, management of the watershed and the Cedar River's instream
flows represent a very important regional opportunity to protect and restore both salmon and
other species that are dependent upon late-successional and old-growth forests. The watershed is
important not only as the region’s primary water supply but also as the major source of
downstream river flows necessary to maintain habitat for anadromous salmonids. In addition, the
municipal watershed offers one of the few significant opportunities to reestablish a block of
mature, late-successional, and old-growth forest below 3,000 ft in a manner that could effectively
link this forest block to existing old-growth in other areas of the Cascade Mountains.
As part of the HCP, the City of Seattle has made a 50-year commitment to a wide variety of
programs providing significant benefits to fish and wildlife found throughout the entire Cedar
River system. These commitments are in three primary categories: Watershed Management,
Landsburg Mitigation, and Instream Flows. The HCP includes conservation measures and
research and monitoring efforts in all three categories. In developing the Cedar River Watershed
HCP, the City understood that undertaking a comprehensive, 50-year habitat protection and
restoration program could be successful only with significant commitments to fund and
implement monitoring and research activities. This includes: (1) compliance monitoring to
determine whether HCP programs and elements are implemented; (2) effectiveness monitoring to
determine whether HCP programs and selected elements result in the anticipated changes in
habitat or other conditions for the species of concern; and (3) cooperative research to obtain more
information on species of concern, test critical assumptions in the plan, and gain understanding
needed to refine management decisions to meet plan objectives.
The sections that follow provide a finer level of detail for each program element’s first year
accomplishments (Program Element Summaries). The Program Element Summaries are
organized into the three HCP Categories (Watershed Management, Landsburg Mitigation and
Instream Flows) and each section is preceded by an explanation of the HCP Program Category.
7
8
Watershed Management Background
The Cedar River Municipal Watershed supports a variety of species that are at risk in the region,
largely as a result of habitat degradation and loss. Within the watershed the northern spotted owl,
marbled murrelet, bald eagle, and bull trout are found, as well as other terrestrial and aquatic
species that are at risk regionally. Since the fish ladders are constructed at the Landsburg
Diversion Dam, native anadromous salmonids, such as chinook salmon and steelhead trout, now
have access to the Watershed. The HCP’s watershed management mitigation and conservation
strategies are designed to protect and contribute to the restoration of the habitats of at-risk
species, and to contribute to the restoration of ecological and physical processes and functions
that create and maintain key habitats.
The proposed mitigation represents a landscape approach to watershed management that includes
both a commitment not to harvest timber for commercial purposes within the municipal
watershed, effectively creating an ecological reserve that includes all forest outside limited
developed areas, and a significant commitment to habitat restoration. These measures were
developed collectively to mitigate for impacts of past land management activities, and they were
developed in an integrated fashion to foster natural biological diversity and to help restore much
of the watershed to more natural conditions.
Following is a listing of the specific components of the City’s commitments under Watershed
Management:
•
•
•
•
•
Eliminate timber harvest for commercial purposes, effectively creating a watershed
ecological reserve that includes all forest outside the few developed areas and that will
provide long-term, comprehensive protection of the watershed ecosystem
Develop and implement a comprehensive program to restore fish and wildlife habitats in the
watershed that have been degraded by past activities, such as logging and road construction
Commit to removing approximately 38% of the forest roads within the watershed by the end
of HCP year 20; use restoration thinning, planting, and similar approaches to restore the
natural ecological functions and processes in watershed forests that create and maintain
habitats for at-risk species
Design and conduct projects to restore habitat in streams and streamside areas and to improve
water quality over the long term
Design and conduct comprehensive research and monitoring studies that will provide the
information needed to improve our ability to achieve the conservation objectives of the HCP
over the long term
The following pages provide summaries of the individual HCP PROGRAM ELEMENTS under
the Watershed Management program category.
9
HCP Program Element: Cedar River Watershed Biodiversity Initiative (to support
restoration and monitoring in aquatic, riparian, and upland habitats)
HCP Program Category: Watershed Management
Contact: David Chapin, Biologist, and Clay Antieau, Senior Watershed Planner, Watershed
Management Division, Cedar River Watershed, Cedar Falls
Objectives & Goals
Protecting, restoring, and monitoring natural biodiversity are stated goals of the HCP. Thus, it is
important to have a framework for acquiring, documenting, organizing, and housing biodiversity
data during the course of the HCP and beyond. The Cedar River Watershed Biodiversity
Initiative (CRWBI) is intended to provide this framework by: (1) defining biodiversity in the
context of the HCP; (2) developing a biodiversity database for the Watershed; (3) conducting
targeted field surveys and biodiversity research and monitoring; (4) interpreting biodiversity data
within the Watershed's biogeographical context; and (5) facilitating biodiversity research in the
region. This project is part of the Watershed Characterization project (see separate summary).
Status of Work (2003)
•
Document information from past ecological and taxonomic studies in the watershed
Based on work in 2001, the considerable amount of research that has been conducted in
the Watershed over many decades continues to be compiled into an organized
bibliography. Staff continues to build on a bibliography of over 350 references, from
which we are extracting pertinent biodiversity data.
•
Collaborate with UW Botany Department on collecting and cataloging vascular plants
This project was quiescent during 2003.
•
Continue studies on presence and distribution of invertebrates
Dr. Rick Sugg concluded his survey of terrestrial invertebrates in the Watershed. This
work initially focused on ground-dwelling invertebrates across the Watershed.
Looking Ahead (Planned 2004 Accomplishments)
The HCP Biological Diversity Initiative will continue in 2004 with major tasks focused on
continuing biological inventory, defining Cedar River Watershed restoration efforts in the context
of biodiversity, and identifying research and monitoring priorities that will support Watershed
restoration efforts. No specific biological diversity studies are planned for 2004; however,
documentation of biodiversity data stemming from other studies will continue.
Financial Summary
This is not an explicit HCP Cost Commitment. Thus, there is no financial summary for this
activity.
10
HCP Program Element: HCP Volunteer Involvement Program
HCP Program Category: Watershed Management
Contact: Clay Antieau, Senior Watershed Planner, Watershed Management Division, Cedar
River Watershed, Cedar Falls
Objectives & Goals
Watershed staff support two volunteer programs: a docent program associated with the Watershed
Education Center, its collections/displays, and its visitors; and a "Habitat Conservation Plan
(HCP) Implementation" program focusing on projects in the Watershed. The Cedar River
Watershed's HCP Volunteer Program uses volunteers and “conservation corps” to assist Division
staff in implementing HCP elements in the Watershed. As with most citizen-involvement
initiatives, Cedar River Watershed managers use this Volunteer Program to renew citizens'
commitment to their own communities and resources while benefiting from that volunteer
assistance. Thus, essentia lly all events in which volunteers participate are designed and managed
to provide distinct educational, training, or development opportunities to those volunteers.
Status of Work (2003 Accomplishments)
♦
The HCP Volunteer Program involved over 200 different volunteers in the mission,
management, and ecology of the Cedar River Municipal Watershed (CRW).
♦
The HCP Volunteer Program generated approximately 1013 hours (127 person-days) of
volunteer effort in the CRW.
♦
The HCP Volunteer Program partnered with at least eleven explicit partner organizations:
Friends of the Cedar River Watershed, EarthCorps, Bank of America, The Mountaineers,
Mountains-to-Sound Greenway, Student Conservation Association, Girls Club of Seattle,
YMCA Earth Service Corps, Earth Ministries, Cub Scouts (Boy Scouts of America), and
the Environmental Protection Agency (Region 10).
♦
Japanese knotweed (Polygonum cuspidatum complex), a noxious weed, was handremoved from portions of abandoned Road 16 (within an area of approximately 2 acres).
♦
Tansy ragwort (Senecio jacobaea), a noxious weed, was hand-removed from the 120
Road and portions of the 9 Road. Infestations were also mapped and characterized in
those areas (over a linear distance of approximately 15 miles).
♦
Approximately 700 conifers and other native species were planted on abandoned forest
roads and along restored stream crossings in the Lower Watershed.
♦
Approximately 400 conifers and shrubs were planted in riparian and wetland habitats at
the Halmar Gates.
♦
Approximately 300 conifers and 300 shrubs were planted in riparian areas at the west end
of Chester Morse Reservoir.
11
Looking Ahead (Planned 2004 Accomplishments)
The HCP Volunteer Program will continue in 2004 with major tasks focused on biological
inventory, invasive plant species management, and revegetation.
Financial Summary
This is not an HCP Cost Commitment; thus, there is no financial summary for this activity.
12
HCP Program Element: Watershed Road Decommissioning (C100026)
HCP Program Category: Watershed Road Decommissioning & Improvements
Contact: Chris Anderson, Watershed Operations Manager, Watershed Management Division
Objectives and goals
To reduce the road network to a long-term core road system of approximately 384 miles, the City
will remove approximately 236 miles of roads (about 38 percent of the current total), and expects
to average about 10 miles of roads per year for the first 20 years of the HCP. The primary
purpose of road decommissioning is to minimize sediment delivery to streams and to improve
drainage patterns. Decommissioning also will reestablish fish passage between significant
amounts of habitat. The basic principles of road deconstruction are to restore the site to
approximate pre-road functioning and stability, which involves restoring drainage, placing
material in stable locations, and controlling surface erosion. Mineral soils and organic debris are
removed from "perched" or otherwise unstable locations and placed either in the roadbed against
the cut bank, or hauled to a suitable waste site where they will not be likely to fail and deliver
sediment to streams. Culverts are removed. Stream crossings are restored, and stabilized with
grade control to avoid eroding into the hillslope. Constructing frequent water bars across the road
surface is done to restore cross-slope drainage. All disturbed soils are treated with an approved
seed mix and protected with an application of straw or brush to reduce surface erosion. We have
had a lot of success with self-seeding of trees, and have occasionally planted seedling trees on
deconstructed roads. Some of the roads slated for deconstruction may pass inspection for longterm stability of material and drainage, and may not require any work before declaring them
"decommissioned.”
Status of work (2003)
In 2003 we abandoned 5.1 miles of road network. The following road sections were abandoned:
64.1A, 64.1B, 64.1C, 64.1D, 64.2, 64.3, 64.4, 64.4A, and 13 Roads. These roads were removed
because they were determined to be nonessential for the management of the watershed and they
were within basins with special issues. The Taylor Creek basin (64 road system) has a high
sediment loading, and the Williams Creek basin is potential anadromous fish habitat. Roads
where abandoned by removing drainage structures (culverts), managing the water crossing the
road prism by installing water bars, and removing any unstable fill material and moving it to a
new stable location. In some situations this meant trucking the material off site to a permanent
storage location within the watershed. Road decommissioning projects were linked with other
HCP aquatic restoration projects (streambank stabilization and streambank revegetation)
whenever possible to increase the ecological benefit of removing the road. The total miles of
roads abandoned in 2003 were lower than our annual average because City staff and equipment
were needed to perform road improvement on a tight schedule as part of the BPA powerline
project. In year 2003 we also began a road inventory that will look at road condition and
sediment production from the road prism to help us determine where best to prioritize our work,
how best to accomplish reduction of sediment delivery from roads to streams, and improve safety.
Looking ahead (Planned 2004 Accomplishments)
In 2004, we plan on abandoning the 610 (spurs), 640 (spurs) and the Little Mountain (spurs) for a
total of approximately 10 miles of Road decommissioning. A road inventory system and longterm road plan will also be continued in 2004 (see account for Road Improvements).
13
Financial summary
The HCP commits funding of $5,900,000 for HCP years 1-20 (in 2003 dollars). The cost per
mile of deconstruction varies with the difficulty of the particular road segments deconstructed.
Some of the funding in 2003 was used for road inventory work to support long-term planning.
$297,319 for labor, equipment, materials, and related expenses was spent in year 2003 for road
decommissioning.
Road Decommissioning
HCP work
HCP Cost
Commitment
Commitment in 2003
dollars
10 miles/per (average) $295,000 per year
(average)
14
HCP work
Commitment,
completed in 2003
Approximately 5.1
miles of roads and
inventory work to
support long-term
planning
HCP Cost
Commitment, spent in
2003
$297,319
Program Element: Watershed Road Improvements (C100023)
Program Category: Watershed Road Decommissioning & Improvements
Contact: Chris Anderson, Watershed Operations Manager, Watershed Management Division
Objectives and goals
The purpose of road improvements is to reduce sediment loading to streams and other water
bodies over time. To minimize sediment delivery to streams and to improve drainage patterns,
priority stream crossing will be upgraded, and ditches will be sized to control hillslope surface
and groundwater flows and to protect the road from surface erosion. Cross-drains will be
installed at frequent intervals to move hillslope surface and groundwater across the road in a
pattern that approximates the drainage pattern upslope of the road, and unstable sidecast and fill
material will be moved. A road may be stabilized by constructing a supported, keyed fill or by
reconstructing the cut slope. Road improvements include activities such as applying rock for
stability, increasing frequency of cross-drains, stabilizing fills, removing unstable sidecast
material and dismantling perched landings.
Status of work (2003)
In year 2003 we accomplished approximately 12.5 miles of road improvements, including culvert
installations, road surfacing, ditching and slope stabilization with soil nailing. An additional 5
miles of HCP designated road improvements were associated with the BPA powerline
construction project, on roads that were identified as needing improvements under HCP. The
road improvement associated with the BPA project was paid for with BPA funds.
Work was also done to develop a new road inventory system to support short-term, logistical
planning to accomplish work in a cost-effective manner, and long-term prioritization and
planning of road improvement, decommissioning, and maintenance work to meet HCP ecological
objectives.
Looking ahead (Planned 2004 Accomplishment)
In 2004, we plan to make improvements to the 9, 50, 70, 100, and 200 systems. In addition, we
plan to complete the road inventory described above, which will include a basis and method for
prioritizing and sequencing road improvements and decommissioning with regard to HCP
ecological objectives. The inventory will be used, with other information, to develop a long-term
strategic plan for road management to meet HCP and other objectives.
Financial summary
The HCP commits funding of $2,065,000 for HCP years 1-5 (in 2003 dollars). $413,000 for
labor, equipment, materials, and related expenses was spent in year 2003 for road improvement.
Road Improvement
HCP work
Commitment
Reduce sediment
delivery to stream and
improve drainage
HCP Cost
Commitment in 2003
dollars
$413,000 per year
(average)
HCP work
Commitment,
completed in 2003
Approximately 12.5
miles plus 5 miles
paid for by BPA
HCP Cost
Commitment, spent in
2003
$413,000
15
HCP Program Element: Watershed Road Maintenance (N541701)
HCP Program Category: Watershed Road Decommissioning & Improvements
Contact: Chris Anderson, Watershed Operations Manager, Watershed Management Division
Objectives and Goals
The primary objectives of road maintenance under the HCP are to minimize sediment delivery to
streams, to improve drainage patterns that have been altered by roads, and to provide fish
passage, following standards included in the HCP. These standards are designed to maintain a
stable, functional road system that minimizes adverse impacts on stream and riparian habitat.
The focus is on road segments that are near streams or have the potential to deliver sediment to
streams. Other areas are now maintained with more precautions and added cost to protect draws
and water crossings.
Status of Work (2003)
In 2003 we accomplished approximately 42 miles of road maintenance on particular roads that
have potential to impact the aquatic system. An additional 5 miles of roads that received
maintenance are part of the BPA power line project. Roadwork standards for the roads related to
the BPA project were reviewed and modified by City staff. Staff hydrologists determined the
design flow using USGS regional equations and/or other methodologies (e.g., Washington DNR).
The stream channels were also analyzed for stability and debris loading before a culvert size was
determined. Significant amounts of applied maintenance were increased in 2003 due to
comprehensive ditch cleaning efforts, re-establishing runoff diversion. Also, in identified HCP
areas, increased care and time was spent on grading and compacting existing surfaces that were
near streams. One of our goals in 2003, in addition to maintaining HCP roads, was to distinguish
HCP maintenance objectives from normal road maintenance. This has been an ongoing
procedure that has been identified through planning and mapping exercises. During 2003, we
were able to identify these areas of immediate maintenance concern and, although road
improvements will be necessary in the future for some of these areas, we were able to mitigate
potential impacts before those improvements will be made.
Looking Ahead (Planned 2004 Accomplishments)
We will continue road maintenance activities to protect and benefit habitat. In 2004, we plan on
continuing maintenance on HCP Roads that are not immediately scheduled for Road
Improvements, with emphasis on data collected from the Road Inventory we will be continuing in
2004 (see account for Road Improvements). In 2004, the process will be finalized for accurately
identifying road segments for which HCP objectives apply regarding maintenance and more
specific identification and accurate tracking will be implemented.
Financial Summary
The HCP commits funding of $547,570 for HCP years 1-5 (in 2003 dollars). $82,198 for labor,
equipment, materials, and related expenses was spent in year 2003 for road maintenance.
16
Road Maintenance
HCP work
Commitment
Correcting and
avoiding direct road
impacts to streams
HCP Cost
Commitment in 2003
dollars
$109,514 per year
(average)
HCP work
Commitment,
completed in 2003
Approximately 42
miles plus 5 miles
paid for by BPA
HCP Cost
Commitment, spent in
2003
$82,198
17
HCP Program Ele ment: Large Woody Debris Replacement in Streams (C100019)
HCP Program Category: Stream and Riparian Restoration
Contact: Dave Beedle, Senior Watershed Hydrologist, Watershed Management Division
Goals and Objectives
The objective of this element is to temporarily enhance stream habitat by placing large woody
debris (LWD) in selected streams that lack wood as a result of past land management activities.
The goal is to help restore ecological functions by enhancing in-channel structural characteristics.
This will temporarily improve fish habitat until the adjacent riparian area begins to supply woody
debris of appropriate size and quantity. A specific plan was developed for the Cedar River
between Cedar Falls and Landsburg. This plan was developed to incorporate specific water
supply infrastructure, water quality, and personnel safety concerns.
Status of Work (2003)
Year 2003 was used to develop a system to identify and prioritize aquatic restoration sites and
develop a watershed specific in-stream habitat inventory system. The aquatic restoration system
developed within the CRW was based on GMUs (Geomorphic Map Units). The system allows
the City to achieve the following: 1) identify key watershed processes (hillslope and fluvial) for
each GMU which most strongly control/influence the characteristics of the GMU; 2) determine
(to the extent possible) the range of variability of these key attributes for each GMU; and 3) use
current and historic information to assess the primary threats which jeopardize the short and long
–term integrity of these GMUs. The stream inventory methodologies were modified from the US
Forest Service Level 2 Stream Inventory Handbook. The modifications where conducted to make
the inventory system more useful as a tool to identify and prioritize aquatic, riparian, and road
restoration projects. One of the primary uses of the inventory will be to identify and determine
the quality of habitat upstream of culverts that potentially block upstream fish passage. The
modified stream inventory methodologies were used in 2003 to verify and refine the GMU
system and identify and prioritize near-term projects within the Rock and William creek basins.
Year 2003 was also devoted to creating a strategic plan with consultants to develop a system
(rationale) for identifying and prioritizing locations for aquatic restoration.
Two LWD projects (covering approximately 300 ft) were completed on Rock Creek in 2003. Site
1 (lower site) consisted for placing 12 full-length trees in the channel and floodplain from the
adjacent riparian area that was to be harvested for the new power line. Site 2 (upper site)
consisted of placing 7 full-length trees in the channel and floodplain from the adjacent riparian
area that was to be harvested for the new power line. Minimal HCP funds were used to complete
the projects as they were part of the BPA project. The anticipated HCP LWD project was not
implemented because additional funding required to move logs into remote reaches of Rock
Creek does not become available until 2004.
Looking Ahead (Planned 2004 Accomplishments)
The planned LWD project for 2004 is Rock Creek at the 10 Road. The proposed project will
introduce at least 50 LWD pieces into Rock Creek using a hand cable system to move logs up to
24 inches in diameter and 40 feet long into a 300 feet reach of Rock Creek 300 feet upstream of
the 10 road crossing. LWD pieces will also be placed in the floodplain to address channel
migration issues and riparian restoration objectives.
18
Financial Summary
The HCP commits funding of $118,000 (in 2003 dollars) for HCP years 1- 8. Approximately
$22,712 was spent in 2003 completing two projects.
Large Woody Debris Replacement
HCP work
HCP Cost
Commitment
Commitment in 2003
dollars
1.6 projects per year
$14,750 per year
(average)
(average)
HCP work
Commitment,
completed in 2002
No projects were
completed this year
under the HCP, but 2
projects were
completed as part of
the BPA project and
considerable work
was done developing
GMU framework and
inventory for planning
restoration
HCP Cost
Commitment, spent in
2003
$22,712
19
HCP Program Category: Streambank Stabilization (C100017)
HCP Program Element: Stream and Riparian Restoration
Contact: Dave Beedle, Senior Watershed Hydrologist, Watershed Management Division
Goals and Objectives
The objective of this element is to minimize excessive rate of streambank erosion caused by
forest roads and land management activities. The goal is to improve storm water quality and
reduce the magnitude and frequency of disturbance to fish habitat from sediment inputs and
bedload movement.
Status of Work (2003)
Year 2003 was used to develop a system to identify and prioritize aquatic restoration sites and
develop a watershed specific in-stream habitat inventory system. The aquatic restoration system
developed within the CRW was based on GMUs (Geomorphic Map Units). The system allows
the City to achieve the following: 1) identify key watershed processes (hillslope and fluvial) for
each GMU which most strongly control/influence the characteristics of the GMU; 2) determine
(to the extent possible) the range of variability of these key attributes for each GMU; and 3) use
current and historic information to assess the primary threats which jeopardize the short and long
–term integrity of these GMUs. The stream inventory methodologies was modified from the U.
S. Forest Service Level 2 Stream Inventory Handbook. The modifications were conducted to
make the inventory system more useful as a tool to identify and prioritize aquatic, riparian, and
road restoration projects. The development of the stream inventory methodologies was funded
through the Culvert Replacement for Fish Passage project (C100016). One of the primary uses of
the inventory will be to identify and determine the quality of habitat upstream of culverts that
potentially block upstream fish passage. The modified stream inventory methodologies were also
used in 2004 to verify and refine the GMU system and identify and prioritize near-term projects
within the Rack and William creek basins.
Specific projects in 2003 consisted of removing poorly designed or failed stream drainage
structures and redesigning the channel to provide long-term stability for approximately 100 linear
feet of stream during road abandonment projects. Survey and preliminary design was completed
in Rock Creek along the 200 road to reduce sedimentation into bull trout spawning areas. Year
2002 was also devoted to creating a strategic plan with consultants to develop a system (rationale)
for identifying and prioritizing locations for aquatic restoration
Looking Ahead (Planned 2004 Accomplishments)
Proposed 2004 work will include Rack Creek downstream of the 200 Road and/or channel
stabilization through drainage structure removal during road abandonment. The exact sections of
streams to be stabilized during road abandonment will depend on the projected cost of the work
and will be determined by the final design of the projects
Financial Summary
The HCP commits funding of $186,440 (in 2003 dollars) for HCP years 1-8. Approximately
$25,174 was spent in 2003
20
Streambank Stabilization
HCP work
HCP Cost
Commitment
Commitment in 2003
dollars
197 feet per year
$23,305 per year
(average)
(average)
HCP work
Commitment,
completed in 2002
Stream and Riparian
consultant, stream
crossing work during
road abandonment,
and design survey
HCP Cost
Commitment, spent in
2003
$25,174
21
HCP Program Element: Streambank Revegetation (C100022)
HCP Program Category: Stream and Riparian Restoration
Contact: Dave Beedle, Senior Watershed Hydrologist, Watershed Management Division
Goals and Objectives
The objective of this element is to revegetate streambanks where past upstream or upslope
activities have altered the riparian vegetation to the point where excessive streambank erosion is
occurring and channel stability has been reduced. The goal is to help restore ecological functions
by recovery of vegetation characteristics. This will improve storm water quality and reduced
magnitude and frequency of disturbance to fish habitat from sediment inputs and bedload
movement.
Status of Work (2003)
The work in year 2003 was anticipated to “catch up” on HCP commitments for this project. 2003
involved planting stream crossings in past road abandonment project areas. Streambank restoration
occurred on the 13, 64.1, 64.2, 64.4, and 126 roads. A total of approximately 1,950 linear feet
(18,800 square feet) were planted with 721 native shrubs and trees. Planting was accomplished
using SPU staff, Earthcorp, and volunteers. Year 2003 was also devoted to creating a strategic plan
with consultants to develop a system (rationale) for identifying and prioritizing locations for
aquatic restoration.
Looking Ahead (Planned 2004 Accomplishments)
Streambanks with high impacts to the aquatic system will be planted in 2004. The projects will
provide vegetative stability to redesigned channels to provide long-term stability at several road
abandonment locations. The exact sections of streams to be stabilized will depend on the projected
cost of the work and will be determined by the final design of the projects.
Financial Summary
The HCP commits funding of $62,540 for HCP years 1-8 (in 2003 dollars). $32,301 was spent in
2003 for streambank restoration.
Streambank Revegetation
HCP work
HCP Cost
Commitment
Commitment in 2003
dollars
331 feet per year
$7,818 per year
(average)
(average)
22
HCP work
Commitment,
completed in 2003
Approximately 1,950
linear feet (18,800
square feet) with 721
native shrubs and
trees
HCP Cost
Commitment, spent in
2003
$32,301
HCP Program Element: Riparian Conifer Underplanting (C100018)
HCP Program Category: Stream and Riparian Restoration
Contact: Amy LaBarge, Senior Forest Ecologist, Watershed Management Division
Objectives & Go als
The objective of this element is to plant and reestablish conifers near streams and in forested areas
around wetlands, ponds, and other non-forested aquatic habitats that were converted to hardwoods
as a result of past land management activities. This conifer establishment will help accelerate the
restoration of diverse and structurally complex riparian stands within the watershed and promote
biodiversity in areas that were disturbed by early timber harvest activities.
Status of Work ( 2003)
In 2003, two riparian planting projects were implemented along the main stem of Taylor Creek in
the lower Cedar River Watershed. These projects were installed in areas that were dominated by
red alder overstory with a salmon berry understory. Watershed management division staff planned,
designed and implemented the planting projects, and volunteers assisted with the site preparation
and planting. A combination of western hemlock, western redcedar, and Sitka spruce seedlings
were planted in five different areas (four at Site 1 and one at Site 3). Approximately 500 linear feet
of riparian area was affected by these riparian planting projects. Riparian vegetation monitoring,
including follow-up monitoring at Webster Creek, Shotgun Creek and Lost Creek, was also
accomplished to track the success of these past riparian conifer planting projects. Consultant work
was performed on remote sensing image data that will differentiate forest overstory, which will be
helpful in long-term planning of riparian restoration activities.
Looking Ahead (Planned 2004 Accomplishments)
In 2004, a riparian planting project will occur along Rock Creek, in conjunction with a Large
Woody Debris Placement project. This planting will occur over approximately 800 linear feet of
Rock Creek north of the 10 Road in the lower Cedar River Watershed. This area currently hosts an
overstory of red alder and an understory of salmon berry.
Longer-term site selection and prioritization of areas to be planted will also occur during 2004
through the interdisciplinary team process. To inform future work, monitoring data will continue
to be collected and analyzed that will allow us to assess planting methods, seedling survival, and
variety of techniques used in riparian underplanting projects.
Financial Summary
The HCP commits funding of $59.100 for HCP years 1-8 (in 2003 dollars), with an average of
$7,395 per year. In 2003, $12,257 was expended for plant materials, consultants, and staff time
during planting projects, monitoring, and image data analysis. Volunteer time spent on planting
projects was additional cost commitment work with no associated cost to the City.
23
HCP Program Element: Riparian Restoration Thinning (C100020)
HCP Program Category: Stream and Riparian Restoration
Contacts: Amy LaBarge, Senior Forest Ecologist, Watershed Management Division
Objectives & Goals
The objective of this element is to conduct restoration thinning (in forests under 30 years old) and
ecological thinning (in forests over 30 years old) within previously disturbed riparian zones of
streams, open water bodies, and wetlands. Riparian thinning will accelerate the growth and
structural development of trees, provide greater protection for streams and eventually develop
forest structure, composition, and diversity characteristics similar to the natural mature riparian
conifer forest originally on the site. Thinning is focused on stands with high tree density and
involves cutting trees to a desired spacing to promote more rapid tree growth, improve current
habitat, and accelerate the development of older forest characteristics. Thinning in riparian areas
also focuses on retaining high tree species diversity, including conifer and hardwood trees and
shrubs. In the long-term, riparian thinning will benefit adjacent aquatic ecosystems by contributing
shade, large woody debris, stream bank stability, and nutrients.
Status of Work (2003)
In 2003, the Selleck riparian restoration thinning project was completed, and the remaining 11
acres were thinned along an unnamed creek in the lower watershed to improve remaining tree
growth and riparian plant species diversity. Restoration thinning contractors implemented this
project, and staff conducted compliance monitoring concurrently. Additionally, approximately
three acres of dense grand fir were thinned along the main stem of Taylor Creek in the lower
watershed. Lastly, approximately 7 acres of riparian restoration thinning occurred in the upper
watershed in conjunction with upland restoration thinning.
In 2003, interdisciplinary planning efforts continued to develop a project site selection and
prioritization strategy for riparian thinning projects through year 2016. Consultant work was
performed on remote sensing image data that will differentiate forest overstory, which will be
helpful in long-term planning of riparian restoration activities. Consultant input was also received
on riparian thinning strategies.
Looking Ahead (Planned 2004 Accomplishments)
In 2004, three types of riparian thinning projects will occur. First, there will be a small riparian
ecological thinning project along Shotgun Creek, wherein snags will be created in order to kill a
portion of the overstory trees. No trees will be removed from the site. Second, approximately 350
acres adja cent to Seattle Creek will be thinned under the upland restoration thinning program;
much of this acreage is young riparian forest. Third, two other areas in the upper watershed will
undergo upland restoration thinning in which substantial streams occur. The riparian forest in these
two thinning areas will be treated different from the remaining uplands. Additionally, strategic
planning will continue to select and prioritize sites for both riparian restoration thinning and
riparian ecological thinning in the watershed through 2016.
Financial Summary
The HCP commits funding of $52,240 for HCP years 1-8 (in 2002 dollars), with an average of
$6,530 per year. A total of $12,209 was expended for contractors, consultants, and staff time to
implement thinning and conduct associated monitoring and long-term planning.
24
HCP Program Element: Stream Crossings for Peak Flows (C100016)
HCP Program Category: Watershed Management, Stream and Riparian Restoration
Contact: Marti Spencer, Watershed Engineering Supervisor, Watershed Management Division
Objectives and Goals
Stream crossing projects in this category are designed to improve drainage patterns that have been
altered by roads, to minimize sediment delivery to streams and to achieve channel stability at that
particular site. There are approximately 1,300 stream crossing structures on non-fish-bearing
streams in the Cedar River Municipal Watershed. Many of these crossing structures need to be
upgraded in size or an alignment correction made, except where the road is deconstructed, which
includes culvert removal. A few crossings, depending on other site-specific conditions, will need
more expensive repairs or modifications.
Status of Work (2003)
In 2003, improvements for passage of peak flows were completed on stream crossings in the
following areas: 60 Road (6 crossings), 64 Road (6 crossings), and 70 Road (6 crossings).
Crossings were designed for each specific crossing to convey a 100-year peak flow and associated
sediment or debris. Staff hydrologists determined the design flow using USGS regional equations
and/or other methodologies (e.g., Washington DNR). The stream channels were also analyzed for
stability and debris loading before a culvert size was determined. These 18 stream crossing
upgrades and culvert upsizing were selected to reduce the environmental impacts due to restricting
peak flows and reduce road sediment delivery to streams.
Looking Ahead (Planned 2004 Accomplishments)
In 2004, we plan to upgrade crossing structures at the following locations: Cabin Creek at the 200
road, Eagle Ridge Creek at the 100-300 road, Williams Creek tributary along the 30 road, and
various smaller unnamed tributaries throughout the watershed.
Financial Summary
The HCP commits funding of $147,500 for HCP years 1-8 (in 2003 dollars). $16,957 for labor,
equipment, materials, and related expenses was spent in year 2003 for stream crossings for peak
flows.
Stream Crossings for Peak Flows
HCP work
HCP Cost
Commitment
Commitment in 2003
dollars
Improve drainage
$18,438 per year
patterns
(average)
HCP work
Commitment,
completed in 2003
18 crossing locations
HCP Cost
Commitment, spent in
2003
$16,957
25
HCP Program Element: Stream Crossings for Fish Passage (C100021)
HCP Program Category: Watershed Management, Stream and Riparian Restoration
Contact: Marti Spencer, Watershed Engineering Supervisor, Watershed Management Division
Objectives and Goals
Stream crossing improvements in this category are designed, when both economically and
technically feasible , to reestablish fish passage at locations where forest road crossings interrupt
connectivity of significant habitat reaches for either anadromous or resident fish. One of the most
cost-effective strategies for increasing and/or improving fish habitat can be to restore access to
potential habitat by upgrading, replacing or removing blocking culverts on fish-bearing streams.
Removal of artificial migration barriers can restore biological connections between upstream and
downstream populations and/or make unoccupied habitat available for recolonization. Fish
populations can potentially increase when access to spawning and rearing habitat is restored.
Status of Work (2003)
In 2003 we removed a fish barrier on a tributary to Williams Creek at the 13 Road. At this location
the crossing was completely removed and the stream channel redesigned to accommodate fish
passage. The crossing was constructed with footings for a temporary bridge in case there may be a
need to access this area for future stream restoration projects in Williams Creek. The ½ mile of the
13 Road on the far side of this crossing was abandoned to minimize any impacts to Williams Creek
and facilitate the removal of the crossing without having to maintain the road on the far side. We
also purchased a crossing structure for the 19 Road project for a tributary to Carey Creek, but
delayed construction until 2004 because City resources were being used for the BPA powerline
project. This 19 Road project is planned to be installed during the 2004 construction season. City
staff hydrologists determined the design flow using USGS regional equations and/or other
methodologies (e.g., Washington DNR). The stream channels were also analyzed for stability and
debris loading before a culvert size was determined.
Looking Ahead (Planned 2004 Accomplishments)
In 2004, we plan to complete the 19 Road project, as described above, on a tributary to Carey
Creek by installing an open-bottomed arch; to install a new crossing structure over the tributary to
Bear Creek on the 600 Road; and to achieve a fish-passable structure where the Taylor Siphon
crosses Webster Creek.
Financial Summary
The HCP commits funding of $1,132,800 for HCP years 1-8 (in 2003 dollars). $134,214 for labor,
equipment, materials, and related expenses was spent in year 2003 for stream crossings for fish
passage.
Stream Crossings for Fish Passage
HCP work
HCP Cost
Commitment
Commitment in 2003
dollars
Removal of road
$141,600 per year
barriers to fish
(average)
movement
26
HCP work
Commitment,
completed in 2003
1 project and purchase
of one crossing
structure
HCP Cost
Commitment, spent in
2003
$134,214
HCP Program Element: Upland Restoration Thinning (C100024)
HCP Program Category: Upland Forest Restoration
Contacts: Amy LaBarge, Senior Forest Ecologist, Watershed Management Division
Objectives & Goals
The objective of this element is to use thinning in young upland forests (generally less than 30
years old) to accelerate development of late-successional and old-growth forest condit ions, to
develop habitat that supports diverse native wildlife, and to reduce the chance of catastrophic
damage to the forest through wildfire, insect outbreak or disease. These young forests have
developed as a direct result of commercial timber harvest that occurred within the watershed during
the past several decades. They often have a very high density of trees that results in intense
competition for light, water, and nutrients. Restoration thinning involves cutting trees to a desired
spacing to promote more rapid tree growth, improve current habitat, and accelerate the
development of older forest characteristics. Because the relative value of restoration thinning
diminishes as a stand ages, efforts in HCP years 1-16 will focus on thinning large areas of very
high tree density.
Status of Work (2003)
In 2003, approximately 1,200 acres were restoration thinned, well in excess of the 800-acre annual
target. The target was exceeded because the cost per acre was less than anticipated, and more
restoration thinning areas have been identified than can be accomplished at the HCP estimated
annual acreage level in 16 years. In 2003, restoration thinning was focused in the upper watershed,
which is dominated by the Pacific silver fir forest type. These forests grow more slowly than
Douglas-fir forests in the lower watershed, so the age at which restoration thinning is appropriate
may be older than 30 years. Staff designed restoration thinning unit locations and boundaries
through a landscape analysis approach, and units included young forest of different ages and
species compositions. The restoration thinning prescriptions were developed by an interdisciplinary
team and were designed to leave existing large trees and retain diverse species. Three different
treatments were applied in 2003. Effectiveness monitoring occurred in each of the treatment types
to provide baseline data for future monitoring and adaptive management. Compliance monitoring
was conducted concurrently with the thinning implementation. Pla nning occurred for 2004
restoration thinning sites, including the preparation of a site-specific restoration thinning
management plan. Surveying was performed to identify and mark City ownership boundaries for
2003 restoration thinning work.
Looking Ahead (Planned 2004 Accomplishments)
Approximately 650 acres will be thinned in 2004. Three types of prescriptions will be
implemented on young forests in the upper watershed. Compliance monitoring will be conducted
while the thinning is implemented. Effectiveness monitoring activities will document forest stand
characteristics before and after thinning to establish baseline information for future effectiveness
monitoring and adaptive management. Planning for 2005 restoration thinning areas will continue.
The program manager and the interdisciplinary team will continue consulting with experts on forest
restoration to develop the most effective approaches to young forest thinning to accomplish HCP
objectives. Computer growth models will also be used to investigate different approaches and their
outcomes. Additionally, strategic planning will continue to select and prioritize sites for restoration
thinning in the watershed.
27
Financial Summary
The HCP commits funding of $1,909,580 for HCP years 1-8 (in 2003 dollars), with an average of
$238,698 per year. A total of $194,732 was expended in 2003, including restoration thinning
contractors, surveyors, and compliance monitoring by staff.
28
HCP Program Element: Upland Ecological Thinning (C100027)
HCP Program Category: Upland Forest Restoration
Contact: Amy LaBarge, Senior Forest Ecologist, Watershed Management Division
Objectives & Goals
The objectives of this element are to use ecological thinning in forests greater than 30 years old to
accelerate the development of characteristics associated with older forests, increase biological
diversity, facilitate ecosystem function, and reduce the risk of catastrophic events, such as wildfire,
insect outbreak or disease. Ecological thinning may use a variety of silvicultural techniques,
including variable density thinning and gap and snag creation, and it is focused on stands with
relatively high tree density and little structural complexity. Thinning will remove trees to create
variable spacing in the remaining forest, retain and develop large trees and trees of varied height
and diameter, increase species diversity, and encourage structural complexity. The HCP provides
that trees can be removed from an ecological thinning site after the ecological objectives have been
met. These surplus trees may be sold under ordinance authority.
Status of Work (2003)
The 45 Road Forest Restoration Project, the first ecological thinning project to be implemented
under the HCP, was completed in fall of 2003. This ecological thinning project aimed to accelerate
the development of forest structure and habitat typical of old-growth stands, and it implemented
variable density thinning, left the largest conifer trees, all hardwood trees and less prevalent conifer
trees, all snags given safety considerations, and created down logs by cutting trees. An area of
approximately 157 acres was thinned on the project site. The trees that remained after thinning
now have more growing space and will therefore maintain or accelerate growth. Pre-treatment
effectiveness monitoring was completed before implementation, while compliance monitoring
occurred concurrently with implementation. The project area was planted under the Upland
Restoration Planting program, which will further increase the species diversity and structural
complexity of the site.
An interdisciplinary project team continued planning the 700 Road Forest Restoration Project,
developed ecological objectives, and formulated silvicultural prescriptions for the project area. A
draft management plan was produced and sent out to experts for review. Treatment area
boundaries were marked, engineering assessments were completed, and a cultural resource survey
was completed. In addition, consultants inventoried future potential ecological thinning areas in
the lower watershed. Strategic planning progressed to select and prioritize sites for ecological
thinning in the watershed.
Looking Ahead (Planned 2004 Accomplishments)
Public outreach and education will occur in summer 2004 to discuss questions and address
concerns regarding the ecological thinning program with members of the environmental
community. The City ordinance needed for the 700 Road Forest Restoration Project will be sought
in fall 2004. Subsequently, a contract for implementation will be advertised and awarded. The
project is planned for implementation in 2005.
Scoping and planning with occur for future potential ecological thinning project areas. Landscape
scale planning will continue in an effort to select and prioritize sites to optimize ecological thinning
for forest ecosystem function, wildlife habitat improvement and biodiversity.
29
Financial Summary
The HCP commits funding of $295,810 for HCP years 1-8 (in 2003 dollars), with an average of
$36,976 per year. A total of $14,475 was expended in 2003 for compliance monitoring and
engineering consulting on the 45 Road Forest Restoration project and for project layout on the 700
Road Forest Restoration Project. A cultural resource survey conducted on the 700 Road project
was funded using revenues from the 45 Road project.
30
HCP Program Element: Upland Restoration Planting (C100025)
HCP Program Category: Upland Forest Restoration
Contact: Amy LaBarge, Senior Forest Ecologist, Watershed Management Division
Objectives & Goals
The objective of this element is to restore the species diversity and ecological complexity through
restoration planting in upland forest ecosystems. Restoration planting will benefit forest biological
diversity by increasing plant community diversity to a level similar found in naturally regenerated
forests on comparable sites. For example, enhancing the hardwood component in forests currently
dominated by conifer trees will increase stand structural complexity and support more diverse
wildlife and epiphytic plant species. Planting may include trees, shrubs, and forbs, as well as flora
such as lichens and mosses. Projects will be monitored, data analyzed and techniques changed to
increase understanding of how desired effects can be achieved.
Status of Work ( 2003)
Sixty-four acres were planted with diverse conifer and shrub species as part of the 45 Road Forest
Restoration project in fall 2003. The planting areas were prepared by a contractor using a
rototiller, head-mounted on a tracked machine. Western redcedar, big leaf maple, and red alder
were planted with teams of volunteers and staff.
The survey of young, poorly stocked forest areas in the watershed yielded no sites where conifer
trees are needed for upland restoration planting. An assessment of techniques for planting nontraditional flora, such as cryptogams (mosses, liverworts, etc.), orchids, mistletoe, and heart rot
fungi was initiated and a strategic plan addressing these techniques and their application in the
watershed is in progress. A small amount of consulting work occurred, which will help in site
selection and prioritization of upland restoration planting sites.
Looking Ahead (Planned 2004 Accomplishments)
Plans for planting trees, shrubs, and nonvascular flora will be developed conjunction with the 700
Road Ecological Thinning project. Upland restoration planting projects will often be integrated
with other HCP projects, such as ecological thinning. Volunteer groups may be used to a
substantial extent for upland restoration planting projects and data collection. Strategic planning
will continue to select and prioritize sites for upland restoration planting in the watershed, assess
the presence and diversity of various nonvascular and rare plant species in the forest ecosystem,
and experiment with planting these nonvascular and rare species to increase ecosystem function
and biodiversity.
Financial Summary
The HCP commits funding of $88,750 for HCP years 1-8 (in 2003 dollars), with an average of
$11,094 per year. Approximately $19,227 was spent on plant materials, site preparation, and
consulting work. .
31
HCP Program Element: Common Loon Monitoring (N541811)
HCP Program Category: Watershed Aquatic Monitoring and Research
Contact: Dwayne Paige, Senior Watershed Ecologist, Watershed Management Division
Objectives and Goals
Document the reproductive success of common loons nesting within the Cedar River Watershed,
especially those utilizing habitat in the Chester Morse Lake/Masonry Pool complex, and provide
alternative nest sites through the deployment of artificial nest platforms at appropriate selected
location(s) and under appropriate environmental circumstances.
Status of Work (2003)
Although common loons use many lakes in Washington as foraging and resting habitat, often
tolerating high levels of human activity, only 10-12 of these lakes are currently known to have
supported active nesting in any given year or on a regular basis at any time during the last decade.
Nesting habitat and structures are potentially available in willow-dominated zones of the Cedar and
Rex River deltas and in specific small areas of Masonry Pool. This nesting habitat, however, is
currently subject to springtime water level fluctuations over the course of the nesting season (April
through mid-June) of up to 10 feet or more under the present reservoir operating regime.
Relatively little is known about the historic presence or reproductive success of common loons
within the Cedar River Watershed prior to the last 20-25 years. Despite the lack of information
before that period, a general knowledge does exist of (1) the historic uses of the watershed, (2) the
major habitat changes through time, and (3) the degree of protection that has been afforded Chester
Morse Lake over the last 100 years. We can reasonably assume that loons have nested on the
shores of the Chester Morse Lake reservoir for many decades and probably on the original natural
lake (Cedar Lake) for hundreds of years. In the period of the mid-1970s to late-1980s, loons were
frequently sighted on Chester Morse Lake, and young chicks were observed by City staff on the
Masonry Pool at least once in each of the years 1979, 1982, and 1988.
In order to reduce adverse effects of reservoir fluctuations on nesting loons, since 1990 the City has
been conducting an experimental nest platform program in which artificial floating platforms with
native vegetation are deployed at the beginning of the loon nesting season, or when reservoir water
levels allow, to provide more stable nest sites. Although the platforms are not sufficient to
counteract the effects of reservoir fluctuations of more than about 5-8 feet, such as occur during a
prolonged, early season drought, this program has demonstrated some success. Platforms have
been used by nesting loons in at least one, and typically two, of the three nesting territories on the
reservoir complex in each of the 14 project years during the period 1990-2003; a platform has been
used in 13 consecutive years in one territory; and a platform has been used in 10 of 14 years in a
second territory. Of 31 nests on the reservoir during the period 1990-2003, 23 (74 percent) have
been on platforms. Of the 32 chicks produced during this period, 7 chicks hatched on natural nests
and 26 chicks (81 percent) hatched on the platform nests.
Monitoring during four common loon nesting seasons (2000, 2001, 2002, 2003) since
implementation of the HCP has extended the long-term data record of loon reproduction on the
Chester Morse Lake/Masonry Pool complex with somewhat atypical results. In 2000, two of the
three pairs in the system nested on experimental platforms, the third pair did not nest. One
platform nest produced two chicks. The other platform nest was lost early to a predator or
scavenger, but the re-nesting effort of this pair on a natural nest site produced a single chick.
Although disappointing, observations during 2001 documented the first year within the last decade
in which no loon chicks were produced in the watershed. This result was significant in that,
although nesting conditions in the watershed (e.g., lake levels) were apparently normal, none of the
32
three pairs nested successfully. The only nesting attempt was on a platform nest that was lost to a
predator or scavenger early in the nesting period as in the previous year; however, no re-nest was
established in this case.
Observations of loon nesting activity during 2002 regrettably documented the second year within
the last decade, and the second year in succession, in whic h no loon chicks were produced in the
watershed. Although one loon pair attempted to nest on an artificial platform, the level of
harassment by bald eagles at the platform site was apparently pervasive enough to cause nest
abandonment, and no evidence of re-nesting was observed. Although present within their
traditional ‘territories’ on Chester Morse Lake and the Masonry Pool and initially exhibiting
behavior indicative of searching for nest sites, there was no definitive indication that the other two
loon pairs established nests. As in 2001, the lack of chick production was significant in that,
although nesting conditions in the watershed (e.g., lake levels) were apparently normal, none of the
three pairs nested successfully. The lack of common loon reproductive success documented in the
Cedar River Municipal Watershed in both 2001 and 2002 was not inconsistent with overall results
throughout western Washington, which may suggest a regional, rather than local environmental
influence on nesting success during these years. Harassment of nesting loons at and in close
proximity to nest sites, however, has been observed more frequently during the last several years
on the Chester Morse Lake/Masonry Pool complex, as well as at other nest sites in Washington,
and may become more of a threat to the nesting success of common loons in the future than has
apparently been the case during the previous decade of research and monitoring.
Artificial nest platforms were deployed in each of the three traditional loon nesting ‘territories’ in
spring 2003 as reservoir levels reached appropriate potential nest sites. Subsequent monitoring of
loon behavior patterns, habitat use, and nesting activity during the spring/summer period
documented the first successful nest in the last three years within the watershed. This nest was
located on an artificial nest platform and produced one chick that survived to fledging. Although
present within their traditional ‘territories’ on Chester Morse Lake and the Masonry Pool, and
initially exhibiting behavior indicative of searching for nest sites, there was no definitive indication
that the other two loon pairs established nests.
Harassment of nesting loons by both adult and juvenile bald eagles at and in close proximity to nest
sites has been observed more frequently during the last several years (i.e., 2000-02) on the Chester
Morse Lake/Masonry Pool reservoir complex, as well as at other nest sites in Washington than
previously reported. This type of harassment has apparently been pervasive enough to cause nest
abandonment in some cases (2000-01 in CRW; 2001 in Tolt). If it has occurred particularly late in
the season, no evidence of re-nesting has been observed. Because of the potential for continued
increases in the level of harassment of nesting adults and scavenging of loon eggs by bald eagles,
experimental modifications were made to several artificial nest platforms in both the South Fork
Tolt and Cedar River watersheds in an attempt to reduce the risk, and, if possible, avoid adverse
effects of bald eagles on nesting loons.
An open, dome-shaped, arching frame of plastic pipe (one pipe from three of the four platform
sides joined in the center) was attached to platforms previously used by nesting loons where
harassment had been observed or highly suspected (all unsuccessful nests). Sparse vegetation was
then attached to the pipe to create the visual effect of ‘cover’ above the platform deck (and
incubating loon on the nest). The non-rigid, ‘flimsy’ pipe frame was intended to serve as a
deterrence to eagle(s) trying to land directly on the platform, or to perch on the frame itself. The
vegetation was not intended to totally hide the bird on the platform, but merely to possibly
complement the bird’s cryptic coloration. Also, any structure added to the previously successful
platform design should not restrict the bird’s view from the platform deck.
Experimental modification of the successful platform design had several risks associated with it
and several relevant outcomes were highly possible: 1) loons would be ‘frightened’ by the
33
pipe/vegetation frame and not use the platforms; 2) loons would nest on the platforms, but eagles
would not be deterred; or 3) loons would nest on the platforms, eagles would be deterred, and nests
would be successful.
Initial results of the platform modification experiment were somewhat promising. A total of three
platforms were modified (Tolt–1; Cedar–2) in 2003. Loons nested on two of the three modified
platforms and both were successful in hatching chicks (Tolt-2; Cedar-1). The pair in the third
territory did not nest in 2003 and had not nested for several years. The only successful nests in
either watershed were those that had been modified. One conclusion from this experiment is that
the modification did not prevent loons from using artificial platforms and nesting successfully.
Also, an initial indication is that the modification may deter eagles from adversely affecting nesting
loons on platforms in the short-term, but continued monitoring in successive years will be needed
to determine if such modification is a long-term ‘fix’ to eagle harassment at loon nest platform
sites.
The importance of the Cedar River Watershed as habitat for common loons takes on added
significance when considered in a regional or statewide context, as the three pairs of common loons
that typically nest in the municipal watershed have constituted more than one-quarter of the loons
nesting in Washington State in many recent years. The production of fledglings from the
watershed has, in many years, constituted an even larger fraction of the fledged loons produced in
the state, likely as a result of the degree of security within the watershed compared to the high
levels of human disturbance to nesting loons on lakes open to the public. As population growth
and development pressure from the Seattle/Tacoma metropolitan area continue to diminish the
quantity of loon habitat (through housing development around lake and reservoir shorelines) and
the quality of habitat (through increasing recreational boat use of lakes and reservoirs, and through
sediment input), the availability of undisturbed habitat in the municipal watershed will play an
increasingly critical role in maintaining the viability of populations of common loons that nest in
the Puget Trough and the western Washington Cascades.
Looking Ahead (Planned 2004 Accomplishments)
Staff will continue to monitor common loon reproductive activity and will deploy experimental
nest platforms (as long as monitoring continues to document the efficacy of the program) during
2004 on the Chester Morse Lake/Masonry Pool complex.
Financial Summary
The HCP commits funding of $29,500 for HCP years 1-10 (in 2003 dollars), with an average of
$2,950 per year. A total of $4,500 was expended for cost commitments in year 2003.
34
HCP Program Elements: Bull Trout Spawning Surveys (N541805)
Bull Trout Fry/Juvenile Surveys (N541806)
Bull Trout Stream Distribution Surveys (N541809)
Bull Trout Surveys (adult/weir) (N541804)
Bull Trout Redd Inundation Study (N541810)
Bull Trout Stream Telemetry Studies (N541807)
Bull Trout Lake Telemetry Studies (N541808)
HCP Program Category: Watershed Aquatic Monitoring and Research
Contact: Dwayne Paige, Senior Watershed Ecologist, Watershed Management Division
Objectives and Goals
Document the overall distribution of bull trout spawning habitat within the Cedar River Watershed
(CRW) and monitor long-term trends in the annual level of spawning activity in “core” spawning
habitat as an index of the status of the adfluvial bull trout population in the Chester Morse Lake
drainage basin.
Document the basic behavior patterns of bull trout fry (e.g., emergence/outmigration timing),
evaluate spring “fry counts” as a potential index of the adfluvial bull trout population and habitat
use, and determine the distribution of juvenile rearing habitat within the CRW.
Document the overall extent and distribution of major stream and tributary habitat used by bull
trout (all life history stages/forms) within the CRW in order to facilitate development of the most
effective management prescriptions for protection and/or enhancement of bull trout habitat under
conservation and mitigation strategies of the HCP.
Status of Work (2003)
Bull trout spawning surveys
Numbers of bull trout redds located during recent years have varied widely as a result of natural
bull trout behavior, stream flow conditions (i.e., high flows), and staff time available to conduct
surveys. During the 2000 season, however, relatively low river flow conditions were ideal for
conducting spawning surveys, and additional HCP staff was available to conduct more intensive
surveys. A conservative total of 236 redds were observed within the Chester Morse Lake drainage
basin, which was more than double the previous high count of 111 redds. In the 2001 season, staff
again observed a conservative total of 236 redds within the Chester Morse Lake drainage basin.
Based on information from other studies, the number of bull trout redds observed in two
consecutive seasons appear to fall well within the range of numbers of redds that would be
predicted for a viable, adfluvial bull trout population of this size. Spawning activity was also
observed in some side-channel reaches where spawning activity had not previously been
documented. Also, the spawning season in 2001 extended into mid-January, approximately four
weeks longer than previously documented, and a similar pattern was observed in 2002.
Data collected by Fish and Wildlife Unit staff indicate that the adfluvial bull trout population
present in Chester Morse Lake spawned in record numbers in ‘core’ spawning reaches of major
lake tributaries during fall/early winter (September – January) of 2002-03. Despite experiencing
near record low flow levels in the Cedar River and other major spawning streams in the watershed,
as well as unusually low reservoir levels (i.e., ‘drought’ conditions) in Chester Morse Lake, bull
trout were able to pass potential barriers at the confluence with the lake and find adequate gravel
and flow conditions in traditional spawning reaches. The highest previous bull trout redd counts in
‘core’ spawning reaches prior to this season’s survey were 236 redds in both 2000 and 2001. This
number was more than doubled in 2002-03 with a count of 504 redds.
35
2003-04 data collected by biologists indicate that the adfluvial bull trout population present in
Chester Morse Lake spawned at a level similar to those documented in HCP years 1-3 (see above).
Surveys conducted in ‘core’ spawning reaches of major lake tributaries during fall/early winter
(September – January) of 2003-04 resulted in a total of a total of 258 redds recorded. This total is
very similar to the non-drought years of 2000 and 2001 when a total of 236 redds was recorded in
each year. Information of this type, collected over the long-term and under a variety of
environmental conditions, is necessary to understand habitat requirements of this ‘threatened’
species and to make informed management decisions in order to protect this ‘unique’ population of
bull trout and its habitat in the municipal watershed. Again, for the fourth year in succession, the
number of bull trout redds observed in 2003-04 falls well within the range of numbers of redds that
would be predicted for a viable, adfluvial bull trout population of this size.
Staff biologists also invested considerable effort to incorporate pre-HCP redd survey location data
into the current database format, perform QA/QC on the data entered, and link the database to the
Watershed Management Division GIS system to facilitate long-term trend and statistical analysis,
GIS mapping, and the development of other GIS-based materials. These tools will soon be used to
evaluate the technique relative to its potential as an index to bull trout population status in the lake,
whether it should be modified to be more effective and efficient as a monitoring technique, or
whether it should be replaced with other more effective methods in future years. Discussion(s) are
planned with the Services to present this information and address associated issues.
Bull trout fry and juvenile surveys
Two experimental techniques have been used to investigate the seasonal timing of bull trout fry
behavior and production in the Chester Morse Lake drainage basin. In the early 1990s, fyke nets
were deployed at selected locations on the mainstem Cedar and Rex rivers to determine seasonal
timing of fry movement and outmigration in mainstem reaches, indicating peak movement levels
from mid- to late April. During 2000, 2001, 2002, and 2003 periodic surveys (direct observation)
of bull trout fry have also been conducted in selected mainstem and side-channel reaches of the
Cedar and Rex rivers, as well as in selected tributary streams (e.g., Boulder, Cabin, Eagle Ridge,
and Morse creeks) to document habitat use and general fry behavior, and to identify general trends
in the relative number of bull trout fry present in the tributaries of Chester Morse Lake from year to
year. This technique is experimental at present and will be evaluated for possible use as an index
to monitor annual bull trout fry production under the HCP . The presence of fry was also observed
in some side-channel reaches where rearing activity had not previously been documented.
Observations of fry in some reaches also indicated earlier dates of emergence and movement in
streams than previously documented in this system.
Although a database of fry capture and observational data has been maintained, both prior to and
since implementation of the HCP, only basic, within year analyses were meaningful to perform.
As data are collected in successive years, however, it becomes more practical to perform more
extensive analyses of such data in terms of trends and relevance to variable environmental
conditions. As with the spawning survey database (see above) staff biologists also invested
considerable effort to incorporate pre-HCP and early HCP fry observation survey data, including
locations, into the current database format, perform QA/QC on the data entered, and link the
database to the Watershed Management Division GIS system to facilitate long-term trend and
statistical analysis, GIS mapping, and the development of other GIS-based materials. These tools
will soon be used to evaluate the technique relative to its potential as an index to bull trout
population status in the lake, whether it should be modified to be more effective and efficient as a
monitoring technique, or whether it should be replaced with other more effective methods in future
years. Discussion(s) are planned with the Services to present this information and address
associated issues.
36
Bull trout stream distribution
The Chester Morse Lake bull trout population was conservatively estimated to be approximately
3,100 fish, and general distribution within the lake was documented in 1995 (R2 Resource
Consultants, 2001). The full extent of the distribution of bull trout in tributary streams is currently
incomplete. The presence of bull trout has, however, been documented in the mainstem of the
Cedar River upstream from Chester Morse Lake, 0.7 mile into the North Fork to a natural barrier
(falls) and also 0.7 mile into the South Fork to a partial seasonal barrier. The presence of bull trout
has also been documented in Eagle Ridge Creek (a rearing area) and in several floodplain channels
in the Cedar drainage. In contrast to the rainbow trout distribution within the lake basin, bull trout
(or redds) have only been observed in three of the smaller tributaries to the reservoir complex (i.e.,
Rack Creek, Shotgun Creek, and Damburat Creek (single observation)). Bull trout have not yet
been found in certain major tributaries of the Cedar River including Bear Creek, which is
accessible and rainbow trout are present. Within the Rex River system, bull trout have been
observed upstream in the mainstem as far as the confluence of Lindsay Creek, in Boulder Creek
and Cabin Creek (spawning/rearing), and in Morse Creek and Lindsay Creek (rearing only).
Observations during 2000-02 (see above) increased the known distribution of spawning and rearing
habitat, but limited surveys in a few selected reaches did not extend the overall known range of bull
trout within the watershed.
Surveys in several streams during 2002 extended both the known range of bull trout presence and
life stage habitat use within the basin. The known presence and distribution of both bull trout
spawning and rearing habitat was extended in Rack Creek, a small tributary to Chester Morse Lake.
The overall distribution range and specific use of additional rearing habitat was also confirmed in
upper Boulder Creek and in a small side-channel of the mainstem Rex River. Surveys in selected
reaches of two other major tributary streams (South Fork Cedar and Bear Creek), thought to have
substantial habitat suitable for bull trout and previously surveyed, again failed to detect the
presence of bull trout.
No fieldwork relative to bull trout distribution was conducted during 2003 because of competing
non-HCP workload levels (BPA project construction). The efforts of staff biologists, however,
were focused on consolidating bull trout and other fish species information in consistent database
format(s) and making the overall fish distribution database more contiguous in order to facilitate
future analyses. Such analyses will be used to plan field survey work in 2004 intended to complete
the first phase of bull trout distribution surveys in the watershed.
Fish passage to reaches upstream of the lake perimeter forest road (200 Road) was restored at the
Shotgun Creek crossing during late summer 2001 by removal of perched culverts and replacement
with a pre-cast cement bridge. Installation of this structure provided potential access for both bull
trout and rainbow trout from Chester Morse Lake to upstream reaches that had been previously
inaccessible for decades. Initial monitoring to detect the presence of fish in newly accessible
reaches was conducted during summer/fall of 2002, but no re-colonization of upstream reaches was
detected. No monitoring for the presence/absence of fish was conducted in Shotgun Creek during
2003 because of competing non-HCP workload levels (e.g., BPA project construction). A major
factor affecting the rate of re-colonization of upstream reaches is the fact that the entire stream
reach from the confluence with Chester Morse Lake to the bridge typically exhibits subsurface
flow conditions on an annual basis. Upstream reaches, however, typically remain wetted with
moderate flow. The especially low flow and/or dry condition during 2002 may have severely
constrained the ability of either species to reach the newly accessible habitat. This constraint may
delay the re-colonization of upstream reaches for an undetermined period of time. Also, until fish
re-establish residency in upstream ‘refuge’ habitat not affected by annual subsurface flow
conditions, the presence and/or absence of fish in downstream reaches will presumably continue to
vary widely.
37
Several aspects of the Chester Morse Lake adfluvial bull trout population are ecologically ‘unique’,
especially its isolation from anadromous influence over a substantial expanse of recent geologic
time. As a result, the upper Cedar River Municipal Watershed (CRMW), encompassing critical
habitat for this population, has been designated as the ‘Chester Morse Lake Core Area’ in the first
draft of the Puget Sound chapter of the federal Recovery Plan for bull trout, soon to be submitted to
the USFWS Regional Office in Portland, OR, for review. Because of the degree and extent of
physical isolation of this population, the genetics of the population as a whole is of potential
regional and evolutionary significance. In addition, the potential for local populations to have
differentiated within the Cedar system also has implications from the perspectives of both reservoir
(i.e., water supply) and land management within the watershed.
As one component of ‘stream distribution’, in order to address the issue of genetic structure and
relationship of the Cedar population on both a local and regional basis, Fish and Wildlife Unit staff
collected tissue samples from juvenile bull trout in tributaries of Chester Morse Lake (e.g., Rack
Creek) and in the Cedar and Rex rivers and their tributaries (e.g., floodplain channels, Boulder
Creek, Cabin Creek) during summer 2002. These samples will be analyzed during 2003 in order to
develop a clear picture of bull trout genetics within the Cedar system and their potential
relationship to other bull trout populations on both regional and evolutionary scales.
Bull trout DNA analysis
Preliminary results of DNA analyses performed in 2003 on bull trout tissue samples collected
during 2002 corroborated the findings of a morphometric analysis of a sample of bull trout/Dolly
Varden individuals from Chester Morse Lake performed in the early 1990s, which classified the
population as ‘bull trout’ and not Dolly Varden. Additional analyses will be conducted to
determine if genetic differences exist between bull trout utilizing different tributaries within the
Chester Morse Lake drainage system. Results of this analysis are pending. This work was funded
from sources other than HCP cost-commitment funds.
Bull trout redd inundation study
The initial phase of the bull trout redd inundation study (i.e., stream topographic surveys) was
initiated in the Cedar and Rex rivers (core spawning habitat) during 2003 to provide information to
facilitate better evaluation of the potential risk of redd inundation during spring reservoir refill.
Field work for this project phase will be completed in 2004, data will be processed, and work
products will be developed to support planning of the second phase of the project (i.e., egg
mortality experiments). Preliminary scoping for the egg mortality phase of the project, including a
draft experimental design, was also completed during 2003. This phase of the inundation effects
project will be initiated in fall of 2004, and monitored through the spawning, incubation, and
emergence season in 2005. Current plans call for a second year of data collection in 2005-06.
Also, topographic surveys were completed in 2003 in an ‘historic’ reach of Boulder Creek
immediately upstream of its confluence with the Rex River to support evaluation of this reach as
potential spawning habitat for bull trout (out of the inundation zone), if flow were to be restored to
the reach (as a additional benefit to the drainage system under HCP stream restoration activities).
Bull trout adult surveys (weir)
A fish weir project was initially proposed as one potential method to obtain physical and behavioral
data on the adfluvial bull trout spawning population accessing habitat in the major tributaries of
Chester Morse Lake (Cedar and Rex rivers), as well as to efficiently support (e.g., fish capture)
other HCP monitoring and research projects, such as lake and stream telemetry and redd inundation
studies. At least two factors have recently come to light, that in combination, make it advisable to
at least temporarily delay and reevaluate the ecological risks (and logistic s) associated with this
project. First, observations in some bull trout populations (and other salmonids) have indicated
that weirs and/or the capture process may adversely affect aspects of natural bull trout spawning
behavior (e.g., upstream and/or downstream position of spawning).
38
The potential of interference from a weir may be of particular concern in a system, such as this one,
where the actual effect of spring inundation (a result of reservoir fill regimes) of bull trout redds
remains a question, and relative location of redds within the accessible reaches may be of potential
significance to annual reproductive success. Secondly, bull trout redd counts in these systems over
the last decade have been highly variable, as influenced by diverse environmental survey
conditions (e.g., peak stream flow events) and differing levels of survey effort, as well as the
natural variability of bull trout spawning behavior in these dynamic systems. The data collected in
the last four years, however, indicate spawning levels consistent with expectations for a population
of this size, providing a sufficient basis for making a decision regarding whether or not the weir
would be the best approach to use for developing an index for use in monitoring relative change in
population size over time. A decision on the status and/or modification of this project is pending.
Looking Ahead (Planned 2004 Accomplishments)
Staff biologists will continue to conduct surveys under each of these three bull trout monitoring
projects during 2004-05 with the intent of extending documentation of the overall range of bull
trout in the watershed, increasing knowledge relative to timing of bull trout life history stages and
behavior, and adding to current information on bull trout habitat use. The second phase of the redd
inundation study will be initiated. In addition, monitoring of the potential re-colonization of
upstream reaches of Shotgun Creek will be renewed and results of the final genetic analyses will be
completed. Also, as mentioned above, the City will try to reach agreement with the USFWS
regarding the best approach to developing an index for monitoring bull trout relative population
change over time, as was one intent of the weir proposal described above, and modify the project or
reapply funds to other HCP bull trout projects in 2004-05. The City plans to scope and design the
bull trout redd inundation study in 2003 and to implement initial steps during fall/winter 2003/4.
The City will also conduct topographical surveys in core spawning reaches of the Cedar and Rex
rivers to better evaluate the potential risk of inundation during spring reservoir refill.
Financial Summary
Year 3 Cost
Commitment
(2003 dollars
Bull Trout Spawning
Surveys (N541805)
Bull Trout
Fry/Juvenile Surveys
(N541806)
Bull Trout Stream
Distribution Surveys
(N541809) 1
Bull Trout Redd
Inundation Study
(N541810)
Year 3 Cost
Commitment
Work accomplished
Expenditures
(2003 dollars
)
$41,300
$39,724 Surveys completed. Cost includes
database maintenance/management,
and data analysis.
$41,300
$27,165 Surveys completed, continuing
evaluation of fry enumeration
methods and techniques. Expanded
range of known juvenile habitat.
Cost includes data
maintenance/management, and data
analysis.
$0
$3,655 No field surveys completed in 2003.
Cost includes database
maintenance/management, and data
analysis.
$64,900
$47,283 Channel topographic survey phase
of project initiated and to be
completed in 2004.
39
Bull Trout Steam
Telemetry Studies
(N541807)
Bull Trout Lake
Telemetry Studies
(N541808)
Bull Trout Surveys
(adult, weir)
(N541804)
40
$0
$0 Project deferred to 2005/2006.
$41,300
$0 Project deferred to 2007.
$59,000
$0 Continued discussion with USFWS
and evaluation regarding
appropriate methods and timing.
Plan to modify and/or transfer funds
to other bull trout project activities
in 2004-06.
HCP Program Element: HCP Program Element: Watershed Characterization--Includes
Assessment of Expanded Forest Stand Attributes (N541501), Assessment of Expanded Fo rest
Attributes (N541502), Augmentation of Forest Habitat Inventory (N541503), Long -term
Forest Habitat Inventory, Old-growth Classification, Field Verification (N541504, N541505),
and Forest Habitat Modeling (N541516)
HCP Program Category: Terrestrial Research and Monitoring
Contacts : Amy LaBarge, Senior Forest Ecologist, Dwayne Paige, Senior Watershed Ecologist, and
Duncan Munro, IT-Professional, Watershed Management Division
Objectives & Goals
The purpose of the watershed characterization project is to provide information to support the
following three major uses of that information under the HCP regarding management of the Cedar
River Municipal Watershed (CRW): (1) plan and prioritize habitat restoration projects to meet
HCP goals and objectives, (2) track changes in habitats over time, and (3) evaluate alternative
approaches for different kinds of restoration projects. This project encompasses the specific HCP
commitments listed in the title above, as well as the more general commitments to plan and
prioritize restoration activities on a landscape scale. Because existing forest inventory data and
remote sensing data that were used to develop the HCP are out-of-date and inaccurate, the funding
for the above-listed activities has been combined to provide comprehensive, current and useful
information to guide planning and monitoring efforts.
Status of Work (2003)
•
Completed the “interim landscape plan” for restoration projects: Mapped locations and
categories of restoration projects in the 2 – 5 year time frame, continued to develop models for
decision support based on landscape-level information products.
•
Watershed Characterization Interdisciplinary Team: This team has completed an options
analysis of the available methodologies for characterizing the CRW.
•
Established Permanent Sample Plots (PSPs): A total of 19 PSPs were established by staff in the
Summer and Fall of 2003 in old-growth forest habitat. An additional 18 were established by
staff and consultants in second growth forest in the lower elevations of the CRW during Winter
2003. A total of about 100 (or more) PSPs are planned.
•
Established Permanent Sample Reaches (PSRs): PSRs are an adaptation of the PSP concept to
serve our characterization needs in the Riparian Zone. A total of 31 PSRs were established at
15 locations by City staff, University of Washington staff, and volunteers in the summer and
fall of 2003. As many as about 60 PSRs may be installed at about 30 locations in key riparian
habitats.
•
Continued to integrate field inventory with remote sensing data: Reworking of existing
inventory data to test models of evaluation of stem density and canopy cover from MASTER
images (MASTER is a remote sensing data set with a 5-meter pixel resolution ad 50 spectral
bands). Continued integration of PSPs as a tool for accuracy assessment of map products
developed from MASTER images for upland forest habitats, and integration of PSRs as a tool
for verification of map products in riparian zones.
•
Documented completeness and quality of existing data that characterize the Cedar River
Watershed: Review of 1992 timber cruise data, 1974 Walker Survey data, and all existing data
sets that can inform upland forest restoration project site selection and prioritization.
41
•
Assessed expanded forest stand and forest attribute data: Conducted a comprehensive review of
1992-1993 forest inventory stand and attribute data and associated remote sensing data layers.
Worked with consultant to analyze forest attribute data. Produced draft report and began
evaluating findings. Determined that existing forest data is insufficient to meet upland forest
restoration project site selection and prioritization needs.
•
Continued acquisition, and analysis of remote sensing data sets: Developed maps of deciduous
vs. coniferous vegetation for CRW from MASTER data. Developed maps of vegetation classes
for CRW. Tested processing methods for mapping stem density and canopy closure from
MASTER and IKONOS images. Received first delivery of King County LiDAR products
acquired in 2003 (products include canopy surface, ground surface models, 5’ contours, shaded
relief images and suites of point used to construct surface models). (LiDAR is data are
produced from laser pulse returns from a fixed-wing aircraft.)
•
Conducted Forest Habitat Inventory: Forestry consultants cruised approximately 4,000 acres of
forest habitat in the lower watershed to provide baseline information for upland forest
restoration project planning. This information was also used to assess the effects of the
December 3rd windstorm, which felled about 14 million board feet of trees over an area of
about 6,000 acres.
Looking Ahead (Planned 2004 Accomplishments)
In 2004, we will continue to work on developing the most cost-effective and useful approach to
implementing watershed characterization. We will use existing information and new data that will
be acquired in 2004, including both field data and remote sensing data. We will integrate
inventories of aquatic, riparian, and upland habitats and integrate field sampling information with
remote sensing data for greatest usefulness and the most cost-effective use of the funding available.
We will continue to pursue collaborative efforts and external grant funding to “leverage” the
funding in the HCP.
Primary activities in 2004 will include:
•
•
•
•
•
•
Assess plot level data from 1992-1993 timber inventory to determine whether it can be used
with new image data and classification.
Complete development of metadata for map products derived from image analysis.
Analyze LiDAR data from King County to evaluate precision, accuracy and reliability of
prediction of forest habitat conditions.
Continue to evaluate appropriate forest growth models and species/habitat relationship models
(see separate summary)
Continue implementation of PSPs in second-growth forest (60) and PSRs in riparian forest (31)
for long-term monitoring.
Standardize DADD templates and integrate with ArcCatalog.
Financial Summary
Assessment of expanded
forest stand data 1
42
Year 3 Cost
Year 3
Commitment Expenditures
Work accomplished
in 2003
dollars
$11,800
$12, 749 Assessment of expanded forest
stand data
Year 3 Cost
Year 3
Commitment Expenditures
Work accomplished
in 2003
dollars
$11,800
$7,934 Assessment of expanded forest
Assessment of expanded
1
attribute data
forest attribute data
$17,700
$25,604 Design and partial implementation
Augmentation of Forest
for augmented forest habitat
Habitat Inventory 2
inventory, PSP installation
$28,851
$41,764
Remote sensing image analys is and
Long-term Forest Habitat
field data collection, including
Inventory (Field
3
forest cruising and 19 PSPs in oldverification and oldgrowth forest, and preliminary data
growth classification4 )
analysis
5
$11,063
$9,967
Assessment of forest growth
Forest Habitat Modeling
models (including FPS, FVS),
analysis of historic forest data, and
forest cruising.
$23,600
$19,016 Largely forest habitat inventory,
Species/Habitat Modeling 6
but some modeling work (See
separate summary for
Species/Habitat Modeling)
1
The HCP commitments are to sample and evaluate in HCP years 1-5, and redesign and
sample if needed during years 6-10.
2
Complete sampling within HCP years 1-5, if “assessment” finds incomplete information.
3
Design and field verification to be completed within HCP years 1-5, then sample and
monitor through HCP year 50.
4
Design and sample in HCP years 3-8.
5
Evaluate and develop in HCP years 1-8.
6
Evaluate and design in HCP years 1-5; Develop in HCP years 6-10; Maintain through year
50.
43
HCP Program Element: Species/Habitat Relationship Modeling (contributes to Upland
Forest Ecological Thinning, Restoration Thinning, and Restoration Planting,) (N541517)
HCP Program Category: Terrestrial Research and Monitoring
Contact: Bill Richards, Terrestrial Ecologist; Dwayne Paige, Senior Watershed Ecologist,
Watershed Management Division
Primary Objective (initial project element)
Utilize Habitat/Dispersal Simulation Modeling as a tool to identify and aid prioritization of specific
areas within the landscape of the Cedar River Municipal Watershed (CRMW) where forest
restoration projects will be most effective in promoting mid- to late-seral forest connectivity as
guided by the conservation strategies of the HCP.
Status of Work (2003)
This project is part of the Watershed Characterization project (see separate summary). In order to
provide potential habitat benefits for populations of 28 wildlife species dependent on late-seral
forest conditions, one of the goals of the HCP is to facilitate the restoration of late-seral forest
characteristics by thinning relatively young and dense second-growth forest. The HCP commits to
planning forest restoration on a landscape scale, prioritizing projects for the most potential benefit.
This modeling application attempts to identify where ecological and restoration thinning projects
will most likely contribute to the connectivity of mid- to late-seral forest habitat.
This project element is being conducted in two phases: 1) habitat modeling, and 2) dispersal
simulations. The habitat-modeling phase combines the best available landscape data to define
current forest habitat conditions using forest growth models (e.g., FVS, FPS) to predict forest
conditions at the end of the 50-year HCP. Ecological and restoration thinning will be simulated in
potential stands under current habitat conditions and ‘grown’ 50 years to produce alternative
landscape conditions. The dispersal simulation phase utilizes a spatially explicit model (PATCH)
designed to simulate populations of territorial, terrestrial vertebrate species. Comparing dispersal
success and dispersal patterns for a range of late-seral dependent wildlife species between
alternative landscape conditions will identify forest areas that, when thinned, will contribute most
to future forested habitat connectivity. During 2001, we conducted preliminary evaluations of
some available models, and preliminary evaluations of data needed for these models.
In 2002, we completed both phases of the modeling process as described above. Completion of
this project element has provided the first planning ‘tool’ that we have developed under the HCP to
address landscape-scale prioritization of forest sites in which to plan and implement restoration and
ecological thinning to facilitate development of late-seral habitat conditions (e.g., connectivity).
In 2003, we investigated the potential effects of planned ecological thinning projects on wildlife
habitat structure at selected low and mid-elevation project sites. We also evaluated several types of
remotely sensed data (e.g., MASTER data, LIDAR) as a potential source of stand composition and
structural data that would support and improve future wildlife and species distributional data within
the watershed. Field data was also collected in lower elevation, second growth stands to be used in
modeling exercises and for restoration planning purposes. Further modeling efforts will be
conducted when these types of remote sensing data coverages become available and are processed
for use with any appropriate and available modeling applications.
Looking Ahead (Planned 2004 Accomplishments)
Staff will continue to investigate the availability and effectiveness of current technology pertinent
to development and/or utilization of species/habitat modeling capability to support landscape level
44
decisions for habitat protection and management under the Conservation and Mitigation Strategies
in the HCP during 2003. As our capability to more accurately classify habitat within the watershed
improves concurrently with advances in remote sensing technology (e.g., MASTER data, LIDAR),
this analysis can be regenerated to refine results, provide a basis for comparison of alternatives, and
improve predictive accuracy. Use of more advanced forest growth models that may have become
available will also be investigated as a means of improving the accuracy of habitat condition
simulations.
Financial Summary
The HCP commits funding of $117,000 for HCP years 1-5 (in 2003 dollars), with an average of
$23,400 per year. A total of $24,047 was expended in 2003, for staff time on modeling and remote
sensing data to be used for forest characterization, as well as forest habitat sampling by consultants.
(Also described in the summary on Watershed Characterization.)
45
HCP Program Element: Riparian Restoration Project Monitoring (N541506)
HCP Program Category: Terrestrial Research and Monitoring
Contact: Amy LaBarge, Senior Forest Ecologist, Watershed Management Division
Primary Objective (initial project element)
The purpose of this element is to design and conduct a sampling program to monitor riparian forest
habitat development and plant species composition changes to track effectiveness and success of
riparian restoration projects. This monitoring will include pretreatment baseline information in
representative riparian forest sites as well as effectiveness monitoring of selected riparian habitat
restoration projects. The application of experimental silvicultural treatments in riparian areas will
be monitored in an adaptive management context.
Status of Work (2003)
In 2003, riparian restoration project monitoring occurred on three projects: Webster Creek,
Shotgun Creek and Lost Creek. Each of these projects had been planted with conifer seedlings in
years prior. City staff conducted all monitoring.
Additionally, permanent sample reaches were established in riparian areas in 15 locations (for a
total of 31 linear plots) in order to establish baseline conditions in representative riparian forest
sites. Staff and University of Washington personnel implemented this work.
Looking Ahead (Planned 2004 Accomplishments)
Riparian restoration project monitoring will occur on Webster Creek, Shotgun Creek, and Lost
Creeks again, as well as on Rock Creek near the 16 Road. Riparian restoration project monitoring
will also occur on Taylor Creek, where three small projects were implemented in 2003. Additional
permanent sample reaches will be established to generate a more comprehensive database on
riparian forest conditions in the watershed.
Financial Summary
The HCP commits funding of $41,300 for HCP years 3-8 (in 2003 dollars), averaging $6,883
annually, with increased funding levels in subsequent years. Approximately $2,216 was spent on
riparian restoration project monitoring in this element in 2003. Much of the effectiveness
monitoring that occurred and the permanent sample reach installations were funded by other
sources, including HCP restoration projects, the University of Washington, a private company, and
volunteers.
46
HCP Program Element: Upland Forest Restoration Project Monitoring (N541507)
HCP Pro gram Category: Terrestrial Research and Monitoring
Contact: Amy LaBarge, Senior Forest Ecologist, Watershed Management Division
Goals and Objectives
The purpose of this element is to design and conduct a sampling program to monitor upland forest
habitat development and plant species composition changes to track effectiveness and success of
upland forest restoration projects. This monitoring will include pretreatment baseline information
in representative forests as well as effectiveness monitoring of selected upland forest habitat
restoration projects. The application of experimental silvicultural treatments in upland areas will
be monitored in an adaptive management context.
Status of Work (2003)
In 2003, upland forest monitoring occurred on several projects, three of which were covered by this
element, including a 10-year re-measurement of the Sugar Bear Substitution variable retention
harvest, upland restoration thinning project sites, and upland forest permanent sample plots. City
staff conducted all monitoring. In addition, pre-treatment effectiveness monitoring occurred on the
45 Road Forest Restoration Project, but was charged to another element. Forestry consultants also
collected forest habitat inventory information in the lower watershed that will serve as a baseline
measurement for forest change over time.
Looking Ahead (Planned 2004 Accomplishments)
In 2004, post-treatment effectiveness monitoring will occur at the 45 Road Forest Restoration
Project. City staff, including interns will conduct this monitoring.
Financial Summary
The HCP commits funding of $41,300 for HCP years 3-8 (in 2003 dollars), averaging $6,883
annually, with increased funding levels in subsequent years. In 2003, a total of $14,139 was spent
for upland forest restoration project monitoring and collection of forest inventory information by
consultants. As mentioned above, other monitoring that occurred was funded by other sources.
47
HCP Program Element: HCP Information Resource Management (includes GIS Data
Compatibility) (N541515)
HCP Program Category: Watershed Management
Contact: Tom Van Buren, IT Professional, Watershed Management Division
Goals and Objectives
Developing and maintaining a well-organized and efficient system of accurate databases, integrated
and compatible with the Geographical Information System (GIS), is essential to support many HCP
commitments within the Cedar River Municipal Watershed (CRW). In addition, as indicated in
this section, most of the program elements are interdependent and rely on data and analyses from
several tasks in order to be fully functional and effective as management tools. Therefore, it is
critical that all databases are designed, maintained, and updated by a procedure that will ensure
accuracy and integration of information, including the acquisition and incorporation of pertinent
information from outside sources.
The objective of this program is to provide a systematic and efficient means by which data
collection formats, incorporation of data into databases, database management, and integration with
modeling efforts can be designed and maintained to maximize the system’s ability to support HCPrelated management activities. In addition, databases should be updated with the most current and
best available information whenever possible from both departmental and appropriate external
sources. Data management systems are being developed for various kinds of users, from technical
specialists to the public.
Status of Work (2003)
•
•
•
•
•
•
•
•
•
•
Created production instance of a GIS Oracle database - including roles and privileges to
enable all HCP staff to contribute.
Realigned GIS road layer to agree with the orthophotography base in preparation for road
inventory (orthophotography is spatially corrected aerial photography).
Developed Road Information Management System software prototype.
Developed database schema for Landscape Information Management System.
Implemented a data model for hydrologic resources in the CRMW.
Developed Stream Information Management System software prototype.
Production of Data Acquisition Description Document for Permanent Sample Plot data
collection
Developed and implemented database schema for culvert inventory database
Developed interface for input of new culverts and their geographic locations
Extended the functionality of ShedWeb to facilitate document contribution and retrieval
Looking Ahead (Planned 2004 Accomplishments)
•
•
•
•
•
•
•
48
Complete migration of legacy GIS coverages to Oracle.
Enhance prototype for flowing information into the Road Inventory Management System
(RIMS)
Extend hydrology data model to incorporate stream inventory measurements and observations.
Implement database schema for the Landscape Information Management System (LIMS)
Derive information products from LiDAR and Master data that are required to prioritize
restoration activities.
Participate in requirements gathering and development of a Project Tracking System (PTS) and
Science Information System (SIMS)
Develop a Watershed Information Portal for Key Watershed Assets:
•
+ Road Information Portlet
+ Riparian and Aquatic Information Portlet
+ Upland Forest Information Portlet
Develop resources to facilitate map production by staff
Financial Summary
The HCP commits specific funding of $59,000 for HCP years 1-8 (in 2003 dollars), with an
average of $7,375 per year. $24,868 was expended in Year 3. In addition, the HCP includes a
variety of commitments that have no explicit HCP Cost Commitments but that create a need for
linking information management to planning and documenting restoration, monitoring, and
research activities. The work described above funded by both cost commitment funds and a
variety of other budget sources.
49
50
Landsburg Mitigation Background
The anadromous fish conservation strategies are designed to mitigate for the blockage to fish
passage created by the Landsburg Diversion Dam. These strategies are designed to complement
other regional efforts to protect and restore declining stocks in the Lake Washington Basin. The
intent is to implement biologically sound solutions that (1) contribute to the recovery and
persistence of healthy, harvestable runs of anadromous fish in the Cedar River and Lake
Washington Basin; (2) have a high likelihood of success; and (3) maintain a safe, high quality
drinking water supply.
Anadromous salmonids have not entered the protected watershed in nearly a century. The HCP
provides passage for all native anadromous salmonids into the protected watershed, significant
regionally as refuge habitat in that it is highly protected and in relatively good condition.
Included among these native salmonids are chinook and coho salmon, and steelhead trout. The
sockeye salmon stock in the Cedar River was introduced from the North Cascades. Because of
risks to public health, the City cannot allow passage above the raw water intake of the massspawning sockeye salmon. In lieu of passage, the City commits to artificial propagation for
sockeye, with extensive monitoring and appropriate adaptive management provisions to reduce or
eliminate risks to wild fish. In addition, the City commits to funding habitat protection and/or
restoration for anadromous fish in the Cedar River Basin downstream of Landsburg.
Specifically, the City has committed to the following activities:
•
•
•
•
•
•
•
•
Provide funding to protect and restore habitats and populations of anadromous fish currently
blocked from entry into the municipal watershed by the Landsburg Diversion Dam
Construct fish ladders, protective screens on the water intake, and other improvements for the
safe passage of chinook, coho, steelhead, and other native fish species over the Landsburg
Diversion Dam, providing access to some of the most protected “refuge” habitat in the region
Prior to construction of fish passage facilities, commit to interim mitigation for chinook, coho
and steelhead, which could involve conducting key studies or emergency supplementation, if
justified.
Construct a new sockeye hatchery capable of producing up to 34 million fry, replacing the
existing interim hatchery facility at Landsburg
Continue to operate the interim sockeye hatchery at Landsburg as mitigation until the
replacement hatchery is built
Provide funding for habitat protection and restoration downstream of the Landsburg
Diversion Dam for all anadromous fish species
Develop and implement a comprehensive program of research, monitoring, and adaptive
management for salmon and steelhead
Create the Cedar River Anadromous Fish Committee, comprised of agencies signatory to the
Landsburg Mitigation Agreement and other stakeholders, which will advise the City
regarding implementation of anadromous fish mitigation
The following pages provide summaries of the individual HCP PROGRAM ELEMENTS under
the Landsburg Mitigation program category.
51
HCP Program Element: Interim mitigation for Coho, Chinook and Steelhead (N663201)
HCP Program Category: Chinook, Coho, Steelhead Mitigation
Contact: Bruce Bachen, Senior Fish Biologist and Paul Faulds, Fish Biologist, Water
Management Section
Objectives and Goals
This program has two main objectives: gathering biological information that is critical in
designing and managing effective, biologically sound short-term and long-term conservation
measures: and, if appropriate, designing and implementing supplementation programs to help
preserve one or more of the populations.
Status of Work (2003)
Recolonization above Landsburg Dam
2003 was the first year of a multi-year monitoring project: Investigations and Monitoring of
Recolonization by Pacific Salmon of the Cedar River Upstream of the Landsburg Diversion Dam.
This project is a collaboration of effort and resources from Seattle Public Utilities (SPU),
Northwest Fisheries Science Center (NOAA), Sea Grant and the School of Fisheries and Aquatic
Sciences at the University of Washington. The goal of the project is to provide a comprehensive
evaluation of spawning adults migrating upstream of Landsburg and the production of juvenile
fish from the recolonized Cedar River system.
The project collected data (number, species, timing, length, sex, presence of adipose fin, and
genetic samples using non-lethal methods) on anadromous fish as they passed through the fish
ladder at the Landsburg Dam. This information will be used to quantify and characterize chinook
and coho that are recolonizing the Cedar River above Landsburg and the genetic data will assist
in determining relationships of successive generations to earlier colonizing fish. The project also
documented chinook and coho spawning distribution upstream of the dam through the use of
telemetry equipment and spawning surveys.
Two other elements of the recolonization project were partially completed in 2003. A platform
was installed at the outflow of the water intake bypass pipe to accommodate a live trap for the
collection and evaluation of juvenile fish migrating downstream and an underwater camera
system was integrated with the existing fish counter at the fish ladder to record photographs of
fish passing through the counter as they move above Landsburg.
Rainbow trout and steelhead genetics
Washington Department of Fish and Wildlife (WDFW) initiated a multi-year project: Genetic
relationships among anadromous and nonanadromous Oncorhynchus mykiss in Cedar River and
Lake Washington: implications for steelhead recovery planning. The primary goal of the project
is to understand the genetic population structure of Cedar River/Lake Washington O. mykiss so
managers can design and implement strategies that effectively conserve and recover native
steelhead and rainbow trout resources. In 2003, WDFW collected tissue samples using non-lethal
methods from O. mykiss in the Cedar River, Green River, Chester Morse Lake, and Lake
Washington. These samples along with samples collected from steelhead in previous years were
analyzed.
Adult PIT tag detection at the Ballard Locks
The US Army Corps of Engineers (USACOE) and WDFW funded an evaluation of noise levels
at specific weirs within the fish ladder at the Hiram Chittenden Locks as the first phase of a multiyear project that involves the installation of adult PIT Tag readers in the ladder at the Locks. The
52
primary objective of this work is to gather information from PIT-tagged adult salmon returning to
Lake Washington that were tagged as juveniles in 2000 through 2004 in the Cedar River and
elsewhere in the Lake Washington basin. This information will be used to evaluate questions
associated with juvenile outmigration to gain a better understanding of what proportion of
juveniles use the smolt flumes, which can be used to inform estimates of survival. Detection rates
decline over time and it is unclear whether this is due to changes in exit pathways at the locks, in
lake mortality rates or rates of residualization.
Looking Ahead (Planned 2004 Accomplishments)
Recolonization above Landsburg Dam
In 2004, the main objectives for this project are to evaluate anadromous fish as they pass through
the fish ladder at the Landsburg Dam, document spawning distribution, initiate juvenile surveys
of resident and Pacific salmon in the mainstem and tributaries; PIT tag resident fishes and
juvenile coho; characterize chinook redd habitat from locations mapped in 2003; collect and
analyze water and biota for nutrient dynamics during chinook and coho spawning migration,
improve the adult trapping capabilities at the ladder, and install a trap at the water intake bypass
pipe to evaluate juvenile’s migrating downstream in 2005.
Rainbow trout and steelhead genetics
WDFW will issue a preliminary report describing the result of first year sampling. WDFW plans
to collect additional genetic samples for this project and will begin a comprehensive genetic
evaluation based on using microsatellite DNA markers and maternally inherited mitochondrial
DNA. The results of this evaluation are expected in 2005.
Adult PIT tag detection at the Ballard Locks
The installation of the PIT Tag readers in the fish ladder at the Hiram Chittenden Locks should be
completed in Spring, 2004 and the project will move into the monitoring phase soon afterwards.
The installation and monitoring will be funded in part by SPU, King Conservation District, and
USACOE.
Financial Summary
The HCP provides $840,600 (2003 dollars) for this program for HCP years 1-8. The HCP
commitment for this program in 2003 (calendar year) was $106,200, the total amount expended
on this program was $115,143 and the reported commitment expended was $109,509. The
contractor, WDFW operates under a budget that covers the fiscal year July 1 through June 30.
53
HCP Program Element: Landsburg Fish Passage Improvements (intake screen, fish
ladders and downstream passage construction) (C1604)
HCP Program Category: Chinook, Coho, Steelhead Mitigation
Contact: Bill Wells, Project Manager, Field Operations Branch
Objectives and Goals
Construct Fish Passage at Landsburg.
Status of Work (2003)
The project construction was completed on schedule and all facilities were placed into operation
by September 2003.
Significant accomplishments:
•
•
•
•
•
•
•
•
Completed new intake fish screen construction and
aqueduct tie -ins and placed the new screening facility
in service in July 2003.
Completed facility start-up testing summer 2003
Took delivery of new live-haul fish tanker for sockeye
transport in August 2003.
Reached construction substantial completion milestone
on August 19, 2003, 12 days ahead of schedule.
Completed fish ladder and sorting/holding facilities
construction at the Landsburg Dam in summer 2003.
The facility was watered up and placed in service the
first week of September 2003.
First Chinook past upstream of Landsburg Dam on September 19, 2003.
Held project ribbon cutting ceremony on October 7, 2003.
Completed all construction contract punch-list items in December 2003.
Looking Ahead (Planned 2004 Accomplishments)
•
•
Receipt of project construction as-built drawings –1st quarter 2004
Project construction contract final acceptance, and final contractor payment – April 2004
Financial Summary
Landsburg Mitigation – Fish Passage 2003 HCP cost commitment was 3,463,300. Actual
expenditures in 2003 were $5,232,189 (inclusive of sales tax, SPU staff costs, and King County
permit expenses and imposed construction mitigation). Total project expenditures were
$12,633,000. The project cost commitment, in 2003 dollars, is $7,490,830.
54
HCP Program Element: Operation of Passage Facilities (intake screen, fish ladders and
downstream passage construction) (N663501)
HCP Program Category: Chinook, Coho, Steelhead Mitigation
Contact: Rand Little, Senior Fisheries Biologist, Water Management Section
Objectives and Goals
•
•
Allow access for all native fish species in the Cedar River, except sockeye salmon, into the
municipal watershed.
Operate the downstream passage gate and intake screening facilities to safely pass
downstream migrating fish while meeting HCP instream flow management requirements and
municipal water supply needs.
Status of Work (2003)
All elements of the project, intake screens, downstream passage gate, the fish ladder and
associated fish sorting and transport facilities, were placed into operation on schedule in late
summer of 2003, just prior to the return of adult salmon. During the spring of 2003, SPU
operations staff began working closely with the SPU construction project manager and staff, the
project design firm and various contractors and vendors to begin testing facility components and
initiate facility operation. Construction of the rock drop structure providing fish passage over the
Lake Youngs Aqueduct river crossing approximately 1/3 mile downstream from the Landsburg
Dam was completed during the summer of 2002. This structure performed successfully
throughout the remaining portion of 2002 and all of 2003.
Just prior to facility start-up and at the request of the Cedar River Anadromous Fish Committee
(AFC), SPU staff retrofitted the fish ladder to include chinook and coho trapping facilities.
Minimizing the handling of upstream migrating adult fish was a key objective of the project and
therefore, the initial ladder design did not include fish trapping facilities. A number of interested
parties and members of the AFC expressed an interest in obtaining genetic information from fish
as they passed upstream and to track family groups to assess the relative success of early recolonization efforts. 2003 also marked the first full return of marked Issaquah Hatchery chinook
to the Lake Washington Basin. By trapping all upstream migrating chinook, operators are able to
assess the relative abundance of naturally produced and hatchery produced adult chinook and
coho salmon migrating over Landsburg. SPU staff worked with staff from NOAA Fisheries and
WDFW to design and construct trapping facilities in the fish ladder return channel that allow
brief, in-water handling of upstream migrating fish while avoiding and minimizing potential
impacts. NOAA Fisheries ammended Seattle’s Incidental Take Permit to allow capture and
handling of upstream migrating fish.
The trapping facilities also help support re-colonization studies being conducted in collaboration
with NOAA Fisheries and the University of Washington, School of Fisheries and Aquatic
Sciences. Tissues samples were collected from the fins of upstream migrating chinook and coho
for genetic analysis. In addition, over half of the migrating coho salmon were radio tagged and
tracked as they passed into the habitat upstream of the dam. All chinook and coho were also
inspected for the presence of adipose fin clips indicating fish of hatchery origin.
The Fish Ladder and Sorting Facilities were placed into operation on September 16. The first
adult chinook salmon passed through the facilities and into the habitat upstream of the Landsburg
Dam on September 19. A total of 79 adult chinook and 47 adult coho salmon passed upstream
55
during the 2003 brood year (see Tables 1 and 2; Figures 1 and 2). Genetic samples were
collected from all but two fish passed upstream. The majority of chinook that passed upstream
had adipose fin clips indicating that they were of hatchery origin. Of the 79 chinook passed
upstream, only 16 were female. Subsequent redd surveys in the river upstream of Landsburg
documented a total of 15 chinook redds. All chinook redds were located in the mainstem. Only 4
of the coho passed upstream had adipose fin clips indicating that most coho were naturally
produced. A total of 37 coho were radio tagged and tracked as part of a collaborative project with
the University of Washington. Most fish appeared to spawn in the mainstem upstream of
Landsburg. In addition to coho and chinook, 1001 sockeye salmon entered the facility, were
sorted and either transferred to the Interim Landsburg Sockeye Hatchery where they were used
for broodstock, or transported back downstream and released into the river.
On January 25, 2004, after nearly a month during which no coho passed upstream, the fish
passage facilities were switched to passive migration mode eliminating the need to sort. In the
passive migration mode, all upstream migrating fish are allowed to pass upstream through the fish
ladder unhindered. Electronic fish counting facilities provide the ability to monitor the number
and approximate size of all upstream migrating fish. Although we are still working through some
start-up challenges with this equipment, over 150 trout-sized fish have been enumerated passing
upstream through the fish counter since late January, 2004. No fish of sufficient size to be
considered steelhead have been recorded at the counter.
Looking Ahead (Planned 2004 Accomplishments)
•
•
•
•
•
The fish ladder will continue to be operated in passive migration mode through the late
summer. We will attempt to continue to monitor all upstream migrating fish using the
electronic fish counting device in the upper fish ladder.
Fish sorting operations are scheduled to recommence in early September as significant
numbers of returning adult salmon begin to arrive in the Landsburg area.
A number of minor facility improvements, identified during the first year of operations,
have been completed. More minor improvements will be completed prior to start-up of
the sorting operations in early September to improve fish handling, reduce the risk of fish
mortality due to their tendancy to jump out of the holding ponds, and improve operational
safety and efficiency.
SPU will continue to work with State and Tribal fisheries resource co-managers and
NOAA Fisheries, the parties to the HCP and the Anadroumous Fish Committee regarding
the issue of passing upstream migrating hatchery salmon into the habitat above of the
Landsburg Dam.
SPU will continue to work with NOAA Fisheries and the University of Washington to
support ongoing salmon re-colonization studies.
Financial Summary
Construction of the fish passage facilities was accelerated approximately 1 year ahead of the
schedule described in the HCP. As a result, the HCP included no operational commitment costs
for HCP Year 3. Actual commitment expenditures for HCP Year 3 totaled $91,640.
56
HCP Program Element: Interim Mitigation for Sockeye Salmon (N663202)
HCP Program Category: Sockeye Mitig ation
Contact: Bruce Bachen, Senior Fish Biologist and Paul Faulds, Fish Biologist, Water
Management Section
Objectives and Goals
The Washington Department of Fish and Wildlife (WDFW) operates a sockeye broodstock
collection facility and hatchery on the Cedar River through an Memorandum of Agreement
(MOA) with Seattle Public Utilities (SPU). The interim hatchery program first began operations
in 1991and the broodstock collection facility has been in operation since 1993. The hatchery
program involves the incubation and release of marked unfed sockeye fry into the Cedar River so
they can volitionally outmigrate and rear naturally in Lake Washington. To maintain the
program, broodstock are collected at a weir and fish trap located at river mile 6.5. The weir is
operated to achieve an egg take goal that is established annually and based on the estimated
sockeye return to Lake Washington. Weir operating protocols are developed annually and
reviewed by the Anadromous Fish Committee (AFC) with the goal of avoiding adverse impacts
to adult chinook salmon. Broodstock are transported to an adult holding facility at Landsburg and
spawned when ripe with the goal of having a 1:1 male to female spawning ratio. Weekly targets
for gamete collection are based upon the average run timing curve for the Cedar River. Fertilized
eggs are then incubated at the hatchery and the resulting emergent fry are released into the river.
Status of Work (2003)
In October 2003, WDFW provided the AFC and SPU with a summary report that detailed the
interim hatchery operation for broodyear 2002, which covered the beginning of broodstock
collection on September 10, 2002 through the last fry release on April 3, 2003.
In 2003, the interim hatchery released 15,957,000 fry in the Cedar River. This is one of the
largest hatchery releases to date. There were four different release locations and the release
numbers varied at each site with 4,450,000 at river mile 0.1; 3,270,000 at river mile 1.9;
3,362,000 at river mile 13.5; and 4,875,000 at river mile 22.
The first known losses of hatchery sockeye to IHN virus at the interim sockeye hatchery occurred
in early 2003. The outbreak is thought to be associated with the extension of available spawning
habitat that resulted from fish passage improvements that allowed sockeye to migrate above the
aqueduct crossing located about one quarter mile below the hatchery. The presence of large
numbers of naturally spawning sockeye adjacent to the hatchery likely increased the risk of an
outbreak in the hatchery. The losses were confined to a relatively small number of incubators and
the number of fry that were destroyed amounted to 5.5% of the total number of fry produced that
year by the hatchery. The risk of additional IHN losses will continue to be elevated until the
replacement hatchery and the associated improvements to the water supply are made. These water
supply improvements should be made as soon as possible to lessen this risk of further IHN
outbreaks in the interim hatchery; however, permittin g such improvements requires the
completion of the SEPA process currently underway.
In May 2003, WDFW estimated the sockeye return for Lake Washington would be about 150,000
fish and would support an egg take goal of 17.2 million for the hatchery. The weir was installed
in September and the first egg take was on September 22, 2003. Egg collection continued
normally until on October 21, 2003 when the weir washed out during unseasonably high flows.
57
By that time, approximately 9.5 million eggs had been collected. Although WDFW was able to
salvage most of the weir, only a portion of the weir could be reinstalled due to high flows. This
reduced capture effectiveness and relatively few eggs were collected during the remainder of the
run. The final egg take for the year was approximately 10,316,000.
Looking Ahead (Planned 2004 Accomplishments)
Due to delays resulting from the development of a SEIS for the new hatchery, SPU and WDFW
are developing a time extension for the MOA that covers the operation of the interim hatchery. It
is anticipated the extension will have a termination date of December 31, 2007.
A strong sockeye return is forecasted for 2004, which is expected to be large enough to support
sport and tribal fisheries this year.
Financial Summary
The HCP commitment for this program in 2003 (calendar year) was $302,080, the total amount
expended on this program was $323,735 and the reported commitment expended was $321,683.
The over expenditure was due in part to spending dollars that were carrie d forward from previous
years and no longer paying December invoices in the following year. This difference is expected
to be reconciled during 2004. The contractor, WDFW operates under a budget that covers the
fiscal year July 1 through June 30.
58
HCP Program Element: New Sockeye Hatchery - Design and Construction (C100032)
HCP Program Category: Sockeye Mitigation
Contact: Bruce Bachen, Senior Fish Biologist, Water Management Section
Objectives and Goals
The primary goal of this program is to develop an effective, comprehensive, and biologically
sound artificial sockeye propagation program consistent with the Cedar River Habitat
Conservation Plan. The objectives are to plan, design, permit and construct a sockeye facility to
replace the interim sockeye facility that is capable of producing 34 million sockeye fry per year as
well as develop the hatchery program documents (biological criteria, operating protocols,
adaptive management plan, and capacity analysis).
Status of Work (2003)
Environmental Review
The Cedar River Sockeye Hatchery FEIS and Response to Comments document were released in
March, 2003. In April, a citizen filed an appeal regarding the adequacy of the FEIS with the City
of Seattle’s Hearing Examiner. Activities associated with this appeal required extensive staff time
from SPU and the City’s Law Department. An addendum to the FEIS was released in August
2003, containing additional information on the project that became available after the FEIS had
been released. The 4-day appeal hearing was held in early October. After the hearing, the City
and the appellant filed lengthy written briefs summarizing their respective positions for the
hearing examiner and the examiner’s decision was issued in November. She required SPU to
issue a Supple mental EIS, providing additional information including worst case analyses of
some potential effects of the hatchery and providing further detail regarding the adaptive
management plan. Work was initiated on the Supplemental EIS in late 2003.
Project Design
Engineering design of the hatchery facilities reached 60% in 2003. Using the 60% design
drawings, an independent value-engineering study was conducted to identify opportunities to
achieve project savings. WDFW and SPU reviewed the drawings and provided comments. The
General Contractor/ Construction Manager developed an estimate of construction costs based on
the 60% design drawings and provided comments on the design drawings. All comments and
value-engineering recommendations were evaluated and used to develop guidance for further
design work.
Project Schedule
Due to the delay in the environmental review process, the project timeline has been adjusted to
reflect a two year delay. The hatchery is now scheduled to be completed by August, 2007.
Looking Ahead (Planned 2004 Accomplishments)
The Draft Supplemental EIS will likely be ready for review in Fall, 2004. Design will be mostly
complete by the end of 2004.
59
Financial Summary
Total project expenditures amounted to $673,234 in 2003, of which $470,399 was spent on
design, program development environmental review services. Total program development and
construction costs are currently expected to exceed the HCP commitment level by approximately
$2 million. In 2003 $502,612 was expended toward the HCP cost commitment.
60
HCP Program Element: Broodstock Collection Solutions and Monitoring (C100033)
HCP Program Category: Sockeye Mitigation
Contact: Bruce Bachen, Senior Fish Biologist, Water Management Section
Objectives and Goals
Evaluate alternative broodstock collection methods and sites as options that would allow the
hatchery to meet its egg take goals while minimizing adverse impacts on chinook and other
salmonids.
Status of Work (2003)
Northwest Hydraulic Consultants (NHC) provided consultation to SPU on the conceptual design
of a replacement broodstock collection facility on the Cedar River focusing on stream hydraulics,
geomorphology, and the efficiency of facility operations. Dr. John Skalski was hired to evaluate
the feasibility of us ing a broodstock collection weir to sample adult returns in order to determine
their origin.
Looking Ahead (Planned 2004 Accomplishments)
Now that method evaluation and site selection studies have been completed, this project will be
merged with the overall design effort for the replacement hatchery. Site selection and design
activities will continue in 2004. Further evaluation of the I-405 site is planned and the conceptual
design will be developed further in 2004 to be prepare for permit submittals.
Financial Summary
The HCP commitment for broodstock collection solutions and monitoring in 2003 was $0 and
$7,266 of the commitment was spent on this program category. Cumulative expenditures are less
than the total cumulative commitment for this activit y. Remaining funds will be spent during the
design process, probably in 2004 and 2005.
61
HCP Program Element: Drinking Water Quality Monitoring, Fish Passage Evaluation
(N663504)
HCP Program Category: Passage of Chinook, Coho & Steelhead Above Landsburg
Research & Monitoring
Contact: Bruce Bachen, Senior Fish Biologist and Paul Faulds, Fish Biologist, Water
Management Section
Objectives and Goals
This study will provide a basis for evaluating the effects of fish passage on the ecosystem above
Landsburg Dam as fish passage is restored. There are two main components: (1) collect baseline
nutrient data from water samples, fish and riparian biota for two years and, (2) conduct
simulation experiments with small artificial channels to evaluate impact of fish carcasses on
stream water quality.
This project does not involve the monitoring of drinking water quality, despite what the title
implies. However, it will provide data useful in evaluating the possible role of fish passage in
any subsequent drinking water quality problems related to the Cedar source. For example,
correlation between the problem and nutrient level changes above Landsburg could be evaluated.
The project is a joint effort of SPU and the National Marine Fisheries Service under a
memorandum of agreement.
Status of Work (2003)
The baseline nutrient data was collected in 2000 – 2002. Artificial channel experiments were
delayed due to difficulty in identifying a suitable water source. Researchers concluded that the
best source and site would be at Landsburg Dam. Development of the source was incorporated
into fish passage construction at Landsburg. In 2003, a water supply pipe and 6 inch valve was
installed at the new intake screen at Landsburg to provide a gravity fed source of screened water
for the channel experiments.
Looking Ahead (Planned 2004 Accomplishments)
The artificial channel experiments may begin in 2004.
Financial Summary
HCP reported commitment expenditures in 2003 totaled $9,380 leaving the remaining unspent
commitment of $12,567.
62
HCP Program Element: Fry Marking and Evaluation (N663402)
HCP Program Category: Sockeye Monitoring and Research
Contact: Bruce Bachen, Senior Fish Biologist and Paul Faulds, Fish Biologist, Water
Management Section
Objectives and Goals
Since the beginning of the Cedar River sockeye salmon hatchery program, the otoliths of all
hatchery-produced sockeye salmon fry have been thermally marked. Marks have been induced
on the otoliths of incubating sockeye through brief exposure to chilled water (approximately 4o C).
Marks are unambiguous and are easily distinguishable from naturally spawning sockeye. The
objective of the program has been to provide a source of marked fish that can be used to evaluate
the hatchery program and address fundamental questions about the performance of Cedar River
hatchery produced sockeye salmon. This type of information is needed to help manage the
ongoing sockeye salmon hatchery program as well as to provide information to help develop the
permanent sockeye salmon hatchery facility.
Status of Work (2003)
Washington Department of Fish and Wildlife (WDFW) provided Seattle Public Utilities (SPU)
with a summary of the thermal marking for the otoliths of sockeye embryos and alevins at the
Landsburg Hatchery for broodyear 2002. This summary documented the 30 different thermal
codes that were developed to mark the 15,957,000 fry incubating in 69 vessels at the hatchery.
The report also included the incubation release date, release location, and number released by
thermal marking pattern.
In October SPU contracted with WDFW for the 2003 marking program. WDFW established a
marking plan for the hatchery based on the goals and objectives of the marking program
established by the Anadromous Fish Committee (AFC). The main objectives of 2003 marking
program were to mark fish for the Short Term Rearing Study resulting in eight marks and mark
production fry by release location in the river (lower, middle, and upper) requiring three
additional marks. Time of release was also addressed in the final marking strategy. Samples of
otoliths were collected from each incubator shortly before each hatchery group was released to
verify that the correct marking pattern was actually induced on the otoliths. WDFW also ensured
all marking equipment was operational by the middle of November and was maintained
throughout the marking period.
Looking Ahead (Planned 2004 Accomplishments)
A summary report that includes the broodyear 2003 marking plan and the results of
implementation will be submitted to SPU and the AFC in July of 2004. The report will include a
description of the marking patterns used for each release group, how many fish were marked in
each group, the start and end date of marking, release location and dates for each mark group.
Results of implementation shall describe any deviations from the marking plan, document marks
through representative photos of each mark. The draft report will be reviewed and WDFW will
produce a final report based on comments by August 2004.
63
Financial Summary
The HCP provides support for this program for HCP Years 1-8, 24-27 and 42-45. The HCP
commitment for this program in 2003 (calendar year) was $23,600, the total amount expended on
this program was $17,866 and the reported commitment expended was $17,629. The contractor,
WDFW operates under a budget that covers the fiscal year July 1 through June 30.
64
HCP Program Element: Fry Trapping and Counting (N663403)
HCP Program Category: Sockeye Monitoring and Research
Contact: Bruce Bachen, Senior Fish Biologist and Paul Faulds, Fish Biologist, Water
Management Section
Objectives and Goals
This program supports the operation of a downstream migrant trap in the lower Cedar River that
is used to develop the data needed to estimate the number of sockeye fry, by origin, that migrate
out of the Cedar River each year. Upriver hatchery releases are evaluated to estimate the number
of fry that reach the trapping site. On nights that catches of sockeye fry may include hatchery
produced fry, otoliths are collected according to the protocols established over the previous
seasons. These protocols prescribe the method of sampling each hour’s catch over the entire
night to insure that regardless of time of capture, each fry captured within a night has an equal
probability of being sampled. The Washington State Department of Fish and Wildlife (WDFW)
determine the number of nights on which otolith samples are collected. In addition, other
biological data such as size and migration timing are collected and recorded to characterize these
populations. Since sockeye migration overlaps with chinook migration, trapping data is also used
to estimate chinook production as well.
Status of Work (2003)
Funding was provided to WDFW through a two-year agreement to support fry trapping
operations on the Cedar River. This agreement provides the full HCP funding commitment for the
period. HCP funding is combined with support from other sources to fully fund the activities and
analyses associated with the project. Two types of traps have been used; an inclined screen trap,
which works best for smaller fry and a screw trap that is more effective at catching larger
juveniles. Trapping occurs on the lower Cedar River from January to July each year resulting in
estimates of the outmigrant salmonids from the river. This is the only estimate of natural fry
production available for the Cedar River.
In May 2003, WDFW provided SPU and the AFC with the draft 2002 Cedar River Sockeye
Salmon Fry Production Evaluation. The document provided outmigrant estimates of hatchery
and natural origin sockeye in the Cedar River for 2002.
Looking Ahead (Planned 2004 Accomplishments)
A final fry trapping report for 2002 and draft reports for 2003 and 2004 are expected in 2004. Fry
trapping work in the Cedar River will continue in 2004.
Financial Summary
The HCP provides support for this program for HCP Years 1-8, 24-27 and 42-45. The HCP
commitment for this program in 2003 (calendar year) was $41,300 and the reported commitment
expended was $41,377. The contractor, WDFW operates under a budget that covers the fiscal
year July 1 through June 30.
65
HCP Program Element: Short Term Fry Rearing (N663405)
HCP Program Category: Sockeye Monitoring and Research
Contact: Bruce Bachen, Senior Fish Biologist and Paul Faulds, Fish Biologist, Water
Management Section
Objectives and Goals
The objective of the project is to learn more about the feasibility and effects of short- term rearing
and use this information to guide future hatchery operations.
Status of Work (2003)
Fry incubation and ponding took place at the Cedar River Hatchery at Landsburg, which is
operated by the Washington Department of Fish and Wildlife (WDFW). Following incubation
and emergence small samples of fry were removed to calculate the KD index and yolk to body
weight ratios (to assess stage of development), and individual weights and lengths (to document
fry growth during rearing). Reared groups were released after being held and fed to satiation for
approximately 10-14 days. Control groups (unfed fry) were comprised of fry that were released
the same day they were removed from incubators, consistent with what has been done in the past
at the hatchery. Reared and unfed groups of fry were paired together to form four releases. Each
release group involved in the experiment received a unique otolith mark to enable future
identification and analysis. Each group included roughly 500,000 fry, however the exact number
depended on egg takes and the number of otolith marks available . Fry were released near the
mouth of the Cedar River at the boat launch ramp adjacent to the Renton Municipal Airport. The
rearing study successfully released approximately 4,450,000 fry in 2003, however one fed group
(A-22) tested positive for IHN and was euthanized and a control group (A-16) was released
before test results showed it to be positive for IHN.
Looking Ahead (Planned 2004 Accomplishments)
The last fry release for the short term rearing study is in 2004 and the work will focus on rearing
and releasing fry, taking biological samples of fry, data analysis, and final reporting. The first
significant adult returns from the study are expected to begin in 2005.
Financial Summary
The HCP provides support for this program for HCP Years 1-4. The HCP commitment for this
program in 2003 (calendar year) was $12,050, the total amount expended was $11,540 and the
reported commitment expended was $9,257. The contractor, WDFW operates under a budget
that covers the fiscal year July 1 through June 30.
66
HCP Program Element: Lake Washington Plankton Studies (year-round) (N663406)
HCP Program Category: Sockeye Monitoring and Research
Contact: Bruce Bachen, Senior Fish Biologist and Paul Faulds, Fish Biologist, Water
Management Section
Objectives and Goals
At the June 2002 Anadromous Fish Committee (AFC) meeting, members recommended to the
Parties to the Landsburg Mitigation Agreement (LMA) that funding for intensive zooplankton
monitoring in HCP Year 2 totaling $46,400 be provided instead for juvenile sockeye research.
The reason behind this recommendation was that an existing non-HCP U. of Washington research
program was providing sufficient data to met the intent of the HCP zooplankton studies.
In 2003 the AFC again recommended that funding for intensive zooplankton monitoring be used
instead to support a proposal by Dr. Dave Beauchamp to conduct a fall survey to enumerate and
obtain growth information of juvenile sockeye in Lake Washington with funding from the
program element Lake Washington Plankton Studies. The Parties to the Landsburg Mitigation
Agreement approved these modifications in both 2002 and 2003.
Status of Work (2003)
In 2003, Seattle Public Utilities (SPU) and the AFC received the final report from Dave
Beauchamp (UW): Early Feeding Demand and Food Supply of Sockeye Salmon Fry in Lake
Washington. This report was funded through the program element: Lake Washington Plankton
Studies and examined the early feeding, growth, distribution, and food supply of sockeye salmon
fry Oncorhynchus nerka in Lake Washington from winter-spring in 2001. Results from this
evaluation are included in a manuscript that will be published in 2004 in a peer-reviewed journal.
The timing of the evaluation of food supply in 2001 was particularly opportune because the work
coincided with the largest number of sockeye fry entering the lake since counts began in 1992.
This study generated useful information for the evaluation of potential concerns about food
limitations during the early growing period for sockeye fry as they entered Lake Washington. In
addition, in-lake survival rate estimates were calculated. SPU and the AFC also received the
report: Growth, Distribution, and Abundance of Pelagic Fishes in Lake Washington: Results and
Evaluation of Methods. This study evaluated hydroacoustic -midwater trawl survey methods for
assessing sockeye presmolt abundance and associated species during the spring and estimated the
abundance, growth, and survival of juvenile sockeye and associated pelagic fishes in the fall and
spring. Additionally, Dave Beauchamp (UW) was contracted to conduct a fall survey to
enumerate and obtain growth information of juvenile sockeye in Lake Washington with funding
from this program.
Looking Ahead (Planned 2004 Accomplishments)
In 2004, SPU and the AFC should receive a report on the fall 2003 survey to enumerate and
obtain growth information of juvenile sockeye in Lake Washington. Dave Beauchamp (UW) was
also contracted to conduct spring juvenile salmon and planktivorous fish surveys to enumerate
and obtain growth information for sockeye in Lake Washington. The survey also provides
information on the size of other major pelagic planktivores in the lake, longfin smelt and
threespine stickleback. Both smelt and sticklebacks potentially influence the temporal
availability of zooplankton in the lake, but are also alternative prey for predatory fish and may
buffer juvenile salmon species from additional predation losses.
67
Financial Summary
The HCP provides support for intensive year-round zooplankton surveys for HCP Years 1-4. The
HCP commitment for this program in 2003 was $47,200, the total amount expended was $17,201
and the reported commitment expended was $16,097. The remaining dollars will be carried
forward for additional work in this program.
68
HCP Program Element: Adult Survival Distribution, and Homing Studies (N663407)
HCP Program Category: Sockeye Monitoring and Evaluation
Contact: Bruce Bachen, Senior Fish Biologist and Paul Faulds, Fish Biologist, Water
Management Section
Objectives and Goals
The purpose of this activity is to collect otoliths from a representative sample of sockeye
spawning in the Cedar River. All sockeye released from the Cedar River Hatchery are exposed to
temperature changes during incubation that results in chill markings on the otolith bone. When
the otolith samples are analyzed, they provide the data to permit evaluation of marked groups
originating from the Cedar River Sockeye Hatchery. The specific evaluations are dependent on
the marking strategy employed. Some examples of analyses that will be or have been done are to
measure fry to adult survival of hatchery-produced fish, determine the proportion of hatcheryorigin sockeye in the return, monitor the spawning distribution of hatchery-produced fish in the
Cedar River, and to assess straying in Bear Creek.
Data from these studies will be used to evaluate and modify fry release strategies and other
appropriate aspects of the supplementation program to improve performance and minimize the
risks of deleterious effects on sockeye spawning in the wild.
Status of Work (2003)
WDFW collected otoliths from the carcasses of adult sockeye that spawned and died in the Cedar
River from October into 2004. Samples were taken from adult spawners found in the lower,
middle, and upper portions of the river. WDFW also received some funding to carry out the
second year of a pilot study to examine the consequences of adult fish behavior on carcass
recovery rates.
Looking Ahead (Planned 2004 Accomplishments)
Otolith collection should continue in 2004 with additional focus being applied to a better
understanding of the results from previous years.
Financial Summary
The HCP provides support for this program for HCP Years 1-8, 24-27 and 42-45. The HCP
commitment for this program in 2003 (calendar year) was $47,200, the total amount expended
was $53,481 and the reported commitment expended was $52,292. The contractor, WDFW
operates under a budget that covers the fiscal year July 1 through June 30.
69
HCP Program Element: Phenotypic and Genetic Studies (N663408)
HCP Program Category: Sockeye Monitoring and Research
Contact: Bruce Bachen, Senior Fish Biologist and Paul Faulds, Fish Biologist, Water
Management Section
Objectives and Goals
In 2002 the Anadromous Fish Committee (AFC) did not identify the need for further genetics
work on sockeye populations in Lake Washington since HCP funded genetic research was
completed by Ingrid Spies, a graduate student at the University of Washington. At the February
2002 AFC meeting, members recommended to the Parties to the Landsburg Mitigation
Agreement (LMA) that funding for phenotypic and molecular genetic studies in HCP Year 2 be
used to support a proposal to evaluate the timing and distribution of adult sockeye as they return
to Lake Washington and the Cedar River. The project by Dr. Thomas Quinn and Jenny Newell
(School of Aquatic and Fishery Sciences, University of Washington) will generate information to
better understand sockeye movement, distribution, and lake entry timing in relation to the timing
and location of spawning. The information is expected to be useful to fishery managers as they
consider how future fisheries should be structured to control effects on other sockeye populations
in Lake Washington and to lower the risk of disproportionate impact to a segment of the run to
the Cedar River. The need for the research is identified in the draft Adaptive Management Plan
for the Cedar River sockeye hatchery. The Parties to the LMA approved the project.
Status of Work (2003)
At the Hiram Chittenden Locks in 2003, the study tagged sockeye with 1,553 disk tags, 261
iButton temperature loggers, and 30 acoustic transmitters. Some interesting and preliminary
trends in the data demonstrated: the proportion of males entering the lake increased later in the
run, lake entry timing did not seem to be correlated with river entry, sockeye migrating to the
Cedar River entered the lake earlier than fish moving to the north end tributaries, recovered
iButton tags showed that some fish stayed in the river for over 3 weeks, and the acoustic tags
demonstrated that most sockeye stayed below the thermocline in August and most of the
detections were in the south end of the lake. Researchers also record the sample date, sex and
length and removed a scale sample.
Looking Ahead (Planned 2004 Accomplishments)
The project will enter its second year in 2004 with some minor changes such as, modifications to
the trap to increase the trapping efficiency and increasing the number of acoustic tags to 78.
Increased numbers of acoustic tags are expected to provide a better understanding about the level
of in-lake mortality during maturation, a question that is relevant to the development of estimates
of spawning sockeye in the Cedar River. Also, the study will not be using iButton temperature
loggers because 2003 proved to be a very warm year and the iButton temperature loggers
provided enough data for analysis.
Financial Summary
The HCP commitment for phenotypic and genetic studies in 2002 was $34,800 and no
commitment dollars were spent on this program category in 2002. Unexpended 2002 cost
commitment and future years’ cost commitments were applied to the $82,623 total cost of the
70
proposal to evaluate the timing and distribution of adult sockeye as they return to Lake
Washington and the Cedar River, which is planned for 2003-05.
The HCP cost commitment for this program in 2003 was $35,400, the total amount expended was
$29,434 and the reported commitment expended was $29,014.
71
HCP Program Ele ment: Anadromous Fish Committee
HCP Program Category: Program Management
Contact: Bruce Bachen, Senior Fish Biologist and Paul Faulds, Fish Biologist, Water
Management Section
Objectives and Goals
The Anadromous Fish Committee (AFC) provides advice and consultation to the City and the
other Parties of the Landsburg Mitigation Agreement (LMA) relating to the implementation of
the LMA. The primary objective of the LMA is to implement biologically sound measures that
assist in the recovery and persistence of healthy, harvestable runs of sockeye, coho, and chinook
salmon and steelhead trout in the Cedar River. The LMA commits the City to long-term measures
to help restore anadromous fish runs and mitigate for the blockage at Landsburg Dam. The AFC
serves as a forum for coordinating and communicating information on the status, condition, and
trends of anadromous fish stocks in the Cedar River and provides guidance with the
implementation and oversight of interim and long-term mitigation measures for these stocks.
In 2003, members of the AFC included representatives from: US Fish and Wildlife Service,
National Marine Fisheries Service, Washington Department of Fish and Wildlife, City of Seattle,
Muckleshoot Indian Tribe, Northwest Marine Trade Association, Puget Sound Anglers-Lake
Washington Chapter, Washington Council of Trout Unlimited, and Washington Trout.
Changes in Membership
In 2003, Bill Robinson stepped down from the AFC as a representative of Trout Unlimited and
regularly attended subsequent meetings as a member of the public, Hans Berge joined the AFC as
the King County representative, Frank Urabeck was appointed as the voting member for Trout
Unlimited and stepped down as the representative for the Northwest Marine Trade Association,
and Phyllis Meyers became the voting member for NOAA Fisheries. A new non-voting seat was
established and Michael Kern with the Long Live the Kings agreed to serve on the AFC.
Status of Work (2003)
The AFC recommended and/or supported the following items:
• Unanimous ly recommended that the LMA Parties approve funding for a proposal from
WDFW for a two-year study on the genetic relationships among anadromous and
nonanadromous Oncorhynchus mykiss in Cedar River and Lake Washington.
• Unanimously recommended to the LMA Parties to fund a multi-year proposal to study
adult sockeye entry timing and distribution in Lake Washington by Tom Quinn and Jenny
Newell (UW) with funding that was originally allocated in the HCP for sockeye genetics
study.
• Unanimously recommended that the LMA Parties approve funding for proposed work by
SPU, NMFS, and the UW to evaluate salmonid recolonization above the Landsburg Dam.
The 2003 elements would evaluate anadromous fish passing above the Landsburg Dam,
their spawning distribution, and the downstream passage of juveniles through the
protective fish screen at the water supply intake.
• Unanimously recommended to the LMA Parties to fund the installation of adult PIT tag
readers at the locks. The overall goal of the project is to provide the U.S. Army Corps of
Engineers with an adult PIT detection system that will provide 95% detection of
72
•
•
•
•
•
•
upstream migrating anadromous salmonids using the fish ladder bearing ISO FDX-B PIT
tags at Hiram Chittenden Locks.
Unanimously recommended to the LMA Parties to fund the proposal from Dave
Beauchamp (UW) for conducting fall surveys to investigate factors influencing sockeye
growth and survival in Lake Washington using uncommitted zooplankton funds from
2003.
Unanimously recommended to the LMA Parties to fund a proposal from the WDFW to
analyze first year genetic samples collected under the Oncorhynchus mykiss genetics
study and produce a preliminary report.
Unanimously supported the 2003 weir protocols to protect chinook
Unanimously supported the 2003 egg take goal of 17.2 million for the Cedar R. hatchery
Unanimously supported the 2003 thermal marking plan for the interim hatchery including
the release strategy
Unanimously supported funding WDFW carcass collection for adult otolith recoveries
Looking Ahead (Planned 2004 Accomplishments)
In 2004, the AFC will continue to advise SPU on the replacement hatchery including the facilities
design and other program elements. The AFC will continue to advise the City on fish passage
and interim hatchery operations. A number of proposals under the Interim Mitigation Program for
Chinook, Coho, and Steelhead were recommended for funding in 2004. The AFC is also
reviewing the 2005 project needs and priorities for the Interim Program for Chinook, Coho, and
Steelhead.
73
74
Instream Flows Background
The City of Seattle manages the Cedar River water supply to: (1) provide its customers in the region with
a high quality, reliable, and adequate supply of drinking water; (2) protect aquatic resources in the Cedar
River; and (3) provide a measure of flood protection and electrical power generation compatible with the
City’s primary water supply mission. The instream flow management strategy commits the City to a
binding instream flow regime designed to improve habitat conditions for chinook, coho, sockeye salmon,
and steelhead trout in the regulated portion of the Cedar River.
Based on many years of study and analysis of the needs of all life stages for each of the four anadromous
species, the flows provide habitat for spawning, incubation, rearing, migration and adult fish holding.
The flow regime includes not only minimum instream flow requirements but also adaptive provisions for
allocation of supplemental flows above minimums in accordance with real time hydrologic conditions and
biological need. Instream flow management is guided by the multi-agency Cedar River Instream Flow
Commission (IFC).
It is important to note that, as used in the HCP, the term minimum flow does not connote an instream flow
that provides only minimum habitat or benefit for fish. Rather, such flows represent commitments to
minimum levels of instream flows that the City will allow to occur. These minimum flows are designed
to provide substantial benefit and habitat for the fish species addressed. As used in the HCP,
supplemental flows are increases above minimums that are believed to provide even greater benefits
during certain times of the year. The combination of minimum and supplemental flows is termed
guaranteed flows.
In addition to these guaranteed river flows, the HCP instream flow management commitments provide the
following measures:
•
•
•
•
•
•
•
Limit rates of decrease in river levels (down-ramping) to minimize the risk of stranding fish in
shallow areas
Guaranteed flows in the “bypass reach” between the Masonry Dam and the Cedar Falls Hydroelectric
Plant
Create the Cedar River Instream Flow Commission (IFC), comprised of representatives from federal,
state, local and tribal resource agencies, which will assist the City in carrying out its responsibilities
for managing the Cedar River for fish and people
Develop and implement a research and monitoring program (known as “Supplemental Studies”) to
support SPU and the IFC in the management of water supply and river flows in the Cedar River
Move the measurement (compliance) point for flows in the lower river from Renton, at the mouth of
the Cedar River, to Landsburg to more closely align SPU’s responsibilities with its capabilities and
authority and to provide more natural flow patterns for aquatic resources in the lower river
Provide funding for: 1) improvements at the Ballard Locks to increase survival of young fish as they
migrate to sea; 2) to protect and restore habitat in the Cedar River Basin downstream of the
Landsburg Diversion Dam; 3) to develop water conservation messages for the public related to
protecting fish and fish habitat; and 4) to modify hydroelectric facilities at Cedar Falls and Masonry
Dam for additional fish protection.
Evaluate the potential permanent use of “dead storage” in Chester More Lake reservoir (water below
the elevation of gravity out-flow) for improved instream flows and water supply
75
HCP Program Element: Implementation of the Cedar River Instream Flow Agreement and
Workings of the Instream Flow Commission
HCP Program Category: Instream Flow Management
Contact: George Schneider, Water Resource Manager; Rand Little, Senior Fisheries Biologist, Water
Management Section
Objectives & Goals
The City of Seattle influences river flows in the Cedar River through its water supply and hydroelectric
operations within the municipal watershed. Water from the Cedar River is used by about two-thirds of
the City's 1.3 million customers in King and Snohomish Counties. The objective of the Instream Flow
Agreement of the HCP is to provide highly beneficial conditions for instream resources, while preserving
Seattle’s water supply and power generation capabilities. We intend to meet this objective, using an
extensive, collaboratively developed, scientific information base coupled with an adaptive approach to
instream flow management that is supported by continuing research, management flexibility and effective
oversight.
Status of Work (2003)
The Instream Flow Agreement (IFA) established a body to assist the City in carrying out its river
management responsibilities. The Cedar River Instream Flow Commission (IFC) was first convened in
July 2000, and has met, on average, every month since then. In HCP Year 3, the IFC participated in realtime stream flow management decisions, guided the development and implementation of supplemental
studies and other technical analyses, and monitored compliance with the IFA. Meetings are chaired by
SPU (George Schneider, chair; Rand Little, vice-chair) and have been very well attended. Organizational
membership is as follows:
NOAA Fisheries – Voting Member
U.S. Fish and Wildlife Service – Voting Member
Washington Department of Fish and Wildlife – Voting Member
Washington Department of Ecology – Voting Member
Muckleshoot Indian Tribe – Voting Member
City of Seattle – Voting Member (representing both Seattle Public Utilities and Seattle City
Light)
Corps of Engineers – Non-voting Member
King County – Non-voting Member
The Cedar produced large numbers of juvenile chinook and sockeye in the spring of 2003, indicating
good conditions for salmon spawning, incubation and emigration (Table 1 and Figure 2). Although the
return of spawning adult steelhead in the spring was again disappointing, all steelhead redds were
protected from dewatering with the application of supplemental stream flows. Spring, summer and fall
instream flow management efforts were complicated by the need to mitigate the effects of extremely poor
snowpack, early snowmelt and an exceptionally warm and dry summer. This was complicated by the
need to coordinate all activities with the construction of fish passage facilities at the Landsburg diversion
dam, construction and testing of fish and flow protection facilities at the Cedar Falls powerhouse and the
construction of new water treatment facilities at Lake Youngs.
Despite the difficult summer conditions, sufficient storage was available to augment stream flows to
levels that were significantly higher than estimated natural unregulated flows during much of the early
portion of the salmon spawning season in the fall. With the fortunate timely return of the fall rains in late
October, we were able to continue to supply supplemental high normal flows throughout the salmon
spawning season. Flood storage capacity was maintained at sufficient levels throughout the fall and early
winter to moderate the detrimental effects of several large storm events that caused substantial egg
mortality in many river systems in the Puget Sound region. Preliminary reports from WDFW indicate
76
that the 2004 emigration of naturally produced Cedar River sockeye fry may be the largest since the
annual counts began in 1992 (Figure 2).
While the early news on juvenile salmon production is encouraging hydrologic conditions began to
deteriorate significantly throughout Western Washington during March and April of 2004. While it
appears that reservoir storage conditions will be near normal at the start of the summer drawdown season,
watershed conditions are unusually dry. Unless conditions change, we are likely to see continued low
reservoir inflows and rapid depletion of reservoir storage through the summer months of 2004.
The third Annual Compliance Report was prepared for the IFC and delivered in March 2004. It
demonstrates that SPU was in full compliance with all applicable IFA minimum flow provisions. Four
out of the five annual supplemental flows volumes were provided in 2003. With very dry conditions
developing in the late spring and early summer, the IFC agreed to forgo allocation of the non-firm
supple mental summer block of water to help better position the system for meeting the needs of returning
salmon in the fall. The firm supplemental summer block of water was fully allocated and was sufficient
to provide 100% dewatering protection for all steelhead redds throughout the steelhead incubation period.
During 2003, we experienced 5 distinct events in which downramping provisions were slightly exceeded
at Landsburg Dam. Three of these events were directly associated with operations of tainter gates at the
Landsburg Dam in support of fish passage facility construction and start-up operations. Two events were
the result of inadvertent operational errors (please see page 10 in the attached HCP Year 3 Annual Flow
Compliance Report).
The HCP also directs SPU to manage average annual Cedar River diversions in the 98 to 105 mgd range
for the first five to ten years of the HCP. In calendar year 2003, mean annual diversion was 83 mgd ; in
calendar year 2002, mean annual diversion was 79 mgd; in 2001, with water use curtailments in effect for
the summer, mean annual diversion was 90 mgd; in 2000, mean annual diversion was 93 mgd.
With the passage of anadromous fish above the Landsburg Diversion Dam came new operating
requirements below Masonry Dam and the Cedar Falls Powerhouse. A new fish flow valve installed in
the Masonry Dam in early 2003 began providing continuos flow of at least 30 cfs in the “canyon reach”
(which is below the lower Cedar Falls ending at Cedar Falls Powerhouse) starting in September 2003.
Also, new downramping requirements below Masonry Dam and below Cedar Falls Powerhouse were
initiated in September 2003. During the 2003 compliance period, we experienced one distinct event in
which downramping provisions were exceeded below the Cedar Falls Powerhouse due to inadvertent
operational errors (please see page 8 in the attached HCP Year 3 Annual Flow Compliance Report). For
additional information, please see following section titled: Improvements to the Cedar Falls
Powerhouse and Masonry Dam.
Looking ahead: Planned 2004 accomplishments:
The IFC will continue its work in all of the areas that it has been involved with so far. Considerable focus
will be on advancing the research and technical study program (see following section). In 2004, the City
will try to achieve the goals related to water rights, i.e.; dedication of 100 mgd of the Cedar claim to
instream uses, and modification of the water right permit for the dead storage temporary pump plant to
reflect the HCP and IFA
Financial Summary:
This is not an HCP cost commitment. Thus there is no financial summary for this activity.
77
Figure 1 – Cedar River Mean Daily Stream Flow – 2003
Last Update: 12/29/2003
Calendar Year 2003
Cedar River Instream Flows Measured at USGS Stream Gage No. 12117600
All Data is Provisional and Subject to Revision
2000
1800
Non-Firm Flow Supplement for
Sockeye Outmigration between
February 11 and April 14 as
determined each year by the City.
1600
Non-Firm Block - up to 3500 Ac-Ft Allocation for
Steelhead Incubation between June 17 and August
4. Minimum flows protect all steelhead redds in
2003. Non-firm block not allocated due to very dry
conditions.
High Normal Minimum Flows for Sockeye and
Chinook Spawning between October 8 and
December 31. Impementation guided by
provisions in the Instream Flow Agreement.
1800
1600
Higher Normal Flows for Sockeye and Chinook
Spawning between September 15 and September 30 .
Temporary Flashboards on the Overflow Dike were in
place throughout the period June 1 to September 30.
1400
1400
1200
1200
1000
1000
Firm Block - 2500 Ac-Ft Allocation for
Steelhead Incubation between June 17 and
August 4. To be set each year by the
Instream Flow Commission
800
800
600
600
400
400
200
200
0
1-Jan
8-Jan
15-Jan
22-Jan
29-Jan
5-Feb
12-Feb
19-Feb
26-Feb
5-Mar
12-Mar
19-Mar
26-Mar
2-Apr
9-Apr
16-Apr
23-Apr
30-Apr
7-May
14-May
21-May
28-May
4-Jun
11-Jun
18-Jun
25-Jun
2-Jul
9-Jul
16-Jul
23-Jul
30-Jul
6-Aug
13-Aug
20-Aug
27-Aug
3-Sep
10-Sep
17-Sep
24-Sep
1-Oct
8-Oct
15-Oct
22-Oct
29-Oct
5-Nov
12-Nov
19-Nov
26-Nov
3-Dec
10-Dec
17-Dec
24-Dec
31-Dec
Average Daily Flow, cfs
2000
0
Days of the Calendar Year
Normal Minimum Flows
78
Normal Minimum Flows Plus Supplemental Flows
Actual Flows
Critical Minimum Flows
Table 1: Lake Washington Juvenile Chinook Salmon Production
Cedar River Juvenile Chinook Production
Source: David Seiler, WDFW (2002, 2003 data preliminary)
Outmigration
Estimated No. of Estimated No. of No. of Juveniles
Year
Spawning
Juvenile
per Spawning
Females
Emigrants
Female
1999
173
80,932
468
2000
180
64,723
360
2001
53
32,249
608
2002
395
126,473
320
2003
266
235,397
885
Bear Creek Juvenile Chinook Production
Source: David Seiler, WDFW (2002, 2003 data preliminary)
Outmigration
Estimated No. of Estimated No. of No. of Juveniles
Year
Spawning
Juvenile
per Spawning
Females
Emigrants
Female
1999
159
15,148
95
2000
293
32,220
110
2001
133
11,157
84
2002
276
22,390
81
2003
N/A
17,313
N/A
79
Figure 2: Cedar River Sockeye Salmon Fry Production
Cedar River Juvenile Sockeye Production
(Data Source: David Seiler, WDFW; preliminary projections for 2004)
60,000,000
hatchery
Number of Juvenile Sockeye
50,000,000
wild
40,000,000
30,000,000
20,000,000
10,000,000
0
1992
1993
1994
1995
1996
1997
1998
1999
Emigration Year
80
2000
2001
2002
2003
2004
HCP Program Element: Chinook/Supplemental Biological Studies and Steelhead Redd
Monitoring Projects (N663308 & N663309)
HCP Program Category: Instream Flow Monitoring and Research
Contact: Rand Little, Senior Fisheries Biologist; Karl Burton, Fisheries Biologist; Water
Management Section
Objectives and Goals
The HCP instream flow management program on the Cedar River attempts to provide certainty
for instream resource protection through the implementation of the guaranteed flow regime based
on more than 10 years of collaborative study and analysis. The program also provides flexibility
to improve and adapt management practices as new information becomes available. The HCP
provides this flexibility by placing limits on municipal diversions, providing funding for
continued study, and by collaborating with the Cedar River Instream Flow Commission in using
new information from a suite of supplemental studies to adapt and improve instream flow
management practices in the future.
Soon after its inception in July of 2000, the IFC developed the following objectives for the
supplemental studies in support of ongoing efforts to adaptively manage instream flows in the
Cedar River:
•
•
•
•
Continue to increase our understanding of the relationships between stream flow and
habitat conditions in the Cedar River, with an emphasis on chinook salmon and other
naturally reproducing salmonids
Support effective allocation of the “firm” and “non-firm” blocks of water during the
summer
Help guide the allocation of available water above guaranteed levels
Help address several remaining technical issues that emerged in the later stages of the
HCP development
Status of Work (2000-03)
From the objectives above, the IFC developed 9 study topic areas and 19 specific study questions.
Through an iterative process, the IFC spent approximately one year refining and prioritizing the
study questions and developing preliminary study scopes for each question. The study topics and
questions address four major areas of interest:
•
•
•
•
Chinook and sockeye spawning and incubation
Chinook early life history
The relative effect of stream flow on water temperature
The relationships between stream flow and natural ecological processes that shape and
maintain riparian and in-channel habitat in altered systems.
This work is summarized in a draft document that was finalized in September of 2001 entitled:
Cedar River Instream Flow Management: Biological Research and Monitoring. This product is
considered a living document that will continue to be revised as it is used to guide the
implementation of supplemental studies.
81
A number of high priority instream flow studies have been conducted HCP years 1, 2 and 3. One
of the first studies implemented by the IFC was an investigation of temporal and spatial
distribution of chinook salmon spawning activity. This work, initially funded with funds from
the HCP, has recently received additional funding support from the King Conservation District
and the King County Department of Natural Resources. SPU staff has collaborated with staff
from WDFW, the Muckleshoot Indian Tribe and the King County Department of Natural
Resources to monitor chinook spawning activity, collect, age, sex and size data from carcasses
and record interactions with spawning sockeye in 2000, 2001, 2002 and 2003. SPU and its
research partners were successful in obtaining grants from the King Conservation District in
2001 and 2002 and from the King County Department of Natural Resources for work conducted
in 2003. These grants covered nearly all costs incurred by SPU during the 2001, 2002 and 2003
chinook spawning study and thus reduced the required amount of Cedar HCP funding. Annual
project reports are available for 2000, 2001, 2002 and 2003.
Since 1999, WDFW has conducted a major sampling effort to estimate the number of juvenile
chinook emigrating from the Cedar River each year. This project continued in 2003 with funds
from King County and the Landsburg Mitigation component of the Cedar River HCP.
Information from this project is considered very useful in addressing several instream flow
supplemental study questions. This information is perhaps of most immediate interest in
addressing one of the top priority questions identified by the IFC: “Are the numbers of recently
emerged chinook fry that migrate out of the Cedar River [as opposed to remaining to rear in the
river] correlated with stream flow?” The IFC has identified the continued collection of chinook
emigration data by WDFW as a key element in addressing this question. Supplemental study
funding may be allocated to investigate potential relationships between stream flow and chinook
early life history in the Cedar using past WDFW data.. WDFW has also conducted annual
enumeration of sockeye fry emigrants from the Cedar River since 1992. The IFC has identified
this effort as another high priority information source for instream flow management. If future
funding from current sources becomes unavailable, the IFC will consider funding these fry
enumeration programs with funding from the HCP instream flow supplemental studies program.
The IFA provides for "firm" and "non-firm" volumes of water to supplement minimum flows
during the steelhead incubation period. In order to support decision making regarding this water,
SPU, in collaboration with the Washington Department of Fish and Wildlife (WDFW), continued
annual steelhead spawning and incubation studies as provided in Section E. 5. of the Instream
Flow Agreement. In 2000, 2001, 2002, and 2003 this monitoring program was used by the IFC to
allocate the supplemental blocks of summer water in a manner that ensured all steelhead redds in
the Cedar River were protected from dewatering. Final reports are available for the results of
studies conducted in 2000, 2001, 2002 and 2003.
At the direction of the IFC, SPU entered into an agreement with the U. S. Fish and Wildlife
service to conduct juvenile chinook rearing habitat electivity studies on the mainstem Cedar River
during the spring of 2002. This study will supplement previous collaborative IFIM, PHABSIM
analyses conducted on the Cedar during the late 1980s. Due to relatively high flows during the
spring of 2002, and the need for additional information, further field work was conducted in the
spring of 2003 and 2004. We expect a draft report on the juvenile chinook habitat electivity
studies to be submitted to the IFC in late 2004. We anticipate that this work will help guide the
second phase of the study; assessment of the effects of stream flow on juvenile chinook rearing
habitat availability.
82
In 2002, the IFC initiated the first phase of a interesting and challenging effort to explore the
relationships between stream flow and natural ecological processes that shape and maintain
riparian and in-channel habitat in altered systems. The first step in this process will be to
compare a wide range of hydrologic characteristics exhibited by a natural, unregulated flow
regime in the Cedar with those exhibited by the present regulated regime. During extensive
discussions in 2002, it became clear that developing robust “natural” and “regulated” flow data
sets for this exercise will be a significant effort. After much discussion and work, the IFC agreed
to contract independent expertise to help guide the development of synthetic “natural” and
“regulated” flow data sets. This work was commissioned in early 2003 and a final report
providing recommendations on appropriate technical approaches to compiling the data sets was
submitted to the IFC in late 2003. SPU is currently developing a draft work plan for compiling
the flow data sets. The plan is expected to be submitted to the IFC in the near future with work
scheduled to commence later this year.
Looking Ahead (Planned 2004 Accomplishments)
Steelhead spawning and incubation and chinook spawning studies will continue in 2004. SPU, in
collaboration with WDFW and King County, has submitted another grant proposal to the King
Conservation District to fund chinook spawning surveys in 2004. As mentioned above, WDFW
will continue to enumerate emigrating juvenile chinook and the IFC may ask WDFW to begin
analyzing past data to investigate potential links between stream flow and early life history
characteristics. Juvenile chinook rearing habitat electivity studies are scheduled to be completed
in 2004; juvenile chinook habitat availability studies are expected to be initiated in the spring of
2005. The IFC will be working with SPU staff and independent hydrologic consultants as needed
to generate ”unregulated” and “regulated” flow data sets for the Cedar River. Once these data
sets have been created, we will explore differences in the hydrologic characteristics between the
two in an effort to better understand the ecological effects of the differences in “natural” and
‘regulated” flows in stream channels that have been subje ct to a high degree of physical
alteration.
Several technical/engineering studies to be overseen by the IFC will commence in 2003. These
are discussed under the following program element.
Financial Summary
The Year 2 cost commitment for Chinook Studies was $223,020 for Chinook Studies, and
$35,400 for Steelhead Redd Monitoring. The actual cost commitment expenditures in HCP Year
3 for the two projects combined totaled $154,537. Successful efforts to secure grant funding for
the chinook spawning studie s, a delay in a portion of the juvenile chinook rearing studies and a
very small return of adult steelhead in 2003 resulted in expenditures below anticipated budget
levels.
83
HCP Program Element: Streamflow Gaging and Technical/Engineering Studies
HCP Pro gram Category: Instream Flow Monitoring and Research
Contact: George Schneider, Water Resources Manager and Alan Chinn, Senior Civil Engineer,
Water Management Section
Objectives and Goals
To effectively perform water management responsibilities as well as monitor compliance with
conditions of the Instream Flow Agreement, Seattle participates in a cooperative stream gaging
program with the USGS. The IFA requires the maintenance of certain existing stream gages and
the installation and maintenance of some new gages. The Accretion Flow Study, a component of
the instream flow research and monitoring program that will likely require installation of
temporary stream gages, is intended to validate certain hydrologic assumptions that were used in
the development of the instream flow regime. The objective of the Switching Criteria Study is to
develop criteria that would be used by the IFC to help decide the appropriateness of moving from
a normal to a critical instream flow regime, and to decide between high-normal and low-normal
flow regimes in the fall.
Status of Work (2003)
Streamflow Gaging
Existing gages to monitor compliance with elevations and flow and downramping rate
requirements were maintained continuously throughout this reporting period.
Accretion Flow Study
The Instream Flow Commission (IFC) and other key participants met at several monthly IFC
meetings to discuss the need for the Accretion Flow Study and to design a study plan to carry out
continuously over the next 10 years or so. In ge neral, the study will:
ο
ο
ο
ο
specify the precise inflow assumptions to be evaluated,
establish and implement a long-term monitoring protocol,
establish analytical objectives; identify any apparent long-term differences from the
assumptions, and
perform additional investigations and analyses to identify causes of any differences from
the assumptions.
An initial level of accretion flow monitoring has already been started. In the lower Cedar River,
Seattle maintains three existing stream gages through its cooperative stream gaging program with
the USGS. These stream gages continuously record mean daily streamflow data in the Cedar
River just upstream of the Landsburg dam (USGS Stream Gage No. 12117500 at river mile 23.4),
immediately downstream of Landsburg dam (USGS Stream Gage No. 12117600 at river mile
20.4) and at a location in Renton near the mouth of the river (USGS Stream Gage No. 12119000
at river mile 1.6). Seattle also continuously monitors and records average daily water diversions
made at the Landsburg Facilities (river mile 21.9). In addition, Seattle operates and maintains an
existing weather station at Landsburg. The data collected at these existing monitoring stations are
providing useful information to help characterize the accretion flow patterns in the lower Cedar
River. The data will be continuously collected over the study period for analysis purposes.
84
Figure 1 below is an example of a draft conceptual monitoring and tracking graph that was
prepared and regularly updated for the IFC durin g 2003 using the provisional real-time
streamflow data collected at USGS Stream Gage No. 12117600 and USGS Stream Gage No.
12119000.
Figure 1. Draft conceptual monitoring and tracking graph for estimating lower Cedar River
accretion flow between Landsburg and Renton.
To provide additional field data to help meet other specified study needs and objectives that
might be established by the IFC during the study design phase, HCP cost commitments allow for
up to three additional temporary stream gages to be strategically installed in the Lower Cedar
River between Landsburg dam and Renton. In 2003, the IFC expressed their desire to possibly
involve the USGS on various potential phases of this accretion flow study. The USGS was
contacted and they indicated that they have researchers who are interested and available to work
on this project.
Looking Ahead (Planned 2004 Accomplishments)
The IFC will continue to work on developing a detailed 10-year Accretion Flow Study plan to
implement within the resources available. The Switching Criteria Study is expected to begin in
2004. Existing gages will be operated and maintained continuously throughout 2004 to monitor
compliance with elevations and flow and downramping rate requirements.
85
Financial Summary
During HCP Year 3, Seattle Public Utilities and Seattle City Light made cost commitment
expenditures for three stream gages. For the existing stream gage above the Cedar Falls
Powerhouse, the existing stream gage below the Cedar Falls Powerhouse and the existing stream
gage below Landsburg, the City spent $53,195 for gage operations and maintenance to
monitoring instream flow and downramping requirements.
For the following activities, there were no cost commitment expenditures made: (see Financial
Monitoring Report Comments column for details)
•
•
•
Temporary Gages in Lower River
New gage at Renton
Switching Criteria Study
A total of $1761 was expended toward the HCP cost commitment for the Accretion Flow Study.
86
HCP Program Element: Cedar Permanent Dead Storage Project Evaluation
(C100052 – C 100057)
HCP Program Category: Instream Flow Monitoring and Research
Contact: Daniel Basketfield, Sr. Water Resources Engineer, Water Management Section;
Dwayne Paige, Senior Watershed Ecologist, Watershed Management Division
Objectives and Goals
Water stored below the existing outlet of Chester Morse Lake is known as “dead storage”.
Currently, this significant amount of water can be accessed only by operating the Morse Lake
Temporary Pumping Plants, and is permitted only during water shortage emergencies and under
other very limited situations. In the context of the Cedar River Instream Flow Agreement, Seattle
Public Utilities (SPU) has committed to evaluate use of dead storage to provide additional water
for both instream uses and municipal and industrial water supply.
The reservoir currently supports healthy populations of fish and wildlife, including bull trout,
which have been listed as threatened under the Endangered Species Act, and approximately one
quarter of the breeding loon population in Washington State. Increased frequency and/or deeper
reservoir drawdown may prevent bull trout upstream spawning migrations and impair loon
nesting during some years. Project elements would include environmental studies, engineering
and water rights evaluations, cost estimates, yield analyses, negotiations over instream flow
augmentation, and other studies. The environmental impact and mitigation study would include
literature search and model effects of increased reservoir drawdown on fish, wildlife, and wetland
vegetation over a three-year period. If lower than usual drawdown occurs during the study
period, effects on biota would be directly observed.
Status of Work (2003)
In early 2002, at the recommendation of the IFC, The Parties to the IFA approved the first
amendment to the IFA. The amendment extended by five years the overall schedule for
completion of the full suite of dead storage-related studies. It was agreed that certain aspects of
the environmental evaluation that were proposed should proceed at the original schedule. These
relate to impacts of reservoir drawdown on resident species and plant communities. These
studies are relevant even without the development of permanent dead storage since low reservoir
conditions may occur whenever there is a period of severe drought.
The fall and early winter drought of 2002 provided unusual opportunity to observe relatively low
Chester Morse Lake elevations. Aerial photos were taken at levels as low as 1538 feet.
Significantly, it was observed that the steeply sloped portions of the delta fans, thought to be a
potential bull trout migration barrier at reservoir levels as high as 1540 feet, did not present a
passage problem at the minimum reservoir level that was reached, around 1537.5 feet.
Looking ahead: Planned 2004 accomplishments:
The approved amendment to the IFA, noted above, calls for commencement of scoping for five
environmental components of the Cedar Permanent Dead Storage Project. These components
are:
•
•
•
Dead Storage Study Engineering Assessment;
Delta Fans Geomorphologic Investigations and Modeling;
Bull Trout Passage Assistance Plan;
87
•
•
•
Pygmy Whitefish/Rainbow Trout Studies;
Delta Plant Community Monitoring; and,
Assessment of Common Loon Nesting Habitat
This work will be initiated this year.
In a related project, SPU will be looking into the reliability of the existing temporary pumping
plant system at Chester Morse Lake. Experience during last year’s drought, when the plants were
mobilized but not actually used, showed that some improvements to the existing system may be
warranted. The work to evaluate such improvements could also be used to assess some aspects of
a permanent dead storage project, so these efforts will be closely coordinated.
If it is determined during the scoping processes that consultants and/or other professional services
are required to conduct all or part of these investigations, procedures for hiring such project
support can also be initiated during 2003.
Financial Summary:
The recently approved amendment to the IFA delayed the start of cost commitments on this
project.
Expenditures toward HCP cost commitments in 2003 were as follows:
Engineering, Water Quality and Economic Studies (C100052)
Bull Trout Passage Assistance Plan (C100053)
Common Loon Nesting Habitat Study (C100056)
Bull Trout Spawning Impedance Study (C100057)
88
$4162
$ 632
$ 84
$8618
HCP Program Element: Improvements to the Cedar Falls Powerhouse and Masonry Dam
HCP Program Category: Instream Flow Management
Contact: Liz Ablow, Senior Fisheries Biologist; Pat Steele, Project Manager, Seattle City Light
Objectives and Goals
As part of the City of Seattle’s HCP, Seattle City Light has been making changes at the Masonry
Dam and the Cedar Falls Powerhouse to improve fish habitat within the Seattle’s municipal
watershed. These are important components of the HCP, as downstream improvements at
Landsburg has allowed migrating anadromous salmonids access to this reach of the Cedar River
for the first time in nearly 100 years.
Status of Work (2003)
1) Cedar Falls Tailrace Barrier
A tailrace barrier was installed at the Cedar Falls Powerhouse in 2002 to prevent injury to adult
salmon and steelhead when anadromous fish passage occurred in 2003 above Landsburg. HCP
year-3 accomplishments include:
• Initial tailrace barrier testing of flow characteristics during normal discharge and during flow
events were implemented.
• Alterations to tailrace barrier were made, including installation of baffles to dissipate energy
during flow events.
• Successful follow up testing occurred after tailrace barrier modifications were made.
• Monitoring of tailrace barrier continues.
2) Cedar Falls Flow Modification
Modification to the dam are required to provide a continuous minimum river flow of 30 cfs in the
canyon reach (between lower Cedar Falls and the Powerhouse) and to improve the control system
for downramping. These changes include the installation of a new low-level valve in Masonry
Dam. HCP year-3 accomplishments include:
• Completed installation of fish flow valve in Masonry Dam.
• Implemented remote control of Masonry dam valves that control flow downstream, control
points include the Cedar Fall Powerhouse and the System Control Center located in Seattle.
3) Cedar Fall Emergency Bypass Improvements
This Project will install mechanical devices and electronic controls on the bypass valves in the
powerhouse to maintain and regulate flow in the event of a load rejection or load reduction. This
will protect against stranding of fish and dewatering of redds as a result of such events. HCP
Year 3 accomplishments include:
•
•
•
Active testing was completed
Continued monitoring of equipment occurred
Additional fine-tuning and minor adjustments of the automatic coordination continues
4) Installation of USGS gage
Installation of a new USGS gage upstream of the Cedar Falls Powerhouse is required to monitor
the flow for compliance purposes once fish passage above Landsburg occurs. Accomplishments
in HCP Year 3 include:
• Rating curve is continuing to be expanded.
89
Looking Ahead (Planned 2004 Accomplishments)
Most of the project construction was completed in 2002 and 2003. In Masonry Dam the
installation and calibration of a flow meter is planned for early 2004. Remote control of the fish
flow valve will be activated. Also, the development and installation of an automatic downramp
capability for the Howell-Bunger valve in Masonry Dam is planned for 2004.
In the Cedar Falls Powerhouse improvements of the operator interface to the control system are
planned. This will improve the operators’ ability to more easily respond to events that could
cause flow disruptions in the river. For both the Cedar Falls Powerhouse and the Masonry Dam
monitoring and fine-tuning of the new equipment will continue.
Financial Summary
The cost commitments for the Emergency Bypass project totaled $385,000; expenditures for the
Emergency Bypass project totaled $870,618 in 2003, which combined with previous expenditure
totals $2,640,272 (91% of life-to-date expenditures). This is substantially higher then the
financial commitment because a decision was made to develop a more reliable emergency bypass
system than what was called for in the agreement. For the tailrace barrier, expenditures were
originally planned to occur in HCP Year 3 but the project was accelerated to ensure that it would
be completed prior to fish passage at Landsburg planned for early fall 2003. The cost
commitments for the tailrace barrier totaled $275,000; actual expenditures for HCP year-3
equaled $477,858, which combined with previous expenditure totals $ 1,851,574 (94% of life-todate expenditures). See Program Element Summary for Streamflow Gaging and
Technical/Engineering Studies for financial information on the new stream gage above the Cedar
Falls Powerhouse.
90
HCP Program Element: Conservation Messages for Fish
HCP Program Category: Instream Flow Management
Contact: Rich Gustav, Resource Conservation Division
Objectives and Goals
The goal of HCP marketing efforts is to educate consumers about the importance of their personal
water use to our region’s salmon habitat. Teaching our customers to use less water enables us to
keep more water in the river for fish. Such conservation efforts are being carried out under SPU’s
1% Water Conservation Program.
The goal of the 1% Percent Program is to reduce personal and business water consumption one
percent every year over a 10-year period with the end result being an overall reduction in water
use of ten percent. Such conservation efforts could save approximately 18 million gallons of
drinking water per day. Such an amount is the equivalent demand of 130,000 new households or
the projected population growth in King County over the next ten years. Keeping water demands
lower reduces the demands on water supply by reducing the need for diverting water from instream flows. Conserving water is a critical part of our commitment to wise management of
natural resources.
Status of Work (2003)
There were a number of public outreach vehicles for distributing salmon related messages. The
table below describes the vehicles and messages.
Product
Type of
Promotion
General Message
Target
Audience
Bert The
Salmon
Cartoon
TV Ad
If you use too much water
there won’t be enough for
Bert and his friends. You
can save water by turning it
off while brushing your
teeth, taking shorter showers
and watering your lawn only
in the early morning or
evening.
Families and
kids.
280,000
Shown on
KOMO TV,
KCPQ and
WB 22
$25,000
Issaquah
Salmon
Days Booth
Event
promotion
Conserving water is
important to our water
supply and fish.
250,000
visitors
$2,000
Water
Busters
Game
On-line
interactive
game
Available to
everyone
with internet
access.
$40,000
Water
Supply
Online
Interactive map
A race against the clock to
help Bert the Salmon and
his friends find all the ways
to save water in the home so
there is more water
available for fish:
http://www.savingwater.org/
waterbusters/
Educates our customers
about where their water
Regional
Saving Water
Partnership
customers
Families and
kids
Online to all
regional
$17,000
Develop-
Families and
school aged
Size of
Distribution
Cost
91
Interactive
Map
of our regional
water supply.
Water
Supply
Poster
Printed map of
our regional
water supply.
Natural
Yard Care
New overview
booklet for
home owners
Why
Conserve?
Fact Sheet
The
“Naturals”
brochure
series
Printed in-depth
guides covering
environmentally
friendly yard
care.
comes from and how it
reaches their homes. This
map shows the relationship
between fish and drinking
water:
http://www.savingwater.org/
waterconnection/default.htm
Educates our customers on
where their water comes
from and how it reaches
their homes. This map
shows the relationship
between fish and drinking
water
Leaving grass clippings,
careful watering, using less
soluble fertilizers and
avoiding herbicides makes
the lawn healthier, a safer
place for kids and pets, and
causes less impact on local
bodies of water and salmon.
People need to conserve
water because resources are
finite and salmon and other
creatures also depend on
this water for their survival
“Smart Watering,”
“Healthy Soil,” “Natural
Lawn,” “Right Plant,”
“Compost at Home” and
“Natural Pest,” all help to
educate serious gardeners
about landscape practices
that reduce water use and
eliminate the need for
chemicals that can run off
and effect our streams and
salmon runs.
children, ages
8 - 13
customers
ment
Families and
school aged
children, ages
8 - 13
2,000
posters
$7,000
Development and
printing
Residential
yard owners in
Seattle and
purveyor water
districts
23,725
$7,300
Home owners
and anyone
who pays a
water bill
2,000
$600
Hotlines,
nurseries,
purveyors, The
Northwest
Flower and
Garden Show,
and other
partners such
as King
County.
20,855
$9,384
TOTAL
$108,284
Looking Ahead to 2004
An outreach and educational conservation practices campaign is currently underway for 2004 that
targets residential high peak-use water customers by appealing to their desires for beautiful
gardens. A second major effort is Northwest Natural Yard Days, which has grown into a two
month event promoting natural yard care practices that keep pesticides and other chemicals out of
creeks and streams. The event is a partnership with King County and area lawn and yard care
retailers. Another major outreach effort involves a newly produced and soon to air Bert the
Salmon television ad. The ad will be part of an annual youth-oriented television educational
campaign.
92
HCP Program Category: Instream Flows
HCP Program Element: Locks Improvements - Smolt Passage Improvements and
Freshwater Conservation (C100014, C100013)
Contact: Melinda Jones, Strategic Advisor
Resource Planning Division
Goals and Objectives
One of the objectives of the instream flow management component of the HCP is to help support
measures that will contribute to improving downstream migration conditions for juvenile
salmonids at the Hiram M. Chittenden Locks. The Smolt Passage Improvements project commits
funding for smolt passage improvements at the Locks in co-sponsorship with King County and
the Muckleshoot Indian Tribe. The Freshwater Conservation project commits funding for a
feasibility study and implementation of cost-effective long-term water efficiency improvements at
the Locks, with the aim of providing improved fish passage conditions.
Status of Work (2003)
The City continued to provide partial funding and sponsorship, through the joint
Corps/City/County Lake Washington Ecosystem Restoration General Investigation Study, for ongoing work related to the following: PIT and microacoustic tag field studies to help determine
smolt survival by migratory route segment, and other technical field research focused on juvenile
salmon migration and habitat upstream and downstream of and through the Locks; regular
monitoring and periodic refinement of the operation of the four smolt flumes at the Locks
spillway dam; and analyses of approaches for water quantity and water quality modeling.
Looking Ahead (Planned 2004 Accomplishments)
Field work to be completed in 2004 will include a second Smolt Flume Observer Calibration
Study and a second Relative Smolt Flume Efficiency Study. Completion of the joint General
Investigation Study has been delayed by Federal funding cuts, and may not occur until 2006 or
2008.
Financial Summary
There is no HCP commitment for funding in HCP year 3. Modest expenditures were planned for
2003 and beyond to help support work described above; $15,783 was spent in 2003 for Smolt
Passage Improvements and $8,019 was spent in 2003 for Freshwater Conservation.
93
HCP Program Eleme nt: Cedar River Downstream Habitat Protection and Restoration
Program (C100015 and C100036)
HCP Program Category: Landsburg Mitigation and Instream Flow Management
Contact: Cyndy Holtz, HCP Program Manager, Resource Planning Division
Objectives and Goals
Protection and restoration of salmonids and their habitat is vital to successful long-term recovery
in the Lake Washington Basin. The goal of this program is to protect and restore fish habitat in
the lower Cedar River downstream of the City’s ownership boundary. Projects will be designed
in a manner that will benefit any or all anadromous salmonid species, especially chinook salmon,
and enhance natural ecological processes that shape and maintain riparian and aquatic habitat.
Status of Work (2003)
Working closely with King County Cedar Legacy program staff (Department of Natural
Resources), a draft legal agreement has been developed between the City of Seattle and King
County. The agreement provides the mechanism for the City and County to cost-share equally in
the acquisition of habitat lands on the lower Cedar River. A total of 124 individual parcels have
been included on an acquisitions priority list, which will guide King County Resource Land
Acquisitions staff in carrying out acquisition transactions. The agreement provides that the City
will purchase a conservation easement from the County for half the total sale and acquisition
costs, which will secure the City’s interest in preservation of the land for habitat conservation
purposes. The agreement commits the City to contribute $3 million to joint acquisitions with
King County. The HCP total commitment under this program is $5.8 million. If this
collaborative endeavor proves successful, the contract could be expanded to utilize remaining
program funds available. A retroactivity clause has been included in the agreement, which will
allow the City to reimburse King County for one-half the cost of acquisition of 11 parcels that the
County acquired during the two years that negotiations were occurring with the City. The HCP
contribution for these 11 parcels is $500,000.
During 2002 the SPU and King County Cedar River Legacy program staff also collaborated on a
jointly-sponsored grant proposal to the U.S. Fish and Wildlife Service under the Cooperative
Endangered Species Conservation Fund program. The City and County were awarded $1.5
million of the $3 million total funding requested. This grant award will supplement City and
County funds dedicated for this program. The City and County submitted a second funding
proposal for the 2004 funding cycle for an additional $1.5 million. Results should be announced
this fall.
Looking Ahead (Planned 2004 Accomplishments)
During 2004 the legal agreement and related conservation easement drafts will be finalized and
approved by legislative actions of both the City of Seattle and King County Councils. King
County acquisitions staff will step-up acquisitions efforts after the City and County legislatures
approve the agreement.
Financial Summary
The extended length of time to develop the legal agreement between King County and the City of
Seattle deferred expenditures until the third and fourth quarters of 2004. Unexpended HCP Year
94
2 and 3 cost commitment funds will be expended during 2004 through 2006. The HCP provides
funding for this program in two areas: Instream Flows ($3.86 million) and Landsburg Mitigation
($1.93 million). The funds expended toward the HCP cost commitment was $18,392.
95
96
HCP YEAR 2 FINANCIAL MONITORING REPORT
(as of year-end 2002)
50 Year Project Totals
Item
#
Project
Manager
Cost
Commitment
(in 2003 $)
Project Description
Life-to-Date
Cost
Commitment
Expenditures
HCP Year 3
Cost
Commitment
(in 2003 $)
Cost
Commitment
Expenditures
Cost
Commitment
Over(+) or
Under (-)
Expenditures
Performance Commitments
(with $ as stated in HCP, in 1996 $)
Comments
WATERSHED MANAGEMENT
Watershed Road Improvement and Decommissioning (cost category 1)
Average 10 miles of road decommissioned per year over
20 years. Fund $250,000 per year for the first 20 years,
based on cost of $25,000 per mile for deconstruction.
1
2
3
Anderson, C Watershed Road Decommissioning
$5,875,000
Anderson, C Watershed Road Improvements
$8,520,000
Anderson, C Watershed Road Maintenance
SUBTOTALS
$1,040,220
$1,047,332
$295,000
$413,000
$297,319
$413,000
$3,846,880
$252,006
$110,450
$82,198
$18,241,880
$2,339,558
$818,450
$792,517
5.1 miles of road abandoned in 2003.
$2,319
Road repair and improvements, culvert replacement, fish
passable stream-crossing structures, slope stabilization,
construct new roads to reduce sediment loading to river
and streams. Fund $1,750,000 over the first 5 years,
based on cost of $2,000 per mile for stabilization and
repair, and $600 for each additional installed cross drain.
$0 Average annual cost commitment in Years 1-5 is
Provide an increased level of maintenance over levels
previous to HCP implementation specifically for reducing
sediment loading to streams. Fund $468,000 over the first
5 years. Average annual cost commitment in Years 1-5 is
-$28,252 $102,960.
12.5 miles of roads improved, including culvert
installations, road surfacing, ditching and slope
stabilization with soil nailing.
Performed maintenance on 42 miles of roads that have
potential to impact aquatic system.
-$25,933
Stream and Riparian Restoration (cost category 1)
4
Beedle, D
LWD Replacement in Streams
$1,149,250
$32,307
$14,750
$22,712
$7,962
5
Beedle, D
Bank Stabilization
$890,110
$36,974
$23,310
$25,174
$1,864
6
Beedle, D
Bank Revegetation
$249,500
$36,617
$7,820
$32,301
$24,481
7
LaBarge, A
Riparian Conifer Underplanting
$249,530
$26,387
$7,380
$12,257
$4,877
8
LaBarge, A
Riparian Restoration Thinning
$211,840
$24,242
$6,640
$12,209
$5,569
9
Spencer, M
Stream Crossing Projects for Passage of Peak Flows
$1,001,440
$51,647
$18,440
$16,957
-$1,483
10
Spencer, M
Stream Crossing Projects for Fish Passage
$1,427,600
$605,640
$141,600
$134,214
-$7,386
$5,179,270
$813,814
$219,940
$255,824
$35,884
SUBTOTAL
Fund $100,000 over the first 8 years, based on estimated Developed a system to identify and prioritize aquatic
restoration sites and a watershed specific instream habitat
cost of $20,000 per project. Average annual cost
inventory system. Completed two LWD projects on Rock
commitment in Years 1-8 is $13,750.
Creek.
Stabilize approximately 200 feet of stream bank per year Developed a system to identify and prioritize aquatic
restoration sites and a watershed specific instream habitat
averaged over the first 8 years. Fund $158,000 over the
first 8 years, based on cost of $10,000 per 100 linear feet inventory system. Removed poorly designed or failed
stream drainage structures and redesigned channel for
of stream bank. Average annual cost commitment in
long-term stability for 100 linear feet of stream during road
Years 1-8 is $21,730.
abandonment projects.
Revegetate approximately 330 linear feet of stream bank Planted stream crossings in past road abandonment
per year averaged over the first 8 years. Fund $53,000
project areas. Approximately 1950 linear feet were
over the first 8 years, based on cost of $2,000 per 100
planted with 721 native trees and shrubs.
linear feet of stream bank. Average annual cost
commitment in Years 1-8 is $7,290.
Reestablish conifers in riparian and streamside areas for Completed two planting projects on mainstem of Taylor
approximately 20 acres per year averaged over the first 8 Creek. Approximately 500 linear feet of riparian areas
years. Fund $50,000 over the first 8 years, based on cost was improved by these projects.
of $300 per acre planted. Average annual cost
commitment in Years 1-8 is $6,880.
Perform thinning on approximately 18 acres per year
Completed Selleck thinning project and 11 acres on
averaged over the first 8 years. Fund $45,000 over the
unnamed creek in lower watershed. Thinned three acres
first 8 years, based on cost of $316 per acre thinned.
of dense grand fir along mainstem of Taylor Creek, and
Average annual cost commitment in Years 1-8 is $6,190. seven acres in upper watershed in conjunction with
restoration thinning work.
Implement approximately 12 stream crossing projects to
Completed stream 18 stream crossings, designed to
improve flow patterns per year averaged over the first 8
convey 100-year peak flow.
years. Fund $125,000 over the first 8 years, based on
cost of $1,250 per culvert. Average annual cost
commitment in Years 1-8 is $17,190.
Implement approximately 4 stream crossing projects to
Removed fish barrier on tributary to Williams Creek at 13
reestablish fish passage per year averaged over the first 8 Road. Purchased crossing structure for a Carey Creek
years. Fund $960,000 over the first 8 years, based on
project to be constructed in 2004.
cost of $20,000 to $36,000 per culvert or structural
improvement. Average annual cost commitment in Years
1-8 is $132,000.
Upland Reserve Forest Restoration (cost category 1)
97
HCP YEAR 2 FINANCIAL MONITORING REPORT
(as of year-end 2002)
50 Year Project Totals
Item
#
11
12
13
Project
Manager
LaBarge, A
LaBarge, A
LaBarge, A
Cost
Commitment
(in 2003 $)
Project Description
Upland Restoration Thinning
$3,071,430
Upland Ecological Thinning
$1,176,870
Upland Restoration Planting
HCP Year 3
Life-to-Date
Cost
Commitment
Expenditures
$671,183
$83,939
Cost
Commitment
(in 2003 $)
$238,070
$36,880
Cost
Commitment
Expenditures
$194,732
$14,475
Cost
Commitment
Over(+) or
Under (-)
Expenditures
Performance Commitments
(with $ as stated in HCP, in 1996 $)
Conduct restoration thinning on approximately 800 acres
per year averaged over the first 8 years. Fund $1,614,000
over the first 8 years, based on cost of $250 per acre
thinned. Average annual cost commitment in Years 1-8 is
-$43,338 $221,930.
Conduct ecological thinning on approximately 500 acres
per year averaged over the first 8 years. Fund $250,000
over the first 8 years, based on a cost of $500 per acre
thinned. Average annual cost commitment in Years 1-8 is
-$22,405 $34,380.
Conduct restoration planting on approximately 31 acres
per year averaged over the first 8 years. Fund $75,000
over the first 8 years, based on cost of $300 per acre
$8,167 planted. Average annual cost commitment in Years 1-8 is
$353,070
$19,227
$11,060
$19,227
SUBTOTALS
$4,601,370
$774,349
$286,010
$228,434
-$57,576
WATERSHED MANAGEMENT TOTALS
$28,022,520
$3,927,721
$1,324,400
$1,276,775
-$47,625
Comments
Restoration thinned 1200 acres, primarily in upper
watershed.
Completed first ecological thinning project (45 Road
Forest Restoration Project) over 157 acres.
Planted 64 acres with diverse conifer and shrub species
as part of 45 Road Forest Restoration Project.
LANDSBURG MITIGATION
Chinook, Coho and Steelhead Mitigation (cost category 3)
14
15
Bachen, B
Wells, B
Interim Chinook, Coho and Steelhead Mitigation
Landsburg Fish Passage (see note at end)
$840,600
$7,476,700
$128,159
$11,524,062
$106,200
$3,463,300
$109,509
$5,232,189
Between Years 1 and 8, accomplish the following: i) fund
the implementation of life history, genetic, demographic
and/or ecological studies to fill critical information gaps; ii)
implement emergency supplemental production programs
designed to help sustain and rebuild populations; and/or
iii) other measures deemed appropriate by Parties.
Parties agree on form of interim mitigation within two years
$3,309 of initiating discussion (discussion period began 3/29/01).
Complete construction of Fish Passage facilities by the
end of Year 3.
Little, R
Operation of Passage Facilities
SUBTOTALS
Project construction was completed on schedule and all
facilities were operational by September 2003.
$1,768,889
Provide up to $50,000 per year during term of LMA to
operate and maintain fish passage facilities.
16
Work focused on beginning evaluation of spawning adults
migrating upstream of the Landsburg Diversion Dam and
the production of juvenile fish from the recolonized Cedar
River; studying the genetic relationships among rainbow
and steelhead trout to conserve and recover native trout
species in the Cedar River; and gathering information from
PIT-tagged adult salmon returning to Lake Washington.
$2,773,000
$91,640
$0
$91,640
$91,640
$11,090,300
$11,743,861
$3,569,500
$5,433,338
$1,863,838
First adult chinook passed through facilities into upstream
habitat on Sept. 19. A total of 79 adult chinook and 47
adult coho salmon passed upstream during 2003 brood
year. Operations included genetic sampling of fish prior to
passage upstream.
Sockeye Mitigation (cost category 4)
Operate existing interim hatchery at Landsburg.
17
Bachen, B
Interim Sockeye Mitigation
$1,192,960
$760,302
$302,080
$321,683
$19,603
18
Bachen, B
New Sockeye Hatchery - Design & Construction
$9,015,520
$1,212,841
$376,420
$502,612
$126,192
19
Bachen, B
Operation of Replacement Hatchery
$16,284,000
$0
$0
$0
$0
20
Bachen, B
Supplementation Guidelines
$35,200
$11,198
$0
$0
$0
In 2003 the interim hatchery released 15,957,000 fry, one
of the largest hatchery releases to date. First known
losses to IHN virus occurred early in 2003; losses were
confined to small number of incubators. Estimated
sockeye returns for 2003 are 150,000.
Initiate design of replacement hatchery in Year 1. Parties Final Environmental Impact Statement was released in
agree in Year 3 as to design, capacity, operating
March and appealed in April to City Hearing Examiner.
guidelines, and adaptive management program. Hatchery Hearing was held in October. Hearing Examiner
facilities will be operational by Sept. 1 Year 5.
remanded EIS back to City for further analysis of
environmental impacts and development of a
Supplemental EIS, scheduled to be available for public
review in Fall, 2004.
Provide up to $300,000 per year to operate and maintain Commitment begins in Year 5. Completion of hatchery
the facilities for the term of the LMA. Commitment begins construction scheduled for 2007.
in HCP Year 5.
The Parties, in consultation with the AFC, shall develop
Guidelines completed in 2001.
guidelines to govern the design, construction, operation
and monitoring phases of the sockeye fry production
program.
98
HCP YEAR 2 FINANCIAL MONITORING REPORT
(as of year-end 2002)
50 Year Project Totals
Item
#
Project
Manager
Cost
Commitment
(in 2003 $)
Project Description
Life-to-Date
Cost
Commitment
Expenditures
HCP Year 3
Cost
Commitment
(in 2003 $)
Cost
Commitment
Expenditures
Cost
Commitment
Over(+) or
Under (-)
Expenditures
Performance Commitments
(with $ as stated in HCP, in 1996 $)
In Years 1 through 3, develop and evaluate measures to
improve sockeye broodstock collection practices.
21
Bachen, B
Broodstock Collection Solutions
SUBTOTALS
$226,000
$110,495
$7,266
$7,266
$0
$26,753,680
$2,094,836
$685,766
$831,561
$145,795
Comments
Work was performed on conceptual design of a
replacement broodstock collection facility focusing on
stream hydraulics, geomorphology, and efficiency of
facility operations. Remaining funds will be used for
design of facilities.
Downstream Habitat (cost category 4)
22
Holtz, C
Downstream Habitat - all species
Negotiations with King County on a collaborative, costProvide up to $1,637,000 in HCP Years 2 through 5 to
sharing land-acquisition agreement. An agreement is
acquire, restore, and/or protect habitat for any or all
anadromous fish, especially chinook salmon, in the lower expected to be reached in Summer 2004.
Cedar River outside the City's current property ownership
boundary. HCP required implementation schedule is
$0 between Years 2 and 5.
$1,929,700
$17,022
$173,460
$5,330
SUBTOTALS
$1,929,700
$17,022
$173,460
$5,330
$0
LANDSBURG MITIGATION TOTALS
$39,773,680
$13,855,719
$4,428,726
$6,270,229
$2,009,633
INSTREAM FLOWS
Powerhouse Improvements (cost category 2)
23
24
Steele, P
Steele, P
Emergency Bypass
$385,000
Tailrace Rack
SUBTOTALS
$3,698,009
$0
$870,618
Install new equipment to provide bypass flows around its
hydroelectric turbines during most emergency plant
shutdowns to protect against stranding of fish and
$870,618 dewatering of redds as a result of such events.
Upon construction of fish ladder, install a tailrace rack at
the Cedar Falls Powerhouse to protect fish from injury or
mortality.
$295,000
$2,366,119
$295,000
$477,858
$182,858
$680,000
$6,064,128
$295,000
$1,348,476
$1,053,476
Active testing was completed, and equipment monitoring
and additional fine-tuning and minor adjustments of the
automatic coordination occurred in 2003.
Initial tailrace barrier testing of flow characteristics during
normal discharge and flow events was implemented;
alterations to tailrace barrier were made, including
installation of baffles to dissipate energy during flow
events; successful followup testing occurred after tailrace
barrier modifications were made; and monitoring of the
tailrace barrier continued.
Ballard Locks Improvements (cost category 2)
Commit up to $625,000 for smolt passage improvements
at the Chittenden Locks in co-sponsorship with King
County and the Muckleshoot Tribe.
25
26
Jones, M
Jones, M
Smolt Passage Improvements
$687,500
Freshwater Conservation
SUBTOTALS
$579,598
$0
$15,783
$1,455,000
$200,545
$0
$8,019
$2,142,500
$780,143
$0
$23,802
City continued to provide partial funding and sponsorship,
through the joint Corps/City/County GI Study, for work
related to monitoring and refinement of smolt flumes at the
Locks, technical field research on juvenile salmon
migration and habitat through the Locks, and analyses of
approaches for water quantity and water quality modeling.
$15,783
Commit to local sponsorship, up to $1,250,000, for the
See comments above under Smolt Passage
purposes of funding a feasibility study and implementation Improvements.
of long-term water efficiency improvements at the
$8,019 Chittenden Locks.
$23,802
99
HCP YEAR 2 FINANCIAL MONITORING REPORT
(as of year-end 2002)
50 Year Project Totals
Item
#
Project
Manager
Cost
Commitment
(in 2003 $)
Project Description
HCP Year 3
Life-to-Date
Cost
Commitment
Expenditures
Cost
Commitment
(in 2003 $)
Cost
Commitment
Expenditures
Cost
Commitment
Over(+) or
Under (-)
Expenditures
Performance Commitments
(with $ as stated in HCP, in 1996 $)
Comments
Conservation Messages for Fish (cost category 2)
Publish or broadcast water conservation messages every Several salmon related water conservation public outreach
summer that emphasize the importance of water
messages, including TV ads, event promotion, booklets,
conservation to protect fish habitat each year of the HCP. brochures, and on-line games and maps were developed
and distributed in Year 3. Costs exceeded the commitment
amount because work was included within SPU's larger
One Percent Conservation program.
27
Gustav, R
Conservation Messages for Fish
SUBTOTALS
$1,767,000
$320,535
$35,400
$108,284
$72,884
$1,767,000
$320,535
$35,400
$108,284
$72,884
Downstream Fish Habitat (cost category 2)
28
Holtz, C
Downstream Habitat Protection and Restoration
(Instream Flow)
Provide up to $3,000,000 to protect and restore aquatic
riparian and floodplain habitat in the lower Cedar River
downstream of the municipal watershed.
$3,520,000
$72,415
$1,180,000
$13,062
$0
Provide up to $270,000 for restoration of the Walsh Lake
system and connecting areas within the municipal
watershed (to be matched by King County).
29
Beedle, D
Walsh Lake Restoration
$313,200
$0
$0
$0
$0
SUBTOTALS
$3,833,200
$72,415
$1,180,000
$13,062
$0
INSTREAM FLOWS TOTALS
$8,422,700
$7,237,221
$1,510,400
$1,493,624
$1,150,162
Negotiations with King County on a collaborative, costsharing land-acquisition agreement. An agreement is
expected to be reached in Summer 2004. HCP required
timeline is between Years 2 and 4.
Completed some consultant work in 2002 on fatal flaw
analysis for potential re-diversion project.
RESEARCH AND MONITORING
Instream Flow Monitoring and Research (cost category 6)
Measure downramping rates immediately below the
powerhouse using existing gage at river mile 33.2.
30
31
32
33
34
35
Chinn, A
Chinn, A
Ablow, L
Chinn, A
Chinn, A
Chinn, A
Existing Stream Gage at Cedar Falls
Existing Stream Gages Below Landsburg
New Stream Gage Above Powerhouse
New Gage at Renton
Temporary Gages in Lower River (2)
Switching Criteria Study
$290,460
$644,370
$619,500
$140,200
$150,800
$231,000
$27,945
$37,501
$108,429
$0
$0
$0
$0
$12,910
$0
$10,740
$11,800
$59,000
$27,945
$13,295
$11,955
$0
$0
$0
$27,945
Monitor flows and downramping rates with the existing
gage at USGS station located below Landsburg at River
$385 Mile 20.4.
Establish a new USGS stream gage near river mile 33.7
just upstream of the Cedar Falls hydroelectric facility
tailrace to monitor compliance with the City's commitment
to provide minimum rearing flows of 30 cfs for
anadromous fish in the bypass reach between Lower
Cedar Falls and the powerhouse once fish passage
$11,955 facilities are complete.
For the purpose of accretion flow monitoring study,
monitor flows at existing stream gage at river mile 1.6. If a
more suitable location is found near existing gage site,
fund installation and temporary operation of a new USGS
-$10,740 stream gage.
Monitor flow at up to two additional locations between
Renton and Landsburg for a temporary period as part of
the accretion flow study to help monitor accretion flows
between Landsburg and Renton. Monitoring will begin
when accretion flow study is initiated and will terminate
when study is completed by or before Year 13.
-$11,800
Provide up to $200,000 to sponsor a collaborative analysis
of alternatives to switching criteria. It is the intent of the
Parties to complete the study, and develop and implement
revised criteria no later than the end of Year 4.
-$59,000
Commitment begins in Year 6, but costs started once fish
passage above Landsburg occurred. Gage operations and
maintenance to monitor instream flow and downramping
requirements is ongoing.
Gage operations and maintenance to monitor instream
flow and downramping requirements is ongoing.
Gage operations and maintenance to monitor instream
flow and downramping requirements is ongoing, and
rating curve continues to be expanded.
Installation of new gage will be timed with Accretion Flow
Study.
Installation of new gages will be timed with Accretion Flow
Study.
The Switching Criteria Study is expected to begin in 2004.
100
HCP YEAR 2 FINANCIAL MONITORING REPORT
(as of year-end 2002)
50 Year Project Totals
Item
#
36
Project
Manager
Little, R
Cost
Commitment
(in 2003 $)
Project Description
Steelhead Redd Monitoring
37
Little, R
Chinook Studies
38
Chinn, A
Accretion Flow Study
$280,200
$1,155,580
SUBTOTALS
HCP Year 3
Life-to-Date
Cost
Commitment
Expenditures
$105,260
$365,786
Cost
Commitment
(in 2003 $)
$35,400
$223,020
Cost
Commitment
Expenditures
$20,781
$133,756
$471,200
$1,761
$47,200
$1,761
$3,983,310
$646,682
$400,070
$209,493
Cost
Commitment
Over(+) or
Under (-)
Expenditures
Performance Commitments
(with $ as stated in HCP, in 1996 $)
Sponsor annual monitoring of steelhead redds for a period
of time until prospective flow guidelines and objectives can
be established. Monitor steelhead redds for up to eight
spawning seasons beginning in Year 1. Total costs of
-$14,619 study will not exceed $240,000.
Provide up to $1,000,000 to support further study of the
effects of certain aspects of instream flow management
on anadromous salmonids with special emphasis on
additional information about chinook and other salmonids
originating from the Cedar River. Funding will be available
over a period of up to 9 years.
Comments
SPU, in collaboration with WDFW continued annual
steelhead spawning and incubation studies as provided in
Section E.5. Of the Instream Flow Agreement. Final
reports are available for results from 2000-2003 studies.
Work on high priority study topics identified by IFC
continued in Year 3. Info. from fall chinook and spring
steelhead spawning surveys was used by IFC in allocating
supplemental available water to protect all chinook and
steelhead redds from dewatering. Juveline salmon
migration monitoring results indicate very robust
production of juvenile chinook and sockeye from the
-$89,264
Cedar River in 2003.
Sponsor a long-term monitoring study to develop a better Began discussions and initial development of study plan
for 10-year program that is expected to require installation
understanding of inflow patterns throughout the lower
river. The study will begin no later than the end of Year 3 of temporary and possible permanent stream gages.
USGS may participate in some phases of this program.
and will continue for not less than 10 years. Total costs
-$45,439 will not exceed $400,000.
-$190,577
Chinook, Coho and Steelhead Monitoring and Research (cost category 7)
39
Bachen, B
Counts at Landsburg Fish Ladders
40
Bachen, B
Landsburg Intake Screen Evaluation
41
Donner, R
Drinking Water Quality Monitoring
SUBTOTALS
$129,800
$0
$0
$0
$17,700
$0
$0
$0
$136,000
$64,213
$9,380
$9,380
Provide up to a total of $110,000 during the first 12 years Commitment begins in Year 4.
after completion of upstream fish passage facilities to
monitor adult fish passage and better understand run
timing, rate of passage, and rate of recolonization.
$0 Commitment begins in Year 4.
To be conducted in 2004.
Provide up to $15,000 to perform hydraulic analyses to
refine flow characteristics of the screens to demonstrate
conformity with hydraulic parameters established during
design of passage facility. Commitment begins in Year 4.
$0
Provide up to $10,000 per year for up to 6 years to
A gravity fed source of screened water for channel
implement water quality sampling program to monitor the experiments was incorporated into fish passage
effects of coho and chinook salmon spawning carcasses construction at Landsburg; artificial channel experiments
on drinking water quality. Provide $60,000 in Year 1 to
may begin in 2004.
help fund collaborative studies with NMFS regarding
recolonization of habitat within the municipal watershed by
$0 anadromous fish.
$283,500
$64,213
$9,380
$9,380
$0
$108,560
$0
$0
$0
Sockeye Monitoring and Research (cost category 8)
42
43
Bachen, B
Bachen, B
Fry Condition at Release
Fry Marking and Evaluation
$375,600
$58,954
$23,600
$17,629
44
Bachen, B
Fry Trapping and Counting
$657,300
$122,066
$41,300
$41,377
45
Bachen, B
Fish Health
$731,600
$0
$0
$0
Provide $92,000 total, $2,000 annually, Years 5-50 to
study physiological, developmental and morphological
$0 similarity between artificial and naturally produced fry.
Provide $320,000 total, $20,000 annually, Years 1-8, 2427, 42-45 to study fry to adult survival, spawning
distribution.
Commitment begins in Year 5.
WDFW issued summary of thermal marking for otoliths of
sockeye embryos and alevins for Landsburg Hatchery,
documenting 30 thermal codes developed to mark fry at
the hatchery for broodyear 2002. Contracted with WDFW
for 2003 marking program using goals of program
established by the AFC. Performance goals were met at
lower cost than commitment amount.
-$5,971
Provide $560,000 total, $35,000 annually, Years 1-8, 24- Provided funding to WDFW to support fry trapping
27, 42-45 to study outmigration timing and comparative fry operations on the Cedar River. WDFW provided the draft
to adult survival for naturally and artificially produced fry. 2002 Cedar River Sockeye Salmon Fry Production
Evaluation in May, 2003. The report provides outmigrant
estimates of hatchery and natural origin sockeye in the
$77
Cedar River for 2002.
Provide $620,000 total; $20,000 annually, Years 5-12, 24-- Commitment begins in Year 5.
27, 42-45; and $10,000 annually, Years 13-23, 28-41, 46$0 50; to study risks associated with IHN.
101
HCP YEAR 2 FINANCIAL MONITORING REPORT
(as of year-end 2002)
50 Year Project Totals
Item
#
Project
Manager
Cost
Commitment
(in 2003 $)
Project Description
46
Bachen, B
Short-term Fry Rearing
47
Bachen, B
Lake Washington Plankton Studies (year-round)
48
Bachen, B
Lake Plankton Studies (spring)
Bachen, B
Adult Survival, Distribution, Homing Studies
50
Bachen, B
Phenotypic and Genetic Studies of Adults
SUBTOTALS
Watershed Aquatic Monitoring and Research (cost category 5)
51
Beedle, D Two-Year Experimental Stream Monitoring
52
Beedle, D
Long-Term Stream Monitoring
Life-to-Date
Cost
Commitment
Expenditures
Cost
Commitment
(in 2003 $)
Cost
Commitment
Expenditures
$73,700
$61,298
$11,800
$9,257
$562,400
$105,017
$47,200
$16,097
$66,080
49
HCP Year 3
$940,000
$0
$140,211
$0
$47,200
$0
$52,292
$65,280
$35,400
$29,014
-$6,386
$206,500
$165,666
-$40,834
$0
$0
$0
$0
$541,620
$0
$0
$0
Aquatic Restoration Monitoring
$1,032,500
$0
$0
$0
Paige, D
Bull Trout - Adult Surveys (weir)
$408,000
$11,374
$59,000
$0
55
Paige, D
Bull Trout - Adult Surveys (spawning)
$326,900
$95,535
$41,300
$39,724
56
Paige, D
Bull Trout - Fry/Juvenile Surveys
$326,900
$51,267
$41,300
$27,165
57
Paige, D
Bull Trout - Stream Telemetry Studies
$140,400
$0
$0
$0
58
Paige, D
Bull Trout - Lake Telemetry Studies
$82,600
$0
$41,300
$0
Paige, D
Bull trout - Stream Distribution
60
Paige, D
61
Paige, D
Implement a real time spring plankton monitoring program
to determine the most appropriate time to release
supplemental fry each spring. $7,000 per year in Years 5$0 12.
Provide $800,000 total; $40,000 annually Years 1-12, 2831, 46-49; to study fry to adult survival, spawning
distribution.
$5,092
Provide $480,000 total; $30,000 annually; Years 1-4, 912, 28-31, 46-49 to characterize and monitor changes in
phenotypic and molecular genetic traits in Lake
Washington sockeye populations in the Cedar River and
north Lake Washington tributaries.
$552,826
Beedle, D
$69,840
$12,310
$0
$3,655
Bull Trout - Redd Inundation Study
$128,700
$56,395
$64,900
$47,283
Common Loon Monitoring
$147,250
$10,150
$2,950
$4,500
Comments
Research was conducted on fry at the Landsburg
Hatchery to learn more about the feasibility and effects of
short term rearing. Performance goals were met at lower
Final reports completed on 1) Early Feeding Demand and
Food Supply of Sockeye Salmon Fry in Lake Washington,
and 2) Growth, Distribution and Abundance of Pelagic
Fishes in Lake Washington: Results and Evaluation
Methods. Contracted with UW for fall survey to enumerate
and obtain growth info on juvenile sockeye in Lake
Washington. Alternative funding has allowed the HCP
funding to be used for (1) juvenile surveys in L.
Washington to assess survival and growth and (2)
maintaining surveys over a longer period of time into the
future than was originally planned.
-$31,103
$563,400
53
Performance Commitments
(with $ as stated in HCP, in 1996 $)
Provide $65,000 total; $35,000 Year 1; $10,000 annually
Years 2-4, to study similarity to naturally produced fry, fry
-$2,543 to adult survival.
Provide $536,000 total; $40,000 annually Years 1-4, 2427, 42-56; $7,000 annually Years 5-12; to study plankton
abundance, distribution periodicity and effects on fry
outmigration timing and in-lake carrying capacity.
$4,078,640
54
59
Cost
Commitment
Over(+) or
Under (-)
Expenditures
$0 Monitoring completed in 1997.
Provide $459,000 over the term of the HCP, up to $50,000
per year to conduct monitoring stream temperature,
$0 channel stability, BIBI study.
Provide up to $25,000 per year in Years 4-6, and up to
$50,000 per year in Years 7-16, 18, 20, 25, 30, 40 to
monitor the success of specific projects implemented
through the conservation strategies for the aquatic and
$0 riparian ecosystem in the HCP.
Conduct adult surveys at the weir and live-box trap counts
-$59,000 in Years 1 through 4.
Conduct spawning surveys in Years 1 through 8.
-$1,576
Conduct juvenile/fry surveys in Years 1 through 8.
-$14,135
Initiate a 2-year stream telemetry study within Years 2 to
$0 7.
Initiate
lake telemetry studies within years 2 to 7.
-$41,300
Commitment begins in Year 5.
Otolith were collected from adult sockeye carcasses in
2003. WDFW received funding to carry out 2nd year of
pilot study to examine consequences of adult fish
behavior on carcass recovery rates.
Evaluation of timing and distribution of adult sockeye as
they return to Lake Washington and the Cedar River
began in 2003. Sockeye at the Hiram Chittenden Locks
fish ladder were trapped and tagged with disk tags,
iButton temperature loggers and acoustic transmitters.
The project will continue in 2004. Remaining funds will be
used to support this project in 2005.
Monitoring completed in 1997.
Commitment begins in Year 4.
Commitment begins in Year 4.
Continued discussions with USFWS exploring possible
use of funds for other bull trout projects.
504 redds were surveyed in 2002-03, more than double
the highest previous survey count.
Surveys completed, continuing evaluation of fry
enumeration methods and techniques.
Will begin work in 2005.
Will begin work in 2007.
Conduct distribution surveys up to 5 times between Years
No field work conducted in 2003. Costs include database
1 and 20.
maintenance/management and data analysis
$3,655
Conduct bull trout redd inundation and egg mortality study Channel topographic survey phase of project initiated and
to be completed in 2004.
in one or more years during Years 1 through 9, up to
-$17,617 $60,000 per year.
Conduct common loon monitoring on an annual basis
Three artificial nest platforms were deployed in spring.
throughout the term of the HCP. Average annual cost
Monitoring documented first successful nest in last three
commitment in Years 1-10 is $2750.
years in watershed. Conducted platform modification
$1,550
experiment.
102
HCP YEAR 2 FINANCIAL MONITORING REPORT
(as of year-end 2002)
50 Year Project Totals
Item
#
Project
Manager
Cost
Commitment
(in 2003 $)
Project Description
SUBTOTALS
HCP Year 3
Life-to-Date
Cost
Commitment
Expenditures
Cost
Commitment
(in 2003 $)
Cost
Commitment
Expenditures
$3,204,710
$237,031
$250,750
$122,327
Cost
Commitment
Over(+) or
Under (-)
Expenditures
Performance Commitments
(with $ as stated in HCP, in 1996 $)
Comments
-$128,423
Watershed Terrestrial Monitoring and Research (cost category 5)
62
LaBarge, A
Assessment of Expanded Forest Stand Data
$87,500
$21,082
$11,800
$12,749
63
LaBarge, A
Assessment of Expanded Forest Attribute Data
$87,500
$16,522
$11,800
$7,934
LaBarge, A
LaBarge, A
Paige, D
Augmentation of Forest Habitat Inventory
Long-Term Forest Habitat Inventory (including old-growth
classification and field verification)
$87,000
$35,938
$17,700
$25,604
65
$618,020
$66,926
$28,760
$41,764
66
LaBarge, A
Habitat Restoration - Riparian Forest Development
$395,300
$2,216
$6,880
$2,216
64
Prepare preliminary design and conduct evaluation in
$949 Years 1 through 5.
Design and conduct evaluation of preliminary sampling
-$3,866 effort in Years 1 through 5.
Design and conduct sampling program to augment
existing forest and habitat inventory data for the
$7,904 watershed in Years 1 through 5.
Design program during Years 1-5.
$13,004
Design and initiate program during Years 3 through 8.
-$4,664
Design and initiate program during Years 3 through 8.
67
LaBarge, A
68
Paige, D
Habitat Restoration - Upland Forest Development
$395,300
$14,139
$6,880
$15,183
$8,303
$88,500
$0
$29,500
$0
-$29,500
Conduct baseline surveys during Years 3 through 8.
Marbled Murrelet - Survey, Old Growth
Develop and implement sampling plan and conduct field
surveys to evaluate habitat potential, and subsequently
develop and implement a prioritized sampling plan to
document occupancy during HCP years 5 through 8.
69
70
Paige, D
Paige, D
Marbled Murrelet - Baseline Survey, Second Growth
Marbled Murrelet - Long Term Surveys
$177,000
$118,000
$0
$0
$0
$0
$0
$0
71
Paige, D
Marbled Murrelet - Experimental Habitat Study
$218,300
$0
$0
$0
72
Paige, D
Spotted Owl - Baseline Survey
73
74
Paige, D
Paige, D
Spotted Owl - Site Center Survey
Optional Species/Habitat Surveys
$0
$0 Conduct surveys during Years 25 through 28.
$0 Development and initiation in Years 7 through 10.
Assessment of expanded forest stand conducted.
Assessment of expanded forest attribute data conducted.
Design and partial implementation of augmented forest
habitat inventory conducted.
Conducted remote sensing image analysis and field data
collection.
Monitored Webster, Shotgun, and Lost Creek riparian
underplanting projects. Installed Permanent Sample
Reaches in representative riparian forests.
Monitored three HCP projects, including 10-year remeasurement of Sugar Bear Substitution variable
retention harvest, upland restoration thinning sites, and
upland forest permanent sample plots.
Delayed from starting in 2003 as originally planned until
2005 for budget reasons, but still consistent with the
timing requirements of HCP.
Commitment begins in Year 5.
Commitment begins in Year 25.
Commitment begins in Year 7.
Conduct survey during Years 3 through 10.
75
VanBuren, T Data/GIS Compatibility
76
Paige, D
77
Richards, B
Forest Habitat Modeling
Species-Habitat Relations Modeling
SUBTOTALS
$88,500
$0
$29,500
$0
$88,500
$177,000
$0
$0
$0
$0
$0
$0
$176,380
$38,998
$7,380
$24,868
$87,560
$18,633
$11,060
$9,667
$204,500
$49,405
$23,600
$24,047
$3,094,860
$263,859
$184,860
$164,032
Delayed from starting in 2003 as originally planned until
2005 for budget reasons, but still consistent with the
timing requirements of HCP.
-$29,500
Conduct
survey
in
Year
intervals
11-20,
21-30
and
31-50.
Commitment
begins in Year 11.
$0
Conduct
research
in
Year
intervals
9-20,
21-35
and
36-48.
Commitment
begins in Year 9.
$0
Integrate data collection formats to make them compatible Created production instance of GIS Oracle database;
with watershed GIS systems and provide for mapping and realigned GIS road layer to agree with orthophotography
analysis capability in Years 1 through 8.
base; developed Road Information Management System
software prototyp; developed database schema for
Landscape Information Management System;
implemented data model for hydrologic resources in
$17,488
CRMW.
Design modeling in Years 1 through 8.
Assessed forest growth models, and conducted analysis
-$1,393
of historic forest data and forest cruising.
Evaluate and design modeling in Years 1 through 5.
Investigated potential effects of planned ecological
thinning projects on wildlife habitat structure. Evaluated
remotely sensed data as potential source of stand
$447
composition and structural data.
-$20,828
103
HCP YEAR 2 FINANCIAL MONITORING REPORT
(as of year-end 2002)
50 Year Project Totals
Item
#
Project
Manager
Cost
Commitment
(in 2003 $)
Project Description
HCP Year 3
Life-to-Date
Cost
Commitment
Expenditures
Cost
Commitment
(in 2003 $)
Cost
Commitment
Expenditures
Cost
Commitment
Over(+) or
Under (-)
Expenditures
Performance Commitments
(with $ as stated in HCP, in 1996 $)
Comments
Cedar Permanent Dead Storage Evaluation (cost category 6)
78
79
80
81
Schneider, G Engineering, Water Quality, & Economic Studies
Paige, D
Bull Trout - Spawning Impedance (Passage Assistance
Plan)
Basketfield, D Bull Trout - Spawning Impedance (Delta Modeling)
Paige, D
Pygmy Whitefish/Rainbow Trout Studies
$812,000
$4,162
$165,200
$4,162
$75,400
$632
$15,340
$632
$334,950
$0
$85,550
$0
$330,400
$0
$165,200
$0
82
Paige, D
Delta Plant Community Monitoring
$93,600
$0
$0
$0
83
Paige, D
Common Loon Nesting Habitat Monitoring
$35,400
$84
$0
$84
Conduct engineering studies to address design options,
siting, water quality, geology and hydrology, yield analysis,
costs and economics, constructibility, reliability, and other
factors for development of permanent non-emergency
access to water stored below Morse Lake. Commence
not later than end of HCP Year 5 and take 10 Years to
complete (per IFA amendment), and will not exceed
-$161,038 $700,000.
Conduct environmental studies to address potential
effects of permanent non-emergency access to water
stored below Morse Lake on resident fish and wildlife
populations and wetlands. Commence not later than end
of HCP Year 5 and take 10 Years to complete. Total
-$14,708 costs will not exceed $745,000.
See Performance Commitment for Item #79 above.
-$85,550
See Performance Commitment for Item #79 above.
-$165,200
See Performance Commitment for Item #79 above.
$0
See Performance Commitment for Item #79 above.
$84
SUBTOTALS
$1,681,750
$4,878
$431,290
$4,878
-$426,412
RESEARCH AND MONITORING TOTALS
$16,326,770
$1,769,489
$1,482,850
$675,776
-$807,074
$92,545,670
$26,790,150
$8,746,376
$9,716,404
$2,305,096
HCP GRAND TOTALS
Note for Item #15: Construction of Intake Screens, Construction of Fish
Ladders, Construction of Downstream Passage, and Contingency Fund for
Fish Passage Facilities are combined into one project, Landsburg Fish
Passage.
Year 3 Cost
Commitment
Cost Commitment Category
$1,324,400
$1,276,775
2. Instream Flow Management
$1,510,400
$1,493,624
3. Mitigation for Chinook, Coho & Steelhead
$3,569,500
$5,433,338
4. Mitigation for Sockeye
$859,226
$836,891
5. Watershed Research & Monitoring
$435,610
$286,359
6. Instream Flow Research & Monitoring
$831,360
$214,371
8. Sockeye Research & Monitoring
TOTALS
Work scheduled to begin in 2005.
Work scheduled to begin in 2004.
Work scheduled to begin in 2006.
Work scheduled to begin in 2004.
Work scheduled to begin in 2006.
HCP Year 3
Actual
1. Watershed Management
7. Chinook, Coho & Steelhead Research &
Monitoring
No studies were performed in Year 2; schedule for this
work revised per first amendment to the IFA.
$9,380
$9,380
$206,500
$165,666
$8,746,376
$9,716,404
104
APPENDIX A
ANNUAL COMPLIANCE REPORT
INSTREAM FLOW AGREEMENT
for the
CEDAR RIVER
March 2004
Cedar River immediately above Landsburg Dam (photo by Laura Kelly)
ANNUAL COMPLIANCE REPORT
INSTREAM FLOW AGREEMENT
for the
CEDAR RIVER
March 2004
SEATTLE PUBLIC UTILITIES and SEATTLE CITY LIGHT
HCP YEAR 3
JANUARY 1 through DECEMBER 31, 2003
The City of Seattle influences river flows in the Cedar River through its water supply and
hydroelectric operations within the municipal watershed. Water from the Cedar River is
used by about two-thirds of the City's 1.3 million customers in King and Snohomish
Counties. The objective of the Instream Flow Agreement of the HCP is to provide highly
beneficial conditions for instream resources, while preserving Seattle’s water supply and
power generation capabilities.
The Instream Flow Agreement (IFA), a key element of the Cedar River Watershed
Habitat Conservation Plan (HCP) established an inter-agency body to assist the City in
carrying out its river management responsibilities. The Cedar River Instream Flow
Commission (IFC) was first convened in July 2000, and has met, on average, every
month since then. Meetings are chaired by SPU and have been very well attended.
In HCP Year 3, the region experienced severe weather and hydrologic conditions. The
year began with the extreme fall/winter drought still unabated, and continued with a poor
snowpack accumulation and one of the driest summers ever recorded in Seattle.
Through it all, the IFC members participated in real-time stream flow management
decisions and monitored compliance with the IFA, while still guiding the development
and implementation of complex supplemental studies and other technical analyses.
The efforts of the IFC members are herein recognized for their vital role in
achieving the successes in 2003. Organizational membership and representation is
as follows:
•
•
•
•
•
•
•
•
National Marine Fisheries Service – Voting Member (Tom Sibley)
U.S. Fish and Wildlife Service – Voting Member (Tim Romanski)
Washington Department of Fish and Wildlife – Voting Member (Gary Engman)
Washington Department of Ecology – Voting Member (Steve Hirshey)
Muckleshoot Indian Tribe – Voting Member (Holly Coccoli, Eric Warner, Carla
Carlson)
City of Seattle – Voting Member (representing both Seattle Public Utilities and
Seattle City Light) (Liz Ablow, Karl Burton, Alan Chinn, Tom Johanson, Rand Little,
George Schneider)
Corps of Engineers – Non-voting Member (Lynn Melder)
King County – Non-voting Member (Kelly Whiting)
In addition, it is recognized that it takes many people in an organization to translate
good intentions into successful operations. Providing beneficial conditions for fish and
other instream resources in the Cedar River is a 24-hour – 365-day a year
responsibility. Special thanks go to staff from:
•
•
•
•
•
Cedar Falls Headworks (Seattle City Light)
Water Supply and Treatment Section (Landsburg Operators and Control Center)
Operations Transition Section
Watershed Management Division
Water Management Section
i
CEDAR RIVER
ANNUAL FLOW COMPLIANCE REPORT
City of Seattle
HCP Year 3
January 1 through December 31, 2003
Seattle Public Utilities and Seattle City Light, for the City of Seattle, present this report to the
Cedar River Instream Flow Oversight Commission (“Commission”) as documentation of
compliance with flow requirements established in the 2000 Instream Flow Agreement (IFA) for
the Cedar River. The IFA is part of the City's Cedar River Watershed Habitat Conservation Plan
(HCP). Section D.3(a) of the IFA stipulates that an annual compliance report be submitted to
the Commission. This annual report covers the period January 1, 2003 through December 31,
2003.
Throughout this report, direct excerpts from the IFA are presented within quotation
marks.
Flow compliance is measured at several locations throughout the Cedar River Watershed
including:
USGS Gaging Station 12115000 – Cedar River near Cedar Falls, Washington (this
gage located at River Mile (RM) 43.5 measures unregulated inflows to Morse Lake).
USGS Gaging Station 12115900 – Chester Morse Lake at Cedar Falls, Washington
(this gage located at the Overflow Dike at RM 37.2 measures water surface elevation of
Chester Morse Lake).
USGS Gaging Station 12116400 – Cedar River at Powerplant at Cedar Falls (this gage
located at RM 33.7 immediately upstream of the Cedar Falls Powerhouse measures
regulated streamflow downstream of Masonry Dam . Note: Date of installation Oct. 1,
2001).
USGS Gaging Station 12116500 – Cedar River at Cedar Falls, Washington (this gage
located at RM 33.2 immediately below the Cedar Falls Powerhouse measures regulated
streamflow downstream of the Cedar Falls Powerhouse).
Seattle Public Utilities Diversion - the volume of water (millions of gallons per day)
diverted for municipal use is monitored at the Landsburg Diversion Dam.
USGS Gaging Station 12117600 – Cedar River below Diversion near Landsburg,
Washington (this gage, located at RM 20.4 measures regulated streamflow downstream
of Landsburg Diversion Dam).
1
I.
INSTREAM FLOWS BELOW LANDSBURG DIVERSION DAM
In accordance with IFA Section B.1.a, the instream flows “consist of two types of
commitments by the City. The minimum instream flows or volumes, as described in
Sub-sections B.2., B.4., B.6., B.7., and B.8“ of the IFA “represent requirements of the City and
are referred to as “firm” flows or volumes”. “Additional flows or volumes provided to supplement
minimum flows, as described in sub-sections B.3. and B.5.” of the IFA “represent goals of the
City and are referred to as ‘non-firm’ flows or volumes”.
A.
Minimum Instream Flows below Landsburg Diversion Dam
Compliance with minimum flow requirements is assessed at one monitoring location
within the Cedar River Watershed: USGS Gage 12117600 - Cedar River below
Diversion near Landsburg
Requirements
Required minimum flows are shown below for USGS Gage 12117600 and are
specified in Sec. B.2.c. of the Instream Flow Agreement.
Compliance
During the reporting period, the project was in compliance with the Instream Flow
Agreement for the minimum flow at USGS Gage 12117600. Provisional mean daily
flows for the reporting period are shown in Table 1 and graphed in Figure 1. The
agreed on operational 2003 minimum instream flow schedule with firm and non-firm
flows are shown in Table 2 and graphed in Figure 1.
B.
“Non-Firm” Flow Supplement in late Winter and Early Spring for Sockeye
Outmigration
“Between February 11 and April 14, the City will, as a goal, expect to supplement the
normal minimum instream flows listed in sub-section B.2.c. by 105 cfs at least
70% of the time throughout said period in any year in which normal flows are in effect
throughout said period.”
Compliance
The City met and exceeded the goal this year by providing more than 105 cfs for
supplemental flow 90.5% of the time.
C.
“Firm Block” of Water in Early Summer to Supplement Normal Minimum Flows for
Steelhead Incubation
“Between June 17 and August 4, in addition to the normal minimum flows listed in
subsection B.2.c., the City shall provide such supplemental flow volumes as the
Commission may direct, provided that the total volume of such supplemental flows
shall not exceed 2500 acre feet of water, and that other procedures and conditions in
this sub-section B.4. are met.” The agreed on operational 2003 minimum instream
flow schedule with firm and non-firm flows are shown in Table 2 and graphed in
Figure 1.
2
Compliance
The City provided supplemental flow volumes as the Commission directed. See
Table 1 and Figure 1.
D. “Non-Firm Block” of Water in Early Summer to Supplement Normal Minimum Flows
for Steelhead Incubation
“Between June 17 and August 4, in addition to the normal minimum flows listed in
sub-section B.2.c, and the “firm block” described in sub-section B.4, the City will, as
a goal and under the conditions set forth in sub-section B.5, expect to further
supplement normal minimum flows by 3500 acre feet of “non-firm” water in 63% of all
years.” The agreed on operational 2003 minimum instream flow schedule with firm
and non-firm flows are shown in Table 2 and graphed in Figure 1.
Compliance
The current conditions were very dry and fairly severe for unregulated inflows and
the City indicated that they would likely decline to accept any recommendations to
allocate the non-firm block unless there were very compelling reasons to do so. The
Commission voted on July 2 not to allocate the non-firm block. See Table 1 and
Figure 1.
For long-term tracking purposes, this goal has been met in 2 years out of 4 (50%).
The IFA set 63% as an expectation.
E.
Higher Normal and Critical Minimum Flows in September for Sockeye and
Chinook Spawning
“In any year in which the temporary flashboards, as they presently exist in the City’s
Overflow Dike or may hereafter be reconstructed, are in place throughout the period
of June 1 through September 30, the normal minimum flows listed in sub-section
B.2.c. shall be increased by the amount of 38 cfs between September 15 and 22, and
by the amount of 115 cfs between September 23 and 30, and the critical minimum
flows shall be increased by the amount of 10 cfs through the period between
September 1 and 15.”
Compliance
Temporary flashboards were in place throughout the period June 1 through
September 30, 2003 and the City provided the additional flows. See Table 1 and
Figure 1.
F.
Two-Part Normal Minimum Flow Regime in the fall for Sockeye and Chinook
Spawning
“Between October 8 and December 31, the City shall provide either high-normal
minimum flows of 330 cfs or low-normal minimum flows of 275 cfs, except when flows
are reduced to critical minimum flows under the terms of sub-section B.8. More
specifically, the City, beginning on October 8, will meet the high-normal and low-
3
normal flow regimes with the following long-term average frequencies assuming that
the critical minimum flow regime will be in effect at a long-term average frequency of
one of ten years:”
1. “The City will follow the high-normal minimum flow regime in six of ten years,
provided that it may switch down to low-normal in one of those years when actual
or forecasted water availability conditions worsen significantly from those
projected and understood at the time of the decision to provide high-normal
minimum flows.”
2. “The City may follow the low-normal minimum flows in three of ten years, provided
that it will switch up to high-normal at such time after October 8 if the City
determines that improving conditions allow, or when criteria for high-normal are
met, whichever comes first.”
Compliance
With early October dry conditions, hydrologic switching criteria remained below the
levels prescribed for high normal. From October 8 through October 10, the City
provided flows that were at or above low normal levels. The City provided highnormal minimum flows exceeding 330 cfs from October 11 through December
31,2003, during the expected peak of the sockeye and chinook spawning season.
See Table 1 and Figure 1.
For long term tracking purposes, the following table compares expected with
actual performance (expressed as percentage of all years).
Week Period
Oct 8 - Oct 14
Oct 15 - Oct 21
Oct 22 - Oct 28
Oct 29 - Nov 4
Nov 5 - Nov 11
Nov 12 - Nov 18
Nov 19 - Nov 25
Nov 26 - Dec 2
Dec 3 - Dec 9
Dec 10 - Dec 16
Dec 17 - Dec 23
Dec 24 - Dec 31
Actual
2003
Expected
High
%
Expected
Low
%
Low
High
High
High
High
High
High
High
High
High
High
High
60
60
60
50
55
65
65
70
75
75
80
80
30
30
30
40
35
25
25
20
15
15
10
10
4
Actual 00-03
Actual 00-03
High
%
75
100
75
75
75
75
75
75
75
75
75
75
Low
%
25
0
25
25
25
25
25
25
25
25
25
25
G.
Reductions to Critical Minimum Flows
Sub-section B.8 of the IFA “describes the circumstances under which the Parties
agree that the City may switch to the minimum flow levels indicated in the column
headed “Critical Flows” in the table which appears in sub-section B.2.c., until such
time as those criteria may be modified pursuant to section E.4.”
Compliance
Although alert level switching criteria were triggered, the City did not switch to the
critical flow levels at any time during the reporting period. See Table 1 and Figure
1.
II.
OTHER OPERATING AND FACILITY IMPROVEMENTS
A.
Instream Flows Above Landsburg Diversion Dam
“After construction of a fish ladder at Landsburg Diversion Dam and subsequent
upstream passage of selected species of anadromous fish, the City will provide a
minimum flow of 30 cfs on a continuous basis to protect rearing habitat in the Cedar
River “Canyon Reach,” measured by a new USGS stream gage installed on
October 1, 2001, near river mile 33.7 and funded by the City.”
Compliance
Fish ladder was completed and operational September 1, 2003. The first
anadromous fish passed above Landsburg Diversion Dam on September 19, 2003,
which marks the date the City will provide a minimum flow of 30 cfs on a continuous
basis in the Cedar River “Canyon Reach.”
During the reporting period, the project was in compliance with the Instream Flow
Agreement for the minimum flow at USGS Gage 12116400. Provisional mean daily
flows for the reporting period are shown in Table 10 and hourly flows are graphed in
Figure 4.
B.
Downramping Below City Facilities
1.
Downramping Below Masonry Dam
a.
General
(1) The downramping rates and procedures set forth in this sub-section
C.2.a will become effective not later than the end of HCP Year 4
(2004) and will apply to operations at Masonry Dam when flows are
less than 80 cfs.
"Adopted ramping rates, criteria and procedures will become effective
only after construction of a fish ladder at Landsburg Dam and
upstream passage of anadromous fish."
(2) The measuring point for downramping rates at the Masonry Dam will
be the USGS gage number 12116400 located below the Dam at river
5
mile 33.7. For compliance purposes, specific ramping rate values set
forth in this sub-section C.2.a will be calculated from provisional real
time data and gage error, as determined by USGS, shall be factored
into the ramping rate calculation.
(3) The downramping rates and prescriptions set forth in this sub-section
C.2.a will not apply when flows exceed 80 cfs
b.
Downramping During Normal Operations
(1) Between February 1 and October 31, on an interim basis the
maximum downramping flow rate will be two inches per hour. Once
the new equipment is in place, the City will undergo downramp
testing. The Commission will adopt final ramping criteria once testing
is complete, no later than HCP year 4.
(2) Between November 1 and January 31, the maximum downramping
flow rate will be two inches per hour.
Compliance
The current year is HCP Year 3 (2003). Fish passage above Landsburg on
September 19, 2003 marks when the City will implement the new interim
downramping guidelines in the Cedar River “Canyon Reach.” There were no
significant downramping events for year 2003 subsequent to fish passage
above Landsburg. Two events occurred a day prior to passage, and they are
shown in Figures 5 and the following table in this section.
Below Masonry Dam: Events exceeding the maximum downramping flow
rate of two inch per hour and less than 80 cfs between from September 19
through December 31, 2003.
2.
Date
9-18
Hour
14:00
Rate per Hour
-5.4”
cfs
43
9-18
15:00
-2.5”
25
Description
Occurred a day prior to fish
passage at Landsburg. The
Howell Bunger valve (low level
flow) automated system failed
when the valve went from 20%
to close after a downramping
test was successfully
completed.
Same closure as above.
Downramping Below Cedar Falls Powerhouse
a.
General
(1) The downramping rates and procedures set forth in this sub-section
C.2.b will become effective not later than the end of HCP Year 4
(2004) and will apply to operations at Cedar Falls Powerhouse when
flows are less than 300 cfs.
6
"Adopted ramping rates, criteria and procedures will become effective
only after construction of a fish ladder at Landsburg Dam and
upstream passage of anadromous fish."
(2) The measuring point for downramping rates at the Cedar Falls
Powerhouse will be the existing USGS gage number 12116500
located ½ mile below the Powerhouse at river mile 33.2. For
compliance purposes, specific ramping rate values set forth in this
sub-section C.2.b will be calculated from provisional real time data
and gage error, as determined by USGS, shall be factored into the
ramping rate calculation.
(3) The downramping rates and prescriptions set forth in this sub-section
C.2.b will not apply when flows exceed 300 cfs
b.
Downramping During Normal Operations
(1) Between February 1 and June 15, the maximum downramping flow
rate will be two inches per hour with no daylight downramping (defined
as one hour before sunrise until one hour after sunset).
(2) Between June 16 and October 31, the maximum downramping flow
rate will be one inch per hour.
(3) Between November 1 and January 31, the maximum downramping
flow rate will be two inches per hour.
c.
Downramping during full system shutdown
(1) Based on past experience, full system shutdown at flows less than 300
cfs can be expected to occur one to two times per year due to low flow
conditions or for scheduled and unscheduled maintenance or
construction projects.
(2) When the lone unit is shutdown the wicket gates close at a prescribed
speed (a condition of the machine safety mechanisms), which results
in a sudden drop in flow, averaging a total of 25 cfs per occurrence.
d.
Swapping load during daytime downramping restrictions
(1) During daytime downramping restrictions there may be a need to
swap loads between generators. In most circumstances it is
seamless and would not show up as a change in stage. However,
there are situations in moving water from one machine to the other,
due to the normal shutdown sequence, that can cause a sudden drop
followed by an increase, or vice-versa. These are typically short
duration occurrences.
7
e.
Extended shutdowns during the February to June 15 time frame.
(1) The City will notify the IFC ahead of time of the circumstances that will
require an extended shutdown and discuss the need for leniency on
daytime downramping.
Compliance
The current year is HCP Year 3 (2003). Fish passage above Landsburg on
September 19, 2003 marks when the City will implement the new interim
downramping guidelines in the Cedar below Cedar Falls Powerhouse. There
was one significant downramping event for year 2003 as shown in Figures 6 &
7 and the following table in this section.
Below Cedar Falls Powerhouse: Events exceeding the maximum
downramping flow rate of one-inch per hour and less than 300 cfs from
September 19 through October 31, 2003.
Date
10-31
Hour
9:00
Rate per Hour
-1.4”
cfs
116
Description
Operator error resulted in
downramp exceedance.
No downramps exceeded the maximum downramping flow rate of two-inch per
hour and less than 300 cfs between November 1 and December 31, 2003.
3.
Downramping Below Landsburg Dam
a.
b.
“General
(1)
The downramping rates and procedures set forth in this sub-section
C.2.c will become effective not later than the end of HCP Year 2”
( 2002 ) “and will apply to operations at Landsburg Diversion Dam
when flows are less than 850 cfs.
(2)
The measuring point for downramping rates at the Landsburg
Diversion Dam will be the existing USGS gage number 12117600
located below the Dam at river mile 20.4. Not later than the end of
HCP Year 2, the City will install equipment to monitor this gage on a
“real time” basis. For compliance purposes, specific ramping rate
values set forth in this sub-section C.2.c will be calculated from
provisional real time data and gage error, as determined by USGS,
shall be factored into the ramping rate calculation.
(3)
The downramping rates and prescriptions set forth in this subsection C.2.c will not apply when flows exceed 850 cfs.
Downramping During Normal Operation
(1)
Between February 1 and October 31, the maximum downramping
flow rate will be one inch per hour.
8
c.
(2)
Between November 1 and January 31, the maximum downramping
flow rate will be two inches per hour.
(3)
The tainter gates will be down and closed during normal operation.
During Startup Following Full System Shutdown
(1)
Based on past experience, full system shutdown at flows less than
850 cfs can be expected to occur one to two times per year for
scheduled and unscheduled maintenance, and at least once per
year for forebay cleaning. Shutdowns for construction may also
occur depending on the nature of the construction project.”
(2)
“To minimize risk of cavitation and mechanical damage of
equipment at Landsburg Diversion Dam, initial downramping
following full system shutdown will be at a maximum of 60 cfs per
hour.
(3)
Not later than the end of HCP Year 2 and as part of the City’s
current evaluation of forebay cleaning procedures with WDFW, the
City will propose downramping rates and procedures for operation
of the tainter gate. After consideration of the City’s proposal, the
Commission will adopt final ramping criteria, but such criteria must
be capable of implementation with existing equipment (for example,
the City must have the mechanical ability to ramp at the
recommended rate).”
With the accelerated schedule for completion of the fish passage
facilities, use of tainter gates to drain the forebay will be very limited.
Draining and refilling of the forebay will be accomplished primarily
through the operation of the newly installed, vertically hinged, tip-out
gate in bay #2 of the Landsburg Dam. SPU proposed and the
Commission agreed that downramping provisions associated with
forebay draining and refilling would be developed after installation
and testing of the new tip-out gate.
Compliance
Current year is HCP Year 3 (2003) and the downramping limits were in effect during
this period. There were five significant downramping events for year 2003; they are
shown in Figures 2 and 3, Tables 9 (1-3) and the following tables (see next page).
9
Below Landsburg: Events exceeding the maximum downramping flow rate of
one inch per hour and less than 850 cfs between February 1 and October 31,
2003:
Date
May 2
October 17
October 22
October 28
October 31
Hour
20:00
16:00
5:00
20:00
11:00
Rate Per Hour
-1.20”
-1.20”
-1.08”
-1.20”
-1.32”
cfs
278
354
802
354
358
Comments
(1) Stop Log Installation
(3) Max. was 39cfs (non-violation)
(1) Tainter gate operation
(2), Malfunction
(1) Tainter gate operation – Lowering of the forebay for Landsburg forebay
cleaning and construction of fish passage facilities is accomplished by opening
tainter gates and the subsequent closure of the gates can drop flows at rates in
excess of the requirements because the control of the gate closures is crude
and inaccurate with a minimum gate closure of 3 inches. The lower the flow
volume at the time of operation, the more difficult it is to perform the operation
without exceeding downramping requirements because it takes less volume to
drop one inch at lower flows than it would at comparatively higher flows.
(2) Downstream passage gate flow mode malfunction.
(3) Following full system shutdown.
Below Landsburg: Events exceeding the maximum downramping flow rate of
two inches per hour and less than 850 cfs between January 1 - 31, 2003 and
November 1 through December 31, 2003:
Date
November 17
C.
Hour
13:00
Rate Per Hour
-2.28”
cfs
321
Comments
Municipal Water Use
The HCP provides that “ The City …is dedicated to managing water diversions from
the Cedar for the next 5 to 10 years in the same range that water diversions have
been for the last five years (98-105 mgd on an annual average basis).”
Compliance
The City was in compliance with the provision in 2003. Actual average annual water
diversion in 2003 was 82 mgd. (See Table 6.)
10
III.
MEASUREMENT AND REPORTING
Annual reports are provided to the Commission to evaluate the City’s compliance with the
terms of the Instream Flow Agreement. “The reports will also include tables of
precipitation levels, reservoir in-flow, reservoir out-flow, and Chester Morse Lake levels
and usage.” These flow and elevation records are described below.
A.
USGS Gage 12117600, Cedar River below Diversion nr Landsburg
Data provided in Table 1 and shown in Figure 1.
B.
USGS Gaging Station 12116500 – Cedar River at Cedar Falls
Data provided in Table 3
C.
USGS Gaging Station 12116400 – Cedar River at Powerplant at Cedar Falls
Data provided in table 10
D.
USGS Gaging Station 12115900 – Chester Morse Lake at Cedar Falls
Data provided in Table 4
E.
USGS Gaging Station 12115000 – Cedar River near Cedar Falls
Data provided in Table 5
F.
SPU Landsburg Tunnel Flow (MG) – Cedar River Landsburg Diversion
Data provided in Table 6
G.
SPU Landsburg Weather Station – Precipitation 24 hour Total (inches)
Data provided in Table 7
H.
SPU Masonry Weather Station – Precipitation 24 hour Total (inches)
Data provided in Table 8
I.
USGS Gage 12117600, Cedar River below Diversion nr Landsburg
Downramping flow data in one-hour increments in Table 9 (1-3)
11
Figure 1
Last Update: 1/1/2004
Calendar Year 2003
Cedar River Instream Flows Measured at USGS Stream Gage No. 12117600
2000
1800
Non-Firm Flow Supplement for Sockeye
Outmigration at least 70% of time between
February 11 and April 14 as determined each
year by the City. Provided 90.5% of time in
2003.
All Data is Provisional and Subject to Revision
2000
Non-Firm Block - up to 3500 Ac-Ft Allocation for
Steelhead Incubation between June 17 and August 4.
Minimum flows protect all steelhead redds in 2003.
Non-firm block not allocated due to very dry conditions.
High Normal Minimum Flows for Sockeye and
Chinook Spawning between October 8 and
December 31. Impementation guided by
provisions in the Instream Flow Agreement.
High Normal Flows provided in 2003.
1600
1600
Higher Normal Flows for Sockeye and Chinook
Spawning between September 15 and September 30 .
Temporary Flashboards on the Overflow Dike were in
place throughout the period June 1 to September 30.
High Normal Flows provided in 2003.
1400
1400
1200
1200
1000
1000
Firm Block - 2500 Ac-Ft Allocation for
Steelhead Incubation between June 17 and
August 4. To be set each year by the
Instream Flow Commission.
Provided in 2003
800
800
600
600
400
400
200
200
0
1-Jan
8-Jan
15-Jan
22-Jan
29-Jan
5-Feb
12-Feb
19-Feb
26-Feb
5-Mar
12-Mar
19-Mar
26-Mar
2-Apr
9-Apr
16-Apr
23-Apr
30-Apr
7-May
14-May
21-May
28-May
4-Jun
11-Jun
18-Jun
25-Jun
2-Jul
9-Jul
16-Jul
23-Jul
30-Jul
6-Aug
13-Aug
20-Aug
27-Aug
3-Sep
10-Sep
17-Sep
24-Sep
1-Oct
8-Oct
15-Oct
22-Oct
29-Oct
5-Nov
12-Nov
19-Nov
26-Nov
3-Dec
10-Dec
17-Dec
24-Dec
31-Dec
Average Daily Flow, cfs
1800
0
Days of the Calendar Year
Normal Minimum Flows
Normal Minimum Flows Plus Supplemental Flows
12
Actual Flows
Critical Minimum Flows
Figure 2
Calendar Year 2003
USGS Stream Gage No. 12117600 Cedar River Below Diversion nr Landsburg
All Data is Provisional and Subject to Revision
5.9
5.7
5.5
2500
Gage Height
CFS
Max. Downramping below 850 cfs
2300
2100
5.3
Gage Height, Feet
4.9
1700
4.7
1500
4.5
1300
4.3
4.1
1100
3.9
900
3.7
700
3.5
500
3.3
3.1
300
2.9
100
2.7
2.5
-100
0
0
0
0
0
0
0
0
0
0
0
0
0
0
0
0
0
0
0
0
00
00
2:0 22: 22:0 22:0 22:0 22:0 22:0 22:0 22:0 22: 22:0 22:0 22:0 22:0 22:0 22:0 22:0 22:0 22:0 22:0 22:0 22:0
2
3
3
3
3
3
3
3
3
3
3
3
3
3
3
3
3
3
3
3
3
3
3
6/0 2/1/0 /17/0 3/5/0 /21/0 4/6/0 /22/0 5/8/0 /24/0 6/9/0 /25/0 /11/0 /27/0 /12/0 /28/0 /13/0 /29/0 /15/0 /31/0 /16/0 2/2/0 /18/0
1/1
2
3
4
5
6
7
7
8
8
9
9 10
1
10
11
12
Date and Time ( Hourly )
13
Flow CFS
1900
5.1
Figure 3
Downramping - Calendar Year 2003
USGS Stream Gage No. 12117600 Cedar River Below Diversion nr Landsburg
All Data is Provisional and Subject to Revision
5
4.5
Gage Height (Inch) change/hr
Max. Downramping
4
Gage Height Change in Inches per Hour
3.5
3
2.5
2
1.5
1
0.5
0
-0.5
-1
-1.5
-2
-2.5
-3
-3.5
-4
-4.5
1-31 thru 2-6 (-1.00" =) above 850 cfs
2-6, 22:00 -2.28" @ 915 cfs
23:00 -1.44" @ 847 cfs
2-25, 17:00 +1.56" @ 904 cfs
18:00 -1.20" @ 847 cfs
3-10 thru 3-13 ( -1.00" + )above 850 cfs
5-2, 20:00 -1.20" @ 278 cfs
10-17, 16:00 -1.20" @ 354 cfs
10-22, 5:00 -1.08" @ 802 cfs
10-28, 20:00 -1.20" @ 354 cfs
10-31, 11:00 -1.32" @ 358 cfs
11-17, 13:00 -2.28" @ 321 cfs
11-19, 0:00 -.60" @ 886 cfs
1:00 -2.04" @ 791 cfs
10-21 thru 10-22 above 850 cfs
11-24 thru 12-9 above 850 cfs
-5
0
0
0
0
0
0
0
0
0
0
0
:00 0:00 0:0 0:00 0:0 0:00 0:0 0:0 0:0 0:0 0:0 0:0 0:00 0:0 0:00 0:0 0:00 0:0 0:00 0:00 0:00 0:00 0:00 0:00 0:00
0
3
3
3
3
3
3
3
3
3
3
3
3
3
3
3
3
3
3
0
0
0
0
0
0
0
0
0
0
0
0
0
0
0
0
0
0
/
/
/
/
/
/
/
/
/
/
/
/
/
/
/
/
/03 /03 /03 /03 /03 /03 /03
/
/
1/1 1/16 1/31 2/15 3/2 3/17 4/1 4/16 5/1 5/16 5/31 6/15 6/30 7/15 7/30 8/14 8/29 9/13 9/28 0/13 0/28 1/12 1/27 2/12 2/27
1
1
1
1
1
1
Date and Time ( Hourly )
14
Calendar Year 2003
USGS Stream Gage No. 12116400 Cedar River at Powerplant at Cedar Falls
All Data is Provisional and Subject to Revision
Figure 4
600
CFS
Max Downramping below 80 CFS
Minimum flow above 30 CFS
500
Flow, CFS
400
300
200
100
0
:00
30
0
/
9/1
:00
30
0
/
7
9/1
:00
30
0
/
/3
10
:00
30
0
/
/19
10
:00
30
0
/
/4
11
:00
30
0
/
/20
11
Date and Time ( Hourly )
15
:00
30
0
/
/6
12
:00
30
0
/
/22
12
Figure 5
5
Downramping--Calendar Year 2003
USGS Stream Gage No. 12116400 Cedar River at Powerplant at Cedar Falls
All Data is Provisional and Subject to Revision
4.5
Gage Height (Inch) change/hr
Max. Downramping
Gage Height Change in Inches per Hour
4
3.5
3
2.5
2
1.5
1
0.5
0
-0.5
-1
-1.5
-2
-2.5
-3
9-18, 14:00 -5.4" @ 43 cfs
9-18, 15:00 -2.5" @ 25 cfs
-3.5
-4
-4.5
10-20 thru 10-21 above 80 cfs
11-18 thru 11-26, 21:00 above 80 cfs
11-28, 12:00 thru 12-6, 17:00 above 80 cfs
12-8, 19:00 thru 12-12, 15:00 above 80 cfs
-5
0
0:0
3
/0
9/1
0
0:0
3
6/0
9/1
0
0:0
3
0
/1/
10
0
0:0
3
/0
/16
10
0
0:0
3
/0
/31
10
0
0:0
3
/0
/15
11
Date and Time ( Hourly )
16
0
0:0
3
/0
/30
11
0
0:0
3
/0
/15
12
0
0:0
3
/0
/30
12
Figure 6
Calendar Year 2003
USGS Stream Gage No. 12116500 Cedar River at Cedar Falls
All Data is Provisional and Subject to Revision
7.9
1800
Gage Height
CFS
Max Downramping below 300 CFS
7.7
1600
7.5
7.3
1400
7.1
1200
6.7
6.5
1000
6.3
6.1
800
5.9
5.7
600
5.5
5.3
400
5.1
4.9
200
4.7
4.5
0
:00
20
3
0
6/
9/1
0
0:0
32
0
/
/2
10
:00
20
3
/0
/18
10
:00
20
3
0
/3/
11
:00
20
3
0
/
/19
11
Date and Time ( Hourly )
17
:00
20
3
0
/5/
12
:00
20
3
/0
/21
12
Flow CFS
Gage Height, Feet
6.9
Figure 7
Downramping--Calendar Year 2003
USGS Stream Gage No. 12116500 Cedar River at Cedar Falls
All Data is Provisional and Subject to Revision
5
4.5
Gage Height (Inch) change/hr
Max. Downramping
4
Gage Height Change in Inches per Hour
3.5
3
2.5
2
1.5
1
0.5
0
-0.5
-1
-1.5
-2
-2.5
10-31, 9:00 -1.7" @ 116 cfs
-3
-3.5
-4
-4.5
-5
0
0:0
3
0
/
9/1
0
0:0
3
0
6/
9/1
0
0:0
3
0
/1/
10
0
0:0
3
0
/
/16
10
0
0:0
3
0
/
/31
10
0
0:0
3
0
/
/15
11
Date and Time ( Hourly )
18
0
0:0
3
0
/
/30
11
0
0:0
3
0
/
/15
12
0
0:0
3
0
/
/30
12
Table 1
UNITED STATES DEPARTMENT OF THE INTERIOR - GEOLOGICAL SURVEY - WASHINGTON STATE NWIS
PROVISIONAL REAL-TIME
STATION NUMBER 12117600 CEDAR RIVER BELOW DIVERSION NR LANDSBURG, WA STREAM SOURCE AGENCY USGS
LATITUDE 472247 LONGITUDE 1215856 DRAINAGE AREA 124 DATUM 490 STATE 53 COUNTY 033
PROVISIONAL DATA
FROM DCP
SUBJECT TO REVISION
DISCHARGE, CUBIC FEET PER SECOND, CALENDER YEAR JANUARY 2003 TO DECEMBER 2003
DAILY MEAN VALUES
FEB
MAR
APR
MAY
JUN
JUL
AUG
SEP
OCT
NOV
DEC
547
954
565
1350
309
267
250
104
88
218
346
1160
617
1130
466
1100
322
270
233
105
88
217
344
1210
3
4
444
289
1070
1230
481
415
1280
1470
313
311
269
270
220
218
108
105
89
88
220
219
345
347
1350
1130
5
281
1020
437
1440
336
270
210
99
86
220
346
953
6
7
273
289
954
723
493
535
1380
1330
368
335
269
269
212
216
92
88
88
90
234
275
346
345
841
824
8
299
608
692
1190
347
269
197
90
112
290
349
995
9
284
502
921
1040
328
270
183
88
98
294
372
1200
10
11
275
269
471
386
1070
1110
908
875
301
300
247
244
276
216
89
96
98
105
307
342
412
384
1190
1160
12
281
380
1670
864
301
292
186
95
97
355
342
1030
13
278
376
1410
918
304
258
177
133
87
351
344
979
14
15
280
278
366
322
1100
1110
785
797
302
325
266
316
166
141
131
123
90
95
342
351
346
376
961
901
16
278
290
1170
811
346
333
132
101
157
501
393
873
17
277
278
1180
841
306
317
136
90
145
437
382
739
18
19
277
276
278
280
1200
1110
775
647
299
307
314
319
140
155
90
106
145
168
338
337
886
812
597
603
20
276
326
1060
548
304
326
135
118
172
516
951
609
21
22
283
451
512
734
981
1000
560
510
301
289
362
353
139
134
117
92
154
163
1400
765
1190
1120
625
596
23
363
615
849
519
289
331
122
91
218
740
1250
572
24
281
753
799
559
290
303
118
88
221
675
1270
561
25
26
278
729
806
804
1240
1420
496
440
285
285
251
251
119
117
88
90
220
219
466
440
1200
1080
566
553
27
818
803
1400
360
283
256
119
90
220
420
867
550
28
722
707
1390
309
271
278
122
91
220
345
979
555
29
30
674
605
1350
1360
311
307
268
267
253
250
114
103
90
89
220
218
354
340
1480
1200
554
555
31
1180
1440
109
87
TOTAL
MEAN
12752
411
17678
631
31424
1014
24720
824
9458
305
8543
285
5115
165
3064
99
4259
142
12662
408
20404
680
25538
824
MAX
1180
1230
1670
1470
368
362
276
133
221
1400
1480
1350
MIN
AC-FT
269
25293
278
35064
415
62329
307
49031
266
18760
244
16945
103
10145
87
6077
86
8448
217
25115
342
40471
546
50654
DAY
JAN
1
2
266
19
353
546
Table 2
OPERATIONAL MINIMUM INSTREAM FLOW SCHEDULE WITH FIRM AND NON-FIRM FLOWS
STATION NUMBER 12117600 CEDAR RIVER BELOW DIVERSION NR LANDSBURG, WA
LATITUDE 472247 LONGITUDE 1215856 DRAINAGE AREA 124 DATUM 490 STATE 53 COUNTY 033
DISCHARGE, CUBIC FEET PER SECOND, CALENDER YEAR JANUARY 2003 TO DECEMBER 2003
DAILY MEAN VALUES
DAY
JAN
FEB
MAR
APR
MAY
JUN
JUL
AUG
SEP
OCT
NOV
DEC
1
260
260
365
365
260
250
225
95
80
210
330
330
2
260
260
365
365
260
250
225
95
80
210
330
330
3
4
260
260
260
260
365
365
365
365
260
260
250
250
200
200
95
80
80
80
210
210
330
330
330
330
5
260
260
365
365
260
250
200
80
80
210
330
330
6
260
260
365
365
260
250
200
80
80
210
330
330
7
8
260
260
260
260
365
365
365
365
260
260
250
250
200
180
80
80
80
80
210
330
330
330
330
330
9
260
260
365
365
260
250
160
80
80
330
330
330
10
260
260
365
365
260
225
160
80
80
330
330
330
11
12
260
260
365
365
365
365
365
365
260
260
225
225
160
160
80
80
80
80
330
330
330
330
330
330
13
260
365
365
365
260
225
160
80
80
330
330
330
14
15
260
260
365
365
365
365
365
260
260
260
225
225
140
125
80
80
80
118
330
330
330
330
330
330
16
260
365
365
260
260
225
125
80
133
330
330
330
17
260
365
365
260
260
225
125
80
133
330
330
330
18
19
260
260
365
365
365
365
260
260
260
260
225
225
125
125
80
80
133
133
330
330
330
330
330
330
20
260
365
365
260
250
225
125
80
133
330
330
330
21
260
365
365
260
250
225
125
80
133
330
330
330
22
23
260
260
365
365
365
365
260
260
250
250
225
225
110
110
80
80
133
210
330
330
330
330
330
330
24
260
365
365
260
250
225
110
80
210
330
330
330
25
26
260
260
365
365
365
365
260
260
250
250
225
225
110
110
80
80
210
210
330
330
330
330
330
330
27
260
365
365
260
250
225
110
80
210
330
330
330
28
260
365
365
260
250
225
110
80
210
330
330
330
29
30
260
260
365
365
260
260
250
250
225
225
95
95
80
80
210
210
330
330
330
330
330
330
31
260
365
95
80
TOTAL
MEAN
8060
260
9170
328
11315
365
9270
309
7940
256
6975
233
4500
145
2525
81
3849
128
9390
303
9900
330
10160
328
MAX
260
365
365
365
260
250
225
95
210
330
330
330
MIN
AC-FT
260
15987
260
18188
365
22443
260
18387
250
15749
225
13835
95
8926
80
5008
80
7634
210
18625
330
19636
260
20152
250
20
330
260
Table 3
UNITED STATES DEPARTMENT OF THE INTERIOR - GEOLOGICAL SURVEY - WASHINGTON STATE NWIS 2/2/2004
STATION NUMBER 12116500 CEDAR RIVER AT CEDAR FALLS, WASH. STREAM SOURCE AGENCY USGS
LATITUDE 472502 LONGITUDE 1214727 DRAINAGE AREA 84.20 DATUM 902.1 STATE 53 COUNTY 033
PROVISIONAL DATA
FROM THE DCP
SUBJECT TO REVISION
DISCHARGE, CUBIC FEET PER SECOND, CALENDER YEAR JANUARY 2003 TO DECEMBER 2003
DAILY MEAN VALUES
DAY
JAN
FEB
MAR
APR
MAY
JUN
JUL
AUG
SEP
OCT
NOV
DEC
1
400
337
436
785
50
144
261
76
32
117
229
789
2
355
628
340
587
76
146
257
73
32
118
229
997
3
4
159
54
724
897
286
253
817
1000
76
77
145
144
257
256
75
78
36
36
142
174
240
292
1020
765
5
59
864
292
999
79
144
254
88
36
176
330
512
6
50
814
338
995
81
144
254
84
36
212
331
464
7
8
67
102
614
514
402
527
997
881
78
63
143
143
253
199
83
83
36
43
269
321
331
331
520
727
9
142
444
542
754
30
144
36
82
31
346
334
939
10
170
406
550
644
30
152
20
81
34
373
331
936
11
12
185
187
335
267
663
816
634
633
30
45
164
229
31
121
52
8.3
60
99
396
397
304
292
892
749
13
187
219
614
627
127
148
168
7.6
94
397
292
610
14
15
186
178
164
122
507
629
513
507
125
119
100
53
168
168
7.2
7.1
91
119
399
431
292
284
595
587
16
176
104
696
498
53
43
168
6.9
171
395
256
577
17
174
103
835
473
30
32
165
6.6
157
223
256
458
18
19
173
175
102
102
1010
926
372
256
30
92
31
31
138
80
6.3
6.2
114
96
223
222
274
260
323
315
20
201
118
832
176
87
32
80
6
73
236
597
316
21
226
225
623
182
78
34
80
11
71
298
902
321
22
23
258
245
293
330
326
218
122
78
74
72
35
34
76
66
25
30
86
119
339
403
974
1100
317
316
24
215
503
300
59
74
32
65
29
121
444
1090
317
25
26
214
260
612
696
748
887
34
33
73
72
56
152
65
66
28
28
119
120
438
434
1080
938
317
320
27
261
681
880
31
74
217
66
27
119
407
705
319
28
269
575
879
32
79
258
70
29
118
334
721
318
29
30
276
274
-----
874
876
34
30
116
146
220
233
80
77
33
33
118
117
340
317
705
681
316
311
31
165
---
896
---
146
---
76
33
---
206
---
284
TOTAL
MEAN
6043
195
11793
421
19001
613
13783
459
2382
77
3583
119
4121
133
1223.2
39
2534
84
9527
307
14981
499
16547
534
MAX
400
897
1010
1000
146
258
261
88
171
444
1100
1020
50
11990
102
23390
31
7110
20
8170
6
2430
31
5030
117
18900
MIN
AC-FT
218
37690
30
27340
30
4720
21
229
29710
284
32820
Table 4
SEATTLE PUBLIC UTILITIES
Daily Readings Approximately 7am
STATION NUMBER 12115900 CHESTER MORSE LAKE AT CEDAR FALLS, WASH.
LATITUDE 472434 LONGITUDE 1214322 DRAINAGE AREA 78.4 sq mi
PROVISIONAL DATA
SUBJECT TO REVISION
RESERVOIR ELEVATION SURFACE WATER (FEET), CALENDER YEAR JANUARY 2003 TO DECEMBER 2003
DAY
JAN
FEB
MAR
APR
MAY
JUN
JUL
AUG
SEP
OCT
NOV
DEC
1
1540.03
1560.32
1557.40
1560.10
1557.50
1561.55
1557.30
1550.30
1549.75
1548.91
1547.41
1552.00
2
1539.52
1561.12
1557.25
1560.15
1557.70
1561.52
1556.96
1550.22
1549.75
1548.77
1547.25
1551.90
3
1539.61
1561.42
1557.15
1560.00
1557.87
1561.44
1556.58
1550.20
1549.77
1548.63
1546.97
1551.49
4
5
1540.03
1561.11
1556.90
1559.50
1558.08
1561.36
1556.23
1550.15
1549.74
1548.41
1546.71
1541.30
1560.62
1556.80
1558.90
1558.35
1561.23
1555.80
1550.10
1549.66
1548.20
1546.40
1551.05
6
1542.15
1560.10
1556.55
1558.22
1558.67
1561.19
1555.48
1550.10
1549.64
1548.00
1546.06
1551.10
7
1542.65
1559.50
1556.34
1557.52
1558.72
1561.00
1555.16
1550.09
1549.56
1547.70
1545.63
1551.00
8
9
1543.30
1559.10
1555.97
1556.85
1558.83
1561.00
1554.98
1550.18
1549.71
1547.50
1545.18
1550.75
1543.77
1558.80
1555.55
1556.43
1558.95
1560.90
1554.78
1550.07
1549.82
1547.15
1544.80
1550.25
10
1544.17
1558.52
1555.90
1556.05
1559.00
1560.75
1554.50
1550.00
1549.79
1546.75
1544.40
1549.67
11
1544.24
1558.16
1556.57
1555.80
1559.15
1560.60
1554.50
1550.00
1549.87
1546.55
1544.75
1548.99
12
13
1544.35
1557.90
1558.05
1555.50
1559.30
1560.40
1554.50
1550.00
1550.10
1546.30
1545.70
1548.89
1544.65
1557.65
1560.03
1555.34
1559.42
1560.15
1554.09
1550.00
1550.12
1546.30
1545.97
1548.30
14
1544.85
1557.50
1561.22
1555.29
1559.48
1560.00
1553.85
1549.99
1550.12
1546.10
1545.97
1548.05
15
1545.09
1557.40
1561.76
1555.25
1559.61
1559.85
1553.53
1549.95
1550.05
1545.90
1545.89
1547.70
16
17
1545.28
1557.32
1561.85
1555.15
1559.72
1559.75
1553.27
1549.96
1549.90
1545.50
1545.81
1547.27
1545.40
1557.28
1561.75
1555.00
1559.96
1559.60
1552.97
1549.95
1550.02
1546.30
1546.10
1547.00
18
1545.50
1557.22
1561.30
1554.90
1560.02
1559.50
1552.65
1549.92
1549.87
1546.41
1547.65
1546.80
19
1545.50
1557.10
1560.68
1555.10
1560.08
1559.38
1552.43
1549.85
1549.83
1546.30
1552.43
1546.58
20
21
1545.50
1557.14
1560.10
1555.20
1560.07
1559.31
1552.22
1549.83
1550.02
1546.15
1553.82
1546.50
1545.50
1557.50
1559.77
1555.31
1560.12
1559.32
1552.03
1549.85
1549.90
1548.50
1553.83
1546.35
22
1545.47
1558.70
1560.22
1555.46
1560.17
1559.30
1551.82
1549.85
1549.85
1550.15
1553.30
1546.50
23
1545.93
1559.52
1561.50
1555.67
1560.25
1559.20
1551.63
1549.81
1549.78
1550.38
1552.54
1546.29
24
25
1546.30
1559.67
1562.25
1555.90
1560.45
1559.10
1551.40
1550.00
1550.01
1550.25
1551.86
1546.15
1546.88
1559.48
1562.40
1556.20
1560.77
1559.00
1551.21
1549.75
1549.68
1549.97
1551.33
1546.01
26
1547.90
1559.02
1562.20
1556.50
1560.98
1558.87
1551.01
1549.75
1549.53
1549.50
1550.69
1545.87
27
1551.28
1558.60
1561.84
1556.72
1561.12
1558.63
1550.86
1549.75
1549.46
1549.00
1550.18
1545.70
28
29
1552.25
1557.95
1561.35
1556.97
1561.26
1558.30
1550.67
1549.74
1549.38
1548.30
1549.72
1545.50
1552.25
1560.83
1557.14
1561.42
1557.95
1550.55
1549.75
1549.18
1548.15
1550.62
1545.25
30
1553.28
1560.30
1557.32
1561.50
1557.60
1550.45
1549.75
1549.09
1547.93
1551.80
1545.02
31
1556.10
1560.00
1550.35
1549.75
0.00
1547.65
MEAN
1545.48
1558.78
1559.41
1556.65
1559.68
1559.93
1553.35
1549.96
1499.77
1547.79
1548.36
1548.07
MAX
MIN
1556.10
1561.42
1562.40
1560.15
1561.53
1561.55
1557.30
1550.30
1550.12
1550.38
1553.83
1552.00
1539.52
1557.10
1555.55
1554.90
1557.50
1557.60
1550.35
1549.74
0.00
1545.50
1544.40
1545.02
1561.53
22
Table 5
UNITED STATES DEPARTMENT OF THE INTERIOR - GEOLOGICAL SURVEY - WASHINGTON STATE NWIS 2/2/2004
STATION NUMBER 12115000 CEDAR RIVER NEAR CEDAR FALLS, WASH. STREAM SOURCE AGENCY USGS
LATITUDE 472213 LONGITUDE 1213726 DRAINAGE AREA 40.70 DATUM 1560.00 STATE 53 COUNTY 033
PROVISIONAL DATA
FROM THE DCP
SUBJECT TO REVISION
DISCHARGE, CUBIC FEET PER SECOND, CALENDER YEAR JANUARY 2003 TO DECEMBER 2003
DAILY MEAN VALUES
DAY
JAN
FEB
MAR
APR
MAY
JUN
JUL
AUG
SEP
OCT
NOV
DEC
1
85
1500
167
574
264
294
70
31
23
28
175
503
2
164
832
159
453
289
262
67
31
23
27
159
403
3
229
621
155
383
304
241
64
31
22
27
144
371
4
5
354
479
474
382
143
152
326
291
298
302
231
243
61
60
30
30
22
22
27
27
131
120
309
326
6
329
317
157
272
284
253
58
30
21
26
112
344
7
256
273
150
255
254
247
56
30
22
29
105
300
8
9
212
183
240
214
138
226
256
272
232
220
226
197
55
53
30
29
51
36
35
54
98
93
267
237
10
161
196
399
270
216
169
51
29
31
73
126
215
11
148
178
707
275
234
152
49
29
63
70
737
195
12
13
173
163
164
153
1230
1270
290
349
260
273
143
135
48
53
29
28
71
41
162
226
478
343
187
214
14
164
144
807
360
291
126
50
27
34
146
269
204
15
16
150
139
138
139
637
551
332
310
309
276
115
109
47
45
27
27
32
44
120
432
229
250
188
177
17
130
142
462
308
250
106
44
27
53
366
442
174
18
122
134
388
291
220
104
42
27
41
240
2270
161
19
20
115
109
129
197
332
313
266
252
200
193
100
109
40
39
26
26
49
50
189
416
1300
706
155
157
21
114
570
371
263
205
133
39
25
43
1240
484
168
22
132
712
831
268
231
115
38
25
39
591
370
158
23
24
188
223
472
343
731
560
264
304
298
455
107
98
37
36
25
24
37
35
396
290
311
280
153
153
25
281
275
503
285
442
93
35
24
33
231
253
154
26
1340
235
447
272
347
89
35
24
32
193
236
145
27
28
1130
758
204
186
392
338
262
251
327
401
86
81
34
34
24
24
31
30
167
205
211
317
136
130
29
620
304
255
379
77
33
24
29
272
1150
122
30
1170
322
259
358
74
32
23
28
220
712
117
31
3090
593
---
335
---
32
23
---
193
---
113
TOTAL
12911
9564
13935
9068
8947
4515
1437
839
1088
6718
12611
6636
MEAN
MAX
416
3090
342
1500
450
1270
302
574
289
455
151
294
46
70
27
31
36
71
217
1240
420
2270
214
503
MIN
85
129
138
251
193
74
32
23
21
26
93
113
AC-FT
25610
18970
27640
17990
17750
8960
2850
1660
2160
13330
25010
13160
CFSM
IN.
10.2
11.8
8.39
8.74
11
12.74
7.43
8.29
7.09
8.18
3.7
4.13
1.14
1.31
0.66
0.77
0.89
0.99
5.32
6.14
10.3
11.53
5.26
6.07
23
Table 6
SEATTLE PUBLIC UTILITIES
LANDSBURG TUNNEL - FLOW VOL 24HR TOT - MG
YEAR 2003
from IWRMS 1-13-04
DAY
JAN
FEB
MAR
APR
MAY
1
2
3
46.9
4
5
87.4
67.7
6
39.2
16.8
151.3
7
9.1
128.7
8
9
35.9
52.4
155.9
10
71.2
53.2
0
112.6
0
50.7
28
33.3
95.2
0
78.7
103.9
11
12
81.7
103
13
91.4
98.6
68
14
89
44.3
15
16
72
69.5
43.7
158.8
158.1
144.3
JUN
JUL
AUG
SEP
OCT
NOV
DEC
87.9
115
168.8
124.7
96.6
48.4
59.7
43.4
86.6
115.4
180.7
120.8
91.8
48
56.7
74.5
0
95.5
112.8
181.6
119.7
95
61.3
62.6
80
79.6
79.9
0
48.6
98.1
88.2
111.2
108.8
190.1
181.9
123.3
134.4
94.1
94.1
75.6
76.1
92.3
109.1
2.2
49.7
77.9
94.7
78.7
107.5
183.2
136.1
92.4
85.9
110
51.6
79.8
143
74.5
106
182.1
134.2
91.1
93.4
107.4
52
79.3
34.5
171.7
171
55.7
55.6
104.2
106.8
157.1
71.3
132.1
131.5
101.7
89.3
125.5
140.7
107.7
81.3
66.4
83.7
86.6
170.4
60.2
128.9
12.2
131.2
92.9
144.8
89.1
85.3
62.3
0
170.7
170.3
55.5
66.2
132.6
134.8
56.6
123.1
113.2
83
124.7
136.8
140.8
145.1
92.9
91.7
84.9
85.3
0
169.5
105.5
110.6
151
71
136.8
147.2
85
83.1
0
160.2
107.5
79
160.4
73.4
119.8
145.9
85.1
86.1
0
0
120.6
107
73.4
50.1
78.9
0
174.3
172
79.1
90.2
123.2
141.3
181
49.1
55.6
55.7
85.3
86.2
17
65
60.3
56.2
85.8
80.3
56.6
0
169.6
91.4
134.7
28.6
67.6
83.9
18
60.8
52.1
152.6
65.6
51.3
0
138.5
90.3
104
47.6
0
66.9
19
20
61.4
75.2
48.5
160
139.4
65.7
54.3
78.1
78.2
0
0
118.5
118
73.9
72.8
91.3
77.7
43.9
28.5
0
0
48.6
49.4
21
103.5
99.6
47.1
77.8
0
116.1
76.8
77
0
59.7
48.1
22
23
33.2
130.3
26.8
11.5
0
31.5
0
77.5
69.9
0
0
119.4
117.7
97.8
97.8
58.7
54.5
0
0
74.1
82.6
49.3
55.5
24
142.5
0
72.2
40
114.8
97.5
52.2
72.8
104.6
61.3
146.9
43.2
87.1
0
25
0
0
74.5
56.2
115.3
97.1
52.3
147.9
130.5
59
26
27
9
0
124.3
0
0
41.3
86.6
69.8
71.8
107.1
137.4
114.4
113.3
96.5
95.5
51.6
49.8
144.6
126
114.3
84.7
60.8
57.2
28
0
0
93.1
79.3
149.2
115
93.7
48
134.4
54.3
52.5
29
15.7
0
88.6
103.5
146
125.8
96.6
48.9
137.5
0
47.2
30
31
108
0
0
0
80
120.6
117.9
153.8
121.5
120.6
96.9
94.4
48.8
112
45
0
42.6
45.2
TOTAL
1971.8
2183.2
1515.3
2431.8
2438.2
2442.2
4184.9
3166.9
2671.1
2777.6
2114.3
1927.2
MEAN
MAX
63.6
146.9
78.0
158.8
48.9
160
81.1
171.7
78.7
120.6
81.4
153.8
135.0
190.1
102.2
136.1
89.0
141.3
89.6
181
70.5
130.5
62.2
86.2
MIN
0
0
0
0
50.1
0
12.2
71
48
0
0
2.2
48
26.3
43.1
116.2
117.4
Average CY 2003
24
81.71
Table 7
SEATTLE PUBLIC UTILITIES
(inches)
LANDSBURG WEATHER STATION - PRECIP 24HR TOT
YEAR 2003
DAY
JAN
FEB
MAR
APR
MAY
JUN
JUL
AUG
SEP
OCT
NOV
DEC
1
2
0.88
0.68
0.04
0.18
0.00
0.55
0.10
0.13
0.00
0.00
0.00
0.00
0.00
0.00
0.00
0.00
0.00
0.00
0.00
0.00
0.03
0.02
0.20
0.50
3
0.09
0.27
0.00
0.25
0.15
0.00
0.00
0.00
0.00
0.00
0.00
0.15
4
5
0.78
0.00
0.00
0.00
0.00
0.06
0.09
0.51
0.29
0.35
0.00
0.00
0.00
0.00
0.00
0.09
0.00
0.00
0.00
0.02
0.00
0.00
0.29
0.85
6
0.00
0.00
0.18
0.16
0.16
0.00
0.00
0.00
0.00
0.00
0.00
0.22
7
0.00
0.00
0.06
0.59
0.05
0.00
0.00
0.00
0.27
0.02
0.00
0.08
8
9
0.00
0.00
0.02
0.06
0.24
1.04
0.26
0.10
0.00
0.00
0.00
0.00
0.00
0.00
0.00
0.00
0.53
0.00
0.28
0.35
0.00
0.00
0.25
0.00
10
0.00
0.00
0.22
0.05
0.00
0.10
0.00
0.16
0.29
0.03
0.35
0.34
11
0.35
0.00
0.63
0.15
0.00
0.00
0.00
0.03
0.63
0.17
0.00
0.21
12
13
0.42
0.40
0.00
0.00
1.08
0.10
0.29
0.92
0.00
0.00
0.00
0.37
0.00
0.21
0.00
0.00
0.03
0.00
0.48
0.00
0.00
0.02
0.42
0.72
14
0.00
0.00
0.02
0.01
0.03
0.00
0.01
0.00
0.01
0.01
0.02
0.14
15
0.00
0.14
0.04
0.00
0.62
0.00
0.00
0.00
0.00
0.36
0.28
0.00
16
17
0.00
0.00
0.48
0.17
0.21
0.11
0.18
0.42
0.15
0.17
0.00
0.00
0.00
0.00
0.00
0.00
0.53
0.01
0.86
0.16
0.42
0.70
0.08
0.00
18
0.03
0.02
0.16
0.01
0.00
0.09
0.00
0.00
0.03
0.00
1.10
0.00
19
0.00
0.23
0.21
0.00
0.00
0.04
0.00
0.00
0.60
0.18
1.31
0.11
20
21
0.00
0.89
0.38
0.65
0.51
0.95
0.00
0.20
0.13
0.22
0.06
1.02
0.00
0.00
0.00
0.00
0.00
0.00
5.50
1.36
0.52
0.13
0.24
0.02
22
0.98
0.34
0.92
0.15
0.01
0.22
0.00
0.00
0.00
0.42
0.08
0.00
23
0.14
0.00
0.15
0.30
0.43
0.11
0.00
0.00
0.00
0.00
0.37
0.03
24
25
0.47
0.45
0.00
0.00
0.05
0.45
0.63
0.01
0.01
0.05
0.00
0.00
0.00
0.00
0.00
0.00
0.00
0.00
0.00
0.00
0.00
0.18
0.31
0.00
26
1.05
0.00
0.08
0.18
0.03
0.00
0.00
0.65
0.00
0.00
0.02
0.08
27
0.50
0.00
0.17
0.00
0.00
0.00
0.00
0.00
0.00
0.02
0.00
0.16
28
29
0.03
0.62
0.27
0.10
0.02
0.00
0.02
0.00
0.00
0.00
0.00
0.00
0.00
0.00
0.00
0.00
0.02
0.16
0.10
1.28
0.52
0.00
0.00
30
0.79
0.17
0.00
0.10
0.04
0.00
0.00
0.00
0.00
0.00
1.30
31
0.63
0.21
0.00
0.00
TOTAL
10.18
3.25
8.69
5.71
2.95
2.05
0.22
0.93
2.95
10.48
7.35
6.70
MEAN
0.33
0.12
0.28
0.19
0.10
0.07
0.01
0.03
0.10
0.34
0.25
0.22
MAX
MIN
1.05
0.00
0.65
0.00
1.08
0.00
0.92
0.00
0.62
0.00
1.02
0.00
0.21
0.00
0.65
0.00
0.63
0.00
5.50
0.00
1.31
0.00
1.30
0.00
0.00
25
0.00
0.00
Table 8
SEATTLE PUBLIC UTILITIES
(inches)
MASONRY WEATHER STATION - PRECIP 24HR TOT
YEAR 2003
DAY
JAN
FEB
MAR
APR
MAY
JUN
JUL
AUG
SEP
OCT
NOV
DEC
1
2
1.72
0.47
0.16
0.75
0.00
0.85
0.05
0.43
0.00
0.00
0.00
0.00
0.00
0.00
0.00
0.00
0.00
0.00
0.00
0.00
0.02
0.00
0.10
1.02
3
0.33
0.04
0.02
0.41
0.22
0.00
0.00
0.00
0.00
0.00
0.00
0.00
4
5
0.99
0.00
0.00
0.00
0.31
0.04
0.24
0.75
1.02
0.40
0.00
0.00
0.00
0.00
0.00
0.05
0.00
0.00
0.00
0.00
0.00
0.00
1.07
1.16
6
0.00
0.00
0.55
0.06
0.00
0.00
0.00
0.00
0.19
0.36
0.00
0.00
7
0.00
0.00
0.46
0.74
0.06
0.00
0.07
0.00
2.90
0.00
0.00
0.20
8
9
0.00
0.00
0.00
0.00
0.85
1.25
0.56
0.00
0.00
0.00
0.00
0.00
0.00
0.00
0.00
0.00
0.20
0.14
0.89
0.88
0.00
0.00
0.10
0.00
10
0.00
0.00
0.76
0.27
0.00
0.05
0.00
0.00
0.76
0.13
1.71
0.00
11
1.12
0.00
1.23
0.11
0.02
0.00
0.00
0.68
1.20
0.62
0.00
0.35
12
13
0.35
0.46
0.00
0.08
1.25
0.12
0.75
0.26
0.00
0.00
0.00
0.42
0.28
0.02
0.00
0.00
0.00
0.00
0.45
0.05
0.00
0.00
0.81
1.60
14
0.00
0.00
0.06
0.06
0.23
0.00
0.00
0.00
0.00
0.00
0.00
0.10
15
0.00
0.43
0.10
0.12
0.41
0.00
0.00
0.13
0.10
1.20
0.82
0.00
16
17
0.00
0.00
0.63
0.17
0.31
0.09
0.53
0.61
0.76
0.15
0.00
0.00
0.00
0.00
0.00
0.00
1.25
0.00
1.27
0.00
0.83
2.53
0.24
0.01
18
0.00
0.05
0.12
0.00
0.00
0.24
0.00
0.00
0.60
0.21
2.91
0.00
19
0.00
0.97
0.15
0.00
0.00
0.45
0.00
0.00
0.54
0.68
0.19
0.28
20
21
0.11
1.05
1.09
1.35
1.45
2.26
0.04
0.16
0.30
0.00
1.04
0.68
0.00
0.00
0.00
0.00
0.00
0.00
5.91
0.10
0.38
0.05
0.00
0.00
22
1.22
0.24
0.39
0.04
0.00
0.18
0.00
0.00
0.00
0.69
0.00
0.00
23
0.44
0.00
0.74
0.76
0.00
0.00
0.00
0.00
0.00
0.00
0.76
0.25
24
25
0.39
1.96
0.00
0.00
0.46
0.41
0.31
0.08
0.15
0.00
0.00
0.00
0.00
0.00
0.00
0.00
0.00
0.00
0.00
0.00
0.66
0.43
0.48
0.13
26
0.88
0.00
0.25
0.03
0.07
0.00
0.00
0.00
0.00
0.00
0.00
0.17
27
0.79
0.10
0.18
0.00
0.00
0.00
0.00
0.00
0.00
0.19
0.76
0.44
28
29
0.00
1.45
0.25
0.00
0.00
0.00
0.00
0.00
0.00
0.00
0.00
0.00
0.00
0.00
0.00
0.00
0.00
0.72
0.21
2.05
0.05
0.13
0.00
30
2.28
1.61
0.00
0.14
0.04
0.00
0.00
0.00
0.00
0.00
0.35
31
0.82
0.30
0.00
0.00
TOTAL
16.83
6.31
16.57
7.37
3.93
3.1
0.368
0.86
7.88
14.56
14.15
9.11
MEAN
0.5
0.2
0.5
0.2
0.1
0.1
0.0
0.0
0.3
0.5
0.5
0.3
MAX
MIN
2.28
0
1.35
0
2.26
0
0.76
0
1.02
0
1.04
0
0.28
0
0.68
0
2.9
0
5.91
0
2.91
0
1.6
0
0.00
26
0.00
0.12
Table 9
1/3
U.S. DEPARTMENT OF THE INTERIOR - U.S. GEOLOGICAL SURVEY - WATER RESOURCES
STATION NUMBER 12117600 CEDAR RIVER BELOW DIVERSION NEAR LANDSBURG, WA
SOURCE AGENCY USGS
LATITUDE 472247 LONGITUDE 1215856 NAD27 DRAINAGE AREA 124
CONTRIBUTING DRAINAGE AREA
Date Processed: 2004- 02- 10 14:25 By johanson
Discharge FROM DCP, in cfs
COMPUTED UNIT VALUES (INSTANTANEOUS)
(# VALUES)
0100
1300
PROVISIONAL DATA
(96)
939
904
0200
1400
933
892
0300
1500
933
898
0400
1600
0500
1700
0600
1800
0700
1900
0800
2000
FEBRUARY 06, 2003
Pacific Standard Time
927
933
921
921
915
898
1080
1180
1190
1130
0900
2100
909
1030
STATE 53 COUNTY 033
DATUM 490 NGVD29
1000
2200
904
915
1100
2300
1200
2400
SUBJECT TO REVISION
915
909
847
824
U.S. DEPARTMENT OF THE INTERIOR - U.S. GEOLOGICAL SURVEY - WATER RESOURCES
STATI ON NUMBER 12117600 CEDAR RIVER BELOW DIVERSION NEAR LANDSBURG, WA
SOURCE AGENCY USGS
LATITUDE 472247 LONGITUDE 1215856 NAD27 DRAINAGE AREA 124
CONTRIBUTING DRAINAGE AREA
Date Processed: 2004- 02- 10 14:25 By johanson
Gage height FROM DCP, in feet
COMPUTED UNIT VALUES (INSTANTANEOUS)
(# VALUES)
0100
1300
PROVISIONAL DATA
(96)
4.67
4.61
0200
1400
4.66
4.59
0300
1500
4.66
4.60
0400
1600
0500
1700
0600
1800
0700
1900
08 00
2000
FEBRUARY 06, 2003
Pacific Standard Time
4.65
4.66
4.64
4.64
4.63
4.60
4.91
5.06
5.08
4.98
0900
2100
4.62
4.82
STATE 53 COUNTY 033
DATUM 490 NGVD29
1000
2200
4.61
4.63
1100
2300
1200
2400
SUBJECT TO REVISION
4.63
4.62
4.51
4.47
U.S. DEPARTMENT OF THE INTERIOR - U.S. GEOLOGICAL SURVEY - WATER RESOURCES
STATION NUMBER 12117600 CEDAR RIVER BELOW DIVERSION NEAR LANDSBURG, WA
SOURCE AGENCY USGS
LATITUDE 472247 LONGITUDE 1215856 NAD27 DRAINAGE AREA 124
CONTRIBUTING DRAINAGE AREA
Date Processed: 2004- 02- 10 14:25 By johanson
Discharge FROM DCP, in cfs
COMPUTED UNIT VALUES (INSTANTANEOUS)
(# VALUES)
0100
1300
PROVISIONAL DATA
(96)
791
780
0200
1400
786
775
0300
1500
780
775
0400
1600
0500
1700
0600
1800
FEBRUARY 25, 2003
786
786
786
830
904
847
0700
19 00
0800
2000
Pacific Standard Time
780
780
841
835
0900
2100
786
847
STATE 53 COUNTY 033
DATUM 490 NGVD29
1000
2200
780
841
1100
2300
1200
2400
SUBJECT TO REVISION
770
786
841
830
U.S. DEPARTMENT OF THE INTERIOR - U.S. GEOLOGICAL SURVEY - WATER RESOURCE S
STATION NUMBER 12117600 CEDAR RIVER BELOW DIVERSION NEAR LANDSBURG, WA
SOURCE AGENCY USGS
LATITUDE 472247 LONGITUDE 1215856 NAD27 DRAINAGE AREA 124
CONTRIBUTING DRAINAGE AREA
Date Processed: 2004- 02- 10 14:25 By johanson
Gage height FROM DCP, in feet
COMPUTED UNIT VALUES (INSTANTANEOUS)
(# VALUES)
0100
1300
PROVISIONAL DATA
(96)
4.41
4.39
0200
1400
4.40
4.38
0300
1500
4.39
4.38
0400
1600
0500
1700
0600
1800
0700
1900
0800
2000
FEBRUARY 25, 2003
Pacific Standard Time
4.40
4.40
4.40
4.39
4.39
4.48
4.61
4 .51
4.50
4.49
0900
2100
4.40
4.51
STATE 53 COUNTY 033
DATUM 490 NGVD29
1000
2200
4.39
4.50
1100
2300
1200
2400
SUBJECT TO REVISION
4.37
4.40
4.50
4.48
U.S. DEPARTMENT OF THE INTERIOR - U.S. GEOLOGICAL SURVEY - WATER RESOURCES
STATION NUMBER 12117600 CEDAR RIVER BELOW DIVERSION NEAR LANDSBURG, WA
SOURCE AGENCY USGS
LATITUDE 472247 LONGITUDE 1215856 NAD27 DRAINAGE AREA 124
CONTRIBUTING DRAINAGE AREA
Date Processed: 2004- 02- 10 14:25 By johanson
Discharge FROM DCP, in cfs
COMPUTED UNIT VALUES (INSTANTANEOUS)
(# VALUES)
0100
1300
PROVISIONAL DATA
(96)
310
339
0200
1400
310
336
0300
1500
310
332
0400
1600
310
325
0500
1700
MAY 02, 2003
310
328
0600
1800
310
328
0700
1900
0800
2000
Pacific Daylight Time
325
343
314
278
0900
2100
362
306
STATE 53 COUNTY 033
DATUM 490 NGVD29
1000
2200
366
321
1100
2300
1200
2400
SUBJECT TO REVISION
366
351
328
310
U.S. DEPARTMENT OF THE INTERIOR - U.S. GEOLOGICAL SURVE Y - WATER RESOURCES
STATION NUMBER 12117600 CEDAR RIVER BELOW DIVERSION NEAR LANDSBURG, WA
SOURCE AGENCY USGS
LATITUDE 472247 LONGITUDE 1215856 NAD27 DRAINAGE AREA 124
CONTRIBUTING DRAINAGE AREA
Date Processed: 2004- 02- 10 14:59 By johanson
Gage height FROM DCP, in feet
COMPUTED UNIT VALUES (INSTANTANEOUS)
(# VALUES)
0100
1300
PROVISIONAL DATA
(96)
3.35
3.43
0200
1400
3.35
3.42
0300
1500
3.35
3.41
0400
1600
0500
1700
MAY 0 2, 2003
3.35
3.35
3.39
3.40
0600
1800
0700
1900
0800
2000
Pacific Daylight Time
3.35
3.39
3.44
3.40
3.36
3.26
27
0900
2100
3.49
3.34
STATE 53 COUNTY 033
DATUM 490 NGVD29
1000
2200
3.50
3.38
1100
2300
1200
2400
SUBJECT TO REVISION
3.50
3.46
3.40
3.35
2/3
U.S. DEPARTMENT OF THE INTERIOR - U.S. GEOLOGICAL SURVEY - WATER RESOURCES
STATION NUMBER 12117600 CEDAR RIVER BELOW DIVERSION NEAR LANDSBURG, WA
SOURCE AGENCY USGS
LATITUDE 472247 LONGITUDE 1215856 NAD27 DRAINAGE AREA 124
CONTRIBUTING DRAINAGE AREA
Date Processed: 2004- 02- 10 14:25 By johanson
Discharge FROM DCP, in cfs
COMPUTED UNIT VALUES (INSTANTANEOUS)
(# VALUES)
0100
1300
PROVISIONAL DATA
(96)
558
430
0200
1400
544
414
0300
1500
535
394
0400
1600
0500
1700
OCTOBER 17, 2003
522
517
355
332
0600
1800
499
355
0700
1900
0800
2000
Pacific Daylight Time
490
477
358
374
0900
2100
473
366
STATE 53 COUNTY 033
DATUM 490 NGVD29
1000
2200
464
358
1100
2300
1200
2400
SUBJECT TO REVISION
447
439
355
351
U.S. DEPARTMENT OF THE INTERIOR - U.S. GEOLOGICAL SURVEY - WATER RESOURCES
STATION NUMBER 12117600 CEDAR RIVER BELOW DIVERSION NEAR LANDSBURG, WA
SOURCE AGENCY USGS
LATITUDE 472247 LONGITUDE 1215856 NAD27 DRAINAGE AREA 124
CONTRIBUTING DRAINAGE AREA
Date Processed: 2004- 02- 10 14:25 By johanson
Gage height FROM DCP, in feet
COMPUTED UNIT VALUES (INSTANTANEOUS)
(# VALUES)
0100
1300
PROVISIONAL DATA
(96)
3.95
3.66
0200
1400
3.92
3.62
0300
1500
3.90
3.57
0400
1600
0500
1700
OCTOBER 17, 2003
3.87
3.86
3.47
3.41
0600
1800
0700
1900
0800
2000
Pacific Daylight Time
3.82
3.80
3.77
3.47
3.48
3.52
0900
2100
3.76
3.50
STATE 53 COUNTY 033
DATUM 490 NGVD29
1000
2200
3.74
3.48
1100
2300
1200
2400
SUBJECT TO REVISION
3.70
3.68
3.47
3.46
U.S. DEPARTMENT OF THE INTERIOR - U.S. GEOLOGICAL SURVEY - WATER RESOURCES
STATION NUMBER 12117600 CEDAR RIVER BELOW DIVERSION NEAR LANDSBURG, WA
SOURCE AGENCY USGS
LATITUDE 472247 LONGITUDE 1215856 NAD27 DRAINAGE AREA 124
CONTRIBUTING DRAINAGE AREA
Date Processed: 2004- 02- 10 14:25 By johanson
Discharge FROM DCP, in cfs
COMPUTED UNIT VALUES (INSTANTANEOUS)
(# VALUES)
0100
1300
PROVISIONAL DATA
(96)
863
748
0200
1400
886
722
0300
1500
869
717
0400
1600
0500
1700
OCTOBER 22, 2003
852
802
696
701
0600
1800
819
696
0700
1900
0800
2000
Pacific Daylight Time
808
797
696
701
0900
2100
775
696
STATE 53 COUNTY 033
DATUM 490 NGVD29
1000
2200
775
701
1100
2300
1200
2400
SUBJECT TO REVISION
743
738
711
753
U.S. DEPARTMENT OF THE INTERIOR - U.S. GEOLOGICAL SURVEY - WATER RESOURCES
STATION NUMBER 12117600 CEDAR RIVER BELOW DIVERSION NEAR LANDSBURG, WA
SOURCE AGENCY USGS
LATITUDE 472247 LONGITUDE 1215856 NAD27 DRAINAGE AREA 124
CONTRIBUTING DRAINAGE AREA
Date Processed: 2004- 02- 10 14:25 By johanson
Gage height FROM DCP, in feet
COMPUTED UNIT VALUES (INSTANTANEOUS)
(# VALUES)
0100
1300
PROVISIONAL DATA
(96)
4.54 T
4.33
0200
1400
4.58
4.28
0300
1500
4.55
4.27
0400
1600
0500
1700
OCTOBER 22, 2003
4.52
4.43
4.23
4.24
0600
1800
0700
1900
0800
2000
Pacific Daylight Time
4.46
4.44
4.42
4.23
4.23
4.24
0900
2100
4.38
4.23
STATE 53 COUNTY 033
DATUM 490 NGVD29
1000
2200
4.38
4.24
1100
2300
1200
2400
SUBJECT TO REVISION
4.32
4.3 1
4.26
4.34
NOTE: SYMBOLS USED ABOVE HAVE THE FOLLOWING MEANINGS -T = THIS VALUE EXCEEDS THE "STANDARD DIFFERENCE" THRESHOLD
U.S. DEPARTMENT OF THE INTERIOR - U.S. GEOLOGICAL SURVEY - WATER RESOURCES
STATION NUMBER 12117600 CEDAR RIVER BELOW DIVERSION NEAR LANDSBURG, WA
SOURCE AGENCY USGS
LATITUDE 472247 LONGITUDE 1215856 NAD27 DRAINAGE AREA 124
CONTRIBUTING DRAINAGE AREA
Date Processed: 2004- 02- 10 14:25 By johanson
Discharge FROM DCP, in cfs
COMPUTED UNIT VALUES (INSTANTANEOUS)
(# VALUES)
0100
1300
PROVISIONAL DATA
(96)
328
343
0200
1400
328
339
0300
1500
343
339
0400
1600
0500
1700
OCTOBER 28, 2003
351
343
336
336
0600
1800
336
343
0700
1900
0800
2000
Pacific Standard Time
336
336
394
355
0900
2100
343
355
STATE 53 COUNTY 033
DATUM 490 NGVD29
1000
2200
343
370
1100
2300
1200
2400
SUBJECT TO REVISION
339
343
378
378
U.S. DEPARTMENT OF THE INTERIOR - U.S. GEOLOGICAL SURVEY - WATER RESOURCES
STATION NUMBER 12117600 CEDAR RIVER BELOW DIVERSION NEAR LANDSBURG, WA
SOURCE AGENCY USGS
LATITUDE 472247 LONGITUDE 1215856 NAD27 DRAINAGE AREA 124
CONTRIBUTING DRAINAGE AREA
Date Proces sed: 2004- 02- 10 14:25 By johanson
Gage height FROM DCP, in feet
COMPUTED UNIT VALUES (INSTANTANEOUS)
(# VALUES)
0100
1300
PROVISIONAL DATA
(96)
3.40
3.44
0200
1400
3.40
3.43
0300
1500
3.44
3.43
0400
1600
0500
1700
OCTOBER 28, 2003
3.46
3.44
3.42
3.42
0600
1800
3.42
3.44
0700
1900
0800
2000
Pacific Standard Time
3.42
3.42
3.57 T
3.47
NOTE: SYMBOLS USED ABOVE HAVE THE FOLLOWING MEANINGS -T = THIS VALUE EXCEEDS THE "STANDARD DIFFERENCE" THRESHOLD
28
0900
2100
3.44
3.47
STATE 53 COUNTY 033
DATUM 490 NGVD29
1000
2200
3.44
3.51
1100
2300
1200
2400
SUBJECT TO REVISION
3.43
3.44
3.53
3.53
3/3
U.S. DEPARTMENT OF THE INTERIOR - U.S. GEOLOGICAL SURVEY - WATER RESOURCES
STATION NUMBER 12117600 CEDAR RIVER BELOW DIVERSION NEAR LANDSBURG, WA
SOURCE AGENCY USGS
LATITUDE 472247 LONGITUDE 1215856 NAD27 DRAINAGE AREA 124
CONTRIBUTING DRAINAGE AREA
Date Processed: 2004- 02- 10 14:25 By johanson
Discharge FROM DCP, in cfs
COMPUTED UNIT VALUES (INSTANTANEOUS)
(# VALUES)
0100
1300
PROVISIONAL DATA
(96)
343
314
0200
1400
351
321
0300
1500
347
343
0400
1600
0500
1700
OCTOBER 31, 2003
343
332
370
374
0600
1800
343
366
0700
1900
0800
2000
Pacific Standard Time
355
366
358
358
0900
2100
406
351
U.S. DEPARTMENT OF THE INTERIOR - U.S. GEOLOGICAL SURVEY - WATER RESOURCES
STATION NUMBER 12117600 CEDAR RIVER BELOW DIVERSION NEAR LANDSBURG, WA
SOURCE AGENCY USGS
LATITU DE 472247 LONGITUDE 1215856 NAD27 DRAINAGE AREA 124
CONTRIBUTING DRAINAGE AREA
Date Processed: 2004- 02- 10 14:25 By johanson
Gage height FROM DCP, in fee t
COMPUTED UNIT VALUES (INSTANTANEOUS)
(# VALUES)
0100
1300
PROVISIONAL DATA
(96)
3.44
3.36
0200
1400
3.46
3.38
0300
1500
3.45
3.44
0400
1600
0500
1700
OCTOBER 31, 2003
3.44
3.41
3.51
3.52
0600
1800
0700
1900
0800
20 00
Pacific Standard Time
3.44
3.47
3.50
3.50
3.48
3.48
0900
2100
3.60
3.46
U.S. DEPARTMENT OF THE INTERIOR - U.S. GEOLOGICAL SURVEY - WATER RESOURCES
STATION NUMBER 12117600 CEDAR RIVER BELOW DIVERSION NEAR LANDSBURG, WA
SOURCE AGENCY USGS
LATITUDE 472247 LONGITUDE 1215856 NAD27 DRAINAGE AREA 124
CONTRIBUTING DRAINAGE AREA
Date Processed: 2004- 02- 10 14:25 By johanson
Discharge FROM DCP, in cfs
COMPUTED UNIT VALUES (INSTANTANEOUS)
(# VALUES)
0100
1300
PROVISIONAL DATA
(96)
410
321
0200
1400
414
328
0300
1500
410
410
0400
1600
0500
1700
0600
1800
NOVEMBER 17, 2003
394
398
394
382
370
362
0700
1900
0800
2000
Pacific Standard Time
394
394
3 66
366
0900
2100
370
370
U.S. DEPARTMENT OF THE INTERIOR - U.S. GEOLOGICAL SURVEY - WATER RESOURCES
STATION NUMBER 12117600 CEDAR RIVER BELOW DIVERSION NEAR LANDSBURG, WA
SOURCE AGENCY USGS
LATITUDE 472247 LONGITUDE 1215856 NAD27 DRAINAGE AREA 124
CONTRIBUTING DRAINAGE AREA
Date Processed: 2004- 02- 10 14:25 By johanson
Gage height F ROM DCP, in feet
COMPUTED UNIT VALUES (INSTANTANEOUS)
(# VALUES)
0100
1300
0200
1400
PROVISIONAL DATA
(96)
3.61
3.62
3.38 T
3.40
NOTE: SYMBOLS USED ABOVE HAVE
T = THIS VALUE EXCEEDS THE
0300
1500
0400
1600
0500
1700
0600
1800
0700
1900
0800
2000
NOVEMBER 17, 2003
Pacific Standard Time
3.61
3.57
3.58
3.57
3.57
3.57
3.61
3.54
3.51
3.49
3.50
3.50
THE FOLLOWING MEANINGS -"STANDARD DIFFERENCE" THRESHOLD
0900
2100
3.51
3.51
U.S. DEPARTMENT OF THE INTERIOR - U.S. GEOLOGICAL SURVEY - WATER RESOURCES
STATION NUMBER 12117600 CEDAR RIVER BELOW DIVERSION NEAR LANDSBURG, WA
SOURCE AGENCY USGS
LATITUDE 472247 LONGITUDE 1215856 NAD27 DRAINAGE AREA 124
CONTRIBUTING DRAINAGE AREA
Date Processed: 2004- 02- 10 14:59 By johanson
Discharge FROM DCP, in cfs
COMPUTED UNIT VALUES (INSTANTANEOUS)
(# VALUES)
0100
1300
0200
1400
0300
1500
0400
1600
0500
1700
0600
1800
0700
1900
0800
2000
0900
2100
STATE 53 COUNTY 033
DATUM 490 NGVD29
1000
2200
402
347
1100
2300
1200
2400
SUBJECT TO REVISION
358
332
343
343
STATE 53 COUNTY 033
DATUM 490 NGVD29
1000
2200
3.59
3.45
1100
2300
1200
2400
SUBJECT TO REVISION
3.48
3.41
3.44
3.44
STATE 53 COUNTY 033
DATUM 490 NGVD29
1000
2200
374
374
1100
2300
1200
2400
SUBJECT TO REVISION
374
394
386
378
STATE 53 COUNTY 033
DATUM 490 NGVD29
1000
2200
3.52
3.52
1100
2300
1200
2400
SUBJECT TO REVISION
3.52
3.57
3.55
3.53
STATE 53 COUNTY 033
DATUM 490 NGVD29
1000
2200
1100
2300
1200
2400
PROVISIONAL DATA
(96)
390
1060
390
1100
426
1110
NOVEMBER 18, 2003
Pacific Standard Time
495
577
7 53
1020
998
1110
1090
1060
1010
980
1070
933
1100
933
SUBJECT TO REVISION
1060
1040
915
886
PROVISIONAL DATA
(96)
791
759
797
753
786
759
NOVEMBER 19, 2003
753
764
780
770
786
830
909
819
858
824
SUBJECT TO REVISION
813
786
841
852
Pacific Standard Time
898
921
813
819
U.S. DEPARTMENT OF THE INTERIOR - U.S. GEOLOGICAL SURVEY - WATER RESOURCES
STATION NUMBER 12117600 CEDAR RIVER BELOW DIVERSION NEAR LANDSBURG, WA
SOURCE AGENCY USGS
LATITUDE 472247 LONGITUDE 1215856 NAD27 DRAINAGE AREA 124
CONTRIBUTING DRAINAGE AREA
Date Processed: 2004- 02- 10 14:59 By johanson
Gage height FROM DCP, in feet
COMPUTED UNIT VALUES (INSTANTANEOUS)
(# VALUES)
0100
1300
PROVISIONAL DATA
(96)
3.56
4.87
0200
1400
3.56
4.93
PROVISIONAL DATA
(96)
4.41
4.42
4.35
4.34
NOTE: SYMBOLS USED ABOVE HAVE
T = THIS VALUE EXCEEDS THE
0300
1500
3.65
4.95
0400
1600
0500
1700
0600
1800
0700
1900
0800
2000
NOVEMBER 18, 2003
Pacific Standard Time
3.81
3.99
4.34
4.81 T
4.77
4.95
4.92
4.87
4.79
4.74
NOVEMBER 19, 2003
Pacific Standard Time
4.40
4.34
4.36
4.39
4.60
4.64
4.35
4.37
4.40
4.48
4.45
4.46
THE FOLLOWING MEANINGS -"STANDARD DIFFERENCE" THRESHOLD
29
0900
2100
STATE 53 COUNTY 033
DATUM 490 NGVD29
1000
2200
1100
2300
1200
2400
4.89
4.66
4.94
4.66
SUBJECT TO REVISION
4.87
4.84
4.63
4.58
4.62
4.46
4.53
4.47
SUBJECT TO REVISION
4.45
4.40
4.50
4.52
Table 10
UNITED STATES DEPARTMENT OF THE INTERIOR - GEOLOGICAL SURVEY - WASHINGTON STATE NWIS 2/2/2004
STATION NUMBER 12116400 CEDAR RIVER AT POWERPLANT AT CEDAR FALLS, WASH. SOURCE AGENCY USGS
LATITUDE 472508 LONGITUDE 1214649 NAD27 DRAINAGE AREA CONTRIBUTING DRAINAGE AREA DATUM 940 NGVD29
PROVISIONAL DATA
FROM THE DCP
SUBJECT TO REVISION
DISCHARGE, CUBIC FEET PER SECOND, CALENDER YEAR JANUARY 2003 TO DECEMBER 2003
DAILY MEAN VALUES
DAY
JAN
FEB
MAR
APR
MAY
JUN
JUL
AUG
SEP
OCT
NOV
DEC
1
398
343
141
157
28
32
26
14
32
33
62
156
2
351
636
68
65
28
33
26
14
33
33
61
370
3
153
728
56
197
28
33
25
14
36
33
60
391
4
5
51
56
864
847
37
36
384
379
28
29
33
33
25
24
13
14
36
36
34
34
59
58
226
230
6
47
771
35
377
31
34
23
13
36
34
58
160
7
66
621
106
375
28
34
22
12
36
33
57
76
8
9
101
142
523
448
233
248
254
210
28
28
33
33
22
21
12
11
42
32
34
35
57
57
112
239
10
169
401
257
52
27
33
21
11
34
33
61
233
11
182
311
377
50
27
33
24
11
62
33
60
195
12
13
186
186
250
199
562
470
48
49
28
29
33
33
125
171
10
9.6
103
98
34
34
59
59
99
73
14
184
161
225
46
29
33
170
9
94
37
59
72
15
176
120
127
94
28
32
169
8.3
125
38
60
67
16
17
174
173
103
102
120
279
38
38
28
29
31
31
168
167
7.9
7.4
175
159
47
51
64
63
65
63
18
171
101
441
37
29
30
138
6.9
105
51
130
61
19
173
101
350
36
29
30
81
6.5
78
52
119
60
20
21
199
224
106
225
315
102
34
33
29
30
30
33
80
80
6
5.4
48
47
90
173
134
276
61
62
22
253
293
91
32
30
33
55
4.8
43
59
354
61
23
240
330
82
31
31
32
17
4.5
35
73
478
60
24
25
210
210
395
330
70
130
34
33
32
32
30
29
16
16
4
4.3
33
33
62
56
477
466
60
59
26
256
419
263
31
32
29
15
4.5
33
52
311
58
27
257
396
262
30
31
28
15
3.4
33
51
72
57
28
29
266
271
284
---
259
258
29
28
32
32
28
27
16
20
11
34
32
32
59
64
83
129
56
56
30
265
---
256
28
32
27
16
34
33
63
106
55
31
157
---
267
---
32
---
15
33
---
63
---
55
TOTAL
5947
10408
6523
3229
914
943
1809
353.5
1754
1578
4149
3648
MEAN
192
372
210
108
29
31
58
11
58
51
138
118
MAX
MIN
398
47
864
101
562
35
384
28
32
27
34
27
171
15
34
3.4
175
32
173
33
478
57
391
55
30


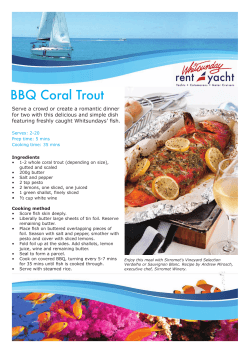


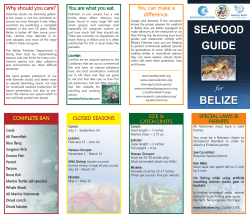

© Copyright 2026