
Circuit Applications of Sample-Hold Amplifiers Circuit Applications
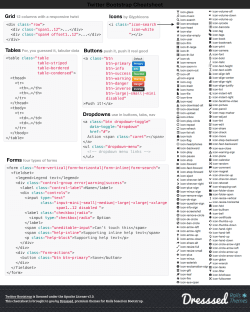
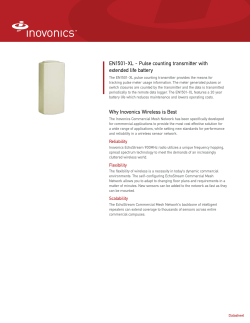
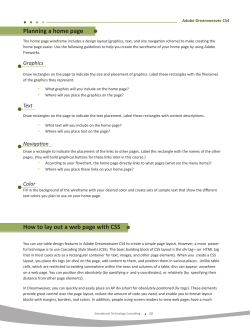
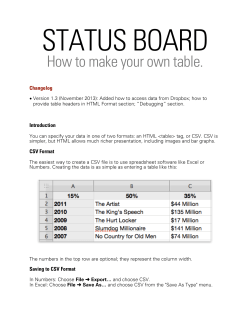
National Semiconductor
Application Note 266
January 1981
Most designers are familiar with the sample-hold amplifier
as a system component which is utilized in high speed data
acquisition work. In these applications, the sample-hold amplifier is used to store analog data which is then digitized by
a relatively slow A/D converter. In this fashion, high speed
or multiplexed analog data can be digitized without resorting
to complex and expensive ultra-high speed A/D converters.
Fiber Optic Data Link Intrusion Alarm
The circuit of Figure 1 will detect an attempt to tap a fiber
optic data link. It may be used with any fiber optic communication system which transmits data in pulse coded form.
The circuit works by detecting any short-term change in the
loss characteristics of the fiber optic line. Long term changes due to temperature and component aging do not affect
the circuit. The amplitude of the pulses at the LH0082 fiber
optic receiver IC (A6) will depend upon the characteristics of
the photocomponents and the losses in the optical line. Any
attempt to tap the fiber optic will necessitate removal of
some amount of light energy. This will cause an instantaneous drop in the pulse amplitude at A6’s output. The amplitude of each of A6’s output pulses is sampled by the LF398
sample-hold amplifier (A3), A1 and A2 provide a delayed
The use of sample-hold amplifiers as circuit oriented components is not as common as the class of application described above. This is unfortunate, because sampling techniques allow circuit functions which are sophisticated, low
cost and not easily achieved with other approaches. An excellent example is furnished by the fiber optic data link intrusion alarm of Figure 1.
Circuit Applications of Sample-Hold Amplifiers
Circuit Applications of
Sample-Hold Amplifiers
TL/H/5627 – 1
C1995 National Semiconductor Corporation
TL/H/5627
RRD-B30M115/Printed in U. S. A.
AN-266
FIGURE 1. Fiber optic link eavesdropping attempts are immediately detected by this design. Working on a pulse-bypulse comparison basis, A3 samples each input pulse and holds its output amplitude value at a DC level. Anything
that disturbs the next input’s amplitude causes a jump in this level; because A4 is an AC-coupled amplifier, the
comparator and latch then activate.
sample-hold control pulse to A3, which insures that A6’s
output is sampled well after its output has settled. Under
normal conditions, the pulse-to-pulse amplitude variations at
A6’s output will be negligible, and the output of A3 will be at
a DC level. A4 is AC coupled and its output will be zero.
During an intrusion attempt, energy will be removed from
the line and A6’s output will shift, causing A3 to jump to a
new DC level. This shift will be AC amplified by A4 and the
A5 comparator will trip, activating the latch circuitry.
Note that the circuit is not affected by slow drifts in circuit
components over time and temperature because it is only
sensitive to AC disturbances on the line. In addition, the
frequency and pulse widths of the data may vary over wide
ranges. The photo of Figure 2 shows the circuit in operation.
Trace A is A6’s output. Trace B is the sample-hold control
pin at A3 and Trace C is the latch-alarm output. In this figure, a disturbance on the fiber optic line has occurred just
past the midpoint of the photo. This is reflected by the reduced amplitude of A6’s output at this point. The latchalarm output goes high just after the sample command rises, due to the sample-hold amplifier jumping to the new
value at A6’s output. In the photo, the disturbance has been
made large ( j 10%) for viewing purposes. In practice, the
circuit will detect an energy removal as small as 0.1% from
the line.
TL/H/5627 – 2
TRACE VERTICAL HORIZONTAL
A
B
C
10V/DIV
10V/DIV
10V/DIV
1 mSEC/DIV
1 mSEC/DIV
1 mSEC/DIV
FIGURE 2. An intrusion attempt occurring just past the
midpoint of Trace A is immediately detected by Figure
1’s circuit. The photodetector’s amplifier output (A)
shows a slight amplitude drop. The next time the S-H
amplifier samples this signal (B), the alarm latch sets
(C).
Proportional Pulse Stretcher
The circuit of Figure 3 allows high accuracy measurement of
short width pulse durations. The pulses may be either
TL/H/5627 – 3
FIGURE 3. Pulse width measurement accuracy is enhanced by this pulse stretching circuit. A short input pulse triggers
the 74121 one-shot and (via Q1) discharges the 100 pF capacitor while concurrently turning on the recharging current
source, Q3. So long as the input pulse is present, the capacitor charges; when the pulse ends, the capacitor’s voltage is
proportional to the pulse’s width. S-H amplifier A2 samples this voltage, and the resultant DC level controls the ON
duration of the A4/A5 pulse width modulator.
2
ceives its sample-hold command from A3 (Figure 4, Trace
EÐnote horizontal scale change at this point). A3 is fed
from a delay network which is driven by A1’s inverting output. The output of A2 is a DC voltage, which represents the
width of the most recently applied pulse to the circuit’s input. This DC potential is applied to A4, which along with A5
comprises a voltage controlled pulse width modulator. A5
ramps positive (Figure 4, Trace G) until it is reset by a pulse
from A6, which goes high for a short period (Figure 4, Trace
F) each time A3’s output (Figure 4, Trace E) goes low. The
ramps at A6’s output are compared to A2’s output voltage
by A4, which goes high for a period linearly dependent on
A2’s output value (Figure 4, Trace H). This pulse is the circuit’s output.
In this particular circuit, the time amplification factor is about
2000 with a 1 ms full-scale width giving a 1.4 ms output
pulse. Absolute accuracy of the time expansion is 1% (10
ns) referred to input with resolution down to 2 ns. The 50 ns
DM74121 reset pulse limits the minimum pulse width the
circuit can measure.
repetitive or single-shot events. Using digital techniques, a
1% width measurement of a 1 ms event requires a 100 MHz
clock. This circuit gets around this requirement by linearly
amplifying the width of the input pulse with a time multiplying
factor of 1000 or more. Thus, a 1 ms input event will yield a
1 ms output pulse which is easy to measure to 1%. This
measurement capability is useful in high energy physics and
nuclear instrumentation work, where short pulse width signals are common.
Figure 4, Trace A shows a 350 ns input pulse applied to the
circuit of Figure 3. The A1 comparator output goes low (Figure 4, Trace B), triggering the DM74121 one shot, which
resets the 100 pF capacitor to 0V via Q1 with a 50 ns pulse
(Trace C). Concurrently, Q2 is turned off, allowing the A3
current source to charge the 100 pF capacitor in a linear
fashion (Figure 4, Trace C). This charging continues until the
circuit input pulse ends, causing A1’s output to return high
and cutting off the current source. The voltage across the
100 pF capacitor at this point in time is directly proportional
to the width of the circuit input pulse. This voltage is sampled by the LF398 sample-hold amplifier (A2) which re-
TL/H/5627 – 4
TRACE VERTICAL HORIZONTAL
A
B
C
D
E
F
G
H
10V/DIV
5V/DIV
5V/DIV
5V/DIV
50V/DIV
50V/DIV
20V/DIV
100V/DIV
100 nSEC/DIV
100 nSEC/DIV
100 nSEC/DIV
100 nSEC/DIV
500 mSEC/DIV
500 mSEC/DIV
500 mSEC/DIV
500 mSEC/DIV
FIGURE 4. A sequence of events in Figure 3’s circuit
stretches a 350 ns input pulse (A) by a factor of 2000.
When triggered, comparator A1 goes low (B). This action
starts the recharging of a capacitor (C) after its previously stored charge has been dumped (D). When the input
pulse ends, the capacitor’s voltage is sampled under control of a delayed pulse (E) derived from the input amplifier’s inverting output (F). The sampled and held voltage
then turns off a voltage controlled pulse width modulator
(G), and a stretched output pulse results (H).
3
Simultaneously, the A1 sample-hold amplifier is placed in
the sample mode. When the pulse ends, A1’s output is at a
DC level equal to the amplitude of the output pulse. This
level is compared to the amplitude set DC reference by A2,
whose output drives Q1. Q1’s emitter provides the DC supply level to the Q2-Q3 switch. This servo action forces the
amplitude of the output pulse to be the same as the DC
potential at the amplitude set potentiometer wiper, regardless of Q3 switch losses or loading. In Figure 6, Trace A is
the circuit output. Traces B and C detail the rising and falling
edges of the output (note horizontal sweep time change for
B and C) with clean 50 ns transitions into the 20X load.
Controlled Amplitude Pulser
Figure 5 depicts a circuit which converts an input pulse train
into an amplitude stabilized pulse output which will drive a
20X load. The output pulse amplitude is adjustable from 0V
to 10V and is stable over time, temperature and load changes. This circuit function is useful in automatic test equipment
and general laboratory applications.
The circuit works by storing the sampled amplitude of the
output pulse as a DC level, and supplying this information to
a feedback loop which controls the voltage applied to the
output switch. Each time a pulse is applied at the circuit input, the Q2-Q3 combination turns on and drives the load.
TL/H/5627 – 5
FIGURE 5. Pulse amplitude control results when this circuit samples an output pulse’s amplitude and compares it with a
preset reference level. When the output exceeds this reference, A2 readjusts switching transistor Q3’s supply voltage
to the correct level.
TRACE VERTICAL HORIZONTAL
A
B
C
10V/DIV
10V/DIV
10V/DIV
1 mSEC/DIV
100 nSEC/DIV
100 nSEC/DIV
TL/H/5627 – 6
FIGURE 6. A 10V, 0.5A pulse (A) is amplitude stabilized by the S-H technique depicted in Figure 5. Note the clean 50 ns
rise (B) and fall (C) times.
4
Isolated Input Signal Conditioning Amplifier
Figure 7 is a logical and very powerful extension of the controlled amplitude pulser shown in Figure 5. This circuit permits measurement of a small amplitude signal, e.g., thermocouples, in the presence of common-mode noise or voltages as high as 500V. This is a common requirement in
industrial control systems. Despite the fact that the input
terminals are fully galvanically isolated from the output, a
transfer accuracy of 0.1% may be expected. With the optional low-level pre-amplifier shown, inputs as low as 10 mV
full-scale may be measured.
The circuit works by converting the input signal into a pulse
train whose amplitude is linearly dependent on the input
signal value. This pulse train drives a transformer which provides total galvanic isolation of the input circuitry from
ground. The transformer output is then demodulated back
to a DC level to provide the circuit’s system ground referenced output. The amplitude of the pulse train which drives
the transformer is controlled by a loop very similar to the
one described in Figure 5. The amplitude set potentiometer
has been deleted, and the servo amplifier’s ‘‘ a ’’ input becomes the circuit input. A1, a low drift X1000 amplifier, may
be employed for boosting low-level inputs. The pulse train is
supplied by A2, which is set up as an oscillator (A2 output
shown in Figure 8, Trace A). The feedback to the pulse
amplitude stabilizing loop is taken from an isolated
TL/H/5627 – 7
FIGURE 7. Obtain input signal isolation using this circuit’s dual S-H scheme. Analog input signals amplitude modulate a
pulse train using a technique similar to that employed in Figure 5 ’s design. This modulated data is transformer coupled,
and thereby isolated, to a DC filter stage, where it is resampled and reconstructed.
TRACE VERTICAL HORIZONTAL
A
B
C
D
E
50V/DIV
1V/DIV
50V/DIV
10V/DIV
5V/DIV
100 mSEC/DIV
100 mSEC/DIV
100 mSEC/DIV
100 mSEC/DIV
100 mSEC/DIV
TL/H/5627 – 8
FIGURE 8. Figure 7’s in-circuit oscillator (A2) generates both the sampling pulse (A) and the switching transistor’s
drive. Modulated by the analog input signal, Q2’s (and therefore T1’s) output (B) is demodulated by S-H amplifier A7.
A5’s output (C) and A6’s input (D) and output (E) provide a delayed sample command.
5
hold amplifier) and Trace D is A7’s output. Trace E shows
the filter’s output at A8.
secondary of the transformer, which insures high accuracy
amplitude information transfer. The amplitude coded information at the transformer’s secondary (Figure 8, Trace B) is
demodulated back to a DC level by sample-hold amplifier,
A7. A5 (output, Figure 8, Trace C) and A6 (‘‘ a ’’ input, Figure 8, Trace D; output, Figure 8, Trace E) provide a delayed
sample command to A7, ensuring accurate acquisition of
the transformer’s output pulse amplitude. A8 provides gain
trimming and filtering capability.
Precision, High Efficiency Temperature Controller
The sample-hold amplifier in Figure 10 is used to provide
very high stability in an oven temperature control circuit. In
this circuit, the output signal of the pulse driven thermistorbridge is ten times greater than the usual DC driven bridge.
In thermistor-bridges, power dissipation in the resistors and
thermistor is the limiting factor in how much DC bridge drive
may be used. However, if the bridge drive is applied in the
form of high voltage pulses at very low duty cycle, average
power dissipation will be low and a high bridge output signal
will result.
Figure 9 provides very graphic evidence of the circuit at
work. Here, a DC biased sine wave (Figure 9, Trace A) is fed
into the circuit input. Trace B is the clock from A2’s output.
Trace C is the transformer secondary (input of A7 sample-
TRACE VERTICAL HORIZONTAL
A
B
C
D
E
5V/DIV 100 mSEC/DIV
100V/DIV
5V/DIV
5V/DIV
5V/DIV
TL/H/5627 – 9
FIGURE 9. Completely input-to-output isolated, Figure 7’s circuit’s analog input signal (A) is sampled by a clock pulse
(B) and converted to a pulse amplitude modulated format (C). After filtering and resampling, the reconstructed signal
(D) is available smoothed (E).
TL/H/5627 – 10
FIGURE 10. Tight temperature control results when high voltage pulses synchronously drive a thermistor-bridgeÐa
trick that increases signal levelÐand are then sampled and used to control a pulse width modulated heater driver.
6
In Figure 10, this operation is implemented by having the A1
oscillator drive Q1 to energize a common 24V transformer
used ‘‘backwards’’. The transformer’s floated output is a
100V pulse which is applied directly across the thermistorbridge. With one side of the bridge output grounded, the
bridge drive with respect to ground appears as complementary 50V pulses (Figure 11, Traces A and B). A2 provides
amplification of the bridge’s pulsed output (Figure 11, Trace
C). A3, a sample-hold amplifier, samples the middle of A2’s
output pulses and has a DC output equal to the amplitude of
these pulses. Proper timing for A3’s sample command (Figure 11, Trace D) is provided by the A4-A5 pair and their
associated RC networks. The DC output of A3 is low-pass
filtered and fed to A6, which combines with A7 to form a
simple pulse width modulator. The output of A7 is a ramp
(Figure 11, Trace FÐnote horizontal scale change) which is
periodically reset by A5’s output (Figure 11, Trace E). This
ramp is compared at A6 to A3’s output, and the resultant
pulse at A6’s output (Figure 11, Trace G) is used to drive the
Q2 heater control switch. In this fashion, the ON time of the
pulse applied to the heater will be proportional to the
sensed offset at the thermistor-bridge. Thermal feedback
from the heater to the thermistor completes a loop around
the circuit. The 5 MX potentiometer is used to adjust the
time constant of this loop, and the 2.5k potentiometer at A2
sets the gain.
In operation, with the thermistor and heater tightly coupled,
the time constant of the loop is adjusted by applying small
step changes in the temperature setpoint. This is done by
alternately opening and closing a switch across a 100X resistor in series with one of the bridge resistors. For the
thermistor shown, this represents a 0.02§ C step. The response of the loop to these steps can be monitored at A3’s
output. With the loop time constant and gain properly adjusted, A3’s output will settle in a minimum amount of time in
response to the steps. Figure 12 shows settling for both
‘‘ a ’’ and ‘‘b’’ steps, with settling inside 2 seconds for either polarity step.
TRACE VERTICAL HORIZONTAL
A
B
C
D
E
F
G
100V/DIV
100V/DIV
5V/DIV
10V/DIV
5V/DIV
10V/DIV
50V/DIV
200 mSEC/DIV
200 mSEC/DIV
200 mSEC/DIV
200 mSEC/DIV
1 mSEC/DIV
1 mSEC/DIV
1 mSEC/DIV
TL/H/5627 – 11
FIGURE 11. Driving a thermistor-bridge with complementary high voltage pulses (A and B) permits high gain amplification without drift problems (C). Driven by a delayed sample command (D), a S-H amplifier converts the bridge’s error
signal to a DC level (E) that controls a pulse width modulated heater driver (F and G).
TL/H/5627 – 12
FIGURE 12. Tight heater to thermistor coupling and careful calibration can provide rapid temperature restabilization. Here the controlled oven recovers within 2 seconds
after g 0.002§ C steps.
7
Circuit Applications of Sample-Hold Amplifiers
Once adjusted, and driving a well insulated and designed
oven, the circuit’s control stability can be monitored. The
high output signal levels from the bridge, in combination
with the gain provided by A2, yield extremely good performance.
Sample-Hold Amplifier Terms
Acquisition Time: The time required to acquire a new analog input voltage with an output step of 10V. Note that acquisition time is not just the time required for the output to
settle, but also includes the time required for all internal
nodes to settle so that the output assumes the proper value
when switched to the hold mode.
Aperture Time: The delay required between hold command
and an input analog transition, so that the transition does
not affect the held output.
Dynamic Sampling Error: The error introduced into the
held output due to a changing analog input at the time the
hold command is given. Error is expressed in mV with a
given hold capacitor value and input slew rate. Note that
this error term occurs even for long sample times.
Gain Error: The ratio of output voltage swing to input voltage swing in the sample mode expressed as a percent difference.
Hold Settling Time: The time required for the output to
settle within 1 mV of final value after the hold logic command.
Hold Step: The voltage step at the output of the samplehold when switching from sample mode to hold mode with a
steady (DC) analog input voltage. Logic swing is specified,
usually 5V.
TL/H/5627 – 13
FIGURE 13. Typical Sample-Hold IC Amplifier
LIFE SUPPORT POLICY
NATIONAL’S PRODUCTS ARE NOT AUTHORIZED FOR USE AS CRITICAL COMPONENTS IN LIFE SUPPORT
DEVICES OR SYSTEMS WITHOUT THE EXPRESS WRITTEN APPROVAL OF THE PRESIDENT OF NATIONAL
SEMICONDUCTOR CORPORATION. As used herein:
AN-266
1. Life support devices or systems are devices or
systems which, (a) are intended for surgical implant
into the body, or (b) support or sustain life, and whose
failure to perform, when properly used in accordance
with instructions for use provided in the labeling, can
be reasonably expected to result in a significant injury
to the user.
National Semiconductor
Corporation
1111 West Bardin Road
Arlington, TX 76017
Tel: 1(800) 272-9959
Fax: 1(800) 737-7018
2. A critical component is any component of a life
support device or system whose failure to perform can
be reasonably expected to cause the failure of the life
support device or system, or to affect its safety or
effectiveness.
National Semiconductor
Europe
Fax: (a49) 0-180-530 85 86
Email: cnjwge @ tevm2.nsc.com
Deutsch Tel: (a49) 0-180-530 85 85
English Tel: (a49) 0-180-532 78 32
Fran3ais Tel: (a49) 0-180-532 93 58
Italiano Tel: (a49) 0-180-534 16 80
National Semiconductor
Hong Kong Ltd.
13th Floor, Straight Block,
Ocean Centre, 5 Canton Rd.
Tsimshatsui, Kowloon
Hong Kong
Tel: (852) 2737-1600
Fax: (852) 2736-9960
National Semiconductor
Japan Ltd.
Tel: 81-043-299-2309
Fax: 81-043-299-2408
National does not assume any responsibility for use of any circuitry described, no circuit patent licenses are implied and National reserves the right at any time without notice to change said circuitry and specifications.


© Copyright 2026