
Chapter 2 Quantitative, Qualitative, and Mixed Research LEARNING OBJECTIVES
Chapter 2 Quantitative, Qualitative, and Mixed Research LEARNING OBJECTIVES To be able to Describe the characteristics of quantitative research. List and explain the different types of variables used in quantitative research. Explain the difference between experimental and nonexperimental quantitative research. Explain the concept of a correlation coefficient. Describe the characteristics of qualitative research. List and explain the differences among the different types of qualitative research introduced in this chapter. Describe the characteristics of mixed research. Explain when each of the three major research paradigms (quantitative, qualitative, and mixed) would be appropriate to use. 29 Visit the study site for an interactive concept map. RESEARCH IN REAL LIFE Paradigms and Perspectives This chapter is about the three major research paradigms in educational research. Each of these paradigms tends to bring a slightly different view or perspective to what we study. It seems appropriate to start this chapter with an age-old poem (written by the Persian poet/philosopher Rumi) that tells us that different perspectives can all have truth value and that, when we put those perspectives together, we can come away with a fuller picture of what we are studying. We use the poem to support our view of the importance of using all three major research paradigms in educational research. Elephant in the Dark Some Hindus have an elephant to show. No one here has ever seen an elephant. They bring it at night to a dark room. One by one, we go in the dark and come out saying how we experience the animal. One of us happens to touch the trunk. “A water-pipe kind of creature.” Another, the ear. “A very strong, always moving back and forth, fan-animal.” Another, the leg. “I find it still, like a column on a temple.” Another touches the curved back. “A leathery throne.” Another, the cleverest, feels the tusk. “A rounded sword made of porcelain.” He’s proud of his description. Each of us touches one place and understands the whole in that way. The palm and the fingers feeling in the dark are how the senses explore the reality of the elephant. If each of us held a candle there, and if we went in together, we could see it. Source: From Jelaluddin Rumi, The Essential Rumi, trans. & ed. by Coleman Barks, 1995, San Francisco CA: Castle Books, 1995. p. 252. Coleman Barks. 30 C h a p t e r 2 : Q u a n t i t a t i ve , Q u a l i t a t i ve , a n d M i xe d R e s e a r c h A research paradigm is a perspective about research held by a community of researchers that is based on a set of shared assumptions, concepts, values, and practices. More simply,it is an approach to thinking about and doing research.In this chapter we introduce you to the three major educational research paradigms or approaches: quantitative research, qualitative research, and mixed research. Mixed research also is commonly called mixed methods research, but we use the simpler term mixed research. Not only is the label mixed research simpler than the label mixed methods research,but it also is more accurate because the quantitative, qualitative, and mixed research debates are about much more than just methods. Quantitative research was the generally accepted research paradigm in educational research until the early 1980s, when the “paradigm wars” between advocates of quantitative and qualitative research reached a new peak (Guba,1990; Tashakkori & Teddlie,1998).During the 1980s,many quantitative and qualitative researchers argued that their approach was superior.Some of these researchers were “purists,” in the sense that they argued that the two approaches could not be used together because of differences in the worldviews or philosophies associated with the two approaches. This either-or position (i.e.,one must use quantitative or qualitative research but not both) is called the incompatibility thesis. The problem with the incompatibility thesis is its failure to recognize that creative and thoughtful mixing of assumptions, ideas, and methods can be very helpful and offers a third paradigm.The mixing of ideas and approaches has been present throughout history because mixing or combining builds upon what we know and offers new ways to understand and study our world. In short, in addition to quantitative and quantitative research, mixed research offers an exciting way of conducting educational research. Exhibit 2.1 shows one of the leading figures in the paradigm dialogue that had become a worldwide phenomenon by the 1990s and continues to play an important part in educational research today. 31 Research paradigm A perspective held by a community of researchers that is based on a set of shared assumptions, concepts, values, and practices Incompatibility thesis The proposition that one cannot mix quantitative and qualitative research EXHIBIT 2.1 Egon G. Guba (1924–2008) During the 1970s, 1980s, and early 1990s, Egon Guba helped initiate the “paradigm dialogue” between quantitative research and the “new” research paradigm of qualitative research. Guba emphasized that research paradigms are characterized by their distinctive ontology—“What is the nature of the knowable? Or what is the nature of reality?”; epistemology—“What is the relationship between the knower (the inquirer) and the known (or knowable)?” or What is the paradigm’s theory of knowledge; and methodology—“How should the inquirer go about finding out knowledge?” or, more specifically, What methods should be used in research? (quotes are from Guba, 1990). Later, two more dimensions of paradigms were added: axiology—What is the role of values in the inquiry process? and rhetoric—What kind of language and communication should be used in research? The differences between quantitative, qualitative, and mixed research on these and additional dimensions are found in Table 2.1 and in the section “Characteristics of the Three Research Paradigms.” Guba was author of many important books, chapters, and articles on qualitative research and evaluation (e.g., Guba; Guba & Lincoln, 1989, 1992; Lincoln & Guba, 1985). (Continued) 32 PA R T I : I N T R O D U C T I O N (Continued) Exhibit definitions: • • • • • Ontology—the branch of philosophy dealing with the nature of reality and truth Epistemology—the branch of philosophy dealing with knowledge and its justification Methodology—the identification, study, and justification of research methods Axiology—the branch of philosophy dealing with values and ethics Rhetoric—the art or science of language and oral and written communication Pragmatism Philosophical position that what works is what is important or “valid” FIGURE 2.1 Starting in the 1990s, many researchers rejected the incompatibility thesis and started advocating the pragmatic position that says that both quantitative and qualitative research are very important and often should be thoughtfully mixed in single research studies. According to pragmatism, what is ultimately important is what works in practice and what promotes social justice. Pragmatism is focused on the ends that we desire. According to pragmatism, your research design should be planned and conducted based on what will best help you answer your research questions; the result is pragmatic knowledge. Pragmatism says that theories or programs or actions that are demonstrated to work for particular groups of people are the ones that we should view as currently being the most valid for those people. We specifically call our version of pragmatism “dialectical pragmatism” because a philosophy for mixed research should carefully listen to ideas, assumptions, and approaches found in qualitative and quantitative research and in any other relevant domain (e.g., perspectives found in different academic disciplines, viewpoints of different stakeholder and social groups). The word dialectical is intended to imply a dynamic back-and-forth listening to multiple perspectives. Although mixed research is still the “new kid on the block,” the list of researchers identifying with this approach is increasing rapidly. You can see in Figure 2.1 that the three major research approaches can be viewed as falling on a research continuum with qualitative research on the left side, quantitative research on the right side, and mixed research in the center of the continuum.In other words, research can be fully qualitative or mixed with an emphasis on qualitative, fully quantitative or mixed with an emphasis on quantitative, or mixed with an equal emphasis on qualitative and quantitative. A particular research study would fall at a particular point on the continuum. We now compare the characteristics or tenets of the three research paradigms in their pure forms. Later in the chapter, we introduce you to some ideas and terminology associated with each of the research paradigms. The research continuum Qualitative Research Mixed Research Quantitative Research C h a p t e r 2 : Q u a n t i t a t i ve , Q u a l i t a t i ve , a n d M i xe d R e s e a r c h 33 CHARACTERISTICS OF THE THREE RESEARCH PARADIGMS Pure quantitative research relies on the collection of quantitative data (i.e., numerical data) and follows the other characteristics of the quantitative research paradigm shown in Table 2.1. Pure qualitative research relies on the collection of qualitative data (i.e., nonnumerical data such as words and pictures) and follows the other characteristics of the qualitative research paradigm shown in Table 2.1. Mixed research involves the mixing of quantitative and qualitative research methods, approaches, or other paradigm characteristics. The exact mixture that is considered appropriate will depend on the research questions and the situational and practical issues facing a researcher. All three research paradigms are important as we attempt to solve the manifold and complex problems facing us in the field of education. Take a moment now to examine Table 2.1 and then read the following discussion of the key differences among the three approaches. First, the quantitative research approach primarily follows the confirmatory scientific method (discussed in Chapter 1) because its focus is on hypothesis testing and theory testing. Quantitative researchers consider it to be of primary importance to state one’s hypotheses and then test those hypotheses with empirical data to see if they are supported. On the other hand, qualitative research primarily follows the exploratory scientific method (also discussed in Chapter 1). Qualitative research is used to describe what is seen locally and sometimes to come up with or generate new hypotheses and theories. Qualitative research is used when little is known about a topic or phenomenon and when one wants to discover or learn more about it. It is commonly used to understand people’s experiences and to express their perspectives. Researchers advocating mixed research argue that that it is important to use both the exploratory and the confirmatory methods in one’s research (Johnson & Onwuegbuzie, 2004). Most researchers use inductive and deductive reasoning when they conduct research. For example, they use inductive reasoning when they search for patterns in their particular data, when they make generalizations (e.g., from samples to populations), and when they make inferences as to the best explanation. Ultimately, the logic of confirmation is inductive because we do not get conclusive proof from empirical research (see principle of evidence in Chapter 1). Researchers use deductive reasoning when they deduce from their hypotheses the observable consequences that should occur with new empirical data if their hypotheses are true. Researchers also use deductive reasoning if they conclude that a theory is false. If they draw this conclusion, they will then move on to generate and test new ideas and new theories. Quantitative and qualitative research are also distinguished by different views of human behavior. In quantitative research, it is assumed that cognition and behavior are highly predictable and explainable. Traditionally, the assumption of determinism, which means that all events are fully determined by one or more causes, was made in quantitative research (Salmon, 2007). For example, the process by which children learn to read is determined by one or more causes.Because quantitative research has not identified any universal or unerring laws of human behavior, most contemporary quantitative researchers search for probabilistic causes (Humphreys, 1989). A probabilistic statement might go like this: “Adolescents who become involved with drugs and alcohol are more likely to drop out of high school than are adolescents who do not become involved with drugs and alcohol.” The point is that most quantitative researchers try to identify cause-and-effect relationships that enable them to make probabilistic predictions and generalizations. Quantitative research Research that relies primarily on the collection of quantitative data Qualitative research Research that relies primarily on the collection of qualitative data Mixed research Research that involves the mixing of quantitative and qualitative methods or other paradigm characteristics Determinism All events have causes. Probabilistic causes Causes that usually produce an outcome 34 PA R T I : I N T R O D U C T I O N TABLE 2.1 Emphases of Quantitative, Mixed, and Qualitative Research Scientific method Quantitative Research Mixed Research Qualitative Research Confirmatory or “top-down” The researcher tests hypotheses and theory with data. Confirmatory and exploratory Exploratory or “bottom-up” The researcher generates or constructs knowledge, hypotheses, and grounded theory from data collected during fieldwork. Ontology (i.e., nature of Objective, material, reality/truth) structural, agreed-upon Pluralism; appreciation of objective, subjective, Subjective, mental, personal, and and intersubjective reality and their constructed interrelations Epistemology (i.e., theory of knowledge) Dialectical pragmatism; pragmatic justification (what works for whom in specific contexts); mixture of universal (e.g., always be ethical) and community-specific needs-based standards Relativism; individual and group justification; varying standards View of human thought Regular and predictable and behavior Dynamic, complex, and partially predictable Multiple influences include environment/nurture, biology/nature, freewill/agency, and chance/fortuity. Situational, social, contextual, personal, and unpredictable Most common research objectives Quantitative/numerical description, causal explanation, and prediction Multiple objectives; provide complex and fuller Qualitative/subjective description, explanation and understanding; understand empathetic understanding, and multiple perspectives exploration Interest Identify general scientific laws; inform national policy. Connect theory and practice; understand multiple causation, nomothetic (i.e., general) causation, and idiographic (i.e., particular, individual) causation; connect national and local interests and policy. Understand and appreciate particular groups and individuals; inform local policy. “Focus” Narrow-angle lens, testing specific hypotheses Multilens focus Wide-angle and “deep-angle” lens, examining the breadth and depth of phenomena to learn more about them Nature of observation Study behavior under controlled conditions; isolate the causal effect of single variables. Study multiple contexts, perspectives, or conditions; study multiple factors as they operate together. Study groups and individuals in natural settings; attempt to understand insiders’ views, meanings, and perspectives. Form of data collected Collect quantitative data based on precise measurement using structured and validated data-collection instruments. Collect multiple kinds of data. Collect qualitative data such as indepth interviews, participant observation, field notes, and openended questions. The researcher is the primary data-collection instrument. Nature of data Variables Mixture of variables, words, categories, and images Words, images, categories Data analysis Identify statistical relationships among variables. Quantitative and qualitative analysis used separately and in combination. Use descriptive data; search for patterns, themes, and holistic features; and appreciate difference/variation. Scientific realism; search for Truth; justification by empirical confirmation of hypotheses; universal scientific standards C h a p t e r 2 : Q u a n t i t a t i ve , Q u a l i t a t i ve , a n d M i xe d R e s e a r c h 35 Results Generalizable findings providing representation of objective outsider viewpoint of populations Provision of “subjective insider” and “objective outsider” viewpoints; presentation and integration of multiple dimensions and perspectives Particularistic findings; provision of insider viewpoints Form of final report Formal statistical report (e.g., with correlations, comparisons of means, and reporting of statistical significance of findings) Mixture of numbers and narrative Informal narrative report with contextual description and direct quotations from research participants On the other hand, qualitative researchers often view human behavior as being fluid, dynamic, and changing over time and place, and they usually are not interested in generalizing beyond the particular people who are studied. In qualitative research, different groups are said to construct their different realities or perspectives, and these social constructions, reciprocally, influence how they “see” or understand their worlds, what they see as normal and abnormal, and how they should act. Mixed researchers see positive value in both the quantitative and the qualitative views of human behavior. They view the use of only quantitative research or only qualitative research as limiting and incomplete for many research problems. As can be seen by examining the middle column in Table 2.1, mixed researchers use a combination of quantitative and qualitative concepts and approaches to understand the world more fully. Quantitative research often uses what might be called a “narrow-angle lens” because the focus is on only one or a few causal factors at the same time. Quantitative researchers attempt to hold constant the factors that are not being studied. This is often accomplished under laboratory conditions in which an experimenter randomly assigns participants to groups, manipulates only one factor, and then examines the outcome. For example, a researcher might first randomly assign research volunteers to two groups. Random assignment makes the two groups very similar. Then the researcher might expose one group to a new teaching method and another group to a different teaching method, treating the two groups similarly during the study except for the research-manipulated difference in teaching method. The researcher then examines which group learns the most and attributes the difference in learning to the teaching method received. The researcher is able to make a causal attribution because the two groups were similar at the start of the experiment and the only factor they differed on was which teaching method they received. Qualitative research uses a wide- and deep-angle lens, examining human choice and behavior as it occurs naturally in all of its detail. Qualitative researchers do not want to intervene in the natural flow of behavior. Qualitative researchers study behavior naturalistically and holistically. They try to understand multiple dimensions and layers of reality, such as the types of people in a group, how they think, how they interact, what kinds of agreements or norms are present, and how these dimensions come together holistically to describe the group. For example, perhaps a qualitative researcher wants to study the social climate and culture of a highly successful school. The researcher would spend a great deal of time studying the many aspects of the school to come up with an analysis of how the school operates and for whom and why it is successful. Depending on the research questions, a researcher using the mixed approach would 36 PA R T I : I N T R O D U C T I O N Linguisticrelativity hypothesis The idea that people see and understand the world through the lens of their local language. People’s thoughts are bound by their language. Verstehen Method of empathetic understanding of others’ viewpoints, meanings, intentions, and cultural beliefs spend part of his or her time in each of the different focus modes, moving back and forth between wide-angle, narrow-angle, and deep-angle viewpoints. Quantitative researchers attempt to operate under the assumption of objectivity. They assume that there is a reality to be observed and that rational observers who look at the same phenomenon will basically agree on its existence and its characteristics. They try to remain as neutral or value-free as they can, and they attempt to avoid human bias whenever possible. In a sense, quantitative researchers attempt to study the phenomena that are of interest to them “from a distance.” For example, standardized questionnaires and other quantitative measuring tools are often used to measure carefully what is observed. In experiments, researchers frequently use random assignment to place participants into different groups to eliminate the possibility of human bias while constructing the comparison groups. In judging results, statistical criteria are used to form many conclusions. Qualitative researchers generally contend that “reality is socially constructed” (e.g., Guba & Lincoln, 1989). For example, social behavior follows socially constructed norms. Language also has an important influence on our views of the world. For example, it has been suggested that the Inuit“see” many types of snow, whereas the average American probably only sees a few types. Inuits’ local languages might allow them to see distinctions that you do not notice; this idea is known as the linguistic-relativity hypothesis. Qualitative researchers argue that it is important to “get close” to their objects of study through participant observation so that they can experience for themselves the subjective dimensions of the phenomena they study. In qualitative research, the researcher is said to be the “instrument of data collection.” Rather than using a standardized instrument or measuring device, the qualitative researcher asks the questions, collects the data, makes interpretations, and records what is observed. The qualitative researcher constantly tries to understand the people he or she is observing from the participants’ or “natives’” or “actors’” viewpoints. This is the concept of “empathetic understanding.” The famous sociologist Max Weber, writing in the early 20th century, called this idea of understanding something from the other person’s viewpoint verstehen (Weber, 1968). This is expressed in an American idiom as “putting yourself into someone else’s shoes.” It is important to remember that qualitative research is focused on understanding the “insider’s perspective” of people and their cultures and this requires direct personal and often participatory contact. According to mixed research, it is important to understand both the subjective (individual), intersubjective (language-based, discursive, cultural), and objective (material and causal) realities in our world. Although it is important not to influence or bias what you are observing, it also is important to understand the insiders’ meanings and viewpoints. For example, if you were studying the culture of the snake-handling churches in the area where Alabama, Tennessee, and Georgia come together, it might be helpful to collect quantitative data by having the church members fill out standardized instruments measuring their personality and demographic characteristics. It would also be essential to collect qualitative data through in-depth personal interviews and close observations of the members to gain a better understanding (from the insiders’ perspectives) of the snake-handling culture. In short, the mixing of methods would add very useful and complementary information. Quantitative research generally reduces measurement to numbers. In survey research, for example, attitudes are usually measured by using rating scales. The following 5-point agreement scale is an example: C h a p t e r 2 : Q u a n t i t a t i ve , Q u a l i t a t i ve , a n d M i xe d R e s e a r c h Strongly Disagree 1 Disagree 2 Neutral 3 Agree 4 37 Strongly Agree 5 The interviewer or questionnaire provides a statement, and the respondents reply with one of the five allowable response categories. After all respondents have provided their answers, the researcher typically calculates and reports an average for the group of respondents. Let us say, for example, that a researcher asks a group of teachers for their degree of agreement with the following statement: “Teachers need more training in the area of child psychopathology.” The researcher might then calculate the average response for the whole group, which might be 4.15 based on a 5-point scale. The researcher might also determine whether the ratings vary by years of teaching experience. Perhaps the average agreement for new teachers is 4.5, and the average for teachers with 5 or more years of experience is 3.9. As you might guess, quantitative data are usually analyzed by using statistical analysis programs on a computer. On the other hand, qualitative researchers do not usually collect data in the form of numbers. Rather, they conduct observations and in-depth interviews, and the data are usually in the form of words. For example, a qualitative researcher might conduct a focus group discussion with six or seven new teachers to discuss the adequacy of their undergraduate educational programs in preparing them to deal with real-world problems that they face in schools. The facilitator of the focus group would probably videotape the group and tape-record what was said. Later, the recording would be transcribed into words, which would then be analyzed by using the techniques of qualitative data analysis (see Chapter 19). Also, when a qualitative researcher enters the field and makes observations, the researcher will write down what he or she sees, as well as relevant insights and thoughts. The data are again in the form of words. During qualitative data analysis, the researcher will try to identify categories that describe what happened, as well as general themes appearing again and again in the data. The mixed research approach would use a variety of data collection and analysis approaches. Finally, qualitative, mixed, and quantitative research reports tend to differ. Quantitative reports are commonly reported in journal articles ranging from 5 to 15 pages. The reports include many numbers and results of statistical significance testing (to be explained later). In contrast, qualitative research reports are generally longer, and they are written in narrative form, describing what was found, especially from the insider perspectives of the people in the group being studied. This report is more interpretative, as the researcher attempts to understand and portray the lives and experiences and language of the research participants. Qualitative journal articles are frequently 20–25 pages long, and the results of qualitative research are often published in the form of books or monographs rather than journal articles. Mixed research might follow the quantitative style or the qualitative style or, more frequently, might use a mixture of the styles. 2.1 What are the key features of quantitative and qualitative research? REVIEW 2.2 What are the key features of mixed methods research? QUESTIONS 38 PA R T I : I N T R O D U C T I O N QUANTITATIVE RESEARCH METHODS: EXPERIMENTAL AND NONEXPERIMENTAL RESEARCH Quantitative research Research that relies primarily on the collection of quantitative data Variable A condition or characteristic that can take on different values or categories Constant A single value or category of a variable You now know some of the characteristics of quantitative, qualitative, and mixed research. We next introduce some of the different methods of quantitative research. Before we do that, however, you need to know about variables, because quantitative researchers usually describe the world by using variables and they attempt to explain and predict aspects of the world by demonstrating the relationships among variables. You can see a summary of the types of variables in Table 2.2. Variables A variable is a condition or characteristic that can take on different values or categories. A much-studied educational variable is intelligence, which varies from low to high for different people. Age is another variable that varies from low to high (e.g., from 1 minute old to 130 years old or so). Another variable is gender, which is either male or female. To better understand the concept of a variable, it is helpful to compare it with a constant, its opposite. A constant is a single value or category of a variable. Here’s the idea: The variable gender is a marker for two constants: male and female. The category (i.e., constant) male is a marker for only one thing; TABLE 2.2 Common Types of Variables Classified by Level of Measurement and by Role of Variable Variable Type Key Characteristic Example Categorical variable A variable that is made up of different types or categories of a phenomenon The variable gender is made up of the categories of male and female. Quantitative variable A variable that varies in degree or amount of a phenomenon The variable annual income varies from zero income to a very high income level. Independent variable (symbolized as IV) A variable that is presumed to cause changes to occur in another variable; a causal variable Amount of studying (IV) affects test grades (DV). Dependent variable (symbolized as DV) A variable that changes because of another variable; the effect or outcome variable Amount of studying (IV) affects test grades (DV). Mediating variable (also called an intervening variable) A variable that comes in between other variables, helping to delineate the process through which variables affect one another Amount of studying (IV) leads to input and organization of knowledge in long-term memory (mediating variable), which affects test grades (DV). Moderator variable A variable that delineates how a relationship of interest changes under different conditions or circumstances Perhaps the relationship between studying (IV) and test grades (DV) changes according to the different levels of use of a drug such as Ritalin (moderator). Extraneous variable A variable that may compete with the independent variable in explaining an outcome Perhaps an observed relationship between coffee drinking (IV) and cancer (DV) is actually due to smoking cigarettes Level of Measurement Role Taken by the Variable C h a p t e r 2 : Q u a n t i t a t i ve , Q u a l i t a t i ve , a n d M i xe d R e s e a r c h it is one of the two constants forming the variable called gender. Gender varies, but male does not vary. Therefore, gender is a variable, and male is a constant. In the case of the variable age, all of the ages make up the values (i.e., constants) of the variable, and each value (e.g., 13 years old) is a constant. If you are still having a hard time with the distinction between a variable and a constant, think of it like this: A variable is like a set of things, and a constant is one of those things. The variables that we just used, age and gender, are actually different types of variables. Age is a quantitative variable, and gender is a categorical variable. A quantitative variable is a variable that varies in degree or amount. It usually involves numbers. A categorical variable is a variable that varies in type or kind. It usually involves different groups. Age takes on numbers (e.g., number of years old), and gender takes on two types or kinds (male and female). Now consider the variable annual income. How does it vary? It varies in amount, ranging from no income at all to some very large amount of income. Therefore, income is a quantitative variable. If you think about how much money you made last year, you can determine your value on the variable annual income. Now think about the variable religion. How does this variable vary? It varies in kind or type. For instance, it can take on any of the categories standing for the different world religions (e.g., Christianity, Judaism, Islam). For practice identifying quantitative and categorical variables, take a look at the examples in Table 2.3. TABLE 2.3 Examples of Quantitative and Categorical Variables Quantitative Variables Categorical Variables Height Gender Weight Religion Temperature Ethnicity Annual income Method of therapy Most aptitude tests College major Most achievement tests Political party identification School size Type of school Class size Marital status of parents Self-esteem level Student retention (retained or not) Grade point average Type of teacher expectation Teacher-pupil ratio Native language Time spent on homework Teaching method Age Personality type Anxiety level Learning style Job satisfaction score Type of feedback Number of behavioral outbursts Computer use (or not) Reading performance Type of reading instruction Spelling accuracy Inclusion (or not) Number of performance errors Problem-solving strategy used Rate of cognitive processing Memory strategy used Dropout rate Social class 39 See Journal Article 2.1 on the study site. Quantitative variable Variable that varies in degree or amount Categorical variable Variable that varies by type or kind 40 PA R T I : I N T R O D U C T I O N Independent variable A variable that is presumed to cause a change in another variable Dependent variable A variable that is presumed to be influenced by one or more independent variables Cause-and-effect relationship Relationship in which one variable affects another variable Intervening or mediating variable A variable that occurs between two other variables in a causal chain; it’s a mediating variable. Moderator variable A variable that changes the relationship between other variables Yet another categorization scheme for variables is to speak of independent and dependent variables. An independent variable is a variable that is presumed to cause a change to occur in another variable. Sometimes the independent variable is manipulated by the researcher (i.e., the researcher determines the value of the independent variable); at other times, the independent variable is studied by the researcher but is not directly manipulated (i.e., the researcher studies what happens when an independent variable changes naturally). The independent variable is an antecedent variable because it must come before another variable if it is to produce a change in it. A dependent variable is the variable that is presumed to be influenced by one or more independent variables. The dependent variable is the variable that is “dependent on” the independent (i.e., antecedent) variable(s). A cause-and-effect relationship between an independent variable and a dependent variable is present when changes in the independent variable tend to cause changes in the dependent variable. Sometimes researchers call the dependent variable an outcome variable or a response variable because it is used to measure the effect of one or more independent variables. Here is a simple example of a cause-and-effect relationship. Think about the U.S. Surgeon General’s warning printed on cigarette packages: “Smoking Causes Lung Cancer, Heart Disease, Emphysema, and May Complicate Pregnancy.” Can you identify the independent and dependent variables in this relationship? It is smoking that is presumed to cause lung cancer and several other diseases. (You should be aware that extensive research beyond simply observing that smoking and lung cancer were associated was conducted to establish that the link between smoking and cancer was causal.) In this example, smoking is the independent variable (the values corresponding to the number of cigarettes smoked a day), and presence of lung cancer is the dependent variable (the values being lung cancer present and lung cancer not present). For shorthand, we could use IV to stand for independent variable and DV to stand for dependent variable. We also sometimes use an arrow: IV DV. The arrow means “tends to cause changes in” or “affects.” In words, this says that the researcher believes “changes in the independent variable tend to cause changes in the dependent variable.” In the smoking example, we write Smoking Onset of Lung Cancer. Another type of variable is an intervening variable (also commonly called a mediating or mediator variable). An intervening or mediating variable occurs between two other variables in a causal chain (Kenny, Kashy, & Bolger, 1998). In the case X Y, we have only an independent variable and a dependent variable. In the case X I Y, we have an intervening variable (I) occurring between the two other variables. In the case of smoking, perhaps an intervening variable is the development of damaged lung cells. In other words, smoking tends to lead to the development of damaged lung cells, which tends to lead to lung cancer. It is helpful to identify intervening variables because these variables may help explain the process by which an independent variable leads to changes in a dependent variable. As another example, let X stand for teaching approach (perhaps the levels of this variable are lecture method and cooperative group method), and let Y stand for test score on class exam (varying from 0 to 100 percent correct). Research may show that X Y; that is, test scores depend on which teaching approach is used. In this case, an intervening variable might be student motivation (varying from low motivation to high motivation). Therefore, the full causal chain is X I Y, where X is teaching approach, I is student motivation, and Y is students’ test scores; that is, teaching method student motivation student test scores. The next type of variable is a moderator variable. A moderator variable is a variable that changes (i.e., moderates) the relationship between other variables. It’s a variable that delineates C h a p t e r 2 : Q u a n t i t a t i ve , Q u a l i t a t i ve , a n d M i xe d R e s e a r c h 41 how a relationship changes under different conditions or contexts or for different kinds of people. For example, you might analyze a set of research data and find that there is little or no difference between the performance scores of students who are taught by using the lecture approach and the students who are taught by using the cooperative learning approach. On further analysis, however, you might learn that cooperative learning works better for extroverted students and that lecture works better for introverted students. In this example, personality type is a moderator variable: The relationship between teaching approach and performance scores depends on the personality type of the student. One thing we commonly find in research on teaching is that what works well depends on the type of student. As you can see, it is helpful to know the important moderator variables so that you can adjust your teaching accordingly. Experimental Research The purpose of experimental research is to determine cause-and-effect relationships. The experimental research method enables us to identify causal relationships because it allows us to observe, under controlled conditions, the effects of systematically changing one or more variables. Specifically, in experimental research, the researcher manipulates the independent variable, actively intervening in the world, and then observes what happens. Thus, manipulation, an intervention studied by an experimenter, is the key defining characteristic of experimental research. The use of manipulation in studying cause-and-effect relationships is based on the activity theory of causation (Collingwood, 1940; Cook & Shadish, 1994). Active manipulation is involved only in experimental research. Because of this (and because of experimental control), experimental research provides the strongest evidence of all the research methods about the existence of cause-and-effect relationships. In a simple experiment, a researcher will systematically vary an independent variable and assess its effects on a dependent variable. For example, perhaps an educational researcher wants to determine the effect of a new teaching approach on reading achievement. The researcher could perform the new teaching approach with one group of participants and perform the traditional teaching approach with another group of participants. After the treatment, the experimenter would determine which group showed the greater amount of learning (reading achievement). If the group receiving the new teaching approach showed the greater gain, then the researcher would tentatively conclude that the new approach is better than the traditional approach. Although the type of experiment just described is sometimes done, there is a potential problem with it. What if the two groups of students differed on variables, such as vocabulary, reading ability, and/or age? More specifically, what if the students in the new teaching approach group happened to be older, had better vocabularies, and were better readers than the students in the traditional teaching approach group? Furthermore, suppose the students with better vocabularies, who were older, and who were better readers also tended to learn more quickly than other students. If this were the case, then it is likely that the students in the new teaching approach group would have learned faster regardless of the teaching approach. In this example, the variables age, vocabulary, and reading ability are called extraneous variables. Extraneous variables are variables other than the independent variable of interest (e.g., teaching approach) that may be related to the outcome. When extraneous variables are not controlled for or dealt with in some way, an outside reviewer of the research study may come up with competing explanations for the research findings. The reviewer might argue that the outcome is due to a particular extraneous variable rather than to the independent variable. Experimental research Research in which the researcher manipulates the independent variable and is interested in showing cause and effect Manipulation An intervention studied by an experimenter Extraneous variable A variable that may compete with the independent variable in explaining the outcome 42 PA R T I : I N T R O D U C T I O N Confounding variable An extraneous variable that was not controlled for and is the reason a particular “confounded” result is observed These competing explanations for the relationship between an independent and a dependent variable are sometimes called alternative explanations or rival hypotheses. In our example, the researcher cannot know whether the students in the new teaching approach performed better because of the teaching approach or because they had better vocabularies, were older, or were better readers. All these factors are said to be confounded; that is, these factors are entangled with the independent variable, and the researcher can’t state which is the most important factor. Sometimes we use the term confounding variables to refer to extraneous variables that were not controlled for by the researcher and are the reason a particular result occurred. Because the presence of extraneous variables makes the interpretation of research findings difficult, the effective researcher attempts to control them whenever possible. The best way to control for extraneous variables in an experiment like the one above is to randomly assign research participants to the groups to be compared. Random assignment helps ensure that the people in the groups to be compared are similar before the intervention or manipulation. For example, if the researcher wants to randomly assign 30 people to two groups, then the researcher might put 30 slips of paper, each with one name on it, into a hat and randomly pull out 15 slips. The 15 names that are pulled out will become one of the two groups, and the 15 names remaining in the hat will become the other group. When this is done, the only differences between the groups will be due to chance. In other words, the people in the groups will be similar at the start of the experiment. After making the groups similar, the researcher administers the levels of the independent variable, making the groups different only on this variable. Perhaps teaching method is the independent variable, and the levels are cooperative learning and lecture. The administration of the independent variable, or manipulation, would involve exposing one group to cooperative learning and the other group to lecture. Then if the two groups become different after the manipulation, the researcher can conclude that the difference was due to the independent variable. In summary, (1) the experimenter uses random assignment to make the groups similar; (2) the experimenter does something different with the groups; and (3) if the groups then become different, the experimenter concludes that the difference was due to what the experimenter did (i.e., it was due to the independent variable). In later chapters, we will introduce you to additional methods that are used to control for extraneous variables when one is not able to use random assignment. For now, remember that random assignment to groups is the most effective way to make the groups similar and therefore control for extraneous variables. Nonexperimental Research Nonexperimental research Research in which the independent variable is not manipulated and there is no random assignment to groups In nonexperimental research, there is no manipulation of an independent variable. There also is no random assignment to groups by the researcher—you will learn in later chapters that random assignment is only possible in the strongest of the various experimental designs. As a result of these two deficiencies (no manipulation and no random assignment), evidence gathered in support of cause-and-effect relationships in nonexperimental research is severely limited and much weaker than evidence gathered in experimental research (especially experimental research designs that include random assignment). If you want to study cause and effect, you should try to conduct an experiment, but sometimes this is not feasible. When important causal research questions need to be answered and an experiment cannot be done, research must still be conducted. In research, we try to do the best we can, and C h a p t e r 2 : Q u a n t i t a t i ve , Q u a l i t a t i ve , a n d M i xe d R e s e a r c h sometimes this means that we must use weaker research methods. For example, during the 1960s, extensive research linking cigarette smoking to lung cancer was conducted. Experimental research with humans was not possible because it would have been unethical. Therefore, in addition to experimental research with laboratory animals, medical researchers relied on nonexperimental research methods for their extensive study of humans. One type of nonexperimental research is sometimes called causal-comparative research. In causal-comparative research, the researcher studies the relationship between one or more categorical independent variables and one or more quantitative dependent variables. In the most basic case, there are a single categorical independent variable and a single quantitative dependent variable. Because the independent variable is categorical (e.g., males vs. females, parents vs.nonparents, or public school teachers vs.private school teachers), the different groups’ average scores on a dependent variable are compared to determine whether a relationship is present between the independent and dependent variables. For example, if the independent variable is student retention (and the categories of the variable are retained in the first grade and not retained in the first grade) and the dependent variable is level of achievement, then the retained students’ average achievement would be compared to the nonretained students’ average achievement. (Which group do you think would have higher achievements on average: the retained or the nonretained students?) Despite the presence of the word causal included in the term causal-comparative research, keep in mind that causal-comparative research is a nonexperimental research method, which means that there is no manipulation of an independent variable by a researcher. Furthermore, techniques of controlling for extraneous variables are more limited than in experimental research (in which random assignment may be possible). Because of the lack of manipulation and weaker techniques of controlling for extraneous variables, it is much more difficult to make statements about cause and effect in causal-comparative research than in experimental research. Do not be misled by the word causal in the name of this type of research, and remember that well-designed experimental research is virtually always better for determining cause and effect, An example of causal-comparative research is a study entitled “Gender Differences in Mathematics Achievement and Other Variables Among University Students” (Rech, 1996). Rech compared the average performance levels of males with the average performance levels of females in intermediate algebra and college algebra courses at a large urban commuter university. In the intermediate algebra course, Rech found that females did slightly better than males. The average percentage correct for females was 75 percent, and the average percentage correct for males was 73.8 percent. In the college algebra course, the difference in female and male performance was even smaller (74.3 percent versus 73.9 percent). The data were collected from more than 2,300 research participants over six semesters. It was mentioned earlier that the basic case of causal-comparative research involves a single categorical independent variable and a single quantitative dependent variable. To design a basic causal-comparative study as an exercise, look at Table 2.3 and find a categorical variable that can serve as your independent variable (i.e., one that you would not manipulate) and a quantitative variable that can be your dependent variable. As an example, we can select retention as the independent variable and self-esteem as a dependent variable. We hypothesize that student retention (retained versus nonretained) has an influence on self-esteem. More specifically, we predict that, on average, retained students will have lower self-esteem than nonretained students. We would have to go to a school and collect 43 Causalcomparative research A form of nonexperimental research in which the primary independent variable of interest is a categorical variable 44 PA R T I : I N T R O D U C T I O N Correlational research A form of nonexperimental research in which the primary independent variable of interest is a quantitative variable Correlation coefficient A numerical index that indicates the strength and direction of the relationship between two variables Positive correlation The situation when scores on two variables tend to move in the same direction Negative correlation The situation when scores on two variables tend to move in opposite directions data if we actually wanted to conduct a research study to see whether there is any support for this hypothesis. Another nonexperimental research method is called correlational research. As in causalcomparative research, there is no manipulation of an independent variable in correlational research. In correlational research, the researcher studies the relationship between one or more quantitative independent variables and one or more quantitative dependent variables; that is, in correlational research, the independent and dependent variables are quantitative. In this chapter, we introduce the basic case in which the researcher has a single quantitative independent variable and a single quantitative dependent variable. To understand how to study the relationship between two variables when both variables are quantitative, you need a basic understanding of a correlation coefficient. A correlation coefficient is a numerical index that provides information about the strength and direction of the relationship between two variables. It provides information about how two variables are associated. More specifically, a correlation coefficient is a number that can range from −1 to 1, with zero standing for no correlation at all. If the number is greater than zero, there is a positive correlation. If the number is less than zero, there is a negative correlation. If the number is equal to zero, then there is no correlation between the two variables being correlated. If the number is equal to +1.00 or equal to –1.00, the correlation is called perfect; that is, it is as strong as possible. Now we provide an explanation of these points. A positive correlation is present when scores on two variables tend to move in the same direction. For example, consider the variables high school GPA and SAT (the college entrance exam). How do you think scores on these two variables are related? A diagram of this relationship is shown in Figure 2.2a. As you can see there, the students who have high GPAs tend also to have high scores on the SAT, and students who have low GPAs tend to have low scores on the SAT. That’s the relationship. We say that GPA and SAT are positively correlated because as SAT scores increase, GPAs also tend to increase (i.e., the variables move in the same direction). Because of this relationship, researchers can use SAT scores to help make predictions about GPAs. However, because the correlation is not perfect, the prediction is also far from perfect. A negative correlation is present when the scores on two variables tend to move in opposite directions—as one variable goes up, the other tends to go down, and vice versa. For example, consider these variables: amount of daily cholesterol consumption and life expectancy. How do you think these variables are related? Do you think the relationship meets the definition of a negative correlation? A diagram of this relationship is shown in Figure 2.2b. You can see that as daily cholesterol consumption increases, life expectancy tends to decrease. That is, the variables move in opposite directions. Therefore, researchers can use information about cholesterol consumption to help predict life expectancies. High values on one variable are associated with low values on the other variable and vice versa. This is what we mean by a negative correlation. At this point, you know the difference between a positive correlation (the variables move in the same direction) and a negative correlation (the variables move in opposite directions). There is, however, one more point about a correlation coefficient that you need to know. In addition to the direction of a correlation (positive or negative), we are interested in the strength of the correlation. By strength, we mean “How strong is the relationship?” Remember this point: Zero means no relationship at all, and +1.00 and −1.00 mean that the relationship is as strong as possible. C h a p t e r 2 : Q u a n t i t a t i ve , Q u a l i t a t i ve , a n d M i xe d R e s e a r c h FIGURE 2.2 Examples of positive and negative correlation (b) Negative Correlation (a) Positive Correlation Very High 4 Life Expectancy High School GPA 3 2 1 Very Low 0 Low SAT Score High Very Low Cholesterol Consumption The higher the number (the negative sign is ignored), the stronger the relationship is. For example, if you have a correlation of −.5, then ignore the negative sign and you have .5, which shows the strength of the correlation. Therefore, a correlation of −.5 and a correlation of +.5 have the same strength. The only difference between the two is the direction of the relationship (−.5 is a negative correlation, and +.5 is a positive correlation). When you are interested in its strength, it does not matter whether a correlation is positive or negative. The strength of a correlation operates like this: Zero stands for no correlation at all (i.e., it is the smallest possible strength), and +1.00 and −1.00 are as strong as a correlation can ever be. That is, +1.00 and −1.00 are equally strong; in research jargon, we say that both +1.00 and −1.00 are perfect correlations. The only difference between +1.00 and −1.00 is the direction of the relationship, not the strength. You can see some diagrams of correlations of different strengths and directions in Figure 2.3. If you found the previous paragraph a little hard to understand, here is a different way to determine how strong a correlation is. Simply check to see how far away the number is from zero. The farther the number is from zero, the stronger the correlation is. A correlation of .9 is stronger than a correlation of .2 because it is farther from zero. Likewise, a correlation of −.9 is stronger than a correlation of −.2 because it, too, is farther from zero. Now for a trick question. Which correlation do you believe is stronger: −.90 or +.80? The answer is −.90 because −.90 is farther from zero than +.80. (I think you’ve got it!) This is only a brief introduction to the idea of a correlation coefficient. You will become more comfortable with the concept the more you use it, and we will be using the concept often in later chapters. For now, you should clearly understand that you can have positive and negative correlations or no correlation at all and that some correlations are stronger than other correlations. You have learned more already than you thought you would, haven’t you? Very High 45 46 PA R T I : I N T R O D U C T I O N FIGURE 2.3 Correlations of different strengths and directions (a) Perfect Correlations r = 1.00 r = −1.00 (b) Large or Strong Correlations r = .75 r = −.75 (c) Small or Weak Correlations r = −.30 r = .30 (d) No Correlation r=0 C h a p t e r 2 : Q u a n t i t a t i ve , Q u a l i t a t i ve , a n d M i xe d R e s e a r c h In the most basic form of correlational research, the researcher examines the correlation between two quantitative variables. For example, perhaps an educational psychologist has a theory stating that global self-esteem (which is a relatively stable personality trait) should predict class performance. More specifically, the educational psychologist predicts that students entering a particular history class with high self-esteem will tend to do better than students entering the class with low self-esteem and vice versa. To test this hypothesis, the researcher could collect the relevant data and calculate the correlation between self-esteem and performance on the class examinations. We would expect a positive correlation (i.e., the higher the self-esteem, the higher the performance on the history exam). In our hypothetical example, let’s say that the correlation was +.5. That is a medium-size positive correlation, and it would support our hypothesis of a positive correlation. In our example of self-esteem and class performance, the researcher would be able to say virtually nothing about cause and effect based on the correlation of .5. About all that one can claim is that there is a relationship between self-esteem and class performance: The higher the self-esteem, the better the class performance. This is the same problem that we experienced in the basic case of causal-comparative research in which there is one independent variable and one dependent variable. There are three key problems with the basic (two-variable) cases of correlational and causalcomparative research described in this chapter: 1. There is no manipulation of the independent variable by the researcher. 2. It can be difficult to determine the temporal order of the variables (i.e., which of the variables occurs first). 3. There are usually too many other reasons why we might observe the relationship (i.e., the correlation or the difference between groups); that is, there are usually too many extraneous variables that are left unexplained and act as rival or alternative explanations for why something occurs in the world. Remember this important point: You must not jump to a conclusion about cause and effect in a nonexperimental research study in which the researcher has examined only the relationship between two variables, such as examining a correlation coefficient in correlational research or comparing two group means in causal-comparative research. Simply finding a relationship between self-esteem and class performance (correlational research) or between gender and class performance (causal-comparative research) is not sufficient evidence for concluding that the relationship is causal. Therefore, you must not jump to that conclusion. We will discuss the issue of cause and effect more in later chapters. We will also show how you can obtain some evidence of cause and effect using nonexperimental research by improving on the basic cases of correlational and causal-comparative research discussed in this chapter. We contend that the terms correlational and causal-comparative are not very useful for educational research (Johnson, 2001); we think it is better to focus on weak and stronger nonexperimental research and to learn what factors make nonexperimental quantitative research weak or stronger with regard to cause and effect. For now, make sure you remember this key point: Experimental research with random assignment is the single best research method for determining causeand-effect relationships, and nonexperimental research methods (i.e., correlational and causalcomparative) are much weaker. 47 48 PA R T I : I N T R O D U C T I O N 2.3 What is the difference between a categorical variable and a quantitative variable? Think of an example of each. REVIEW QUESTIONS 2.4 Why is experimental research more effective than nonexperimental research when a researcher is interested in studying cause and effect? 2.5 What are the three main problems with the simple cases of causal-comparative and correlational research? 2.6 What are two variables that you believe are positively correlated? 2.7 What are two variables that you believe are negatively correlated? QUALITATIVE RESEARCH METHODS Qualitative research Research that relies primarily on the collection of qualitative data Phenomenology A form of qualitative research in which the researcher attempts to understand how one or more individuals experience a phenomenon Ethnography A form of qualitative research focused on discovering and describing the culture of a group of people Culture The shared attitudes, values, norms, practices, patterns of interaction, perspectives, and language of a group of people As you saw in Table 2.1, qualitative research is based on qualitative data and tends to follow the exploratory mode of the scientific method. In this book, we will be discussing five specific types of qualitative research: phenomenology, ethnography, case study, grounded theory, and historical research. Chapters 14 and 15 provide detailed discussions of these five kinds of research; now we introduce you to the key ideas of each of these research methods to foreshadow our later, in-depth discussions of these methods. Phenomenology The first major type of qualitative research is phenomenology. When conducting a phenomenological research study, a researcher attempts to understand how one or more individuals experience a phenomenon. For example, you might conduct a phenomenological study of elementary school students who have lost a parent to understand better how schoolchildren experience bereavement. The key element of a phenomenological research study is that the researcher attempts to understand how people experience a phenomenon from the person’s own perspectives. Your goal is to enter the inner world of each participant to understand his or her perspectives and experiences. Phenomenological researchers have studied many phenomena, such as what it is like to participate in a religious group that handles serpents as part of the worship service (Williamson, Pollio, & Hood, 2000), the experience of grief (Bailley, Dunham, & Kral, 2000), the experience of learning to become a music teacher (Devries, 2000), the experience of living with alcoholism (Smith, 1998), the meaning of age for young and old adults (Adams-Price, Henley, & Hale, 1998), and elementary school children’s experiences of stress (Omizo & Omizo, 1990). Ethnography Ethnography is one of the most popular approaches to qualitative research in education. The word ethnography literally means “writing about people.” When ethnographers conduct research, they are interested in describing the culture of a group of people and learning what it is like to be a member of the group from the perspective of the members of that group. That is, they are interested in documenting things like the shared attitudes, values, norms, practices, patterns of interaction, perspectives, and language of a group of people. They may also be interested C h a p t e r 2 : Q u a n t i t a t i ve , Q u a l i t a t i ve , a n d M i xe d R e s e a r c h in the material things that the group members produce or use, such as clothing styles, ethnic foods, and architectural styles. Ethnographers try to use holistic descriptions; that is, they try to describe how the members of a group interact and how they come together to make up the group as a whole. In other words, the group is more than just the sum of its parts. Just a few of the many groups that ethnographers have studied recently are a group of panhandlers living on the streets of Washington, D.C. (Lankenau, 1999), men with mental retardation living in a group home (Croft, 1999), black and white sorority members (Berkowitz & Padavic, 1999), students in a U.S. history class (Keedy, Fleming, Gentry, & Wheat, 1998), sixth-grade students in science classes (Solot & Arluke, 1997), karaoke bar performers (Drew, 1997), Puerto Rican American parents with children in special education (Harry, 1992), and a group of Native American students who had dropped out of school (Deyhle, 1992). In all of these studies, the researchers were interested in describing some aspect of the culture of the people in the study. 49 Holistic description The description of how members of a group interact and how they come together to make up the group as a whole See Journal Article 2.2 on the study site. Case Study Research In case study research, the researcher provides a detailed account of one or more cases. Although case study research usually relies on qualitative data, multiple methods are also used. Case study research can be used to address exploratory, descriptive, and explanatory research questions (Stake, 1995; Yin, 1994). Case study research is more varied than phenomenology, which focuses on individuals’ experience of some phenomenon; ethnography, which focuses on some aspect of culture; or grounded theory, which focuses on developing an explanatory theory. What all pure case studies do have in common, however, is a focus on each case as a whole unit (i.e., case study research is holistic) as it exists in its real-life context. For example, in “Building Learning Organizations in Engineering Cultures,” Ford,Voyer, and Wilkinson (2000) examined how a specific organization changed over time into a learning organization. Although their focus was on a single case, other organizations might be able to learn from the experiences of Ford and colleagues. In “The Journey Through College of Seven Gifted Females: Influences on Their Career Related Decisions,” Grant (2000) examined in detail the personal, social, and academic experiences of seven people. After analyzing each case, Grant made crosscase comparisons, searching for similarities and differences. Case study research A form of qualitative research that is focused on providing a detailed account of one or more cases Grounded Theory Grounded theory research is a qualitative approach to generating and developing a theory from the data you collect in a research study. You will recall from Chapter 1 that a theory is an explanation of how and why something operates. We will explain the details of grounded theory in Chapter 14; for now, remember that grounded theory is an inductive approach for generating theories or explanations. One example of a grounded theory is found in “An Analysis of Factors That Contribute to Parent-School Conflict in Special Education” by Lake and Billingsley (2000). Lake and Billingsley wanted to explain why conflict takes place between the parents of children in special education programs and school officials. Lake and Billingsley conducted indepth interviews (lasting an average of 1 hour) with parents, principals, special education program directors, and mediators. They identified several factors as contributing to the escalation of parent-school conflict. The primary or core factor was a discrepancy in views about the child’s needs. The other factors were lack of knowledge (e.g., lack of problem-solving knowledge), disagreements over service delivery, the presence of constraints (e.g., such as the lack of Grounded theory research A qualitative approach to generating and developing a theory from the data that the researcher collects 50 PA R T I : I N T R O D U C T I O N funds to deliver services), differences in how a child is valued, unilateral use of power, poor communication, and lack of trust. In addition to discussing what factors lead to conflict, the authors discussed how conflict can be reduced and how it can be prevented. As you can see, the authors generated a tentative explanation about conflict based on their data. To strengthen their explanation, they would need to develop their theory further and test it with new empirical data (which would result in a mixed research approach). Historical Research Historical research Research about people, places, and events in the past REVIEW QUESTION The last general type of research used by educational researchers and discussed in this chapter is historical research, or research about people, places, and events in the past. This type of research is sometimes called narrative research because it studies “the text of history,” and it often presents its results through stories or narratives. Although many historical research studies are best classified as mixed (e.g., when quantitative and qualitative data are used), we place this type of research under the heading of qualitative research because, generally speaking, the data tend to be qualitative and the approach to the use of evidence and the forming of arguments is closer to that of qualitative research than to quantitative research. As you know, historical research is done so that researchers can better understand events that have already occurred. Educational historians have been able to find historical data that lend themselves to data analysis and have studied how various educational phenomena operated in the past. For example, educational researchers document the history of education and important events that occurred in the past, study trends in education occurring over time, study the multiple factors that led to certain events in the past, and study how things operated in the past (e.g., different teaching practices and the different outcomes that resulted from those practices). They might also study the origin of current practices and document any changes over time. Historiography is the word historians sometimes use to mean “research methods.” As you will learn in Chapter 15, historiography involves the posing of questions, the collection of authentic source materials, the analysis and interpretation of those materials, and the composition of the results into a final report. Historical research, like the other methods of research, has an important place in education. 2.8 What are the different types of qualitative research, and what is the defining feature of each of these? MIXED RESEARCH (OR MIXED METHODS RESEARCH) See Journal Article 2.3 on the study site. In mixed research, the researcher uses a mixture or combination of quantitative and qualitative methods, approaches, or concepts in a single research study or in a set of related studies. The qualitative and quantitative parts of a research study might be conducted concurrently (conducting both parts at roughly the same time) or sequentially (conducting one part first and the C h a p t e r 2 : Q u a n t i t a t i ve , Q u a l i t a t i ve , a n d M i xe d R e s e a r c h other second) to address a research question or a set of related questions. For example, let’s say that you are interested in studying the phenomenon of living with dyslexia for high school students.You might decide first to conduct a qualitative (exploratory) component of your research study by conducting open-ended or unstructured interviews with 10 or 20 high school students who have dyslexia so that you can directly hear from these students in their own words what it is like to live with dyslexia. On the basis of the data from this phase of your overall study and from your reading of the current research literature, you construct a closed-ended and more structured questionnaire. Next, in the quantitative phase of your study, you ask another group of high school students with dyslexia to rate how descriptive each of the characteristics on the structured questionnaire is of them. For this quantitative phase of your study, you might select a sample of students with dyslexia from several high schools and have these students fill out your questionnaire.You then analyze your questionnaire data and write up your “integrated” findings from the qualitative and quantitative parts of your research study. In this example, the qualitative phase was used to explore the words, categories, and dimensions to include in a structured questionnaire. Then you started testing (or validating) how well the questionnaire operated in the quantitative phase. Together, the qualitative and quantitative approaches produced a superior questionnaire. The Advantages of Mixed Research We view the use of multiple perspectives, theories, and research methods as a strength in educational research. In fact, we view the quantitative and qualitative research methods as complementary. When mixing research or when you read and evaluate research that involved mixing, be sure to consider the fundamental principle of mixed research, which says that it is wise to collect multiple sets of data using different research methods, epistemologies, and approaches in such a way that the resulting mixture or combination has complementary strengths and nonoverlapping weaknesses (Johnson & Turner, 2003). The idea of complementary strengths here means that the whole is greater than the sum of the parts. The mixed approach helps improve the quality of research because the different research approaches have different strengths and different weaknesses. By combining two (or more) research methods with different strengths and weaknesses in a research study, you can make it less likely that you will miss something important or make a mistake. The famous qualitative researchers Lincoln and Guba (1985) explained this idea using the metaphor of fish nets. Perhaps a fisherman has several fishing nets, each with one or more holes. To come up with one good net, the fisherman decides to overlap the different fishing nets, forming one overall net. All the nets have holes in them; however, when the nets are put together, there will probably no longer be a hole in the overall net. In the case of research methods, an experimental research study might demonstrate causality well, but it might be limited in realism because of the confines of the research laboratory. On the other hand, an ethnographic research study might not demonstrate causality especially well, but it can be done in the field, which enables a researcher to observe behavior as it naturally takes place and therefore increases realism. When both methods are used, causality is strong, and realism is no longer a big problem. Although it is often not practical to use more than one research method or strategy in a single research study, you should be aware of the potential benefit of using multiple methods and strategies. Furthermore, even if a researcher does not use multiple approaches or methods in a single research study, the relevant set of published research studies will usually include research based on several different 51 Mixed research Research that involves the mixing of quantitative and qualitative methods or other paradigm characteristics Fundamental principle of mixed research Advises researchers to thoughtfully and strategically mix or combine qualitative and quantitative research methods, approaches, procedures, concepts, and other paradigm characteristics in a way that produces an overall design with complementary strengths (broadly viewed) and nonoverlapping weaknesses. Complementary strengths The whole is greater than the sum of its parts. 52 PA R T I : I N T R O D U C T I O N research methods. The research literature is therefore mixed method.As a result, the mixed method (or mixed fishing net) advantage will be gained in the overall area of research. REVIEW 2.9 What is mixed research, and what is an example of this kind of research? QUESTION OUR RESEARCH T YPOLOGY The forms of research that we have covered in this chapter are shown in Figure 2.4. We will discuss each of these types of research in later chapters. It is important to understand that all of the major types of research that we discuss in this textbook have value! It is not uncommon for an educational researcher to use several different types of research at different times. A researcher should always select the appropriate research method on the basis of a consideration of the research question(s) of interest, the objective(s) of the research, time and cost constraints, available populations, the possibility (or not) of the manipulation of an independent variable, and the availability of data. Sometimes a researcher will use more than one research approach within a single study. However, even if researchers never used more than one method in a single study, published research literature would still tend to include articles based on different approaches and methods because of the diversity of the researchers working in the area. When a research finding has been demonstrated by using more than one type of research, one can place more confidence in it. We say that a finding has been corroborated if the same result is found by using different types of research. Conversely, if different data sources or types of research result in conflicting information, then additional research will be needed to explore the nature of the phenomenon more completely and to determine the source of conflict. That is, if different types of research result in different findings, then the researcher should study the FIGURE 2.4 Research typology (Later chapters will add a third level to this typology.) Level 1: Methodological Paradigm Level 2: Research Method 1 Quantitative research a Experimental b Nonexperimental 2 Mixed research 3 Qualitative research a Phenomenology b Ethnography c Case study e Historical d Grounded theory C h a p t e r 2 : Q u a n t i t a t i ve , Q u a l i t a t i ve , a n d M i xe d R e s e a r c h 53 phenomenon in more depth to determine the exact reason for the conflicting findings. The world is a complex and ever-changing place. As we study it, it is helpful to be equipped with the best methods and approaches currently available. You will probably find that some methods and approaches we discuss will fit your style or personality better than others. However, we hope that you will keep an open mind as you learn about all of the kinds of research. All the research methods can be useful if used properly. 2.10 What are the three research paradigms in education, and what are the major types of research in each of these paradigms? (Hint: See Figure 2.4.) REVIEW QUESTION SUMMARY The three major research traditions in educational research are qualitative research, quantitative research, and mixed research. All three of these traditions are important and have value. Qualitative research tends to use the exploratory scientific method to generate hypotheses and develop understandings about particular people, places, and groups (e.g., in case studies, ethnography, phenomenology, and historical research). Qualitative researchers typically are not interested in making generalizations. An exception to this lack of interest in generalizing is found in the grounded theory approach to qualitative research. Qualitative research is discovery oriented and is conducted in natural settings. On the other hand, quantitative research is typically done under more tightly controlled conditions and tends to use the confirmatory scientific method, focusing on hypothesis testing and theory testing. Quantitative researchers hope to find common patterns in thought and behavior and to generalize broadly. Mixed research involves mixing and combining qualitative and quantitative research in single research studies. It is based on the philosophy of pragmatism (i.e., what works is what should be considered to be important in answering research questions). In this chapter, two quantitative research types or methods were introduced (experimental and nonexperimental research), five types of qualitative research were introduced (phenomenology, ethnography, case study, grounded theory, and historical), and mixed research (which mixes or combines qualitative and quantitative research approaches in single research studies) was introduced. In later chapters, we elaborate on each part of the research typology (i.e., our classification of the different types of research) shown in Figure 2.4. KEY TERMS case study research (p. 49) categorical variable (p. 39) causal-comparative research (p. 43) cause-and-effect relationship (p. 40) complementary strengths (p. 51) confounding variable (p. 42) constant (p. 38) correlation coefficient (p. 44) correlational research (p. 44) culture (p. 48) dependent variable (p. 40) determinism (p. 33) ethnography (p. 48) experimental research (p. 41) extraneous variable (p. 41) fundamental principle of mixed research (p. 51) grounded theory research (p. 49) historical research (p. 50) holistic description (p. 49) incompatibility thesis (p. 31) independent variable (p. 40) intervening variable (p. 40) linguistic-relativity hypothesis (p. 36) manipulation (p. 41) mediating variable (p. 40) mixed research (pp. 33, 51) 54 PA R T I : I N T R O D U C T I O N moderator variable (p. 40) negative correlation (p. 44) nonexperimental research (p. 42) phenomenology (p. 48) positive correlation (p. 44) pragmatism (p. 32) probabilistic causes (p. 33) qualitative research (pp. 33, 48) quantitative research (pp. 33, 38) quantitative variable (p. 39) research paradigm (p. 31) variable (p. 38) verstehen (p. 36) DISCUSSION QUESTIONS 1. Which of the three research paradigms do you like the most? Explain why? 2. If you find a statistical relationship between two variables (e.g., income and education, or gender and grades, or time spent studying and grades) in a nonexperimental research study, should you confidently conclude that one variable is the cause of the other variable? 3. What is an example of a positive correlation? What is an example of a negative correlation? 4. Following are several research questions. For each, list the research method that you believe would be most appropriate to use in answering the question. a. How do individuals experience the phenomenon of being one of only a few minority students in a predominantly homogeneous high school? b. What is the effect of a new teaching technique on elementary school students’ arithmetic performance? c. Does cognitive therapy or behavioral therapy work better for treating childhood depression? d. What is the culture of the band at a high school in your local community? e. What is the relationship between the GRE and student performance in graduate school? f. Do males and females have different performance levels in high school English classes? g. Does the student-to-teacher ratio have an effect on elementary students’ level of performance in the classroom? h. What was it like being a middle school student in 1921 in the four-room school (where primary through high school were taught) in Great Bridge, Virginia (which is located in the city of Chesapeake)? i. Was John Dewey an effective schoolteacher? j. Do students perform better on an academics test when they are exposed to a cooperative learning style or a lecture style of teaching? RESEARCH EXERCISES 1. Go to this book’s companion website or to a database on the website of your university library and locate a qualitative research article, a quantitative research article, or a mixed methods research article. Briefly summarize the purpose of the research and the methodology (i.e., how it attempted to answer the research questions). Explain why you classified your article as a qualitative, a quantitative, or a mixed research study. 2. Read the quantitative research study on the companion website and write a two-page (typed, double-spaced) summary of the article. Organize your paper into the following three sections: (1) Purpose: What was the research study about? What did the researchers hope to learn? (2) Methods: How did the researchers carry out their research study? What did they actually do? C h a p t e r 2 : Q u a n t i t a t i ve , Q u a l i t a t i ve , a n d M i xe d R e s e a r c h 55 (3) Results: What were the key findings of the research study? Don’t worry about the technical jargon in the research article. Just try to understand and clearly communicate the main ideas of the article. 3. Read the qualitative research study on the companion website and write a two-page summary of the article. Organize your paper into the three sections described in Exercise 2 (purpose, methods, and results). 4. Read the mixed research study on the companion website and write a two-page summary of the article. Organize your paper into the three sections described in Exercise 2 (purpose, methods, and results). ACTION RESEARCH JOURNALING Insight: Action researchers usually follow the mixed research paradigm because they like to select what works best from both qualitative and quantitative research. 1. What paradigm(s) do you like to operate from? Why? 2. What philosophical and practical assumptions do you think you tend to operate from? First, what do you mean by the word reality, and do you think that reality is singular or plural? (These are some of your ontological assumptions.) Second, do you think there is one best way to gain knowledge or multiple ways, and what do you mean by “warranted or justified knowledge”? (These are some of your epistemological assumptions.) Third, what research methods discussed in this chapter do you think might be useful in learning about your world? (This is one of your methodological assumptions.) See Journal Article 2.4 on the study site. RELEVANT INTERNET SITES Quantitative research book materials and links. Go to Research Methods, Design, and Analysis textbook website (under the Website Gallery section). http://www.pearsonhighered.com/educator/product/ResearchMethods-Design-and-Analysis/9780205701650.page Correlation coefficients http://glass.ed.asu.edu/stats/lesson4/ Mixed research links http://www.fiu.edu/~bridges/ Qualitative research links http://www.qualitativeresearch.uga.edu/QualPage/ STUDENT STUDY SITE Visit the Student Study Site at www.sagepub.com/bjohnson4e/ for these additional learning tools: Video Links Self Quizzes E-Flashcards Learning Objectives Full-text SAGE journal articles Interactive Concept Maps Web Resources SPSS Exercises and Data Set 56 PA R T I : I N T R O D U C T I O N RECOMMENDED READING Baron, R. M., & Kenny, D. A. (1986). The moderator-mediator variable distinction in social psychological research: Conceptual, strategic, and statistical considerations. Journal of Personality and Social Psychology, 51(6), 1173–1182. Christensen, L. B. (2007). Experimental methodology (10th ed.). Boston, MA: Allyn & Bacon. Johnson, R. B. (2001). Toward a new classification of nonexperimental quantitative research. Educational Researcher, 30(2), 3–13. Johnson, R. B., & Onwuegbuzie, A. J. (2004). Mixed methods research: A research paradigm whose time has come. Educational Researcher, 33(7), 14–26. (Also available online at http://aera.net/publications/?id=338) Johnson, R. B., Onwuegbuzie, A. J., & Turner, L. A. (2007). Toward a definition of mixed methods research. Journal of Mixed Methods Research, 1, 112–133. Patton, M. Q. (2002). Qualitative research and evaluation methods (3rd ed.). Thousand Oaks, CA: Sage. Pedhazur, E. J., & Schmelkin, L. P. (1991). Measurement, design, and analysis: An integrated approach. Hillsdale, NJ: Erlbaum. Tashakkori, A., & Teddlie, C. (Eds.). (2003). Handbook of mixed methods in the social and behavioral sciences. Thousand Oaks, CA: Sage.


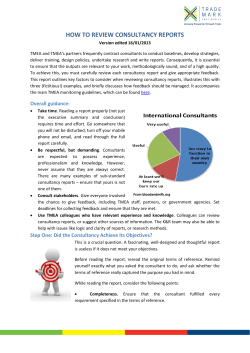
© Copyright 2026