
Species richness declines and biotic homogenisation have
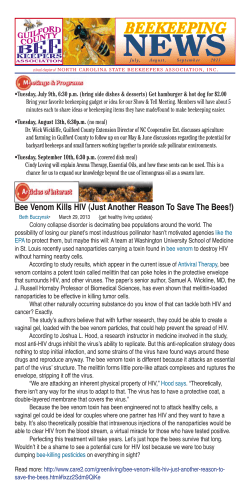
Ecology Letters, (2013) 16: 870–878
LETTER
doi: 10.1111/ele.12121
Species richness declines and biotic homogenisation have
slowed down for NW-European pollinators and plants
Luısa Gigante Carvalheiro,1,2*
William E. Kunin,1 Petr Keil,3,4
rrez,2 Willem
Jesus Aguirre-Gutie
Nicolaas Ellis,2,5 Richard Fox,6
Quentin Groom,7 Stephan
Hennekens,8 Wouter Van Landuyt,9
Dirk Maes,9 Frank Van de
Meutter,9,10 Denis Michez,11 Pierre
Rasmont,11 Baudewijn Ode,12
Simon Geoffrey Potts,13 Menno
Reemer,14 Stuart Paul Masson
e,15
Roberts,13 Joop Schamine
Michiel F. WallisDeVries16,17 and
1,2,18
Jacobus Christiaan Biesmeijer
Abstract
Concern about biodiversity loss has led to increased public investment in conservation. Whereas there is a
widespread perception that such initiatives have been unsuccessful, there are few quantitative tests of this
perception. Here, we evaluate whether rates of biodiversity change have altered in recent decades in three
European countries (Great Britain, Netherlands and Belgium) for plants and flower visiting insects. We
compared four 20-year periods, comparing periods of rapid land-use intensification and natural habitat loss
(1930–1990) with a period of increased conservation investment (post-1990). We found that extensive species richness loss and biotic homogenisation occurred before 1990, whereas these negative trends became
substantially less accentuated during recent decades, being partially reversed for certain taxa (e.g. bees in
Great Britain and Netherlands). These results highlight the potential to maintain or even restore current
species assemblages (which despite past extinctions are still of great conservation value), at least in regions
where large-scale land-use intensification and natural habitat loss has ceased.
Keywords
Accumulation curves, biodiversity loss, community ecology, plant–flower visitor communities, pollination,
similarity, spatial homogenisation, species richness estimations, temporal and spatial patterns.
Ecology Letters (2013) 16: 870–878
Ongoing species richness loss and biotic homogenisation are a
growing concern for society (Pereira et al. 2010; Cardinale et al.
2012). The increasing awareness of the role of human activities in
these declines and their potential impacts on our health, food supply, ecosystem services and well being (e.g. Isbell et al. 2011) have
led to policy changes towards the protection of biodiversity, many
implemented after 1990 (Kleijn & Sutherland 2003). The Convention on Biological Diversity’s main target is to substantially reduce
the rate of biodiversity loss at global, regional and national levels
(CBD, Secretariat of the Convention on Biological Diversity 2010),
and the EU committed itself to an even more ambitious target of
halting biodiversity loss. Most agree that these targets have not been
met (e.g. Butchart et al. 2010); but in the absence of standardised
long-term monitoring programmes (which exist for only a few taxa
and countries) it is difficult to assess if biodiversity loss trends are
changing.
Biesmeijer et al. (2006) use rarefaction methods to estimate
changes in diversity in plant and pollinator taxa based on historical
collections before and after 1980. They found evidence of declines
in bees and pollinator-dependent plants in Great Britain and the
Netherlands. However, whereas it is well known that during the
past decades the studied countries underwent substantial climatic
(EEA, European Environment Agency 2004), land-use (HainesYoung et al. 2003; EEA, European Environment Agency 2010;
FAO, Food & Agriculture Organization of the United Nations
2012) and environmental policy changes (Kleijn & Sutherland
2003), it remains unclear how the rate of biodiversity loss has changed over time.
Focusing only on native species assemblages, here we apply
robust richness estimation methods to evaluate richness changes
during the past 80 years in three European countries (Great Britain,
the Netherlands and Belgium; ca. 29.2 million records in total) at
1
School of Biology, University of Leeds, LS2 9JT, Leeds, UK
11
2
Naturalis Biodiversity Center, P.O. Box 9517, 2300RA, Leiden,
Mons, Belgium
de Mons, Place du Parc 23, B-7000
Laboratoire de Zoologie, Universite
The Netherlands
12
FLORON, Postbus 1413, 6501 BK, Nijmegen, The Netherlands
3
13
School of Agriculture, Policy and Development, University of Reading,
Department of Ecology and Evolutionary Biology, Yale University,
165 Prospect Street, New Haven, CT, 06520, USA
Reading, RG6 6AR, UK
4
14
Center for Theoretical Study, Charles University and the Academy of Sciences
European Invertebrate Survey–Netherlands/Naturalis Biodiversity Center,
of the Czech Republic, Jilska 1, 110 00, Praha 1, Czech Republic
Postbus 9517, 2300 RA, Leiden, The Netherlands
5
15
Working Group Lepidoptera Faunistics, Zoological Museum, Section
Institute for Water and Wetland Research, Radboud University Nijmegen,
Entomology, Plantage Middenlaan 64, 1018 DH, Amsterdam, The Netherlands
P.O. Box 9010, 6500 GL, Nijmegen, The Netherlands
6
Butterfly Conservation, Manor Yard, East Lulworth, Dorset, BH20 5QP, UK
16
7
Botanical Society of the British Isles, c/o Botany Department, British Museum
Wageningen, The Netherlands
De Vlinderstichting/Dutch Butterfly Conservation, P.O. Box 506, 6700AM,
(Nat. Hist.), London, UK
17
8
Wageningen, The Netherlands
Centre for Ecosystem Studies, Wageningen University and Research, Alterra,
Laboratory of Entomology, Wageningen University, P.O. Box 8031, 6700 EH,
PO Box 47, NL-6700 AA, Wageningen, The Netherlands
18
9
P.O. Box 94248, 1090 GE, Amsterdam, The Netherlands
Research Institute for Nature and Forest (INBO), Kliniekstraat 25, 1070,
*Correspondence: E-mail: [email protected]
Brussels, Belgium
10
University of Amsterdam, Institute of Biodiversity and Ecosystem Dynamics,
Laboratory of Aquatic Ecology and Evolutionary Biology, University of
Leuven, Charles Deberiotstraat 32, B-3000, Leuven, Belgium
© 2013 The Authors. Ecology Letters published by John Wiley & Sons Ltd and CNRS
This is an open access article under the terms of the Creative Commons Attribution License, which permits use,
distribution and reproduction in any medium, provided the original work is properly cited.
Letter
multiple spatial scales (from 10 9 10 km cells to the whole of each
country), and also evaluate changes in patterns of biotic homogenisation (due to the spread of native species or loss of spatially
restricted species). We find that extensive species richness loss and
biotic homogenisation occurred before 1990. However, such negative trends have slowed down (or recovery has set in) for several
taxa during the most recent decades.
MATERIALS AND METHODS
For each of the studied countries (the United Kingdom, the
Netherlands and Belgium), four 20-year time periods were compared: 1950–1969 (hereafter P1), 1970–1989 (P2), 1990–2009 (P3)
and whenever possible 1930–1949 (P0), covering a period during
which the studied countries were subjected to substantial changes in
land-use, climate and environmental policies. The analysis of data
collected prior to 1950 (1930–1949) was limited to taxonomic
groups and countries for which data quality allowed this.
Three groups of flower visiting insects which contribute to plant
pollination were studied here: bees (Hymenoptera: Apoidea), hoverflies (Diptera: Syrphidae) and butterflies (Lepidoptera: Papilionoidea
and Hesperioidea). Given the importance of bees for pollination,
and the recognised high vulnerability of bumble bees (Apidae,
Bombini) (Carvell et al. 2007; Williams & Osborne 2009), we
analyse bumble bees separately from other bees (the honeybee, Apis
mellifera L. was not considered, as its presence in the focal region is
largely dependent on apiculture practices). Plants were divided into
three groups according to their dependence on flower visitors for
pollination: fully dependent, intermediate dependency and independent, as described below. Exotic species (archaeophytes and
neophytes) represent a relatively small minority of species, and
analyses including exotics generated similar result patterns for most
spatial scales; therefore, we focus only on the results obtained using
data on native plant species. For details on the databases sources
see Table S1.
Information on the dependency of plants on insects for pollination was obtained for ca. 50% of the plant species (2481 of 4943
species) from the Ecological Flora database (see Table S1). When
information was not consistent among the three databases a given
species was classified as intermediately dependent. On the basis of
this information we detected that only 6% of the genera (23 of 377
genera, single species genera excluded) and only 35% of the families
(36 of 103 multi-species families) included both insect-dependent
and non–insect-dependent species. Therefore, for the ca. 50% of
species for which information was not available in any of the databases, we used information from genus and family level to classify
the species (e.g. all Poaceae were classified as pollinator independent). If species within a genus had different dependencies, species
would be classified as intermediately dependent. As many tree
species are planted for ornamental or reforestation purposes, we
repeated the analyses with and without all tree species to distinguish
between effects of natural vs. man-induced range changes. As no
major differences were found between analyses with and without
trees, we presented the results including all native plant species.
Analyses of species richness change
In the absence of formal monitoring programmes, long-term databases containing validated species records collected at different
European plant-pollinator declines have slowed 871
times and by many different recorders provide a valuable source of
information on past and present species occurrences. As these
records were usually not collected following standardised sampling
schemes, their analysis faces several methodological challenges.
First, improvement of taxonomic and collection tools/skills through
time can lead to more species being registered in more recent time
periods simply due to detectability changes. To ensure that taxonomic changes and collection tools/skills would not affect estimates
of richness change, species that could not be easily distinguished in
the past or present time periods were lumped into aggregate species,
based on information provided by the specialists on each of the
taxa (Bees: DMichez, PR, SR; Hoverflies: MR, FVM, Butterflies:
RF, DMaes, MW, Plants: QG, SH, WVL, BO, JS). Plant species
with multiple subspecies or varieties were always aggregated under a
unique name. Secondly, estimates of richness change are generally
dependent on the spatial scale at which they are evaluated (Keil
et al. 2010). However, such scale-related differences in estimates
provide valuable information to help understand the patterns of
change, and for conservation management (Whittaker et al. 2001).
For example, range expansions affect richness values of multiple
fine-scale cells, and hence have a substantial effect on the mean
change value at finer spatial scales (Gotelli & Colwell 2001), but no
effect at country level (if the species was present in both periods,
and simply changed its distribution pattern). Conversely, countrylevel extinctions of spatially restricted species and species introductions will affect coarse (e.g. national)-scale richness, while only influencing a few fine-scale cells (see Cassey et al. 2006). Therefore,
whenever data quality allowed, we repeated richness change analyses
at multiple spatial scales (e.g. 10 9 10, 20 9 20, 40 9 40, 80 9 80
or 160 9 160 km grid cells as well as for the whole country). As
only one 160 9 160 km grid was available for the Netherlands and
Belgium, this scale was not considered in these countries. Finally,
unequal sampling intensity between grid cells or time periods and
oversampling of rare species can bias richness estimates (Hellmann
& Fowler 1999; Garcillan & Ezcurra 2011; ter Steege et al. 2011).
Here, we combine robust richness estimation methods with a metaanalysis approach to deal with the unstandardised nature of historical collections.
When comparing two periods with unequal sampling, previous
studies have used rarefaction to estimate (or rather, interpolate) the
value of richness in the more sampled period that would be
expected if sampling effort had been equal to that of the less sampled period (e.g. Biesmeijer et al. 2006; Keil et al. 2010). As an alternative, Colwell et al. (2012) have shown that species accumulation
curves can be extrapolated (up to threefold of the real sampling
effort), producing reasonable estimates of richness further in the
accumulation curve. This approach has been used here to estimate
richness of the least-sampled period, extrapolating to a point where
sampling effort is equal between the two periods (pre-period X1[n]
and post-period X2[n]). However, where the more sampled period
had more than threefold the number of records of the less sampled
period, we combined extrapolation and interpolation in our comparisons: extrapolating the smaller sample’s accumulation curve up to
three times its sample size, and rarifying the larger sample down to
this same ‘comparison point’.
We repeat this process for every cell, calculating relative richness
change between the pre- and the post-period as XX21 ðnÞ
ðnÞ. For analyses
of richness change, we applied a log transformation
© 2013 The Authors. Ecology Letters published by John Wiley & Sons Ltd and CNRS
872 L. G. Carvalheiro et al.
(ln XX21 ðnÞ
ðnÞ ¼ lnX2 ðnÞ lnX1 ðnÞ, hereafter termed ‘logratio’) to normalise residuals. Its sampling variance (VARQX) is approximated as
SD2 ðnÞ 2
1 ðnÞ 2
þ SD
: As in the absence of singletons, the assemX2 ðnÞ
X1 ðnÞ
blage is considered to be well sampled, and SD of X will be zero
(Colwell et al. 2012), to account for any under- or overestimation of
singletons and doubletons (collectors may put more effort on registering the rarest species, Garcillan & Ezcurra 2011, or try to obtain
two specimens to capture morphological diversity of the species,
e.g. males and females; flowering and fruiting plant specimens), we
a priori excluded cells with very poor quality of sampling and we
used bootstrapping to calculate SD of X (by re-sampling the data
we create a corrected estimator of the number of unseen species,
where the effect of under/oversampling of singletons is reduced).
For details on selection criteria applied in richness change analyses,
see legend of Table S2.
Meta-analysis techniques were then applied to obtain an overall
weighted value of richness change (Qw) and assess if the mean value
of change at a given scale was significantly different from zero.
Using the rma.uni function of the R package metaphor (Viechtbauer
2010), each grid cell was weighted based on the inverse of the variance, so that cells with more reliable estimations have a higher
weight in the analyses (Hartung et al. 2008). To check if the method
completely corrected for bias due to differences in sampling efforts,
we included the log of the relative difference in the number of
numberofRecords2 Þ as a
records between the two time periods ðDR ¼ ln numberofRecords1
covariate. If accumulation curve estimations did not completely
remove the bias due to sampling effort (i.e. whenever DR had a significant effect on estimated richness change across sites), we calculated the partial residuals after removing the effect of sampling
effort for each cell to obtain unbiased estimates of richness change
for each grid cell. We then assessed in which cells richness had significantly increased or decreased using a z-test, for each species
group, country and time period. Finally, we evaluated if values of
richness change were spatially autocorrelated by comparing a model
with spatial autocorrelation structure (linear or exponential) with a
null model using a log-likelihood ratio test and compared the
Akaike Information Criterion values of each model.
For verification of the sensitivity of our results, we repeated all
richness analyses using only interpolation and only extrapolation
and we compare the results using re-sampled and non–re-sampled
SD and variance when analysing data.
Analyses of species assemblage similarity through time and space
To evaluate changes in patterns of biotic homogenisation, we investigate how similarity (and thus turnover) of species assemblages across
space (evaluated by comparing assemblages in 10-km grid cells) changes
over time. Classical measures of assemblage similarity or dissimilarity
(beta-diversity, e.g. Sorensen similarity or Jaccard similarity) can be partitioned into two components: dissimilarity due to species replacement
and dissimilarity due to nestedness (see Baselga 2010). Here, we use
similarity due to species replacement (calculated as 1-Beta-sim, Lennon
et al. 2001), a measure that is independent of, but complementary to,
our measurements of alpha-diversity (see Baselga 2010).
To correct for the unequal sampling effort, for each group and
each 20-year time period, we used an individual-based probabilistic
approach (Chao et al. 2005) for calculating similarity in species
© 2013 The Authors. Ecology Letters published by John Wiley & Sons Ltd and CNRS
Letter
composition between each selected grid cell (focal cell) and all other
selected grid cells, not allowing for repetition of pairs of grid cells.
As species identity is crucial for similarity analyses, we applied selection criteria stricter than for the richness analyses (see details on
selection criteria in the legend of Table S3). Applying less strict
selection criteria would lead to the selection of more grid cells, but
could lead to results more influenced by cells which due to their
low sample size have only the commonest species.
We then estimated the distance decay of similarity (logit transformed to standardise residuals) at the different time periods. We
used a general linear-mixed model (with focal grid cell as a random
factor and distance and time period as fixed variables) fitted using
maximum likelihood (estimates obtained using restricted maximum
likelihood) using the R package nlme (Pinheiro et al. 2012). As in
richness analyses, the probability of a given species being selected in
a random sample of records will depend on the evenness of records
per species. As evenness of records per species decreases with
increasing sampling effort (Table S4), the probability of an assemblage being a nested subset of another (such that 1-Beta-sim = 1) is
likely to increase with increasing difference in sampling effort
between the two grid cells. This effect is, however, likely to be less
accentuated when the least-sampled cell is already very well sampled. To test and correct for this effect, the number of records of
the least-sampled grid cell, the relative difference of number of
records between the two grid cells and the interaction between the
two were included in the model as explanatory terms.
All calculations described above were made using scripts written
by LGC, PK and Tom van Dooren for R (R Development Core
Team 2012), and scripts can be provided upon request to LGC.
RESULTS
Whereas analyses at coarser spatial scales (e.g. country level) were
always possible, the number of finer spatial scale locations that
matched our selection criteria varied between taxa and countries (Fig.
S1). Although evenness of records per species significantly changed
with sampling effort and time period (Table S4, which affect richness
change estimations per cell), overall we found consistent patterns of
average native richness change per spatial scale when using interpolation combined with extrapolation (Fig. 1, Fig. S2), only interpolation
(Fig. S3) or only extrapolation (Fig. S4), and when using different
weights in the meta-analyses (Table S5). Overall richness change values for each 10-km cell are provided for each taxonomic group and
country (Fig. S5) to display of variability in richness change values
and to assess how our methodological approach corrected for differences in sampling effort between time periods. When comparing
1970–1989 vs. 1990–2009, significant spatial autocorrelation was
detected for all taxa in Great Britain (plants, butterflies, hoverflies
and bees), for Dutch plants and hoverflies and for Belgium hoverflies. For Great Britain, significant spatial autocorrelation was also
detected when comparing 1950–1969 vs. 1970–1989 (Table S6). The
degree of autocorrelation did not undermine subsequent calculation
of mean values of change at different spatial scales.
Changes in flower visitor and plant species assemblages up to
1990
Patterns of species assemblage change differed between taxa, countries and time periods. When comparing 1950–1969 (P1) and 1970–
Letter
European plant-pollinator declines have slowed 873
P1
Flower visitors
Other bees
Hoverflies
0
20
40
Butterflies
(d)
(e)
(f)
(g)
(h)
(i)
(j)
(k)
(l)
0
20
40
(c)
40
20
0
–40 –20
Change (%)
60
Great Britain
(b)
(a)
Bumblebees
–40 –20
Change (% )
60
Belgium
P3
1970–1989 vs. 1990–2009
–40 –20
Change (% )
60
Netherlands
P2
P2
1950–1969 vs. 1970–1989
Plants
20
0
Change (%)
–40 –20
40
20
0
–40 –20
20
0
Change (%)
–40 –20
Great Britain
40
60
Change (%)
60
Belgium
Intermediate dependence
Independent of insects
40
60
Dependent on insects
Netherlands
10
km
20
km
40
km
80
km
160
km
Whole
country
10
km
20
km
40
km
80
km
160
km
Whole
country
Figure 1 Change in species richness (estimated weighted mean 95% confidence intervals) of flower visitors and plants through time at different spatial scales. For
most taxa and countries richness change estimates (% of change) of flower visitors and plants were more accentuated between P1 and P2 (the Netherlands, a, g, Belgium,
c, i, and Great Britain, e, k) than between P2 and P3 (the Netherlands, b, h, Belgium, d, j, and Great Britain, f, l). Due to insufficient number of grid cells, results from
some spatial scales are not presented for some groups. The horizontal line represents no change (0%). Filled symbols indicate that change was significantly different from
zero, otherwise symbols are open (see statistical details in Table S2).
© 2013 The Authors. Ecology Letters published by John Wiley & Sons Ltd and CNRS
874 L. G. Carvalheiro et al.
1989 (P2), substantial richness changes were noted in all insect
groups. Butterfly richness fell significantly in all three countries, and
at almost all spatial scales (Fig. 1a,c,e). Substantial declines in bees
were also detected between P1 and P2 in the Netherlands and
Belgium (Fig. 1a,c). In Great Britain, at the few locations for which
available data were sufficient for the comparison of these two time
periods (see Fig. S1.5), declines were also found in bumble bee species richness, whereas the richness of other bees did not change significantly at most scales, even showing a tendency to increase at
relatively coarse scales (Fig. 1e). However, when looking further
back in time (i.e. comparing P0 and P1), richness declines were
found for both bee groups in all three countries (in Great Britain
significant only at the coarsest scale) (see Fig. S2). Moreover, the
spatial homogeneity of bee community species composition
increased significantly in Great Britain between P1 and P2 (Fig. 2g),
suggesting that any increases in richness in non–bumble bees were
driven by expansion of common species. Significant spatial homogenisation of species assemblages was also detected in the Netherlands
for bees and butterflies between P1 and P2 (Fig. 2a,c). Hoverflies
fared better over this period, with no significant richness declines
being detected in any of the countries (Fig. 1a,c,e), and slight
increases at fine spatial scales in the Netherlands (Fig. 1a), but with
significant increases in homogeneity across space (Fig. 2,b,e,h).
For plant assemblages, between P1 and P2, only British native
species richness declined significantly at finer spatial resolutions
(10–40 km; Fig. 1k). No such losses were apparent for the plants
of the Netherlands or Belgium over this period, but in the Netherlands richness declines were detected at the coarsest resolution
(i.e. whole country, Fig. 1g), which may be associated with loss of
species that due to their restricted ranges do not have a major influence on the average values of finer scales. In the Netherlands, we
even detected significant increases in plant richness at finer
(10–40 km) spatial resolutions (Fig. 1g). This increase at local scales,
however, was accompanied by spatial homogenisation of native
communities across space (Fig. 2j,k,i), which suggests that in the
Netherlands locally unique species were replaced by native widespread species (for patterns of change in exotic plants, see Fig. S6).
Plants displayed qualitatively similar patterns of change between
these periods (P1 vs. P2) regardless of their dependence on pollinators (see Figs 1 and 2).
Changes in flower visitor and plant species assemblages since
1990
Over more recent decades (P2: 1970–1989 vs. P3: 1990–2009)
declines in species richness or spatial heterogeneity slowed down
for many of the studied taxa and countries (see Figs. 1 and 2). In
the Netherlands and in Great Britain, bumble bee richness declines
became less accentuated, whereas species richness of other bees
increased significantly at fine and intermediate scales in both Great
Britain and the Netherlands (Fig. 1b,f). Bumble bee richness
increases were also detected in Great Britain at country level
(Fig. 1f), which is associated with the well-documented arrival of
Bombus hypnorum L. (Goulson & Williams 2001). Furthermore, no
further spatial homogenisation of communities was detected for
bees in the Netherlands (Fig. 2a). Dutch butterfly richness declines
also became less accentuated at finer scales (with richness increases
detected at the finest spatial scales in the Netherlands). Only for
Belgian bees and British butterflies was the magnitude of richness
© 2013 The Authors. Ecology Letters published by John Wiley & Sons Ltd and CNRS
Letter
decline maintained over this period, even becoming more accentuated at some spatial scales (Fig. 1d,f). Although butterfly assemblage
homogeneity was high in all three countries in P2, significant
increases were still detected in Belgium and the Netherlands
(Fig. 2c,f), whereas in Great Britain a marked increase in biotic heterogeneity was detected (possibly caused by range contractions of
some previously widespread species) (Fig. 2i). For hoverflies, richness increases were detected at all spatial scales in Belgium, whereas
in Great Britain and the Netherlands no significant changes were
found over this period. The process of spatial homogenisation
essentially stopped for this group (Fig. 2), with only weak increases
in the Netherlands and Great Britain.
Patterns of plant diversity change (richness and similarity) were
also much less marked between the more recent periods P2 and P3
(Figs. and 1 and 2), with rates of diversity change slowing in both
the Netherlands (Fig. 1h, see also Fig. S7) and in Great Britain
(Fig. 1i), where richness declines were no longer detected. Indeed, a
partial recovery of species richness was detected in the Netherlands
at coarse scales, and in Great Britain at finer scales. Homogenisation trends in the Netherlands also became less accentuated (Fig. 2j,
k,l). In Belgium, mild richness increases at finer scales continued to
be detected (Fig. 1j) and increases in spatial homogeneity became
more accentuated (Fig. 2m,n,o).
DISCUSSION
Evaluating how rates of biodiversity loss are changing through time
and space is essential to better understand the role of the different
potential drivers and the effectiveness of mitigation measures.
Although rates of change have been assessed for a few taxa for
which standardised monitoring schemes have been running for several decades (Van Dyck et al. 2009; Brereton et al. 2011), our combination of data sources and novel methods allows, for the first time,
a detailed assessment of shifts in the strength and nature of biodiversity change for several sets of functionally linked taxa. Our findings are encouraging, indicating that declines have slowed or even
been partially reversed in many groups and sites in recent decades.
Although current species communities may be less diverse than in
the past, they still contain many species of considerable value for
conservation (see Table S1). As such, although we may not be able
to reverse species extinctions, the trends here presented help justify
the continuation of investment in conservation.
Comparison with previous studies
Our analyses cover a range of plant and insect taxa across three
countries, but depend on rather indirect methods for inferring
dynamics. However, for taxa, regions and time periods where more
direct surveys have been performed, they largely corroborate our
findings, suggesting that our analytic approaches are robust. Both
butterflies (Thomas et al. 2004; Brereton et al. 2011; de Vries et al.
2012) and bumble bees (Rasmont et al. 2005; Williams & Osborne
2009) have been the subject of recent research, and the previously
documented declines in these groups are reflected here (Fig. 1).
More specifically, the more accentuated rates of decline detected for
Great Britain butterflies in the most recent decades were also
detected by a long-term monitoring scheme (Brereton et al. 2011).
Previous studies also confirm our finding that a large number of
non–bumble bee species have declined in Belgium after the 1950s
Letter
European plant-pollinator declines have slowed 875
Flower visitors
(c)
(b)
(a)
Similarity
0.0 0.2 0.4 0.6 0.8 1.0
Netherlands
0
50
100
200
0
300
50 100
200
0
300
(e)
(d)
50 100
200
300
(f)
Similarity
0.0 0.2 0.4 0.6 0.8 1.0
Belgium
50
0
100
150
200
250
(g)
Similarity
0
200
400
600
800
1000
Dependent on insects
for pollination
Plants
(j)
Similarity
50
100
150
200
250
0
50
100
150
200
250
200
400
600
800
1000
(i)
0
50 100
200
Similarity
600
800
1000
0
Not dependent on insects
for pollination
(l)
50 100
200
0
300
50 100
200
300
(o)
(n)
100
150
200
250
0
50
100
150
200
250
(q)
0
50
100
150
200
250
(r)
0.4
0.6
0.8
1.0
50
(p)
1950–1969
1970–1989
1990–2009
0.0
0.2
Similarity
400
0.0 0.2 0.4 0.6 0.8 1.0
0
Great Britain
200
Intermediate dependence
0
300
(m)
Belgium
0
(k)
0.0 0.2 0.4 0.6 0.8 1.0
Netherlands
0
(h)
0.0 0.2 0.4 0.6 0.8 1.0
Great Britain
0
200
400
600
800
1000
0
200
400
600
800
1000
0
200
400
600
800
1000
Distance between grids (km)
Figure 2 Changes in species compositional similarity (1-bsim) of plants and flower visitors among 10-km grid cells through space and time. Decline in similarity with
distance is presented for bees, hoverflies, butterflies, plants dependent on insects for pollination, plants of intermediate dependence and plants independent of insects for
pollination of the Netherlands (a, b, c, j, k, l, respectively), Belgium (d, e, f, m, n, o) and Great Britain (g, h, i, p, q, r). Strong patterns of spatial homogenisation (i.e.
increases in similarity) were detected between P1 and P2 (a, c, e, i, j, k, l). Lines represent the estimated value of similarity 95% confidence intervals, after removing
the effect of sampling effort (for statistical details see Table S3). Data were insufficient for butterflies in Belgium for time period P1.
© 2013 The Authors. Ecology Letters published by John Wiley & Sons Ltd and CNRS
876 L. G. Carvalheiro et al.
(Jauker et al. 2009). For plants, data from long-term standardised surveys in Great Britain have shown that earlier declines in local plant
richness in many habitats have become far less accentuated after the
1990s (Countryside Survey 2007), corroborating our results.
Although no such standardised analyses were available for the Netherlands or Belgium, previous studies have reported both expansions
of nitrophilous plants and loss of other species in the Netherlands
during P1 and P2 (Tamis et al. 2005). The strong spatial homogenisation and accentuated fine-scale increases in richness found in our
study for the Netherlands (Figs. 1g and 2j,k,l) are hence likely to be
due to a few expanding species. Similar increases in nitrophilous
plants have been noted in Great Britain (Maskell et al. 2010; see also
Smart et al. 2005) and in Belgium (EEA, European Environmental
Agency 2012). In Great Britain, however, the declines at finer scales
detected by our study suggest that any local increases in richness
between P1 and P2 were outweighed by losses of other plants, but
not between earlier periods when richness increased at finer scales
(see Great Britain results for 1930–1950 in Fig. S2).
Earlier comparison of pre- and post-1980 data on NW-European
plant-pollinator dynamics (Biesmeijer et al. 2006) showed declines in
the species richness of both bees and pollinator-dependent plants,
suggesting a potential causal connection between plant and pollinator losses. However, our results suggest that changes are not parallel
in time: although richness declines were detected in most groups at
some point, they occurred in distinct time periods (Fig. 1, Fig. S1).
Differences in intensity of the drivers of change through time and
space (Haines-Young et al. 2003; EEA, European Environment
Agency 2004, 2010; FAO, Food & Agriculture Organization of the
United Nations 2012) and differences in ecological sensitivity of the
different taxa (Reemer 2005; Carvell et al. 2007; Shreeve et al. 2001)
may partly explain the diversity in patterns of change observed.
Also, the different groups analysed here vary in taxonomic scope
from tribe level (Bombini) to superfamilies (Lepidoptera: Papilionidae and Hersperioidea). It is possible that, similarly to what we
report for the bees (Bombini vs. other bees), within each group of
plants, hoverflies or butterflies, certain tribes or families will have
different patterns of change than others, particularly if such tribes
or families have traits (e.g. dispersal ability, diet or habitat specialisation) that may affect species susceptibility to environmental changes.
More detailed data analyses involving species traits are needed to
understand how species assemblage composition has changed in
terms of species traits.
What has changed for plant–flower visitor assemblages after the
1990s?
The majority of the losses in richness (bees and butterflies) and
increases in homogenisation (e.g. plants in the Netherlands) that
were detected between P1 and P2 (i.e. up to the 1990) slowed down
between P2 and P3 (after 1990). Some insect groups even became
more diverse at finer scales (e.g. non–bumble bees in the Netherlands and Great Britain, hoverflies in Belgium) in recent decades.
Range expansions of some generalist species which were previously
restricted (e.g. poleward shifts likely driven by climate warming after
the 1980s, Parmesan et al. 1999) could be masking declines in more
specialised species. However, in most groups, homogenisation patterns also became less accentuated concurrently, indicating that loss
of locally unique species has diminished. For some groups (e.g. butterflies), homogenisation levels were already so high in P2 that fur© 2013 The Authors. Ecology Letters published by John Wiley & Sons Ltd and CNRS
Letter
ther increases in P3 were constrained, but for other groups that
were still spatially heterogeneous in P2 (e.g. Dutch plants, Great
Britain bees), homogenisation processes between P2 and P3 were
far less accentuated than between P1 and P2. In species richness
terms, only butterflies (Belgium, Great Britain) and some Belgian
bees showed declines in recent decades as marked as the changes
between P1 and P2. Differences in environmental conditions, landuse change and in timing of the implementation of management
actions that aim to protect biodiversity (e.g. agri-environmental
schemes) may explain why some regions are performing better than
others in terms of reducing or reversing diversity losses. For example, whereas certain drivers have likely impacted all three countries
similarly (e.g. temperature increases, see EEA, European Environment Agency 2004), patterns of eutrophication, insecticide use and
loss of semi-natural habitat diverged substantially between the countries (Haines-Young et al. 2003; Van Eetvelde & Antrop 2009; EEA,
European Environment Agency 2010; FAO, Food & Agriculture
Organization of the United Nations 2012). As such drivers of
change are likely to be geographically explicit, and patterns of richness change likely depend on regional diversity, the significant spatial autocorrelation detected for some taxa and countries (Table S6)
was expected. The lack of significant spatial autocorrelation for
other taxa and time periods is likely caused by a very restricted and
climatically homogeneous spatial range (e.g. plants and butterflies
analyses in Belgium were restricted to Flanders) or to low number
of spatial locations with good quality data (e.g. bees in Great Britain
for the P1 vs. P2 comparison); although it may also be caused by
drivers of change (e.g. land conversion) operating at finer scales
than the ones here studied. Future detailed analysis involving spatially explicit data on changes in drivers (land use, climate, nitrogen
deposition, etc.) and biodiversity may help disentangle the relative
contribution of these drivers.
Our study shows that haphazardly collected data can be used for
assessing changes in biodiversity loss rates. However, when sampling effort is low (e.g. Belgian butterflies or Great Britain bee comparisons at finer scales between P1 and P2), extraction of
meaningful patterns is sometimes impossible. Moreover, however,
sophisticated our methods, analyses of haphazardly collected data
sets remain vulnerable to shifts in recorder behaviour over time.
Therefore, further investment in long-term fine-scale monitoring
schemes (ideally with standardised methods, modelled on, e.g. the
butterfly, van Swaay et al. 2008) is essential to further evaluate how
multiple drivers are affecting biodiversity throughout the world.
Such monitoring would also allow assessment of abundance trends
(Van Dyck et al. 2009) which cannot be detected using species accumulation methods. Such information is essential for adequate planning of conservation management and assessment of ecosystem
service provision (e.g. crop pollination). Nevertheless, the deceleration of diversity losses demonstrated here suggests that declines in
abundance and function may also be moderating.
The deceleration of biodiversity losses observed could be thought
to be due to the species assemblages remaining in these countries
being composed mostly of fairly resilient species, ones that can tolerate or benefit from anthropogenic disturbances. However, current
species assemblages still bear a substantial number of rare species,
habitat and food specialists, many having a recognised vulnerability
and high value for conservation (see Table S1). It is, therefore,
essential that future studies evaluate how variable are such trends
among other taxa and regions; and that the positive trends here
Letter
presented are used to motivate further research exploring the actual
contribution of each driver (e.g. land-use or climate change) or specific policies (e.g. pesticide use regulation, agri-environmental
schemes) to the improved change trajectories.
Concluding remarks
Europe has some of the world’s most intensively managed landscapes, but in recent decades cropland expansion has decelerated
and even been partially reversed throughout large parts of the continent (EEA, European Environmental Agency 2012). Moreover,
increased public awareness of the consequences of biodiversity loss
has led to increased investment in measures to counteract the most
negative impacts of industrial pollution (EEA, European Environment Agency 2011), habitat destruction and agricultural intensification (EEA, European Environment Agency 2010). Furthermore,
farm payments have led to conversion of cropland into restored
conservation or agri-environmental management areas (Kleijn &
Sutherland 2003; EEA, European Environment Agency 2010). For
such substantial investments to be continued, we need evidence to
assess their effectiveness. Our work helps fill that gap. While we
document declines in species richness and increases in biotic
homogenisation in most groups and taxa in the mid 20th century,
during earlier periods of accentuated loss of natural habitat (HainesYoung et al. 2003; Van Eetvelde & Antrop 2009; EEA, European
Environment Agency 2010; FAO, Food & Agriculture Organization
of the United Nations 2012), and of less investment in conservation
(Kleijn & Sutherland 2003), we find strong indications that many of
these problems have been ameliorated in the most recent two decades since 1990. The species assemblages remaining in these countries will likely continue to bear the marks of past declines for a
long time; yet they remain diverse and contain considerable numbers of specialist and rare species. Thus, while other drivers may
also contribute to the increase in richness in comparatively speciespoor regions (e.g. climate), the slowing of rates of biodiversity loss
(and particularly of biotic homogenisation) during recent decades
constitutes a positive sign indicating that, at least in regions where
large land-use changes leading to natural habitat loss have nearly
stopped, conservation efforts may be paying off.
ACKNOWLEDGEMENTS
We thank UK Biological Records Centre for the data on Great Britain hoverflies; and all volunteers who collected data for the databases analysed here. Sources of data reported in the study are described
in Table S1. We thank Tom van Dooren for advice on data analyses
and help in developing scripts. We thank David Kleijn for useful
comments on an earlier version of this manuscript. This research
was funded by the EU FP7 projects ‘Status and Trends of European
Pollinators’ (244 090, www.STEP-project.net) and “Securing the
Conservation of biodiversity across Administrative Levels and spatial, temporal, and Ecological Scales” (www.scales-project.net) and
Agriland (BB/H014934/1). PK was supported by EU FP7 People
Programme (Marie Curie Actions; REA agreement no 302868).
AUTHORSHIP
L.G.C., W.E.K. and J.C.B compiled data; L.G.C and P.K. developed
scripts for data analyses with suggestions from W.E.K., W.N.E. and
European plant-pollinator declines have slowed 877
J.C.B.; L.G.C. analysed data. The authors named between J.A. and
M.W., are listed alphabetically, as they contributed similarly, gathering data and or preparing it for the analyses and providing information to help with data interpretation. The text was drafted and
revised by L.G.C, W.E.K and J.C.B; all other authors provided corrections to manuscript drafts, and discussed ideas within it.
REFERENCES
Baselga, A. (2010). Partitioning the turnover and nestedness components of beta
diversity. Glob. Ecol. Biogeogr., 19, 134–143.
Biesmeijer, J.C., Roberts, S.P.M., Reemer, R., Ohlemuller, R., Edwards, M.,
Peeters, T., et al. (2006). Parallel declines in pollinators and insect-pollinated
plants in Britain and the Netherlands. Science, 313, 351–354.
Brereton, T., Roy, D.B., Middlebrook, I., Botham, M. & Warren, M. (2011). The
development of butterfly indicators in the United Kingdom and assessments
in 2010. J. Insect Conserv., 15, 139–151.
Butchart, S.H.M., Walpole, M., Collen, B., van Strien, A., Scharlemann, J.P.W.,
Almond, R.E.A., et al. (2010). Global biodiversity: indicators of recent
declines. Science, 328, 1164–1168.
Cardinale, B.J., Duffy, J.E., Gonzalez, A., Hooper, D.U., Perrings, C., Venail, P.,
et al. (2012). Biodiversity loss and its impact on humanity. Nature, 486, 59–67.
Carvell, C., Meek, W.R., Pywell, R.F., Goulson, D. & Nowakowski, M. (2007).
Comparing the efficacy of agri-environment schemes to enhance bumble bee
abundance and diversity on arable field margins. J. Appl. Ecol., 44, 29–40.
Cassey, P., Blackburn, T.M., Lockwood, J.L. & Sax, D.F. (2006). A stochastic
model for integrating changes in species richness and community similarity
across spatial scales. Oikos, 115, 207–218.
CBD, Secretariat of the Convention on Biological Diversity (2010). The Strategic
Plan for Biodiversity 2011-2020 and the Aichi Biodiversity Targets. COP 10 Decision
X/2. Available at: http://www.cbd.int/doc/decisions/cop-10/cop-10-dec-02en.pdf. Last accessed 15 December 2012.
Chao, A., Cahzdon, R.L., Colwell, R.K. & Shen, T. (2005). A new statistical
approach for assessing similarity of species composition with incidence and
abundance data. Ecol. Lett., 8, 148–159.
Colwell, R.K., Chao, A., Gotelli, N.J., Lin, S., Mao, C.X., Chazdon, R.L., et al.
(2012). Models and estimators linking individual-based and sample-based
rarefaction, extrapolation and comparison of assemblages. J. Plant Ecol., 5, 3–21.
Countryside Survey (2007). UK Results from 2007 – Changes in Countryside Vegetation
System Aggregate Classes between 1978, 2007. Available at: http://www.countrysid
esurvey.org.uk/sites/default/files/pdfs/reports2007/CS-UK-Results2007-Chapter
10.pdf. Last accessed 15 December 2012.
EEA, European Environment Agency (2004). Impacts of Europe’s Changing Climate –
An Indicator-Based Assessment. EEA report 2/2004. Available at: http://www.eea.
europa.eu/publications/eea_report_2008_4. Last accessed 15 December 2012.
EEA, European Environment Agency (2010). The European Environment State and
Outlook – Land Use. Available at: http://www.eea.europa.eu/soer. Last
accessed 15 December 2012.
EEA, European Environment Agency (2011). Greenhouse Gas Emissions in Europe:
A Retrospective Trend Analysis for the Period 1990–2008. EEA report 6/2011.
Available at: http://bookshop.europa.eu/en/greenhouse-gas-emissions-ineurope-pbTHAL11006/?CatalogCategoryID=znMKABstX5IAAAEjs5AY4e5L.
DOI: 10.2800/81509.
EEA, European Environmental Agency (2012). Corine Land Cover 2000 by
Country. Available at: http://www.eea.europa.eu/data-and-maps/figures/
corine-land-cover-2000-by-country/. Last accessed 27 September 2012.
FAO, Food and Agriculture Organization of the United Nations (2012).
FAOSTATS. Available at: http://faostat.fao.org/site/567/default.aspx#ancor.
Last accessed 20 September 2012.
Garcillan, P.P. & Ezcurra, E. (2011). Sampling procedures and species
estimation: testing the effectiveness of herbarium data against vegetation
sampling in an oceanic island. J. Veg. Sci., 22, 273–280.
Gotelli, N.J. & Colwell, R.K. (2001). Quantifying biodiversity: procedures and
pitfalls in the measurement and comparison of species richness. Ecol. Lett., 4,
379–391.
© 2013 The Authors. Ecology Letters published by John Wiley & Sons Ltd and CNRS
878 L. G. Carvalheiro et al.
Goulson, D. & Williams, P.H. (2001). Bombus hypnorum (Hymenoptera: Apidae), a
new British bumblebee? Br. J. Entomol. Nat. Hist., 14, 129–131.
Haines-Young, R., Barr, C.J., Firbank, L.G., Furse, M., Howards, D.C.,
McGowan, G., et al. (2003). Changing landscapes, habitats and vegetation
diversity across Great Britain. J. Environ. Manage., 67, 267–281.
Hartung, J., Knapp, G. & Sinha, B.K. (2008). Statistical Meta-Analysis with
Applications. John Wiley & Sons, Inc., Hoboken, New Jersey, p. 248.
Hellmann, J.J. & Fowler, G.W. (1999). Bias, precision, and accuracy of four
measures of species richness. Ecol. Appl., 9, 824–834.
Isbell, F., Calcagno, V., Hector, A., Connolly, J.W., Harpole, S., Reich, P.B., et al.
(2011). High plant diversity is needed to maintain ecosystem services. Nature,
477, 199–203.
Jauker, F., Diekotter, T., Schwarzbach, F. & Wolters, V. (2009). Pollinator
dispersal in an agricultural matrix: opposing responses of wild bees and
hoverflies to landscape structure and distance from main habitat. Landscape
Ecol., 24, 547–555.
Keil, P., Biesmeijer, J.C., Barendregt, A., Reemer, M. & Kunin, W.E. (2010).
Biodiversity change is scale-dependent: an example from Dutch and UK
hoverflies (Diptera, Syrphidae). Ecography, 33, 1–10.
Kleijn, D. & Sutherland, W.J. (2003). How effective are European agrienvironment schemes in conserving and promoting biodiversity? J. Appl. Ecol.,
40, 947–969.
Lennon, J.J., Koleff, P., Greenwood, J.J.D. & Gaston, K.J. (2001). The
geographical structure of British bird distributions: diversity, spatial turnover
and scale. J. Anim. Ecol., 70, 966–979.
Maskell, L.C., Smart, S.M., Bullock, J.M., Thompson, K. & Stevens, C.J. (2010).
Nitrogen deposition causes widespread loss of species richness in British
habitats. Glob. Chang. Biol., 16, 671–679.
Parmesan, C., Ryrholm, N., Stefanescu, C., Hill, J.K., Thomas, C.D., Descimon,
H., et al. (1999). Poleward shifts in geographical ranges of butterfly species
associated with regional warming. Nature, 399, 579–583.
Pereira, H.M., Leadley, P.W., Proenca, V., Alkemade, R., Scharlemann, P.W.,
Fernandez-Manjarres, J.F., et al. (2010). Scenarios for Global Biodiversity in
the 21st Century. Science, 330, 1496–1501.
Pinheiro, J., Bates, D., DebRoy, S. & Sarkar, D., the R Development Core Team
(2012). nlme: Linear and Nonlinear Mixed Effects Models. R package version 3.1-105.
Available at: http://cran.open-source-solution.org/web/packages/nlme/nlme.
pdf. Last accessed 15 December 2012.
R Development Core Team (2012). R: A Language and Environment for Statistical
Computing. R Foundation for Statistical Computing. Available at: http://www.
R-project.org. Last accessed 15 December 2012.
Rasmont, P., Pauly, A., Terzo, M., Patiny, S., Michez, D. & Iserbyt, S., et al.
(2005). The Survey of Wild Bees (Hymenoptera, Apoidea) in Belgium and France.
Rapport d’activite , UMH - FUSAGx - FAO. Available at: http://www.gembloux.
ulg.ac.be/entomologie-fonctionnelle-et-evolutive/wp-content/uploads/2012/07/
1597.pdf. Last accessed 15 December 2012.
Reemer, M. (2005). Saproxylic hoverflies benefit by modern forest management
(Diptera, Syrphidae). J. Insect Conserv., 9, 49–59.
Shreeve, T.G., Dennis, R.L.H., Roy, D.B. & Moss, D. (2001). An ecological
classification of British butterflies: ecological attributes and biotope occupancy.
J. Insect Conserv., 5, 145–161.
© 2013 The Authors. Ecology Letters published by John Wiley & Sons Ltd and CNRS
Letter
Smart, S.M., Bunce, R.G.H., Marrs, R., LeDuc, M., Firbank, L.G., Maskell, L.C.,
et al. (2005). Large-scale changes in the abundance of common higher plant
species across Britain between 1978, 1990 and 1998 as a consequence of
human activity: tests of hypothesised changes in trait representation. Biol.
Conserv., 124, 355–371.
ter Steege, H., Haripersaud, P.P., Banki, O.S. & Schieving, F. (2011). A Model of
botanical collectors behavior in the field - never the same species twice. Am.
J. Bot., 98, 31–37.
van Swaay, C.A.M., Nowicki, P., Settele, J. & van Strien, A.J. (2008). Butterfly
monitoring in Europe: methods, applications and perspectives. Biodivers.
Conserv., 17, 3455–3469.
Tamis, W.L.M., van’t Zelfde, M., van der Meijden, R. & de Haes, H.A.U. (2005).
Changes in vascular plant biodiversity in the Netherlands in the 20th century
explained by their climatic and other environmental characteristics. Clim.
Change, 72, 37–56.
Thomas, J.A., Telfer, M.G., Roy, D.B., Preston, C.D., Greenwood, J.J.D., et al.
(2004). Comparative losses of British butterflies, birds, and plants and the
global extinction crisis. Science, 303, 1879–1881.
Van Dyck, H., van Strien, A.J., Maes, D. & van Swaay, C.A.M. (2009). Declines
in common, widespread butterflies in a landscape under intense human use.
Conserv. Biol., 23, 957–965.
Van Eetvelde, V. & Antrop, M. (2009). Indicators for assessing changing
landscape character of cultural landscapes in Flanders (Belgium). Land Use
Policy, 26, 901–910.
Viechtbauer, W. (2010). Conducting meta-analyses in R with the metafor
package. J. Stat. Softw., 36, 1–48.
Wallis de Vries, M.F., Swaay, C.A.M. & Plate, C.L. (2012). Changes in nectar
supply: a possible cause of widespread butterfly decline. Current Zoology, 58,
384–391.
Whittaker, R.J., Willis, K.J. & Field, R. (2001). Scale and species richness: towards a
general, hierarchical theory of species diversity. J. Biogeogr., 28, 453–470.
Williams, P.H. & Osborne, J.L. (2009). Bumblebee vulnerability and conservation
world-wide. Apidologie, 40, 367–387.
SUPPORTING INFORMATION
Additional Supporting Information may be downloaded via the online
version of this article at Wiley Online Library (www.ecologyletters.com).
Editor, Yvonne Buckley
Manuscript received 14 February 2013
First decision made 26 March 2013
Manuscript accepted 7 April 2013


© Copyright 2026