
Urban agriculture, poverty, and food security: Empirical evidence
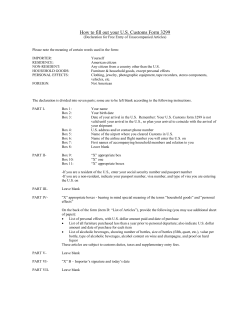
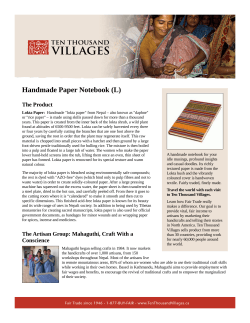
Food Policy 35 (2010) 265–273
Contents lists available at ScienceDirect
Food Policy
journal homepage: www.elsevier.com/locate/foodpol
Urban agriculture, poverty, and food security: Empirical evidence
from a sample of developing countries
Alberto Zezza *, Luca Tasciotti
Agricultural Development Economics Division, Food and Agriculture Organization (FAO), Viale delle Terme di Caracalla, 00153 Rome, Italy
a r t i c l e
i n f o
Article history:
Received 19 August 2009
Received in revised form 15 April 2010
Accepted 20 April 2010
Keywords:
Urban agriculture
Food security
Poverty
Nutrition
Household surveys
a b s t r a c t
Urban agriculture may have a role to play in addressing urban food insecurity problems, which are bound
to become increasingly important with the secular trend towards the urbanization of poverty and of population in developing regions. Our understanding of the importance, nature and food security implications of urban agriculture is however plagued by a lack of good quality, reliable data. While studies
based on survey data do exist for several major cities, much of the evidence is still qualitative if not anecdotal. Using a recently created dataset bringing together comparable, nationally representative household survey data for 15 developing or transition countries, this paper analyzes in a comparative
international perspective the importance of urban agriculture for the urban poor and food insecure. Some
clear hints do come from our analysis. On the one hand, the potential for urban agriculture to play a substantial role in urban poverty and food insecurity reduction should not be overemphasised, as its share in
income and overall agricultural production is often quite limited. On the other hand, though, its role
should also not be too easily dismissed, particularly in much of Africa and in all those countries in which
agriculture provides a substantial share of income for the urban poor, and for those groups of households
to which it constitutes an important source of livelihoods. We also find fairly consistent evidence of a
positive statistical association between engagement in urban agriculture and dietary adequacy
indicators.
Ó 2010 Elsevier Ltd. All rights reserved.
Introduction
Urban agriculture (UA) is defined as the production of crop and
livestock goods within cities and towns. According to some accounts, 200 million people are employed in urban farming and related enterprises, contributing to the food supply of 800 million
urban dwellers (UNDP, 1996). In African countries 40% of urban
dwellers are said to be engaged in some sort of agricultural activity
and this percentage rises to 50% in Latin American countries (see
studies quoted in Ruel et al. (1998)).
If these numbers are accurate (and they may well not be, as we
discuss in this paper), urban agriculture may have a role to play in
addressing urban food insecurity problems, which are bound to become increasingly important with the secular trend towards the
urbanization of poverty and of the overall population in developing
regions. Ravallion et al. (2007) estimate that about one-quarter of
the developing world’s poor live in urban areas, but also that poverty is becoming more urban and the poor are urbanizing faster
than the population as a whole.
* Corresponding author. Tel.: +39 06 570 539 23; fax: +39 06 570 555 22.
E-mail addresses: [email protected], [email protected] (A. Zezza), luca.
[email protected] (L. Tasciotti).
0306-9192/$ - see front matter Ó 2010 Elsevier Ltd. All rights reserved.
doi:10.1016/j.foodpol.2010.04.007
The recent world food price crisis has rendered the importance
of understanding and confronting the causes of food insecurity of
the urban poor even more apparent. Poor urban dwellers, being
largely net food buyers and depending mostly on markets for their
food supplies, are particularly vulnerable to adverse food price
shocks, and are consistently the group in society that suffers most
from higher food prices (Zezza et al., 2008; Dessus et al., 2008).
Analyzing the extent to which urban agriculture might help shield
the urban poor from some of these shocks becomes therefore a
topical policy question.
Our understanding of the importance, nature and food security
implications of urban agriculture is however hindered by a lack of
good quality, reliable data. While studies based on survey data do
exist for several major cities, much of the evidence is still qualitative if not anecdotal. This paper attempts to fill some of the key research gaps in this area, using a recently created dataset bringing
together comparable, nationally representative household survey
data for 15 developing or transition countries. Exploiting the
wealth of data made available by the dataset, the paper analyzes,
in a comparative international perspective, the importance of
urban agriculture for the urban poor and food insecure.
The paper sets out to address two basic research questions: (i)
which is the magnitude of urban agriculture, both in terms of
266
A. Zezza, L. Tasciotti / Food Policy 35 (2010) 265–273
households engaged in agricultural activities and in terms of income deriving from it, and (ii) is there evidence of any significant
relationship between urban agriculture on household food security, dietary diversity and calories intake.
After a brief review of the literature (Section ‘‘The importance
and role of urban agriculture: facts and artefacts. A brief review
of the literature”), and a discussion of data and definitions, the paper sets out to quantify (Section ‘‘Opening the urban agriculture
black box: what the data say”) the importance of urban agriculture
in terms of urban households’ participation in agricultural activities; the share of income rural households generate from farming
(in particular with reference to the poor); and the relative importance of crop versus livestock production. In Section ‘‘Urban agriculture and food security”, both descriptive statistics and
multivariate analysis are used to gauge how participation in urban
agriculture impacts dietary diversity and calorie intake. The key
findings and policy conclusions of the paper are briefly outlined
in the final Section.
The importance and role of urban agriculture: facts and
artefacts. A brief review of the literature
Characterising urban agriculture
In this paper urban agriculture is defined as the production of
agricultural goods by urban residents, according to the official definition of the urban space utilised by the surveys we work with.
Our definition is eminently driven by the definition of rurality
adopted by national governments and reflected in our dataset,
and we do not deal with the conceptual definitional issues discussed for instance by Maxwell (2003), FAO (1996) and Ellis and
Sumberg (1998).
The two main problems with our dataset (further described in
the next section) are (a) the comparability of the definition of urban and rural across countries, and (b) that we have information
on where the household resides, not necessarily on where their
agricultural production is located. In that sense we should be
strictly speaking of ‘agriculture practiced by urban households’.
But having made those caveats, we will for simplicity stick to the
standard expression ‘urban agriculture’.1
One of the objectives of this paper is to attempt a rigorous quantification of the magnitude of urban agriculture in a reasonably
large cross-section of countries, responding to the need for more efforts in this direction expressed by several of the authors who have
contributed to this literature (Nugent, 2001; Egal et al., 2001; Ellis
and Sumberg, 1998). Possibly the most widely cited claim concerning urban agriculture is that ‘‘the United Nations Development Programme estimates that 800 million people are engaged in urban
agriculture world-wide” (Mougeot (2000); but see also Armar-Klemesu (2001) and Nelson (1996)). Tracing this source backward in
time we arrived at UNDP (1996). Their Table 2.1 reports the following estimates: 800 million people actively engaged in urban agriculture, of which 200 million produce goods for market sale, with
a full-time job equivalent estimate in production and processing
of 150 million jobs. The source of the table is however ‘‘estimates
by the Urban Agriculture Network based on the authors’ experiences and observations and extrapolation from data”. The authors
also caution that their intent is simply to ‘‘present a thumbnail
sketch” and that a more systematic estimation would be needed.
Unfortunately many of their readers and citers have overlooked this
caveat and the figures are frequently quoted as hard evidence. This
may be partly due to the fact that one substantial strand of the literature on urban agriculture is driven by an advocacy objective,
1
We also cannot make any distinction between urban and peri-urban areas.
more than by analytical rigour (Ellis and Sumberg, 1998). A very different figure is quoted by FAO (1996), which states (ironically quoting again a UNDP publication) that 100 million people are
estimated to earn some income directly from urban farming (one
eighth of the 800 million urban agriculture producers and one half
of the 200 million commercial urban farmers recalled above).
Rigorous quantifications are in fact available, but mostly for
case studies. Reviews of these case studies can be found in Egziaber
et al. (1994), FAO (1996), Ellis and Sumberg (1998) and van
Veenhuizen (2006). An annotated bibliography of 170 pages compiled by Sida and ETC (2003) also provides an interesting overview
of the available figures as well as of the magnitude and directions
in which the urban agriculture literature has expanded. Figures
vary widely between and within countries and regions, and differences in definitions and methodologies compound the uncertainty.
Urban agriculture and food security
One major theme of the literature on urban agriculture is the
discussion of how it can contribute to the food security and nutrition of cities as a whole, and of the households that are engaged in
farming within urban boundaries.
One distinction that is often made in the literature refers to the
extent to which urban households that engage in agriculture have
some degree of market orientation or are purely producing agricultural goods for own-consumption. There seems to be a consensus,
based on case study reviews, that the direct food security purpose
prevails, but that a substantial number of urban farmers also sell
their produce on the market, and more so in Latin America than
in Africa (Maxwell, 2003; Ellis and Sumberg, 1998).
There are a number of ways through which urban agriculture
can, in principle, have an impact on urban food security. At the
household level, urban agriculture can be a source of income, can
provide direct access to a larger number of nutritionally rich foods
(vegetables, fruit, meat) and a more varied diet, can increase the
stability of household food consumption against seasonality or
other temporary shortages, and can increase the time mothers
spend caring for their children, as opposed to non-agricultural
activities that are more likely to be located further away from
home (Maxwell, 2003; Maxwell et al., 1998; Armar-Klemesu,
2001; Egal et al., 2001). There is also some evidence, again based
on case studies, that it is the poor households that are mostly engaged in UA, although not necessarily the poorest, which may lack
access to land (Ruel et al., 1998).
Moving beyond the household to a more aggregate level, urban
agriculture can account for an important share of the production of
some foods, particularly the more perishable ones such as vegetables and milk, and there is evidence that this is indeed the case in
several of the case studies mentioned above.2
Despite the relatively large number of studies that have looked at
the link between UA and food security, the amount of quantitative
work that has been published is surprisingly limited. We could only
identify one paper (Maxwell et al., 1998) that explored this link using
a multivariate framework. Their findings, based on data from Kampala, indicate that there is indeed an impact of UA on child nutritional status, an outcome indicator of food and nutrition security.
Data and definitions
As previously mentioned, this study is fundamentally different
from any other study on urban agriculture we are aware of in as
much as it uses (a) nationally representative data; (b) a compara2
Nugent (2001) reports on the importance of urban agriculture for some of these
foods in a number of cities worldwide.
A. Zezza, L. Tasciotti / Food Policy 35 (2010) 265–273
ble definition of agricultural activities; and (c) a comparative international perspective.
The data in this study does not allow dealing with another
dimension of comparability, which is the definition of what constitutes an urban area. Countries have their own unique mechanisms
of defining what constitutes urban or rural, and these mechanisms
determine the definition of urban and rural in the dataset used. On
the other hand, it may make sense to use government definitions
since presumably these reflect local information about what constitutes rural and is the definition used to administer government
programs.
One additional important caveat is that with the information
available we identify an agricultural activity to be urban via the
domicile of the household, not the location of the activity. It is probable that a number of what we identify as urban agriculture activities in this study are in fact taking place in nearby rural areas. In
that sense the study/discussion focuses on urban households’
involvement in agriculture, rather than strictly urban agricultural
activities, and for that reason our results may not be fully comparable with other studies on urban agriculture which only include crop
and livestock activities taking place within the city boundaries.
A narrow definition of agriculture is used, whereby agricultural
income accounts for the sale of crops and livestock, crop and livestock by-products, sharecropping earnings, the consumption of
home-grown crops and livestock products, net of all expenditures
related to these activities, such as seed and fertilizer purchases
and the hire of farm labour. Participation in agriculture is defined
as the production of any crop or livestock product, whether for sale
or for own-consumption. Activities related to the marketing and
processing of agricultural goods are therefore not included in our
definition of urban agriculture.
Our analysis is based on the Rural Income Generating Activities
(RIGA) database, which is constructed from a pool of several Living
Standards Measurement Study (LSMS) and other multi-purpose
household surveys made available by the World Bank and other
national and international institutions. The choice of countries to
be included in the dataset was guided by the desire to ensure geographic coverage across the four principal development regions –
Asia, Africa, Eastern Europe and Latin America, as well as adequate
quality and sufficient comparability in codification and nomenclatures. Furthermore, an effort was made to include a number of IDA
(International Development Association) countries as these represent developing countries with higher levels of poverty and are
therefore of particular interest to the development and poverty
reduction debate.
Using these criteria, survey data from the following countries
were utilized (corresponding survey years in parentheses): Ghana
(1998), Madagascar (2001), Malawi (2004), Nigeria (2004); Bangladesh (2000), Indonesia (2000), Nepal (2003), Pakistan (2001), Vietnam (1998); Albania (2005), Bulgaria (2001); Ecuador (1995),
Guatemala (2000), Nicaragua (2001), Panama (2003). While clearly
not representative of all developing countries, the list does represent a significant range of countries and regions and has proved
useful in providing insights into the fundamental aspects of livelihood strategies of households in the developing world (Davis et al.,
2010; Winters et al., 2009; Valdés et al., 2009).
The RIGA database consists of income and household characteristic variables that were constructed by using uniform definitions
and data handling protocols, drawing on data that are collected
using broadly similar survey instruments. Clearly some differences
in questionnaire design across countries remain, but the degree of
comparability in the RIGA data is very high.3 While most of these
3
Details of the construction of the income aggregates can be found in Carletto et al.
(2007). The RIGA data and their full documentation can be obtained at http://
www.fao.org/es/ESA/riga/.
267
data are fairly recent (collected within the last decade), three of
them were collected in the 1990s. In the presence of rapid urban
transformation, the picture we paint for a few of the countries covered by our data may therefore have become out of date.4
Opening the urban agriculture black box: what the data say
The first research question of the paper, i.e. the quantification of
the magnitude of the UA phenomenon in a cross-section of countries is addressed in this section. To quantify the magnitude of
UA in the countries at hand we first look at the rates of participation in, and the shares of income from, urban agriculture.5 The nature of our data also allows us to separate agriculture into crop and
livestock activities. The picture that emerges from these data is one
of an extreme variation (Table 1). The shares of urban households
that earn income from agriculture vary from 11% in Indonesia to almost 70% in Vietnam and Nicaragua. In 11 of the 15 countries in
our dataset, the share of households participating is over 30%. In
general livestock activities are less common than cropping activities, but there are cases (Bangladesh, Nepal, Ecuador and Nicaragua) in which livestock is reared by about one in three urban
households.
The income shares coming from urban agriculture are, as expected, smaller than the participation rates (Table 2). They range
from 1% to 27%, but they are higher than 10% in just five cases
(Ghana, Madagascar, Malawi, Nepal and Nigeria).
Looking at regional patterns, no clear regularity can be found in
terms of participation rates, while it is interesting to note that it is
the four African countries in the sample that display the four largest
income shares. Should this result be representative of Africa at large,
one may indeed be inclined to conclude that urban agriculture is a
significant source of livelihoods for urban households in that continent. Outside of Africa, the highest share of income in our dataset are
in Nepal at 11% and Vietnam at 9%, with most other countries displaying shares of 5% of less, and in several cases much lower.
It needs to be emphasised however that these averages across
the urban population may mask the fact that there are particular
groups in urban areas for which agriculture makes up a sizeable
share of their livelihoods. When only households engaged in urban
agriculture are taken into consideration, average shares of income
from primary activities are in fact much more substantial. The African countries still top the table, but three of the five Asian countries also have shares around 20% or greater and another three
countries have shares over 10% (see third column in Table 2).
For between 18% and 24% of all urban households in the African
countries in the sample agriculture constitutes 30% of total income
or more. The same is true for 13% of urban households in Nepal,
and for 7–10% of households in Guatemala, Nicaragua and Vietnam
(fourth column in Table 2).
These results show how urban agriculture – while by no means
negligible – does not appear to be the major urban economic activity that some of its most enthusiastic advocates sometimes claim it
to be. On the other hand, the data do confirm that in a number of
countries there is a significant share of the urban population that
relies on the production of crop and livestock products for their
livelihoods.
By decomposing participation rates and income shares by quintile of expenditure levels (our preferred welfare measure) we find
4
For a couple of countries (Nepal, Madagascar) we have analyzed survey data from
earlier years. From the comparison we gained further confidence that while the
specific country situations may certainly be changing over-time, the results of the
overall cross-country analysis that is the focus of this paper would not be significantly
affected if we were to substitute our older datasets with more recent ones.
5
In this paper the definition of income includes also income in kind as well the
production of goods for own-consumption by the household.
268
A. Zezza, L. Tasciotti / Food Policy 35 (2010) 265–273
Table 1
Participation in urban agriculture.
Country and year
Total % participation in crop
activities (urban sample)
Total % participation in livestock
activities (urban sample)
Total % participation in agricultural
activities (urban sample)
Total % participation in
agricultural activities
(rural sample)
Africa
Ghana 1998
Madagascar 2001
Malawi 2004
Nigeria 2004
38
30
45
29
14
13
14
12
41
33
46
32
89
85
97
90
Asia
Bangladesh 2000
Indonesia 2000
Nepal 2003
Pakistan 2001
Vietnam 1998
26
10
52
4
65
14
3
36
13
35
30
11
57
14
69
90
64
98
74
99
Eastern Europe
Albania 2005
Bulgaria 2001
18
23
10
13
19
27
95
78
Latin America
Ecuador 1995
Guatemala 2000
Nicaragua 2001
Panama 2003
Mean
Max
Min
17
35
65
31
33
65
4
28
21
29
12
18
36
3
35
42
68
34
37
69
11
93
93
95
87
88
99
64
Table 2
Share of total income from agriculture.
Country and year
Share of total income
from agriculture (urban
sample)
Share of total income from agriculture
(urban sample and hhs participating in
urban agriculture)
% of hhs with income coming from urban
ag. equal or higher than 30% (50%) (urban
sample)
Share of total income
from agriculture (rural
sample)
Africa
Ghana 1998
Madagascar 2001
Malawi 2004
Nigeria 2004
18
21
12
27
44
63
26
71
23
21
18
24
61
68
77
80
Asia
Bangladesh 2000
Indonesia 2000
Nepal 2003
Pakistan 2001
Vietnam 1998
3
3
11
3
9
9
27
19
22
13
Eastern Europe
Albania 2005
Bulgaria 2001
3
2
Latin America
Ecuador 1995
Guatemala 2000
Nicaragua 2001
Panama 2003
2
5
5
1
(20)
(18)
(12)
(23)
(2)
(3)
(8)
(4)
(7)
37
35
51
41
62
14
8
3 (1)
5 (4)
43
20
4
11
8
3
3 (2)
9 (5)
7 (4)
1 (0.5)
23
50
57
35
confirmation that urban agriculture is eminently an activity practiced by the poor. With very few exceptions, a clear negative correlation between participation in agricultural activities and level of
welfare is noted. Participation rates for the poorest quintile are extremely high, over 50% in 8 out of 15 countries, proving how urban
agriculture plays an important role for a non-negligible number of
poor households in the developing world (Fig. 1).
The importance of the role played by urban agriculture activities can be best perceived by looking at the shares of income derived from agricultural activities in urban areas across quintiles
of the consumption expenditure distribution (Fig. 2). The picture
that emerges, points to a stark contrast between the African countries in our dataset and other regions. Ghana, Madagascar and
Nigeria stand out with over 30% of the income of the poorest quin-
3
5
13
5
10
tile originating in agriculture, but rates higher than 20% are also
found in the poorer strata of the Malawi sample as well. Outside
of Africa, only a handful of the Guatemala, Nepal and Vietnam
quintiles display shares surpassing 10%, with all the others well below that mark. Again, should this picture be confirmed by a larger
cross-section of countries, it is hard to see UA playing a substantial
role in poverty alleviation outside of Africa.6 Also, no clear pattern
seem to emerge from these data in terms of how participation and
income shares may evolve with the level of development (e.g. a
6
One caveat is that our data being nationally representative, we cannot rule out
that agriculture may be playing a more substantial role in some specific urban
settings within a country.
269
A. Zezza, L. Tasciotti / Food Policy 35 (2010) 265–273
90
80
70
60
50
40
30
20
10
M
ad
ag
M
al
aw
i2
00
4
as
ca
Ba
r
ng
20
la
01
de
sh
20
00
N
ep
al
20
03
G
ha
na
19
Vi
98
et
na
m
19
N
98
ig
er
ia
20
Pa
04
ki
st
an
N
20
ic
ar
01
ag
ua
In
20
do
01
ne
si
a
G
20
ua
00
te
m
al
a
20
Al
00
ba
ni
a
20
Ec
05
ua
do
r1
Bu
99
lg
5
ar
ia
2
Pa
00
na
1
m
a
20
03
0
Poorest quintile
2nd
3nd
4th
5th
Fig. 1. Percentage of households participating in urban farming, by expenditure Quintile. Note: The bars correspond to expenditure quintiles, from the poorest (‘Poorest
quintile’, on the left) to the richest (‘5th’, on the right). Countries are ordered by level of Purchasing Power Parity GDP per capita.
60
50
40
30
20
10
Poorest quintile
03
a
m
na
Pa
ar
lg
Bu
20
01
5
ia
r1
do
ua
Ec
20
99
05
00
20
a
Al
ba
ni
al
G
ua
te
m
si
ne
do
20
00
a
20
01
a
20
01
ua
2nd
In
ar
N
ic
Pa
ki
st
ag
an
20
20
04
98
N
ig
er
ia
m
na
Vi
et
na
19
19
98
03
20
ha
al
ep
N
G
1
sh
r2
de
ca
Ba
ng
la
as
ag
ad
M
20
00
4
00
i2
aw
al
M
00
0
3nd
4th
5th
Fig. 2. Share of income from urban agriculture, by expenditure quintile. Note: The bars correspond to expenditure quintiles, from the poorest (‘Poorest quintile’, on the left) to
the richest (‘5th’, on the right). Countries are ordered by level of Purchasing Power Parity GDP per capita.
possible decline in participation and income share as GDP levels increase), but this may also be due to the small sample size.
A final point concerns the quantification of the role of urban
agriculture as a proportion of total agricultural production and
its degree of market orientation (Table 3). According to the data
in the surveys we use, in most countries urban agriculture accounts for 5–15% of total agricultural production with peaks above
20% in Madagascar and Nicaragua and a low of 3% in Malawi.7 A
common feature of urban agriculture in most countries appears
to be that it is largely geared towards own-consumption. In only
four of the countries in our sample (Madagascar, Bangladesh, Nepal
and Nicaragua) is more than a third of agricultural production marketed. In another seven countries sales account for between 15%
and 26% of the total volume of agricultural production. In the
remaining two countries for which this could be computed as
7
It should be noted that large commercial farms tend not to be sampled in LSMStype surveys. To the extent that these farms are concentrated in rural areas, this may
induce an upward bias in our estimates of the share of urban agricultural production.
The bias will be greater the larger the commercial farm sector in each country.
much as 92% to 93% of the production is consumed within the
household.
Urban agriculture and food security
Urban agriculture, as explained in Section ‘‘The importance and
role of urban agriculture: facts and artefacts. A brief review of the
literature”, can have a positive impact on household food security
as it generates direct income for the household concerned as well
as providing direct access to the food produced. Households that
engage in farming may have access to comparatively cheaper food
and to a wider variety of particularly nutritious foods, such as vegetables and products of animal origin (milk, eggs, meat). The latter
mechanism may be particularly relevant should urban food markets, particularly in the poorer neighbourhoods, be inefficient. Under such conditions direct access to food may allow households to
consume greater amounts of food and a more diversified diet, richer in valuable micronutrients.
In this section we analyse whether this is the case, by looking at
the correlation between participation in agricultural activities
270
A. Zezza, L. Tasciotti / Food Policy 35 (2010) 265–273
Table 3
Urban agriculture: share in total production and percentage marketed.
Urban production/total ag.
production (%)
Urban ag.
production sold (%)
Africa
Ghana 1998
Madagascar 2001
Malawi 2004
Nigeria 2004
15
27
3
5
26
39
15
17
Asia
Bangladesh 2000
Indonesia 2000
Nepal 2003
Pakistan 2001
Vietnam 1998
7
15
13
n/a
8
35
n/a
34
n/a
26
Eastern Europe
Albania 2005
Bulgaria 2001
7
13
24
7
Latin America
Ecuador 1995
Guatemala 2000
Nicaragua 2001
Panama 2003
8
15
22
12
17
15
45
8
where Outcome is our dietary diversity measure (simple count of
food or food groups for models 1 and 2 respectively), or total calorie
consumption (model 3), p_onfarm is the dummy variable indicating
whether the household participates in agriculture, and X is a vector
of household demographic and socio-economic control variables
including per capita consumption expenditure, land ownership in
hectares, household size, education and age of the household head,
the female share of the working age adults and the number of children aged between 0 and 5. The regressions also include a set of
geographic dummy variables, and square terms for the age and education variables and e, an independently, identically distributed error term. Households’ identifiers are omitted from the notation for
simplicity.
Model 4 is different in that is consists of a system of simultaneous equations, specified as follows:
Kilocaloriesf ¼ a0f þ a1f p onfarm þ a2f X þ ef
subject to the constraint that
10
X
a1f n p onfarm ¼ 0
f ¼1
within urban areas and a series of indicators of dietary adequacy.
We will first look at two dietary diversity indicators for which
we have data for the full set of countries. Dietary diversity is often
used as a food security proxy in nutrition surveys, and has been
generally found to be closely correlated to both caloric adequacy
(the amount of kilocalories consumed) and anthropometric
outcomes (for a review see Ruel (2006)). We use two measures
of dietary diversity. One is based on 13 food groups, including a
food group to account for prepared foods that could not be
otherwise classified, which are listed in Appendix Table 1. We will
refer to this as model 1 in what follows. The second is a simple
count of the different food items household report having consumed during the survey reference period. This is our model 2.
Appendix Table 2 reports key summary statistics for the dietary
diversity variables as well as synthetic information on the questionnaire design (number of items listed, recall period, type of
survey instrument used).
We then perform a somewhat more detailed analysis of a subset of four countries (Malawi, Bangladesh, Guatemala and Nicaragua) for which data on kilocalorie consumption were available.
For these four countries we also investigate whether any association can be detected between engagement in urban agriculture
and (a) the total amount of kilocalories per capita consumed
(model 3) and (b) changes in the composition of the diets as measured by share of calories from different major food groups (model 4).
As previously mentioned we could only find one study (Maxwell et al., 1998) that investigates the link between UA and food
security in a multivariate framework, using child nutritional status
as the dependent variable. Our dependent variables are however
different, and they allow us to look at only part (albeit a large part)
of the food security picture. In fact dietary diversity and kilocalorie
consumption are the product of the food access, availability, and
stability dimensions of food security, but do not reflect the dimension concerning the utilization of food, its preparation, and care
and sanitation practices that are instead subsumed in anthropometric indicators.
The analytical model used is very simple, and builds on the conceptual links between household food security and participation in
urban agriculture previously outlined. Models 1–3 are thus specified as follows:
where Kilocaloriesf are the amount of kilocalories consumed for each
of 10 food groups, f. The constraint allows quantifying how the composition of food consumption changes with participation in agriculture keeping the total amount of kilocalories constant. The other
variables are defined as in Eq. (1) above.
The models are run separately for the full urban sample for each
country, so that we have 15 regressions in total for each of models
1 and 2, and four regressions each for models 3 and 4. As it would
be cumbersome to report the complete results for all the regressions, we summarise in Table 4 the results related to the main
explanatory variable of interest, participation in urban
agriculture.8
After introducing the set of controls specified above, we do
find evidence that engagement in farming in urban areas is positively associated with greater dietary diversity in 10 out of 15
countries when it is measured using the dietary diversity score,
and in 11 out of 15 when it is measured with the simple food
count. Positive and significant coefficients are found in at least
one model specification in the four Latin American countries,
the five Asian ones, Nigeria and Ghana in Africa, and in Albania
and Bulgaria.9
These results provide a fairly robust confirmation of earlier suggestions of city case studies, nutritional surveys, and qualitative
and anecdotal observations, that engagement in farming by urban
households can allow them consuming better, more nutritious
diets. The magnitude of the coefficients varies quite extensively
suggesting that engagement in urban agriculture may be associated with increases in the average number of food consumed in
the order of 34% in Albania, 11% in Panama, 9% in Nicaragua, and
6–7% in Bangladesh, Nepal, Vietnam, Guatemala and Ecuador.
The associated increase in the number of food groups consumed
is obviously smaller, in the range of 1–5%. This is not surprising
however, given that the variability in the dietary diversity variable
is not all that large either, as in this surveys the recall period for
food consumption is quite long, usually between 2 weeks to
1 month.
When looking at calorie consumption the results go in a similar
direction (Table 5). In two of the four countries (Bangladesh and
Guatemala) for which data on calorie consumption were obtain-
8
The full regression results are available from the authors.
In Madagascar, Malawi and Nigeria we find negative and significant coefficients
in one or both regressions.
9
Outcome ¼ a0 þ a1 p onfarm þ a2 X þ e
ð2Þ
ð1Þ
5.37
0.50
0.23
3417
2.06
0.32
0.42
2327
0.73
0.36
0.46
1690
2.72
0.51
0.26
3225
3.80
0.74
0.24
1219
0.75
0.12
0.28
1722
1.35
0.27
0.28
1154
0.42
0.24
0.41
5852
Concluding remarks
This paper set out to tackle two very specific research questions
concerning (1) the importance and magnitude of agricultural activities for urban households and (2) the relationship between
engagement in urban agriculture and household food security.
Our findings indicate that agriculture is indeed a not negligible
reality of the urban economy, involving anywhere between about
10–70% of urban households. In terms of income generation,
though, its role appears to be much more limited, with the important exception of the African countries in our sample, and of the
households in the poorer quintiles in Nepal and Vietnam. Our data
confirm that urban agriculture is an activity in which the poor are
disproportionately represented, and that this occurs in all regions.
This study also highlights that urban agriculture does appear to
be associated with greater dietary diversity and calorie availability,
both measures of an improved diet and hence closely related to
food security. In two thirds of the countries analyzed results
showed a correlation between an active participation of urban
household in agricultural activities and greater dietary diversity,
this after controlling for economic welfare and a set of household
characteristics. Using a smaller set of countries some evidence is
also found of a relationship with greater calorie consumption, with
fruits and vegetables being the food group more consistently found
to contribute to the increase in calorie consumption associated
with the engagement in urban agriculture.
In the context of the recent trends in food markets and the overall economic crisis, and in light of the well known fact that the urban poor are the most vulnerable to an increase in food prices,
these findings acquire particular policy relevance. A common
household response to a real term increase in food prices (or a corresponding decrease in disposable income) is to adjust consumption towards cheaper sources of calories, which often means
trading off a richer set of micronutrients in the diet to keep calorie
consumption constant. This type of response can be detrimental for
the nutrition of specific population subgroups such as women of
Note:
,
, and
indicate significance at the 1%, 5%, and 10% level, respectively.
0.60
0.26
0.26
4913
1.63
0.38
0.36
2396
2.13
0.29
0.27
3759
0.18
0.33
0.55
1421
2.60
0.32
0.47
3085
0.16
0.39
0.32
2154
Food count
Coefficient
Standard error
R-squared
Number of
obs.
271
able a positive and statistically significant association between
calorie availability and engagement in urban agriculture was
noted. That is related to higher consumption of calories from meat
and fruits and vegetables (both countries), and dairy and staple
products (Guatemala). In Malawi no statistically significant difference in calorie consumption can be detected, but involvement in
agriculture is nevertheless associated with higher consumption
of calories from fruits and vegetables and staples, partly offset by
lower amounts of calories from meat. In Bangladesh the diet of urban households engaged in agriculture appears to have a smaller
staple component.10
Taken together these results confirm the existence of an association between urban agriculture and indicators of dietary adequacy
and diversity in a majority of the countries for which we have data.
We find that controlling for other factors, households engaged in
urban agriculture are more likely, in several but not all countries,
to enjoy a more diverse diet, to consume more calories and to have
access to a greater number of calories from both basic staples and
fruit and vegetable products. It is worth recalling that an increase
in calorie consumption is not necessarily a positive development
if it is concentrated in households that already consume an adequate amount of calories. Obesity is a problem even in low income
countries such as Guatemala (Marini and Gragnolati, 2003), and
these results should therefore be interpreted with some care.
3.27
0.52
0.32
3418
0.56
0.09
0.15
3417
0.22
0.06
0.17
2327
0.17
0.06
0.12
3418
0.36
0.08
0.18
3225
0.26
0.06
0.24
1690
0.01
0.07
0.15
1996
0.19
0.07
0.04
1154
0.22
0.11
0.25
4913
0.52
0.07
0.33
2396
0.33
0.07
0.22
3759
0.19
0.08
0.44
1421
0.97
0.08
0.44
3085
0.25
0.08
0.20
2154
Dietary diversity
Coefficient
Standard error
R-squared
Number of
obs.
Malawi
2004
Madagascar
2001
0.09
0.04
0.19
5852
0.03
0.05
0.18
1722
Guatemala
2000
Ecuador
1995
Bulgaria
2001
Albania
2001
Bangladesh
2000
Indonesia
2000
Asia
Ghana
1998
Nigeria
2004
Africa
Dependent
variable
Table 4
Regression results for models 1 and 2 – coefficients on the urban agriculture participation dummy.
Nepal
2003
Pakistan
2001
Vietnam
1998
Eastern Europe
Latin America
Nicaragua
2000
Panama
2003
A. Zezza, L. Tasciotti / Food Policy 35 (2010) 265–273
10
The regression results for Nicaragua buck these trends and show a negative
association between participation in urban agriculture and most of the outcome
variables.
272
A. Zezza, L. Tasciotti / Food Policy 35 (2010) 265–273
Table 5
Regression results for models 3 and 4 – coefficients on the urban agriculture participation variable.
Dependent variable
Kilocalories per capita
Calories from
Main staple
Fruit and vegetables
Dairy and eggs
Meat
Number of obs.
Note:
,
, and
Malawi 2004
30.30 (101.07)
741.10 (262.29)
122.20 (34.58)
21.87 (32.50)
68.02 (33.50)
1421
Bangladesh 2000
Guatemala 2000
Nicaragua 2001
213.21
(65.84)
106.58 (82.46)
128.87
18.68
25.89
9.30
3416
(21.82)
(3.24)
(5.46)
(3.69)
9.9 (14.15)
12.28 (10.75)
25.67 (14.63)
0.95 (1.04)
2313
88.31
36.43 (8.76)
7.10 (1.79)
0.03 (0.17)
1.75 (0.91)
2392
indicate significance at the 1%, 5%, and 10% level, respectively. Standard errors are reported in parentheses.
reproductive age and children, with the effects likely to persist
over the longer term. Having direct access to a wider variety of
foods (especially to more fruits and vegetables) via urban agriculture can therefore play a potentially important role in protecting
the poorest urban dwellers as they cope with an economic crisis
that hit on the heels of a food price crisis.11
However it is important to reiterate that results traced on possible impacts were small, and that this should be taken into account when assessing the likely contribution of urban agriculture
to address food insecurity problems in urban areas. More in-depth,
country case studies are needed to better grasp the precise magnitude of these effects under different circumstances, and to fully explore the existence of causal links. Thus far such studies have been
limited to large cities, and expanding these to nationally representative samples of the urban population should form part of the research agenda on this topic.
It is not for a paper of this kind to make specific recommendations about what urban planners should do about urban agriculture. We know very well from case study literature that cities are
very different in the characteristics of their urban agriculture,
and that even different neighbourhoods in the same city might require different approaches. The evidence presented seems however
strong enough to urge urban planners and policymakers to think
twice before taking drastic action against urban agriculture, as it
has often been the case in the past. At a minimum, the poverty
and food security implications this might have on the households
that participate in urban agriculture should be properly assessed.
If urban households are engaging in agriculture (and the data suggest that to be true for a fair number of households) this means
that, under the circumstances, they are benefiting from their
involvement in this activity. How large these benefits are, and to
whom they accrue is difficult to quantify, but the message that
comes from our analysis is that they are often (but by no means always) large enough to play a non-negligible part in the livelihood
and food security strategies of several poor urban households.
We do not want to overemphasise the potential for urban agriculture to play a role in urban poverty and food insecurity reduction: the agricultural production of households participating in
this activity is often minimal, as indicated by the income shares
in Table 2 and Fig. 2. Our view is that a more balanced, evidencebased approach than what is found in some of the existing literature is needed. While some of the literature on urban agriculture
is driven by advocacy purposes and is therefore some time guilty
of ‘promoting’ the sector based on scant data, that argument should
not be used to dismiss all arguments in favour of urban agriculture.
Whether urban agriculture makes economic sense is an empirical
question,12 and will depend on its profitability and on the extent to
which it provides food for the food insecure at a lower opportunity
11
We thank an anonymous referee for noting this important point.
The issue of environmental externality and competition over scarce natural
resources (e.g. water) will likely form a substantial part of the response to this
question, which this paper has not touched upon.
12
(24.30)
cost in the use of their resources than alternative means of procuring
that food. Whether urban agriculture is worthy of direct public policy support is debatable and not a question this paper can address, as
each case requires exploring specific alternative pathways out of
poverty and possible alternative measures to increase household’s
access to food, be it through the promotion or different income generating activities and employment opportunities, or by improving
the efficiency of the urban food markets the poor rely on.
Acknowledgements
We thank Benjamin Davis, Rachel Nugent and participants at
the EAAE Conference in Gent and at a Seminar at FAO in Rome
for comments on an earlier draft. We are also grateful to Terri Ballard for discussions on the dietary diversity measures and to Daniela Farinelli for editing the text. The views expressed in the paper
are those of the authors and should not be attributed to FAO.
Appendix A
Tables A1 and A2.
Table A1
List of food groups and content of each group.
Food group
Food
Food
Food
Food
Food
Food
Food
Food
Food
Food
Food
Food
Food
group
group
group
group
group
group
group
group
group
group
group
group
group
Content of the group
1
2
3
4
5
6
7
8
9
10
11
12
13
Cereals and grain products
Starchy, roots, tubers and legumes
Nuts, seeds and legumes
Vegetables
Fruits
Sugar, syrup and sweets
Meat and poultry
Fish and shellfish
Milk and milk products
Oil and fats
Beverages
Eggs
Miscellaneous
Table A2
Average value for ‘food group index’ and average value for ‘food count’ (total number
of food items included in questionnaire in parentheses).
Country
and year
Africa
Ghana
1998
Madagascar
2001
Malawi 2004
Food
group
index
Food
count
(max.)
Food consumption record
technique
Recall
period
30 days
7 days
7 days
10.5
26 (79)
10.9
23 (57)
Questionnaire: six
enumerator visits, 5 days
apart
Questionnaire: one visit
9.9
19 (53)
Questionnaire: one visit
A. Zezza, L. Tasciotti / Food Policy 35 (2010) 265–273
Table A2 (continued)
Country
and year
Food
group
index
Nigeria
2004
Asia
Bangladesh
2000
Indonesia
2000
Nepal 2003
Pakistan
2001
Vietnam
1998
Eastern Europe
Albania 2005
Bulgaria
2001
Latin America
Ecuador
1995
Guatemala
2000
Nicaragua
2001
Panama
2003
a
Food
count
(max.)
Food consumption record
technique
Recall
period
8.9
21 (122)
Questionnaire: six
enumerator visits, 5 days
apart
30 days
10.5
27 (63)
7 days
9.9
17 (37)
7 day diary compiled by
the household
Questionnaire: one visit
7 days
11.8
10.4
24 (35)
42 (83)
Questionnaire: one visit
Questionnaire: one visit
31 days
14 days
11.1
11 (20)
Questionnaire: one visit
365 daysa
10.7
11 (74)
14 days
10
27 (56)
14 day diary compiled by
the household
Questionnaire: one visit
31 days
9.8
40 (80)
Questionnaire: one visit
14 days
10.4
51 (88)
Questionnaire: one visit
15 days
9.4
24 (61)
Questionnaire: one visit
15 days
10.8
47 (82)
Questionnaire: one visit
15 days
Fourteen days recall data are also collected in this survey.
References
Armar-Klemesu, M., 2001. Urban agriculture and food security nutrition and health.
Thematic paper 4. In: Bakker, N. et al. (Eds.), Growing Cities, Growing Food:
Urban Agriculture on the Policy Agenda. DSE, Fefdafing.
Carletto, G., Covarrubias, K., Krausova, M., 2007. Rural Income Generating Activities
(RIGA) Study: Income Aggregate Methodology. Agricultural Sector in Economic
Development Service, FAO, Rome.
Davis, B., Winters, P., Carletto, G., Covarrubias, K., Quinones, E., Zezza, A., Stamoulis,
K., Azzarri, C., DiGiuseppe, S., 2010. A cross-country comparison of rural income
generating activities. World Development 38 (1), 48–63.
273
Dessus, S., Herrera, S., de Hoyos, R., 2008. The impact of food inflation on urban
poverty and its monetary cost: some back-of-the-envelope calculations.
Agricultural Economics 39 (Suppl.), 417–429.
Egal, F., Valstar, A., Meershoek, S., 2001. Urban Agriculture, Household Food Security
and Nutrition in Southern Africa. Mimeo, FAO, Rome.
Egziaber, A.G., Lee-Smith, D., Maxwell, D.G., Memon, P.A., Mougeot, L.J.A., Sawio, C.J.,
1994. Cities Feeding People. An Examination of Urban Agriculture in East Africa.
IDRC, Ottawa.
Ellis, F., Sumberg, J., 1998. Food production, urban areas and policy response. Food
Policy 26 (2), 213–225.
FAO, 1996. The State of Food and Agriculture. FAO, Rome.
Marini, A., Gragnolati, M., 2003. Malnutrition and Poverty in Guatemala. World
Bank Policy Research Working Paper No. 2967. World Bank, Washington,
DC.
Maxwell, D., 2003. The importance of urban agriculture to food and nutrition. In:
Annotated Bibliography on Urban Agriculture. Sida and ETC, Leusden, The
Netherlands, pp. 22–129.
Maxwell, D., Levin, C., Csete, J., 1998. Does urban agriculture help prevent
malnutrition? Evidence from Kampala. Food Policy 23 (5), 411–424.
Mougeot, L.J., 2000. The Hidden Significance of Urban Agriculture. 2020 Vision.
Focus 3, Brief 6 of 10, August. IFPRI, Washington, DC.
Nelson, T., 1996. Closing the Nutrient Loop. World Watch, 9:6, November–
December, pp. 10–17.
Nugent, R., 2001. The impact of urban agriculture on household and local
economies. Thematic paper 3. In: Bakker, N. et al. (Ed.), Growing Cities,
Growing Food: Urban Agriculture on the Policy Agenda. DSE, Fefdafing.
Ravallion, M., Chen, S., Sangraula, P., 2007. New Evidence on the Urbanization of
Global Poverty. Policy Research Working Paper 4199. World Bank, Washington,
DC.
Ruel, M.T., 2006. Operationalizing dietary diversity: a review of measurement issues
and research priorities. Journal of Nutrition.
Ruel, M.T., Garrett, J.L., Morris, S.S., Maxwell, D., Oshaung, A., Engle, P., Menon, P.,
Slack, A., Haddad, L., 1998. Urban Challenges to Food and Nutrition Security: A
Review of Food Security, Health, and Caregiving in the Cities. FCND Discussion
Paper No. 51. IFPRI, Washington, DC.
Sida and ETC, 2003. Annotated Bibliography on Urban Agriculture. ETC, Leusden,
The Netherlands.
UNDP, 1996. Urban Agriculture. Food, Jobs, and Sustainable Cities. United Nations
Development Programme. Publication Series for Habitat II, vol. 1. UNDP, New
York.
Valdés, A., Foster, W., Anríquez, G., Azzarri, C., Covarrubias, K., Davis, B.,
DiGiuseppe, S., Essam, T., Hertz, T., de la O, A.P., Quiñones, E., Stamoulis, K.,
Winters, P., Zezza, A., 2009. A Profile of the Rural Poor. ESA Working Paper No.
09-04. FAO, Rome.
Van Veenhuizen, R., 2006. Cities Farming for the Future. Urban Agriculture for Green
and Productive Cities. RUAF Foundation, IDRC, Ottawa.
Winters, P., Davis, B., Carletto, G., Covarrubias, K., Quinones, E., Zezza, A., Azzarri, C.,
Stamoulis, K., 2009. Assets, activities and rural income generation: evidence
from a multicountry analysis. World Development 37 (9), 1435–1452.
Zezza, A., Azzarri, C., Davis, B., Covarrubias, K., Tasciotti, L., Anriquez, G., 2008. The
Impact of Rising Food Prices on the Poor. FAO–ESA Working Paper 08-07.


© Copyright 2026