
Bounding Sample Errors in Approximate Distributed Latent Dirichlet Allocation Alexander Ihler
Bounding Sample Errors in Approximate Distributed Latent Dirichlet Allocation
1
Alexander Ihler and David Newman
1,2
1 Department of Computer Science, University of California, Irvine, Irvine CA 92697 USA
2 NICTA Victoria Research Laboratory, University of Melbourne, VIC 3010, Australia
Abstract
Latent Dirichlet allocation (LDA) is a popular algorithm for discovering structure in large collections of text or
other data. Although its complexity is linear in the data size, its use on increasingly massive collections has created
considerable interest in parallel implementations. “Approximate distributed” LDA, or AD-LDA, approximates the
popular collapsed Gibbs sampling algorithm for LDA models while running on a distributed architecture. Although
this algorithm often appears to perform well in practice, its quality is not well understood or easily assessed. In this
work, we provide some theoretical justification of the algorithm, and modify AD-LDA to track an error bound on its
performance. Specifically, we upper-bound the probability of making a sampling error at each step of the algorithm
(compared to an exact, sequential Gibbs sampler), given the samples drawn thus far. We show empirically that our
bound is sufficiently tight to give a meaningful and intuitive measure of approximation error in AD-LDA, allowing
the user to understand the trade-off between accuracy and efficiency.
Citation: UCI ICS Technical Report # 09-06
Original Date: October 2009
Last Updated: October 27, 2009
1
Introduction
strated that AD-LDA learned models with similar properties
and accuracy to those learned using the exact algorithm on a
single processor. Wang et al. [9] show how AD-LDA (along
with several optimization tricks) can be represented in either
the MPI or MapReduce programming models, demonstrating
that they are capable of scaling to very large data sets and
providing an open-source implementation of the MPI version.
Asuncion et al. [10] generalized the AD-LDA approach to include asynchronous distributed learning, and to use nonparametric versions of the LDA model. However, a significant drawback of AD-LDA is that since the algorithm only approximates
Gibbs sampling, AD-LDA has no accuracy guarantees, and no
inherent way to assess the degree of approximation.
Latent Dirichlet allocation (LDA) models, sometimes called
topic models, have received considerable attention over the last
decade for their ability to extract semantic content from collections of text documents. The extracted semantic content is
useful for a variety of applications such as search, categorization and prediction, as well as understanding the structure of
a collection and its metadata. For example, McCallum et al.
used a topic model to discover groups of US senators based on
their voting records and the text from bills [1]. Topic modeling
can be especially useful in understanding the organization of
very large scale systems and sets of documents; for example,
Blei and Lafferty show how topic models make a powerful tool
for browsing, exploring and navigating through the more than
100 years of the journal Science [2].
The complexity of LDA is linear in the size of the corpus and
the number of topics being learned; however, for large collections of documents even linear complexity becomes computationally challenging. For example, learning a 1000-topic model
of MEDLINE, which contains over a billion words, would take
months on a single 3GHz processor. Text collections of this size
can easily be found from a variety of sources such as email, online news, blogs, and literature databases. Applications of LDA
are not limited to text; variants of LDA have also been applied
to problems on many other types of data, including understanding the content of images [3] and capturing user rankings and
preferences [4].
With the widespread availability of multicore processors and
the need to topic model increasingly large collections, researchers have been motivated to investigate ways of parallelizing or distributing LDA’s computations. Nallapati et al. [5]
developed a parallel algorithm for variational inference in LDA
models. However, many researchers prefer to use a collapsed
Gibbs sampling approach for learning LDA models [6,7]. Gibbs
sampling is fundamentally sequential in nature and thus can be
difficult to correctly parallelize, prompting Newman et al. [8] to
develop AD-LDA, a distributed algorithm that approximates
collapsed Gibbs sampling for LDA. They showed excellent parallel efficiencies for large data sets, and experimentally demon-
We present a modified parallel Gibbs sampler for LDA which
enables performance guarantees. Our algorithm obtains similar
speedups to AD-LDA, but provides an on-line measure of the
incurred error. This measure allows the user to bound and
track the sampling error at each step, to continually assess the
quality of the learned model.
2
Latent Dirichlet Allocation
Latent Dirichlet allocation is a probabilistic model which explains word co-appearances in text as arising from a relatively
small number of possible semantic topics. Specifically, each document is considered to consist of a small number of topics, each
of which is dominated by only a fraction of all possible words.
The topics define a simplified representation of the documents,
where words which co-appear regularly in documents will tend
to appear together in a topic.
The input to LDA is the standard bag-of-words representation of a collection of text documents, where D documents are
each represented as a sparse vector of |W | nonnegative counts,
with W being the set of words in the vocabulary. LDA models
each document d as a mixture θd over T latent topics, where
each topic φt is a multinomial distribution over the |W | word vocabulary. In the generative model φt is drawn from a symmetric
Dirichlet with parameter β, and θd is drawn from a symmetric
1
Algorithm 1: Collapsed Gibbs sampling for LDA.
1
2
3
4
5
6
7
8
9
10
α
initialize z at random;
adt = #{i : zdi = t} + α;
bwt = #{(d, i) : xdi = w, zdi = t} + β;
ct = #{(d, i) : zdi = t} + |W |β;
repeat
forall d ∈ D, i ∈ {1 . . . Nd } do
t ← zdi ; w ← xdi ; adt - -; bwt - -; ct - -;
t ∼ Multinomial(ad bw / c);
zdi ← t; adt ++; bwt ++; ct ++;
θd
β
zdi
until convergence ;
φt
Dirichlet with parameter α.1 The ith token in document d is
generated by first drawing a topic assignment zdi from θd , then
generating the token xdi from φzdi . This generative process is
represented as the graphical model shown in Figure 1.
Given the observed data x, the goal is to compute the posterior distribution over the latent variables z, φt and θd . Since
exact inference is intractable, one can use variational or sampling methods to perform approximate inference [13]. The collapsed Gibbs sampling algorithm is one of the most commonly
adopted methods, and performs well in practice [6, 7].
Collapsed Gibbs sampling proceeds by marginalizing over φt
and θd and sampling just the topic assignments z. A Gibbs
sampling step draws a new value for each topic assignment
conditioned on the current values for all the other topic assignments. Given the current state of all but one variable zdi ,
the conditional probability of zdi is given by
Algorithm 2: AD-LDA: Perform collapsed Gibbs
sampling updates on a distributed set of documents
D1 . . . DP .
1
2
3
4
5
p(zdi = t|z¬di , α, β)
7
8
∝ p(xdi |zdi = t, z¬di , β) p(zdi = t|z¬di , α)
9
10
where z¬di denotes the other assignments. Defining the word
label w = xdi we have
11
12
¬di
p(zdi = t|z¬di , α) ∝ Ndt
+α
14
¬di + β
Nwt
¬di
Nt + |W |β
15
Here we have defined the summation of the current assignments
(indexed by word w, document d, and topic t) by Nwdt = |{i :
xdi = w, zdi = t}|, and use the P
convention that missing
P indices
are summed out, so that Ndt = w Nwdt and Nwt = d Nwdt .
The superscript “¬di” again indicates that word i in document
d has been excluded from the summation.
It is convenient to write the distribution of zdi in a vector
form over the possible topics t, so that
p(zdi |z¬di , α, β) = Multinomial(p ∝ ad bw /c)
3
¬di
bwt = Nwt
+β
initialize z at random;
adt = #{i : zdi = t} + α;
bwt = #{(d, i) : xdi = w, zdi = t} + β;
ct = #{(d, i) : zdi = t} + |W |β;
Partition D ⇒ D1 . . . DP ;
repeat
for j = 1 . . . P in parallel do
Copy bj = b, cj = c;
forall d ∈ Dj , i ∈ {1 . . . Nd } do
t ← zdi ; w ← xdi ; adt - -; bjwt - -; cjt - -;
t ∼ Multinomial(ad bjw / cj );
zdi ← t; adt ++; bjwt ++; cjt ++;
P
P
Update b = b + j (bj − b), c = c + j (cj − c);
until convergence ;
Parallel Gibbs Sampling for LDA
Each iteration of Gibbs sampling updates the topic assignment
zdi for every word in every document in the collection. For
sufficiently massive corpora of text, this can take a long time,
and require days or even months of CPU time [8]. For example, learning T = 1000 topics for the D = 19 million citations
in MEDLINE would take an estimated 4 hours to iterate once
through the corpus, assuming a single 3GHz processor, and
hundreds of these iterations would be required to reach stationarity. Distributed clusters of computers can be used to speed
up this process. Even relatively small data sets may benefit
from incorporating parallelism, by enabling desktops to take
advantage of multicore computing architectures.
The obvious way to distribute the learning of an LDA model
is to partition the data set by dividing the collection of documents into P sets, each of which is processed in parallel. This
is the idea behind AD-LDA: after distributing the documents
over P processors, Gibbs sampling is done on each set concurrently, and the results are combined after each processor has
swept through its local data once. Note that we use P to represent both the number of partitions in the data and the number
(1)
where
¬di
adt = Ndt
+α
Nd
D
Figure 1. Graphical model for latent Dirichlet allocation. Each
observed word xdi and its associated latent topic zdi is modeled
as being generated by a combination of two factors, the topic
distribution for that document, θd and the word distribution for
that topic, φt .
6
p(xdi |zdi = t, z¬di , β) ∝
xdi
T
ct = Nt¬di + |W |β,
the product aw bd /c is taken element-wise, and p is normalized
to sum to one. Pseudocode for the collapsed Gibbs sampling
algorithm for LDA is listed in Algorithm 1.
1
For simplicity, we assume symmetric Dirichlet priors with scalar parameters α, β [11], but our error bounds are easily extended to asymmetric Dirichlet priors with vector-valued parameters, and the algorithm
can be extended to include learning or optimizing over these parameters
as well [12].
2
Words
Algorithm 3: Word-block coordination in AD-LDA.
1
Documents
A1 A2 A3
2
3
B3
B1
B2
4
5
6
C2
C3
C1
7
8
9
Figure 2. We partition the documents across processors, and
divide the words into non-overlapping blocks. Processors sample
blocks A1,B1,C1 asynchronously in parallel, re-synchronize, then
continue to blocks A2,B2,C2, and so on.
10
11
12
13
14
of processors. Although these quantities need not be equal (we
need as many partitions than we have processors to work in parallel, but could partition more finely if desired), for simplicity
of presentation we assume that the two numbers are the same.
The AD-LDA algorithm is listed in Algorithm 2. Notice
that since the data are split into groups along document lines,
document-specific variables are accessed only by the process
with ownership of that document. Although each processor appears to use a particular variable, in fact each processor is only
accessing a processor-specific subsection of the vector, and no
access conflicts can arise among the parallel processes. Thus,
the partitioning of documents across processors enables us to
also partition the variables z and a (representing Ndt ) among
the distributed computing elements so that the relevant parts
of these variables are always local and up-to-date. For the other
variables (b, c), AD-LDA makes a local copy (bj , cj ) which is
updated using that processor’s data, and the results are combined at the end of each iteration (line 2). Note that this Gibbs
sampling process is approximate, in the sense that the topic
values sampled are not from the same distributions as would be
used in a sequential Gibbs sampling algorithm. In particular,
the vectors bj , cj are not changed to reflect the samples that
have been already drawn by other processors, and are thus incorrect. In practice, this approximation appears to be minor,
and AD-LDA provides good results. We shall see that, with
a little more work, we can gauge this error “on the fly” and
control it.
Our first algorithmic modification is to partition the data not
only along shared documents but also along shared words. In
addition to partitioning documents D = D1 ∪ . . . ∪ DP , we also
partition the observed words W = W1 ∪ . . . ∪ WP . We create
P 2 data partitions, each of which is defined by a subgroup of
documents and words. We arrange the computation so that
exactly P of these are done concurrently, and that these P subsets are orthogonal (no two share the same document or word);
see Figure 2. The algorithm is outlined as Algorithm 3. The
refined partitioning requires slightly more frequent synchronization among the processes (fewer data are processed during each
parallel-for loop), but also involves fewer shared resources. The
local Gibbs sampling steps can update a and b without potential overlap; only c uses a local copy at each process which is
not kept up-to-date.
This data partitioning has recently been independently proposed by Yan et al. [14]. There, the additional partitioning
is justified mainly from the perspective of reducing potential
read/write conflicts to shared memory. However, we shall see
that this modification is key to being able to bound the approximation error inherent in the algorithm.
In terms of approximation error, the smaller overlap among
15
16
initialize z at random;
adt = #{i : zdi = t} + α;
bwt = #{(d, i) : xdi = w, zdi = t} + β;
c0t = #{(d, i) : zdi = t} + |W |β;
Partition D ⇒ D1 . . . DP , W ⇒ W1 . . . WP ;
repeat
for k = 1 . . . P in sequence do
for j = 1 . . . P in parallel do
¯ = k + j − 1 mod P ;
k
Copy cj = c0 ;
forall d ∈ Dj , i ∈ {i : xdi ∈ Wk¯ } do
t ← zdi ; w ← xdi ; adt - -; bwt - -; cjt - -;
t ∼ Multinomial(ad bw / cj );
zdi ← t; adt ++; bwt ++; cjt ++;
P
Update c0 = c0 + j (cj − c0 );
until convergence ;
the resources used by each process that results from partitioning
both document and word collections has two significant advantages. The first is that c (or Nt ) represents the total number
of words allocated to each topic, which is a “bulk” quantity
and likely to be relatively stable from iteration to iteration. If
c were constant, i.e., was not changed by each processor, our
sampler would be exact. Intuitively, the more stable c, the
closer our approximation will be; we make this intuition precise
in Section 4. The second important point is that c is relatively
low-dimensional (T values); this small size makes it feasible to
save and re-examine its values later, making it possible to retrospectively compare and evaluate its stability.
It may be useful to design the partitioning of D and W so
as to produce balanced computational loads across processors.
The cost of any given block
P of data is the number of words which
appear within it, i.e.,
Di ,Wj Ndw . For a balanced load, we
should minimize the spread (maximum minus minimum) across
any two blocks which are executed in parallel. However, in practice, a simple random partitioning into equal numbers of documents and words is very effective; we use this strategy for our
experiments in Section 6. A more sophisticated optimization
method is proposed by Yan et al. [14]. However, load balancing
may become less important in more sophisticated scheduling
and load allocation architectures such as MapReduce [9].
4
Analyzing the Sampling Error
Our version of AD-LDA has only one source of approximation
error, specifically the differences in the topic counts Nt being
updated locally at each processor. Using a particular, robust
measure of distributional error, it turns out that we can efficiently track and bound the error experienced by the approximate algorithm at each step of the Gibbs sampler.
It is worth noting here that our bound will be on the probability of drawing an incorrect sample at each step of the algorithm, given the (possibly incorrect) samples drawn so far.
While this does not capture the possible accumulation of errors, we argue that it remains a useful assessment of quality. In
particular, AD-LDA as originally developed provides no feedback on quality, and can only be assessed anecdotally by also
running a sequentially computed model [8]. A per-sample error
bound allows us to consider the error due to distributed computation on the same footing as we might consider, for example,
3
Proof. Since (sv)t = st vt , by the mean value theorem we have
that
min log vt′ /ˆ
vt′ ≤ 0 ≤ max log vt /ˆ
vt .
roundoff error in floating point calculations, or non-uniformity
in a random number generator. Being a probability of error,
it has an intuitive scale by which to gauge its magnitude, and
thus provides a way to meaningfully assess the level of error
experienced by the sampler.
4.1
Furthermore, it is easy to show that for a, b, c, d ≥ 0,
a
b
≤
c
d
Hilbert’s Projective Metric
We make use of a measure of error between two vectors known
as Hilbert’s projective metric [15]. This metric has been successfully applied to analyze approximations and parallelism in
a probabilistic inference algorithm called belief propagation; it
was independently developed in [16] (there termed the dynamic
range) for the purposes of analyzing the behavior of the belief
propagation algorithm under small perturbations, and subsequently for designing efficient parallel partitioning and scheduling of the algorithm [17].
The projective metric d(v, v
ˆ) between two positive vectors v
and v
ˆ is given by
d(v, v
ˆ) = max [log(vt /ˆ
vt ) − log(vt′ /ˆ
vt′ )]
t,t′
log
vt
v ′ + ht′
vt + ht
vt ′
≤ log
.
≤ log t
≤ 0 ≤ log
v
ˆ t′
v
ˆt′ + ht′
v
ˆt + ht
v
ˆt
Finally, we would like to relate d(v, v
ˆ) to more traditional
norms, particularly when applied to normalized probability distributions.
Theorem
ˆ be two positive vectors with unit sum,
P 4. LetPv, v
so that
ˆt = 1, and let d(v, v
ˆ) = ǫ. Then the L1
t vt =
tv
difference is bounded by
X
|vt − v
ˆt | ≤ |1 − eǫ | = ǫ + O(ǫ2 )
(6)
kv − v
ˆk1 =
(2)
t
and therefore, the difference in probabilities assigned to any
event E is also bounded:
˛
˛
˛X
X ˛˛
˛
1
1
v
ˆt ˛˛ ≤ |1 − eǫ | = ǫ + O(ǫ2 )
vt −
max ˛˛
(7)
E ˛
2
2
˛
t∈E
t∈E
Theorem 1. The projective metric is invariant to positive
scaling on the vectors, so that if λ, λ′ are positive scalars, we
have
d(λv, λ′ v
ˆ) = d(v, v
ˆ)
(3)
Proof. Since
P
(v − v
ˆ) = 0, we know mint
Thus, exp(−ǫ) ≤
Proof. From the definition (2) we have
X
λvt λ′ v
ˆ t′
d(λv, λ v
ˆ) = max log ′
t,t′
λv
ˆt λvt′
vt v
ˆ t′
= max log
t,t′
v
ˆ t vt ′
′
t
v
ˆt
vt
≤ exp(ǫ). We then see
|vt − v
ˆt | =
X
t
v
ˆt
vt
≤ 1 ≤ maxt
v
ˆt
.
vt
vt |1 − v
ˆt /vt | ≤ |1 − eǫ |.
Inequality (7) then follows from Scheff´
e’s identity [18]:
˛
˛
˛
˛
X ˛
X
˛X
max ˛˛
v
ˆt ˛˛ =
vt −
vt − v
ˆt
E ˛
˛
t∈E
t∈E
t:vt >ˆ
vt
X
1X
|vt − v
ˆt |.
v
ˆ t − vt =
=
2 t
t:v <ˆ
v
= d(v, v
ˆ)
Theorem 2. Let s be any positive vector; then
t
t
(4)
4.2
where the vector multiplication is taken elementwise, (sv)t =
s t vt .
Error Bounds in Parallel LDA
Let us now examine the distributions used while executing parallel collapsed Gibbs sampling for LDA, as in Algorithm 3. Consider a sequential version of this algorithm, in which process
j = 1 executes first, then j = 2, and so on, and imagine that
in addition to the local copy cj of c0 used at each processor,
the processor also updates the true global count c. We will
design our algorithm to assess and bound the error between the
parallel and sequential distributions at each step of the algorithm, given the samples that have been drawn thus far. In
other words, we compare the distributions
Proof. Again from (2) we have
s t vt s t ′ v
ˆ t′
st v
ˆ t s t ′ vt ′
vt v
ˆ t′
= max log
t,t′
v
ˆt vt′
d(sv, sˆ
v) = max log
t,t′
= d(v, v
ˆ)
p ∝ ad bw /c
P
a
a+b
b
≤
≤ .
c
c+d
d
⇒
Since log is monotonic, and log ht /ht = log 1 = 0, we have
This distance measure is closely related to the L∞ or sup-norm
applied to log v, and has a number of useful properties for analyzing the ways in which distributional errors behave during
inference. The most important properties for our analysis are:
d(sv, sˆ
v) = d(v, v
ˆ)
t
t′
P
Theorem 3. Let
ˆt . Then, adding any nonnegt vt =
tv
ative vector h does not increase the distance between v and
v
ˆ:
d(v + h, v
ˆ + h) ≤ d(v, v
ˆ)
(5)
ˆ ∝ ad bw /cj
p
ˆ , and update both c and
but draw our sample according to p
cj for the next step given this sample. Thus we assess the
instantaneous difference in distributions between the sequential
and parallel versions of the algorithm, but do not consider the
4
where the identities follow from equation (5), the definition (2),
equation (4), and (3), respectively. Applying Theorem 4 completes the proof.
Algorithm 4: Bounding errors in AD-LDA.
Follow Algorithm 3, with modifications:
j
10a ht = #{(d, i) : d ∈ Dj , xdi ∈ Wk , zdi = t};
10b v
ˆj = c0 − hj ;
11 forall d ∈ Dj , i ∈ {i : xdi ∈ Wk
¯ } do
12
t ← zdi ; w ← xdi ; adt - -; bwt - -; hjt - -;
13
t ∼ Multinomial(ad bw / (ˆ
vj + hj ));
14
zdi ← t; adt ++; bwt ++; hjt ++;
P
15a Compute ǫj = d( v
ˆj , v
ˆj + k<j (hk + v
ˆk − c0 ) );
P
0
0
j
j − c0 );
15b Update c = c +
(h
+
v
ˆ
j
Moreover, to track ǫj for each processor requires only P · T
additional storage and sequential work after all processes have
finished.
We separate hj from v because hj evolves during the algorithm, and we wish to bound the error using a single computation at the end. However, the fact that hj only needs to be nonnegative suggests another small modification. If we also track
the minimum value of hj at any step of the Gibbs sampler, this
count can be included in v as well, by modifying Algorithm 4:
accumulation of errors in the distribution; see the discussion of
this issue in Section 4.
The difficulty with this approach lies in the fact that the
“true” c is not available at the time each processor evaluates its
data. A comparison to c must be retrospective, i.e., it can take
place only after the preceding processes have finished. However,
the distributions evaluated change at each step, depending on
ad and bw , and moreover these vectors and c, cj all evolve
with each step as topic assignments are changed. Thus it is not
ˆ k1 can be evaluated without re-visiting each
obvious that kp − p
datum in sequence.
ˆ k1 to be
Luckily the bounds from Section 4.1 enable kp − p
bounded efficiently. To do so, we must slightly modify our
algorithm and the quantities it keeps track of; these changes
are given in Algorithm 4. Specifically, we first separate the
topic counts associated with data in the current process, and
denote this vector hj . We denote the remainder of the counts
(those associated with other processes) as v
ˆj . Each step of
the Gibbs sampler in processor j affects only hj ; v
ˆj remains
constant. We can thus save v
ˆj , and use it to retrospectively
bound the error.
Once all processes have finished, we can compare the cj used
by each processor to the c which would have been computed
sequentially. However, instead of comparing cj and c (which
evolve during the process), we compare v
ˆj and its sequentially
obtained version, v. As v
ˆj represents the topic counts of data
assigned to other processes at the beginning of j’s operations,
v represents what these topic counts would have been had j
waited until all prior processes had finished. The vector v can
be easily computed given the process outputs, by summing up
the changes in each preceding process’ counts, and the error
computed as:
ǫj = d( v
ˆj , v = v
ˆj +
X
k<j
10b
12b
15a
v
ˆj = c0 − hj ; hj+ = hj ;
j
hj+
= min(hj+
t
t , ht );
P
j
j+
ǫj = d( v
ˆ +h
, v
ˆj + hj+ + k<j (hk + v
ˆk − c0 ) );
Again, this modification requires tracking only T additional
values at each processor. In practice, however, it appears to
provide only a very slight improvement over Algorithm 4.
5
Approximate Scaling Analysis
Before showing the empirical behavior of our error bounds, it
is useful to describe a simple, approximate analysis of the error
and its dependence on parameters such as the number of data,
number of partitions, and number of topics. We will compare
this expected scaling behavior with the empirical behavior we
measure in Section 6.
Our error bound makes use of the idea that, if the counts
allocated to the topic count vector c were unchanged by each
block sampled in parallel, then the sampling would have proceeded correctly. Moreover, c is a bulk quantity (the sum of
many individual topic assignments), making it likely to remain
approximately constant. We are thus relying on the law of large
numbers to make the allocation of counts approximately constant over the course of a set of parallel block operations. Here,
we will use a simple approximation to this idea to gauge how
we might expect the errors to scale with various parameters.
Let us suppose that the topics are approximately uniform,
i.e., the actual allocation is centered around N/T counts per
topic, and let K be the number of data being processed in
parallel at any one time. Ideally, we have K ≈ N/P , since
there are P 2 blocks total, P of which are executed in parallel
at any one time. If the data being sampled in parallel are are
also approximately uniformly distributed across the topics and
are assumed to be independent, the probability of each datum
falling into a given topic is 1/T , and thus the total number of
these counts to fall in each topic is approximately normal with
K(T −1)
≈ K/T .
mean K/T and variance
T2
(hk + v
ˆ k − c0 ) )
We then have the following result:
Theorem 5. The probability of drawing an incorrect sample at
each step of the Gibbs sampler due to the parallel computation,
given the values of all preceding samples, is bounded by (eǫj −
1)/2 = ǫj /2 + O(ǫ2j ).
Suppose that we take the usual 95% confidence interval (plus
or minus two standard deviations) to be an estimate of the range
that we might observe in practice. Then, the total number of
counts in each bin is
r
N
K
±2
,
T
T
Proof. Using the preceding theorems, we have that for an arbitrary nonnegative vector hj and positive vectors ad , bw ,
d(ˆ
vj , v) ≥ d(ˆ
vj + hj , v + hj )
= d(1/(ˆ
vj + hj ) , 1/(v + hj ) )
= d(ad bw /(ˆ
vj + hj ) , ad bw /(v + hj ) )
and the projective measure of error between the endpoints of
the 95% confidence interval and the nominal uniform (N/T )
= d(ˆ
pj , p )
5
Data Set
KOS
NIPS
Enron
|D|
3,430
1,500
39,861
|W |
6,906
12,419
28,102
N
sampler (dashed line). The actual error is measured by running the sampler sequentially but simulating the distributed
computations and comparing their respective sampling distributions. For a reasonable comparison, we report the maximum
ˆ k1 , observed during
mis-allocated probability mass, 12 kp − p
each iteration of the Gibbs sampler. This value represents the
tightest bound possible when measuring error in the proposed
sense.
The figure shows that both our algorithm’s bound and the
true error behave similarly, and in practice appear to be separated by an approximately constant factor over time (here,
between about 2 and 3). The sampling error often appears to
undergo an increase at the very beginning of the algorithm, as
many topic assignments at each processor are changing rapidly.
The error then begins to fall off, eventually arriving at some
steady-state level of fluctuation. Similar shapes are observed
for the other data sets as well.
The timing of this decrease in sampling error can be compared to the drop in perplexity (a measure of the current parameters’ representation of the data) over time, shown in Figure 5(b). Note that, as in the empirical findings of [8], exact
LDA and AD-LDA (at various numbers of partitions P ) showed
almost indistinguishable perplexity curves, and so we show only
the exact (sequential) perplexity. In general, the increased error
levels seen in Figure 5(a) appear to correspond roughly with the
rapid decrease in perplexity, while the steady-state error levels
are associated with the more gradual change in perplexity. Intuitively, significant improvements in perplexity correspond to
highly probable (nearly non-random) topic assignments, which
then cause significant drift across processors and results in the
temporary increase in sampling error.
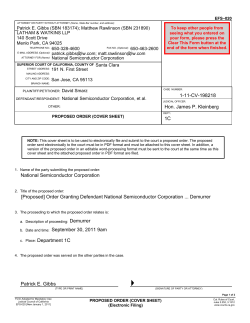
467,714
1,932,365
6,412,172
Figure 3. Bag-of-words text data sets used in the experiments
and their relative sizes, available from [19].
count vector is
!
p
N/T + 2 K/T
N/T
p
d(ˆ
p , p) ≈ log
N/T
N/T − 2 K/T
!
√
1 + 2 KT /N
√
= log
1 − 2 KT /N
”
“
√
≈ log 1 + 4 KT /N + O(KT /N 2 )
√
KT
≈4
N
r
T
=4
NP
Thus, under the previously described approximations, we would
expect that the error we observe should increase with the square
root of the number of topics T , and decrease with the square
root of both the number of partitions P and the total number
of data N . We shall see in Section 6 that these approximations
are reasonably accurate in practice.
6
Experiments
We empirically validate our results using an OpenMP implementation of AD-LDA to show the speed-up of our modified
algorithm, along with the scaling of our error bounds with problem size, number of data partitions, and topics, and their behavior over time (iteration number). We use several instances of
bag-of-words text data from the UCI Machine Learning Repository [19], whose relative sizes (in terms of number of documents, unique words, and total number of words in the corpus)
are listed in Table 3. Following the parameter choices of [8],
we select α = .1, β = .01, and T = 200 for all three data sets
except where noted.
6.1
6.3
Next, we examine the scaling behavior of our error bound with
the data size N (number of words in the corpus), the number of
partitions P , and the number of topics T . The results of these
experiments on all three data sets are shown in Figure 6. For
comparison, we again show both the bound obtained by our
algorithm (solid blue lines) and the actual sampling error experienced by the sampler (dashed lines). In both cases, we report
the average values observed within the last 50 iterations (i.e.,
within the steady-state error regime depicted in Figure 5(a)),
and averaged over 10 trials. All three data sets appear in each
figure: KOS (circles), NIPS (squares), and Enron (triangles).
Also shown in each figure is a reference line (red) to indicate
the scaling behavior anticipated by the approximations in Section 5. All plots are logarithmic in both scales for clarity.
Figure 6(a) shows the error values as a function of data set
size (one point per data set). As expected, the error decreases
for larger data sets. Both the actual error and our bound decrease at √
approximately the same rate, which is roughly similar
to the 1/ N behavior suggested by our analysis.
Figure 6(b) shows the error level as a function of the number of partitions P . Increasing the number of partitions also
increases the number of times per iteration that the algorithm
synchronizes and updates its counts. Thus as expected, we see
that both the actual error and our bound decrease as the number of partitions grows. Again, across all sizes of partitionings,
our error bound remains reasonably close to the actual maximum error observed during sampling,
and again the trend is
√
quite close to the anticipated 1/ P scaling behavior.
Finally, Figure 6(c) shows the error level as a function of the
number of topics T . Increasing the number of topics increases
both the actual error and our bound. In this case, the actual
Timing and speed-up
Figure 4 shows the speed-up of our modified version of AD-LDA
on an eight-core desktop machine, having subdivided the data
into P partitions where P is the number of cores in use. As can
be seen, speed-up is nearly linear in the number of cores, showing that (like the original formulation) our block-synchronized
AD-LDA has excellent parallel efficiency. It should be noted
however that our results are presented using a shared memory
architecture. Using a cluster or other distributed architecture
may see less efficiency due to slower communications, but we
would expect its behavior again to be similar to the original
AD-LDA algorithm.
6.2
Scaling behavior
Behavior over time
We can also examine the behavior of our error bound as the
Gibbs sampler progresses. Figure 5(a) shows the error bound
produced by Algorithm 4 on the largest of the data sets (Enron), as a function of the iteration number and for P = 4. For
comparison, we also show the actual error experienced by the
6
8
4
10
Enron
NIPS
KOS
Ideal (1/P)
7
Enron
NIPS
KOS
Ideal
6
3
Time (s)
Speedup Factor
10
2
5
4
10
3
2
1
10
1
2
3
4
5
6
7
1
1
8
2
3
4
5
6
7
8
Number of Cores
Number of Cores
(a) Computation time
(b) Speedup factor
Figure 4. Parallel efficiency of the modified AD-LDA sampler. (a) Computation time for each data set, as a function of the number of
cores used; (b) Speedup factor (sequential time divided by parallel time) as a function of the number of cores. Dashed lines show ideal
(linear) speedup behavior. As can be seen, AD-LDA is quite close to optimal in all three data sets, indicating a high parallel efficiency.
√
error appears to scale in a similar way to our anticipated T
behavior, but the error bound may be increasing at a slightly
faster rate. Intuitively, our bound depends on the stability of
the log-counts over each iteration; for a sufficiently large number of topics, some topic will have only a few counts, and will
thus be unstable in our projective metric sense. The bound
often becomes loose in these cases. This suggests that for very
large values of T , such as nonparametric models in which T is
effectively infinite [10], more research may be be required to
provide a tight estimate of the error.
7
mixture models such as those that arise for image features or
other continuous data [3].
Acknowledgments
The authors would like to thank Arthur Asuncion, Max Welling,
and Padhraic Smyth for many useful discussions on LDA and
its distributed implementations.
NICTA is funded by the Australian Government as represented by the Department of Broadband, Communications
and the Digital Economy and the Australian Research Council
through the ICT Centre of Excellence program.
Conclusion
We have presented a variant of AD-LDA which has a number of
advantages over the original. It reduces the number of sources
of error by decreasing the shared resources between threads executing in parallel. Moreover, by using this modification and
tracking slightly more information at each processor, the algorithm is able to retrospectively construct a bound on the
probability of drawing an incorrect sample at each step once
the processors resynchronize. Our empirical results show that
the bounds closely track the actual maximum error experienced
by AD-LDA, and quantitatively support the anecdotal evidence
that AD-LDA provides accurate approximations.
This modification gives us the means to check the behavior
of AD-LDA during execution, obtaining some assurance that
our distributed implementation is not causing serious errors.
Empirically, we see that larger data sets and smaller parallel
blocks typically lead to better approximations, and that error
typically increases during early mixing but falls off as the model
stabilizes.
Although we have presented our bounds for LDA and text
data, it should also be extensible to more general problems
as well. In theory, our results are applicable to hierarchical
and nonparametric variants of LDA as well [10, 20]. However,
since we rely on the stability of the log-counts in distributed
copies of shared data during sampling, in practice the resulting error bounds may become loose and may require additional
research. Other potential extensions include analyzing asynchronous exchanges between processors [10], and more general
References
[1] A. McCallum, “Information extraction: Distilling structured data from unstructured text,” ACM Queue, vol. 3,
no. 9, pp. 48–57, Nov. 2005.
[2] D. Blei and J. Lafferty, “A correlated topic model of Science,” Annals of Applied Statistics, vol. 1, no. 1, pp. 17–35,
2007.
[3] J. Sivic, B. Russell, A. Efros, A. Zisserman, and W. Freeman, “Discovering object categories in image collections,”
in Proc. International Conference on Computer Vision,
2005.
[4] T. Rubin and M. Steyvers, “A topic model for movie
choices and ratings,” in Proc. Ninth International Conference on Cognitive Modeling, Manchester, UK, 2009.
[5] R. Nallapati, W. Cohen, and J. Lafferty, “Parallelized variational em for latent Dirichlet allocation: An experimental
evaluation of speed and scalability,” in ICDMW ’07: Proceedings of the Seventh IEEE International Conference on
Data Mining Workshops. Washington, DC, USA: IEEE
Computer Society, 2007, pp. 349–354.
7
−1
10
Enron Bound
Enron Error
3.6
Data Perplexity
Sample Error Probability
10
−2
10
3.5
10
3.4
10
3.3
10
3.2
10
−3
10
0
20
40
60
80
100
0
Iteration
20
40
60
80
100
Iteration
(a)
(b)
Figure 5. Algorithm behavior as a function of the iteration number on the Enron data set. (a) Sampling error, for P = 4 partitions.
The solid curve shows the error bound computed using our method, while the dashed curve shows the maximum actual error experienced
at each iteration (computed using sequential sampling). Errors are high early on, while many assignments are changing, then fall off
to a lower steady-state value after the chain has mixed. (b) Perplexity of the Enron data set as a function of iteration. Perplexity
falls off rapidly at first, then slows; the rapid improvement corresponds to approximately the same time that the sampling error is high.
As observed in the empirical results in Newman et al. [8], sequential Gibbs sampling and AD-LDA for all tested numbers of partitions
produced almost indistinguishable perplexity curves.
[6] M. Welling, Y. W. Teh, and B. Kappen, “Hybrid variational/Gibbs collapsed inference in topic models,” in Uncertainty in Artificial Intelligence (UAI), 2008, pp. 587–
594.
[14] F. Yan, N. Xu, and Y. Qi, “Parallel inference for latent
Dirichlet allocation on graphics processing units,” in To
appear, Advances in Neural Information Processing Systems, Dec. 2009.
[7] A. Asuncion, M. Welling, P. Smyth, and Y. W. Teh, “On
smoothing and inference for topic models,” in Proceedings
of the International Conference on Uncertainty in Artificial Intelligence, June 2009.
[15] P. J. Bushell, “Hilbert’s metric and positive contraction
mappings in a Banach space,” Archive for Rational Mechanics and Analysis, 1973.
[16] A. T. Ihler, J. W. Fisher III, and A. S. Willsky, “Loopy
belief propagation: Convergence and effects of message errors,” Journal of Machine Learning Research, vol. 6, pp.
905–936, May 2005.
[8] D. Newman, A. Asuncion, P. Smyth, and M. Welling, “Distributed inference for latent Dirichlet allocation,” in Proc.
Neural Information Processing Systems (NIPS) 20, Dec.
2007.
[17] J. Gonzalez, Y. Low, and C. Guestrin, “Residual splash for
optimally parallelizing belief propagation,” in In Artificial
Intelligence and Statistics (AISTATS), Clearwater Beach,
Florida, April 2009.
[9] Y. Wang, H. Bai, M. Stanton, W.-Y. Chen, and E. Y.
Chang, “PLDA: Parallel latent Dirichlet allocation for
large-scale applications,” in Proc. of 5th Int’l Conf. on
Algorithmic Aspects in Information and Management
(AAIM), June 2009.
[18] L. Devroye and G. Lugosi, Combinatorial Methods in Density Estimation. New York: Springer, 2001.
[10] A. Asuncion, P. Smyth, and M. Welling, “Asynchronous
distributed learning of topic models,” in Advances in Neural Information Processing Systems 21, D. Koller, D. Schuurmans, Y. Bengio, and L. Bottou, Eds., 2009, pp. 81–88.
[19] A.
Asuncion
and
D.
Newman,
“UCI
machine learning repository,” 2007. [Online]. Available:
http://www.ics.uci.edu/∼mlearn/MLRepository.html
[20] Y. W. Teh, M. I. Jordan, M. J. Beal, and D. M. Blei, “Sharing clusters among related groups: Hierarchical Dirichlet
processes,” in Advances in Neural Information Processing
Systems 17, L. K. Saul, Y. Weiss, and L. Bottou, Eds.
Cambridge, MA: MIT Press, 2005, pp. 1385–1392.
[11] T. L. Griffiths and M. Steyvers, “Finding scientific
topics.” Proc Natl Acad Sci U S A, vol. 101 Suppl
1, pp. 5228–5235, April 2004. [Online]. Available:
http://dx.doi.org/10.1073/pnas.0307752101
[12] T.
Minka,
“Estimating
a
Dirichlet
distribution,”
2003.
[Online].
Available:
http://research.microsoft.com/en-us/um/people/minka/papers/dirichlet/
[13] D. M. Blei, A. Y. Ng, and M. I. Jordan, “Latent Dirichlet
allocation,” Journal of Machine Learning Research, vol. 3,
pp. 993–1022, 2003.
8
Sample Error Probability
10
Sample Error Probability
KOS Bound
KOS Error
NIPS Bound
NIPS Error
Enron Bound
√
Enron
Error
1/ P
reference
−2
KOS Bound
KOS Error
NIPS Bound
NIPS Error
Enron Bound
√
Enron
Error
1/ N
reference
−2
10
−3
10
−3
10
6
7
10
1
10
2
10
Number of Data
10
Number of Partitions
(a)
(b)
−1
Sample Error Probability
10
KOS Bound
KOS Error
NIPS Bound
NIPS Error
Enron Bound
√ Enron Error
T
reference
−2
10
−3
10
−4
10
1
10
2
3
10
10
Number of Topics
(c)
Figure 6. Error scaling as a function of (a) the size of the data set, N ; (b) the number of partitions, P ; (c) the number of topics, T .
Each plot shows both the error bound (solid, blue) and actual error probability (dashed, black) for the KOS (circles), NIPS (squares), and
Enron (triangle) data sets. Also shown in each plot is a reference line showing the estimated scaling behavior described in Section 5. In
all cases, the estimated behavior appears roughly similar to the observed curves for both the error bound and the true error probability.
9


© Copyright 2026