
Document 265434
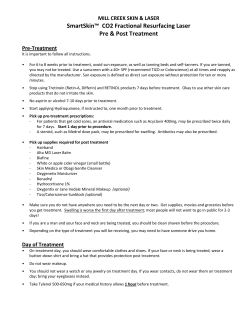
EXPERIMENTAL
CELL
RESEARCH
195,
361-367 (1991)
Laser Irradiation and Raman Spectroscopy of Single Living Cells and
Chromosomes: Sample Degradation Occurs with 514.5 nm
but not with 660 nm Laser Light
G.J. PUPPELS,' J.H.F.
OLMINKHOF,G.
Rioph.ysical Technology Group, Department
of Applied
M.J.
SEGERS-NOLTEN,~.
Physics, University
INTRODUCTION
Progress in modern cell biology creates an evergrowing demand for data on the composition, conformation,
and organization in time and space of nucleic acids, proteins, lipids, and complexes of these in cells. Raman
spectroscopy has been successfully applied in many
studies in this field. However, the inherently low signal
correspondence
and reprint
requests
should
F.F.M.
DEMUL,AND
J. GREVE
of Twente, P.0. Ron 217, 7500 AE, Enschede, The Netherlands
intensity due to the low cross-section for Raman scattering of most biological macromolecules has limited its
applicability to the study of model systems (see e.g., [l]
for reviews). W ith the development of a confocal Raman microspectrometer
(CRM) in our laboratory, the
field of investigation
open to Raman spectroscopy has
been significantly
extended. Microscopically
small intact biological objects as single cells and chromosome
bands with a spatial resolution of -0.45 X 0.45 X 1.3
ym3 can now be studied [2-41. Detailed molecular information from precisely defined positions in intact cells
and metaphase and polytene chromosomes can be obtained in this way. However, in our first attempts to
obtain Raman spectra of single biological cells and
chromosomes we found that the samples were damaged
by the 514.5nm laser light commonly used in DNA/
protein-Raman
studies. Whereas many reports have
appeared concerning the damaging effects of uv and
near visible radiation on DNA and cells (see [5] for review) little literature is available on the effects of irradiation with visible laser light of high intensity. Problems with sample integrity have been reported in experiments on cell trapping with laser light of 514.5 nm [6].
Berns et al. [7, 81 developed a microsurgery technique
using visible laser light from a pulsed laser. Using light
of 532 nm they found a four-photon
mechanism to be
the cause of the damage to metaphase chromosomes [9],
which they termed paling. However, as in our experiments the peak intensity of the laser light (0.5-5 MW/
cm2) on the sample is 4 orders of magnitude lower than
in their case it seemed very unlikely that a four-photon
process would occur. Therefore a number of experiments were carried out to elucidate the mechanism
causing sample degradation. Although our findings do
not provide a definite answer, they do narrow down the
range of potential mechanisms. Using laser light of 660
nm sample integrity was found not to be affected. The
results presented here are not only important
for the
field of Raman spectroscopy but should also be of interest to other areas of research where laser microscopical
techniques are used to study or manipulate living cells
or other biological objects.
In Raman spectroscopic
measurements
of single cells
(human lymphocytes)
and chromosomes,
using a newly
developed
confocal
Raman
microspectrometer
and a
laser excitation
wavelength
of 514.5 nm, degradation
of the biological
objects was observed.
In the experiments high power microscope
objectives
were used, focusing the laser beam into a spot - 0.5 pm in diameter.
At the position of the laser focus a paling of the samples
became visible even when the laser power on the sample
was reduced to less than 1 mW. This was accompanied
by a gradual decrease in the intensity
of the Raman signal. W ith 5 m W of laser power the events became noticeable after a period of time in the order of minutes.
It is
shown that a number of potential
mechanisms,
such as
excessive
sample heating
due to absorption
of laser
light, multiple
photon absorption,
and substrate
heating are unlikely
to play a role. In experiments
with
DNA solutions
and histone
protein
solutions
no evidence of photo damage was found using laser powers up
to 25 mW. No degradation
of cells and chromosomes
occurs when laser light of 660 nm is used. The most
plausible
explanation
therefore
seems to be that the
sample degradation
is the result of photochemical
reactions initiated
by laser excitation
at 514.5 nm of as yet
unidentified
sensitizer
molecules
or complexes
present
in chromosomes
and cells but not in purified
DNA and
IG 1991 Academic
PWS,
IN.
histone protein samples.
‘To whom
dressed.
OTTO,
be ad-
361
0014-4827/91
$3.00
Copyright 0 1991 by Academic Press, Inc.
All rights of reproduction in any form reserved.
362
PUPPELS
MATERIALS
AND
METHODS
Human lymphocytes were isolated from peSample preparations.
ripheral blood. The mononuclear
white blood cell fraction was obtained by means of density gradient centrifugation
[lo]. It was depleted of monocytes by incubation in a 75-cm2 tissue culture flask for
60 min at 37°C. This causes the monocytes to adhere to the surface of
the flask whereas the lymphocytes remain in suspension. A few drops
of this suspension were then deposited on a poly-L-lysine
(Sigma
P-6516)coated
fused silica substrate. During a 15-min incubation in
an environment
of 100% humidity the cells attach to the substrate.
The substrate was then placed in a petri dish filled with phosphatebuffered saline (PBS) [0.14 M NaCl + 2.7 m M KC1 + 1.5 m M
KH,PO, + 6.5 m M NaH,PO].
Chinese hamster lung (CHL) cell (V79) metaphase chromosomes
were isolated from exponentially
growing cell cultures as described in
[ll]. The cells were grown in Eagle’s minimum essential medium
(MEM), without phenol red to avoid fluorescent
contamination,
which would cause a high background signal in the Raman spectroscopic experiments. Omission of other luminescent compounds from
the growth medium (such as folic acid and riboflavin) during the last
2-10 growth cycles did not lead to further improvements
in this respect.
The metaphase chromosome spread of Fig. 1A was prepared according to standard procedures, including fixation of mitotic cells in
1:3 mixture of methanol and acetic acid.
The fixed polytene chromosome sample shown in figure 1C was
prepared from Chironomus thummi thumni salivary gland cells using
standard squash preparation techniques [12]. Unfixed polytene chromosomes were obtained by a micromanipulation
technique [13]. After
preparation
the samples were taken up in PBS with added divalent
cations (1 m M CaCl, + 1 m M MgCl,).
Calf Thymus DNA was purchased from Sigma (type I, Sigma
D-1501) and used as received. A 25 mg/ml solution in PBS, resulting
in a thick gel, was prepared. A small quantity of this gel was placed on
a fused silica microscope slide and covered by a fused silica coverglass, which was sealed to the slide. A thin layer of 10 Frn was thus
obtained. Lyophilyzed
calf thymus histone II-AS, purchased from
Sigma (H-7755), was also used without further purification
at a concentration of 50 mg/ml in PBS. This resulted in a thick but fluidic
solution. The histone solution was kept between a microscope slide
and a coverglass as described for the DNA-sample.
The following laser sources were used in
Experimental
methods.
the experiments: A Coherent Innova 90 argon ion laser (457.9,48&O,
and 514.5 nm), a SIL MS 120A He-Ne laser (632.8 nm), and a Spectra
Physics Model 375 B dye laser operated with DCM (Exciton) and
tuned to 660 nm. The dye laser was equipped with a birefringent filter
and an ultrafine etalon to produce a linewidth of -7 GHz (-0.3
cm-‘). The argon ion laser was used to pump the dye laser. Raman
spectra were recorded on the laboratory-built
CRM mentioned before. For the measurements it was equipped with a 63X Zeiss Plan
Neofluar water immersion objective (N.A. 1.2).
Absorption spectra of cell and chromosome suspensions were measured on a spectrophotometer
(PerkinElmer
551s) equipped with a
Ulbricht 45”-integrating
sphere, to avoid extinction due to light scattering. Absorption
spectra of glass substrates were recorded on a
Beckmann DU-8 spectrophotometer.
Substrates of different thicknesses were measured in order to be able to correct the data for reflection losses at the air-glass interfaces. Cell survival after laser irradiation was determined using the viability test described in [14].
Calculations.
The method used to calculate heating effects due to
absorption of laser light is straightforward
and described in [15] and
[16]. The following simplified model was used: it was assumed that
the strongly focused laser light was uniformly absorbed (applying the
appropriate
absorption coefficients) in a half-sphere (chromosome)
ET AL.
or a cylinder (substrate) with the radial dimensions of the laser focus
(0.25 Km), conducting the absorbed energy to their surroundings. The
calculations were based on stationary conditions. In the calculation of
heating of the substrate on which the samples were placed, heat conduction to the medium in which the sample was immersed was neglected. In the calculation of chromosome heating, the chromosome
was treated as a DNA-protein
solution with the same coefficient of
heat conduction as the surrounding medium. Heat conduction to the
substrate was neglected in this case. Heat conduction coefficients for
water, crown glass, and fused silica were taken from [17].
RESULTS
Characteristics
of the Radiation
Damage
In Raman microspectroscopic
experiments laser light
is focused by means of a microscope objective onto a
sample (Fig. 1D). In our experiments
on single cells,
polytene chromosomes,
and metaphase chromosomes
high numerical
aperture
(NA) objectives are used,
which focus the laser light into a spot of -0.5 vrn
(FWHM)
in diameter. This leads to high light intensities: -5 MW/cm’ for 10 mW of laser power. For all
samples investigated (cells and chromosomes)
a degradation under the influence of 514.5 nm laser light was
observed at all laser powers tested (0.5-20 mW). At the
position of the laser focus a paling of the sample occurred (Fig. 1). This was accompanied by a gradual decrease in the intensity of the Raman signal (Fig. 2).
There was no indication of excessive heating of the samples, such as a large increase in the luminescent background of the Raman signal. An interesting feature, regularly observed, was that in the Raman spectra the
DNA line at 1487 cm-‘, mainly due to a guanine vibration involving the N7 and C8 positions, decreased in
intensity more rapidly than other lines. A typical example of this is shown in Fig. 2B.
Comparison
Protein
with Model Solutions
of DNA
and Histone
For comparison it was tested whether a solution of
CT-DNA would also be damaged by the laser light. A
thin layer of about 10 pm of the gel-like DNA solution
(25 mg/ml) was kept between two sealed coverslips.
Even after 3 h of irradiation
with a laser power of 25
mW on the sample the Raman spectrum remained unchanged and also upon visual inspection no proof of
sample degradation was found. A similar test was done
for a 50 mg/ml solution of CT histone II-AS, with the
same result: no signs of degradation of the sample were
found.
Wavelength
Damage
Dependence
of the Radiation-Induced
The wavelength of the laser light turned out to be a
crucial factor. Whereas at 457.9 and 488 nm the same
LASER-INDUCED
DEGRADATION
OF CELLS
AND
363
CHROMOSOMES
MICROSCOPE
OBJECTIVE
-!2iiLBUFFER
FIG. 1. Examples of the paling of biological samples in the focus of an Argon ion (514.5 nm) laser beam. The laser beam was focused into a
spot of -1 pm in diameter with a 40X Nikon E Plan objective. (A) Fixed CHL-cell metaphase chromosomes after 120 s (arrow 1) and 60 s
(arrow 2) of irradiation
with 20 mW of laser power on the sample. The chromosomes have been stained with acridine orange after laser light
irradiation for clarity (magnification:
2000X). (B) Isolated (unfixed) CHL-cell metaphase chromosome after a 300-s irradiation with 10 mW of
laser power (magnification:
2000x). (C) Chironomus thummi #mmmi salivary gland polytene chromosome (from a squash preparation)
after
600 s of irradiation
at different locations with 5 mW of laser power on the sample (magnification:
1500x). (D) Focusing of the laser light on a
sample.
paling effects were observed as with 514.5 nm laser
light, sample damage could be avoided using laser light
of a larger wavelength. No paling effects were observed
using laser light of 632.8 or 660 nm. Raman spectra obtained consecutively
at the same measuring position on
a sample were found to be completely reproducible,
using 660 nm laser light for excitation. The measurements
on a polytene chromosome band, shown in Fig. 3, illustrate this. No Raman experiments were carried out with
632.8 nm laser light.
We also determined
the percentage of cells (freshly
isolated human lymphocytes)
surviving a 5-min irradiation with laser light as a function of laser power and
wavelength of the laser light. The results are shown in
Fig. 3. Lymphocytes
are small (diameter
~10 pm)
rounded cells with little cytoplasm. The laser light was
focused in the center of the cells. It is mainly the nucleus
that is irradiated in this way. Although the tests were
done for small numbers of cells only it makes clear that
laser light of 632.8 and 660 nm is much less harmful
than 514.5 nm laser light. Whereas 514.5 nm-irradiation
affects cell viability already at a laser power of 5 mW no
adverse effects are noticed with 632.8 and 660 nm irradiation for laser powers up to 20 mW. Above this level
irradiation
with red laser light also causes cell death.
The tests with 632.8 nm had to be carried on a different
experimental
set up, the only significant difference being that a lower numerical
aperture (0.65) was employed. This results in a larger diameter of the laser
focus. However, a control measurement
with 514.5nm
laser light with the same (NA = 0.65) objective resulted
in the same curve as shown in Fig. 4 for 514.5 nm (obtained using a 1.2 NA objective). This indicates that the
total integrated laser light dose on a cell is the important parameter, rather than the intensity with which it
is applied, at least for the intensity range and cell type
investigated here.
A number of experiments
was performed
to learn
364
PUPPELS
1200
1250
1300
1350
Wavenumber
1400
[cm-‘]
1450
ET AL.
1500
1450
Wavenumber
1500
[cm-‘]
FIG. 2. Effect of laser light (514.5 nm)-induced sample degradation on the Raman spectrum. Raman line assignments are in Table 1. (A)
Decrease of the intensity of the Raman signal, as recorded during measurements on isolated (unfixed) single (CHL-cell) metaphase chromosomes. Ten series of measurements were carried out on 10 different chromosomes. Each series consisted of 10 consecutive measurements at a
fixed chromosome position. The spectra shown are the result of summations of corresponding
measurements
from the 10 series. In each
measurement the laser power was 5 m W and the measuring time 60 s. Background signal from the fused silica coverslip and water have been
subtracted, as well as a second order polynome representing luminescent background signal. The spectra were obtained during the (A) 1st
minute of irradiation,
(B) 3rd minute of irradiation,
(C) 5th minute of irradiation, and (D) 9th minute of irradiation.
(For further details see
section about multi-photon
absorption.)
(B) An example of the sensitivity of the 1487 cm-i guanine/adenine
band to laser light irradiation.
Detail of the spectra shown in A. The spectra were scaled to have equal intensity in the spectral interval 1150-1460 cm-‘.
more about the cause of the sample degradation
by laser light of 514.5 nm.
Absorption
induced
of Laser Light
An absorption spectrum of a suspension of chromosomes was recorded (Fig. 5). This was done on a spectrophotometer equipped with a partially integrating sphere
in order to avoid large extinction
effects due to light
scattering. The spectrum shows only the well-known uv
absorption of DNA and proteins. Absorption
at 514.5
nm (optical density (O.D.) 0.0087) was lower by roughly
two orders of magnitude than at 260 nm (O.D. 1.04). On
the basis of Fig. 5 and assuming that the absorption of
laser light occurs uniformly over the irradiated position
it can be argued that the absorption at 514.5 nm is too
low to cause sample damage through heating effects. A
solution of 50 pug DNA/ml has an O.D. of l/cm at 260
nm. The DNA concentration
in a CHL metaphase chromosome will be of the order of 100 mg/ml and the pathlength of the laser light through a chromosome is about
0.5 pm. (A CHL mitotic cell contains 6.6 pg of DNA [18],
divided over 22 chromosomes. The total added length of
the chromatids of these chromosomes was estimated by
light microscopic observation to be 200 km and the diameter of a chromatid is about 0.5 pm.) It follows that at
260 nm roughly 20% of the incident radiation will be
absorbed by a chromatid. This means that at 514.5 nm a
chromatid absorbs a fraction of about 5 * lop3 of the
incident laser light. A calculation (Materials and Methods) shows that 10 mW of laser power (514.5 nm) would
give rise to an increase in temperature of about 100°C in
the chromosome at the position of the laser focus. However, there are several indications that this result is not
realistic. As noted before, no damaging occurs using
laser light of 660 nm, while Fig. 5 suggests that light
absorption at that wavelength is not much less than at
514.5 nm. It is most likely, therefore, that the larger part
of the “absorption”
above -300 nm is due to residual
light scattering effects. Furthermore
damage was found
also to occur using laser powers <l mW, where the temperature increase would be an order of magnitude lower
than with 10 mW. It is therefore not very likely that
heating effects are the cause of damage in the case of
chromosomes.
For cells some additional absorption can be expected.
Absorption
spectra (not shown) obtained from human
lymphocytes
showed a low intensity absorption band
centered at 420 nm and an absorption
band around
550-560 nm just above noise level, probably due to
flavins and heme-group
containing
molecules
(e.g.,
cytochromes).
LASER-INDUCED
TABLE
Raman
Line
Line position
Assignments
in Figs.
1303
1340
1377
1421
1449
1487
1510
1577
1660
Multi-Photon
When light intensity is high enough multiphoton
processes can occur, as indicated by Calmettes and Berms
x IO4
6
6
.a
__
’
-‘6
0
\
9’
,
Y0
-0
80.0
(Refs. 119, 20, 211)
Absorption
365
CHROMOSOMES
a.
.
2 and 3
Thymine (T), Guanine (G)
G
Adenine (A)
T
DNA: O-P-O, Cytosine (C), T
DNA: backbone (BK) (B-conformation)
DNA: BK
DNA: BK, protein (p): o-helix
phenylalanine
DNA: O-P-OAmide III, A
A
A p: CH deformation
(def)
I
T, A, G
A, G
p: CH def
G, A
A
G, A
Amide I
1094
1254
AND
1 oo.ome
Assignment
670
681
729
750
788
832
895
928
1004
OF CELLS
1
for the Spectra
(cm-‘)
DEGRADATION
\
\
3
2
Ii
0
u
2
5
\
60.0 -
\
0
\
40.0
20.0-
7
0.0.
0
0
c
5
0
1
’
c
20
10
15
LASER
POWER (mW)
.J
25
30
FIG. 4. Percentage of cells (human lymphocytes)
surviving a
300-s laser light irradiation
as a function of laser light power for
514.5, 632.8, and 660 nm. (0) At 514.5 nm; objective, 63X Zeiss Plan
Neofluar water immersion (N. A. 1.2) focus diameter, -0.5 Nm. (0)
At 632.8 nm; objective, 40X Nikon E Plan (N. A. 0.65) focus diameter,
-1 pm. (0) At 660 nm, objective and beam diameter are the same as
that for 514.5 nm. The laser beam was focused in the center of the
cells. Each point in the graph represents 10 irradiatedcells
(20 for 660
nm 25 mW point). Control samples contained > 90% living cells.
[8]. The energy contained in two photons with a wavelength of 514.5 nm lies exactly at the maximum of the
DNA absorption band in the uv. The damaging effects
of uv radiation on DNA are a well-known phenomenon.
With an experiment we checked whether two or multiphoton absorption could play an important role in sample degradation.
In that case not only the total laser
light dose applied to a sample but also the intensity of
the laser light should determine the extent of the damage. With the CRM Raman spectra of single metaphase
chromosomes
were recorded. A chromosome was positioned in the laser focus (without preference for type of
chromosome or position on a chromosome)
and a series
of consecutive
short Raman spectroscopic
measurements was made at that position on the chromosome.
The time course of the decrease in Raman signal inten-
1.5
c,
,,, ,,
750
., ,,,
ii
,u
c
,,, ,~
1000
1250
Wavenumber
A
1.0
1500
[cm-‘]
FIG. 3. Raman spectra obtained from a (dark) band of an unfixed Chironomus
thummi thummi polytene chromosome
in PBS.
The spectra (A, B, C) were recorded consecutively
at the same position in the chromosome band. Laser power, 10 mW (660 nm); measuring time, 600 s. Background
signal from fused silica and buffer has
been subtracted. An appropriate straight line has been subtracted to
correct for a remaining slightly sloping background. Difference spectra: (D) A-B, (E) A-C. The spectra have been shifted along the ordinate for clarity of presentation.
Raman line assignments are given in
Table 1.
z
z
8
0.075
0.5
d
F
8
.B
\
\.
4. ‘,.‘i..Y,,
‘CI.
.-..,.
-..-._.,_.
-----......_..,.,...,_...,.__
-...
.....__..._....
I
0.050
3.025
0.0
10
300
400
600
500
WAVELENGTH
700
61
hm)
FIG. 5. (A) Absorption
spectrum of a suspension of CHL-cell
metaphase chromosomes. (B) 20X magnification
of spectrum A.
366
PUPPELS
20 mW, 15s
A
0
80.0-
60.0
n
10 mW, 30s
5 mW, 60s
2.5 mW, 120 s
-
ET AL.
laser focus was calculated and found to be negligible (at
most O.l”C for 10 mW of incident laser power), indicating that it is not of any importance
for sample degradation. The calculation
for a fused silica substrate yields
even lower values for the temperature
rise, due to the
fact that the transmittance
(T) of this material is extremely high (7’ > 0.9999/cm, Melles Griot Optics Guide
IV), while the heat conduction coefficient is the same as
for the glass substrate.
DISCUSSION
z
0.01
0
12
3
NUMBER
4
5
OF
300
6
7
mJ.
8
91011
DOSES
FIG. 6. Decrease in Raman signal intensity, observed in measurements on single metaphase chromosomes
for different laser light
powers (514.5 nm). The laser light dose in each measurement
was
kept constant at 300 mJ. Laser power (measuring time per measurement): +, 20 mW (15 s); a, 10 mW (30 s); 0, 5 mW (60 s); n , 2.5 mW
(120 s). Every point in the graph represents the integrated
Raman
signal (normalized
over 10 measurements).
See text for further details. At every laser power 10 series of measurements
were carried
out.
sity was thus determined.
This was done for laser
powers ranging from 2.5-20 mW. For the different laser
powers used the signal integration
time for each measurement was adjusted in such a way that the total irradiation dose for each measurement
was kept constant at
300 mJ. At every laser power 10 such measurement
series were made, each on a different chromosome.
The
results in Fig. 2 are examples of how the Raman signal
intensity decreased with time, using a laser power of 5
mW. In order to make a quantitative
comparison
between the results obtained at different laser powers the
total Raman signal contained
in the spectral region
1150-1530 cm-’ in the resulting spectra was integrated.
The relative decrease in integrated signal intensity as a
function of irradiation
dose on the sample is shown in
Fig. 6. Taking the decrease in signal intensity as a measure of sample degradation
it follows from this figure
that the amount of damage depends on the total laser
light dose only and not on the intensity of the laser light.
This agrees with the observation mentioned earlier that
total laser irradiation
dose on a cell seems to be the
parameter determining
cell survival and not the intensity of the laser light. Therefore the influence of two or
multiphoton
absorption
processes is considered to be
negligible.
Substrate Heating
The temperature
rise of a glass substrate (O.D. 0.02/
cm at 514.5 nm) due to absorption at the position of the
From the results presented here it follows clearly that
in laser experiments
on (living) biological matter the
choice of the wavelength of the laser light is a matter of
concern. Based on experiments it was found that the use
of laser light of 660 nm greatly improves the experimental conditions in that it does not affect sample integrity.
When using 514.5 nm laser light a paling occurs for all
types of samples investigated
thus far. Although
this
paling resembles the findings of Berns et al. [7-91 no
evidence was found for multiphoton
absorption
as in
their case. Furthermore
they observed that in metaphase chromosomes
histones were more sensitive to
laser irradiation
(532.8 nm from a frequency-doubled
Nd Yag pulse laser) than DNA [22]. This appears to
disagree with our observation
that the guanine Raman
line at 1487 cm-’ decreases most rapidly in intensity.
Most likely the effects of laser irradiation
described in
this paper are of a different kind than those that occur
during irradiation
with pulsed laser light of much higher
peak intensity. Another difference in experimental
conditions, that may influence the specific paling mechanism, is that in the work of Berns et al. [7-9, 221 chromosomes were irradiated intracellularly,
whereas in our
experiments
isolated chromosomes
were used. No definite answer concerning
the cause for the reported effects of 514.5 nm (and 488/457.9 nm) laser light on biological samples has been found. Multiphoton
absorption and substrate heating could be excluded as possible
mechanisms.
Therefore
one-photon
laser light absorption by the chromosomes and cells remains the only possible process involved in sample degradation.
For the case of chromosomes
it is not plausible, that
heating effects due to laser light absorption play an appreciable role. Thus photochemical
processes should be
considered to cause the radiation damage.
The experiments
with CT-DNA
and CT-histone
have shown that two of the main chromosome constituents in their purified form are not susceptible to radiation damage (at 514.5 nm). Other compounds
or complexes that can act as photosensitizers
must therefore
be present in chromosomes
and cells. DNA bases (especially guanine) and a number of amino acids (methionine, tyrosine, tryptophan,
histidine, cysteine) can be
degraded in a photodynamical
process, requiring
the
LASER-INDUCED
DEGRADATION
presence of light, a sensitizer, and oxygen [23]. In such a
process laser excitation
brings the sensitizer via the
singlet state in a long-lived triplet state. It can then
react with an oxygen molecule to form singlet oxygen or
a superoxide-ion.
The reactive oxygen species could
cause the observed radiation damage, through oxydation of the DNA bases or amino acids leading to lesions
in these molecules.
The observation that the guanine Raman line at 1487
cm-’ looses its intensity most rapidly would agree with
the fact that guanine is the DNA base that is most sensitive to this type of processes. Sensitizer triplets can
also produce free radicals or radical ions through interaction with a reducing substrate, which can then react
further to induce damage. In such a process the presence of oxygen is not required [23]. An experiment (not
shown) in which a mixture of glucose oxidase and catalase was added to a metaphase chromosome preparation
showed that damage still occured. Such an enzyme mixture was shown [24] to be very effective in depleting a
sample of free oxygen molecules. However, reactive hydrogen peroxide may be present and the enzymes contain tlavines which can act as sensitizers [23]. This matter was not further pursued.
The fact that excitation
with laser light of 660 nm
does not induce sample degradation indicates that the
sensitizer molecules do not absorb at this wavelength.
Summarizing,
it can be stated that the laser irradiation-induced
degradation
of chromosomes
and cells is
probably a photochemical
process mediated by as yet
unidentified
sensitizer molecules or complexes. These
sensitizers are excited by blue and green laser light but
not by the 660-nm laser light used in the CRM.
The authors thank Dr. J. Krijgsman of the Faculty of Civil Engineering of the Delft University of Technology for the use of the integrating sphere spectrophotometer;
Mr. M. M. van den Berg of the
department
of Mechanical Engineering
of the University of Twente
for the use of the He-Ne laser; and Drs. M. Robert-Nicoud,
D. J.
Arndt-Jovin,
and T. M. Jovin of the Max Planck Institute for Biophysical Chemistry
in Gottingen,
FRG, for polytene chromosome
preparations
and a glucose oxidase and catalase sample. This work
was supported by the Netherlands
Foundation
for Biophysics.
REFERENCES
1.
Spiro, T. G., Ed. (1987) Biological Applications
of Raman Spectroscopy, Vol. 1, Wiley, New York; Clark, R. J. H., Hester, R. E.,
Eds. (1986) Advances in Spectroscopy, Vol. 13: Spectroscopy of
Biological Systems, Heyden, London.
Received December 27, 1990
Revised version received March
26, 1991
OF CELLS
AND
367
CHROMOSOMES
2.
Greve, J., Puppels, G. J., Olminkhof,
J. H. F., Otto, C., de Mul,
F. F. M. (1989) in Spectroscopy of Biological Molecules (Bertoluzza, A., Fagnano, C., and Monti, P. Eds.), pp. 401-404, Societa
Editrice Esculapio s.r.l., Bologna.
3.
Puppels, G. J., Olminkhof,
J. H. F., Otto, C., de Mul, F. F. M.,
Greve, J. (1989) in Spectroscopy of Biological Molecules (Bertoluzza, A., Fagnano, C., and Monti, P., Eds.), pp. 357-358, Societa
Editrice Esculapio s.r.l., Bologna.
4.
Puppels, G. J., de Mul, F. F. M., Otto, C., Greve, J., Robert-Nicoud, M., Arndt-Jovin,
D. J., and Jovin, T. M. (1990) Nature
347,301-303.
Coohill, T. P., Peak, M. J., and Peak, J. G. (1987) Photo&en.
Photobiol. 46(6), 1043-1050.
Ashkin, A., and Dziedzic, J. M. (1987) Science 235, 1517-1520.
Berns, M. W., and Rounds, D. E. (1970) Sci. Am. 222(2), 99110.
Berns, M. W., and Richardson,
S. M. (1977) J. Cell. Biol. 75,
977-982.
5.
6.
7.
a.
9.
Calmettes, P. P., and Berns, M. W. (1983) Proc. N&l. Acad. Ski.
USA 80, 7197-7199.
10.
Terstappen, L. W. M. M., de Grooth, B. G., Nolten, G. M. J., ten
Napel, C. H. H., Van Berkel, W., and Greve, J. (1986) Cytometry
7, 178-183.
11.
Van den Engh, G., Trask, B., Cram, S., and Bartholdi,
Cytometry 5, 108-117.
12.
Arndt-Jovin,
D. J., Robert-Nicoud,
M., Zarling, D. A., Greider,
C., Weimer, E., and Jovin, T. M. (1983) Proc. N&l. Acad. Sci.
USA 80, 4344-4348.
13.
RobertNicoud,
M., Arndt-Jovin,
D. J., Zarling, D. A., and Jovin,
T. M. (1984) EMi?
J. 3(4), 721-731.
Parks, D. R., Bryan, V. M., Oi, V. M., Oi, V. T., and Herzenberg,
L. A. (1979) Proc. Natl. Acad. Sci. USA 76, 1962-1966.
14.
M. (1984)
15.
Rosasco, G. J. (1980) in Advances in Infrared and Raman Spectroscopy (Clark, R. J. H., and Hester, R. E., Eds.), Vol. 7, pp.
223-282, Heyden, London.
16.
Merlin, J. C., and Delhaye, M. (1987) in Laser Scattering Spectroscopy of Biological Objects (Stepanek, J., Anzenbacher,
P.,
and Sedlacek, B., Eds.), pp. 49-66, Elsevier, Amsterdam.
Handbook of Chemistry and Physics 56. Edition (1975-1976)
(Weast, R. C., Ed.) RC Press, Cleveland.
Prescott, D. M. (1988) Cells, Jones & Bartlett, Boston.
Otto, C. (1987) PhD thesis, University of Twente, Enschede.
17.
18.
19.
20.
Thomas,
G. J., Jr., Prescott,
B., and Olins, D. E. (1977) Science
197, 385-388.
21.
Savoie, R., Jutier, J.-J., Alex, S., Nadeau,
(1985) Biophys. J. 47,451l459.
22.
Berns, M. W. (1974) Cold SpringHarbor
38, 165-174.
23.
Foote, C. S. (1976) in Free Radicals in Biology (Pryor,
Ed.), Vol. 2, pp. 85-133, Academic Press, New York.
24.
Horie, J. and Vanderkooi,
670, 294-297.
P., and Lewis, P. N.
Symp. Quant. Biol. Data
J. M. (1981) Biochim.
Biophys.
W. A.
Acta


© Copyright 2026