
Confirmatory Factor Analysis of Article 483981
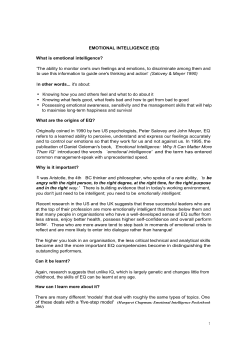
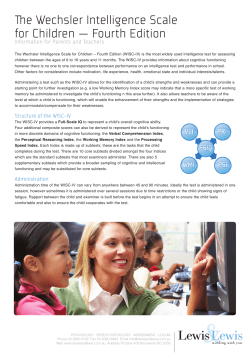
483981 research-article2013 JPA31610.1177/0734282913483981Journal of Psychoeducational AssessmentDevena et al. Article Confirmatory Factor Analysis of the WISC-IV in a Hospital Referral Sample Journal of Psychoeducational Assessment 31(6) 591–599 © 2013 SAGE Publications Reprints and permissions: sagepub.com/journalsPermissions.nav DOI: 10.1177/0734282913483981 jpa.sagepub.com Sarah E. Devena1, Catherine E. Gay1, and Marley W. Watkins2 Abstract Confirmatory factor analysis was used to determine the factor structure of the Wechsler Intelligence Scale for Children–Fourth Edition (WISC-IV) scores of 297 children referred to a children’s hospital in the Southwestern United States. Results support previous findings that indicate the WISC-IV is best represented by a direct hierarchical (bifactor) model including four first-order factors and one general intelligence factor. In this sample, the general intelligence factor accounted for 50% of the total variance and 76% of the common variance. Of the firstorder factors, the Verbal Comprehension factor accounted for the most total (5.6%) and common (8.4%) variance. Furthermore, the general intelligence factor accounted for more variance in each subtest than did its respective first-order factor and it was the only factor that exhibited adequate measurement precision (ωh = .87). These findings support previous recommendations that WISC-IV interpretations should focus on the general intelligence factor over first-order factors. Keywords confirmatory factor analysis, structural validity, intelligence tests, factor loadings Professional standards for the appropriate use of psychological assessments should include determining and evaluating whether a specific assessment is suitable for its intended purpose based on the validity and reliability evidence (American Educational Research Association, American Psychological Association, and National Council on Measurement in Education, 1999). In terms of validity, construct validity is of particular interest. Construct validity refers to the appropriateness of interpretations and actions that are derived from test scores (Messick, 1995). There are numerous important facets of construct validity (i.e., test content, relationship to external sources, consequences of test scores, etc.). However, the most important may be internal structure or structural validity. Assessment of structural validity, both through exploratory (EFA) and confirmatory (CFA) factor analyses, determines whether the structure of the assessment instrument appropriately matches the theoretical structure of the construct of interest. Specifically, the construct is analyzed with EFA to establish an underlying factor structure and with CFA to verify a 1Arizona 2Baylor State University, Tempe, AZ, USA University, Waco, TX, USA Corresponding Author: Sarah E. Devena, Educational Psychology, Arizona State University, P.O. Box 871811, Tempe, AZ 85287-1811, USA. Email: [email protected] Downloaded from jpa.sagepub.com at BAYLOR LIBRARY on November 28, 2013 592 Journal of Psychoeducational Assessment 31(6) Figure 1. Direct hierarchical model for the Wechsler Intelligence Scale for Children-Fourth Edition in a hospital sample of 297 children. Note. g = general intelligence; VC = Verbal Comprehension; PR = Perceptual Reasoning; WM = Working Memory; PS = Processing Speed; VO = Vocabulary; SI = Similarities; CO = Comprehension; BD = Block Design; PCn = Picture Concepts; MR = Matrix Reasoning; DS = Digit Span; LN = Letter-Number Sequencing; CD = Coding; and SS = Symbol Search. previously established structure (O’Brien, 2007). Without clear evidence of structural validity it is not possible to understand what construct is actually being measured (Messick, 1995). Structural validity evidence is especially critical for evaluating tests of intelligence like the Wechsler Intelligence Scale for Children–Fourth Edition (WISC-IV; Wechsler, 2003) that are regularly used by psychologists in high-stakes decisions. WISC-IV factors can be conceptualized using either indirect or direct hierarchical models. In an indirect model (see Figure 2), the relationship between higher order factors and a variable is fully mediated by the lower order factors. In a direct model (see Figure 1), sometimes called the bifactor model (Holzinger & Swineford, 1937) or the nested factor model (Gustafsson & Balke, 1993), each variable is distinguished by the direct effect it has on another without mediation (Reise, 2012). Factors are then defined by either their level in the model or by their breadth of observed variables (Gignac, 2008). Evidence from EFA and CFA of the WISC-IV standardization sample supported a first-order, four-factor structure (Wechsler, 2003). Independent research has generally substantiated this structure (Chen & Zhu, 2008) but has also endorsed a hierarchical structure with four first-order factors and a higher order general intelligence factor (Chen, Keith, Weiss, Zhu, & Li, 2010; Keith, Fine, Taub, Reynolds, & Kranzler, 2006). Although the structural validity results acquired from standardization samples are important, the WISC-IV is primarily used with children with suspected disabilities. Consequently, its structure for children with suspected and confirmed disabilities should also be evaluated to ensure that the structural validity found with the standardization sample generalizes to that unique population of test takers (American Educational Research Association, American Psychological Association, and National Council on Measurement in Education, 1999). Downloaded from jpa.sagepub.com at BAYLOR LIBRARY on November 28, 2013 593 Devena et al. Figure 2. Indirect hierarchical model for the Wechsler Intelligence Scale for Children–Fourth Edition in a hospital sample of 297 children. Note. g = general intelligence; VC = Verbal Comprehension; PR = Perceptual Reasoning; WM = Working Memory; PS = Processing Speed; VO = Vocabulary; SI = Similarities; CO = Comprehension, BD = Block Design; PCn = Picture Concepts; MR = Matrix Reasoning; DS = Digit Span; LN = Letter-Number Sequencing; CD = Coding; and SS = Symbol Search. To date, only four studies have investigated the structure of the WISC-IV in referral samples. The first study applied EFA methods to the WISC-IV core subtest scores of 432 students who were referred for a psychoeducational evaluation in Pennsylvania schools (Watkins, Wilson, Kotz, Carbone, & Babula, 2006). Using the exploratory bifactor methods (e.g., Schmid & Leiman’s 1957 orthogonalization method) recommended by Carroll (1995), four group factors and a broad general factor were found. The second study applied CFA methods to WISC-IV scores from a national sample of 355 students who were referred for evaluation to determine special education eligibility (Watkins, 2010). Model fit statistics indicated that the direct and indirect hierarchical models both exhibited good fit to the data, but the direct hierarchical model was slightly superior. The third study assessed the WISC-IV factor structure by applying CFA methods to a sample of 344 children who received neuropsychological examinations in the Southeastern United States (Bodin, Pardini, Burns, & Stevens, 2009). Global fit indices indicated good fit for an indirect hierarchical model, but a direct hierarchical model was not tested. The final study assessed the measurement invariance of WISC-IV scores from 550 children with diverse clinical diagnoses that were sampled as part of the WISC-IV standardization research (Chen & Zhu, 2012). Goodness-of-fit indexes supported an indirect hierarchical four-factor model, but a direct hierarchical model was not tested. All four studies produced similar results: (a) a hierarchical structure with four first-order factors plus a general intelligence factor, and (b) the general factor accounted for more total and common variance than the first-order factors. Downloaded from jpa.sagepub.com at BAYLOR LIBRARY on November 28, 2013 594 Journal of Psychoeducational Assessment 31(6) Although important, these independent studies were still restricted to local samples with a variety of disorders. Additional studies from different locales with different referral samples are also needed (Bodin et al., 2009; Strauss, Sherman, & Spreen, 2006, p. 334) because the validity of a structural model is further enhanced if the same model can be replicated in new samples (Raykov & Marcoulides, 2000). Without replication, clinical interpretations and treatment decisions associated with this intelligence test remain unclear. Consequently, the structure of the WISC–IV core battery was analyzed using CFA methods on a diverse sample of children referred for evaluation at a children’s hospital in the Southwestern United States. Method The WISC-IV is an individually administered cognitive test composed of 10 mandatory subtests that form a Full Scale IQ (FSIQ) and four factor index composites. The Verbal Comprehension (VCI) factor is comprised by the Similarities, Vocabulary, and Comprehension subtests. The Perceptual Reasoning (PRI) factor is formed by the Block Design, Picture Concepts, and Matrix Reasoning subtests. The Working Memory (WMI) factor is loaded by the Digit Span and LetterNumber Sequencing subtests, and the Processing Speed (PSI) factor is formed by the Coding and Symbol Search subtests. Detailed descriptions of each subtest are available from Wechsler (2003) and from Strauss et al. (2006). As noted by Strauss et al. (2006, p. 331) “the internal reliability of the WISC-IV is excellent.” For example, the average internal consistency coefficients were .94 for VCI, .92 for PRI, .92 for WMI, .88 for PSI, and .97 for the FSIQ. Test-retest stability coefficients have also been high: .89 for VCI, .85 for PRI, .85 for WMI, .79 for PSI, and .89 for FSIQ for 243 children retested at intervals ranging from 13 to 63 days (Wechsler, 2003). WISC-IV scores have also demonstrated strong correlations with cognitive and achievement tests (Wechsler, 2003). These psychometric properties persuaded Strauss et al. (2006, p. 336) to judge that “overall, the WISC-IV is an excellent test.” Following IRB approval, children’s WISC-IV scores and diagnoses were collected by doctoral students in school psychology, who were serving as hospital volunteers, from 322 psychology department files at a children’s hospital located in the Southwest. The data were collected for all active referrals from the hospital’s outpatient practice, which treats both neurological and behavioral conditions in children. Within the 322 files, there were 297 with scores on all 10 core subtests of the WISC-IV. These 297 participants (63% male) ranged in age from 6 through 15 years (M = 10.5, SD = 2.76). The five most frequent diagnoses were no disorder (26.6%), ADHD (18.2%), mixed neuropsychological deficit (8.4%), autism and Asperger’s (6.7%), and learning disorder (5.4%). More than 35 other diagnoses were found among the remaining 34.7% of the sample, including bipolar, leukemia, anxiety, depression, Epstein-Barr virus, neurofibromatosis, PTSD, mental retardation, selective mutism, and so forth. Information on participants’ ethnicity and language was specified for only approximately 20% of the hospital referral sample and as a result is not reported. CFA was conducted using maximum likelihood estimation in Mplus 6.1. Following previous WISC-IV structural analyses, four first-order models and two hierarchical models were specified: (a) one factor; (b) two oblique verbal and nonverbal factors; (c) three oblique verbal, perceptual, and working memory/processing speed factors; (d) four oblique verbal, perceptual, working memory, and processing speed factors; (e) an indirect hierarchical model (as per Bodin et al., 2009; Chen & Zhu, 2012) with four first-order factors; and (f) a direct hierarchical model (as per Watkins, 2010) with four first-order factors. Although there is as yet no consensus on the proper cutoff values for CFA fit indices (Marsh, Hau, & Wen, 2004), Hu and Bentler (1998, 1999) recommended a dual cutoff value of .95 for the comparative fit index (CFI) and .06 for the root mean square error of approximation (RMSEA) Downloaded from jpa.sagepub.com at BAYLOR LIBRARY on November 28, 2013 595 Devena et al. Table 1. Descriptive Statistics for Wechsler Intelligence Scale for Children–Fourth Edition Scores in a Hospital Sample of 297 Children. Subtest Mean SD Skew Kurtosis Similarities Vocabulary Comprehension Block design Picture concepts Matrix reasoning Digit span Letter-number sequencing Coding Symbol search Verbal Comprehension Index Perceptual Reasoning Index Working Memory Index Processing Speed Index Full scale IQ 9.55 8.90 9.15 8.91 9.80 9.55 8.23 8.58 7.18 8.19 95.69 96.86 91.78 90.34 93.43 3.52 3.41 3.37 3.08 3.32 3.31 3.05 3.50 3.50 3.49 17.63 16.84 16.67 18.12 18.98 0.00 0.01 –0.25 –0.10 –0.36 –0.21 –0.19 –0.43 0.40 –0.30 –0.14 –0.33 –0.33 0.00 –0.33 –0.45 –0.43 –0.07 –0.04 0.06 –0.09 –0.21 –0.20 0.22 –0.42 –0.20 0.10 –0.01 –0.22 –0.15 Table 2. Fit Statistics for Alternative Models for the Wechsler Intelligence Scale for Children–Fourth Edition in a Hospital Sample of 297 Children. Model One factor Two factors Three factors Four Factors Indirect hierarchical Direct hierarchical† χ2 df CFI ΔCFI RMSEA (90% CI) BIC ΔBIC 272.94 183.33 123.86 59.03 68.49 60.57 35 34 32 29 31 27 .867 .916 .949 .983 .979 .981 — .049 .033 .034 -.004 .002 .151 [.135, .168] .122 [.105, .139] .098 [.080, .117] .059 [.037, .081] .064 [.043, .084] .065 [.043, .087] 14213.1 14129.1 14081.1 14033.3 14031.4 14046.2 — 84.0 48.0 47.8 1.9 14.8 Note. df = degrees of freedom; CFI = comparative fit index; RMSEA = root mean square error of approximation; BIC = Bayesian information criteria. †Two variables per factor are insufficient for identification of a factor (Raykov & Marcoulides, 2000). Thus the loading of two subtests on the third and fourth first-order factors were constrained to be equal to allow identification. Resulting loadings were reasonable estimates, per the loading of these variables in the indirect hierarchical model (see Figure 2) and in an EFA of the standardization sample (Wechsler, 2003). to ensure against both Type I and Type II errors. These fit indices were supplemented with chisquare and Bayesian information criterion (BIC) values. Differences between the models were evaluated using CFI and BIC where ΔCFI > .01 and ΔBIC > 5 indicated meaningful change (Cheung & Rensvold, 2002; Raftery, 1995). Results and Discussion As with other clinical samples, scores were lower than average (see Table 1). However, subtest scores appeared to be relatively normally distributed with the largest univariate skew and kurtosis less than 1, no influential outliers, and multivariate kurtosis less than 1. CFA fit statistics are reported in Table 2. As with other structural analyses of the WISC-IV, the first-order models with one to three oblique factors were inferior to the four-factor oblique model and the two hierarchical models. In essence, the three best fitting models all met a priori Downloaded from jpa.sagepub.com at BAYLOR LIBRARY on November 28, 2013 596 Journal of Psychoeducational Assessment 31(6) Table 3. Sources of Variance in the Wechsler Intelligence Scale for Children–Fourth Edition in a Hospital Sample of 297 Children Based on a Direct Hierarchical Model. General Subtest SI VO CO BD PCn MR DS LN CD SS % Total Var % Common Var VC PR b Var b Var .71 .80 .75 .65 .71 .77 .65 .76 .59 .70 49.7 64.0 55.5 42.1 49.8 59.1 42.5 57.8 34.5 49.1 50.4 75.6 .44 .53 .30 19.3 28.2 8.8 b .35 .27 .30 WM Var b PS Var b Var 12.4 7.1 9.2 .44 .38 18.9 14.4 .47 .47 5.6 8.4 2.9 4.3 3.3 5.0 22.0 22.2 4.4 6.6 h2 u2 .69 .31 .92 .08 .64 .36 .55 .45 .57 .43 .68 .32 .61 .39 .72 .28 .56 .44 .71 .29 66.7 33.3 Note. b = loading of subtest on factor; Var = variance explained; h2 = communality; u2 = uniqueness; VC = Verbal Comprehension factor; PR = Perceptual Reasoning factor; WM = Working Memory factor; PS = Processing Speed factor; h2 = communality; SI = Similarities; VO = Vocabulary; CO = Comprehension; BD = Block Design; PCn = Picture Concepts; MR = Matrix Reasoning; DS = Digit Span; LN = Letter-Number Sequencing; CD = Coding; and SS = Symbol Search. guidelines for a good fitting model; however, no model was consistently superior across all fit statistics. Nevertheless, the theoretical structure of the WISC-IV suggests that one of the hierarchical models that incorporate general intelligence should be preferred. Figures 1 and 2 display direct and indirect hierarchical models, respectively, with standardized loadings. Although not supported by all researchers (Keith et al., 2006), the ease of interpretation and breadth of influence of the direct hierarchical model recommends that model over the indirect hierarchical model (Chen, Hayes, Carver, Laurenceau, & Zhang, 2012; Gignac, 2008; Reise, 2012). As is apparent from Table 3, the general intelligence factor accounted for more variance in each subtest than did its respective first-order factor. The general intelligence factor explained a higher amount of variance on the Similarities, Vocabulary, and Comprehension subtests making up the VC factor than the first order factor itself (49.7%, 64%, and 55.5% vs. 19.3%, 28.2%, and 8.8%, respectively). This was also true for the Block Design, Picture Concepts, and Matrix Reasoning subtests that make up the PR factor (42.1%, 49.8%, and 59.1% vs. 12.4%, 7.1%, and 9.2%, respectively), and the Digit Span and Coding subtest that make up the WM factor (42.5%, and 57.8% vs. 18.9% and 14.4%, respectively). Lastly, the variance in the VC factor subtests of Letter-Number Sequencing and Symbol Search was better accounted for by the general intelligence factor (34.5% and 49.1% vs. 22% and 22.2%, respectively). These results are similar to the other structural validity studies on referral samples where the general intelligence factor typically accounted for more variance in each subtest than did the respective first-order factors (Bodin et al., 2009; Watkins, 2010; Watkins et al., 2006). Similarly, prior investigations of the WISC-IV in referral samples found that the general factor accounted for 47% to 48% of the total variance and 72% to 77% of the common variance, whereas in this sample the general intelligence factor accounted for 50% of the total variance and 76% of the common variance. As clearly illustrated in Figure 2, the direct hierarchical model hypothesizes that each WISC-IV subtest is independently influenced by two latent constructs: the general ability factor (g) and one broad group factor (VC, PR, WM, or PS). For instance, variability of the Vocabulary Downloaded from jpa.sagepub.com at BAYLOR LIBRARY on November 28, 2013 597 Devena et al. subtest is due to both g and VC. Likewise, variability of the MR subtest is due to both g and PR. Of course, each subtest also contains variance that is specific to itself, due to neither g nor group factors. This third influence might be called error in classical test theory or uniqueness in CFA. Traditionally, computation of internal consistency reliability estimates of group factor scores inappropriately considers all consistent variability to be true score variance caused by that group factor alone (Yang & Green, 2011). Thus, the consistent variance contributed by both g and the group factor is inappropriately attributed to the group factor alone. However, it is possible to disentangle the contributions of the g and group factors to obtain a model-based estimate of score reliability that indexes the measurement precision of each factor independent of the others (Brunner, Nagy, & Wilhelm, 2012). Called omega hierarchical (ωh; Zinbarg, Revelle, Yovel, & Li, 2005), this index ranges from 0, indicating no reliability, to 1, indicating perfect reliability. Using the computational methods of Brunner et al. (2012), ωh for the VCI, PRI, WMI, PSI, and FSIQ were .22, .13, .20, .27, and .87, respectively. Thus only the general intelligence factor exhibited adequate measurement precision. A limitation of the current study is the use of a very heterogeneous sample that consisted of children referred to a clinic for neuropsychological evaluation. The use of factor analysis procedures to establish construct validity with heterogeneous samples has been criticized (Delis, Jacobson, Bondi, Hamilton, & Salmon, 2003). However, heterogeneous samples appear to be the norm when school and hospital referrals are analyzed (Bodin et al., 2009; Watkins, 2010; Watkins et al., 2006). Furthermore, similar results were obtained in two supplemental analyses when the children without disabilities and children with ADHD were excluded, respectively. Despite this limitation, the replication of results from different samples in different locales selected in different ways lends support to the conclusion that the WISC-IV is best considered within a hierarchical structure that includes four first-order factors that account for small amounts of variance plus a general intelligence factor that accounts for large amounts of variance. Additionally, WISC-IV group factor scores appear to lack measurement precision (ωh values of .13 to .27) and previous research has demonstrated that they have little incremental predictive validity (Glutting, Watkins, Konold, & McDermott, 2006; Watkins, Glutting, & Lei, 2007). Thus the recommendations of previous researchers that clinicians “should not ignore the contribution of g” (Bodin et al., 2009, p. 422) and “should favor the interpretation of the general intelligence score over the narrow factor scores” (Watkins, 2010, p. 786), when interpreting the WISC-IV, were both verified and reinforced. Acknowledgment The assistance of Michael S. Lavoie, PhD is gratefully acknowledged. Declaration of Conflicting Interests The authors declared no potential conflicts of interest with respect to the research, authorship, and/or publication of this article. Funding The authors received no financial support for the research, authorship, and/or publication of this article. References American Educational Research Association, American Psychological Association, and National Council on Measurement in Education. (1999). Standards for education and psychological testing. Washington, DC: American Educational Research Association. Bodin, D., Pardini, D. A., Burns, T. G., & Stevens, A. B. (2009). Higher order factor structure of the WISC-IV in a clinical neuropsychological sample. Child Neuropsychology, 15, 417-424. Downloaded from jpa.sagepub.com at BAYLOR LIBRARY on November 28, 2013 598 Journal of Psychoeducational Assessment 31(6) Brunner, M., Nagy, G., & Wilhelm, O. (2012). A tutorial on hierarchically structured constructs. Journal of Personality, 80, 796-846. Carroll, J. B. (1995). On methodology in the study of cognitive abilities. Multivariate Behavioral Research, 30, 429-452. Chen, F. F., Hayes, A., Carver, C. S., Laurenceau, J.-P., & Zhang, Z. (2012). Modeling general and specific variance in multifaceted constructs: A comparison of the bifactor model to other approaches. Journal of Personality, 80, 219-251. Chen, H., Keith, T. Z., Weiss, L., Zhu, J., & Li, Y. (2010). Testing for multigroup invariance of secondorder WISC-IV structure across China, Hong Kong, Macau, and Taiwan. Personality and Individual Differences, 49, 677-682. Chen, H., & Zhu, J. (2008). Factor invariance between genders on the Wechsler Intelligence Scale for Children–Fourth Edition. Personality and Individual Differences, 45, 260-266. Chen, H., & Zhu, J. (2012). Measurement invariance of WISC-IV across normative and clinical samples. Personality and Individual Differences, 52, 161-166. Cheung, G. W., & Rensvold, R. B. (2002). Evaluating goodness-of-fit indexes for testing measurement invariance. Structural Equation Modeling, 9, 233-255. Delis, D. C., Jacobson, M., Bondi, M. W., Hamilton, J. M., & Salmon, D. P. (2003). The myth of testing construct validity using factor analysis or correlations with normal or mixed clinical populations: Lessons from memory assessment. Journal of the International Neuropsychological Society, 9, 936-946. Gignac, G. E. (2008). Higher-order models versus direct hierarchical models: g as superordinate or breadth factor. Psychology Science Quarterly, 50, 21-43. Glutting, J. J., Watkins, M. W., Konold, T. R., & McDermott, P. A. (2006). Distinctions without a difference: The utility of observed versus latent factors from the WISC-IV in estimating reading and math achievement on the WIAT-II. Journal of Special Education, 40, 103-114. Gustafsson, J.-E., & Balke, G. (1993). General and specific abilities as predictors of school achievement. Multivariate Behavioral Research, 28, 407-434. Holzinger, K. J., & Swineford, F. (1937). The bi-factor method. Psychometrika, 2, 41-54. Hu, L., & Bentler, P. M. (1998). Fit indices in covariance structure modeling: Sensitivity to under parameterized model misspecification. Psychological Methods, 3, 424-453. Hu, L., & Bentler, P. M. (1999). Cutoff criteria for fit indexes in covariance structure analysis: Conventional criteria versus new alternatives. Structural Equation Modeling, 6, 1-55. Keith, T. Z., Fine, J. G., Taub, G. E., Reynolds, M. R., & Kranzler, J. H. (2006). Higher order, multisample, confirmatory factor analysis of the Wechsler Intelligence Scale for Children–Fourth Edition: What does it measure? School Psychology Review, 35, 108-127. Marsh, H. W., Hau, K.-T., & Wen, Z. (2004). In search of golden rules: Comment on hypothesis-testing approaches to setting cutoff values for fit indexes and dangers in overgeneralizing Hu and Bentler’s (1999) findings. Structural Equation Modeling, 11, 320-341. Messick, S. (1995). Validity of psychological assessment: Validation of inferences from persons’ responses and performance as scientific inquiry into score meaning. American Psychologist, 50, 741-749. O’Brien, K. (2007). Factor analysis: An overview in the field of measurement. Physiotherapy Canada, 59, 142-155. Raftery, A. E. (1995). Bayesian model selection in social research. Sociological Methodology, 25, 111-163. Raykov, T., & Marcoulides, G. A. (2000). A first course in structural equation modeling. Mahwah, NJ: Lawrence Erlbaum. Reise, S. P. (2012). The rediscovery of bifactor measurement models. Multivariate Behavioral Research, 47, 667-696. Schmid, J., & Leiman, J. M. (1957). The development of hierarchical factor solutions. Psychometrika, 22, 53-61. Strauss, E., Sherman, E. M. S., & Spreen, O. (2006). A compendium of neuropsychological tests: Administration, norms, and commentary. New York, NY: Oxford University Press. Watkins, M. W. (2010). Structure of the Wechsler Intelligence Scale for Children-Fourth Edition among a national sample of referred students. Psychological Assessment, 22, 782-787. Watkins, M. W., Glutting, J. J., & Lei, P.-W. (2007). Validity of the full scale IQ when there is significant variability among WISC-III and WISC-IV factor scores. Applied Neuropsychology, 14, 13-20. Downloaded from jpa.sagepub.com at BAYLOR LIBRARY on November 28, 2013 599 Devena et al. Watkins, M. W., Wilson, S. M., Kotz, K. M., Carbone, M. C., & Babula, T. (2006). Factor structure of the Wechsler Intelligence Scale for Children-Fourth Edition among referred students. Educational and Psychological Measurement, 66, 975-983. Wechsler, D. (2003). Wechsler Intelligence Scale for Children-Fourth Edition. San Antonio, TX: Psychological Corporation. Yang, Y., & Green, S. B. (2011). Coefficient alpha: A reliability coefficient for the 21st century? Journal of Psychoeducational Assessment, 29, 377-392. Zinbarg, R. E., Revelle, W., Yovel, I., & Li, W. (2005). Cronbach’s alpha, Revelle's beta, and McDonald’s omega h: Their relations with each other and two alternative conceptualizations of reliability. Psychometrika, 70, 123-133. Downloaded from jpa.sagepub.com at BAYLOR LIBRARY on November 28, 2013


© Copyright 2026