
STRUCTURE AND ATOMIC DYNAMICS IN CONDENSED MATTER UNDER PRESSURE
STRUCTURE AND ATOMIC DYNAMICS
IN CONDENSED MATTER UNDER PRESSURE
AND LI-ION BATTERY MATERIALS
A Thesis Submitted to the College of
Graduate Studies and Research
In Partial Fulfillment of the Requirements
For the Degree of Doctor of Philosophy
In the Department of Physics and Engineering Physics
University of Saskatchewan
Saskatoon
By
Jianjun Yang
Copyright Jianjun Yang, February, 2014. All rights reserved.
PERMISSION TO USE
In presenting this thesis in partial fulfilment of the requirements for a Postgraduate
degree from the University of Saskatchewan, I agree that the Libraries of this University may
make it freely available for inspection. I further agree that permission for copying of this thesis
in any manner, in whole or in part, for scholarly purposes may be granted by the professor or
professors who supervised my thesis work or, in their absence, by the Head of the Department or
the Dean of the College in which my thesis work was done. It is understood that any copying or
publication or use of this thesis or parts thereof for financial gain shall not be allowed without
my written permission. It is also understood that due recognition shall be given to me and to the
University of Saskatchewan in any scholarly use which may be made of any material in my
thesis.
Requests for permission to copy or to make other use of material in this thesis in whole or
part should be addressed to:
Head of the Department of Physics and Engineering Physics
116 Science Place
University of Saskatchewan
Saskatoon, Saskatchewan
Canada
S7N 5E2
i
ABSTRACT
The main goal of this research was to apply first-principles electronic structure
calculations to investigate atomic motions in several condensed materials. This thesis consists of
five separate but related topics that are classified into two main categories: structure of materials
under pressure and Li ion dynamics in lithium battery materials.
The atomic structure of liquid gallium was investigated in order to resolve a controversy
about an anomalous structural feature observed in the x-ray and neutron scattering patterns. We
explored the pressure effect when modifying the liquid structure close to the solid-liquid melting
line. The atomic trajectories obtained from first-principles molecular dynamics (FPMD)
calculations were examined. The results clarified the local structure of liquid gallium and
explained the origin of a peculiar feature observed in the measured static structure factor. We
also studied the structure of a recently discovered phase-IV of solid hydrogen over a broad
pressure range near room temperature. The results revealed novel structural dynamics of
hydrogen under extreme pressure. Unprecedented large amplitude fluxional atomic dynamics
were observed. The results helped to elucidate the complex vibrational spectra of this highlycompressed solid.
The atomic dynamics of Li ions in cathode, anode, and electrolyte materials - the three
main components of a lithium ion battery - were also studied. On LiFePO4, a promising cathode
material, we found that in addition to the commonly accepted one-dimensional diffusion along
the Li channels in the crystal structure, a second but less obvious multi-step Li migration through
the formation of Li-Fe antisites was identified. This discovery confirms the two-dimensional Li
diffusion model reported in several Li conductivity measurements and illustrates the importance
ii
of the distribution of intrinsic defects in the enhancement of Li transport ability. The possibility
of using type-II clathrate Si136 as an anode material was investigated. It was found that lithiated
Si-clathrates are intrinsic metals and their crystal structures are very stable. Calculations revealed
the charge and discharge voltages are very low and almost independent of the Li concentrations,
an ideal property for an anode material. Significantly, migration pathways for Li ions diffusing
through the cavities of the clathrate structures were found to be rather complex. Finally, the
feasibility of a family of Li3PS4 crystalline and nanoporous cluster phases were studied for
application as solid electrolytes. It was found that the ionic conductivity in the nanocluster is
much higher than in crystalline phases. It is anticipated that the knowledge gained in the study of
battery materials will assist in future design of new materials with improved battery charge and
discharge performance.
iii
ACKNOWLEDGMENTS
There are many wonderful colleagues and friends surrounded me during my PhD study at
the University of Saskatchewan. I would have never been able to complete my thesis without
their contributions and support and I would like to acknowledge their importance to my thesis
journey.
Firstly, I would like to express my deepest gratitude to my supervisor, Professor John
Tse, who offered me the opportunity to pursue the PhD study with him four years ago and has
provided help at all stages of this thesis. He deserves thanks for the continuous support in many
aspects, whether it was providing excellent academic guidance, exposure to wide scientific
interests, financial contributions, great patience, friendly care, or thoughtful career advice. His
vision and ability to grasp the essence of physics in a complicated problem; his deep and vast
knowledge of condensed matter physics; and his enthusiasm for science have greatly influenced
me and my future professional development.
I appreciate all of my thesis committee members: Professor Andrei Smolyakov, Professor
Masoud Ghezelbash, and Professor Burgess Ian for their time, encouragement and insightful
comments.
I would like to thank all fellow students and postdocs from Professor Tse’s group for the
collaborations, fruitful discussions and willingness to share their skills and interests. I enjoyed
the collaboration with Hui Wang on the hydrogen project. Although I spent a shorter amount of
time with Hanyu Liu, we had a lot of fruitful and interesting scientific discussions. Xue Yong
generously shared her skills with much scientific software. The names of all other group
members also deserve a mention: Niloofar Zarifi, Jianbao Zhao, Garimella Subrahmanyam, Jun
iv
Yang, Jianjun Yang (male), and Min Wu. I enjoyed and benefited a lot from many scientific and
non-scientific conversations with them.
A special thanks to Professor Gapsoo Chang for his support and guidance throughout my
teaching experience. Additionally, I wish to thank Professor Yansun Yao for his help and
instructive suggestions on potential career paths. My appreciation goes to Paul Bazylewski for
his willingness to correct my written English and share his ideas over the lab demonstrations. I
would also like to thank the secretaries of my department, Ms. Debbie Parker and Marj
Granrude, for taking care of administrative matters.
I owe big thanks to my husband Donghui Wu for his deep love and unhesitating support
of the time commitment required for this thesis work. I am also indebted to my two sons,
Jackson and Alan, for their love and patience. This thesis work demanded a lot of my time that
they deserved to have and enjoy. My sincere thanks also go to all my family members from
China for their eternal love and care.
Finally, I am very grateful to the AUTO21 for financial support on the study of Li-ion
batteries.
v
TABLE OF CONTENTS
page
PERMISSION TO USE ................................................................................................................... i
ABSTRACT .................................................................................................................................... ii
ACKNOWLEDGMENTS ............................................................................................................. iv
TABLE OF CONTENTS ............................................................................................................... vi
LIST OF TABLES ......................................................................................................................... ix
LIST OF FIGURES ........................................................................................................................ x
LIST OF ABBREVIATIONS ...................................................................................................... xiii
INTRODUCTION .......................................................................................................................... 1
1.1 Condensed matter under pressure ......................................................................................... 2
1.1.1 Structure of liquid gallium .......................................................................................... 3
1.1.2 Atomic dynamics in phase-IV solid hydrogen ............................................................ 4
1.2 Lithium-ion battery materials ............................................................................................... 5
1.3 Thesis outline ...................................................................................................................... 10
1.4 Research contributions ........................................................................................................ 11
COMPUTATIONAL METHODOLOGY .................................................................................... 13
2.1 Electronic structure theory and the density functional theory ............................................ 14
2.1.1 Hohenberg-Kohn theorems ....................................................................................... 16
2.1.2 Kohn-Sham equations ............................................................................................... 17
2.1.3 Exchange-correlation functionals.............................................................................. 18
2.1.4 DFT+U ...................................................................................................................... 21
2.1.5 Periodic boundary conditions, and k-point sampling ................................................ 23
2.1.6 Plane-wave basis sets ................................................................................................ 25
2.1.7 Pseudopotential approximation ................................................................................. 26
2.1.8 Self-consistent solution ............................................................................................. 28
2.2 Nudged elastic band method ............................................................................................... 30
2.3 First-principles molecular dynamics ................................................................................... 31
2.3.1 A simple MD program .............................................................................................. 32
2.3.2 Velocity Verlet algorithm ......................................................................................... 34
2.3.3 Post-processing methods ........................................................................................... 35
Trajectory colour coding ............................................................................................. 36
Time-correlation functions.......................................................................................... 37
vi
Mean squared displacement ........................................................................................ 40
2.5 First-principles software ..................................................................................................... 41
STRUCTURE AND DYNAMICS IN CONDENSED MATTERS UNDER PRESSURE.......... 43
3.1 Dynamical structure of liquid gallium at ambient and high pressures................................ 44
3.1.1 Computational details ............................................................................................... 46
3.1.2 Results and discussions ............................................................................................. 48
3.1.3 Conclusions ............................................................................................................... 59
3.2 Structure and dynamics of dense hydrogen ........................................................................ 61
3.2.1 Theoretical methodology details ............................................................................... 65
3.2.2 Fluxional structure of phase-IV ................................................................................ 66
3.2.3 Transition to the metallic Cmca-4 phase................................................................... 73
3.2.4 Vibrational properties of phases-IV and Cmca-4...................................................... 74
3.2.5 Structures and structural transformations of solid hydrogen at low pressure ........... 76
3.2.6 Conclusions ............................................................................................................... 83
IONIC TRANSPORT IN LI-ION BATTERY MATERIALS ..................................................... 84
4.1 Cathode: LiFePO4 ............................................................................................................... 85
4.1.1 Computational details ............................................................................................... 89
4.1.2 Li self-diffusion mechamisms ................................................................................... 90
4.1.3 Conclusions ............................................................................................................... 97
4.2 Anode: Type-II Si Clathrate................................................................................................ 98
4.2.1 Introduction ............................................................................................................... 98
4.2.2 Computational details ............................................................................................. 100
4.2.3 Results and discussions ........................................................................................... 101
Crystal structure and stability ................................................................................... 101
Electronic structure ................................................................................................... 106
Li-intercalation voltage ............................................................................................. 107
Li diffusion barrier and mechanism .......................................................................... 108
Storage Capacity ....................................................................................................... 116
4.2.4 Conclusions ............................................................................................................. 117
4.3 Solid Electrolyte: Li3PS4 ................................................................................................... 118
4.3.1 Introduction ............................................................................................................. 118
4.3.2 Computational details ............................................................................................. 120
4.3.3 Results and discussions ........................................................................................... 122
Electrochemical window........................................................................................... 122
Li diffusion in crystals .............................................................................................. 123
Li diffusion in nanoporous Li3PS4 ............................................................................ 126
4.3.4 Conclusions ............................................................................................................. 128
SUMMARY AND PERSPECTIVES ......................................................................................... 130
vii
5.1 Summary ........................................................................................................................... 130
5.2 Perspectives....................................................................................................................... 133
REFERENCES ........................................................................................................................... 135
viii
LIST OF TABLES
Table
page
Table 3. 1 Comparison of the optimized structures of Ga-I, Ga-II Ga-III with experimental
results ................................................................................................................................ 47
Table 4. 1 Comparison of calculated and experimental structural parameters and bandgaps of
LiFePO4............................................................................................................................. 90
Table 4. 2 Formation energy of clathrates LixSi34 (x≤6) upon lithiation ..................................... 103
Table 4. 3 Formation energy of clathrates NaxSi136 (x≤8) upon lithiation .................................. 104
Table 4. 4 Formation energy and volume change of clathrates LixBa2Si34 (x≤4) upon lithiation.
......................................................................................................................................... 106
Table 4. 5 Summary of the MD simulations on three different Li3PS4 phases ........................... 129
ix
LIST OF FIGURES
Figure
page
Figure 1. 1 Schematic energy diagram of a battery cell including the three major components: ... 7
Figure 2. 1 Comparison of the pseudopotential (dashed) Coulombic potential (solid) of an atom
(dashed curves) and the corresponding pseudo wave function (dashed) with the all
electron wave function (solid curves). .............................................................................. 27
Figure 2. 2 A simplified depiction of reconstructed PAW wave function.................................... 28
Figure 2. 3 Flowchart illustrating the basic steps in the Kohn-Sham self-consistency loop. ....... 29
Figure 2. 4 A schematic potential energy surface showing the minimum energy pathway as
determined by the nudged elastic band method. ............................................................... 31
Figure 2. 6 Illustration of the trajectories of several atoms represented with different colours. .. 36
Figure 2. 7 The normalized velocity autocorrelation function. .................................................... 38
Figure 2. 8 Fourier transform of the velocity autocorrelation function. ....................................... 39
Figure 2. 9 The mean square displacement as a function of time. ................................................ 41
Figure 3. 1 Phase diagram of Ga. .................................................................................................. 45
Figure 3. 2 (a) Comparison of static structure factors of our calculated l-Ga at 0 GPa and 300K
(solid square line)and the experimental result of that at 0 GPa and 293K (hollow circle
line) [11]. (b) Comparison of experimental [73] and calculated G(r)at 1.72 and 1.6 GPa,
respectively. ...................................................................................................................... 50
Figure 3. 3 Comparison of radial distribution function g(r) of l-Ga near melting temperature ... 51
Figure 3. 4 Calculated static structure factor S(q) for l-Ga near melting temperature.................. 52
Figure 3. 5 (a) Calculated x-ray absorption spectra (XAS) of l-Ga; (b) Difference of calculated
XAS () spectra between 1.6 and 0 GPa........................................................................ 53
Figure 3. 6 Calculated vibrational density of states (VDOS) of liquid Ga at different pressures. 55
Figure 3. 7 Comparison of the calculated (a) angular distribution function g(θ) and (b) radial
distribution function g(r) of l-Ga at 2.5 GPa with those of experimental crystalline Ga-II
and Ga-III. ......................................................................................................................... 57
Figure 3. 8 Comparison of the total density of states for l-Ga and solid Ga-I, Ga-II and Ga-III. 58
x
Figure 3. 9 High-pressure phase diagram of solid molecular hydrogen from experimental
measurements. ................................................................................................................... 61
Figure 3. 10 Proposed structure of phase-IV of hydrogen with two distinct layers ..................... 63
Figure 3. 11 Molecular dynamics trajectories of the two distinct layers from Pbcn structure for
different pressures near room temperature. ...................................................................... 67
Figure 3. 12 Split trajectories on the two distinct layers of hydrogen at 300 GPa and 280 K. ..... 68
Figure 3. 13 Intralayer H transfer within G-layer shown with five continuous time spans of
trajectories. ........................................................................................................................ 70
Figure 3. 14 The H-H distances between two neighbouring atoms within the hexagon from the
G-layer. ............................................................................................................................. 71
Figure 3. 15 Comparison of diffraction pattern calculated from the MD trajectory with the static
Pc structure ....................................................................................................................... 72
Figure 3. 16 Crystal structure of solid hydrogen in Cmca-4 phase. ............................................. 73
Figure 3. 17 Charge density isosurfaces for the Cmca-4 metallic phase ...................................... 74
Figure 3. 18 Power spectra for hydrogen at different conditions. ................................................ 75
Figure 3. 19 Raman spectra of solid hydrogen with pressure. ...................................................... 76
Figure 3. 20 Calculated IR spectra for solid H2 at different pressures. ........................................ 78
Figure 3. 21 Vibron frequencies from calculated and experimental IR as a function of pressure.79
Figure 3. 22 Trajectories of solid hydrogen as a function of pressure. Viewed along y-direction.
........................................................................................................................................... 80
Figure 3. 23 Trajectories of solid hydrogen as a function of pressure. Viewed along x-direction.
........................................................................................................................................... 81
Figure 3. 24 Relaxation time from the time autocorrelation function of P2 ( ) 1 (3cos 2 1) of
2
hydrogen molecules in the solid state at pressures between 25-160 GPa. The phase-I II
transition is indicated by the red arrow. ............................................................................ 82
Figure 4. 1 Polyhedral representation of LiFePO4 crystal structure in a unit cell ........................ 87
Figure 4. 2 Time evolution function of relative Li-O distances within a LiO6 octahedron involved
in the crystal LiFePO4. ...................................................................................................... 91
Figure 4. 3 Snapshots from the MD simulation of the fully lithiated LiFePO4 at 2000 K ........... 92
xi
Figure 4. 4 Trajectories of the three Li atoms originally situated in the crystalline LiFePO4
structure along the b-axis obtained from the MD simulation at 2000 K. ......................... 94
Figure 4. 5 Snapshots from the MD simulation of the fully lithiated LiFePO4 at 2000 K showing
the second diffusion mechanism ....................................................................................... 96
Figure 4. 6 Crystal structure of a type II Si136 clathrate .............................................................. 102
Figure 4. 7 Formation energy Eform and the percentage of volume change of Ba-doped clathrates
......................................................................................................................................... 104
Figure 4. 8 Bandstructures for pristine Si34 clathrate (Si136 in the cubic cell) and metal-doped
clathrates ......................................................................................................................... 107
Figure 4. 9 Calculated average voltage of Li intercalation in Ba2Si34 as a function of Li content.
......................................................................................................................................... 108
Figure 4. 10 Potential energy curves along the reaction path between two small 512 cages through
the shared pentagonal face .............................................................................................. 110
Figure 4. 11 The Li diffusion potential energy along the successive reaction path 512→ 51264 and
51264→ 51264.................................................................................................................... 112
Figure 4. 12 Calculated DOS of optimized β- and γ-Li3PS4 crystals. ......................................... 122
Figure 4. 13 Trajectories for Li ions in perfect crystal γ-Li3PS4................................................. 123
Figure 4. 14 The trajectory of a particular Li atom (rose colour dots) in the β-Li3PS4 crystal ... 124
Figure 4. 15 The MSD as a function of time t for (a) γ- and (b) β-phases of Li3PS4 .................. 125
Figure 4. 16 The route for a selected concerted diffusion process in the cluster model of β-Li3PS4
......................................................................................................................................... 128
xii
LIST OF ABBREVIATIONS
1D
2D
3D
BZ
CN
cNEB
D
DFT
DOS
EV
EXAFS
fcc
FPMD
GGA
hcp
HEV
HOMO
INS
IR
IXS
KS
LDA
LIBs
LSDA
LUMO
MD
MEP
MSD
NEB
NPT
NVT
PAW
PBC
PBE
PW
PW91
One-dimensional
Two-dimensional
Three-dimensional
Brillouin zone
Coordination number
Climbing nudged elastic band
Diffusion coefficient
Density functional theories
Electronic density of states
All-electric vehicles
Extended X-Ray Absorption Fine Structure
Face-centered cubic
First-principles molecular dynamics
Generalized Gradient Approximation
Hexagonal close pack
Hybrid electric vehicles
The highest occupied molecular orbital
Inelastic neutron scattering
Infrared
Inelastic X-ray scattering
Kohn-Sham
Local Density Approximation
Li-ion batteries
Local spin density approximation
The lowest unoccupied molecular orbital
Molecular dynamics
Minimum energy path
Mean square displacement
Nudged elastic band
Constant-pressure and constant-temperature
Constant-volume and constant-temperature
Projector Augmented Waves
Periodic boundary conditions
Perdew-Burke-Ernzerhof
Plane-wave
Perdew-Wang 91
xiii
Quantum-ESPRESSO
RDF
S(q)
SEI
VACF
VASP
VDOS
XAS
ZPE
Open Source Package for Research in Electronic
Structure, Simulation, and Optimization
Radial distribution function
Static structure factor
Solid-electrolyte-interface
Velocity autocorrelation function
Vienna Ab-initio Simulation Package
Vibrational density of states
X-ray absorption
Zero-point energy
xiv
CHAPTER 1
INTRODUCTION
Atomic dynamics always plays an important role in the properties of condensed systems.
Atomic diffusion can occur in both ordered and disordered systems [1], with the most obvious
example being a molten liquid lacking long-range order. It is generally assumed that local
structures in liquids tend to show short-range ordering within a few tenths of a nanometer,
resembling the atomic arrangements in their solid counterparts [2]. While it is intuitively obvious
that the structure of a molten system is disordered and thus exhibits atomic motions, atomic
diffusion in solids that are ordered or partially-disordered is also of practical interest.
Furthermore, crystals containing molecules or complex ions have additional complexity in
comparison with a usual liquid because they possess orientational as well as translational degrees
of freedom. They can therefore exhibit a variety of orientational and translational disorders. A
large number of crystals composed of diatomic, high-symmetry (i.e., tetrahedral), and more
complex organic molecules [3, 4] are known to exhibit a rotor phase. One example of a solid
with rotational disorder is the simplest diatomic system formed by isotopes of hydrogen [1, 5]; a
class of solids exhibiting significant atomic motion is represented by superionic materials. These
solids exhibit characteristics of both a solid and a liquid simultaneously. Above a critical
temperature, one atomic species in the material may exhibit liquid-like ionic conductivities and
dynamic disorder within the rigid crystalline structure of the others (partial lattice melting). The
abrupt change in ionic mobility during this phase transition has be explored for practical
applications such as solid-state electrolytes and resistance switching devices [6, 7].
1
In spite of extensive interest and repeated applications of these disordered condensed
systems, fundamental questions concerning the microscopic origin and mechanisms of atomic
dynamical behaviour associated with the structural properties for a number of systems have not
yet been fully clarified. Atomistic numerical simulations with well-established first-principles
methods have proven to be indispensable complements to experimental measurements. By
analyzing the trajectory, mechanisms of the transport process can be elucidated at the atomic
level. With the rapid increase in computational power and development of advanced electronic
structure algorithms of high numerical accuracy, the variety and complexity of materials
susceptible to modelling has increased dramatically over recent years. The objective of this thesis
is to apply first-principles computational simulations to explore the structural and dynamical
properties of selected condensed systems at both ambient and high-pressure conditions. The
topics studied can be classified into two categories: atomic dynamics in condensed matter under
pressure, and Li ion transports in the cathode, anode, and solid electrolyte materials of
rechargeable Li-ion batteries (LIBs) at ambient pressure.
1.1 Condensed matter under pressure
Significant questions in geophysics, planetary physics, and applied materials science
address the concern with the physical and electronic properties of solids under high pressure. At
high pressure, ambient structures of most condensed systems can be modified dramatically. As a
result, novel electronic properties and atomic dynamics may emerge in the new phases. In this
thesis, the structure and dynamics of two condensed systems, liquid gallium (l-Ga) and solid
hydrogen, will be studied.
2
1.1.1 Structure of liquid gallium
Inelastic neutron scattering (INS) and X-ray scattering (IXS) are the two most common
techniques for studying structure and atomic dynamics in condensed matter [8]. Generally, for
simple liquid metal the measured static structure factor, S(q), shows a symmetrical first sharp
peak. In comparison, liquids from covalently bonded solids, such as those of group IV elements
(Si, Ge, etc.), often exhibit a distinct shoulder at the high q (q = 4/sin, where is the
wavelength and is the scattering angle) side of the first peak in the S(q) [9]. Furthermore, high
pressure measurements have revealed that the contraction of liquid alkali metals is almost
uniform [8], whereas those of group IV elemental liquids are anisotropic [9].
Recently, INS and IXS experiments on l-Ga over a broad temperature range have been
performed [10-14]. Similar to group-IV elemental liquid like Si or Ge, researchers found that the
structure factor S(q) in liquid Ga also displays a distinct shoulder at the high q side of the first
peak, which is indicative of a covalent behaviour. In contrast, the coordination number was
found to range from 10 to 12 when the l-Ga is close to the melting point, showing a property
similar to typical densely-packed simple liquid metals instead. The unique feature in l-Ga has
motivated many investigations to explain the origin of the characteristic shoulder in the first peak
of S(q); of a particular note is that the pressure effect on the liquid structure have been conducted
by a series of experiments using INS, IXS and extended x-ray absorption (XAS) [15, 16]. For
this purpose, first-principles molecular dynamics (FPMD) simulations were performed on l-Ga at
a number of temperature and pressure (P,T) points. From the obtained trajectories, the structure
factors and the XAS spectra were computed and compared with available experimental results
3
[15, 16]. The validity of previously proposed local structures was carefully examined with the
help of vibrational density of states. Finally, the electronic structure of the l-Ga was compared
with that of the underlying solid phases existing in the similar P-T range.
1.1.2 Atomic dynamics in phase-IV solid hydrogen
Being the lightest and the most abundant element in the universe, hydrogen is a
fascinating substance and is of special interest to the high-pressure and astrophysics scientific
communities [5, 17, 18]. Phase-I solid H2 is formed by freezing the liquid at ambient pressure.
The phase has a hexagonal close pack (hcp) lattice, but the hydrogen molecules rotate randomly
about their center of mass [19]. Upon compression, solid hydrogen undergoes a series of phase
transitions where the orientational and translational orders are modified. At low temperatures, it
transforms into a quantum broken symmetry phase (phase-II) at pressures of 10 (50) GPa for H2
(D2) and phase-III at 150 (165) GPa [20]. However, because of the limited information, such
molecular orientations in phases II and III have not been fully determined. Partially-orientational
ordering was suggested through the experimental observation that the center of mass of the H2
molecule still remains close to the hcp lattice sites of phase-I up to 183 GPa [21].
The
transformation into phase-III is evidenced with distinctive enhancement in the infrared
absorptivity [22]. Recent theoretical calculations have predicted a fully ordered structure with the
space group symmetry of C2/c to be the best candidate [23]. More recently, a new phase was
discovered when phase-III was compressed to nearly 220 GPa at room temperature [24].
Experimental results on this newly discovered phase (phase-IV) [24, 25] are still sparse, but a
dramatic change of the Raman spectra indicates a substantial change in the crystal structure.
4
Based on the Raman results, this new phase was suggested to have a layered structure with
alternating molecular Br2-like and atomic graphene-like planes [25].
Perhaps the most investigated topic regarding solid hydrogen is the possible insulator-tometal transition. Early theoretical predictions suggested that hydrogen would become atomic and
metallic at high pressure [26], and the atomic metallic phase (>500 GPa) was predicted to be a
high temperature superconductor [27]. So far, the metallic phase has not been detected
experimentally although the transition is anticipated. Theoretical studies generally agree that the
transition pressure to atomic and metallic phase exists above 300 GPa and has an orthorhombic
Cmca-4 space group [5, 17, 28]. Therefore, the orientational dynamics of the H2 molecules must
experience a series of continual changes with compression starting from the low pressure
molecular phase-I to the atomic phase at high pressure. Since there are difficulties in determining
the crystal structure of hydrogen at high pressure, first-principles calculations have been an
invaluable tool to gain insight into this yet unidentified phase. In the present study, the FPMD
simulation method is shown to be a very powerful tool in examining the evolution of
orientational dynamics as well as the structural transformations of dense solid hydrogen,
particularly of phase-IV.
1.2 Lithium-ion battery materials
Rechargeable lithium-ion batteries (LIBs) are one of the key components in the portable
entertainment, computing and telecommunication equipment in today’s information-rich and
mobile society. Despite impressive growth in worldwide sales of batteries, battery technology
advancement has generally lagged behind other technology sectors such as semiconductors.
5
While it is true that energy storage capacity may not keep pace with the rate of progress in the
computer industry, recent advances in lithium batteries, particularly at the material level, give
hope that the performance will soon be dramatically improved. If this expectation materializes, it
will signify a tremendous shift in the battery industry, offering promise for many applications
that require better batteries; for example, the expansion of hybrid electric vehicles (HEV) into
plug-in HEV and all-electric vehicles (EV) may benefit from such improvements.
Despite the advantages of their high energy density and design flexibility, LIBs still have
several shortcomings. For example, some component materials cost too much and for some
systems they may be unsafe or unreliable, and the energy density is not sufficiently high to be
useful in large scale applications. Therefore, a breakthrough in the design technology of the LIBs
is urgently needed to meet rapidly increasing demands.
The performance of a battery is determined by the intrinsic properties of its component
materials. A rechargeable LIB consists of three main components: a positive electrode (cathode),
a negative electrode (anode), and an electrolyte (Li ionic conduction medium). On discharge,
electrons flow from the anode through an external circuit to the cathode and Li ions migrate from
the anode to the cathode through the electrolyte to retain charge neutrality. The reverse happens
in the charging process. The anode is the reductant and the cathode is the oxidant. During
discharge, the chemical reaction is used to produce electricity. Figure 1. 1 shows a schematic
energy level diagram of the three principal components of a typical battery [29].
6
Figure 1. 1 Schematic energy diagram of a battery cell including the three major
components: the cathode, anode, and electrolyte. ΦA and ΦC are the anode and cathode
work functions, respectively. Eg is the window of the electrolyte for the thermodynamic
stability. (Reproduced with permission from Ref. [29])
Theoretical calculations can contribute to understanding and improving the design of the
electrochemical processes. The energy separation Eg between the lowest unoccupied molecular
orbital (LUMO) and the highest occupied molecular orbital (HOMO) of the electrolyte is the
window of the electrolyte. The two electrodes are conductors with the Fermi levels (or
electrochemical potentials) of EFA and EFC for anode and cathode, respectively, which have to be
located within the window of the electrolyte to ensure thermodynamic stability of the battery.
Therefore, the open-circuit voltage Voc of a battery cell is constrained to the difference between
the chemical potentials of the two electrodes,
eVoc EFA EFC Eg ,
7
(1.1)
where e is the magnitude of the electron charge. The chemical reactions at the electrodes
determine the battery voltage. The specific capacity is the reversible charge transfer per unit
weight (Ah/g) between the electrodes. The energy density (Wh/g) of a battery cell is expressed as
the product of the capacity and the voltage, determined by the chemistry of the two electrodes.
A major challenge in battery development is to maximize the energy density, both
gravimetric and volumetric, as many applications constrain the size and/or weight of the battery.
For automotive applications, both volume and weight of a battery are important. Currently, the
best LIBs for HEVs have energy densities of about 75 Wh/kg and 100 Wh/L, while the best LIBs
for battery EVs have energy densities of about 160 Wh/kg and 320 Wh/L [30]. Batteries with
high voltages can be constructed by selecting appropriate cathode and anode materials. Graphite
is the most commonly used anode material for LIBs, and it operates at a voltage potential close
to lithium metal, the low-voltage limit of electrochemical reactions. Therefore, there is little
opportunity to increase cell voltage by lowering the voltage of the anode. The recent focus thus
turns to the search for high voltage cathode materials [31]. It is important to note, however, that
any potential electrode material is not expected to provide the desired performance in all possible
aspects. Rather, it has to be chosen according to its practical application. For example, if a fast
charging/discharging rate is required, as is the case with HEV or EV industries, rapid Li
transport in all component materials is critical to fulfill that purpose.
In addition to the high energy density, the safety issue of LIBs is also crucial in large
scale energy storage systems. Currently, most LIBs employ organic liquids as the electrolyte.
This choice has created safety problems (e.g., explosion and fire) and has posed a limit for
achieving high energy density. For example, liquid electrolytes are expected to react with
graphite anode to form a solid-electrolyte-interface (SEI) layer that can significantly decrease
8
battery performance and contribute to the aforementioned safety problems. To address those
issues, efforts have been made to replace traditional liquid electrolytes with solid electrolytes [7].
However, the major challenge in practical applications of these solid electrolytes is the relatively
low ionic conductivity that is insufficient to meet the LIB’s requirements. To search for better
solid Li electrolyte materials, further understanding of the Li transport mechanisms will help to
improve the ionic conductivity.
From a theoretical perspective, developing rechargeable batteries for use in EVs and
other large-scale applications poses two main challenges: the choice of proper electrode
materials with the Fermi levels matched well to the window of the electrolyte and the choice of
proper electrolyte materials with a larger energy window, allowing a thermodynamically stable
voltage higher than 4V (the current electrolyte energy window).
Generally, cathodes and anodes differ mainly in their half-cell voltages (related to their
Fermi levels, EFC and EFA, respectively). In addition to the tailoring of the EFC/ EFA to the
HOMO/LUMO of the electrolyte to be employed, a useful electrode material must meet the
following requirements:
is able to intercalate lithium in a reversible manner;
has high/low voltage for cathode/anode;
transports Li quickly during the insertion and removal processes;
serves as a good electron conductor, preferably a metal;
is both chemically and structurally stable;
is cost-efficient;
and is environmentally benign.
9
For solid electrolytes, being used to replace aqueous solvents, the most important
elements to consider are the following:
large electrolyte window Eg;
low electronic conductivity (< 10-10 S/cm);
high Li ionic conductivity (>10-4 S/cm over the temperature range of battery
operation);
and good chemical stability.
First-principles molecular dynamics were performed on selected cathodes, anodes, and
solid electrolytes of interest. The thesis focuses on the energetics for the migration pathways of
Li ions in the electrodes and electrolytes to characterize the transport mechanisms in the three
main components of a LIB.
1.3 Thesis outline
The focus of this thesis is on the study of structural and dynamical properties of
condensed systems at both ambient and high-pressure conditions through first-principles
computational methods. There are two separate objectives: to characterize the structure and
atomic dynamics for materials under compression and to investigate Li transport mechanisms in
the battery materials at the atomic level. The latter will help with the design of rechargeable LIBs
with improved charge and discharge rate.
This thesis is composed of five chapters. The general introduction and the overview of
the research is presented in Chapter 1. The essential background of the computational
methodologies is described in Chapter 2. Chapter 3 presents results from the study of the atomic
10
dynamics under pressure. The first subject to be investigated is the elucidation of the structure of
molten gallium, followed by an examination of hydrogen dynamics in highly compressed solid
hydrogen. In Chapter 4, results on the studies of Li transport properties in the cathode, anode,
and electrolyte – the three major components of a LIB – are presented. The thesis concludes with
a summary of the research and a presentation of future perspectives in Chapter 5.
1.4 Research contributions
A large portion of the research described in this thesis, namely studies of, liquid Ga, solid
hydrogen, Li cathode and anode, has been published in four scientific papers. The remaining
work in the last section (Sec. 3.2.5) of Chapter 3 as well as Li transport in Li3PS4 solid
electrolytes is under preparation. In addition, during the course of study, I have contributed one
review article that was published as one chapter in a book on Li ion batteries. The references are
listed as follows:
Published:
1.
Alexander F. Goncharov, John S. Tse, Hui Wang, Jianjun Yang, Viktor Struzhkin,
Ross T. Howie, and Eugene Gregoryanz, Bonding, structures, and bandgap closure of hydrogen
at high pressures. Phys. Rev. B 87, 024101 (2013).
2.
Jianjun Yang and John S. Tse, Si Clathrates as Anode Materials for Lithium Ion
Batteries? J. Mater. Chem. A 1, 7782 (2013).
3.
Jianjun Yang and John S. Tse, Li Ion Diffusion Mechanisms in LiFePO4 – an Ab
Initio Molecular Dynamics Study, J. Phys. Chem. A 115, 13045 (2011).
11
4.
Jianjun Yang, John S. Tse, and Toshi Iitaka, First-principles Study of Liquid
Gallium at Ambient and High Pressure, J. Chem. Phys., 135, 044507 (2011).
5.
John S. Tse, and Jianjun Yang, First-principles methods in the modeling of Li-ion
battery materials, in “Lithium-Ion Batteries: Advanced Materials and Technologies” X. Yuan, H.
Liu and J. Zhang (Eds), the CRC Press 253-302 (2011).
In preparation:
1.
Jianjun Yang and John S. Tse, Near room temperature phase transition of
hydrogen at low pressure – an Ab Initio Molecular Dynamics Study, 2014.
2.
Jianjun Yang and John S. Tse, First-principles Molecular Dynamics Study on the
Li transport mechanisms in the solid electrolyte Li3PS4, 2014.
12
CHAPTER 2
COMPUTATIONAL METHODOLOGY
Even in classical mechanics, the dynamics of a system consisting of more than two
bodies has no general analytical solution. To bypass this problem, a method that has proven
useful in many cases is numerical simulation. Within the realm of numerical methods, one way
to simulate the dynamical properties of a material at the atomic scale is to use molecular
dynamics (MD) calculations. In a condensed system, the collective behaviours of the atomic
nuclei and electrons can be simulated by first-principles or ab initio methods.
First-principles methods, where properties of materials are predicted from the principles
of quantum mechanics, are the most powerful tools in physics and chemistry. These methods are
based on the basic laws of physics and do not require any experimental input beyond information
on the constituent elements and sometimes the crystal structure. While the static ground state of a
condensed system at zero temperature can be calculated through electronic structure theory,
temperature effects can be simulated using MD methods. The macroscopic temperature is
equated to the average kinetic energy via the equipartition theorem. MD calculations can also
provide information on the temporal evolution of the atomic positions and velocities. Therefore,
it is a method that helps to bridge the microscopic structures and macroscopic properties
observed experimentally.
First-principles molecular dynamics (FPMD) technique is a unification of classical
molecular dynamics and electronic structure methods to “realistically” simulate complex manybody systems. This method has been employed in the investigation of a large number of
13
physical, chemical and biological phenomena. It is an indispensable tool in the study of the
dynamics of crystalline and disordered condensed systems. In this thesis, all calculations were
performed with first-principles methods, including electronic structure calculations, geometry
optimization, and MD simulations. In this chapter, the theoretical background of these methods
will be introduced briefly. We start with the density functional theories (DFT) in which all
calculations were based. DFT is an exact quantum mechanical theory of correlated many-body
systems and has tremendous impact on the calculation of the electronic structure of solids. Next,
the FPMD method employed in the thesis work is introduced. Finally, the major methods to
analyze the theoretical results are presented.
2.1 Electronic structure theory and the density functional theory
The microscopic description of a condensed matter is a system constructed from nuclei
and electrons that interact with each other through Coulomb interactions. According to quantum
mechanics, in principle any observable can be calculated from the appropriate operator in the
integral of the wave function over space, where the wave function of the system is determined by
solving the many-body Schrödinger equation
H ({ri , R I }) E({ri , R I })
,
(2.1)
where H is the Hamiltonian for the system of electrons and nuclei (in CGS units), and
H H ee H eN H NN
i
I
2
2me
2
2M I
i2
Z I e2
1
e2
2 i , j (i j ) ri r j i , I ri R I
2I
Z I Z J e2
1
.
2 I ,J (I J ) R I R J
14
(2.2)
Here, the upper and lower case indices represent nuclei and electrons, respectively. RI (ri) and
MI (me) represent the corresponding positions and masses of the nucleus (electron), respectively.
ZI is the atomic number and –e is the electron charge. As per the equations above, the
Hamiltonian consists of kinetic energy and potential energy due to interactions between the
nuclei and electrons.
An approximation to decouple the electronic degrees of freedom from the nuclei is the
Born-Oppenheimer approximation [32]. This is motivated mainly by the fact that electrons are
much lighter and therefore move about three orders of magnitude faster than the nuclei. In this
approximation, the nuclei are regarded as fixed ions acting as an external potential. This
approximation has proved to be sufficiently accurate for a large number of interesting systems.
All first-principles calculations performed in this thesis have been done using the BornOppenheimer approximation. The behaviour of interacting electrons in the external potential
created by the nuclei is described by the following Hamiltonian, from Eq.(2.2):
H
i
2
2me
i2
Z I e2
1
e2
.
2 i , j ?i j ri r j i I ri R I
(2.3)
In this equation, the last term is the external potential describing the Coulomb interaction
between the electrons and a given configuration of the nuclei. The periodic boundary condition
(PBC) is imposed for solids such that external potential is determined explicitly by the Bravais
lattice vectors and internal atomic coordinates. The second term in Eq.(2.3) describes the
electron-electron Coulomb interactions. This term involves all electronic degrees of freedom,
which makes it intractable to solve the equation. A remedy is the independent one-electron wave
function which is a very good approximation. This is known as the Hartree approximation, where
the many-body wave function is represented by a product of the wave functions of individual
15
electrons. Taking the fermionic exchange of electrons into account, a Slater-determinant [33] of
independent one-electron wave functions often gives a good approximation.
2.1.1 Hohenberg-Kohn theorems
The basic idea of DFT is to show the electronic density as the basic variable in the
description of a many-body system. This theory dramatically simplifies the many–body
Schrödinger equation (2.3). It is based on two theorems proposed by Hohenberg and Kohn [34]
(H-K) in 1964 wherein the total energy of a system is dependent only upon density.
Theorem 1 For any system of interacting particles in an external Vext (r) potential,,
the external potential and hence the total energy is determined uniquely - except for a constant by the ground state particle n0 (r) density .
Theorem 2 A universal functional for E[n] energy in terms of density n(r ) can be
defined and is valid for any external potential
Vext (r)
. For any particular
Vext (r)
, the exact ground
state energy of the system is the global minimum value of this functional, and the density
n(r ) that minimizes the functional is the exact ground state density n0 (r ) .
The first H-K theorem implies that if the density of the system is known, everything
about the system can be determined since the density of a system corresponds uniquely to the
external potential. Therefore, in order to solve the problem, we only need to find the ground state
density. The second H-K theorem provides a way to do this by finding the ground state energy
functional. However, so far the exact energy functional of an interacting many-body system is
not known. Kohn and Sham [35] have proposed a practical scheme for DFT as will be described
in detail below.
16
2.1.2 Kohn-Sham equations
The Kohn-Sham (KS) approach states that there is a system of non-interacting particles
corresponding to a system of interacting particles with the same ground state density. This
means that instead of solving a system of interacting particles in a “simple” external potential,
we can try to solve a system of independent particles in a “complex” effective potential with the
same electron density, thereby reducing all the many-body interactions in the system to an
effective potential. Therefore, the electrons will only interact through the effective potential.
Following the KS approach [35], a set of single-particle Schrödinger-like equations for
the interacting electron system – known as the Kohn-Sham equations – was derived:
2
2 Veff r i r ii r
2me
(2.4)
with the effective potential defined as,
Veff r Vext r
Exc n r
n r
.
dr
r r
n r
(2.5)
The righthand side of Eq. (2.5) contains the external potential, the electron-density interaction
and the exchange-correlation as represented by the last term. Note that
i r
is the single-
particle wave function in the interacting electrons system often referred to as the KS orbital. The
electron density is simply a sum over squares of the KS orbitals:
n(r) i (r) .
2
(2.6)
i
As a result, the ground state total energy of a quantum matter, including both electrons
and nuclei, can be expressed by a functional of the electron density n(r ) :
17
Etotal [n] Eelectron [n] Eion .
(2.7)
Here, Eion is the Coulomb energy between nuclei determined explicitly by the atomic
configurations. The electronic contribution Eelectron [n] functional is written as,
Eelectron [n(r)] T0 [n(r)]
1
n(r)n(r ')
drdr '
Exc [n(r)] drVext (r)n(r) ,
2
r r'
T0 [n(r)] dri* (r )(
i
2
2me
(2.8)
2 )i (r)
.
(2.9)
As seen in Eq.(2.8), the electron energy consists of the kinetic energy T0 (n) of independent
electrons, the Hartree Coulomb energy, the exchange-correlation energy functional
Exc [n]
and
the external potential energy.
The correct ground-state total energy can be obtained by minimizing the electronic
energy functional in terms of ground-state electron density n(r ) , subject to constraint on the
conserved electron number N:
drn(r) N
V
.
(2.10)
It is important to note in Eq.(2.8) that kinetic energy is calculated from non-interacting
particles and the Hartree term can also be calculated explicitly. However, the exact functional for
the exchange-correlation term
Exc [n]
is unknown, and thus the problem is still intractable. To
address this issue, an approximation to exchange-correlation energy is needed.
2.1.3 Exchange-correlation functionals
18
Up to this point, the DFT approach has provided a practical procedure to solve the manybody problem by transforming the many-body wave function into a set of single-particle
problems. However, due to the unknown exact form of the exchange-correlation term Exc [n] , we
are forced to find approximations for this term to make the formalism useful.
The most common and straightforward approximation to
Exc [n]
is the Local Density
Approximation (LDA) [35]. The intent of the LDA is to treat a general inhomogenous electronic
system as locally homogeneous. It is assumed that the exchange-correlation energy per electron
of a non-uniform system at any point in space is equal to the exchange-correlation energy per
electron in a uniform electron gas having the same density at this point. Thus,
ExcLDA[n] drn(r) xc [n]
(2.11)
xc [n] xcuniform [n] .
(2.12)
with
By definition, the LDA is local as the xc [n] at each point in space depends only on the
uniform
electron density at that same point. The xc [n] has been calculated and parameterized for
different values of the density using Monte Carlo techniques [36].
Since the LDA is based on uniform electron gas, it is expected to be accurate only for
systems in which the electron density varies very slowly, as with most bulk metals. It is not
suitable for situations where the electron density undergoes rapid changes, as is the case for
covalently-bonded solids, molecules and surface systems. To overcome this drawback and
address the inhomogeneous issue, a new form of exchange-correlation functional was developed,
which depends on the local electron density as well as the spatial density gradient, to improve the
19
LDA. This is called the Generalized Gradient Approximation (GGA) [37-40]. The GGA
functional can be written as
ExcGGA[n] drn(r) xcGGA[n, n] .
Conventionally,
(2.13)
Exc is assumed to be separate as the sum of exchange functional E x and
correlation functional Ec . The ExcGGA can be defined over local exchange as
ExcGGA[n] dr xuniform [n]Fxc [n, n]n(r) ,
(2.14)
where xuniform 3kF / (4 ) is the Slater exchange energy density in the uniform electron
approximation [41]. kF [3 2 n(r)]1/3 is the local Fermi wave vector. The analytic form of Fxc
includes the correlation term Ec and exchange term Fx . Fx is the enhancement factor in the
exchange functional and is a function of a dimensionless density gradient s, defined as
s n(r) (2kF n(r)) . The correlation functional Ec is given by
Ec drn(r){ c [n] H (t,rs ,V )} .
(2.15)
Here, rs is the Seitz radius and is the spin polarization. The parameter t or scale
density gradient is another dimensionless term defined as t n(r) / (2 gks n(r)) where
g [(1 )2/3 (1 )2/3 ] / 2 and ks (4kF / )1/2 . The term c [n] is the correlation energy
density of a uniform electron gas. H (t , rs , ) is the correlation term to be parameterized.
Unlike a unique form for LDA, GGA can have many different forms depending on the
parameterization. Examples of this include the Becke [37], the Becke-Lee-Yang-Parr (BLYP)
[38], the Perdew-Wang 91 (PW91) [39] and its simplified version, the Perdew-Burke-Ernzerhof
(PBE) [40]. Among this class of functionals, the PBE parameterization [40] is the most
20
successful and commonly used. In the PBE functional, the exchange enhancement factor is
denoted as
FxPBE ( s) 1
where
1 s2 /
(2.16)
0.2195 and ~ 0.804 . The correlation term H (t , rs , ) in Eq.(2.15) is written
as
1 At 2
H (t , rs , ) g 3 log 1 t 2
2
2 4
1 At A t
(2.17)
with ~ 0.0667 , ~ 0.031 and
(r , )
A exp c s3 1
g
1
.
(2.18)
Significant improvements have been observed using the PBE functional over the LDA in
the prediction of total energies, structural geometries, bulk modulus, atomic total energies and
vibrational properties.
2.1.4 DFT+U
Despite the great success of DFT with LDA and GGA functionals, there are still inherent
deficiencies when describing strongly correlated effects (e.g., between localized d electrons in
the transition metal oxides [40]). Additionally, since the Coulomb and exchange terms are
calculated separately in Eq.(2.5), the self-interaction is not canceled exactly.
The shortcomings for the correlation and self-interaction effects with DFT can be
amended with a simple DFT+U scheme based on the Hubbard model [42, 43]. Since the strong
on-site Coulomb interaction is the source of strong electron correlation, the main idea of the
21
DFT+U method is to separate electrons into two subsystems: the strongly localized d (or f for the
lanthanides) electrons and the delocalized s and p electrons. While the latter case still could be
described using an orbital-independent one-electron potential such as LDA or GGA, the strong
d-d Coulomb interaction in the former case is taken into account by adding a term,
1
EU U ni n j , in the Hamiltonian. Here, U is the Hubbard parameter and ni (nj) is the
2 i j
occupancy of the ith (jth) d (or f) orbital. This method can be summarized by the expression of
the new functional
E DFT U n E DFT n EU ni E dc ni ,
(2.19)
where E dc ni is called the “double counting” term. As this term is included explicitly in the
Hubbard term, it is necessary to remove the energy contribution of these orbitals in the
LDA/GGA functional so as not to count them twice. E dc is approximated as the mean-field value
of the Hubbard term EU . Therefore, the mean value of E dc is UN(N-1)/2, where N is the total
number of d (f) electrons N ni . The U value varies for different transition metals, which
i
makes determining the appropriate U for each compound a necessity. The value of U can be
determined theoretically using methods such as the recently developed linear response method
[43]. A simple approach involves selecting the value to match experimentally measured
properties such as magnetic moments, band gaps [44] or lithium insertion voltages [45]. GGA+U
calculations are used widely in combination with the plane-wave basis sets, as will be explained
in the next section. In most cases this approach permits very accurate reproduction of electronic
structures of insulators/semiconductors such as the band gap that is strongly underestimated in
standard DFT calculations.
22
2.1.5 Periodic boundary conditions, and k-point sampling
Since there exists a large number of electrons (on the order of Avogradro’s number
6.0221023) in a solid or other condensed matter, the solutions to the KS equations in Eq.(2.4)
are still intractable. While the one-electron wave function of a metallic solid extends throughout
the entire system, the basis set required to expand the KS orbital is infinite. Fortunately, perfect
crystals can be described as spatially repeated unit cells that contain only a small number of
nuclei and electrons. This leads to the use of PBC according to the Bloch theorem. The Bloch
theorem states that the solution of the single-particle Schrödinger equation (i.e., KS equation) in
the presence of a periodic potential must have the form
j (k, r) eikr u j (k, r) ,
(2.20)
where j represents the band, k represents the wave vector of the electron in the first Brillouin
zone (BZ) and u j (k , r) is a periodic function where u j (k, r) u j (k, r R) for any reciprocal
lattice vector R. Thus, Eq. (2.20) can be rewritten as
j (k, r R) eikR j (k, r) .
(2.21)
By substituting Eq.(2.21) into the KS equation Eq.(2.4), a new set of eigen-equations,
each for a given k, was found. Each electron occupies an electronic state of definite wave vector
k. The Bloch wave functions confine the calculation of a very large system (approximately
Avogadro’s number) into a single unit cell. Therefore, the problem of solving for an infinite
number (~1023) of electrons within the extended system is converted to solving for a finite
number of electronic bands at an infinite number of k-points within the single (reciprocal) unit
cell. Changing from one infinite number to another, however, does not make the problem
simpler. Knowing that electronic wave functions at those k-points being close to each other are
23
very similar, in practice, one can represent the wave functions over a small region of reciprocal
space around one k-point by the wave function at that k-point. Therefore, only a finite number of
k-points are needed to determine the ground state of solids.
Many efficient schemes have been developed for k-point sampling inside the first BZ.
Using these schemes, one can obtain very good approximations for the electron potential and
total energy of a solid. Any integral over almost continuous k-points in the first BZ is thus
represented by the summation over a k-points mesh
V
dkf (k )
(2 )3 V
f (k )w
i
i
,
(2.22)
i
where wi is the weight of the point ki. The most widely used scheme for the k-point sampling
was developed by Monkhorst and Pack [46], known as the MP mesh. The MP mesh utilizes the
space group symmetries of the lattice to reduce the number of k points by confining the sampling
only to the irreducible wedge of the first BZ. The k-points are also selected according to their
point group symmetries, which in turn determines the weight wi. This scheme achieves a
sufficient sampling with a very small number of k-points. The density of allowed k-points is
generally proportional to the volume of the solid. The magnitude of error in the calculated total
energy due to insufficient k-point sampling can always be reduced by using a denser k-point
mesh.
It is noted that in addition to bulk solids, PBC can also be applied in the study of nonperiodic systems such as isolated molecules and surfaces. For example, when studying surfaces it
is common to retain periodicity in two dimensions and discard it in the direction perpendicular to
the surface. In some cases, even the study of a liquid can make use of PBC in the first-principles
calculations, as long as the size of the model system is large enough.
24
2.1.6 Plane-wave basis sets
Up to this point, it is possible to solve the KS equations in Eq.(2.4) with approximations
of exchange-correlation functionals and by employing PBC. It is noted in Eq.(2.20) that in order
to solve the KS equations numerically, KS orbitals need to be expanded by well-behaved basis
sets such as plane-wave (PW) or atomic orbitals. The PW basis set is the most straightforward
for solids. Plane-waves are exact eigenfunctions of the homogeneous electron gas. Plane-waves
are not biased to any particular atom or its position. They form a complete basis set with very
simple mathematical functions. The completeness of the basis set is easy to adjust and essentially
only requires one parameter known as the kinetic energy cutoff Ecut .
Using the PW basis set, the KS orbital can be expanded as
j (k , r) eikr u j (k , r)
1
V
c
j ,k G
eiGr eik r ,
(2.23)
G
where G is the reciprocal lattice vector. In principle, an infinite basis set of G should be used to
expand the KS orbital. In practice, it is possible to truncate the infinite basis set to include only
the PWs with kinetic energies less than a defined cutoff energy Ecut :
k G Gcut
(2.24)
with
Ecut
2
2me
2
Gcut
.
(2.25)
It can be seen from the above two equations that the number of PWs differs for each k-point.
Clearly, the truncation of the PW basis set will introduce some error in the calculated total
energy. However, this error should gradually decrease by increasing the energy cutoff Ecut . It is
25
noted that a larger energy cutoff will increase the computational workload significantly.
Therefore, in practical calculations, the assigned Ecut value should be well-tested to reach a good
convergence of the calculated total energy but maintain an affordable computational efficiency.
2.1.7 Pseudopotential approximation
One of the main problems with the use of PWs as a basis set is the expensive PW
expansion in the core region. Since the potential at the nuclear core region is steep (~ 1/r) and all
one-particle wave functions have to be orthogonal, the resulting orbital wave functions oscillate
rapidly in the core region. Expanding oscillatory wave functions requires a large number of PW
components. One way to solve this problem is to modify the potential. The modified potential is
known as pseudopotential [47]. Since the core region of the atom is usually not involved in the
bonding of specific materials, the core electrons and ionic potential can be pre-calculated and
replaced with a smooth (nodeless) part, making the PW expansion much more effective. In this
approximation, only the valence electrons outside the core region are considered. The
pseudopotential acts on a set of pseudo wave functions instead of the true valence wave
functions.
As a general rule, the constructed pseudopotential and pseudo wave functions should be
identical to the all-electron potential and valence wave function in the valence region r rc , as
shown in Figure 2. 1. The cutoff radius rc is determined by the fact that the core regions of
neighbouring atoms should not overlap. Choosing a smaller core cutoff radius usually means
improving the transferability of the pseudopotential, making it suitable for a more diverse
26
chemical environment. However, a small core cutoff also makes the pseudo wave functions
tighter and therefore more PWs are needed in the expansion.
Figure 2. 1 Comparison of the pseudopotential (dashed) Coulombic potential (solid) of
an atom (dashed curves) and the corresponding pseudo wave function (dashed) with the
all electron wave function (solid curves).
The Projector Augmented Waves (PAW) method [16] is an alternative to the
pseudopotential method. In principle, PAW is an all-electron potential that has been
demonstrated as a very successful scheme for accurate and efficient calculation of the electronic
structure of materials. PAW potential takes advantage of many ideas developed in the
pseudopotential concept by reconstructing all-electron core wave functions from the pseudo
wave functions in the core region [48]. When the all-electron partial waves are added to the total
wave function, the corresponding pseudo partial waves must be subtracted (see Figure 2. 2). The
27
reconstructed all-electron wave function is therefore a combination of the pseudo wave function
outside the core region and the all-electron wave function inside the core region [48].
Figure 2. 2 A simplified depiction of reconstructed PAW wave function that contains
onsite and out-of-site contributions from all-electron and pseudo wave functions.
2.1.8 Self-consistent solution
All ingredients needed to practically solve the KS equations are now completely
described. In practice, the ground-state electron density can be solved self-consistently using the
pseudopotential plane-wave method [49, 50]. This procedure is illustrated in the flow chart in
Figure 2. 3.
The self-consistent calculation starts with an initial guess of electron density that is
usually constructed by superimposing the electron densities of non-interacting atoms. From this
electron density an effective potential Veff (n) is constructed. The set of KS equations can now be
solved for each k-point, producing a set of pseudo wave functions described by a finite set of
PWs and truncated at the kinetic energy cutoff Ecut . The resulting KS orbitals are used to build a
new electron density via Eq.(2.6) and convergence is checked by comparing the output and input
densities. If the difference is beyond a tolerance, one has to construct a new set of potentials
28
using the new electron density and repeat the calculations again. To speed up the convergence,
the new input density can be constructed by mixing the output density from the last step with
previous densities. This calculation is repeated until the solutions are self-consistent, where the
output density is found to be sufficiently close to the input density. Once the convergence is
achieved, the ground-state total energy, KS energies, KS orbitals, as well as forces can be
calculated.
Figure 2. 3 Flowchart illustrating the basic steps in the Kohn-Sham self-consistency
loop.
29
2.2 Nudged elastic band method
The nudged elastic band (NEB) method [51, 52] is used to trace a transition pathway
when both the initial and final structures are known. This method works by interpolating a set of
“images” linearly between the known initial and a guess final structure. The structure of each
“image” is optimized and the total energy is calculated. The “image” is then moved according to
the residual force acting perpendicularly to the path (FNEB), which is an artificial spring force that
keeps the “images” spaced along the minimum energy path (MEP). The procedure is then
repeated when the final minimum energy structure is reached. Each "image" corresponds to a
specific geometry of the atoms on their way from the initial to the final state. Thus, once the
energy of this string of “images” has been calculated, the MEP for the transformation is
obtained. The transition state for the transformation is the highest energy “image” along this
trajectory. A schematic representation of the computational process is shown in Figure 2. 4.
An improved NEB method known as the climbing nudged elastic band (cNEB) scheme
was further developed by Henkelman’s group [53, 54]. In this method, the highest energy
“image” is driven up to the saddle point. This “image” does not feel the spring forces along the
band; rather, its true force along the tangent is inverted. In this way, the “image” tries to
maximize its energy along the band and minimize in all other directions. When this “image”
converges, it will be at the exact saddle point or transition state.
30
Figure 2. 4 A schematic potential energy surface showing the minimum energy
pathway as determined by the nudged elastic band method. (Reproduced from
http://theory.cm.utexas.edu/henkelman/research/saddle/ )
2.3 First-principles molecular dynamics
As discussed above, the ground-state properties of solids can be determined through
DFT-based electronic structure calculations. In practice, the properties observed for a material
are for its electronic state at finite temperatures. MD, sometimes called a “virtual laboratory
approach”, is a numerical method to simulate materials at the atomistic level in order to
understand and predict a system’s behaviours by purely theoretical means. A variety of
thermodynamic properties can be calculated and structural information on temperature dependent
conformational changes can be determined from the MD trajectory. This technique is a popular
computational tool to study dynamical chemical and biological processes and particularly to
study atomic diffusion and the breaking and making of chemical bonds.
31
2.3.1 A simple MD program
Classical molecular dynamics is essentially the propagation of a system according to the
Newtonian equations of motion,
FI M I a I M I R I
(2.26)
FI U (rI ) ,
(2.27)
and
where FI denotes the force exerted on the atoms I by all other atoms in the system and M I , a I
and R I are the mass, acceleration vector, and generalized coordinates of that atom. As can be
seen in Eq.(2.27), force can be calculated from the first derivative of the intermolecular potential
U (rI ) with respect to the coordinate vector rI . Detailed information about the intermolecular
potential will be discussed later. From the two above equations, atomic movements can then be
calculated as a function of time to generate a trajectory.
As necessary inputs for MD simulation, atoms need to have defined positions in space
that can be obtained from the experimental structure. Apart from the atoms’ positions, the
temperature of the system is determined by the starting velocities of the atoms. These velocities
are generated from a random number adhering to the Maxwell distribution at the initial
temperature. As seen in Figure 2.5, the basic MD loop is composed of two steps: the force
evaluation and the integration of the equations of motion.
To solve the Newtonian equations of motion, the forces between atoms have to be
calculated. In FPMD, the instantaneous forces acting on individual atoms are calculated by the
Hellman-Feynman theorem [55] once the wave functions of the system are determined from the
32
self-consistent calculations. With Born-Oppenheimer MD, the electronic structure part is reduced
to solving the ground-state of the stationary Schrödinger equation. In another word, the static
electronic structure problem in each MD step is solvable given the set of fixed nuclear positions
at that instant in time. The resulting Born-Oppenheimer MD in Eqs.(2.26) and (2.27) can be
rewritten as
M I R I (t ) I 0 H e 0 ,
(2.28)
E0 0 H e 0 .
(2.29)
Here, H e is the static Hamiltonian of the electronic system for a given atomic configuration
{R I (t )} at time t, and E0 and 0 are the corresponding ground state energy and wave function.
As shown in Eq. (2.28), the forces acting on the nuclei can be calculated from the
electronic structure calculations. From the Hellmann-Feynman theorem [55], forces calculated
from the SCF wave functions are then used in the Newtonian equations of motion to propagate
the atoms. The most common scheme is the Velocity Verlet method [56], which is numerically
stable and simple to implement. The time step for the integration is usually in the order of
femtoseconds ( 1 fs 1015 s ). The MD loop is executed for each time step (see Figure 2. 5). All
forces between atoms are calculated using the Hellman-Feynman theorem after solving the
Schrödinger equation. Atoms are then propagated according to forces by solving the Newtonian
equations of motion. Relevant properties of the system can be calculated from the atom
positions, velocities and forces. The most important properties are the total energy and the
temperature or kinetic energy of the system. The temperature is important because it directly
influences the atom’s motions. When the simulation is finished, a large amount of data including
33
the instantaneous atomic positions, forces, energies and temperatures is generated. Postprocessing analysis of the collected data can be used to extract relevant physical properties.
Figure 2. 5 The basic MD loop.
2.3.2 Velocity Verlet algorithm
The Velocity Verlet integrator [56] is probably the most commonly used integrator,
giving the trajectories and velocities in a very straightforward way. It provides positions,
velocities and forces at the same time step. This algorithm gives good long-time accuracy at the
34
cost of a poorer short-time accuracy, resulting in shorter allowed timesteps. The positions (r) and
velocities (v) at the next time step are generated by
r (t t ) r (t ) v(t ) t
f (t ) 2
t ,
2m
(2.30)
and
v(t t ) v(t )
f (t t ) f (t )
t ,
2m
(2.31)
where f is the force and m is the mass of the atom. With this method, velocities need to be
calculated based on the velocity and force from the previous time step and the force calculated
from the current position.
2.3.3 Post-processing methods
A large part of the computational work is performed after the MD simulation is complete.
The direct result of any MD simulation is a trajectory containing the positions and velocities of
the particles in a system at discrete time steps. Depending on the desired information, different
analysis methods can be performed. An examination of atomic motions in real space can be
accomplished by highlighting specific atoms with different colours. Calculations of
autocorrelation functions and mean squared displacement functions yield dynamical properties of
the system.
35
Figure 2. 6 Illustration of the trajectories of several atoms represented with different
colours.
Trajectory colour coding
Colour coding was used in this thesis work to investigate the atomic dynamics by
examining the collected atomic trajectory directly. Using this method, the atomic positions along
the simulation (represented by dots in three-dimensional (3D) space) were plotted by assigning
colour codes to different atoms or atomic species. Through an analysis of the evolution of samecoloured dots, the diffusion or other dynamical process of the corresponding atoms can be
identified. These methods are useful to investigate the slow dynamical process (see the LiFePO4
study in Chapter 4) as well as to study possible dynamical structural behaviour (see the hydrogen
system in Chapter 3). For example, Figure 2. 6 shows a colour-coded trajectory for a number of
atoms. When one examines the plot, one notes that the trajectory is a round, cloud-like spread
over fixed lattice sites. Within each cloud, two colours are identified and the colour distribution
is quite even with spherical shape. This indicates that the two atoms are bound together and
rotate around their bond center. Therefore, the rotating molecules can be identified without
further analysis.
36
Time-correlation functions
Time-correlation functions are an effective and intuitive way of representing the
dynamics of a system. They provide a statistical description of the time-evolution of a variable
for an ensemble at thermal equilibrium. A time-correlation function is defined as
C (t ) A(0) A(t ) ,
where
(2.32)
represents an ensemble average and A is the dynamic variable of interest (e.g.,
velocity, bond fluctuation, vector reorientation, etc.) Eq.(2.32) is technically a time
autocorrelation function, as it correlates the same variable at two points in time. The
autocorrelation function measures how the value of a dynamic quantity A at time t is dependent
on its initial value. It describes how long a given property of a system persists until it is averaged
out by microscopic motions and interactions with its surroundings. It also describes how and
when the statistical relationship vanishes. If the temporal value of A(t) is comparable with the
value at zero time A(0), this indicates that the property represented by A is highly correlated. In a
liquid, this often happens in a short time interval but the correlation eventually decays to zero at
long-time.
Since the atomic velocities are manifestations of the dynamics in a system, the atom
velocity autocorrelation function (VACF) is the most convenient way to analyze dynamical
properties. Information about relevant dynamical processes is contained in the fluctuations and
time decay of VACF. The typical VACFs for a liquid and a solid are compared in Figure 2. 7. In
solids or dense liquids, the oscillatory patterns characterize the vibrating motion of particles in
the system. The oscillatory VACF always decays at long-time as random forces acting on the
atoms destroy the correlated motions. In liquids, the diffusion motion leads to heavy damping of
37
the oscillatory behaviour as there is less chance to collide with the surrounding atoms before they
diffuse away.
Figure 2. 7 The normalized velocity autocorrelation function.
A dynamical property that can be obtained from the VACF is diffusion coefficient D.
Provided the VACF decays to zero at long-time, the Green-Kubo relation shows that the
integrated area below the VACF plot gives the value of D, such that
1
D v(t ) v(0) dt .
30
(2.33)
The Wiener-Khinchin theorem [52] states that the power spectrum of a dynamic quantity
can be obtained through the Fourier transform of its autocorrelation function
F ( )
1
2
C (t )eit dt .
38
(2.34)
Figure 2. 8 Fourier transform of the velocity autocorrelation function.
For example, one can transform the VACF from coordinate to time domain via a Fourier
transformation. The resulting power spectrum F() in frequency space is simply the vibrational
density of states (VDOS) representing the single particle dynamics. For a liquid, the VDOS at
zero frequency is non-zero and is proportional to the diffusion coefficient D (see Figure 2. 8).
The peaks of the VDOS are composed of all the vibrations, including both infrared (IR) and
Raman active modes. For a classical system, a Fourier transformation of the autocorrelation of
the molecular dipole moment (t ) (0) and the polarizability corresponds to the IR spectra and
Raman spectra, respectively. For a solid, the dipole of the unit cell can be computed from the
Wannier function method [57, 58]. In essence, it is not possible to assign charges to the atoms in
the unit cell of a periodic system. Instead, the electronic distribution of a periodic solid can be
computed from the wave functions by projecting them on Wannier centers. The total dipole
moment of the unit cell can be computed from the nuclear charges and the associated coordinates
of the Wannier centers. The IR spectrum is obtained from the Fourier transform of the dipole
moment weighed by a quantum correction factor [59].
39
An important use of the correlation function in this thesis work is the molecular
orientation time function P2 (t ) 1
3cos (t ) 1 , where (t ) is the angle of the directional
2
2
molecule at time t relative to the laboratory frame. The autocorrelation function P2 (t ) P2 (0) is
used to describe the reorientation dynamics that can be measured from nuclear magnetic
resonance (NMR) spectra. The relaxation time 0 of the reorientation process can be extracted
from a fit to P2 (t ) P2 (0) Cet / 0 (C is a constant), which can be compared directly with results
from the NMR measurement.
Mean squared displacement
Another method to analyze the dynamics is to calculate the mean square displacement
(MSD) of selected particles in the system. MSD is defined as the square of the average distance a
particle has moved from its starting point within the time interval t,
MSD r(t ) r(0)
where
2
,
(2.35)
denotes an average of starting time origins and r(t) represents the particle position at
time t. The MSD contains information on the atomic diffusivity information. As shown in Figure
2. 9, if the system is solid, the diffusion will be negligibly small and the slope of MSD is almost
zero. Due to diffusive motions in the equilibrium state, the MSD for a liquid increases linearly
with time. According to the Einstein relationship, the slope of MSD is related to the diffusion
coefficient D,
1
2
r (t ) r(0) ,
t 2n t
d
D lim
40
(2.36)
where nd is the dimensionality of the diffusion (e.g., 3 for 3D systems). At an infinite time limit,
the D value obtained from Eq.(2.36) should be equivalent to that from the Green-Kubo relation
given in Eq.(2.33) .
Figure 2. 9 The mean square displacement as a function of time.
2.5 First-principles software
Three first-principles electronic structure codes - Vienna Ab-initio Simulation Package
(VASP) [60, 61], Quantum-ESPRESSO [62], and CP2K [63] - were used in the thesis research
as described in ensuing Chapters 3 and 4.
VASP is a first-principles package based on the DFT theory. It can be used for static
electronic calculations and quantum mechanical MD with pseudopotential and plane-wave
(PSPW) methods. Born-Oppenheimer MD was implemented in the VASP code. An advantage of
the VASP package is that the Blöchl’s PAW potential was also implemented [64, 65]. In
principle, the PAW potential is an all–electron potential and therefore allows for the calculation
41
of all-electron properties from pseudopotential-based schemes by reconstructing all-electron
wave functions from the pseudo wave functions. In general, the PAW method can produce more
accurate results than general pseudopotentials. The PAW potential also allows the core orbitals
to adjust under extreme pressure. Most static and dynamic calculations in this thesis work were
performed with the VASP code (e.g., geometry optimization, electronic property calculations
and finite-temperature MD simulations with constant-volume and constant-temperature (NVT)
ensembles).
Quantum-ESPRESSO is an integrated suite of first-principles codes for electronic
structure calculations and material modeling based on the PSPW approach. While PAW
potentials [65], in addition to other pseudopotentials, are also available included, a distinct
advantage of the Quantum-ESPRESSO package is that MD calculations in the constant-pressure
and constant-temperature (NPT) ensemble can be used. At the time the thesis work was
performed, NPT ensemble was not available in the VASP package, so the Quantum-ESPRESSO
package was used in the NPT ensembles study for the solid hydrogen project. The recent
addition of the NPT algorithms in VASP facilitates the study of the structure and dynamics at
high pressure and finite temperatures.
Finally, to calculate the infrared spectra of solid hydrogen, it is essential to evaluate the
dipole moments from Wannier centers. For this purpose, the code CP2K [63] was used. CP2K is
a pseudopotential code using localized atomic orbitals. The atom-centered localized orbitals
facilitate the transformation of the Bloch wave functions to Wannier functions.
42
CHAPTER 3
STRUCTURE AND DYNAMICS IN CONDENSED MATTERS
UNDER PRESSURE
As introduced in Chapter 1, atomic dynamics can play an important role in the intrinsic
properties of condensed matters. As will be shown in this chapter, even solids at extremely high
pressure are not immune to this phenomenon. Atomic dynamics can strongly affect the structure
and properties of materials and pressure is the most sensitive probe to alter dynamics.
Liquids are disordered systems lacking long-range order. The short-range order in a
molten matter is usually extended to a few tenths of a nanometer. This local structure is often
considered to be analogous to the atomic arrangement of the corresponding solid [2]. However,
this assumption is not always valid. An example of this is the long unsolved problem of molten
gallium’s structure. The presence of a shoulder on the high q-side of the main peak in the
measured static structure factor S(q) has been the subject of controversy. In the first part of this
chapter, we study the structure of liquid gallium (l-Ga) using first-principles molecular dynamics
(FPMD). Our objectives were to reproduce experimental observations and analyze the temporal
structures to decipher the underlying physics of this peculiar S(q) feature. We focus on the
pressure effect on the liquid and compare it with available experimental results.
Rotational disorder may exist in some molecular solids. A typical solid with rotational
disorder is solid hydrogen. At ambient pressure, H2 molecules are freely rotating with the
molecular centers arranged in an hcp lattice [19]. As discussed in Chapter 1, solid hydrogen has a
complex phase diagram (vide supra). Under compression, solid hydrogen transforms
43
successively into a number of high pressure phases. While the first three phases (I-III) are wellknown, a new phase (IV) at high pressure (>220 GPa) and room temperature was recently
identified [24, 25]. Due to a lack of structural information, computer simulation has been an
effective tool to explore the structure. In the second part of this chapter, results on a study of the
structure and atomic dynamics of this new dense hydrogen phase are reported.
3.1 Dynamical structure of liquid gallium at ambient and high
pressures
Gallium is a metal known to show several phase transitions as a function of pressure and
temperature. The P-T phase diagram is shown in Figure 3. 1 [15]. Similar to ice, an anomalous
behaviour where the melting temperature decreases with pressure has been the subject of intense
study and speculation. Therefore, it is interesting and relevant to study the structure of l-Ga. The
structure of l-Ga at ambient pressure has been studied extensively by experimental researchers
[10-14]. When just above melting temperature, a highly asymmetric first sharp (principal) peak
in the static structure factor S(q) with a distinct shoulder at the high-q side is observed. At a very
high temperature, the shoulder merges into the principal peak and increases its asymmetry. This
feature has been attributed to a non-close-packed liquid structure [66]. In order to explain the
features in the S(q), a large number of computer simulations [67-69] have been performed over a
wide temperature range at ambient pressure. There are only a few studies concerning pressure
effect [15, 70-72]. Moreover, most of the previous calculations on l-Ga were performed using
empirical potentials. Only two first-principles [69, 73] and one orbital-free [74] MD simulations
have been reported. The dynamics of l-Ga was studied recently by inelastic x-ray scattering [75]
44
and the results revealed surprising dispersive, transverse acoustic vibrations, showing that the
structure cannot be described as a simple hard-sphere liquid.
Figure 3. 1 Phase diagram of Ga. Reproduced with permission from Ref.[15].
In spite of extensive experimental and theoretical studies, there is no consensus on the
structure of l-Ga. An unsettling problem is the origin of the distinct shoulder on the high-q side
of the principal peak in the S(q). The free-electron model suggests that the anomalous structural
features observed in the S(q) of metallic liquids are of purely electronic origin and are the
consequence of Freidel oscillations in a non-close-pack structure [67]. From classical MD
calculations, a structural model invoking the clustering of Ga was proposed [68]. In addition, a
first-principles simulation of l-Ga at 1000 K [69] found the existence of covalent Ga2 dimers and
attributed the high-q shoulder in S(q) to the presence of these dimers. However, the hypothesis
that Ga2 dimers are the origin of the high-q shoulder was questioned by Tsai and colleagues [76]
with classical MD simulations.
45
Motivated by the lack of detailed investigations of pressure effect and the inconsistency
between different theoretical interpretations about l-Ga’s structure, we studied this structure near
its melting temperature as a function of pressure with FPMD calculations [77]. Both the static
and dynamic properties of l-Ga at ambient and high pressure were investigated. As will be
demonstrated in the ensuing discussion, the observed features in the S(q) and pressure
dependency are correctly reproduced. Detailed analysis of MD trajectories found no evidence of
the presence of Ga2 dimers as proposed elsewhere. Through a comparison of the local geometry
and electronic properties, the structure l-Ga was found to be similar to the underlying crystalline
Ga-II and Ga-III solids.
3.1.1 Computational details
The aim of this study was to investigate the effect of compression on the structure and
dynamics of l-Ga near its melting point. For this purpose, FPMD calculations were performed at
pressures of 0, 1.6, 2.5 and 5.8 GPa at 300K with the VASP (Vienna ab initio simulation
package) code [60, 78] using the Born-Oppenheimer MD method. Electronic structure
calculations were performed with a projector augmented wave (PAW) potential [61, 65] in the
GGA-PW91 approximation [79]. Electron orbitals were represented by plane-waves with an
energy cutoff of 135 eV using a 2×2×2 k-point grid [46]. FPMD simulations were performed on
a bulk l-Ga model containing 128 Ga atoms in a cubic box with periodic boundary conditions.
An initial liquid model was obtained by melting the ambient solid structure at 1000 K. The
system was then cooled down at a rate of 175 K/ps to achieve the desired liquid state. At each
pressure point, the system was first equilibrated for 7 ps. In the micro-canonical ensemble
46
(NVE), equilibrium was ensured by monitoring the fluctuation of the total energy. This was
followed by a production run of 17 ps with the temperature controlled by a Nose-Hoover
thermostat [80, 81]. A time step of 1 fs was used in the integration of equations of motion.
Table 3. 1 Comparison of the optimized structures of Ga-I, Ga-II Ga-III with
experimental results [82-84] under the same pressure conditions (0 GPa for Ga-I and
2.8 GPa for Ga-II and Ga-III). The cell length (a, b, c) and volume (V) are in unit of Å
and Å3/atom, respectively.
Ga-I
Ga-II
Ga-III
a
4.5922
5.978
2.809
Cal.
b
c
7.7574 4.5881
8.670 36.262
2.809
4.586
V
20.43
18.07
18.09
a
4.5192
5.976
2.813
Exp.
b
c
7.6586 4.5258
8.576 35.758
2.813
4.452
V
19.58
17.62
17.62
The system size and time span of the present MD simulation are much larger than in
previous work [69, 73]. This permits more accurate description of the structural and dynamical
properties. The pressure of the system was determined by the average of the calculated pressures
for five randomly selected instantaneous configurations during the MD simulation. The error is
estimated to be ±0.2 GPa. Under thermodynamic equilibrium conditions of 5.8 GPa and 300 K,
Ga should crystallize into a solid [15]. The purpose of the calculation at 5.8 GPa was to
investigate if there was any dramatic change in the structural and electronic properties of the
meta-stable liquid in the over-pressurized region. The electronic density of states (DOS) was
calculated with a denser 8×8×8 k-point grid. Prior to MD simulations, the accuracy of the PW91
pseudopotential was examined by calculating the crystalline Ga-I, Ga-II and Ga-III structures. As
shown in Table 3. 1, good agreements with experiments [82-84] were found. In addition, the
47
PBE functional [40] was compared to PW91 on the predicted crystal and electronic structures of
solid Ga-I phase and the obtained results are nearly identical.
3.1.2 Results and discussions
To validate the computational parameters, the diffusive behaviour and static structure
factor of l-Ga at ambient pressure and 300 K were examined first. At 0 GPa, the model system
was liquid and exhibited behaviour typical of a linear relationship with the variation of the mean
square displacement (MSD) and time. The diffusion coefficient D - which is the slope of MSD at
long time - was estimated to be 0.160×10⁻⁴ cm2/s; this closely matched the experimental value of
0.157×10⁻⁴ cm2/s determined under similar thermodynamics conditions (i.e., ambient pressure
and 320 K) [85]. Figure 3. 2a shows the computed structure factor S(q) as well as the measured
x-ray and neutron diffraction data [11]. The concordance between theoretical and experimental
results is remarkably good. Both the positions and heights of the maxima in the S(q) as well as
the characteristic shoulder at the high-q side of the first peak are reproduced qualitatively. In
addition, the calculated profile of the radial distribution function (RDF) g(r) at pressure of 1.6
GPa was compared with the result obtained from in-situ high pressure diffraction performed in a
diamond anvil cell at 1.72 GPa [72], as shown in Figure 3. 2b. Apart from a minor discrepancy
with the position of the third coordination shell, where the calculation overestimates the
maximum by 0.2 Å, the agreement is once again excellent. Although it cannot be completely
ruled out that the discrepancy of 0.2 Å on the position of the 3rd peak in the RDF (see Figure 3.
2b) was due to a deficiency in the GGA correction [86], a difference in pressure is the most
likely explanation. Since the computed pressure of 1.6 GPa was lower than the experimental 1.72
48
GPa, the theoretical density should therefore be lower and manifest as a longer 3rd nearest
neighbour distance, owing to a less closed-pack structure. The calculated coordination number
(CN) of the first shell computed by integrating g(r) to the first minimum was 11.7. This value is
comparable to the 10.4 determined experimentally [10, 12]. The good accord between theory and
experiment affirms the reliability of the present calculations.
The calculated RDF g(r) at different pressures is compared in Figure 3. 3. For an
isotropic monatomic liquid, the distance of the nearest neighbour peak is expected to shorten
under uniform compression. In l-Ga, however, no appreciable change in shape was found from 0
to 2.5 GPa. The position of the first peak remained fairly constant at ~2.78Å. In comparison, the
distances to the second and third nearest-neighbour in the same pressure range were reduced by
0.06 and 0.27 Å, respectively. This observation suggests that atoms in the second and third
coordination shells are pressed inward and gradually occupy the interstitial voids to give a denser
pack structure. The lack of compressibility in the computed nearest neighbour Ga-Ga distance
has been reported in high pressure extended x-ray absorption fine structure (EXAFS) [71] and insitu x-ray diffraction experiments [72]. Upon further compression to 5.8 GPa, the first Ga-Ga
distance decreased by 0.024 Å from 0 GPa (see Figure 3. 3). The calculated CNs were 11.7, 12.1,
12.2 and 12.8 at 0, 1.6, 2.5 and 5.8 GPa, respectively. These values are typical for most metallic
liquids [67]. More significantly, the predicted trend was in complete agreement with the
measurements by Tsuji and colleagues [70]. The lack of substantial variation of CN in this
pressure regime suggests there is no tendency for l-Ga to adopt more directional bonding as
observed in some simple alkali metal liquids and solids under pressure [87].
49
Figure 3. 2 (a) Comparison of static structure factors of our calculated l-Ga at 0 GPa
and 300K (solid square line)and the experimental result of that at 0 GPa and 293K
(hollow circle line) [11]. (b) Comparison of experimental [73] and calculated G(r)at
g (r )
1.72 and 1.6 GPa, respectively. Note
density of the liquid.
50
1
2 2 r
G (r ) 1
where is the atomic
The S(q) at different pressures is compared in Figure 3. 4. No significant change in gross
profiles was observed below 2.5 GPa. However, in detail, the principal peak became sharper with
increasing pressure. Since the first peak of the structure factor for a disordered system [88] is
related to the intermediate range structural order, this observation suggests the intermediate
ordering of l-Ga changes with pressure and becomes more structured. This conclusion is
consistent with the analysis of the g(r) presented above, which also revealed structural changes
in the second and third coordination shell upon compression.
4.0
3.5
5.8 GPa
2.5 GPa
1.6 GPa
0 GPa
g(r)
3.0
2.5
2.0
1.5
1.0
0.5
0.0
0
2
4
6
8
10
r /Å
Figure 3. 3 Comparison of radial distribution function g(r) of l-Ga near melting
temperature at 0, 1.6, 2.5, and 5.8 GPa.
The origin of the high-q shoulder of the first peak of S(q) has long been the subject of
debate [68, 69]. Gong and colleagues.[69] attributed the presence of the shoulder to very shortlived covalent dimers – remnants of melted Ga – with a bond length of 2.44 Å. From classical
MD calculations, Tsay’s group [68] instead postulated that the shoulder structure was due to the
formation of clusters in the l-Ga. Very recently, Tsai and colleagues [76] re-examined l-Ga
51
structure using classical MD simulations and raised objection to the proposal of the presence of
covalent Ga2 dimers [69].
7
6
S(q)
5
5.8 GPa
4
2.5 GPa
3
1.6 GPa
2
0 GPa
1
0
0
2
4
6
8
-1
q/Å
Figure 3. 4 Calculated static structure factor S(q) for l-Ga near melting temperature at 0,
1.6, 2.5, and 5.8 GPa.
To examine the postulation about the formation of Ga2 dimers, the temporal Ga-Ga
distances between pairs of atoms were monitored during the MD calculations. Ga-Ga pairs
separated by 2.5 Å were only found occasionally with a resident time of less than 0.2 ps. In αGa, the dimer vibration was found to be 7 THz [89], which corresponded to a vibration period of
0.14 ps. Therefore, no sustainable Ga2 dimer was found in the liquid. It should be noted that
previous FPMD calculations [69] were performed at 1000 K and the lifetime of the proposed Ga2
dimer was determined to be only 0.05 ps. Therefore, the possibility of covalently bonded dimers
in the liquid is very low, if not negligible. Finally, it has been proposed [89] that the shoulder at
high-q of S(q) in a metallic liquid is the result of medium-range order beyond the first shell
52
caused by Friedel oscillations [67]. As will be shown later, an analysis of local geometry and
electronic properties of l-Ga supports this explanation.
The local structure of l-Ga has been studied using the EXAFS method at the Ga K(1s)edge [15, 16]. In agreement with total diffraction measurements, analysis of the experimental
results revealed no discernible change in the first-neighbour distance at 2.76 Å from 0-1.9 GPa
[16]. There were, however, small variations in the amplitude of the first peak in the reconstructed
g(r) functions, where the height of the first-neighbour peak increased slightly with pressure from
3.5 at 0.6 GPa to 3.8 at 1.9 GPa [16]. The theoretical calculated heights at 0 and 2.5 GPa were
3.3 and 3.5, respectively (see Figure 3. 3).
(cross-section)
0.04
1.6 GPa
0.03
0 GPa
0.02
0.01
0.005
(a)
1.6GPa-0 GPa
(b)
0.000
-0.005
10360
10370
10380
10390
E / eV
Figure 3. 5 (a) Calculated x-ray absorption spectra (XAS) of l-Ga; (b) Difference of
calculated XAS () spectra between 1.6 and 0 GPa. The XAS spectra in (a) at 1.6
GPa is up-shifted by 0.01.
53
More recently, fine differences even in the rather monotonous Ga K-edge XAS spectra
were revealed in a confined droplet of l-Ga at high pressure [15]. A shift in the spectral density
from the low- to high-energy regions near the ionization threshold was found by taking the
difference of the normalized XAS spectra () at 1.6 GPa and 0 GPa. A dip (intensity loss) was
found at 10.369 keV, which is compensated for by an intensity gain at 10.378 keV. The dip and
peak of the XAS difference spectrum were separated by 9 eV. Here, the K-edge XAS at 0 and
1.6 GPa was calculated using the multi-scattering method with the FEFF8 code [90], taking into
account the core-hole effect. At each pressure, a snapshot from the MD trajectory was selected
and the XAS spectrum was averaged from the calculations of 18 randomly selected Ga sites. The
theoretical XAS spectra at 0 and 1.6 GPa, as well as the difference spectrum (), are shown in
Figure 3. 5. These calculations reproduced the essential features in the experimental difference
spectrum. The predicted energy separation between the dip and the peak of 7 eV is in qualitative
agreement with the experiment. The strong accord between the theoretical and experimental
features further affirms the reliability of the theoretical liquid model.
To investigate the dynamical behaviour of l-Ga, the diffusion coefficient (D) was
calculated from both the velocity autocorrelation function (VACF) and the MSD. The results
from both methods were almost identical. As already stated above, the calculated diffusion
coefficient of 0.160×10⁻⁴ cm2/s at 0 GPa was comparable to the experimental value of 0.157×10⁻⁴
cm2/s [85]. When l-Ga was compressed to 1.6 GPa, D reduced slightly to 0.123×10⁻⁴ cm2/s. It is
interesting to note that the diffusion coefficient decreased almost linearly with increasing
compression. This observation agrees with a previous study based on a modified embedded-atom
model (MEAM) [91]. At 5.8 GPa, in the over-pressurized metastable liquid regime of l-Ga, the
atomic diffusion slowed and D dropped to 0.077×10⁻⁴ cm2/s.
54
Figure 3. 6 Calculated vibrational density of states (VDOS) of liquid Ga at different
pressures.
The dynamical behaviour of l-Ga can also be probed from the phonon spectra. The
normalized vibrational density of states (VDOS) calculated from the Fourier transform of the
VACF at different pressures is shown in Figure 3. 6. The non-vanishing VDOS at zero frequency
(ω = 0) is a consequence of the diffusive motions in the liquid. The calculated mean bandwidth
of 150 cm-1 at 0 GPa is comparable to the measured width of 157 cm-1 (19 meV) from an
inelastic neutron scattering experiment [92]. The calculated bandwidth increased with pressure
and reached 185 cm-1 at 5.8 GPa. At 0 GPa, three peaks can be observed in the VDOS. At
elevated pressure, four vibrational peaks are predicted. The two low frequency peaks at 40 and
85 cm-1 were not very sensitive to pressure. In contrast, the higher frequency peaks at 100 and
145 cm-1 at 0 GPa shifted to 150 and 185 cm-1, respectively, at 5.8 GPa. The vibrations in a
typical liquid are usually heavily damped and characterized by one featureless broad band. It is
tempting to associate the two distinct low frequency peaks in the VDOS of l-Ga to the acoustic
55
branches and the two high frequency peaks to the optic branches of the solid. The phonon
dispersions of crystalline α- and β-Ga have been measured by neutron inelastic scattering
experiments at ambient pressure [89, 93]. α-Ga consists of a pair of Ga2 dimers in the primitive
cell and the stretching frequencies of the dimer were found to lie between 223-247 cm-1 (6.7-7.4
THz) [89]. These frequencies are significantly higher than the calculated and observed cutoff
frequency of ca. 200 cm-1 in the VDOS of l-Ga at 0 GPa. In comparison, the metastable β-Ga is
monoclinic and is built from Ga polyhedra. The highest observed phonon frequency cutoff [93]
was 200 cm-1, which is comparable to the calculated VDOS of l-Ga at 0 GPa (see Figure 3. 6).
Once again, from the comparison of the vibrational frequencies, it is unlikely that l-Ga is
composed of Ga2 dimers as speculated previously [69].
From the theoretical evidence and discussions presented above, it is certain that l-Ga is
not composed of Ga2 dimers. So what does the local structure of l-Ga look like? The clue lies in
the analysis of the three-body angular distribution function g(θ). There was little difference in
g(θ) functions at pressures under 2.5 GPa. The g(θ) showed a narrow distribution at 55o and a
broader distribution centered around 106o. The angular distribution is very similar to the high
pressure Ga-III phase which is stable above 2.8 GPa and over 319 K as well as the Ga-II phase
which is stable between 2-10 GPa at room temperature [16]. The comparison is addressed in
Figure 3. 7(a). Ga-III has a body-centered tetragonal structure. At 2.8 GPa and 298 K, a Ga atom
is surrounded by 12 nearest neighbours at distances of 2.813 and 2.985 Å [84]. Ga-II has a
complex orthorhombic structure consisting of 104 atoms per unit cell [83]. It is a precursor of
Ga-III and may be viewed as a distorted body-centered structure. Both Ga-II and Ga-III show
angular distribution of the nearest neighbour atoms between 55-60o. The broad distribution
(“hump”) in l-Ga, with the width extending from 80o to 140o and centered at 106o, visually
56
Figure 3. 7 Comparison of the calculated (a) angular distribution function g(θ) and (b)
radial distribution function g(r) of l-Ga at 2.5 GPa with those of experimental
crystalline Ga-II and Ga-III.
resembles Ga-III more than Ga-II. Stimulated by the revealing comparison in g(θ) functions
shown in Figure 3. 7(a), the g(r) functions of crystalline Ga-II and Ga-III are also computed and
compared with l-Ga in Figure 3. 7(b). Owing to the complex Ga-II structure, the g(r) showed a
57
quasi-continuous distribution with the nearest neighbour distance extending from 2.65 to 3.10 Å.
Incidentally, this distribution resembles the broad first peak in the g(r) of l-Ga. In addition, the
sharp distribution at ca. 5.2 Å is close to the center of the broad band at 5.5 Å in l-Ga. Ga-III has
a much simpler crystal structure. As already discussed above, the two first nearest Ga-Ga
distances fall into the first peak range of l-Ga. The longer range order in l-Ga did not compare
well with Ga-II. Nevertheless, complete agreement between the liquid and crystalline solid was
not anticipated. A comparison of g(θ) and g(r) functions, however, allows one to conclude with
confidence that the structure of l-Ga is closer to the underlying high pressure crystalline Ga-II or
Ga-III phase.
Figure 3. 8 Comparison of the total density of states for l-Ga and solid Ga-I, Ga-II and
Ga-III.
Finally, the electronic density of states (DOS) for l-Ga was investigated. The DOS is not
very sensitive to pressure and only the results at 0 GPa will be discussed in detail. The total DOS
58
(TDOS) for l-Ga at 0 GPa is compared with crystalline Ga-I (α-Ga), Ga-II and Ga-III in Figure 3.
8. The TDOS profile of l-Ga is typical of a free electron metal (i.e., TDOS (E-Ef)1/2, where Ef
is the Fermi energy). In comparison, the TDOS of l-Ga is very similar to that of Ga-II and Ga-III,
both of which also have a free-electron like DOS distributions but are distinct from Ga-I. This is
not surprising because the Ga-I structure consists of Ga2 dimers and the electrons are localized in
covalent bonds. The proximity of Ga-III to the melting line [15] lends support to the proposal
that the liquid structure is akin to the distorted crystalline structure. The free-electron like
electronic property of metallic liquid at ambient pressure has been studied previously [67, 73].
The present results re-affirm this description of the electronic structure but also address the
similarity in electronic structure of liquid Ga and solid Ga-II and Ga-III.
3.1.3 Conclusions
FPMD calculations were performed at ambient pressures and medium pressures up to 5.8
GPa to investigate the structure of l-Ga near its melting point. It was shown that the first peak in
the structure factor S(q) became sharper with compression. Consistent with past experiments, the
first nearest neighbour Ga-Ga distance showed no noticeable change below 2.5 GPa, whereas the
distances to the second and third shells reduced. There was no evidence of substantial structural
changes within the pressure range studied. Detailed analysis of the static and dynamical property
compression trends showed that the proposal for the existence of Ga2 dimers on the local
structure of l-Ga was not valid. The instantaneous Ga-Ga contact within the range of a covalent
bond has a very short lifetime. Furthermore, no signal of Ga2 dimer vibrational mode was found
in the experimental nor the calculated VDOS spectra of l-Ga. In fact, the three-body angular
59
distribution and radial distribution functions as well as the electronic structures showed the liquid
structure to be very similar to the underlying high pressure crystalline Ga-II or Ga-III. This
“crystalline-like” liquid structure is manifested in the dispersive transverse acoustic vibrations
revealed in a recent report [75]. The results of the present theoretical analysis are consistent with
two previous experimental investigations showing that the structure of l-Ga cannot be described
by the existence of “molecular pairs” or any molecular clustering [94, 95].
60
3.2 Structure and dynamics of dense hydrogen
The metallization of dense hydrogen is a central topic in high pressure physics. In 1935,
Wigner and Huntington predicted that solid molecular hydrogen would transform into a
monoatomic metallic state at sufficiently high pressure [26]. Later, the metallic phase was
predicted to exhibit exotic properties such as high temperature superconductivity [27] and
quantum fluidity [96]. Therefore, the search for metallic hydrogen is the Holy Grail in high
pressure physics. While metallization has not yet been found, a rich phase diagram of dense
hydrogen has emerged through both experimental and theoretical investigations [25]. This
complex phase diagram of hydrogen under extreme pressures with an emphasis on experimental
progress has been reviewed
by Goncharov et al. [18].
A complementary discussion on
theoretical progress was published as well [5].
Figure 3. 9 High-pressure phase diagram of solid molecular hydrogen from
experimental measurements. Reproduced from Ref.[5].
61
The phase diagram of solid hydrogen up to 300 GPa in Figure 3.9 shows the existence of
at least four solid molecular phases [5]. The three low-temperature phases established
experimentally are labeled phases I, II and III. At low pressures, intermolecular interactions
between hydrogen molecules are weak and therefore hydrogen molecules can rotate freely
(quantum rotors) about their center of mass that crystallize into an hcp lattice (phase-I) [20]. As
the pressure increases and temperatures remain below 140 K, the rotational symmetry of phase-I
is broken and the solid hydrogen transforms to phase-II. The phase transition boundary is
dependent on temperature. The transition occurs at ~110 GPa and 8 K in H2 [97]. This is
followed by a transition to phase-III at 150 GPa. This transition is signified by a strong
enhancement in the infrared (IR) vibron absorption intensity [22]. Recent synchrotron IR and
optical absorption measurements suggest that phase-III is an insulator and stable up to at least
360 GPa over a broad temperature range [98]. In both phases II and III, the H2 molecules are
believed to be partially or completely frozen into orientationally-ordered structures. The
molecular orientations, however, cannot be identified experimentally due to limitations with
small sample size and low x-ray scattering efficiency of hydrogen atoms proportional to the
atomic number squared [5]. Several theoretical studies have predicted the structures for phases
II and III [5]. No consensus has been reached, but it is generally agreed that phase-III is an
insulator and that H2 molecules are orientationally ordered [99].
In late 2011, a report surfaced claiming that metallization was observed at 260 GPa and
300 K [53]. In a subsequent study with Raman and visible transmission spectroscopy,
researchers found that when phase-III was warm compressed at room temperature (~300 K) to
220 GPa, it transformed to a new phase-IV of solid hydrogen [25]. Raman spectra of the vibrons
further suggested that there are two distinct local H2 environments in the structure [3]. More
62
recent work showed that phase-IV is still an insulator and that the early claim of metallization is
possibly incorrect. Nevertheless, this provides additional evidence for the existence of the new
phase-IV.
Figure 3. 10 Proposed structure of phase-IV of hydrogen with two distinct layers, i.e.,
Br2- and Graphene (G)-like.
A number of structural candidates have been proposed for the phase-IV from theoretical
searches for the lowest enthalpy structures, including zero point vibration corrections [23, 28,
100]. Common to these predicted structures is the presence of two distinct structural
components: a “molecular” (Br2- like) layer and a graphene-like (G-) layer (see Figure 3. 10)
stacked in an alternating A-B-A’-B sequence. However, the symmetry and exact structure of the
G-layer, which consists of elongated and weakly-bonded H2 molecules, remains a matter of
debate. Static calculations (i.e., at 0 K) indicate that the Pbcn structure [23], which consists of 3
kinds of hexagonal rings, is dynamically unstable because the lowest frequency libron (H2)3 ring
mode has an imaginary frequency. Two very similar structures - Pc [100] and Cc [28],- have also
been suggested as they have slightly lower enthalpy and show no imaginary frequencies.
63
Raman measurements of phase-IV show a dramatic softening of the G-layer vibron mode
with pressure [25]. This is consistent with theoretical calculations [100] wherein the H-H
distance in the H2 molecules is elongated and the intermolecular interaction is weak. Therefore, it
is anticipated that the H2 in the G-layers may transform to a truly graphene pattern with
symmetric hydrogen bonds [20], leading to a Ibam space group [100]. On the other hand, a
Cmca-4 structure with four molecules per unit cell [23, 101] was found to be energetically
favourable above 225 GPa [100, 102]. Metadynamics simulations [28] also showed the transition
from phase-IV to the Cmca-4 structure at 275 GPa, which has been speculated to be the atomic
metallic hydrogen structure reported in an earlier study [24]. However, the proposed band gap
closure [24] disagrees with recent optical data [25]. So far, there is no conclusive structure for
phase-IV.
As most structural predictions have been based on static geometry optimization, there is
uncertainty surrounding whether the predicted structures may exist at ~300 K, where most
experiments are performed. In this work, we examined the structure of phase-IV with FPMD
calculations where the temperature effect is explicitly included. As will be shown below, we
found that H2 molecular fragments are fragile and exhibit large amplitude fluxional atomic
motions including frequent molecular rotations and intermolecular atomic fluctuations, with
intralayer H2 rearrangements at temperatures between 250 and 300 K. This observation raised the
question of whether or not the structure of phase-IV can be described simply by a unique space
group. The theoretical finding, however, is substantiated by experimental observations of
significant quantum effects in molecular vibrations and librations in the G-layer. The MD results
show phase-IV will transform to the metallic Cmca-4 structure at 370 GPa, where the distinction
between the Br2-like and G-layers vanishes and large atomic motions ceases.
64
3.2.1 Theoretical methodology details
Constant pressure - constant temperature (NPT) ensemble classical molecular dynamics
calculations were performed with the PAW potential in conjunction with a plane-wave basis set
(kinetic energy cutoff of 80 Ry)The PBE functional was employed. The quality of the PAW
potential has been checked against all electron calculations to guarantee results are valid within
the pressure range studied in this work. A 1×1×2 Pbcn [23] supercell with 48 atoms was used as
the initial structure. The Brillouin zone (BZ) was sampled with a 4 4 4 k-grid [46]. All MD
simulations were performed with the Quantum-ESPRESSO code [62]. The structural
optimization and electronic structure calculations of the Cmca-4 phase were carried out with
VASP [60, 61], where the PAW potential with the PBE functional was employed with an energy
cutoff of 875 eV for the plane-wave basis set and a k-mesh of 6 4 4 for sampling the BZ.
We performed MD calculations for phase-IV of hydrogen at 250 – 370 GPa and 250 300 K. Thermodynamic equilibrium was usually achieved in the first 6 ps. The length of the
simulation varied from 20 ps at both 250 and 370 GPa to 87 ps at 300 GPa. The maximum
deviation during the MD calculations was less than 0.4 meV/atom in the internal energy and the
pressure was within 2% of the target. The results of the simulations should be at least
qualitatively correct since the ratio of the mean atomic distance (V/N)1/3 and the thermal de
Broglie wavelength were slightly larger than 1 for the density range [103] studied. Since the
quantum effect normally enhances delocalization of the hydrogen spatial distribution, it was
expected that the quantum zero-point motions would not fundamentally alter the classical results
65
at relatively high temperatures (ca. 300 K), which tends to show hopping and molecular
rearrangement processes [104].
3.2.2 Fluxional structure of phase-IV
All MD simulations were performed with an initial Pbcn structure. Figure 3. 11
summarizes results of the MD trajectory analyses for two dissimilar planes originating from the
Pbcn structure. H atoms are colour coded to differentiate individual H atoms on each layer. Same
colour dots represent the trajectory of a certain H atom across the simulation time.
As seen in the leftmost columns of Figure 3. 11, at 250 GPa the Br2-like layers consist of
a hexagonal lattice of round “clouds”, each composed of two H atoms, corresponding to the
nearly free rotation of H2 molecules about the center of their bonds. At the same time, the
intramolecular bond lengths (0.72 Å) are well maintained as characteristic of “free” molecules.
The disordered, rotational motion of H2 molecules in this layer resembles that of free rotors
observed in phase-I [20]. In contrast, the G-layers can be represented as an almost equally
populated honey-comb lattice. One does not see any difference in the dimensions or shape of the
constituting hexagons, which is expected for Pbcn [23] and Pc [100] structures. Further
inspection employed the colour codes method to trace the atomic motion. The same coloured
dots represent the trajectory from the same H atom, therefore the change in colour on crystal
sites of G-layer would correspond to the H transfer or collaborative hopping of the H atoms. At
250 GPa (see Figure 3. 11), within our simulation time (~20 ps), the site-to-site H transfer can be
identified from the G-layers, where an average frequency of hopping is ca. 1 jump every 4 ps.
66
Figure 3. 11 Molecular dynamics trajectories of the two distinct layers from Pbcn
structure for different pressures near room temperature. The top row corresponds to the
Br2 like layer, while the bottom row to the G-layer. Different colours correspond to
different atoms.
67
Figure 3. 12 Split trajectories on the two distinct layers of hydrogen at 300 GPa and
280 K. (a), (c) and (e) represent the consecutive structural change within one layer, and
(b), (d) and (f) represent the consecutive structural change within the other layer with
the same time span.
As seen in the central columns of Figure 3. 11, at 300 GPa the average time difference in
the distribution of H atoms between the Br2- and G-layers seems to disappear. Both layers show
a honeycomb structure superimposed by an increased number of “clouds,” the result of
molecular rotations. Closer analysis of the MD trajectories revealed a synchronized intralayer
atomic fluctuation where the molecular-like Br2-layers and the atomic-like G-layers
interchanged. This process is clearly identifiable when the trajectory is split into a series of time
68
slices, as shown in Figure 3. 12. It can be seen from the upper panels of the plot that the atomic
arrangements in this layer started from the molecular Br2-layer structure and sustained for a time
period of 5.4 ps (see (a)). The structure then changed abruptly to the G-layer arrangement (see
(c)). After a span of 14.1 ps, it changed back to Br2-layer structure (see (e)). As expected, the
atomic arrangements of the other layers (see the lower panels (b), (d) and (f) of Figure 3. 12)
concomitantly oscillated from the G- to Br2- and then back to G-layer. Longer time simulations
confirmed the continual structural alternation between Br2- and G- layer arrangements. It is noted
that the structural change occured in both layers simultaneously. This indicates that at any given
time the crystal structure of hydrogen at 300 GPa and 280 K is always composed of Br2- and Glayers. This is consistent with the static structure predicted for phase-IV [23, 100]. However, the
simulation showed that the structure is not static but is, in fact, dynamic. It should be emphasized
that no H transfer was found between the two distinctive layers.
As seen in Figure 3. 11, we already observed H transfers within the G-layer at 250 GPa
by identifying the different colour codes for the individual atomic trajectories. This novel
phenomenon is magnified at 300 GPa and appears in Figure 3. 12(c) as a significant spread of the
same coloured dots over a large range of lattice sites. The H transfer mechanism was examined
further by dividing the trajectory (see Figure 3. 12(c)) into five shorter time slices (see Figure 3.
13) of several picoseconds. Within each given time slice, with the exception of the middle panel
where some H atoms – indicated by yellow arrows - are moving too fast, the atomic arrangement
is unchanged. H transfers occurred between two consecutive time slices with the H atoms
moving in the directions shown by the yellow arrows. Figure 3. 13 highlights the fact that H
atoms are very fluxional and can transfer to their nearest neighbouring lattice site within a few
picoseconds or less. Occasionally, as shown in the middle panel of Figure 3. 13, the proton
69
transfer process is nearly continuous. More intriguingly, the collaborative H transfer led to
“pseudo”-rotations of the hexagons in the G-layer.
Figure 3. 13 Intralayer H transfer within G-layer shown with five continuous time spans
of trajectories. Arrows represent the moving directions of the H atoms to enter into the
configuration as appears in the next time span.
The H transfer phenomenon may be explained by pressure-induced changes in the H-H
distances within the hexagons of the G-layer, as shown in Figure 3. 14. In the top plot of this
figure, at 250 GPa three molecules are identified with intra-molecular bond lengths (from a, c, e
contacts) of ~0.80 Å and are loosely bonded with a longer H-H distance (from b, d, f contacts) of
~1.10 Å. This hexagonal geometry is quite stable over the simulation time at 250 GPa but
becomes brittle when the pressure increased to 300 GPa. This is seen on the bottom plot of
Figure 3. 14. At 300 GPa, the intra-molecular bonds (a, c, e contacts) are stretched so that the
they become weak, leading to a shorter H2 molecule lifetime. The H atom in the hexagon can
bond with the nearest neighbour to either the left or the right and temporarily form a molecule.
70
The rapid H motions reduce the molecular character of the G-layer and lead to the “pseudo”rotation of the hexagonal rings.
1.6
a, c, d
250 GPa
1.4
1.2
H-H distance (A)
1.0
0.8
0.6
1.6
b, d, f
1.4
1.2
1.0
0.8
0.6
0
1000
2000
3000
4000
Time (fs)
1.6
a, c, d
300 GPa
1.4
1.2
H-H distance (A)
1.0
0.8
0.6
1.6
b, d, f
1.4
1.2
1.0
0.8
0.6
0
1000
2000
3000
4000
Time (fs)
Figure 3. 14 The H-H distances between two neighbouring atoms within the hexagon
from the G-layer. Top and bottom plots are for 250 and 300 GPa, respectively.
Upon completion of this study, we were notified of a publication reporting similar
dynamical properties of phase-IV [105]. Rotation of the H2 molecules in Br2 layer and H transfer
71
in the G-layer was reported, however, the interlayer structural fluctuation was not observed [64].
This discrepancy may arise from the relatively short simulation time (~10 ps) in this reference
study compared to the present thesis work (over 90 ps). Our calculations showed that the
interlayer fluctuation was a rare event and the structure may remain “stationary” for a period of
up to 14.1 ps (see Figure 3.12).
Figure 3. 15 Comparison of diffraction pattern calculated from the MD trajectory with
the static Pc structure as reported in Ref. [23].
The large atomic fluctuations observed in the MD runs at 250 and 300 GPa showed that
the conventional static structure representation of phase-IV as an ideal crystal lattice may not be
appropriate. The diffraction pattern (S(q)), however, can be calculated directly from the
trajectory, as shown in Figure 3. 15. The time averaged structure is consistent with the predicted
“static” Pc structure [23].
72
3.2.3 Transition to the metallic Cmca-4 phase
To examine how the dynamical structure observed in phase-IV at 250 and 300 GPa
would develop in a higher pressure range, we continued the MD simulation of phase-IV at 300 K
and raised the pressure to 370 GPa. The calculations revealed a spontaneous transition to another
structure. As shown in the rightmost columns of Figure 3. 11, the amplitudes of the atomic
motions became much smaller and the layers were crystallographically equivalent.
An
approximate structure was obtained by taking the average of the instantaneous atomic positions.
Geometry optimization led to the Cmca-4 structure as proposed previously [23, 101]. The
structure is still molecular and consisted of crystallographically equivalent molecules with H-H
bond length of 0.776 Å (see Figure 3. 16).
Figure 3. 16 Crystal structure of solid hydrogen in Cmca-4 phase.
The calculated electronic structure showed that the Cmca-4 phase is metallic. The charge
density plot (Figure 3. 17) shows that electron density is partially pushed out from the
intramolecular bond to interstitial space. The electron density topology is not unlike those
reported previously for light elements under extreme pressure [106].
73
Figure 3. 17 Charge density isosurfaces for the Cmca-4 metallic phase at the contour
values of (a) 1.0 e/Å3 showing the persistence of H-H molecules, and (b) 0.5 e/Å3
illustrating the presence of interstitial electron density.
3.2.4 Vibrational properties of phases-IV and Cmca-4
To compare with experimental vibrational spectra, single atom power spectra were
calculated from the Fourier transform of the hydrogen atom VACF. The power spectrum
contained both IR and Raman active modes. Owing to the fluxional (disordered) nature of phaseIV, there is no well-defined symmetry and so the Raman spectra should comprise all vibrations.
As a first approximation, the power pattern is a good representation of the Raman spectrum. The
power spectra for hydrogen phases-IV (the top two panels) and Cmca-4 (the bottom panel) are
compared in Figure 3. 18. At 250 GPa and 250 K, there were two broad vibrational branches at ~
4500 cm-1 and ~ 3600 cm-1. When the system was compressed to 300 GPa at 280 K, the high
frequency branch remained largely unchanged while the lower frequency branch shifted to a
lower frequency at ~3100 cm-1.
74
Figure 3. 18 Power spectra for hydrogen at different conditions.
The change in features in the vibrational spectra can be explained by the structure of
phase-IV. The higher frequency branch at ~ 4500 cm-1 arose from the nearly free rotating H2
molecules in the Br2-layer. The lower frequency branch at ~ 3600 cm-1 can be attributed to the
H2 vibron of the elongated molecules in the G-layer. At higher pressures, the molecule bond
length from the Br2-layer remained nearly unchanged (0.72 Å). In contrast, H2 vibration in the Glayer became weaker. This interpretation is consistent with the experimental Raman spectra
obtained by our collaborators. This is shown in Figure 3. 19 where the two distinct vibrational
75
bands disappeared at the highest pressure (316 GPa) and the vibrons band merged into a single
set of modes at ~3100 cm-1.
Figure 3. 19 Raman spectra of solid hydrogen with pressure. (Reproduced with the
permission from Ref.[107])
3.2.5 Structures and structural transformations of solid hydrogen at low
pressure
Following the successful FPMD study on phase-IV, we revisited the structures of solid
hydrogen in the low pressure region, as there is very limited information concerning the phase
transitions between phases I, II and III. As mentioned earlier, phase-I is a crystal consisting of
76
rotating H2 molecules where the center of the molecules is arranged in an hcp lattice. Details on
the structures and molecular orientations in phase-II and III, however, are still not well
characterized. While the information on the structure and phase transitions from x-ray diffraction
experiments is very restricted [21], valuable but indirect structural information was obtained
from IR, Raman and optical measurements [99]. One key experimental observation was that
upon passing from phase-I to II, the frequency of the roton mode underwent substantial changes,
indicating that the molecules changed from a rotationally free state to more restricted librations
(rotational oscillations) [97]. Moreover, the IR activity increased dramatically at the phase-II to
III transition and the IR and Raman vibron frequencies softened by about 80 cm-1 [99, 108]. We
employed FPMD simulations to model the dynamic processes that occurred in solid hydrogen at
a pressure range of 25-160 GPa at ~245 K. IR spectra in particular was computed in order to
compare with available IR results obtained at a similar pressure and temperature (~300 K) range
[109].
A starting model at 25 GPa was constructed from the experimental hexagonal structure
but was represented in an orthorhombic cell consisting of 48 hydrogen molecules with random
orientations. At each pressure, an NPT MD at 245 K lasting about 10 ps (time step of 1 fs) was
performed using Quantum-ESPRESSO code [62]. The cell constants were then computed by
averaging cell fluctuations. Using the averaged cell constants, a second set of NVT calculations
was performed using the CP2K code [63]. During the course of these MD calculations, the
electronic wave functions were transformed into Wannier centers. This facilitated the calculation
of the instantaneous dipole moment of the simulation cell. As presented in Chapter 2, the IR
spectrum can be computed from the Fourier transform of the dipole moment time autocorrelation
function.
77
Figure 3. 20 Calculated IR spectra for solid H2 at different pressures.
The calculated IR spectra at selected pressures from 25 to 160 GPa are displayed in
Figure 3. 20. The profile of the IR below 130 GPa is quite similar, but above 130 GPa there is a
prominent change. The extracted H2 vibron frequencies from the IR spectra were compared with
the available experimental data [107] in Figure 3. 21. The vibrational frequency was found to
increase gradually upon compression from 25 GPa to 140 GPa and then started to decrease at
160 GPa. Both the trend and the calculated frequencies are in excellent agreement with
experimental measurements. The change of the vibron frequency at 160 GPa is indicative of a
phase transition. As will be shown below, a subtle change in the molecular dynamics occurred
between 120 - 140 GPa as well.
78
Figure 3. 21 Vibron frequencies from calculated and experimental IR as a function of
pressure.
The atom colour-coded dot plots of the MD trajectories of the hydrogen atoms at
different pressures viewed along the hexagonal c axes (y) and orthogonal direction (x) are shown
in Figure 3. 22 and Figure 3. 23, respectively. Below 100 GPa, the colour-coded dot plots show
unambiguously round shaped “clouds” in the two orthogonal viewing directions. This showed
that the H2 molecules were freely rotating, as is expected in phase-I. When the pressure was
increased from 100 GPa, triangular patterns gradually emerged when viewed down the
hexagonal c-axis (y) (Figure 3. 22). However, the round “cloud” patterns still persisted in the
perpendicular x direction (Figure 3. 23). Starting from 130 GPa, triangular patterns became more
prominent. Concomitantly, the motions viewed down the x direction had flattened.
79
This
indicated the H2 molecules were no longer freely rotating. Furthermore, a detailed examination
showed that the triangular features arose from restrictive molecular rotations within the x-z plane
of the orthorhombic cell.
Figure 3. 22 Trajectories of solid hydrogen as a function of pressure. Viewed along ydirection. The pressure values (in unit of GPa) are indicated in the plot.
80
Figure 3. 23 Trajectories of solid hydrogen as a function of pressure. Viewed along xdirection. The pressure values (in unit of GPa) are indicated in the plot.
The visually suggestive, restricted H2 molecular motions were confirmed from an
analysis of orientations function P2 introduced in Chapter 2. The relaxation time at each pressure
was estimated by fitting the short-time behaviour of the orientation autocorrelation function
P2(t)P2(0) to an exponential function plotted in Figure 3. 24. It was found that the relaxation
time increased abruptly from 15 fs at 120 GPa to 25 fs at 130 GPa. This discontinuity signified a
structural transition from a free rotor phase-I to a restricted rotor phase-II. The longer relaxation
time in phase-II was the result of restricted H2 rotations.
81
35
Relaxation Time (fs)
30
25
20
15
10
5
0
0
50
100
150
Pressure (GPa)
Figure 3. 24 Relaxation time from the time autocorrelation function of
P2 ( ) 1 (3cos 2 1) of hydrogen molecules in the solid state at pressures between
2
25-160 GPa. The phase-I II transition is indicated by the red arrow.
At 160 GPa, the large amplitude H2 rotational motions were largely inhibited and the H2
molecules were now liberated about their centers of mass. The instantaneous configuration was
found to be a layered structure with a monoclinic C2/c symmetry. This structure is the same as
the lowest enthalpy structure previously proposed for phase-III [23].
FPMD calculations correctly reproduced the experimental trend of successive phase
transitions in solid hydrogen from phase-I to II to III. The transition pressures at 245 K were
estimated at 130 and 160 GPa, respectively. The present results showed that at high compression,
free rotation of H2 was no longer feasible. Calculations of the orientation autocorrelation
functions and the relaxation time indicated that at 130 GPa phase-I is transformed to a restricted
rotor phase-II. At 160 GPa, rotations were inhibited and phase-II transformed into an orientationordered phase-III.
82
3.2.6 Conclusions
FPMD simulation method was used to study the dynamics and structural transformations
in dense hydrogen at 250-300 K and between 250-370 GPa. While previous theoretical
prediction studies were focused on the static structures, we investigated structural dynamics near
room temperature. It was found that the proposed two distinct layers in phase-IV can exchange
dynamically. These molecular layers are composed of rotating H2 molecules and “atomic” Glayers displaying fast site-to-site proton transfer. These findings are novel and unprecedented. At
room temperature, the structure of phase-IV solid hydrogen was dynamic with molecular
orientation disorder and large amplitude proton hopping. These results challenge the
appropriateness of conventional static space group descriptions of a crystal structure.
Nevertheless, the time average structure is close to the Pc space group suggested in a theoretical
prediction. Simulation results also showed that when compressed to 370 GPa, phase-IV will
transform spontaneously to metallic Cmca-4 symmetry. The latter structure is still molecular in
nature and the existence of a monatomic solid hydrogen structure is still elusive.
83
84
CHAPTER 4
IONIC TRANSPORT IN LI-ION BATTERY MATERIALS
As presented in Chapter 1, a rechargeable lithium-ion battery (LIB) consists of three
principal components: a positive electrode (cathode), a negative electrode (anode), and an
electrolyte (electronic conduction medium). To design LIBs that meet the demands for highpower devices, there are many technical challenges to overcome. Fast charging rate and high
energy density are two critical issues. The charging/discharging rate is directly related to Li
transport ability. Information on the diffusion mechanisms and diffusion paths is crucial to
improve the performance of LIBs. However, the behaviour of Li transport in many potential
electrode and electrolyte materials is not well understood. Molecular dynamics based on firstprinciples methods is able to provide valuable information to characterize Li transport behaviour
at the atomic scale.
In this chapter, selected materials of the three components of the LIB were studied using
first-principles methods. LiFePO4, a promising replacement to the current LiCoO2 cathode, was
investigated in the first part of this chapter and two diffusion mechanisms were revealed by firstprinciples molecular dynamics (FPMD) simulations. The anti-site pathway (vide supra) found in
the calculations helps to resolve a controversy on the experimentally-measured Li diffusion
dimensionality [110-114]. Based on theoretical results, suggestions for further experimental
work to improve the Li transport properties of this material are proposed. The second part of the
chapter concerns the possibility of using type-II clathrate Si136 as an anode. It was found that this
silicon material possesses many properties superior to the current graphite anode. These include
84
85
its intrinsic metallic character, extraordinary structural stability, as well as low and flat liathiation
voltages. The Li migration pathways between the cages in the clathrate structure were studied in
detail. An unusual diffusion mechanism involving collaborative motions of Si framework atoms
and the formation of transient chemical bonds was revealed. The relatively high activation
barrier affects ionic diffusion rate and low Li intercalation concentration limits energy capacity.
Despite these shortcomings, Si clathrate is still probably useful as an anode material for specific
applications where safety is the highest concern. Finally, the Li transport and ionic conductivity
in the potential solid electrolyte material Li3PS4 will be studied. The calculated electrochemical
window was found not to be as wide as suggested by experiments. The general trends of the Li
conductivity in the crystalline γ-, β-Li3PS4 as well as the nano-clusters are consistent with
experimental observations. In contrast to the expected continuous flow of Li ions, even in the
superionic state a hopping mechanism between Li sites was found.
4.1 Cathode: LiFePO4
A systematic survey of suitable cathode materials identified LiCoO2, LiMn2O4 and
LiFePO4 as the most promising candidates. LiFePO4 [115] in particular has attracted the most
attention due to its safety, high energy-density, low cost, structural stability and environmental
benign properties. LiFePO4 has a maximum lithium intercalation potential of 3.5 V and a
theoretical capacity of 170 mAhg-1 [116]. In LiFePO4, the O atoms are covalently bonded to the
P atoms forming tetrahedral PO4 units. The PO4 units reduce the problem of oxygen gas
generation due to heating on overcharge which can cause the battery to catch fire when
combined with a flammable organic electrolyte. It also has the advantage of being relatively
85
86
inexpensive. These merits have made LiFePO4 favourable for commercial battery applications.
However, a major obstacle to realize the full potential of LiFePO4 is its low electronic
conductivity, which inhibits high-rate applications [117].
Many theoretical calculations have been used to investigate the electronic properties of
LiFePO4 in order to improve its applicability. Since the valence 3d electrons in Fe containing
compounds are localized, they are highly correlated. The common density functionals employing
local (spin) density approximation (LSDA) or the generalized gradient approximation (GGA)
have failed to describe the correlated electronic state. It has been shown that the Hubbard model
(LDA/GGA+U), where an onsite repulsion parameter U is used to describe the Coulomb
repulsion interaction, is an empirical method that can provide reasonable results [118]. This
method is used in this thesis work to study the electronic structure of LiFePO4 [118]. Using an
empirical U parameter of 3.71 eV for the Fe 3d electrons, the band gap was found to be 3.8 eV
and the activation energy for electrical conductivity was ca. 0.6 eV [119]. The reason for the low
electronic conductivity in pristine LiFePO4 is the intrinsic insulating nature of the material. To
achieve a high rate of charge and discharge requires not only high electronic conductivity, but
also fast ionic conductivity within the electrode material. The Li ion diffusion constants obtained
from Galvanostatic Intermittent Titration Technique (GITT) and Electrochemical Impedance
Spectroscopy (EIS) ranged from 10-13 to 10-16 cm2/s [8-11]. Efforts to increase electrical
conductivity have been focused on particle size reduction [120], carbon coating [116] and cation
doping [117, 121]. Very recently, Kang and Ceder demonstrated that extraordinarily high
discharge rates of Li batteries with LiFePO4 as a cathode could be achieved with a fast ionconducting surface phase through controlled off-stoichiometry [122]. This experiment and the
hypothesis, however, have been heavily criticized [123]. Fundamental knowledge of the Li
86
87
diffusion process in LiFePO4 in the atomic scale is essential to determinate the factors governing
the electrochemical behaviour of this material.
LiFePO4 has an olivine structure belonging to the Pnma space-group. As illustrated in
Figure 4. 1, the LiO6 octahedra are edge-shared parallel to the b-axis of the crystal, thus creating
Li channels along this [010] direction. These chains are bridged by edge- and corner-shared PO4
tetrahedra, creating octahedral interstitial sites along the c-axis. A cursory inspection of the
crystal structure suggests a possible pathway for Li transport is through the Li ion channels along
the b- or c- directions. Previous first-principles calculations [110, 111] indicated that the Li ion
mobility was much higher in the diffusion channel along the [010] direction (along the b-axis)
than the [001] direction (along the c-axis). Therefore, it is generally believed that Li ion hopping
between channels is highly unlikely. Similar conclusions were reached by the calculations of
Islam’s group using empirical potential models [112].
PO4
FeO6
Li
Figure 4. 1 Polyhedral representation of LiFePO4 crystal structure in a unit cell (spacegroup Pnma) viewed along the c-direction.
87
88
While most theoretical calculations [110-112] agree that the Li ion transport in the
ordered structure of LiFePO4 should follow a “zig-zag”, one-dimensional (1D) pathway along
the b-axis direction, experimental results have been contradictory. For example, measurements
on pure and doped single crystals suggest that the low Li ion conductivity is primarily twodimensional (2D) and confined within the b-c plane [113, 114]. In contrast, another single-crystal
measurement of ion conductivity shows that ionic conductivity along the “b” direction is a few
thousand times larger than that in the two orthogonal directions consistent with the prediction of
a 1D migration pathway [124]. A recent analysis of neutron powder diffraction patterns by
Nishimura et al. using the maximum entropy method also revealed a “zig-zag”, 1D pathway for
Li ion transport along the [010] direction [125]. On the other hand, there has been recent
speculation about the possibility of antisite defects in LiFePO4 that may affect the diffusion
behaviour [126, 127]. Classical molecular dynamics simulations have already been employed to
investigate how structural disorder (i.e., intrinsic anti-site defects) affects anisotropy of the ionic
diffusion coefficient [128, 129]. It was concluded that the anti-site of Fe on Li could impede the
Li ion diffusion along the [010] channel.
All previous theoretical studies [110-112] predicting a 1D diffusion along the Li [010]
channel were based on the calculation of the migration energy barrier following a pre-conceived
“minimum” energy path (MEP). Most calculations were performed with the nudged elastic band
(NEB) method [130] which depends on a priori assumed initial and final geometry. Because
self-diffusion of Li ion in LiFePO4 is a thermally induced process, molecular dynamics
simulation offers a more direct approach to explore feasible diffusion pathways. In the present
study, the Li ion diffusion behaviour in LiFePO4 was studied with FPMD calculations. As
described above, the Hubbard GGA+U model [118] is essential to take into account for the
88
89
important electron-correlation effect [118], therefore GGA+U FPMD were performed to
characterize the Li transport pathways in LiFePO4. To the best of our knowledge this is the first
time that a spin polarized GGA+U method was used in a FPMD calculation.
4.1.1 Computational details
Spin polarized FPMD calculations were performed using the pseudopotential plane-wave
method with projector augmented wave (PAW) potentials [61, 131] replacing the atomic core
electrons. Electron orbitals were represented by the expansion of plane-waves with an energy
cutoff of 400 eV. To account for electron correlation in the Fe 3d orbitals, the GGA functional
[132] was augmented with a Hubbard on-site repulsion term, U (GGA+U) [133]. The effective
interaction Ueff = U-J of 4.3 eV, where J represents the Coulomb interaction, was used. This Ueff
value has been shown to give the correct electronic ground state structure and band gap energy as
well as the experimental intercalation potential of LiFePO4 [118]. All calculations were
performed with the aforementioned method as implemented in VASP code [60, 134].
Calculations on the ground state properties of bulk olivine-type LiFePO4 (Pnma, 28 atoms/unit
cell) were performed using a 1×2×3 Monkhorst-Pack k-point mesh [46]. To calculate the
electronic density of states (DOS), a denser k-mesh of 3×5×7 was used. Convergence with
respect to self-consistent iterations was assumed when the total energy difference between cycles
was less than 10-5 eV and the residual forces were less than 0.005 eV/Å. In agreement with
experimental and previous theoretical studies, the ground state of LiFePO4 was found to be antiferromagnetic. Results on the optimized structural parameters and the band gap are summarized
in Table 4. 1 and are in substantial agreement with experimental data [118, 135].
89
90
Table 4. 1 Comparison of calculated and experimental structural parameters and
bandgaps of LiFePO4 (space group Pnma).
Calculated
Experimental [135]
a (Å)
10.4060
10.3377
b (Å)
6.0565
6.0112
c (Å)
4.7442
4.6950
Bandgap (eV)
3.64
3.8-4.0 [117]
In the molecular dynamic calculations, a 1×2×2 supercell containing 16 LiFePO4 units
(112 atoms) was employed. For this fully lithiated LiFePO4 system, the Brillouin zone sampling
was performed at the point. Since LiFePO4 is antiferromagnetic, spin polarization
(unrestricted) calculations were performed. The model system was first thermally equilibrated in
a micro-canonical ensemble (NVE) for 2 ps then followed by a MD production run of 20 ps
where the temperature was controlled by a Nose-Hoover thermostat [80]. A time step of 1 fs was
used for the integration of the motion equations. Initial simulations performed at 600 and 1000 K
showed no significant Li migration, even when simulation time lasted for 20 ps. To reduce the
computation effort and increase the possibility of Li ion diffusion, the temperature was raised to
2000 K. It was found that the Li atoms diffused readily. Statistically significant Li diffusion
events were obtained by registering a number of atomic jumps for both the Li and Fe atoms in
the MD trajectories.
4.1.2 Li self-diffusion mechamisms
Li ion migration in fully lithiated LiFePO4 was observed from the MD trajectory at 2000
K. An important finding was that the Li transport is not the continuous process previously
anticipated [125]. In contrast, the migration occurred in discrete steps with the Li ions hopping
90
91
between different sites but not in a concerted manner. In the crystal structure, each Li atom was
surrounded by six nearest O atoms forming a LiO6 octahedron. The hopping process was
highlighted via the examination of the time evolution of the relative Li-O distances, dLi-O(t)/dLiO(t0),
where t0 is the time origin. Oscillation of the relative Li-O distances about a constant mean
value indicated the Li ions were trapped. A sudden and dramatic change in the value of the
relative Li-O distances, instead, signified that a “jump” (hopping) of a Li ion from one site to
another site has occurred. It should be noted that it is not necessary for all six relevant Li-O
distances to experience a big change when a Li ion is migrated (e.g., when the initial and final
sites share a common O atom at similar distances). All Li atoms in the model system were
examined.
(a)
initial
4
final
dLi-O(t)/dLi-O(t0)
dLi-O(t)/dLi-O(t0)
4
3
2
1
(b) initial
intermediate
final
3
2
1
0
5
10
15
20
0
Time (ps)
5
10
15
20
Time (ps)
Figure 4. 2 Time evolution function of relative Li-O distances within a LiO6 octahedron
involved in the crystal LiFePO4. The sudden change of the Li-O distance value
indicates the hop from one site to another has occurred. (a) a migrating Li ion hops
from one Li site to a second Li site along the b-axis direction as involved in the first
diffusion mechanism; (b) with the second diffusion mechanism a migrating Li ion hops
from a Li site to a neighbouring Fe site and then to a second Li site in an adjacent Li
[010] channel.
91
92
To illustrate the Li hopping process, only two separate events for two Li ions are
shown in Figure 4. 2a and Figure 4. 2b. As shown in these Figures, both Li ions hop from one
site to another at ca. 10.5 ps. In the case of the Li ion in Figure 4. 2b, a more complex diffusion
process was identified. At 10 ps it hopped and then became “trapped” at an intermediate site for
4 ps before a second hop at 14 ps. The self-diffusion of Li is therefore not a continuous process
as anticipated; rather, it consists of a sequence of consecutive processes where Li ions are
trapped momentarily and oscillate for a short time before jumping to the next available site.
1
1
2
2
3
3
4
4
10.5 ps
3
4
11.2 ps
1
2
3
4
12.5 ps
1
2
13.3 ps
1
2
4
3
14.0 ps
Figure 4. 3 Snapshots from the MD simulation of the fully lithiated LiFePO4 at 2000 K
showing Li diffusing along the b-axis direction, where those Li atoms without getting
involved in this diffusion mechanism as well as those O atoms are not shown for
clarity. Large (light green) and small (brown) spheres represent Li and Fe atoms,
respectively. Numbers on Li atoms are given indices of atoms in the crystal structure
for the facility of description. Dashed lines show the size of the used supercell.
92
93
Further analysis of the atomic motions revealed that the two Li ions illustrated in Figure
4. 2 are actually involved in two distinct diffusion mechanisms. In Figure 4. 2a, the adjoining Li
ions in the channel parallel to the crystal b-axis hopped between the neighbouring Li sites,
leading to a 1D diffusion mechanism similar to what has been proposed in previous theoretical
calculations [110-112]. A more detailed representation of the atomic processes of this diffusion
mechanism is depicted in Figure 4. 3. Four Li atoms are shown with a number index of 1, 2, 3
and 4 in the simulated cell situated sequentially in the channel along the b-axis. First, atom Li-1
moved away from its site towards the adjacent Li-2 in a circuitous route. Due to the increased
repulsion from the approaching Li-1, Li-2 started to move towards the nearest neighbour Li-3
site on the other side of the channel. Concomitantly, atom Li-3 became displaced and atom Li-4
was pushed away, forming a Fe anti-site (vide infra) with atoms Li-1, Li-2 and Li-3 all migrated
forward to occupy the former Li-2, Li-3 and Li-4 sites, respectively.
To illustrate the diffusion pathway more clearly, trajectories of three Li atoms (Li-1, Li-2
and Li-3) involved in the migration process are depicted in Figure 4. 4. For clarity, the positions
of the “spectator” atoms (i.e., Fe and PO4) are fixed at their initial configurations. The “zig-zag”
diffusion pathway of the Li ions along the b-axis channel confined in the a-b plane can be easily
identified. The FPMD calculations also revealed other details about the atomistic migration
processes. It was found that the thermal vibration of trapped Li ions is anisotropic with a
preferred direction towards the face-shared tetrahedral Li sites (see Figure 4. 4). This picture of
the Li diffusion pathway and the vibration anisotropy is consistent with experimental findings
[125] and previous theoretical predictions [110-112]. The observation of the replacement of an
Fe site by a Li ion in the simulation was due to the fact that our model system was fully lithiated
93
94
and there were no vacant Li sites. In previous studies [110-112], the presence of defect vacant Li
sites was always assumed and no dynamical simulation were performed. Nevertheless, the
features for the 1D “zig-zag” Li diffusion pathway observed here is very similar to that obtained
before.
Figure 4. 4 Trajectories of the three Li atoms originally situated in the crystalline
LiFePO4 structure along the b-axis obtained from the MD simulation at 2000 K. The
three specific Li atoms are highlighted with different colours, and all other Li atoms are
omitted for clarity. A “zig-zag” diffusion pathway can be clearly identified (shown with
the curved arrows) along the b-direction and confined in the a-b plane.
It is surprising that at the transition point when a Li ion migrates and passes the
neighbouring PO4 tetrahedron, there is no noticeable collaborative change in the orientation of
the PO4. One would expect that a concomitant rotation of the PO4 may help to reduce the
repulsion between the three O atoms, forming the tetrahedral face with the hopping Li ion
promoting mobility. However, it was found that the orientation change of PO4 was at the same
time scale as that of the thermal effect (refer to Figure 4. 2). The PO4 tetrahedra were identified
94
95
as intact with only minor changes in the P-O bond lengths (±0.3 Å). In contrast, the FeO6
octahedra were more fragile. On a few occasions (vide supra) the Fe ions were found to migrate
between different sites. As will be described below, this is the basis for the second Li ion
migration mechanism.
The second Li ion migration route involved the formation of a Li-Fe anti-site defect (i.e.,
the exchange between Li and Fe ions). Li-Fe anti-sites have been suggested as an intrinsic defect
in LiFePO4 by a theoretical calculation [112]. It was speculated that even at low temperatures
there should be a small percentage of Li-Fe anti-sites because of the low exchange energy (ca.
0.7 eV) [112]. The Li ion diffusion mechanism involving the formation of a Li-Fe anti-site is
illustrated in Figure 4. 5. The mechanism is highlighted from a pair of Li (pink) and Fe (blue)
ions in a series of snapshots captured during the MD simulations. It was shown that a Li ion in
the [010] channel diffuses to the adjacent Li ion channel facilitated by the formation of a Li-Fe
anti-site. A Li ion (see Figure 4. 2b) initially in the Li ion channel displaced a Fe ion in the
neighbouring site (anti-site Li) and simultaneously the Fe ion migrated to another Li site,
forming an anti-site Fe. The anti-site Li ion continued to migrate to an available Li site in the
adjacent Li ion channel. Consequently, Li ion diffusion between adjacent [010] channels can be
accomplished with the formation of a pair of Li-Fe anti-sites. This possibility was raised by
Malik and colleagues based on the results of static first-principles calculations [136]. The
activation energy for a Li ion migrating to the nearest Li channel through a vacant intermediate
Fe site was determined to be 0.491 eV. Although this is higher than that the 0.27 eV for Li
migration along the [010] Li channel [110], the crossing of the Li ion channels was anticipated to
occur whenever the migrating Li encountered an anti-site Fe in the Li channel due to a larger
energy barrier along the channel (0.70-0.74 eV) [129, 137]. After crossing the channel, the Li ion
95
96
can continue migrating in a new diffusion path along a second [010] channel. Migration across
channels, however, can reduce the diffusion rate as compared to the 1D diffusion along the [010]
channel. Overall, the presence of anti-site defects was expected to reduce Li ion mobility and
thus the electrochemical capacity. A low concentration (<3%) of anti-sites has been observed in
hydrothermally synthesized LiFePO4 [127]. The result is in reasonable agreement with a
scanning transmission electron microscopy (STEM) measurement, where the concentration of
anti-site defects was found to be approximately 1% [138]. Recently, Hamelet and colleagues
have reported a Li-Fe exchange in LiFePO4-based nano powders with a significant amount of
structural defects [139].
9.0 ps
15.0 ps
11.2 ps
c
Figure 4. 5 Snapshots from the MD simulation of the fully lithiated LiFePO4 at 2000 K
showing the second diffusion mechanism involving the formation of Li-Fe antisite.
Large (light green) and small (brown) spheres represent Li and Fe atoms, respectively.
A pair of Li (pink) and Fe (blue) atoms are highlighted to illustrate this mechanism.
Dashed lines indicate the size of the used supercell.
As discussed above, the formation of Li-Fe anti-sites indicates that the Li diffusion
process is “two-dimensional”. The present results lend credence to the recent and perhaps
surprising suggestion that Li ion diffusion in single crystal LiFePO4 is 2D [113, 114]. It is
possible that this2D diffusion mechanism may affect the overall diffusion rate of Li ions
96
97
compared to the 1D one along the [010] channel. A future experiment, particularly one
considering the temperature effect, may help to resolve this issue since the formation of Li-Fe
anti-sites is a thermal activated process. Nevertheless, in a practical LiFePO4 cathode, the
concentration of the anti-site defects may be small but it may still impede the normal Li diffusion
along the [010] channel.
4.1.3 Conclusions
The Li ion self-diffusion in crystal LiFePO4 has been studied using GGA+U AIMD
calculations. Two distinct Li ion diffusion mechanisms were found. The results showed that
diffusion processes are more complex than suggested from previous static calculations. The Li
migration was shown to involve temporal collaborative relaxation or be assisted by the migration
of Li and Fe ions at close proximity. In agreement with previous studies [110-112], a “zig-zag”
1D diffusion along the b-axis direction and restricted in the a-b plane was identified [125]. A
second pathway not previously proposed involved diffusion across the [010] channels, aided by
the formation of Li-Fe anti-sites. The formation of Li-Fe anti-site defects is consistent with
suggestions in experimental findings. Li transport through the anti-site defect is expected to be
slower than the route along the 1D pathway down the [010] channel. The simultaneous
occurrence of two distinct Li transport processes suggested that the gross result of Li diffusion
was not a simple linear process but may exhibit features of a 2D diffusion pattern. It should be
recognized that the study of diffusion mechanisms by FPMD is still a challenging problem; this
is owing to the limited accessible time scale. The preliminary results presented here demonstrate
the strength of this approach in providing deeper insight into the atomistic processes for diffusion
97
98
mechanisms. Future investigations will focus on realistic systems such as Li transport in partially
lithiated LixFePO4 (x<1) systems, with and without the presence of an electric field gradient.
4.2 Anode: Type-II Si Clathrate
4.2.1 Introduction
A suitable anode material for rechargeable LIBs is expected to possess the following key
properties: an open structure for lithiation and delithiation, a high specific capacity, low and
constant voltage, great structural stability and good electron and Li ion conductivity. In practice,
it is difficult to satisfy all these conditions with a single material. For example, silicon (Si) has
attracted great attention as potential anode application due to its extremely high theoretical
specific capacity (4200 mAh/g) [140] compared to the current graphite anode (372 mAh/g). A
major obstacle to realize the practical application of these high energy density materials is the
significant volume change associated with lithiation and delithiation in the charging and
discharging processes. This often leads to anode fractures and failure of the battery [141]. A
remedy is to employ nano-structured Si with larger open surface area instead of bulk Si [142].
Below we study another alternative.
Si clathrates are polymorphs of silicon with open frameworks constructed from the three
dimensional links of sp3 Si atoms. Metal atoms can be encapsulated in the empty voids. Since the
synthesis of two distinct clathrate phases - Na8Si46 (type-I) and NaxSi136 (x<11) (type-II) - was
first reported in 1965 there has been considerable interest in exploiting these open framework
98
99
compounds as tunable semiconductors and thermoelectric materials. Type-I Si clathrate has a
simple cubic structure (Pm-3n) and contains 46 Si atoms per unit cell (Si46). It is composed of
two “small” dodecahedron (512) cages with 20 Si atoms and six larger truncated trapezohedron
(51262) formed by 24 Si atoms. Type-II clathrate consists of 136 Si (Si136) in a face-centeredcubic structure (Fd-3m). There are also two types of cages: sixteen small (512) cages and eight
large hexadecahedron (51264) made up of 28 Si atoms. Metal-intercalated Si clathrates exhibit
many novel properties, including superconductivity in Na2Ba6Si46 and Ba8Si46 [143, 144] and
tunable electronic properties in NaxSi136 achieved by adjusting the concentration of the
intercalated Na [145]. More significantly, silicon clathrate Si136 has been found to possess very
low compressibility (i.e., comparable to that of the diamond) up to 12 GPa [146], indicating
type-II Si136 has a rigid framework.
Recently, an American patent suggested that Si clathrates might be used as anode
materials for LIB applications [147]. However, there was insufficient information to support this
expectation. In this thesis we report a systematic investigation of the suitability of type-II Si136
clathrates as anode materials with first-principles calculation methods. The two reasons that
type-II clathrates were investigated are: (i) there are more small cages which Li can occupy due
to the energy preference of the small guests to the small cages; and (ii) its framework is
thermodynamically more stable than type-I, as one would expect from the analogous water
clathrates [148]. It was found that pristine Si136 clathrate is energetically less stable than the
normal face-centered cubic (fcc) Si. However, we demonstrated that the Si136 clathrate can be
stabilized by doping with barium (Ba) and forming intercalated BaxSi136 (6≤x≤8) compounds. It
is noteworthy that it is possible to synthesize guest-free type II Si clathrate via the controlled
thermal decomposition of sodium monosilicide NaSi under vacuum [149]. During the course of
99
100
this study we reported successful lithiation into the almost empty Si136 [150]. However,
reversible lithiation/de-lithiation was not demonstrated [150]. Moreover, as will be shown below,
intercalation of Li into the empty Si136 structure is not sufficient to compensate for the energetic
difference of the empty clathrate with respect to fcc Si. This structural instability may explain the
observed “collapse” of the clathrate structure during the lithiation process [150]. In comparison,
the Si136 framework stabilized with the addition of Ba (BaxSi136 (6≤x≤8)) and the stability was
more likely maintained upon reversible lithiation and delithiation cycles. This investigation
focused on the Ba-stabilized clathrates and examined their suitability to serve as an anode.
From the present theoretical investigation, it was found that lithiation had a minimal
effect on the clathrate structure, indicating the Ba8Si136 clathrate is a nearly zero strain material.
The calculated voltage associated with lithiation of Ba8Si136 clathrate was found to be very low
and almost constant with Li content. The most significant finding was that the barrier of Li
diffusion was determined by the geometry of the polyhedral face (i.e., pentagonal or hexagonal)
shared by neighbouring cages. A surprising result was that the energy barrier for Li diffusion
through the smaller pentagonal face (Si5 ring) was lowered significantly by the presence of Ba
atoms in the two adjacent 51264 cages. This unusual diffusion mechanism uncovered here may
provide valuable information to help further development of this material as anode for LIBs.
4.2.2 Computational details
First-principles density functional theory calculations on type II Si136 clathrate doped
with Ba and Li atoms were performed using VASP code [60, 134]. The projected augmented
wave (PAW) potentials [61, 131] were used along with the PBE-GGA exchange-correlation
100
101
functional [40]. For Ba atoms, the 5s, 5p and 6s orbitals were treated as valence. Electron orbitals
were represented by a plane-wave basis set with an energy cutoff of 450 eV. Most geometry
optimization and electronic structure calculations were performed in the primitive cell
comprising of 34 Si (Si34). Brillion zone was sampled with a 6×6×6 Monkhorst-Pack (MP) kpoint mesh [46]. Self-consistent iteration convergence was assumed when the total energy
difference between successive cycles was less than 10-6 eV. To calculate the energy of the Li
diffusion barriers, an improved NEB method known as the climbing NEB (cNEB) scheme [54]
was used. In this case, the full cubic cell was employed to reduce the influence from the effect of
periodic images, and a less dense MP k-grid of 2×2×2 was used.
4.2.3 Results and discussions
Crystal structure and stability
The conventional cell of a Si136 clathrate is shown in Figure 4. 6. Assuming single
occupancy (i.e., one guest atom for each cage, which is true for most alkali and alkaline metals),
a total of 24 guest atoms were encapsulated into the Si136 framework. It is usually the case that
larger metal atoms tend to prefer large cages and the converse is true for the small cages.
The first step of the calculation was to optimize the crystal structure of pristine Si136. The
calculated lattice constant of 14.73 Å was in good agreement with the experimental value of
14.62 Å [151]. Compared with the conventional fcc Si, the pristine Si136 clathrate was found to
have a total energy higher by 0.052 eV/Si and was therefore thermodynamically less stable.
Encapsulation of metal atoms is needed to help to stabilize the crystal structure [152].
101
102
Figure 4. 6 Crystal structure of a type II Si136 clathrate with two types of cages: small
cage 512 (cyan) and large cage 51264 (yellow) (a) in the conventional cell and (b) in the
primitive cell. Green lines indicate the cell boundary.
First, the effect of Li encapsulation into the cages of an empty Si136 was studied. It was
noted that Li preferred to be situated at the center of the small cage but off-center in the large
cage. Due to their small size, Li atoms preferred the small cages. In fact, when a single Li atom
was put in the large cage of an empty Si136, the total energy was raised by 0.060 eV/Li,
indicating the structure destabilized. However, when all small cages were first occupied by Li
atoms, further doping Li atoms in large cages was found to be energetically favourable as well.
The stability of the Li-doped Si136 with respect to fcc Si and body-centered cubic (bcc) Li metal
was determined by the energy of formation per Si atom, Eform. In the primitive cell, Eform is
calculated by the following formula,
Eform [E(MxSi34 ) 34E(Si) xE(M )]/ 34 ,
102
(4.1)
103
where E(Si) = -5.4249 eV/Si and E(M=Li) = -1.8993 eV/Li. These are the total energies per atom
for the fcc Si and bcc Li metal, respectively. A summary of the calculated energies is shown in
Table 4. 2. The decreasing formation energy Eform indicates that the doping of Li atoms in the
clathrate Si136 structure is energetically favourable. However, the overall positive values of Eform
clearly show that the incorporation of Li did not improve the stability of the Si clathrate
structures with respect to fcc Si. For this reason, it is not surprising that the crystalline Si136
structure was found to collapse upon increasing Li content [150]. It is reasonable to conclude that
empty Si136 will not be a suitable material for anode application.
Table 4. 2 Formation energy of clathrates LixSi34 (x≤6) upon lithiation with respect to
fcc Si and bcc Li. The first four doped Li atoms were put into the small cages, and then
the next two Li were further doped into the two large cages with Li being off the cage
centers.
x in LixSi34
Eform (eV/Si)
1
0.051
2
0.046
3
0.039
4
0.030
5
0.024
6
0.021
For Si clathrate to be useful as an anode, it is necessary to introduce metal atoms into the
51264 cages to stabilize the framework while leaving the 512 cages empty to incorporate the
smaller Li atoms. For this purpose, the relative stability of Si136 clathrate intercalated with Na
atoms into the large empty 51264 cages was calculated. The energies reported in Table 4. 3 show
the clathrate structure Si136 was not stabilized with respect to fcc Si and bcc Na metal through the
addition of Na. It is known that Ba atoms favour the large 51264 cages [153]. The effect of Ba
doping was evaluated from the calculations of the formation energy per Si atom, Eform, of the
BaxSi136 (x 8) clathrates (with conventional crystal cells) based on an equation similar to
103
104
Eq.(4.1). The calculated formation energies are summarized in Figure 4. 7, where E(Ba) (= 1.92324 eV/atom) is the total energy for a stable bcc Ba metal. As can be seen from the figure, as
the number of encapsulated Ba increased, Eform decreased gradually. This indicates that the
BaxSi136 structures are becoming more competitive to empty Si136 and Ba metal. At x ≥ 6, the
formation energy became negative, showing that the BaxSi136 turned out to be more stable than
fcc Si and bcc Ba.
Table 4. 3 Formation energy of clathrates NaxSi136 (x≤8) upon lithiation with respect to
fcc Si and bcc Li. Eform was calculated in the similar formula of Eq.(4.1) but in the
conventional cell.
1
0.050
2
0.049
4
0.046
6
0.039
8
0.036
0.06
0.0
0.04
-0.2
0.02
-0.4
0.00
-0.6
-0.02
-0.8
0
2
4
6
Formation Energy Eform (eV)
Percentage of volume change (%)
x in NaxSi136
Eform (eV/Si)
8
x in BaxSi136
Figure 4. 7 Formation energy Eform and the percentage of volume change of Ba-doped
clathrates BaxSi136 as a function of Ba content x.
104
105
Upon the addition of Ba, it was also noted that the volume of BaxSi136 clathrate
contracted very slightly (see Figure 4. 7). For example, at the maximum Ba content when the
eight large 51264 cages were completely filled, the volume of Ba8Si46 was only 0.8% smaller than
the empty Si136. The almost constant volume over a large Ba concentration indicates rigidity of
the open Si framework. Since Li atoms favour the small 512 cages, the ensuing study focused
mainly on the stabilized clathrate Ba8Si136. For reasons to be discussed below, less Ba-doped
Ba6Si136 was also studied in the investigation of Li transport mechanisms.
The effect of Li intercalation into Ba8Si136 was studied by gradually filling the 16 small
cages. It was found that the smaller Li atoms prefer to reside at the center of 512 cage (see Figure
4. 6). To reduce computational effort, formation energies were calculated in the primitive cell
LixBa2Si34 (x 4). The results are listed in Table 4. 4. All Li-intercalated clathrates had negative
formation energies relative to Ba2Si34 (Ba8Si136 in the conventional cell) and bcc Li, indicating
the Li occupation of the 512 cages was energetically favourable. The volume of Li-intercalated
clathrate as a function of Li content is also tabulated in Table 4. 4. Once again, the cell volume of
LixBa2Si34 (x 4) only reduced marginally with increasing Li content. The overall volume
change, however, was negligibly small: only 0.021% when all small cages were filled (x = 4). In
comparison, the volume changes of other anode materials such as graphite (~10%) [154] and
silicon (~400%) [155] are more substantial. The very small volume change for the Si136 clathrate
was remarkable. This observation showed that LixBa8Si136 has superior structural rigidity upon
adding and removing Li. This is a critical factor to reduce the fast capacity fading rate during
charge and discharge cycles.
105
106
Table 4. 4 Formation energy and volume change of clathrates LixBa2Si34 (x≤4) upon
lithiation. Eform is calculated relative to the Ba2Si34 and bcc Li.
x in LixBa2Si34
Eform (eV/Li)
V (Å3)
ΔV/V0 (%)
0
0
794.77
0
1
-0.361
794.18
-0.007
2
-0.378
793.70
-0.013
3
-0.396
793.55
-0.015
4
-0.421
793.11
-0.021
Electronic structure
To examine the effect of Li intercalation on electronic properties, band structures for Si34,
Ba2Si34, LiBa2Si34, and Li4Ba2Si34 were calculated and compared (see Figure 4. 8). In agreement
with previous studies [156-158], empty Si34 was found to be a semiconductor with a direct band
gap of 1.38 eV. In a Zintl description, the encapsulation of Ba and Li atoms lead to electron
transfer from the metal to the Si34 framework. As a result, the conduction band of Li- and Badoped Si34 was populated and showed metallic character. The conduction band profiles of
LixBa2Si34 (x=1,4) were modified slightly from that of the parent Ba2Si34. The inherent metallic
property of Li-intercalated Ba8Si136 is a distinct advantage for anode applications as it ensures a
good electrical conductivity.
106
107
Si34
2
Energy / eV
Energy / eV
1
0
-1
-2
L
W
X
-1
-3
Ba2Si34
L
W
X
Li4Ba2Si34
1
0
0
Energy / eV
Energy / eV
0
-2
1
-1
-1
-2
-2
-3
LiBa2Si34
1
L
W
X
-3
L
W
X
Figure 4. 8 Bandstructures for pristine Si34 clathrate (Si136 in the cubic cell) and metaldoped clathrates Ba2Si34, LiBa2Si34, and Li4Ba2Si34.
Li-intercalation voltage
The voltage associated with lithiation is a critical parameter for anode materials of LIBs.
The average voltage V is related to the difference in the Gibbs free energy between the charged
and discharged states with Li metal as the reference. Since the contributions of entropy and
volume effects to the Gibbs free energy difference are very small, one may approximate the
voltage using the energy difference computed at ground state (zero temperature and pressure)
[159], given by the formula
eV [E(LixxBa2Si34 ) E(LixBa2Si34 ) xE(Li)]/ x ,
107
(4.2)
108
where E is the total energy, e is the free electron charge and Δx is the increment on Li content.
This method has shown to be remarkably accurate in predicting voltage profiles for many
materials [160]. Figure 4. 9 shows the average intercalation voltage of LixBa2Si34 as a function of
Li content. It was found that the voltage increased only slightly with Li intercalation. This trend
is opposite to those observed in other anode materials [159, 161]. However, the most relevant
and important observation is that the overall voltage variation was very flat (< 0.1 V), changing
from 0.36 V to 0.46 V for the entire intercalation process until all the small cages were fully
occupied. The low and flat potential of ~0.4 V is desirable, as a high cell voltage LIB may be
constructed when combined with an appropriate cathode material.
0.8
Voltage (V)
0.6
0.4
0.2
0.0
0
1
2
3
4
x in LixBa2Si34
Figure 4. 9 Calculated average voltage of Li intercalation in Ba2Si34 as a function of Li
content.
Li diffusion barrier and mechanism
Fast Li ion transport in electrode materials is essential to high power capability (i.e., high
rate of charge and discharge) in LIBs. This requires a low energy barrier for the Li ion to migrate
108
109
in the electrode. To investigate the Li mobility, the crystal structure was examined to identify
possible ion diffusion pathways (see Figure 4. 6). In Si136 clathrate, the small 512 cage is
composed of twelve pentagonal (Si5) faces, while the large 51264 cage contains four additional
hexagonal (Si6) faces. Large 51264 cages share all their hexagonal faces, forming a diamond-like,
three-dimensional (3D) network. If all the cages in Si136 were accessible by Li, three possible
diffusion pathways were identified: (i) between two small 512 cages through the shared Si5 face;
(ii) between small 512 and large 51264 cages through the Si5 face; and (iii) between two large
51264 cages through the Si6 face. To study the energy barrier for Li diffusion, the potential energy
profile along the diffusion path was computed using the cNEB method. In the calculations,
selected structures along the pathway between the two fixed end points [54] were fully
optimized. All calculations were performed in the cubic conventional cell to avoid fictitious
interactions with the periodic images.
In the Ba8Si136 (or Ba2Si34) system studied above, all large 51264 cages were occupied by
Ba atoms, such that the only accessible migration pathway was through a pentagonal face shared
by two small cages. Two models with different Li concentrations were studied. In the first model
(LiBa8Si136), there was only one intercalated Li atom. The second model (Li15Ba8Si136)
represented the other extreme, where 15 out of the 16 small 512 cages were occupied by Li. The
potential energy curves for the diffusion path between two adjacent 512 cages are compared in
Figure 4. 10. It was found that the reaction profiles for the two models were quite similar except
for a small difference in the activation barriers (0.85 eV and 0.97 eV for the first and second
model, respectively). Therefore, it is not unreasonable to expect the energy barrier for other Li
concentrations (1 < x < 15) should bracket between these two values. Since the reaction profiles
109
110
as well as energy barriers obtained from these two extreme models were similar, the first model
with dilute Li concentration (see Figure 4. 10a) was used for ensuing studies and discussions.
Figure 4. 10 Potential energy curves along the reaction path between two small 512
cages through the shared pentagonal face (red) for the two employed models (a)
LiBa8Si136 and (b) Li15Ba8Si136 (see text); (c) side view and (d) front view of the
transient configuration of the transition state. For clarity, only the two small cages, as
well as the Ba atoms (purple) encaged in the three adjacent large cages are shown. The
bonding between SiA and SiB is interrupted by the incoming Li atom (brown).
At first glance, the potential energy profile along the pathway (i) was apparently trivially
simple that the Li atom migrated directly from one 512 cage to the next nearest 512 cage through
the connecting pentagonal face (see Figure 4. 10a). However, the energetically preferred path
revealed from an analysis of the trajectory was quite different. In actuality, this process was the
result of a sequence of complex processes. The Li did not diffuse freely through the middle of
the pentagonal face but rather “through” a Si-Si bond by breaking the bond and forming two
transient Li-Si bonds. Significantly, the broken Si-Si bond (denoted as SiA-SiB) was not
110
111
arbitrarily selected but must be the pair connecting the two neighbouring 51264 cages (see Figure
4. 10c and d). The detail diffusion process can be depicted as follows: at the starting point (point
1 in Figure 4. 10a), the Li atom was situated at the center of the 512 cage, corresponding to the
global minimum energy along the reaction path. The initial migration step disrupted the
favourable interactions between Li and Si cage atoms. The potential energy rose with the
displacement of Li from the cage center. As the Li atom approached the common pentagonal
face of the neighbouring cage, it deviated from the linear path and moved towards the
aforementioned SiA-SiB bond. When the atom got even closer (point 2 in Figure 4. 10a), the SiASiB bond of the shared Si5 ring was pulled apart with the SiA…SiB distance elongated to 4.5 Å. At
this point, the potential energy reached a local maximum of 0.76 eV. Further migration towards
the pentagonal face re-established the Li-Si interactions between the Li atoms and the SiA/SiB
atoms and lead to a local potential minimum at point 3. The transition state with a barrier of 0.85
eV occurred at the highest point 4 where the Li atoms were at the boundary of the two connected
512 cages. Li was located nearly at the center of the broken Si-Si bond and the Li-Si interactions
formed transient Li-SiA/SiB bonds as short as 2.5 Å. After passing the transition state, the Li
atoms followed a mirror route of what had happened before, reaching transition state by
migrating towards the new 512 cage center. Concomitantly, the broken SiA-SiB bond was
recovered during this process. This mechanism maintained efficient Li-Si interactions along the
diffusion pathway and at the transition state, even to the extent of breaking a Si-Si bond. This is a
surprising but important finding.
Results on the investigation of the other two possible Li diffusion pathways (ii) and (iii)
are discussed below. Both pathways involved the migration of Li into a large 51264 cage (i.e.,
from a small or large cage). In both cases, the large 51264 cages involved in the diffusion paths
111
112
could not be occupied by Ba atoms. To model this situation, another energetically stable
clathrate, Ba6Si136, was used when the two empty 51264 cages were located next to each other.
LiBa6Si136, a system with a dilute Li concentration, was chosen for detailed study. Prior to
modeling the diffusion path, the Li position in the large 51264 cage was optimized. Unlike the
small cage, the intercalated Li atom favoured an off-center position in the large cage and
displaced as much as 1.7Å towards the hexagonal face. This configuration displayed a total
energy 0.2 eV lower than when the Li atom was at the cage center. This preference towards offcenter site in large 51264 cages has also been reported in Na, Cs and Rb [162] doped type-II
clathrates.
Figure 4. 11 The Li diffusion potential energy along the successive reaction path 512→
51264 and 51264→ 51264 computed with the LiBa6Si136 model.
The Li diffusion pathways (ii) and (iii) can be collectively represented by successive
migration through the polygon faces (i.e., 512 51264 51264). Figure 4. 11 shows the
calculated potential energy along the reaction path. The diffusion started with Li at the center of
a 512 cage (point 1 in Figure 4. 11). As it approached the pentagonal face, the energy rose quickly
112
113
up to 0.8 eV (point 5). At this position, the Li was 1.34 Å away from the small cage center.
Instead of approaching the center of the pentagonal face, it moved towards the SiA-SiB bond. The
diffusion mechanism along pathway (ii) was similar to what happened along pathway (i) (vide
supra). Like the earlier discussion of Figure 4. 10a (vide supra), the SiA-SiB bond was disrupted
and lead to a local minimum at point 9 as a result of the SiA-SiB bond breaking and enhanced
interactions between Li and the two Si atoms. After that, the Li entered the first large 51264 cage.
The energy maximum of 0.85 eV at point 14 is simply the mirror image of point 5 but the Li
atoms were now inside the large cage. The potential energy dropped quickly to 0.19 eV at point
17 when the Li was 0.12 Å away from the center of the large cage. However, the Li never got
closer to the 51264 cage center; rather, it roamed along the cage wall until it reached the most
stable location (point 23) (i.e., close to the center of the hexagonal Si6 face shared with the next
large 51264 cage). The Li atom continued to migrate along pathway (iii) (i.e., 51264 51264)
through the center of the hexagonal Si6 face (point 26) to the second large 51264 cage (point 29).
The 512 51264 barrier was found to be 0.85 eV; this is the same as the barrier of the 512
512 diffusion path (compare Figure 4. 11 and Figure 4. 10a). In the reverse diffusion direction,
(i.e., 51264 512) the energy barrier was lowered slightly by 0.12 eV. The results highlight the
difficulties for Li to diffuse through the pentagonal faces, either along path (i) or (ii).
Nonetheless, both paths were similar and were only slightly influenced by the environment of the
starting cage (512 or 51264). It is noted that the predicted barrier heights were higher than those
reported with crystalline Si (0.58 eV) [163]. Overall, diffusion mechanisms for pathways (i) and
(ii) involved the breaking and reforming of a Si-Si bond from the pentagonal face to facilitate Li
migration through the bond center and avoid the direct penetration through the Si5 face center.
On the other hand, Li migration along pathway (iii) (i.e., 51264 51264) through the hexagonal
113
114
Si6 interface was found to have a much lower energy barrier of 0.33 eV. This activation energy is
comparable to the Li diffusion barrier (0.12-0.20 eV) found on the surface of Si nanowires [163].
The theoretical results show that Li diffusion through the hexagonal face is easier than through
the pentagonal face. As shown above, this seemingly trivial result is much more complicated
than a naive consideration of static effect on the size of the open polyhedron faces.
In Si136 clathrate, the effective radius of the hexagonal Si6 ring in clathrate Si136 was 2.36
Å. This is comparable to the Li…Si distance of 2.37 - 2.45 Å found in bulk Si when Li is located
at the tetrahedral/hexagonal sites [163]. Therefore, when the Li trespasses the Si6 face center
(point 26 in Figure 4. 11) along path (iii), the hexagonal ring is only expanded slightly to a
Li…Si distances of 2.43 Å. Consequently, the activation barrier was low for this diffusion path.
On the other hand, the pentagonal Si5 face had a much smaller radius of 2.01 Å. This is too small
to allow the Li to penetrate through without severely distorting or even destroying the ring
structure. As will be indicated below, forced “squeezing” of the Li through the Si5 center would
result in a very high barrier of 2.08 eV.
To further explore the Si-Si bond breaking mechanism, the role of the participating SiASiB bond was scrutinized. For example, consider a delithiated Ba6Si136 structure where the SiASiB bond length of ~2.405 Å is longer than the other Si-Si bond (2.36-2.37 Å) in the same
pentagon. A longer Si-Si bond length is an indication of a weaker bond. Therefore, this specific
SiA-SiB bond should be easier to break. When Li moves towards the pentagonal face, instead of
penetrating through the center (which is highly repulsive due to its small opening) directly, the
system gains stability from sacrificing a weak Si-Si bond to form two transient Li-Si bonds. This
mechanism is akin to that reported for Li-assisted Si-Si bond breaking in bulk Si [164]. Full
geometry optimization of the configuration at the transition state showed that the broken SiA-SiB
114
115
bond “heals” itself when the Li migrated further into the 51264 cage, similar to what was found
along the NEB reaction. The ability to reform the broken SiA-SiB bond in the Li diffusion process
retains the integrity of the host structure in the lithiation and delithiation processes. In another
word, the Li intercalation process is reversible in Si clathrates.
As discussed above, if the SiA-SiB bond break is the result of a weak Si-Si bond from the
pentagonal face in Ba6Si136, then what is the reason that the particular SiA-SiB bond is weaker
than the rest in the same pentagon ring? Even in the empty Si136 clathrate, the corresponding
SiA-SiB bond length was found to be longer than the others at, 2.395 Å versus 2.35-2.37 Å. It
was found that the SiA-SiB bond length did not change unless the two 51264 cages connected by
the SiA-SiB bond were both filled with Ba. In this case, the SiA-SiB bond was lengthened to 2.405
Å. In another word, if one of the two adjacent 51264 cages is occupied by Ba, the effect on the
SiA-SiB bond length is very small. To test this hypothesis, the diffusion process for a system with
only one neighbour Ba occupancy was investigated. It was found through NEB calculations that
instead of breaking the SiA-SiB bond, the Li “squeezes” through the center of the pentagon. At
the transition state, the Si5 ring was severely distorted and all Si-Si bonds were stretched
outwards. The elongated Si-Si bonds had lengths in the range of 2.48-2.80 Å with an average LiSi distance of 2.21 Å. The significant distortion of the pentagon leads to a very high energy
barrier of 2.08 eV. A similar scenario was also found for the Li diffusion between two small
cages (i.e., 512 512). These results indicate that when Li is confined in the small 512 cage of Si
clathrate, it has a very low probability of diffusing out of the cage if at least one of the two 51264
cages connected by the SiA-SiB bond from the pentagonal face are empty. In contrast, when those
two 51264 cages are occupied by Ba, the Li is able to diffuse via the pentagon interface by
breaking the weaker SiA-SiB bond with a much reduced energy barrier of 0.85 eV. Therefore, the
115
116
Li diffusion mechanism through the pentagonal face is unique. It is dependent on the occupancy
of the adjacent large cages by Ba. Under favourable conditions, the SiA-SiB bond connected by
the two large cages can be broken and then reformed during the Li migration. It could be that
breaking the SiA-SiB bond is easier when the two adjacent 51264 cages are occupied because of
transferred valence electrons from the Ba atoms into the Si clathrate framework. These “extra”
electrons occupy the empty anti-bonding Si-Si levels in the conduction band and weaken the
specific Si-Si bond.
Storage Capacity
Since only one Li atom can be inserted into each small cage, a maximum of 16 Li atoms
can be stored in Ba8Si136 clathrate. The calculated theoretical discharge capacity of Li16Ba8Si136
clathrate was 85 mAh/g, which is much smaller than the reversible value of 320 mAh/g of the
current LiC6 anode. However, as the results presented above show, it is not necessary to
completely fill the large cages with Ba to stabilize the Si136 framework. For example, in Ba6Si134
there are two large, vacant cavities where additional Li atoms would be inserted. Moreover, due
to the size of the 51264 cage, it may even accommodate more than one Li atom. Theoretical
calculations showed that the 51264 cage could, in principle, accommodate up to three Li atoms
without significantly affecting the crystal structure and volume. The hypothetical Li16+3×2Ba6Si136
clathrate can achieve a maximum capacity of 123 mAh/g. This value can be compared with the
capacity of 140 mAh/g for LiCoO2 [165] and 170 mAh/g for LiFePO4 [116] cathodes. Although
the theoretical capacity for Li16+3×2Ba6Si136 clathrate is still lower than the graphite, it matches
well with these cathode materials and therefore may be suitable as an anode. On the other hand,
when compared with the extremely high theoretical capacity (~4200 mAh/g) of Si anode, a lower
116
117
Li storage capacity in Si clathrates is not surprising. The lithiation process in Si clathrates is
based on an intercalation mechanism, which is not the same as the alloying one as found in the Si
anode where the crystal structure has completely changed.
4.2.4 Conclusions
A systematic and comprehensive investigation using first-principles calculations on the
structural stability, electronic properties, Li intercalation voltages, Li ion diffusion mechanisms
and theoretical capacities of thermodynamically stable lithiated Ba8Si136/Ba6Si136 clathrates was
performed. The Ba-doped clathrates were found to possess very high structural rigidity, almost
insensitive to the intercalated Li content. This property is far superior to the currently used anode
materials in LIBs and ensures structural integrity for repeated charge and discharge processes.
The lithiated clathrates are metallic and therefore expected to have good electrical conductivity.
The average intercalation voltage was found to be roughly constant at ~0.4 V relative to Li metal.
The low and nearly constant voltage is a good feature of an anode for the design of high cell
voltage and long life-time LIBs. The most chemically interesting observation was the Li
diffusion mechanisms. The barrier through the hexagonal face was 0.33 eV, which is much lower
than that through the pentagonal face of ~0.85 eV. Surprisingly, the energy barrier through the
pentagonal face was found to depend on the occupation of the neighbouring large cages
connected by a Si-Si bond from the Si5 face. When the two adjacent large 51264 cages were
occupied by Ba, this Si-Si bond was broken upon lithiation, which lowered the “diffusion”
barrier from 0.85 to 0.73 eV. If at least one of the above mentioned two large cages was empty,
the pentagon face would be distorted and expanded extensively in order to accommodate the
117
118
migrating Li, resulting in a substantially higher migration energy barrier of 2.08 eV. In summary,
the structural rigidity, low and flat voltage, metallic property and reasonable Li transport barriers
of Ba-doped Si136 clathrates offers the possibility of potential applications as anode materials for
LIBs. On the other hand, the theoretical capacities for the lithiated Ba8Si136/Ba6Si136 clathrates
studied here are relatively low but still comparable with the current favourable cathode materials.
Previously, single crystalline nanostructures of clathrate-II phase of NaxSi136 have been
successfully synthesized [166]. In order to fulfill the useful Li storage capacity of Si136 clathrate
as an anode, we suggest synthesizing the stable crystalline Ba6Si136 first. The crystalline
nanoparticles of Ba6Si136 may then be pressed into a pellet and used as the anode in LIB. Finally,
it is noteworthy that there is another class of metal doped Si-clathrate with a channel framework
(e.g., BaSi6 [167]) that can also be explored as potential anode materials, as the shared
polyhedral face along the channel is expected to have a larger opening size than a regular
pentagonal face. This, in turn, might lead to faster Li transport.
4.3 Solid Electrolyte: Li3PS4
4.3.1 Introduction
Currently, most lithium-ion batteries use organic liquids as an electrolyte. This choice has
imposed a limit for achieving high energy density as it poses significant safety problems (e.g.,
explosion and fire). For example, liquid electrolytes are expected to react with a graphite anode.
On the other hand, lithium metal has the highest gravimetric energy density of all anode
materials; however, it cannot be used as an anode in conjunction with a liquid electrolyte due to
118
119
the electrochemical reaction with the organics. The formed solid-electrolyte-interface (SEI) layer
can significantly decrease battery performance and create severe safety problems. Several recent
articles suggest that replacing organic liquids with solid-state electrolytes will provide high
energy density cells and may eliminate some of the potential hazards [7]. Solid electrolytes such
as superionic Li conductors are expected to be more stable and safer. A major limitation in the
application of the current solid electrolytes is that the ionic conductivities are generally too low
to meet LIB requirements. Therefore, the search for new solid Li electrolyte materials is an
active research area.
The prospect of the design of LIB batteries with solid electrolytes was encouraged by the
discovery of crystalline Li10GeP2S12 [168], synthesized by partially substituting the P with Ge in
Li3PS4. This has a room-temperature ionic conductivity comparable to that of liquid electrolytes
[168]. A more recent study [169] reported nanoporous Li3PS4 and also showed significant
technological promise with ionic conductivity improved by several orders of magnitude as
compared to the crystalline forms [170, 171].
Bulk Li3PS4 exists in the γ-phase (SG: Pmn21) at room temperature. It transforms to the
β-Li3PS4 phase (SG: Pnma) when heated to 195 oC [171]. The ionic conductivity of γ-Li3PS4 was
measured to be 3 107 S cm-1 at room temperature. The ionic conductivity increased abruptly
when it transformed into the β-Li3PS4 form [170, 171]. A conductivity of 8.93 10 7 S cm-1 was
found when the conductivity of β-Li3PS4 from the Arrhenius plot (see Figure 1 in [169]) was
extrapolated to room temperature. This value is much higher than that of the room temperature γphase. Synthetic nanoporous Li3PS4 has a conductivity nearly three orders of magnitude higher
than the crystalline forms reported [169]. High Li conductivity in solid electrolytes is often
attributed to fast diffusion (i.e., superionic conductivity) of Li ions in its structural framework. A
119
120
recent theoretical study [172] analyzed Li mobility in both γ- and β-Li3PS4 phases with the NEB
method [51, 52] and it was found that there were multiple energy valleys for Li ions. The
calculated activation barriers were very low, less than 0.3 eV. However, no details on the
transport mechanism were studied. The NEB method is a series of static calculations depending
on a priori assumed initial and final geometry. Alternatively, finite temperature molecular
dynamics is an effective tool for the exploration of potential energy surface. As demonstrated in
the study of LiFePO4 (vide infra), FPMD has been successful in identifying a non-intuitive
antisite diffusion pathway of Li ions [173]. In this work, the same simulation method was used to
investigate the diffusion processes in the two crystalline phases (β- and γ-Li3PS4) and the
nanoporous cluster.
4.3.2 Computational details
All calculations were performed using the GGA-approximation with the PBE functional
[40] implemented in the VASP [60, 61]. PAW potentials [65] were used in conjunction with a
plane-wave basis set with an cutoff energy of 280 eV to describe the electronic wave functions.
The structures of γ- and β- crystalline phases were optimized within the conventional cells. The
electronic structures were calculated from the optimized structures. The Brillouin zone was
sampled with a k-mesh of 5 6 6 and 3 5 6 for the γ- and β-Li3PS4, respectively. For the
DOS calculations, denser k-meshes of 10 12 13 and 6 10 12 were used. Model supercells
containing 16 Li3PS4 and 128 atoms were used for the γ- and β-phases in MD calculations. For
both crystalline phases, experimental lattice constants were appropriated for the chosen
simulation temperatures [71] used.
120
121
Bulk γ-Li3PS4 has an ordered structure where all the atomic sites are fully occupied. The
structure of β-Li3PS4 is more complicated, since some of the Li sites are partially occupied. The
occupancies of the 4b and 4c Wyckoff sites are 0.7, and 0.3, respectively [171]. In this study, one
random configuration with the correct stoichiometry was chosen as the initial structure for βLi3PS4. To mimic the nanoporous β-Li3PS4, a cluster model with a diameter of ca. 9 Å was
carved out from the crystalline structure of β-Li3PS4. The number of Li atoms on the surface was
adjusted to ensure that the cluster contains the correct chemical formula of Li3PS4. In total, the
cluster contained 160 atoms composed of 20 Li3PS4 units. The cluster was put in a cubic box
with a cell size of 30 Å. A vacuum layer ca. 20 Å thick was used to prevent the interaction of the
cluster with its periodic images. Due to the large supercell and the insulating nature of the
system, only one k-point of 111 was used. A timestep of 1 fs was used in the integration of the
equations of motion. The model systems were first thermally equilibrated in the NVE ensemble
for about 4 ps. This is followed by a NVT MD production run for additional 24-150 ps. The
temperature was controlled by the Nose-Hoover thermostat [80].
The optimized lattice constants for the low-temperature phase γ-Li3PS4 in the
orthorhombic cell (SG: Pmn21) were a 7.771 , b 6.623 and c 6.221 Å. These are
comparable to the experimental results at 297 K of a 7.708 , b 6.535 and c 6.136 Å [171].
The volume deviation was only 3.6%. For the high temperature β-Li3PS4 phase (SG: Pnma), the
optimized lattice constants of a 12.966 , b 8.115 and c 6.195 Å are in good agreement
with the observed values at 673 K of a 12.819 , b 8.219 and c 6.124 Å [171] with a
volume deviation of 1.0%.
121
122
4.3.3 Results and discussions
Electrochemical window
The electrochemical window of crystalline Li3PS4 was estimated using the approach
outlined in a previous paper [174]. Briefly, this approach involved calculating the DOS of Li3PS4
to determine the band gap between the lowest unoccupied molecular orbital (LUMO) and the
highest occupied molecular orbital (HOMO) energies. The DOS calculated at the respective
optimized geometries of both crystalline phases is plotted in Figure 4. 12. We found that the
band gaps Eg for both crystals were similar at 2.2 eV, but these values were lower than the
estimated energy gap (>5 eV) from an electrochemical measurement [169]. These results are to
be expected as it is well known that GGA functionals always underestimate the calculated energy
gap. As discussed by Mo and colleagues [175], another possibility for the discrepancy may be
that the experimentally reported Li3PS4 electrolyte might not be entirely from intrinsic material
but rather affected by passivation.
DOS
30
Li3PS4
20
10
DOS
0
30
Li3PS4
20
10
0
-8
-6
-4
-2
0
2
Energy (eV)
Figure 4. 12 Calculated DOS of optimized β- and γ-Li3PS4 crystals.
122
4
123
Li diffusion in crystals
The diffusion of Li ions in the two crystalline structures were examined with FPMD. The
systems were overheated slightly to accelerate their dynamical processes [173, 175]. Figure 4. 13
shows the trajectories of Li ions as well as those of P and S atoms in crystalline γ-Li3PS4 at 500
and 800 K. At 500 K, displacements of the atoms are generally confined to vibrations around
their regular crystal lattice sites, with occasional events on the migration of Li atoms. When the
temperature was raised to 800 K, the PS4 tetrahedrons continued to liberate about their
equilibrium positions although the amplitudes were fairly large. In contrast, the Li atoms became
diffusive. This is indicative of sub-lattice melting of the Li ions in the γ-Li3PS4, resulting in a
superionic state.
Figure 4. 13 Trajectories for Li ions in perfect crystal γ-Li3PS4 at (a) 500 K and (b) 800
K. The red, brown, and yellow colour dots correspond to the superposition of the Li, P,
and S atomic positions along the simulation 50-90ps, respectively.
A similar MD calculation was performed on β-Li3PS4. Specifically, we wished to
examine if the presence of intrinsic Li defects would enhance the migration process. In
comparison to γ-Li3PS4, even at 500 K Li ions were found to diffuse in the β-Li3PS4 crystal
123
124
lattice. The Li ion motions were not continuous. The ions spent most of their time vibrating
around the crystal lattice sites. Occasionally there was a jump from an occupied to an unoccupied
site. For clarity, Figure 4. 14 displays the trajectory of only a single, randomly chosen Li ion in
the β-Li3PS4 crystal within a time segment of 85 ps. The hopping mechanism is clearly
identifiable. When the temperature was raised to 800 K, the hopping mechanism became more
frequent with the distribution of Li and was more diffusive along the interstitial channels. The
Li+ ion trajectory is now quite similar to that of the -phase shown in Figure 4. 13(b).
Figure 4. 14 The trajectory of a particular Li atom (rose colour dots) in the β-Li3PS4
crystal within a simulation of 85 ps at 500 K. PS4 framework is shown by sticks, and
purple dots are the initial positions for all Li atoms.
It is convenient to quantify the Li motion from the calculation of the atomic mean square
displacement (MSD):
r(t )
2
1 N
2
ri (t t0 ) ri (t0 ) .
N i 1
The average in Eq. (4.3) is over all Li atoms, where
(4.3)
ri (t ) is the displacement of the i-th Li atom
at time t and N is the total number of Li atoms taken into account. For a normal Brownian
124
125
diffusion, the MSD plot has a linear behaviour with time and the slope is proportional to the
diffusion coefficient (D).
Figure 4. 15 shows the time dependence of calculated MSD for γ- and β-phases of Li3PS4
at different temperatures. A linear behaviour was observed in both phases. In γ- Li3PS4 (Figure 4.
15(a)), the slope of the MSD is almost zero, showing the Li does not diffuse at 500 K. The
diffusion rate, however, increased rapidly at 800 K. In comparison, as shown in Figure 4. 15(b),
at 500 K Li the β-Li3PS4 has already started diffusing, although the rate is slow. At 800 K the
diffusion rate for both crystalline phases was comparable.
Figure 4. 15 The MSD as a function of time t for (a) γ- and (b) β-phases of Li3PS4 at
different simulation temperatures.
As explained in Chapter 2, the diffusion rate D can be calculated from either the slope of
the MSD according to Eq.(2.36) or from the velocity autocorrelation function using Eq.(2.33). At
infinite time, results from both methods should be identical. Using Eq.(2.33) at 800 K, the
diffusion coefficient of γ-Li3PS4 was calculated to be 3.45 10 5 cm2/s. This value is typical of
superionic conductors. For β-Li3PS4 at 50 K the calculated D was quite low ( 0.13 10 5 cm2/s).
The diffusion rate increased 30 times at 800 K to 3.55 10 5 cm2/s and was slightly higher than
125
126
the γ-phase. At present, there is no experimental data for the self-diffusion constant of Li in
Li3PS4. However, the diffusion rate can be estimated from ionic conductivity measurements. To
make a direct comparison, we used the Nernst-Einstein relationship [176]
n( ze)2 D / kBT
(4.4)
to link the conductivity σ to the diffusion coefficient D. In Eq.(4.4), n represents ionic
concentration (i.e., the number of ions per unit volume), z represents the valence of the charge
carrier (in this case z 1), e represents the elementary charge of an electron,
kB represents the
Boltzmann constant and T represents temperature. Using Eq.(4.4), the calculated bulk
conductivities for γ- and β-Li3PS4 at 800 K were 1.39 and 1.51 S/cm, respectively. The
experimental values extrapolated to 800 K were 0.025 and 0.068 S/cm, respectively [169]. The
theoretical results are larger than the experimental values by one order of magnitude,, but the
general trend (i.e., that the diffusion rate in the β-phase is faster than in the γ-phase) is consistent
with the experimental observations [169]. Equation (4.4) is applicable to a special case of single
ions and random jumps in the system. In the above discussion, we have shown that the Li
transport in Li3PS4 is through a series of hops and is a collaborative process. Therefore, the
motions of the Li ions are correlated. In this case, the estimated conductivity from Eq.(4.4) will
be an upper limit. The calculated value should be weighed by a correlation factor (< 1) governing
the probability for Li site-to-site hopping which is expected to be higher in the -phase, due to
the intrinsic Li vacant sites, than the pristine -phase.
Li diffusion in nanoporous Li3PS4
Nanoporous Li3PS4 synthesized from β-Li3PS4 has been reported recently to have a much
higher ionic conductivity than the parent crystalline forms [169]. This suggestion was examined
126
127
through a MD simulation on the cluster model. Since FPMD simulation on a cluster model using
periodic boundary conditions is very costly, simulation was performed only at 500 K for 24 ps.
Due to different chemical environments, the dynamics of the Li atoms inside the cluster (core)
and on the surface were very different. The calculated diffusion coefficients D for the core and
surface Li were 1.37 105 and 3.32 10 5 cm2/s, respectively. As expected, the surface atoms
diffused much faster than the interior atoms. Therefore, a large surface area in the nanoparticle
can greatly promote Li transport ability [169, 177]. It is noteworthy that the diffusion rate of the
cluster surface at 500 K was much faster than in bulk - and -phases at the same temperature.
Detailed analysis of the atom trajectories showed an exchange of surface and interior Li
ions. Figure 4. 16 depicts a concerted Li migration pathway within a time slice of 7 ps. Two sites
on or near the surface are labelled A and B. Sites C, D and E are situated in the interior of the
cluster. Initially, all sites were occupied by a Li ion (denoted as Li 4@D, 3@C, 2@B and 1@A)
and the surface site E was vacant. The ions oscillated within their atomic site and then at some
instant Li 4@D jumped into the empty E surface site. Concomitantly, the other Li atoms hopped
consecutively, from Li 3@C →@E, Li 2@B →@C, Li 1@A →@B and a concerted diffusion
process occurred. This event showed that surface Li ions (e.g., Li 1) can migrate into the interior
and vice versa (e.g., Li 4). This type of Li transport process, however, was rare within the time
scale of the simulation. Therefore, experimentally measured Li ionic conductivity was mainly
due to surface diffusion.
127
128
Figure 4. 16 The route for a selected concerted diffusion process in the cluster model of
β-Li3PS4 within a simulation of 7ps, involving five crystal sites indicated by A, B, C,
and D, and four Li atoms represented by 1, 2, 3, and 4 which are coloured differently.
Arrows indicates the diffusion directions for the Li atoms.
4.3.4 Conclusions
First-principles calculations have been performed to investigate the diffusion processes in
crystalline and nanoporous Li3PS4. The calculated band gap was smaller than that estimated in an
128
129
electrochemical experiment. This may suggest that the stability of the electrochemical process
might not originate from the pure electrolyte but may involve other possible factors. The
calculated Li ionic conductivities for all three models of γ-, β-Li3PS4 and nanoporous systems
were higher than the measured values, yet the calculated trends are consistent with previous
experiments. The theoretical results showed that Li3PS4 crystalline polymorphs and nanoclusters
are indeed good superionic conductors and suitable for solid electrolytes. The faster ionic
conductivity in the -phase was due to the presence of intrinsic Li site defects. The mobility of
Li ions was much higher in the nanocluster due to available defect sites and large surface area.
Although the experimental trends were reproduced, the calculated ionic conductivities were
higher than the observed values. In future work, convergence of the diffusion coefficient with
respect to the system size of the model system needs to be verified.
Table 4. 5 Summary of the MD simulations on three different Li3PS4 phases at given
temperatures.Simulation length, diffusion coefficient from velocity autocorrelation
function (D_Cvv), calculated conductivity (σ_cal) as well as the extrapolated
experimental conductivity are listed.
Model
Temperature
(K)
D_Cvv
(×10-5
cm2/s)
σ_cal
(S/cm)
γ-Li3PS4
500
-
-
γ-Li3PS4
800
3.449
1.48
β-Li3PS4
300
-
-
β-Li3PS4
500
0.694
0.47
β-Li3PS4
800
4.028
1.71
bulk
2.009
1.37
surface
4.855
3.32
Cluster
500
129
σ_exp
(S/cm)
Simulation
length (ps)
50
0.02
149
100
0.0015
150
110
0.05
24
130
CHAPTER 5
SUMMARY AND PERSPECTIVES
In Chapter 1, the need for applying first-principles calculations to understand the
structural and dynamical properties of condensed matter in general and the atomic dynamics in
particular was explained. In Chapter 2, the methodology used throughout the thesis work was
introduced. In Chapters 3 and 4, those methods were applied to two clearly different subjects: the
atomic dynamics in liquid gallium and in solid hydrogen under pressure, as well as Li transports
in the cathode, anode, and solid electrolyte materials of Lithium-ion batteries (LIBs). The work
presented in this thesis has helped to address key issues in these systems. However, there are
still ample opportunities for future work. In this chapter, the major results and contributions are
briefly summarized and perspectives for future work are presented.
5.1 Summary
One objective of the research was to characterize the structure and atomic dynamics for
materials under compression by applying first-principles molecular dynamics (FPMD) methods.
Two systems, liquid (l-) Ga and solid hydrogen, were studied in Chapter 3. Neutron and x-ray
scattering experiments on l-Ga found a shoulder on the high-q side of the first peak of the static
structure factor S(q). This feature is unusual for a simple liquid and consequently has stimulated
debates about its origin. Our calculations successfully reproduced the features found in the
130
131
measured S(q). Furthermore, there is no evidence of substantial structural changes observed
within the pressure range studied. We found short-lived instantaneous Ga-Ga contacts and no
characteristic Ga2 dimer vibrational mode in the calculated VDOS spectra. In fact, because of the
close proximity to the melting point, both the electronic and local structures of the liquid are
similar to those of the underlying high pressure crystalline Ga-II and/or Ga-III.
The newly proposed insulating phase-IV of solid hydrogen above 250 GPa at room
temperature was investigated through FPMD simulations. In agreement with the predicted static
structures, phase-IV was found to consist of alternating Br2-like molecular layers and “atomic”
graphene-like layers. However, MD simulations have provided surprising insight into the
dynamical structure. Phase-IV was revealed to be a partially-disordered structure with
orientationally disordered H2 in the Br2-like layers. In comparison, the graphene-like layers were
found to have an ordered lattice but there were fast H transfers between the lattice sites, leading
to “pseudo”-rotations of the hexagon rings. More strikingly, even at a pressure of 300 GPa, the
structures of the two distinct layers were found to exchange concomitantly and continually.
However, at any instant the structure still possesses two distinct layers as in the static Pc
structure. This fluxional structural behaviour under extreme pressure is unprecedented. Finally, a
metallic, but still molecular, Cmca-4 phase appeared when phase-IV was compressed to 370
GPa.
LIBs are important power sources for electrical vehicles and portable electronics.
However, the current performance of LIBs is not sufficient to meet increasing demands.
Consequently, a search for new electrode and electrolyte materials with better performance
assumes great importance. These materials must be low-cost, safe at high operating voltages, and
have high energy capacity and fast rechargeable rates. An objective of the thesis research was to
131
132
investigate the Li transport mechanisms at the atomic level in order to develop materials with
better charge/discharge rates. In Chapter 4, the mechanism of Li transport in three sample
components − cathode, anode, and electrolyte − of a LIB were studied.
LiFePO4 is currently touted as the best cathode material. Our FPMD calculations have
revealed two Li transport mechanisms. Apart from the accepted 1D diffusion through the Li
channels of the structure, a second but less intuitive multistep Li migration through the formation
of Li-Fe antisites was found. These results lend support to the 2D dimensionality model of Li
diffusion based on Li conductivity measurements [113] wherein the presence of Li-Fe antisites
as intrinsic defects in the sample can contribute to the Li transport process.
We studied the possibility of using type-II Si-clathrates as anode material. The
calculations show that clathrates exhibit various desirable properties as an anode (e.g., structural
rigidity and a low and almost constant voltage upon lithiation). Most significantly, we revealed a
complex sequence of events involved in the migration of Li ions through cavities of the
clathrates. In the end, the calculated theoretical energy capacity was not found to be competitive
for practical applications.
To understand the fast ionic conductivity behaviour in the recently reported Li3PS4
systems, the Li self-diffusion processes in two crystalline phases and one nanoporous form were
studied using FPMD. The calculated Li ionic conductivities for all three models of γ-, β-Li3PS4,
and nanoporous systems have the same trend as that found in available experiments. The
theoretical results show that Li3PS4 crystalline polymorphs and nanoclusters are indeed good
superionic conductors and are suitable for solid electrolytes. The relatively faster ionic
conductivity in the -phase is caused by the presence of intrinsic Li site defects. Both the defect
132
133
sites and the large surface area in the nanocluster contribute to the high mobility of Li ions in the
nanocluster.
5.2 Perspectives
The results obtained in Chapter 3 demonstrate the advantages of FPMD simulations for
the investigation of the dynamical behaviour of condensed matters. However, DFT-based firstprinciples methods have several drawbacks evident when dealing with hydrogen systems. A
well-known shortcoming of the current density functionals (e.g., PBE) is an underestimation of
the electronic band gap. One of the more serious problems with the Kohn-Sham equation is the
separation of the Coulomb repulsion and the exchange interaction. This situation is known as
self-energy correction, and it manifests more prominently in a one-electron system such as
hydrogen. Such a deficiency may affect both the predicted relative stabilities of the different
phases as well as the transition pressures [178]. In addition, the nuclear motions are neglected in
the Born-Oppenheimer approximation; this is especially important in hydrogen due to the light
mass of the proton. The quantum behaviour of hydrogen at the limit of very high pressure
remains an open question [18]. For example, the fast H transfers in the graphene-like layers of
phase-IV might be closely related to large atomic tunneling quantum effects. In future simulation
research, it will be important to extend the investigation of solid hydrogen while incorporating
the quantum effect. Since the proton zero-point energy (ZPE) in pressurized solid hydrogen is
comparable to the binding energy and the relative energy differences between various candidate
structures [178], a better estimate of ZPE is needed. Often the treatment of ZPE is accomplished
by adding the vibrational entropy corrections to the ground-state DFT results; however, it is not
133
134
sufficient for hydrogen systems. Both electrons and ions should be treated with rigorous quantum
mechanics. That goal can be achieved by quantum Monte Carlo (QMC) calculations [179, 180]
or by path-integral methods [181-184]. Within the path-integral MD (PIMD), the ionic quantum
problem at a finite temperature is mapped onto a classical problem where each ion is represented
by a polymer ring of fictitious particles. This PIMD technique has been used recently by Li et al.
[185] to explore the classical and quantum ordering of protons in cold, high-pressure solid
hydrogen. This approach was also applied in the study of low temperature, metallic liquid
hydrogen at extremely high pressures [186]. The quantum motions of the protons were found to
critical for determining melting temperatures. It was illustrated that the quantum simulations
predicted the melting point of a pressurized solid hydrogen nearly 100 K lower than that
obtained from the classical simulations. PIMD, however, is very computationally demanding and
further development of an efficient and accurate way for numerical simulation such as reported
in [7] is needed.
In a realistic battery device, the transport of Li ions during charge and discharge will be
influenced by the bias voltage. The nanoscale mapping of ion diffusion under an electric field in
the electrode of LIBs has been studied recently [9]. The characterization of the behaviour of
electrically-driven Li-ion motions in LIB materials is critically important and relevant to the
understanding of the Li ion transport mechanism during battery operations. In the present study,
only the self-diffusion of Li was considered. Further studies should take into account the bias
voltage. In principle, a theoretical model including an external electrical field represented by a
sawtooth potential [187] in a supercell with periodic boundary conditions can be employed. In
such circumstances, the dynamics of the Li ions can then be studied under the bias with existing
software such as Quantum-ESPRESSO [62].
134
135
REFERENCES
1.
2.
3.
4.
5.
6.
7.
8.
9.
10.
11.
12.
13.
14.
15.
16.
17.
18.
19.
20.
David, L.P., S. Marie-Louise, and F.J. Bermejo, Dynamical aspects of disorder in
condensed matter. Reports on Progress in Physics, 2003. 66(4): p. 407.
Waseda, Y., The Structure of Non-Crystalline Materials. 1980, New York: McGraw-Hill.
Sherwood, J.N., The Plastically Crystalline State, 1979: New York: Wiley.
Nield, V.M. and D.A. Keen, Diffusion Neutron Scattering from Crystalline Materials.
Vol. Chapter 9. 2001, Oxford, UK: Oxford Science Publications.
McMahon, J.M., et al., The properties of hydrogen and helium under extreme conditions.
Reviews of Modern Physics, 2012. 84(4): p. 1607-1653.
Schoen, D.T., C. Xie, and Y. Cui, Electrical Switching and Phase Transformation in
Silver Selenide Nanowires. Journal of the American Chemical Society, 2007. 129(14): p.
4116-4117.
Stephen, H., Superionics: crystal structures and conduction processes. Reports on
Progress in Physics, 2004. 67(7): p. 1233.
Yoshinori, K. and T. Kazuhiko, X-ray structural studies on elemental liquids under high
pressures. Journal of Physics: Condensed Matter, 2003. 15(36): p. 6085.
Kazuhiko, T., et al., Pressure dependence of the structure of liquid group 14 elements.
Journal of Physics: Condensed Matter, 2004. 16(14): p. S989.
Bellissent-Funel, M.C., et al., Structure factor and effective two-body potential for liquid
gallium. Physical Review A, 1989. 39(12): p. 6310-6318.
Narten, A.H., Liquid Gallium: Comparison of X-Ray and Neutron-Diffraction Data. The
Journal of Chemical Physics, 1972. 56(3): p. 1185.
Di Cicco, A. and A. Filipponi, Three-body distribution function in liquids: the case of
liquid gallium. Journal of Non-Crystalline Solids, 1993. 156–158, Part 1(0): p. 102-106.
Inui, M., S.i. Takeda, and T. Uechi, Ultrasonic Velocity and Density Measurement of
Liquid Bi-Ga Alloys with Miscibility Gap Region. Journal of the Physical Society of
Japan. 61(9): p. 3203.
Bermejo, F.J., et al., Microscopic dynamics of liquid gallium. Physical Review E, 1994.
49(4): p. 3133-3142.
Poloni, R., et al., Liquid gallium in confined droplets under high-temperature and highpressure conditions. Physical Review B, 2005. 71(18): p. 184111.
Comez, L., et al., High-pressure and high-temperature x-ray absorption study of liquid
and solid gallium. Physical Review B, 2001. 65(1): p. 014114.
Edwards, B., N.W. Ashcroft, and T. Lenosky, Layering transitions and the structure of
dense hydrogen. EPL (Europhysics Letters), 1996. 34(7): p. 519.
Goncharov, A.F., R.T. Howie, and E. Gregoryanz, Hydrogen at extreme pressures
(Review Article). Low Temperature Physics, 2013. 39(5): p. 402-408.
Hazen, R.M., et al., Single-crystal x-ray diffraction of n-H2 at high pressure. Physical
Review B, 1987. 36(7): p. 3944-3947.
Mao, H.-K. and R.J. Hemley, Ultrahigh-pressure transitions in solid hydrogen. Reviews
of Modern Physics, 1994. 66(2): p. 671-692.
135
136
21.
22.
23.
24.
25.
26.
27.
28.
29.
30.
31.
32.
33.
34.
35.
36.
37.
38.
39.
40.
41.
42.
Akahama, Y., et al., Evidence from x-ray diffraction of orientational ordering in phase III
of solid hydrogen at pressures up to 183 GPa. Physical Review B, 2010. 82(6): p.
060101.
Hemley, R.J. and H.K. Mao, Phase Transition in Solid Molecular Hydrogen at Ultrahigh
Pressures. Physical Review Letters, 1988. 61(7): p. 857-860.
Pickard, C.J. and R.J. Needs, Structure of phase III of solid hydrogen. Nat Phys, 2007.
3(7): p. 473-476.
Eremets, M.I. and I.A. Troyan, Conductive dense hydrogen. Nat Mater, 2011. 10(12): p.
927-931.
Howie, R.T., et al., Mixed Molecular and Atomic Phase of Dense Hydrogen. Physical
Review Letters, 2012. 108(12): p. 125501.
Wigner, E. and H.B. Huntington, On the Possibility of a Metallic Modification of
Hydrogen. The Journal of Chemical Physics, 1935. 3(12): p. 764-770.
McMahon, J.M. and D.M. Ceperley, High-temperature superconductivity in atomic
metallic hydrogen. Physical Review B, 2011. 84(14): p. 144515.
Liu, H., et al., Room-temperature structures of solid hydrogen at high pressures. The
Journal of Chemical Physics, 2012. 137(7): p. 074501-7.
Goodenough, J.B. and Y. Kim, Challenges for Rechargeable Li Batteries†. Chemistry of
Materials, 2009. 22(3): p. 587-603.
Spontnitz, R., Lithium-ion Batteries: The Basics. CEP, 2013. October: p. 39-43.
Kraytsberg, A. and Y. Ein-Eli, Higher, Stronger, Better…︁ A Review of 5 Volt Cathode
Materials for Advanced Lithium-Ion Batteries. Advanced Energy Materials, 2012. 2(8):
p. 922-939.
Born, M. and R. Oppenheimer, Ann. Phys. (NY), 1927. 84.
Slater, J.C., The Theory of Complex Spectra. Physical Review, 1929. 34(10): p. 12931322.
Hohenberg, P. and W. Kohn, Inhomogeneous Electron Gas. Physical Review, 1964.
136(3B): p. B864-B871.
Kohn, W. and L.J. Sham, Self-Consistent Equations Including Exchange and Correlation
Effects. Physical Review, 1965. 140(4A): p. A1133-A1138.
Ceperley, D.M. and B.J. Alder, Ground State of the Electron Gas by a Stochastic
Method. Physical Review Letters, 1980. 45(7): p. 566-569.
Becke, A.D., Density-functional exchange-energy approximation with correct asymptotic
behavior. Physical Review A, 1988. 38(6): p. 3098-3100.
Lee, C., W. Yang, and R.G. Parr, Development of the Colle-Salvetti correlation-energy
formula into a functional of the electron density. Physical Review B, 1988. 37(2): p. 785789.
Perdew, J.P., et al., Atoms, molecules, solids, and surfaces: Applications of the
generalized gradient approximation for exchange and correlation. Physical Review B,
1992. 46(11): p. 6671-6687.
Perdew, J.P., K. Burke, and M. Ernzerhof, Generalized Gradient Approximation Made
Simple. Physical Review Letters, 1996. 77(18): p. 3865-3868.
Slater, J.C., Quamtum Theory of Molecules and Solids. Vol. 4. 1974, New York:
McGraw-Hill.
Anisimov, V.I., J. Zaanen, and O.K. Andersen, Band theory and Mott insulators:
Hubbard U instead of Stoner I. Physical Review B, 1991. 44(3): p. 943-954.
136
137
43.
44.
45.
46.
47.
48.
49.
50.
51.
52.
53.
54.
55.
56.
57.
58.
59.
60.
61.
Cococcioni, M. and S. de Gironcoli, Linear response approach to the calculation of the
effective interaction parameters in the LDA+U method. Physical Review B, 2005. 71(3):
p. 035105.
Zhou, F., et al., First-principles prediction of redox potentials in transition-metal
compounds with LDA+U. Physical Review B, 2004. 70(23): p. 235121.
Wang, L., T. Maxisch, and G. Ceder, Oxidation energies of transition metal oxides within
the GGA+U framework. Physical Review B, 2006. 73(19): p. 195107.
Monkhorst, H.J. and J.D. Pack, Special points for Brillouin-zone integrations. Physical
Review B, 1976. 13(12): p. 5188-5192.
Pickett, W.E., Pseudopotential methods in condensed matter applications. Computer
Physics Reports, 1989. 9(3): p. 115-197.
Pickard, C.J., PhD. Thesis, 1997.
Payne, M.C., et al., Iterative minimization techniques for ab initio total-energy
calculations: molecular dynamics and conjugate gradients. Reviews of Modern Physics,
1992. 64(4): p. 1045-1097.
Meyer, B., The Pseudopotential Plane Wave Approach, in Computational Nanoscience:
Do it yourself!, J. Grotendorst, S. Blugel, and D. Marx, Editors. 2006, NIC Series: John
von Neumann Institute for Computing. p. 71.
Mills, G. and H. Jónsson, Quantum and thermal effects in H2 dissociative adsorption:
Evaluation of free energy barriers in multidimensional quantum systems. Physical
Review Letters, 1994. 72(7): p. 1124-1127.
Mills, G., H. Jónsson, and G.K. Schenter, Reversible work transition state theory:
application to dissociative adsorption of hydrogen. Surface Science, 1995. 324(2–3): p.
305-337.
Henkelman, G. and H. Jónsson, Improved tangent estimate in the nudged elastic band
method for finding minimum energy paths and saddle points. The Journal of Chemical
Physics, 2000. 113(22): p. 9978-9985.
Henkelman, G., B.P. Uberuaga, and H. Jónsson, A climbing image nudged elastic band
method for finding saddle points and minimum energy paths. The Journal of Chemical
Physics, 2000. 113(22): p. 9901-9904.
Feynman, R.P., Forces in Molecules. Physical Review, 1939. 56(4): p. 340-343.
Swope, W.C., et al., A computer simulation method for the calculation of equilibrium
constants for the formation of physical clusters of molecules: Application to small water
clusters. The Journal of Chemical Physics, 1982. 76(1): p. 637-649.
Marzari, N. and D. Vanderbilt, Maximally localized generalized Wannier functions for
composite energy bands. Physical Review B, 1997. 56(20): p. 12847-12865.
Marzari, N., et al., Maximally localized Wannier functions: Theory and applications.
Reviews of Modern Physics, 2012. 84(4): p. 1419-1475.
Thomas, M., et al., Computing vibrational spectra from ab initio molecular dynamics.
Physical Chemistry Chemical Physics, 2013. 15(18): p. 6608-6622.
Kresse, G. and J. Hafner, Ab initio molecular dynamics for liquid metals. Physical
Review B, 1993. 47(1): p. 558-561.
Kresse, G. and D. Joubert, From ultrasoft pseudopotentials to the projector augmentedwave method. Physical Review B, 1999. 59(3): p. 1758-1775.
137
138
62.
63.
64.
65.
66.
67.
68.
69.
70.
71.
72.
73.
74.
75.
76.
77.
78.
79.
80.
81.
82.
83.
Paolo, G., et al., QUANTUM ESPRESSO: a modular and open-source software project
for quantum simulations of materials. Journal of Physics: Condensed Matter, 2009.
21(39): p. 395502.
CP2K, http://www.cp2k.org/.
Van de Walle, C.G. and P.E. Blöchl, First-principles calculations of hyperfine
parameters. Physical Review B, 1993. 47(8): p. 4244-4255.
Blöchl, P.E., Projector augmented-wave method. Physical Review B, 1994. 50(24): p.
17953-17979.
Gong, X.G., et al., α-gallium: A metallic molecular crystal. Physical Review B, 1991.
43(17): p. 14277-14280.
Hafner, J. and W. Jank, Structural and electronic properties of the liquid polyvalent
elements. III. The trivalent elements. Physical Review B, 1990. 42(18): p. 11530-11539.
Tsay, S.-F. and S. Wang, Anomalies in the liquid structure of Ga metal. Physical Review
B, 1994. 50(1): p. 108-112.
Gong, X.G., et al., Coexistence of Monatomic and Diatomic Molecular Fluid Character
in Liquid Gallium. EPL (Europhysics Letters), 1993. 21(4): p. 469.
Tsuji, K., Structure of liquid metals under high pressure. Journal of Non-Crystalline
Solids, 1990. 117–118, Part 1(0): p. 27-34.
Comez, L., et al., EXAFS study on liquid gallium under high pressure and high
temperature. Journal of Synchrotron Radiation, 2001. 8(2): p. 776-778.
Ehm, L., et al., Studies of local and intermediate range structure in crystalline and
amorphous materials at high pressure using high-energy X-rays. Powder Diffraction,
2012. 22(02): p. 108-112.
Holender, J.M., et al., Static, dynamic, and electronic properties of liquid gallium studied
by first-principles simulation. Physical Review B, 1995. 52(2): p. 967-975.
González, L.E. and D.J. González, Structure and dynamics of bulk liquid Ga and the
liquid-vapor interface: An ab initio study. Physical Review B, 2008. 77(6): p. 064202.
Hosokawa, S., et al., Transverse Acoustic Excitations in Liquid Ga. Physical Review
Letters, 2009. 102(10): p. 105502.
Tsai, K.H., T.-M. Wu, and S.-F. Tsay, Revisiting anomalous structures in liquid Ga. The
Journal of Chemical Physics, 2010. 132(3): p. 034502-6.
Tse, J.S., Ab initio molecular dynamics with density functional theory. Annual Review of
Physical Chemistry, 2002. 53(1): p. 249-290.
Furthmüller, J., J. Hafner, and G. Kresse, Dimer reconstruction and electronic surface
states on clean and hydrogenated diamond (100) surfaces. Physical Review B, 1996.
53(11): p. 7334-7351.
Wang, Y. and J.P. Perdew, Correlation hole of the spin-polarized electron gas, with exact
small-wave-vector and high-density scaling. Physical Review B, 1991. 44(24): p. 1329813307.
Nose, S., A unified formulation of the constant temperature molecular dynamics methods.
The Journal of Chemical Physics, 1984. 81(1): p. 511-519.
Hoover, W.G., Canonical dynamics: Equilibrium phase-space distributions. Physical
Review A, 1985. 31(3): p. 1695-1697.
Donohue, J., The Structure of the Elements. 1974, Wiley: New York.
Degtyareva, O., et al., Structural Complexity in Gallium under High Pressure: Relation
to Alkali Elements. Physical Review Letters, 2004. 93(20): p. 205502.
138
139
84.
85.
86.
87.
88.
89.
90.
91.
92.
93.
94.
95.
96.
97.
98.
99.
100.
101.
102.
103.
104.
Bosio, L., Crystal structures of Ga(II) and Ga(III). The Journal of Chemical Physics,
1978. 68(3): p. 1221-1223.
Bove, L.E., et al., Vibrational dynamics of liquid gallium at 320 and 970K. Physical
Review B, 2005. 71(1): p. 014207.
Johnson, B.G., P.M.W. Gill, and J.A. Pople, The performance of a family of density
functional methods. The Journal of Chemical Physics, 1993. 98(7): p. 5612-5626.
Yang, J., J.S. Tse, and T. Iitaka, First-principles studies of liquid lithium under pressure.
J Phys Condens Matter, 2010. 22(9): p. 095503.
Elliott, S.R., Origin of the first sharp diffraction peak in the structure factor of covalent
glasses. Physical Review Letters, 1991. 67(6): p. 711-714.
Spagnolatti, I. and M. Bernasconi, Ab initio phonon dispersion relations of α-Ga. The
European Physical Journal B - Condensed Matter and Complex Systems, 2003. 36(1): p.
87-90.
Ankudinov, A.L., et al., Real-space multiple-scattering calculation and interpretation of
x-ray-absorption near-edge structure. Physical Review B, 1998. 58(12): p. 7565-7576.
Baskes, M.I., S.P. Chen, and F.J. Cherne, Atomistic model of gallium. Physical Review B,
2002. 66(10): p. 104107.
Łużny, W., et al., Inelastic neutron scattering on solid and liquid gallium. physica status
solidi (a), 1989. 116(1): p. K25-K28.
Bosio, L., et al., Phonons in metastable beta gallium: neutron scattering measurements.
Journal of Physics F: Metal Physics, 1981. 11(11): p. 2261.
Ascarelli, P., Atomic Radial Distributions and Ion-Ion Potential in Liquid Gallium.
Physical Review, 1966. 143(1): p. 36-47.
Nield, V.M., R.L. McGreevy, and M.G. Tucker, Changes in the short-range order of
gallium on melting and supercooling. Journal of Physics: Condensed Matter, 1998.
10(15): p. 3293.
Babaev, E., A. Sudbo, and N.W. Ashcroft, A superconductor to superfluid phase
transition in liquid metallic hydrogen. Nature, 2004. 431(7009): p. 666-668.
Lorenzana, H.E., I.F. Silvera, and K.A. Goettel, Orientational phase transitions in
hydrogen at megabar pressures. Physical Review Letters, 1990. 64(16): p. 1939-1942.
Zha, C.-S., Z. Liu, and R.J. Hemley, Synchrotron Infrared Measurements of Dense
Hydrogen to 360 GPa. Physical Review Letters, 2012. 108(14): p. 146402.
Mazin, I.I., et al., Quantum and Classical Orientational Ordering in Solid Hydrogen.
Physical Review Letters, 1997. 78(6): p. 1066-1069.
Pickard, C.J., M. Martinez-Canales, and R.J. Needs, Density functional theory study of
phase IV of solid hydrogen. Physical Review B, 2012. 85(21): p. 214114.
Johnson, K.A. and N.W. Ashcroft, Structure and bandgap closure in dense hydrogen.
Nature, 2000. 403(6770): p. 632-635.
Pickard, C.J., M. Martinez-Canales, and R.J. Needs, Erratum: Density functional theory
study of phase IV of solid hydrogen [Phys. Rev. B 85, 214114 (2012)]. Physical Review
B, 2012. 86(5): p. 059902.
Zijun, Y., General thermal wavelength and its applications. European Journal of Physics,
2000. 21(6): p. 625.
Kitamura, H., et al., Quantum distribution of protons in solid molecular hydrogen at
megabar pressures. Nature, 2000. 404(6775): p. 259-262.
139
140
105.
106.
107.
108.
109.
110.
111.
112.
113.
114.
115.
116.
117.
118.
119.
120.
121.
122.
123.
124.
Liu, H. and Y. Ma, Proton or Deuteron Transfer in Phase IV of Solid Hydrogen and
Deuterium. Physical Review Letters, 2013. 110(2): p. 025903.
Marqués, M., et al., Crystal Structures of Dense Lithium: A Metal-Semiconductor-Metal
Transition. Physical Review Letters, 2011. 106(9): p. 095502.
Goncharov, A.F., et al., Bonding, structures, and band gap closure of hydrogen at high
pressures. Physical Review B, 2013. 87(2): p. 024101.
Hanfland, M., R.J. Hemley, and H.-K. Mao, Novel infrared vibron absorption in solid
hydrogen at megabar pressures. Physical Review Letters, 1993. 70(24): p. 3760-3763.
Hanfland, M., et al., Synchrotron infrared spectroscopy at megabar pressures:
Vibrational dynamics of hydrogen to 180 GPa. Physical Review Letters, 1992. 69(7): p.
1129-1132.
Morgan, D., A. Van der Ven, and G. Ceder, Li Conductivity in Lix MPO4 ( M = Mn , Fe , Co , Ni ) Olivine Materials. Electrochemical and Solid-State Letters,
2004. 7(2): p. A30-A32.
Ouyang, C., et al., First-principles study of Li ion diffusion in LiFePO4. Physical Review
B, 2004. 69(10): p. 104303.
Islam, M.S., et al., Atomic-Scale Investigation of Defects, Dopants, and Lithium
Transport in the LiFePO4 Olivine-Type Battery Material. Chemistry of Materials, 2005.
17(20): p. 5085-5092.
Amin, R. and J. Maier, Effect of annealing on transport properties of LiFePO4: Towards
a defect chemical model. Solid State Ionics, 2008. 178(35–36): p. 1831-1836.
Amin, R., et al., Ionic and electronic transport in single crystalline LiFePO4 grown by
optical floating zone technique. Solid State Ionics, 2008. 179(27–32): p. 1683-1687.
Padhi, A.K., K.S. Nanjundaswamy, and J.B. Goodenough, Phospho‐olivines as
Positive‐Electrode Materials for Rechargeable Lithium Batteries. Journal of The
Electrochemical Society, 1997. 144(4): p. 1188-1194.
Huang, H., S.-C. Yin, and L.F. Nazar, Approaching Theoretical Capacity of LiFePO4 at
Room Temperature at High Rates. Electrochemical and Solid-State Letters, 2001. 4(10):
p. A170-A172.
Chung, S.-Y., J.T. Bloking, and Y.-M. Chiang, Electronically conductive phosphoolivines as lithium storage electrodes. Nat Mater, 2002. 1(2): p. 123-128.
Zhou, F., et al., The electronic structure and band gap of LiFePO4 and LiMnPO4. Solid
State Communications, 2004. 132(3–4): p. 181-186.
Zaghib, K., et al., Electronic, Optical, and Magnetic Properties of LiFePO4: Small
Magnetic Polaron Effects. Chemistry of Materials, 2007. 19(15): p. 3740-3747.
Yamada, A., S.C. Chung, and K. Hinokuma Optimized LiFePO4 for Lithium Battery
Cathodes. Journal of The Electrochemical Society, 2001. 148(3): p. A224-A229.
Herle, P.S., et al., Nano-network electronic conduction in iron and nickel olivine
phosphates. Nat Mater, 2004. 3(3): p. 147-152.
Kang, B. and G. Ceder, Battery materials for ultrafast charging and discharging. Nature,
2009. 458(7235): p. 190-193.
Zaghib, K., et al., Unsupported claims of ultrafast charging of LiFePO4 Li-ion batteries.
Journal of Power Sources, 2009. 194(2): p. 1021-1023.
Li, J., et al., Lithium ion conductivity in single crystal LiFePO4. Solid State Ionics, 2008.
179(35–36): p. 2016-2019.
140
141
125.
126.
127.
128.
129.
130.
131.
132.
133.
134.
135.
136.
137.
138.
139.
140.
141.
142.
143.
144.
Nishimura, S.-I., et al., Experimental visualization of lithium diffusion in LixFePO4. Nat
Mater, 2008. 7(9): p. 707-711.
Maier, J. and R. Amin, Defect Chemistry of LiFePO4. Journal of The Electrochemical
Society, 2008. 155(4): p. A339-A344.
Chen, J., et al., The hydrothermal synthesis and characterization of olivines and related
compounds for electrochemical applications. Solid State Ionics, 2008. 178(31–32): p.
1676-1693.
Adams, S., Lithium ion pathways in LiFePO4 and related olivines. Journal of Solid State
Electrochemistry, 2010. 14(10): p. 1787-1792.
Fisher, C.A.J., V.M. Hart Prieto, and M.S. Islam, Lithium Battery Materials LiMPO4 (M
= Mn, Fe, Co, and Ni): Insights into Defect Association, Transport Mechanisms, and
Doping Behavior. Chemistry of Materials, 2008. 20(18): p. 5907-5915.
Jόnsson, H., G. Mills, and K.W. Jacobsen, Nudged elastic band method for finding
minimum energy paths of transitions, in Classical and Quantum Dynamics in Condensed
Phase Simulations. p. 385-404.
Blöchl, P.E., O. Jepsen, and O.K. Andersen, Improved tetrahedron method for Brillouinzone integrations. Physical Review B, 1994. 49(23): p. 16223-16233.
Perdew, J.P., et al., Restoring the Density-Gradient Expansion for Exchange in Solids
and Surfaces. Physical Review Letters, 2008. 100(13): p. 136406.
Dudarev, S.L., et al., Electron-energy-loss spectra and the structural stability of nickel
oxide:An LSDA+U study. Physical Review B, 1998. 57(3): p. 1505-1509.
Kresse, G. and J. Furthmüller, Efficient iterative schemes for ab initio total-energy
calculations using a plane-wave basis set. Physical Review B, 1996. 54(16): p. 1116911186.
Rousse, G., et al., Magnetic Structures of the Triphylite LiFePO4 and of Its Delithiated
Form FePO4. Chemistry of Materials, 2003. 15(21): p. 4082-4090.
Malik, R., et al., Particle Size Dependence of the Ionic Diffusivity. Nano Letters, 2010.
10(10): p. 4123-4127.
Hoang, K. and M. Johannes, Tailoring Native Defects in LiFePO4: Insights from FirstPrinciples Calculations. Chemistry of Materials, 2011. 23(11): p. 3003-3013.
Chung, S.-Y., et al., Atomic-Scale Visualization of Antisite Defects in LiFePO4. Physical
Review Letters, 2008. 100(12): p. 125502.
Hamelet, S., et al., The effects of moderate thermal treatments under air on LiFePO4based nano powders. Journal of Materials Chemistry, 2009. 19(23): p. 3979-3991.
Chan, C.K., et al., High-performance lithium battery anodes using silicon nanowires. Nat
Nano, 2008. 3(1): p. 31-35.
Larcher, D., et al., Recent findings and prospects in the field of pure metals as negative
electrodes for Li-ion batteries. Journal of Materials Chemistry, 2007. 17(36): p. 37593772.
Park, M.-H., et al., Silicon Nanotube Battery Anodes. Nano Letters, 2009. 9(11): p. 38443847.
Kawaji, H., et al., Superconductivity in the Silicon Clathrate Compound (Na,Ba)xSi46.
Physical Review Letters, 1995. 74(8): p. 1427-1429.
Yamanaka, S., et al., High-Pressure Synthesis of a New Silicon Clathrate
Superconductor, Ba8Si46. Inorganic Chemistry, 1999. 39(1): p. 56-58.
141
142
145.
146.
147.
148.
149.
150.
151.
152.
153.
154.
155.
156.
157.
158.
159.
160.
161.
162.
163.
164.
Nolas, G.S., et al., Semiconducting Ge clathrates: Promising candidates for
thermoelectric applications. Applied Physics Letters, 1998. 73(2): p. 178-180.
San-Miguel, A., et al., High Pressure Behavior of Silicon Clathrates: A New Class of
Low Compressibility Materials. Physical Review Letters, 1999. 83(25): p. 5290-5293.
Chan, K.S., Chan, C. K., and Liang, W., Silicon Clathrate Anodes for Lithium-Ion
Batteries, in US Patent 2012.
Davidson, D.W., et al., The ability of small molecules to form clathrate hydrates of
structure II. Nature, 1984. 311(5982): p. 142-143.
Horie, H.-O., et al., Controlled thermal decomposition of NaSi to derive silicon clathrate
compounds. Journal of Solid State Chemistry, 2009. 182(1): p. 129-135.
Langer, T., et al., Electrochemical Lithiation of Silicon Clathrate-II. Journal of The
Electrochemical Society, 2012. 159(8): p. A1318-A1322.
Kasper, J.S., et al., Clathrate Structure of Silicon Na8Si46 and NaxSi136 (x < 11). Science,
1965. 150(3704): p. 1713-1714.
Ker, A., et al., Structure and Phase Stability of Binary Zintl-Phase Compounds: Lithium–
Group 13 Intermetallics and Metal-Doped Group 14 Clathrate Compounds. Chemistry –
A European Journal, 2002. 8(12): p. 2787-2798.
Rachi, T., et al., Preparation and electronic states of Na16Ba8Si136 clathrate. Chemical
Physics Letters, 2005. 409(1–3): p. 48-51.
Ohzuku, T., Y. Iwakoshi, and K. Sawai, Formation of Lithium‐Graphite Intercalation
Compounds in Nonaqueous Electrolytes and Their Application as a Negative Electrode
for a Lithium Ion (Shuttlecock) Cell. Journal of The Electrochemical Society, 1993.
140(9): p. 2490-2498.
Kasavajjula, U., C. Wang, and A.J. Appleby, Nano- and bulk-silicon-based insertion
anodes for lithium-ion secondary cells. Journal of Power Sources, 2007. 163(2): p. 10031039.
Gryko, J., et al., Low-density framework form of crystalline silicon with a wide optical
band gap. Physical Review B, 2000. 62(12): p. R7707-R7710.
Adams, G.B., et al., Wide-band-gap Si in open fourfold-coordinated clathrate structures.
Physical Review B, 1994. 49(12): p. 8048-8053.
Blase, X., Quasiparticle band structure and screening in silicon and carbon clathrates.
Physical Review B, 2003. 67(3): p. 035211.
Courtney, I.A., et al., Ab initio calculation of the lithium-tin voltage profile. Physical
Review B, 1998. 58(23): p. 15583-15588.
Ceder, G., Hautier, G., Jain, and A., Ong, S.P., Recharging lithium battery research with
first-principles methods. MRS Bulletin, 2011. 36(03): p. 185-191.
Ma, C., X. Shao, and D. Cao, Nitrogen-doped graphene nanosheets as anode materials
for lithium ion batteries: a first-principles study. Journal of Materials Chemistry, 2012.
22(18): p. 8911-8915.
Beekman, M. and G.S. Nolas, Inorganic clathrate-II materials of group 14: synthetic
routes and physical properties. Journal of Materials Chemistry, 2008. 18(8): p. 842-851.
Zhang, Q., et al., Lithium Insertion In Silicon Nanowires: An ab Initio Study. Nano
Letters, 2010. 10(9): p. 3243-3249.
Zhao, K., et al., Lithium-Assisted Plastic Deformation of Silicon Electrodes in LithiumIon Batteries: A First-Principles Theoretical Study. Nano Letters, 2011. 11(7): p. 29622967.
142
143
165.
166.
167.
168.
169.
170.
171.
172.
173.
174.
175.
176.
177.
178.
179.
180.
181.
182.
183.
184.
Xia, H., et al., Phase Transitions and High-Voltage Electrochemical Behavior of LiCoO2
Thin Films Grown by Pulsed Laser Deposition. Journal of The Electrochemical Society,
2007. 154(4): p. A337-A342.
Simon, P., et al., Synthesis and Electron Holography Studies of Single Crystalline
Nanostructures of Clathrate-II Phases KxGe136 and NaxSi136. Journal of the American
Chemical Society, 2011. 133(19): p. 7596-7601.
Yamanaka, S. and S. Maekawa, Structural evolution of the binary system Ba-Si under
high-pressure and high-temperature conditions. Z. Naturforsch., B: Chemical Sciences,
2006. 61(12): p. 1493-1499.
Kamaya, N., et al., A lithium superionic conductor. Nat Mater, 2011. 10(9): p. 682-686.
Liu, Z., et al., Anomalous High Ionic Conductivity of Nanoporous β-Li3PS4. Journal of
the American Chemical Society, 2013. 135(3): p. 975-978.
Tachez, M., et al., Ionic conductivity of and phase transition in lithium thiophosphate
Li3PS4. Solid State Ionics, 1984. 14(3): p. 181-185.
Homma, K., et al., Crystal structure and phase transitions of the lithium ionic conductor
Li3PS4. Solid State Ionics, 2011. 182(1): p. 53-58.
Lepley, N.D., N.A.W. Holzwarth, and Y.A. Du, Structures, Li+ mobilities, and interfacial
properties of solid electrolytes Li3PS4 and Li3PO4 from first principles. Physical Review
B, 2013. 88(10): p. 104103.
Yang, J. and J.S. Tse, Li Ion Diffusion Mechanisms in LiFePO4: An ab Initio Molecular
Dynamics Study. The Journal of Physical Chemistry A, 2011. 115(45): p. 13045-13049.
Ong, S.P., et al., Electrochemical Windows of Room-Temperature Ionic Liquids from
Molecular Dynamics and Density Functional Theory Calculations. Chemistry of
Materials, 2011. 23(11): p. 2979-2986.
Mo, Y., S.P. Ong, and G. Ceder, First Principles Study of the Li10GeP2S12 Lithium Super
Ionic Conductor Material. Chemistry of Materials, 2011. 24(1): p. 15-17.
Kumar, P.P. and S. Yashonath, Ionic conduction in the solid state. Journal of Chemical
Sciences, 2006. 118(1): p. 135-154.
Ge, M., et al., Scalable preparation of porous silicon nanoparticles and their application
for lithium-ion battery anodes. Nano Research, 2013. 6(3): p. 174-181.
Azadi, S. and W.M.C. Foulkes, Fate of density functional theory in the study of highpressure solid hydrogen. Physical Review B, 2013. 88(1): p. 014115.
Ceperley, D.M. and B.J. Alder, Ground state of solid hydrogen at high pressures.
Physical Review B, 1987. 36(4): p. 2092-2106.
Natoli, V., R.M. Martin, and D.M. Ceperley, Crystal structure of atomic hydrogen.
Physical Review Letters, 1993. 70(13): p. 1952-1955.
Tuckerman, M.E., et al., Efficient molecular dynamics and hybrid Monte Carlo
algorithms for path integrals. The Journal of Chemical Physics, 1993. 99(4): p. 27962808.
Marx, D. and M. Parrinello, Ab initio path integral molecular dynamics: Basic ideas. The
Journal of Chemical Physics, 1996. 104(11): p. 4077-4082.
Ceriotti, M., et al., Efficient stochastic thermostatting of path integral molecular
dynamics. The Journal of Chemical Physics, 2010. 133(12): p. 124104.
Ceriotti, M., D.E. Manolopoulos, and M. Parrinello, Accelerating the convergence of
path integral dynamics with a generalized Langevin equation. The Journal of Chemical
Physics, 2011. 134(8): p. 084104.
143
144
185.
186.
187.
Xin-Zheng, L., et al., Classical and quantum ordering of protons in cold solid hydrogen
under megabar pressures. Journal of Physics: Condensed Matter, 2013. 25(8): p. 085402.
Chen, J., et al., Quantum simulation of low-temperature metallic liquid hydrogen. Nat
Commun, 2013. 4: p. 2064.
Kirtman, B., et al., Polarization of one-dimensional periodic systems in a static electric
field: Sawtooth potential treatment revisited. The Journal of Chemical Physics, 2009.
131(4): p. 044109.
144
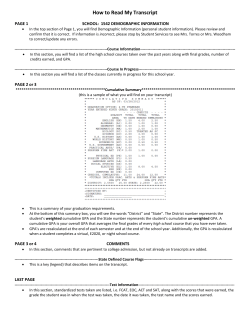


© Copyright 2026